Tchula, MS Map & Demographics
Tchula Map
Tchula Overview
$16,323
PER CAPITA INCOME
$43,000
AVG FAMILY INCOME
$35,987
AVG HOUSEHOLD INCOME
17.1%
WAGE / INCOME GAP [ % ]
82.9¢/ $1
WAGE / INCOME GAP [ $ ]
0.48
INEQUALITY / GINI INDEX
2,274
TOTAL POPULATION
907
MALE POPULATION
1,367
FEMALE POPULATION
66.35
MALES / 100 FEMALES
150.72
FEMALES / 100 MALES
29.6
MEDIAN AGE
4.4
AVG FAMILY SIZE
2.9
AVG HOUSEHOLD SIZE
743
LABOR FORCE [ PEOPLE ]
44.6%
PERCENT IN LABOR FORCE
16.2%
UNEMPLOYMENT RATE
Tchula Zip Codes
Tchula Area Codes
Income in Tchula
Income Overview in Tchula
Per Capita Income in Tchula is $16,323, while median incomes of families and households are $43,000 and $35,987 respectively.
| Characteristic | Number | Measure |
| Per Capita Income | 2,274 | $16,323 |
| Median Family Income | 428 | $43,000 |
| Mean Family Income | 428 | $44,893 |
| Median Household Income | 777 | $35,987 |
| Mean Household Income | 777 | $40,656 |
| Income Deficit | 428 | $0 |
| Wage / Income Gap (%) | 2,274 | 17.09% |
| Wage / Income Gap ($) | 2,274 | 82.91¢ per $1 |
| Gini / Inequality Index | 2,274 | 0.48 |
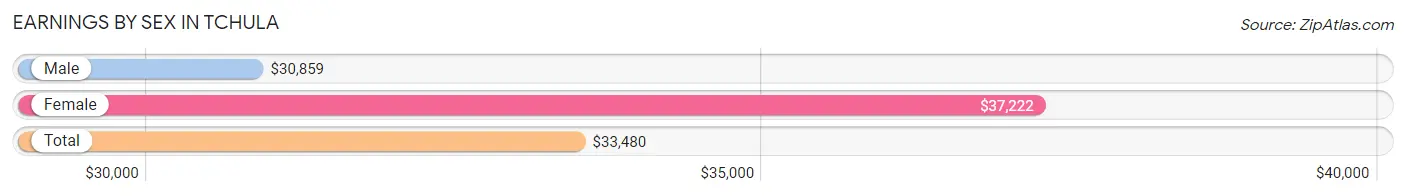
Earnings by Sex in Tchula
Average Earnings in Tchula are $33,480, $30,859 for men and $37,222 for women, a difference of 17.1%.
| Sex | Number | Average Earnings |
| Male | 304 (36.5%) | $30,859 |
| Female | 528 (63.5%) | $37,222 |
| Total | 832 (100.0%) | $33,480 |
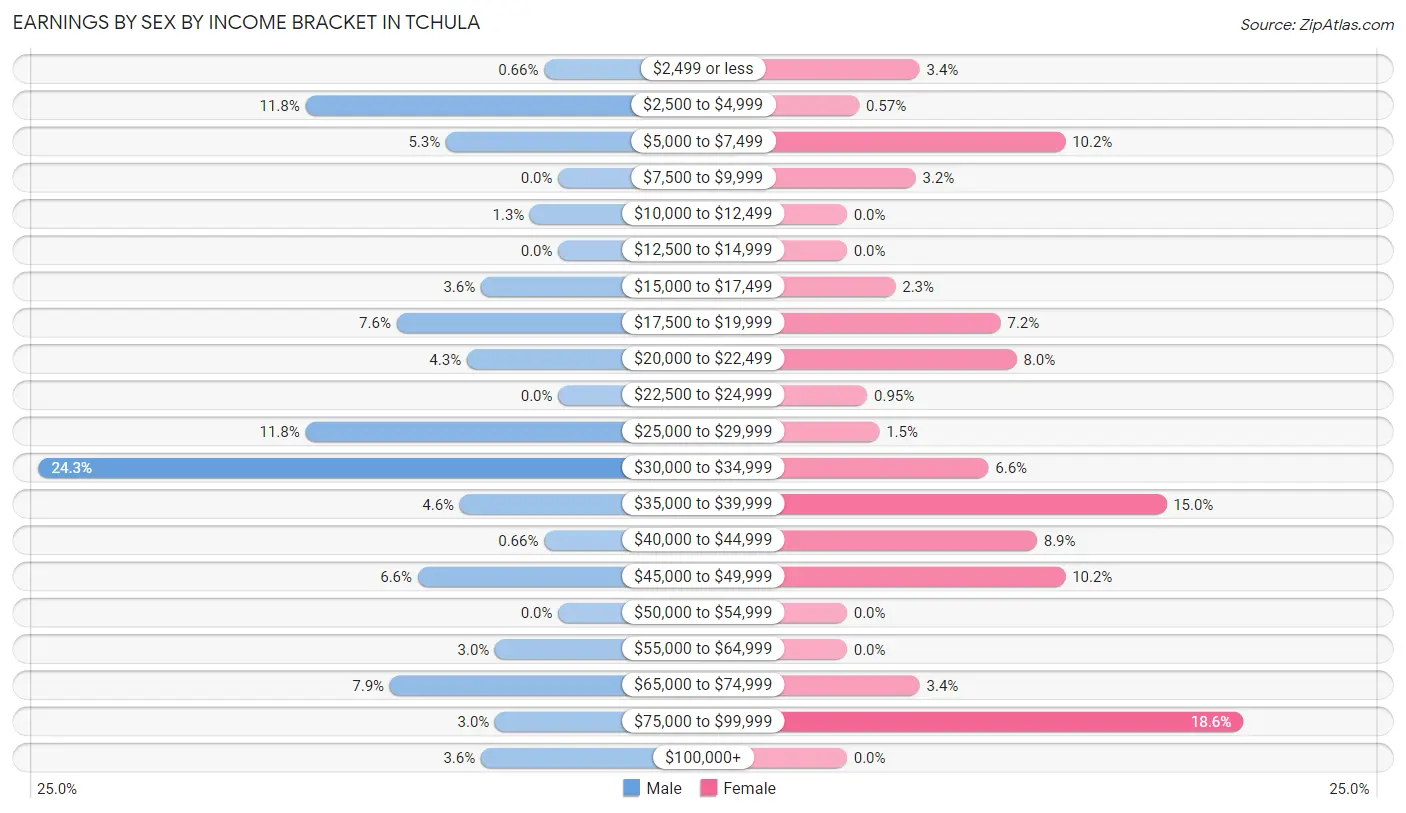
Earnings by Sex by Income Bracket in Tchula
The most common earnings brackets in Tchula are $30,000 to $34,999 for men (74 | 24.3%) and $75,000 to $99,999 for women (98 | 18.6%).
| Income | Male | Female |
| $2,499 or less | 2 (0.7%) | 18 (3.4%) |
| $2,500 to $4,999 | 36 (11.8%) | 3 (0.6%) |
| $5,000 to $7,499 | 16 (5.3%) | 54 (10.2%) |
| $7,500 to $9,999 | 0 (0.0%) | 17 (3.2%) |
| $10,000 to $12,499 | 4 (1.3%) | 0 (0.0%) |
| $12,500 to $14,999 | 0 (0.0%) | 0 (0.0%) |
| $15,000 to $17,499 | 11 (3.6%) | 12 (2.3%) |
| $17,500 to $19,999 | 23 (7.6%) | 38 (7.2%) |
| $20,000 to $22,499 | 13 (4.3%) | 42 (8.0%) |
| $22,500 to $24,999 | 0 (0.0%) | 5 (0.9%) |
| $25,000 to $29,999 | 36 (11.8%) | 8 (1.5%) |
| $30,000 to $34,999 | 74 (24.3%) | 35 (6.6%) |
| $35,000 to $39,999 | 14 (4.6%) | 79 (15.0%) |
| $40,000 to $44,999 | 2 (0.7%) | 47 (8.9%) |
| $45,000 to $49,999 | 20 (6.6%) | 54 (10.2%) |
| $50,000 to $54,999 | 0 (0.0%) | 0 (0.0%) |
| $55,000 to $64,999 | 9 (3.0%) | 0 (0.0%) |
| $65,000 to $74,999 | 24 (7.9%) | 18 (3.4%) |
| $75,000 to $99,999 | 9 (3.0%) | 98 (18.6%) |
| $100,000+ | 11 (3.6%) | 0 (0.0%) |
| Total | 304 (100.0%) | 528 (100.0%) |
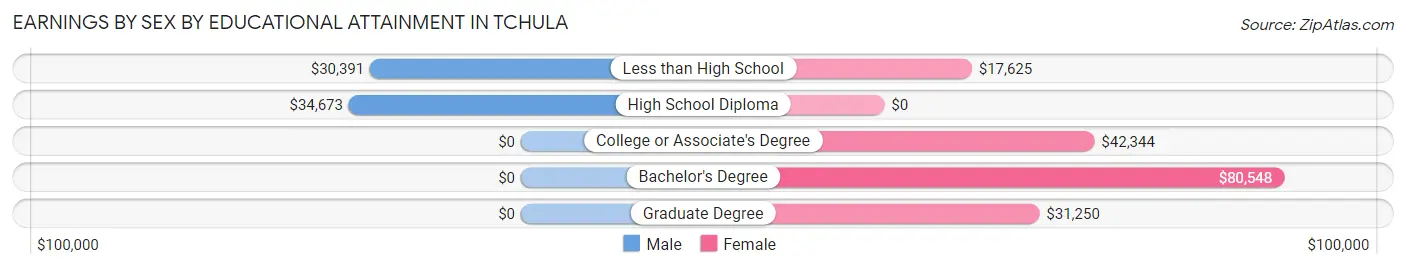
Earnings by Sex by Educational Attainment in Tchula
Average earnings in Tchula are $32,827 for men and $38,854 for women, a difference of 15.5%. Men with an educational attainment of high school diploma enjoy the highest average annual earnings of $34,673, while those with less than high school education earn the least with $30,391. Women with an educational attainment of bachelor's degree earn the most with the average annual earnings of $80,548, while those with less than high school education have the smallest earnings of $17,625.
| Educational Attainment | Male Income | Female Income |
| Less than High School | $30,391 | $17,625 |
| High School Diploma | $34,673 | $0 |
| College or Associate's Degree | - | - |
| Bachelor's Degree | - | - |
| Graduate Degree | - | - |
| Total | $32,827 | $38,854 |
Family Income in Tchula
Family Income Brackets in Tchula
According to the Tchula family income data, there are 115 families falling into the $35,000 to $49,999 income range, which is the most common income bracket and makes up 26.9% of all families.
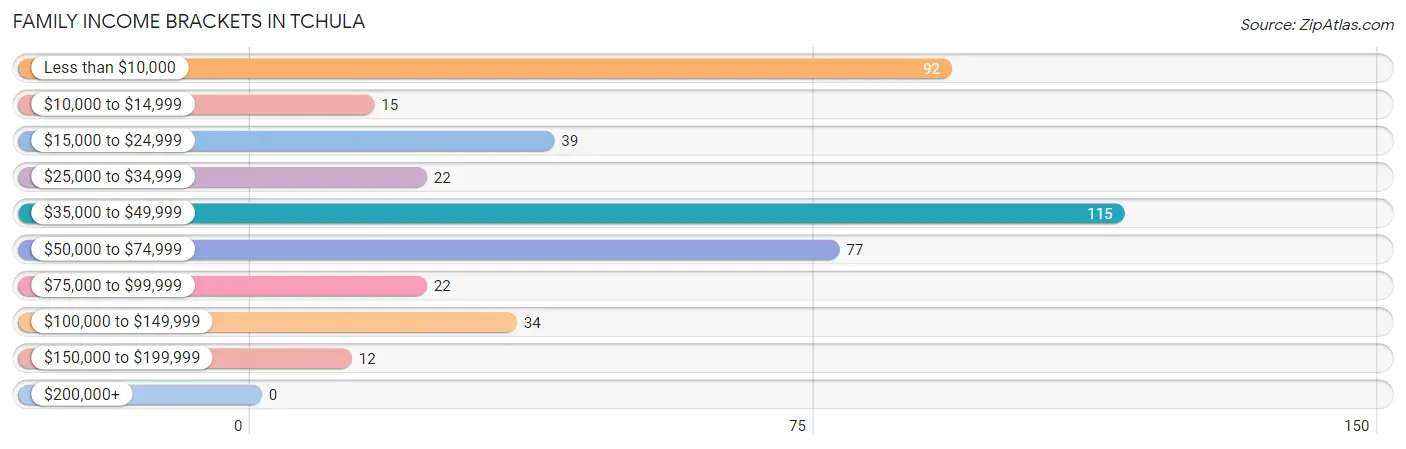
| Income Bracket | # Families | % Families |
| Less than $10,000 | 92 | 21.5% |
| $10,000 to $14,999 | 15 | 3.5% |
| $15,000 to $24,999 | 39 | 9.1% |
| $25,000 to $34,999 | 22 | 5.1% |
| $35,000 to $49,999 | 115 | 26.9% |
| $50,000 to $74,999 | 77 | 18.0% |
| $75,000 to $99,999 | 22 | 5.1% |
| $100,000 to $149,999 | 34 | 7.9% |
| $150,000 to $199,999 | 12 | 2.8% |
| $200,000+ | 0 | 0.0% |
Family Income by Famaliy Size in Tchula
5-person families (32 | 7.5%) account for the highest median family income in Tchula with $89,583 per family, while 2-person families (159 | 37.1%) have the highest median income of $22,564 per family member.
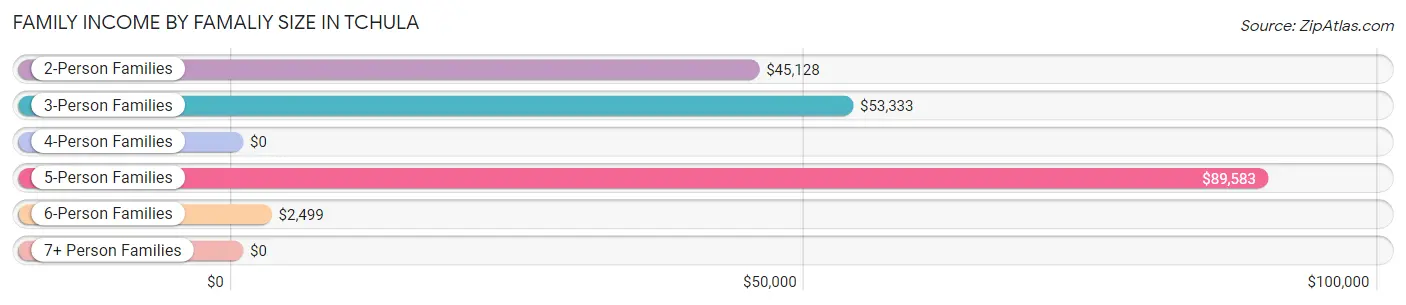
| Income Bracket | # Families | Median Income |
| 2-Person Families | 159 (37.1%) | $45,128 |
| 3-Person Families | 102 (23.8%) | $53,333 |
| 4-Person Families | 102 (23.8%) | $0 |
| 5-Person Families | 32 (7.5%) | $89,583 |
| 6-Person Families | 33 (7.7%) | $2,499 |
| 7+ Person Families | 0 (0.0%) | $0 |
| Total | 428 (100.0%) | $43,000 |
Family Income by Number of Earners in Tchula
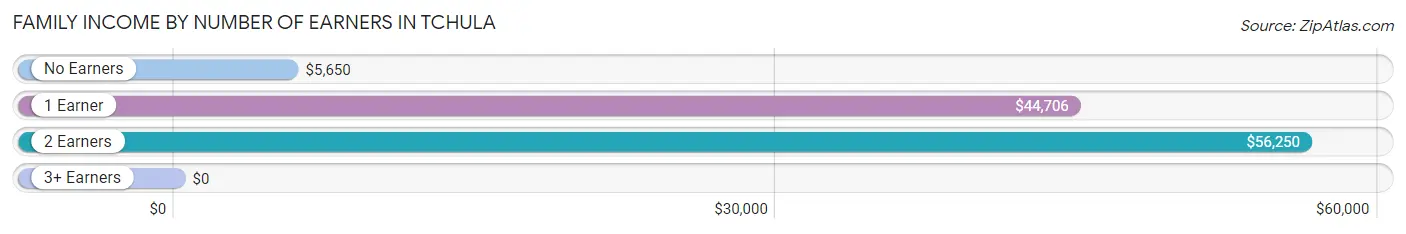
| Number of Earners | # Families | Median Income |
| No Earners | 121 (28.3%) | $5,650 |
| 1 Earner | 172 (40.2%) | $44,706 |
| 2 Earners | 104 (24.3%) | $56,250 |
| 3+ Earners | 31 (7.2%) | $0 |
| Total | 428 (100.0%) | $43,000 |
Household Income in Tchula
Household Income Brackets in Tchula
With 191 households falling in the category, the less than $10,000 income range is the most frequent in Tchula, accounting for 24.6% of all households.
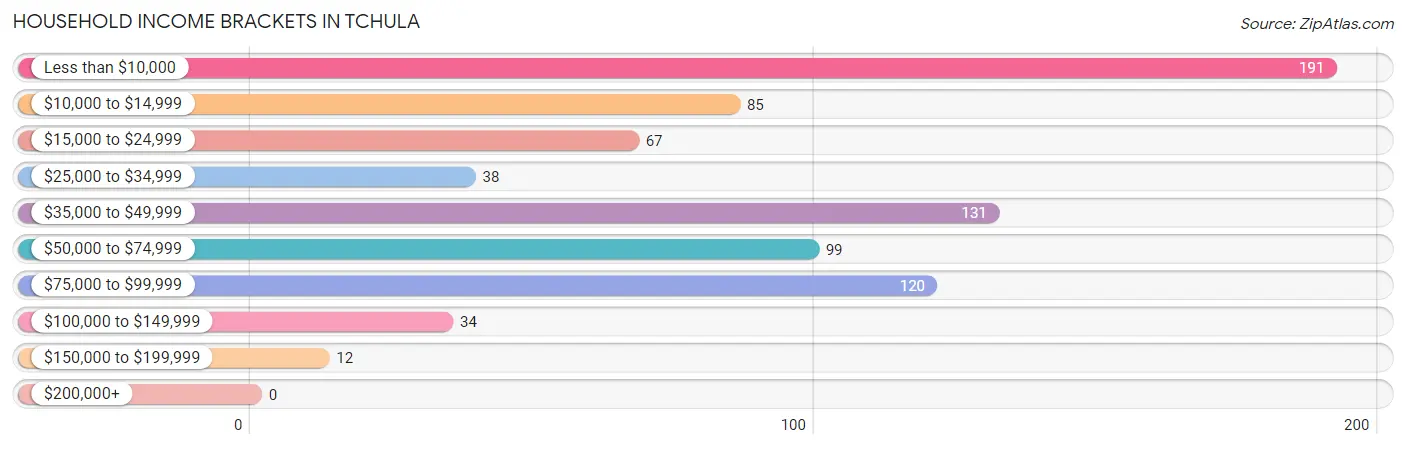
| Income Bracket | # Households | % Households |
| Less than $10,000 | 191 | 24.6% |
| $10,000 to $14,999 | 85 | 10.9% |
| $15,000 to $24,999 | 67 | 8.6% |
| $25,000 to $34,999 | 38 | 4.9% |
| $35,000 to $49,999 | 131 | 16.9% |
| $50,000 to $74,999 | 99 | 12.7% |
| $75,000 to $99,999 | 120 | 15.4% |
| $100,000 to $149,999 | 34 | 4.4% |
| $150,000 to $199,999 | 12 | 1.5% |
| $200,000+ | 0 | 0.0% |
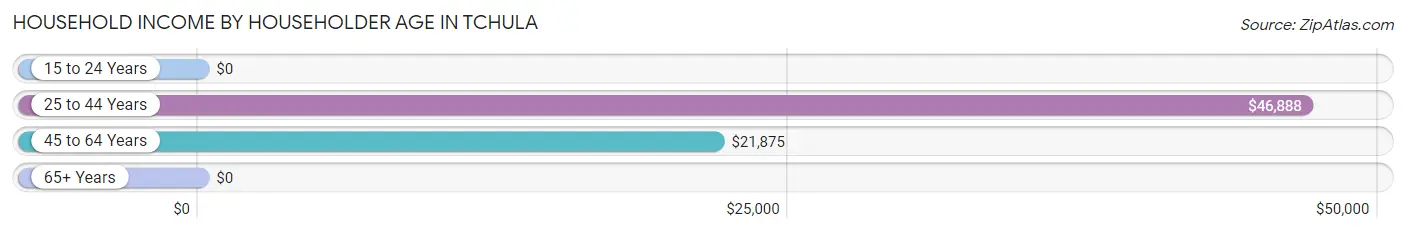
Household Income by Householder Age in Tchula
The median household income in Tchula is $35,987, with the highest median household income of $46,888 found in the 25 to 44 years age bracket for the primary householder. A total of 338 households (43.5%) fall into this category. Meanwhile, the 15 to 24 years age bracket for the primary householder has the lowest median household income of $0, with 11 households (1.4%) in this group.
| Income Bracket | # Households | Median Income |
| 15 to 24 Years | 11 (1.4%) | $0 |
| 25 to 44 Years | 338 (43.5%) | $46,888 |
| 45 to 64 Years | 315 (40.5%) | $21,875 |
| 65+ Years | 113 (14.5%) | $0 |
| Total | 777 (100.0%) | $35,987 |
Poverty in Tchula
Income Below Poverty by Sex and Age in Tchula
With 41.6% poverty level for males and 42.1% for females among the residents of Tchula, 5 year old males and 6 to 11 year old females are the most vulnerable to poverty, with 26 males (100.0%) and 88 females (73.3%) in their respective age groups living below the poverty level.
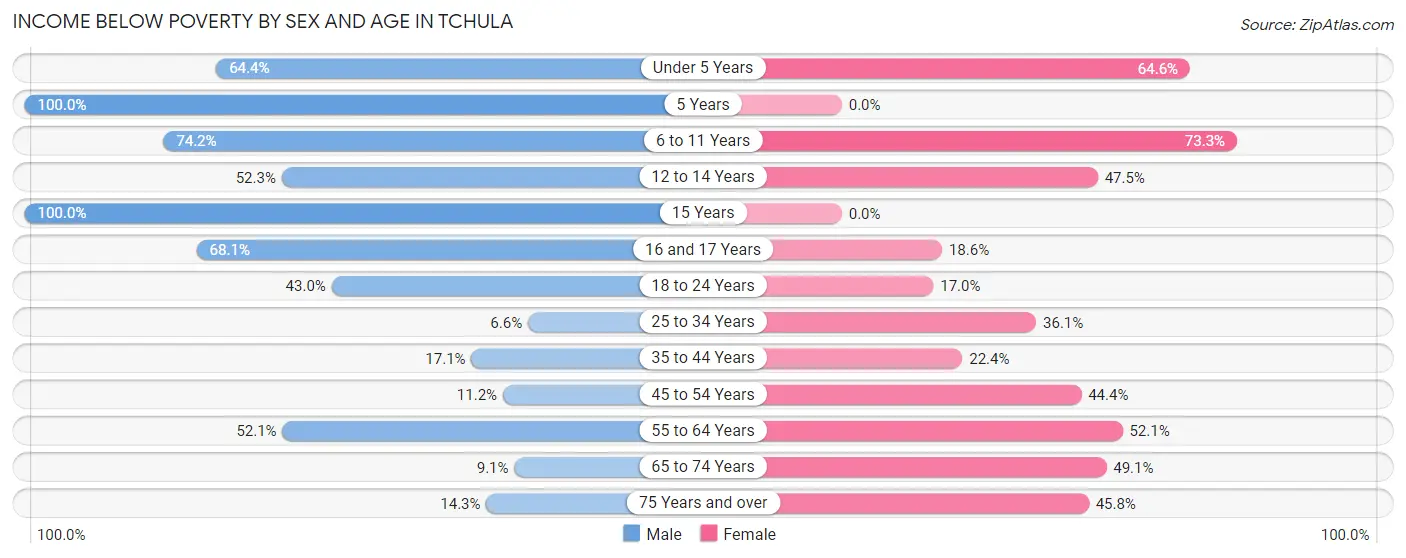
| Age Bracket | Male | Female |
| Under 5 Years | 67 (64.4%) | 115 (64.6%) |
| 5 Years | 26 (100.0%) | 0 (0.0%) |
| 6 to 11 Years | 49 (74.2%) | 88 (73.3%) |
| 12 to 14 Years | 23 (52.3%) | 19 (47.5%) |
| 15 Years | 22 (100.0%) | 0 (0.0%) |
| 16 and 17 Years | 49 (68.1%) | 8 (18.6%) |
| 18 to 24 Years | 40 (43.0%) | 18 (17.0%) |
| 25 to 34 Years | 8 (6.6%) | 101 (36.1%) |
| 35 to 44 Years | 14 (17.1%) | 49 (22.4%) |
| 45 to 54 Years | 11 (11.2%) | 56 (44.4%) |
| 55 to 64 Years | 61 (52.1%) | 62 (52.1%) |
| 65 to 74 Years | 3 (9.1%) | 27 (49.1%) |
| 75 Years and over | 4 (14.3%) | 33 (45.8%) |
| Total | 377 (41.6%) | 576 (42.1%) |
Income Above Poverty by Sex and Age in Tchula
According to the poverty statistics in Tchula, males aged 25 to 34 years and females aged 15 years are the age groups that are most secure financially, with 93.4% of males and 100.0% of females in these age groups living above the poverty line.
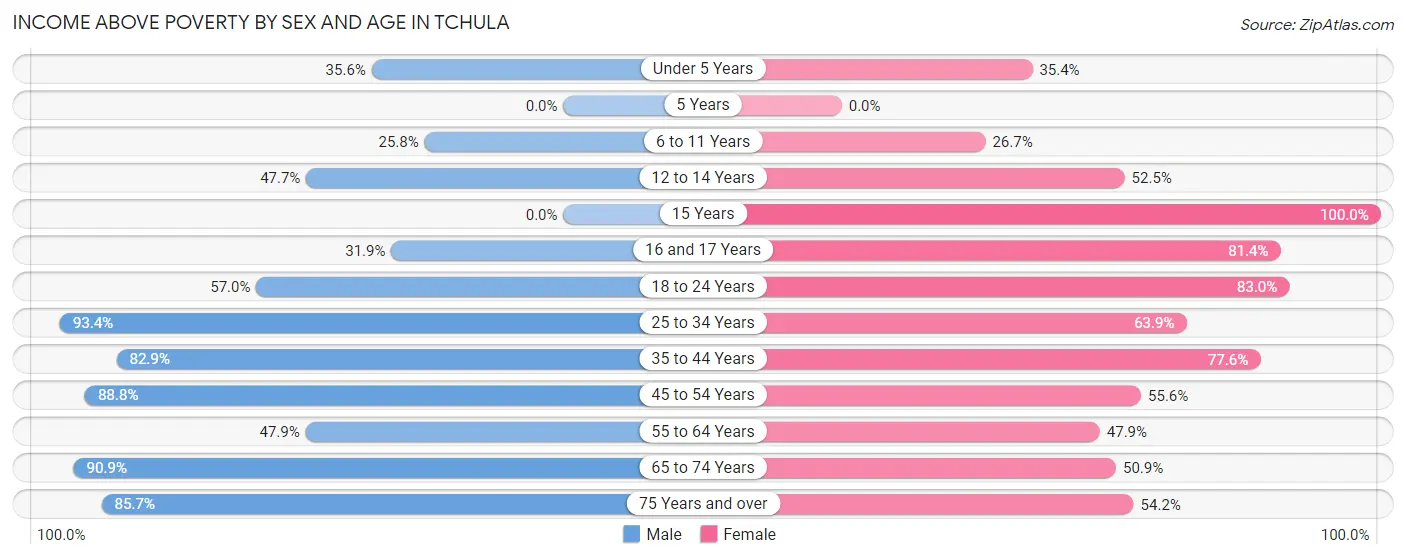
| Age Bracket | Male | Female |
| Under 5 Years | 37 (35.6%) | 63 (35.4%) |
| 5 Years | 0 (0.0%) | 0 (0.0%) |
| 6 to 11 Years | 17 (25.8%) | 32 (26.7%) |
| 12 to 14 Years | 21 (47.7%) | 21 (52.5%) |
| 15 Years | 0 (0.0%) | 9 (100.0%) |
| 16 and 17 Years | 23 (31.9%) | 35 (81.4%) |
| 18 to 24 Years | 53 (57.0%) | 88 (83.0%) |
| 25 to 34 Years | 114 (93.4%) | 179 (63.9%) |
| 35 to 44 Years | 68 (82.9%) | 170 (77.6%) |
| 45 to 54 Years | 87 (88.8%) | 70 (55.6%) |
| 55 to 64 Years | 56 (47.9%) | 57 (47.9%) |
| 65 to 74 Years | 30 (90.9%) | 28 (50.9%) |
| 75 Years and over | 24 (85.7%) | 39 (54.2%) |
| Total | 530 (58.4%) | 791 (57.9%) |
Income Below Poverty Among Married-Couple Families in Tchula
The poverty statistics for married-couple families in Tchula show that 12.8% or 14 of the total 109 families live below the poverty line. Families with 1 or 2 children have the highest poverty rate of 42.9%, comprising of 12 families. On the other hand, families with 3 or 4 children have the lowest poverty rate of 0.0%, which includes 0 families.
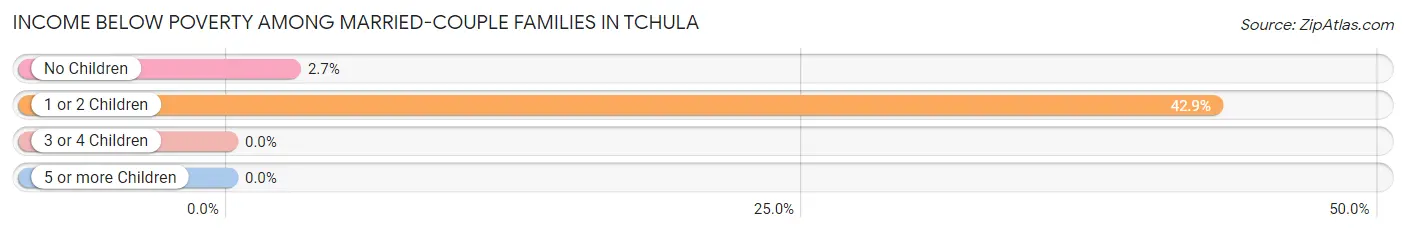
| Children | Above Poverty | Below Poverty |
| No Children | 71 (97.3%) | 2 (2.7%) |
| 1 or 2 Children | 16 (57.1%) | 12 (42.9%) |
| 3 or 4 Children | 8 (100.0%) | 0 (0.0%) |
| 5 or more Children | 0 (0.0%) | 0 (0.0%) |
| Total | 95 (87.2%) | 14 (12.8%) |
Income Below Poverty Among Single-Parent Households in Tchula
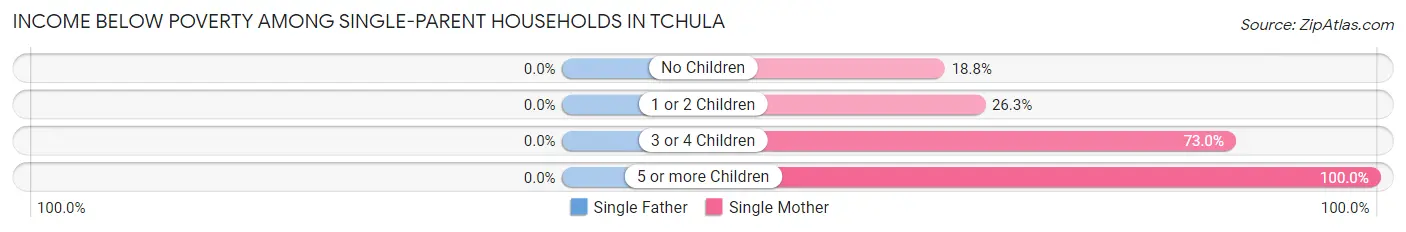
| Children | Single Father | Single Mother |
| No Children | 0 (0.0%) | 16 (18.8%) |
| 1 or 2 Children | 0 (0.0%) | 35 (26.3%) |
| 3 or 4 Children | 0 (0.0%) | 46 (73.0%) |
| 5 or more Children | 0 (0.0%) | 25 (100.0%) |
| Total | 0 (0.0%) | 122 (39.9%) |
Income Below Poverty Among Married-Couple vs Single-Parent Households in Tchula
The poverty data for Tchula shows that 14 of the married-couple family households (12.8%) and 122 of the single-parent households (38.2%) are living below the poverty level. Within the married-couple family households, those with 1 or 2 children have the highest poverty rate, with 12 households (42.9%) falling below the poverty line. Among the single-parent households, those with 5 or more children have the highest poverty rate, with 25 household (100.0%) living below poverty.
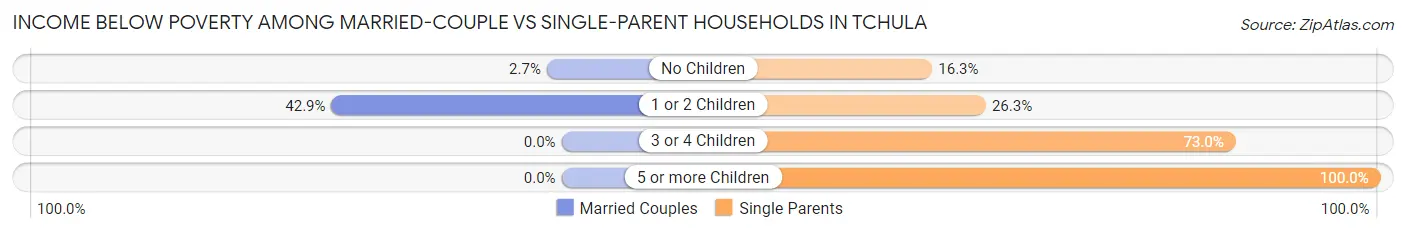
| Children | Married-Couple Families | Single-Parent Households |
| No Children | 2 (2.7%) | 16 (16.3%) |
| 1 or 2 Children | 12 (42.9%) | 35 (26.3%) |
| 3 or 4 Children | 0 (0.0%) | 46 (73.0%) |
| 5 or more Children | 0 (0.0%) | 25 (100.0%) |
| Total | 14 (12.8%) | 122 (38.2%) |
Race in Tchula
The most populous races in Tchula are Black / African American (2,241 | 98.6%), White / Caucasian (30 | 1.3%), and Two or more Races (3 | 0.1%).
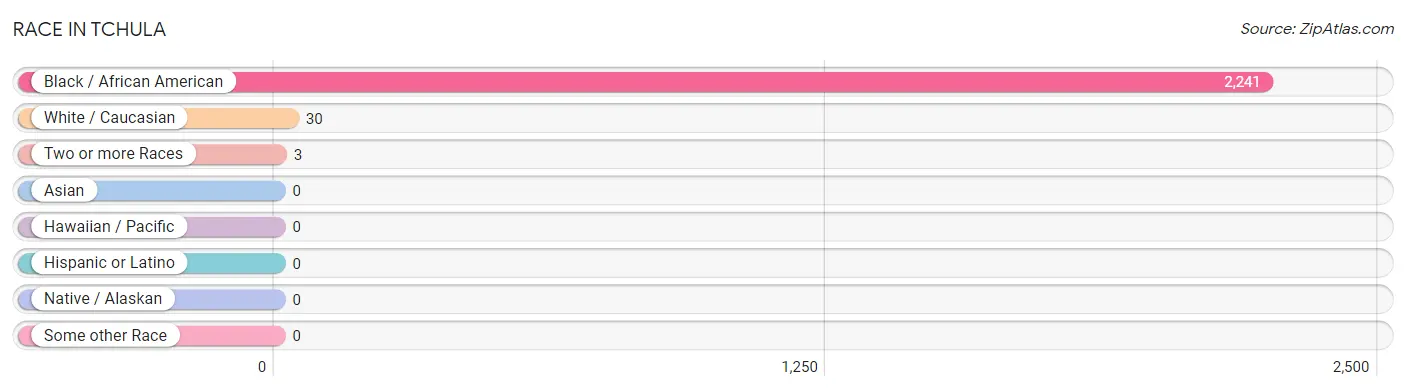
| Race | # Population | % Population |
| Asian | 0 | 0.0% |
| Black / African American | 2,241 | 98.6% |
| Hawaiian / Pacific | 0 | 0.0% |
| Hispanic or Latino | 0 | 0.0% |
| Native / Alaskan | 0 | 0.0% |
| White / Caucasian | 30 | 1.3% |
| Two or more Races | 3 | 0.1% |
| Some other Race | 0 | 0.0% |
| Total | 2,274 | 100.0% |
Ancestry in Tchula
The most populous ancestries reported in Tchula are African (19 | 0.8%), Subsaharan African (19 | 0.8%), and Choctaw (3 | 0.1%), together accounting for 1.8% of all Tchula residents.
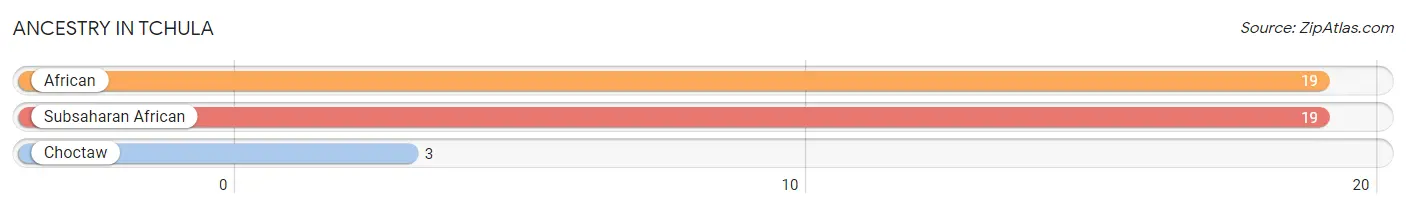
| Ancestry | # Population | % Population |
| African | 19 | 0.8% |
| Choctaw | 3 | 0.1% |
| Subsaharan African | 19 | 0.8% | View All 3 Rows |
Immigrants in Tchula

| Immigration Origin | # Population | % Population | View All 0 Rows |
Sex and Age in Tchula
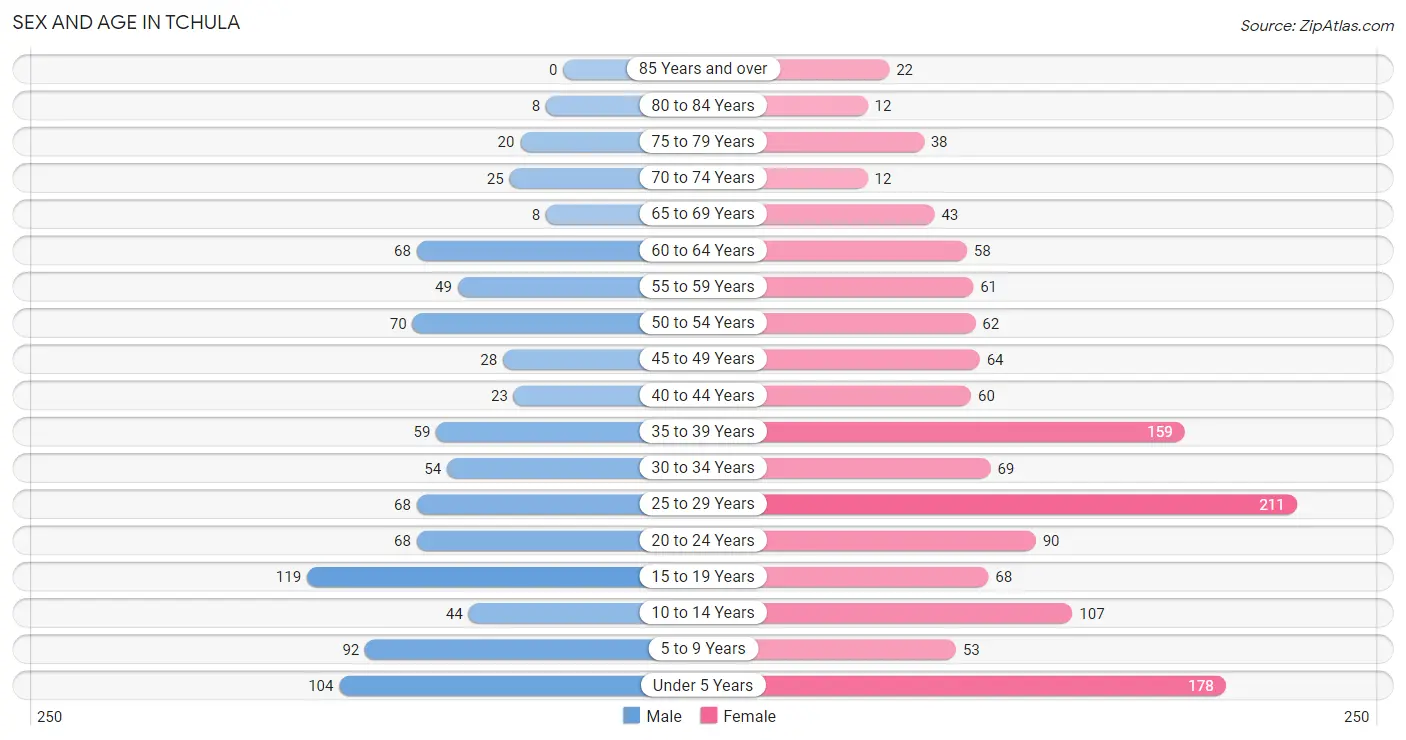
Sex and Age in Tchula
The most populous age groups in Tchula are 15 to 19 Years (119 | 13.1%) for men and 25 to 29 Years (211 | 15.4%) for women.
| Age Bracket | Male | Female |
| Under 5 Years | 104 (11.5%) | 178 (13.0%) |
| 5 to 9 Years | 92 (10.1%) | 53 (3.9%) |
| 10 to 14 Years | 44 (4.9%) | 107 (7.8%) |
| 15 to 19 Years | 119 (13.1%) | 68 (5.0%) |
| 20 to 24 Years | 68 (7.5%) | 90 (6.6%) |
| 25 to 29 Years | 68 (7.5%) | 211 (15.4%) |
| 30 to 34 Years | 54 (5.9%) | 69 (5.1%) |
| 35 to 39 Years | 59 (6.5%) | 159 (11.6%) |
| 40 to 44 Years | 23 (2.5%) | 60 (4.4%) |
| 45 to 49 Years | 28 (3.1%) | 64 (4.7%) |
| 50 to 54 Years | 70 (7.7%) | 62 (4.5%) |
| 55 to 59 Years | 49 (5.4%) | 61 (4.5%) |
| 60 to 64 Years | 68 (7.5%) | 58 (4.2%) |
| 65 to 69 Years | 8 (0.9%) | 43 (3.2%) |
| 70 to 74 Years | 25 (2.8%) | 12 (0.9%) |
| 75 to 79 Years | 20 (2.2%) | 38 (2.8%) |
| 80 to 84 Years | 8 (0.9%) | 12 (0.9%) |
| 85 Years and over | 0 (0.0%) | 22 (1.6%) |
| Total | 907 (100.0%) | 1,367 (100.0%) |
Families and Households in Tchula
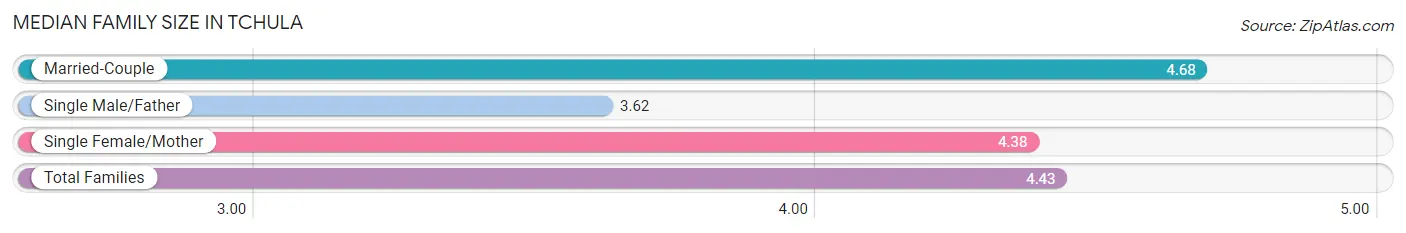
Median Family Size in Tchula
The median family size in Tchula is 4.43 persons per family, with married-couple families (109 | 25.5%) accounting for the largest median family size of 4.68 persons per family. On the other hand, single male/father families (13 | 3.0%) represent the smallest median family size with 3.62 persons per family.
| Family Type | # Families | Family Size |
| Married-Couple | 109 (25.5%) | 4.68 |
| Single Male/Father | 13 (3.0%) | 3.62 |
| Single Female/Mother | 306 (71.5%) | 4.38 |
| Total Families | 428 (100.0%) | 4.43 |
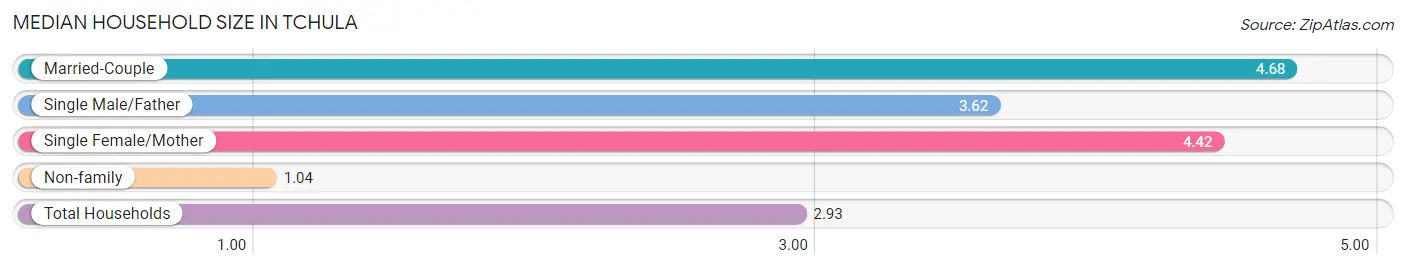
Median Household Size in Tchula
The median household size in Tchula is 2.93 persons per household, with married-couple households (109 | 14.0%) accounting for the largest median household size of 4.68 persons per household. non-family households (349 | 44.9%) represent the smallest median household size with 1.04 persons per household.
| Household Type | # Households | Household Size |
| Married-Couple | 109 (14.0%) | 4.68 |
| Single Male/Father | 13 (1.7%) | 3.62 |
| Single Female/Mother | 306 (39.4%) | 4.42 |
| Non-family | 349 (44.9%) | 1.04 |
| Total Households | 777 (100.0%) | 2.93 |
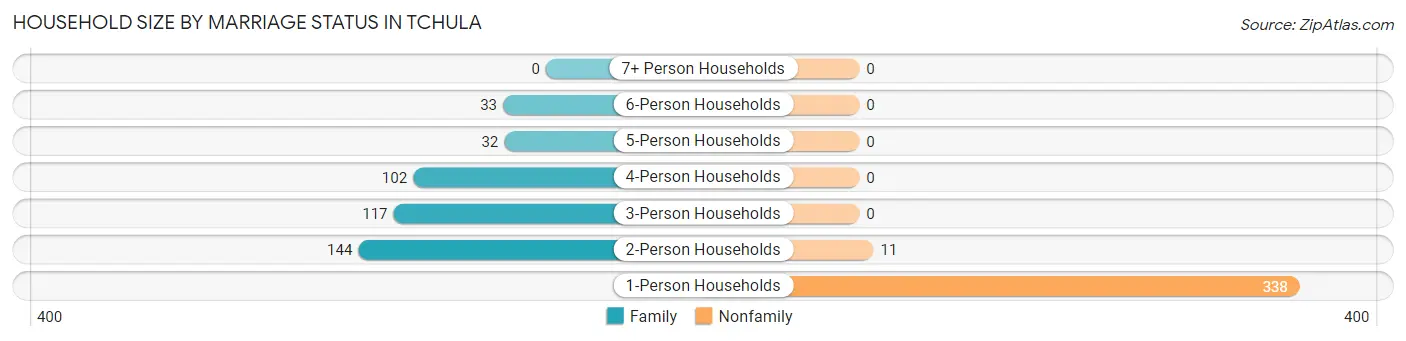
Household Size by Marriage Status in Tchula
Out of a total of 777 households in Tchula, 428 (55.1%) are family households, while 349 (44.9%) are nonfamily households. The most numerous type of family households are 2-person households, comprising 144, and the most common type of nonfamily households are 1-person households, comprising 338.
| Household Size | Family Households | Nonfamily Households |
| 1-Person Households | - | 338 (43.5%) |
| 2-Person Households | 144 (18.5%) | 11 (1.4%) |
| 3-Person Households | 117 (15.1%) | 0 (0.0%) |
| 4-Person Households | 102 (13.1%) | 0 (0.0%) |
| 5-Person Households | 32 (4.1%) | 0 (0.0%) |
| 6-Person Households | 33 (4.3%) | 0 (0.0%) |
| 7+ Person Households | 0 (0.0%) | 0 (0.0%) |
| Total | 428 (55.1%) | 349 (44.9%) |
Female Fertility in Tchula
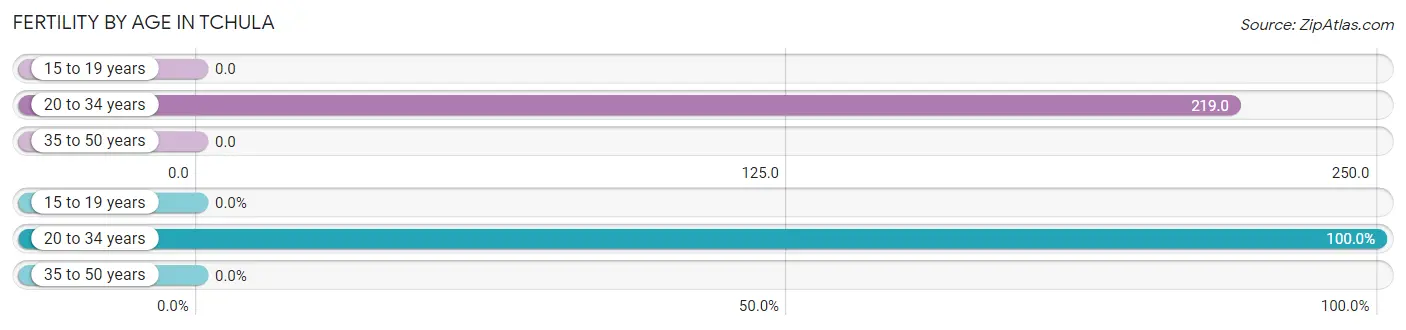
Fertility by Age in Tchula
Average fertility rate in Tchula is 112.0 births per 1,000 women. Women in the age bracket of 20 to 34 years have the highest fertility rate with 219.0 births per 1,000 women. Women in the age bracket of 20 to 34 years acount for 100.0% of all women with births.
| Age Bracket | Women with Births | Births / 1,000 Women |
| 15 to 19 years | 0 (0.0%) | 0.0 |
| 20 to 34 years | 81 (100.0%) | 219.0 |
| 35 to 50 years | 0 (0.0%) | 0.0 |
| Total | 81 (100.0%) | 112.0 |
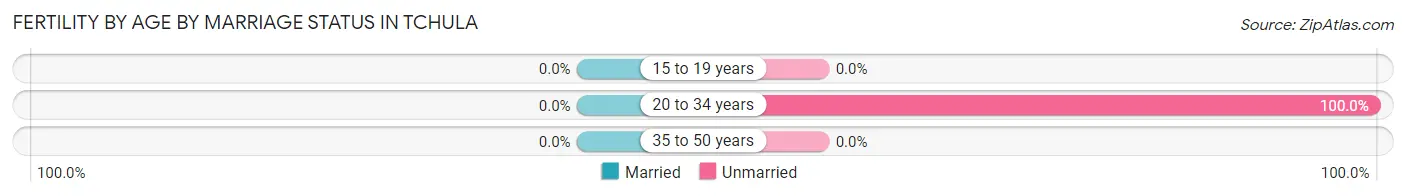
Fertility by Age by Marriage Status in Tchula
| Age Bracket | Married | Unmarried |
| 15 to 19 years | 0 (0.0%) | 0 (0.0%) |
| 20 to 34 years | 0 (0.0%) | 81 (100.0%) |
| 35 to 50 years | 0 (0.0%) | 0 (0.0%) |
| Total | 0 (0.0%) | 81 (100.0%) |
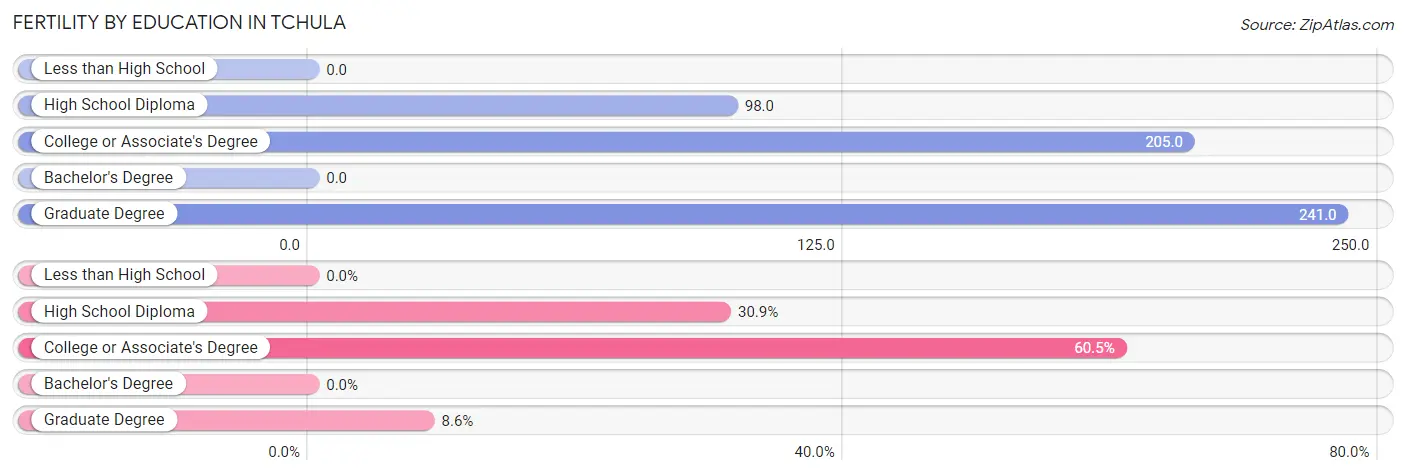
Fertility by Education in Tchula
| Educational Attainment | Women with Births | Births / 1,000 Women |
| Less than High School | 0 (0.0%) | 0.0 |
| High School Diploma | 25 (30.9%) | 98.0 |
| College or Associate's Degree | 49 (60.5%) | 205.0 |
| Bachelor's Degree | 0 (0.0%) | 0.0 |
| Graduate Degree | 7 (8.6%) | 241.0 |
| Total | 81 (100.0%) | 112.0 |
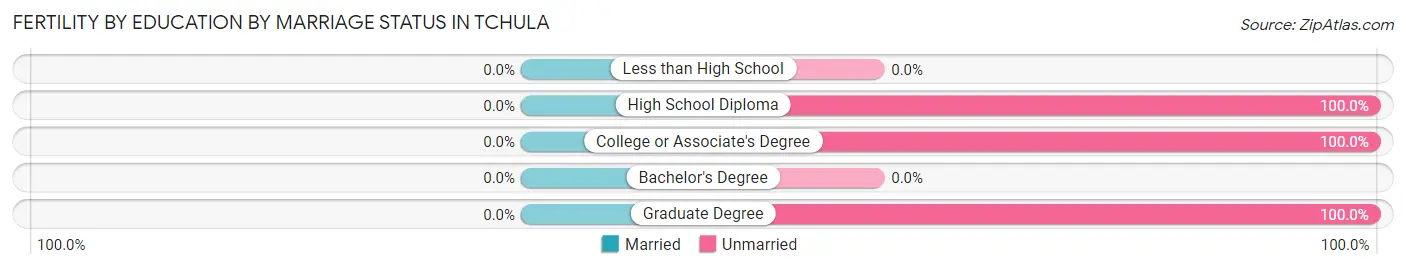
Fertility by Education by Marriage Status in Tchula
| Educational Attainment | Married | Unmarried |
| Less than High School | 0 (0.0%) | 0 (0.0%) |
| High School Diploma | 0 (0.0%) | 25 (100.0%) |
| College or Associate's Degree | 0 (0.0%) | 49 (100.0%) |
| Bachelor's Degree | 0 (0.0%) | 0 (0.0%) |
| Graduate Degree | 0 (0.0%) | 7 (100.0%) |
| Total | 0 (0.0%) | 81 (100.0%) |
Employment Characteristics in Tchula
Employment by Class of Employer in Tchula
Among the 616 employed individuals in Tchula, private company employees (459 | 74.5%), state government employees (87 | 14.1%), and local government employees (37 | 6.0%) make up the most common classes of employment.
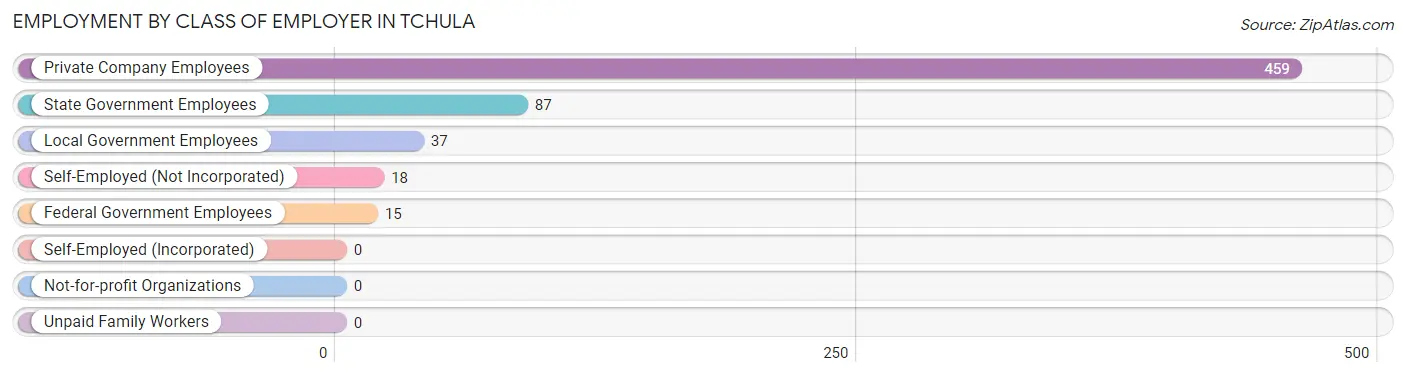
| Employer Class | # Employees | % Employees |
| Private Company Employees | 459 | 74.5% |
| Self-Employed (Incorporated) | 0 | 0.0% |
| Self-Employed (Not Incorporated) | 18 | 2.9% |
| Not-for-profit Organizations | 0 | 0.0% |
| Local Government Employees | 37 | 6.0% |
| State Government Employees | 87 | 14.1% |
| Federal Government Employees | 15 | 2.4% |
| Unpaid Family Workers | 0 | 0.0% |
| Total | 616 | 100.0% |
Employment Status by Age in Tchula
According to the labor force statistics for Tchula, out of the total population over 16 years of age (1,665), 44.6% or 743 individuals are in the labor force, with 16.2% or 120 of them unemployed. The age group with the highest labor force participation rate is 20 to 24 years, with 72.2% or 114 individuals in the labor force. Within the labor force, the 16 to 19 years age range has the highest percentage of unemployed individuals, with 100.0% or 21 of them being unemployed.
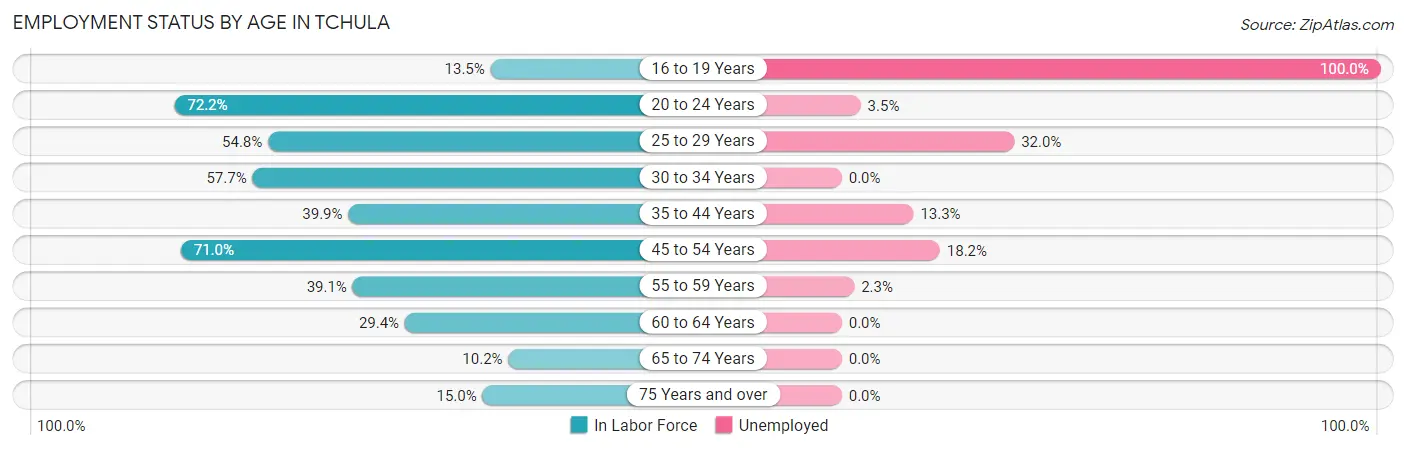
| Age Bracket | In Labor Force | Unemployed |
| 16 to 19 Years | 21 (13.5%) | 21 (100.0%) |
| 20 to 24 Years | 114 (72.2%) | 4 (3.5%) |
| 25 to 29 Years | 153 (54.8%) | 49 (32.0%) |
| 30 to 34 Years | 71 (57.7%) | 0 (0.0%) |
| 35 to 44 Years | 120 (39.9%) | 16 (13.3%) |
| 45 to 54 Years | 159 (71.0%) | 29 (18.2%) |
| 55 to 59 Years | 43 (39.1%) | 1 (2.3%) |
| 60 to 64 Years | 37 (29.4%) | 0 (0.0%) |
| 65 to 74 Years | 9 (10.2%) | 0 (0.0%) |
| 75 Years and over | 15 (15.0%) | 0 (0.0%) |
| Total | 743 (44.6%) | 120 (16.2%) |
Employment Status by Educational Attainment in Tchula
According to labor force statistics for Tchula, 50.1% of individuals (583) out of the total population between 25 and 64 years of age (1,163) are in the labor force, with 16.3% or 95 of them being unemployed. The group with the highest labor force participation rate are those with the educational attainment of college / associate degree, with 64.5% or 187 individuals in the labor force. Within the labor force, individuals with college / associate degree education have the highest percentage of unemployment, with 26.2% or 49 of them being unemployed.
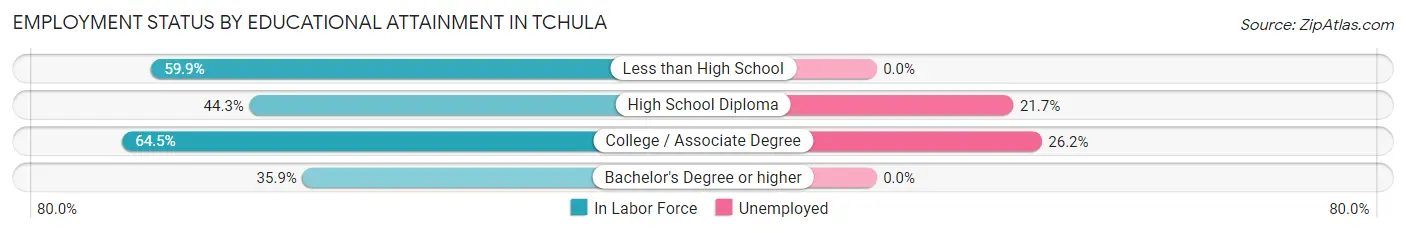
| Educational Attainment | In Labor Force | Unemployed |
| Less than High School | 106 (59.9%) | 0 (0.0%) |
| High School Diploma | 212 (44.3%) | 104 (21.7%) |
| College / Associate Degree | 187 (64.5%) | 76 (26.2%) |
| Bachelor's Degree or higher | 78 (35.9%) | 0 (0.0%) |
| Total | 583 (50.1%) | 190 (16.3%) |
Employment Occupations by Sex in Tchula
Management, Business, Science and Arts Occupations
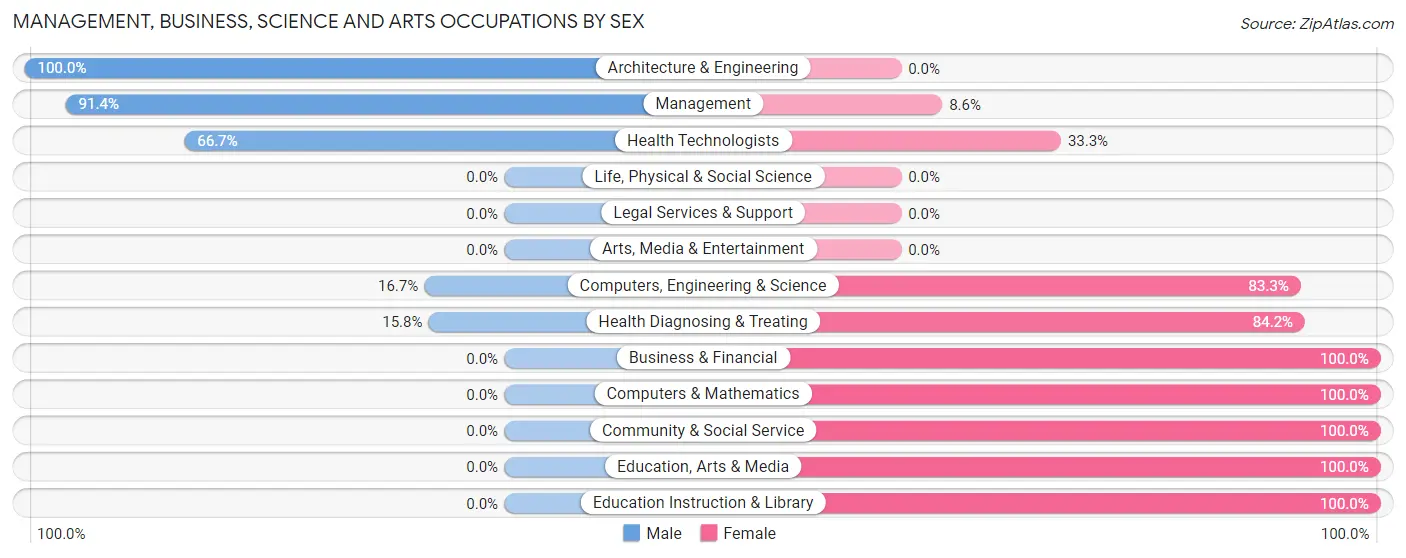
The most common Management, Business, Science and Arts occupations in Tchula are Community & Social Service (76 | 12.2%), Education Instruction & Library (65 | 10.4%), Health Diagnosing & Treating (38 | 6.1%), Management (35 | 5.6%), and Education, Arts & Media (11 | 1.8%).
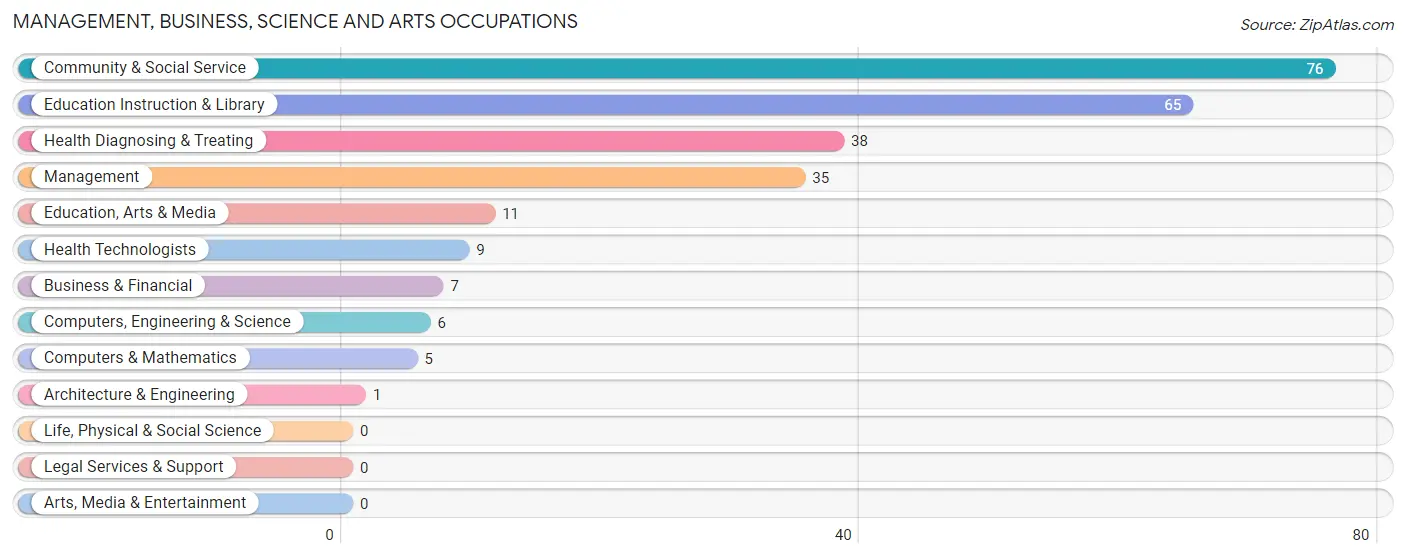
Management, Business, Science and Arts Occupations by Sex
Within the Management, Business, Science and Arts occupations in Tchula, the most male-oriented occupations are Architecture & Engineering (100.0%), Management (91.4%), and Health Technologists (66.7%), while the most female-oriented occupations are Business & Financial (100.0%), Computers & Mathematics (100.0%), and Community & Social Service (100.0%).
| Occupation | Male | Female |
| Management | 32 (91.4%) | 3 (8.6%) |
| Business & Financial | 0 (0.0%) | 7 (100.0%) |
| Computers, Engineering & Science | 1 (16.7%) | 5 (83.3%) |
| Computers & Mathematics | 0 (0.0%) | 5 (100.0%) |
| Architecture & Engineering | 1 (100.0%) | 0 (0.0%) |
| Life, Physical & Social Science | 0 (0.0%) | 0 (0.0%) |
| Community & Social Service | 0 (0.0%) | 76 (100.0%) |
| Education, Arts & Media | 0 (0.0%) | 11 (100.0%) |
| Legal Services & Support | 0 (0.0%) | 0 (0.0%) |
| Education Instruction & Library | 0 (0.0%) | 65 (100.0%) |
| Arts, Media & Entertainment | 0 (0.0%) | 0 (0.0%) |
| Health Diagnosing & Treating | 6 (15.8%) | 32 (84.2%) |
| Health Technologists | 6 (66.7%) | 3 (33.3%) |
| Total (Category) | 39 (24.1%) | 123 (75.9%) |
| Total (Overall) | 276 (44.4%) | 346 (55.6%) |
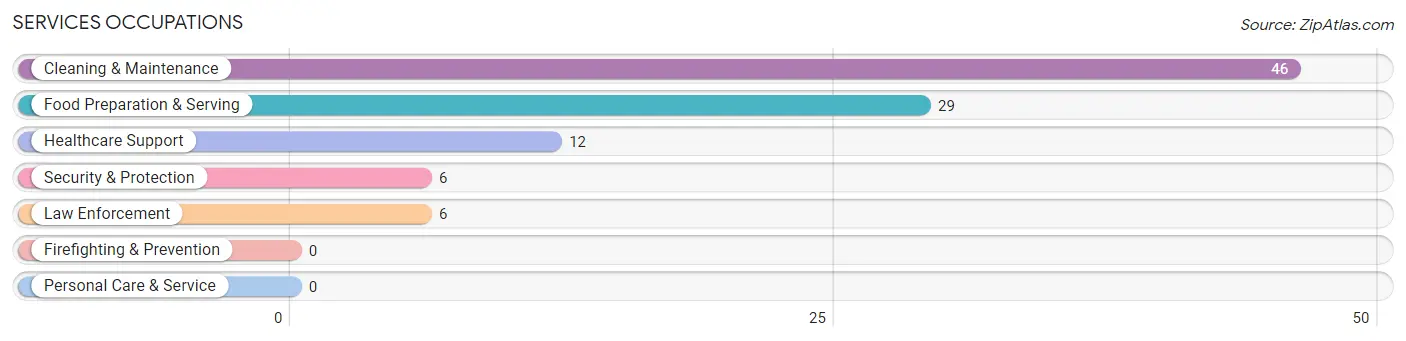
Services Occupations
The most common Services occupations in Tchula are Cleaning & Maintenance (46 | 7.4%), Food Preparation & Serving (29 | 4.7%), Healthcare Support (12 | 1.9%), Security & Protection (6 | 1.0%), and Law Enforcement (6 | 1.0%).
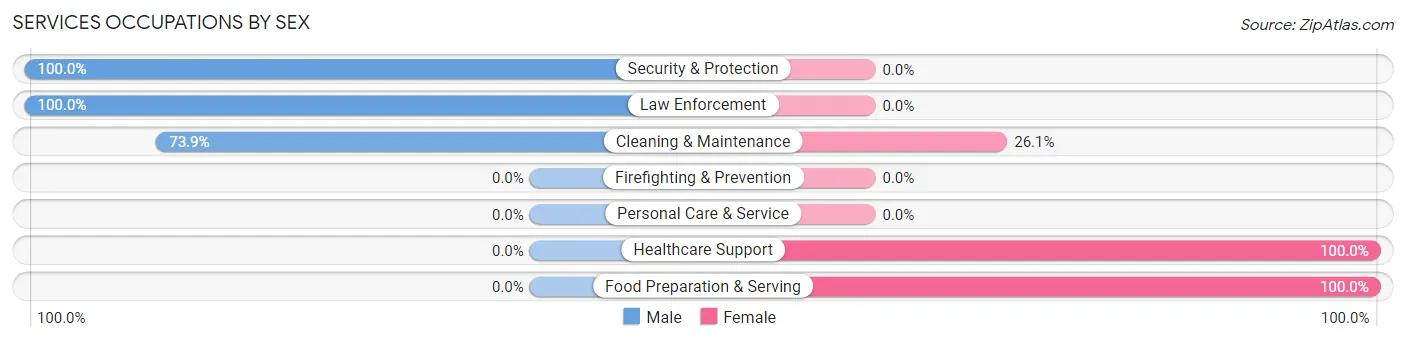
Services Occupations by Sex
Within the Services occupations in Tchula, the most male-oriented occupations are Security & Protection (100.0%), Law Enforcement (100.0%), and Cleaning & Maintenance (73.9%), while the most female-oriented occupations are Healthcare Support (100.0%), Food Preparation & Serving (100.0%), and Cleaning & Maintenance (26.1%).
| Occupation | Male | Female |
| Healthcare Support | 0 (0.0%) | 12 (100.0%) |
| Security & Protection | 6 (100.0%) | 0 (0.0%) |
| Firefighting & Prevention | 0 (0.0%) | 0 (0.0%) |
| Law Enforcement | 6 (100.0%) | 0 (0.0%) |
| Food Preparation & Serving | 0 (0.0%) | 29 (100.0%) |
| Cleaning & Maintenance | 34 (73.9%) | 12 (26.1%) |
| Personal Care & Service | 0 (0.0%) | 0 (0.0%) |
| Total (Category) | 40 (43.0%) | 53 (57.0%) |
| Total (Overall) | 276 (44.4%) | 346 (55.6%) |
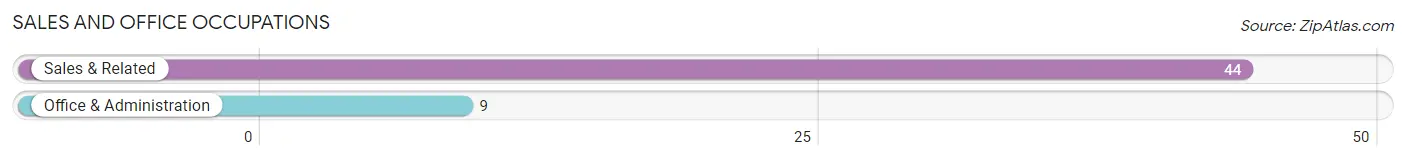
Sales and Office Occupations
The most common Sales and Office occupations in Tchula are Sales & Related (44 | 7.1%), and Office & Administration (9 | 1.5%).
Sales and Office Occupations by Sex
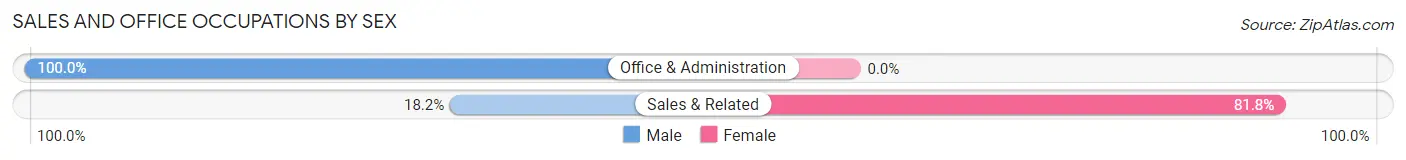
| Occupation | Male | Female |
| Sales & Related | 8 (18.2%) | 36 (81.8%) |
| Office & Administration | 9 (100.0%) | 0 (0.0%) |
| Total (Category) | 17 (32.1%) | 36 (67.9%) |
| Total (Overall) | 276 (44.4%) | 346 (55.6%) |
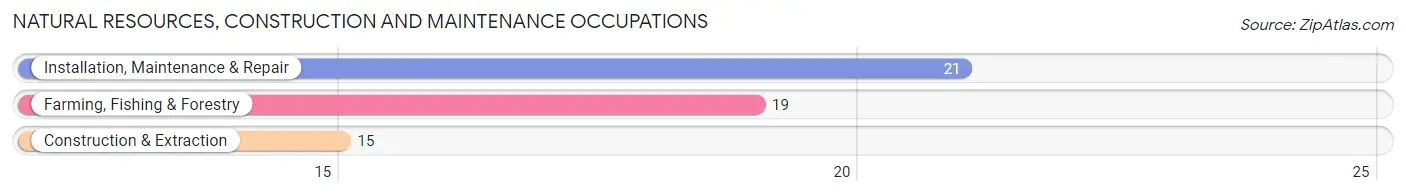
Natural Resources, Construction and Maintenance Occupations
The most common Natural Resources, Construction and Maintenance occupations in Tchula are Installation, Maintenance & Repair (21 | 3.4%), Farming, Fishing & Forestry (19 | 3.0%), and Construction & Extraction (15 | 2.4%).
Natural Resources, Construction and Maintenance Occupations by Sex
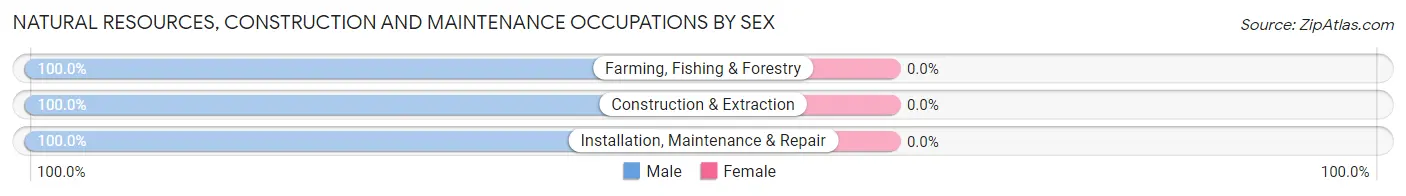
| Occupation | Male | Female |
| Farming, Fishing & Forestry | 19 (100.0%) | 0 (0.0%) |
| Construction & Extraction | 15 (100.0%) | 0 (0.0%) |
| Installation, Maintenance & Repair | 21 (100.0%) | 0 (0.0%) |
| Total (Category) | 55 (100.0%) | 0 (0.0%) |
| Total (Overall) | 276 (44.4%) | 346 (55.6%) |
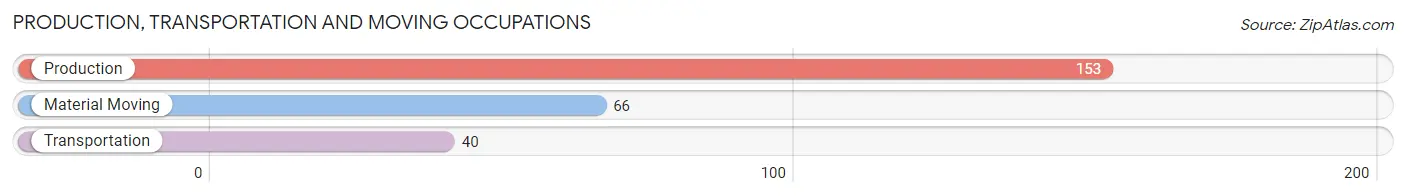
Production, Transportation and Moving Occupations
The most common Production, Transportation and Moving occupations in Tchula are Production (153 | 24.6%), Material Moving (66 | 10.6%), and Transportation (40 | 6.4%).
Production, Transportation and Moving Occupations by Sex
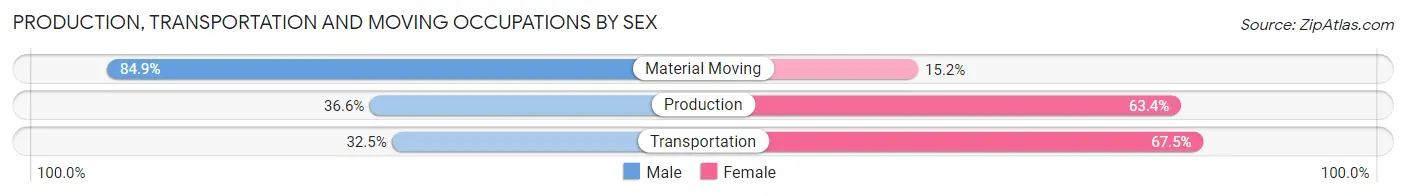
| Occupation | Male | Female |
| Production | 56 (36.6%) | 97 (63.4%) |
| Transportation | 13 (32.5%) | 27 (67.5%) |
| Material Moving | 56 (84.9%) | 10 (15.1%) |
| Total (Category) | 125 (48.3%) | 134 (51.7%) |
| Total (Overall) | 276 (44.4%) | 346 (55.6%) |
Employment Industries by Sex in Tchula
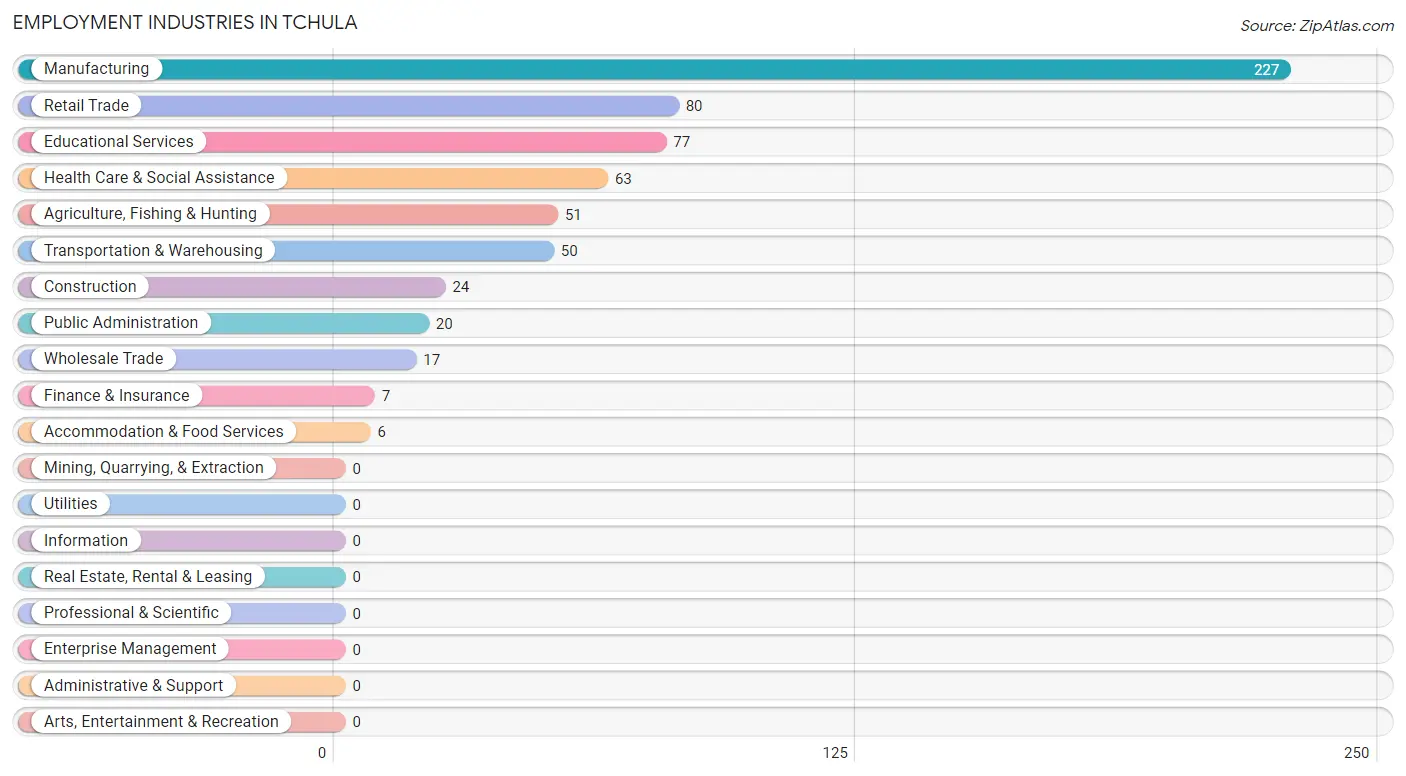
Employment Industries in Tchula
The major employment industries in Tchula include Manufacturing (227 | 36.5%), Retail Trade (80 | 12.9%), Educational Services (77 | 12.4%), Health Care & Social Assistance (63 | 10.1%), and Agriculture, Fishing & Hunting (51 | 8.2%).
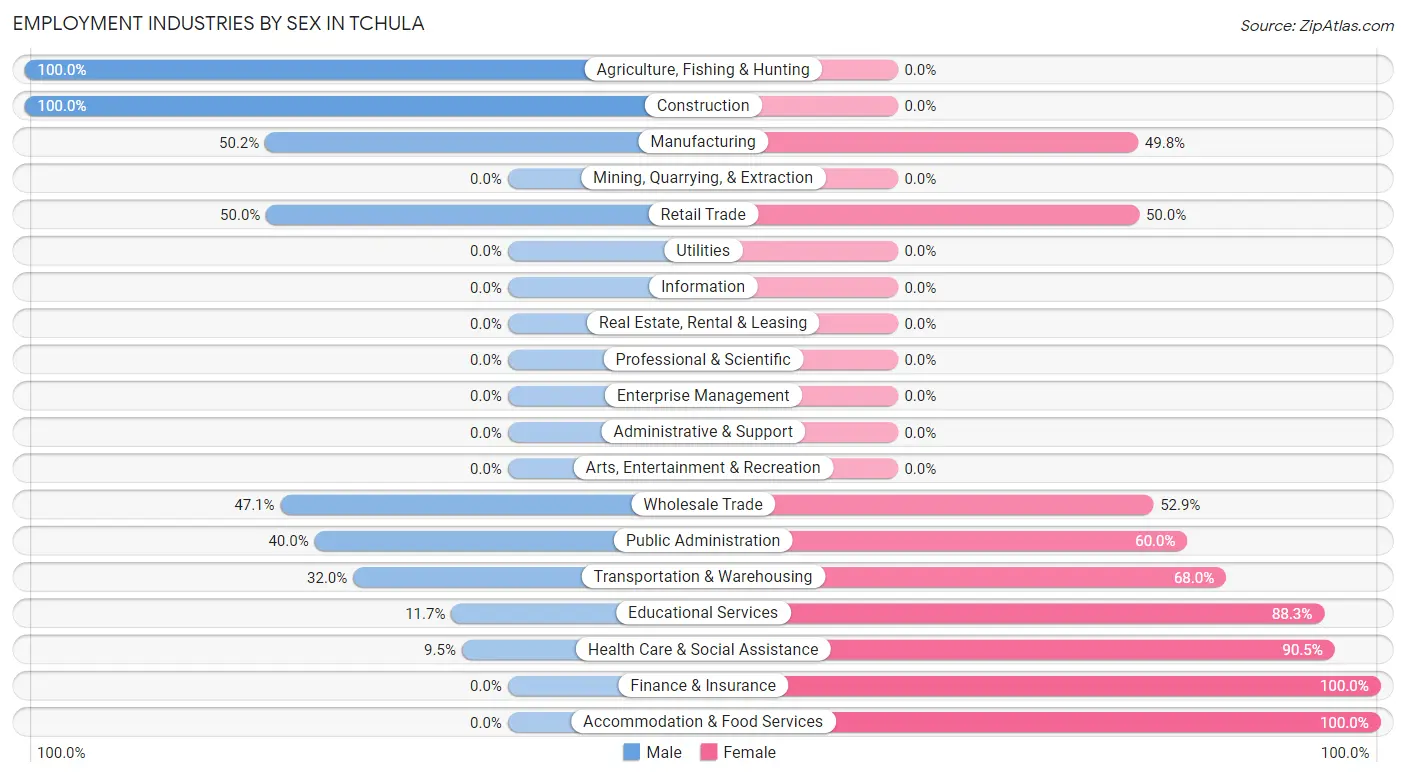
Employment Industries by Sex in Tchula
The Tchula industries that see more men than women are Agriculture, Fishing & Hunting (100.0%), Construction (100.0%), and Manufacturing (50.2%), whereas the industries that tend to have a higher number of women are Finance & Insurance (100.0%), Accommodation & Food Services (100.0%), and Health Care & Social Assistance (90.5%).
| Industry | Male | Female |
| Agriculture, Fishing & Hunting | 51 (100.0%) | 0 (0.0%) |
| Mining, Quarrying, & Extraction | 0 (0.0%) | 0 (0.0%) |
| Construction | 24 (100.0%) | 0 (0.0%) |
| Manufacturing | 114 (50.2%) | 113 (49.8%) |
| Wholesale Trade | 8 (47.1%) | 9 (52.9%) |
| Retail Trade | 40 (50.0%) | 40 (50.0%) |
| Transportation & Warehousing | 16 (32.0%) | 34 (68.0%) |
| Utilities | 0 (0.0%) | 0 (0.0%) |
| Information | 0 (0.0%) | 0 (0.0%) |
| Finance & Insurance | 0 (0.0%) | 7 (100.0%) |
| Real Estate, Rental & Leasing | 0 (0.0%) | 0 (0.0%) |
| Professional & Scientific | 0 (0.0%) | 0 (0.0%) |
| Enterprise Management | 0 (0.0%) | 0 (0.0%) |
| Administrative & Support | 0 (0.0%) | 0 (0.0%) |
| Educational Services | 9 (11.7%) | 68 (88.3%) |
| Health Care & Social Assistance | 6 (9.5%) | 57 (90.5%) |
| Arts, Entertainment & Recreation | 0 (0.0%) | 0 (0.0%) |
| Accommodation & Food Services | 0 (0.0%) | 6 (100.0%) |
| Public Administration | 8 (40.0%) | 12 (60.0%) |
| Total | 276 (44.4%) | 346 (55.6%) |
Education in Tchula
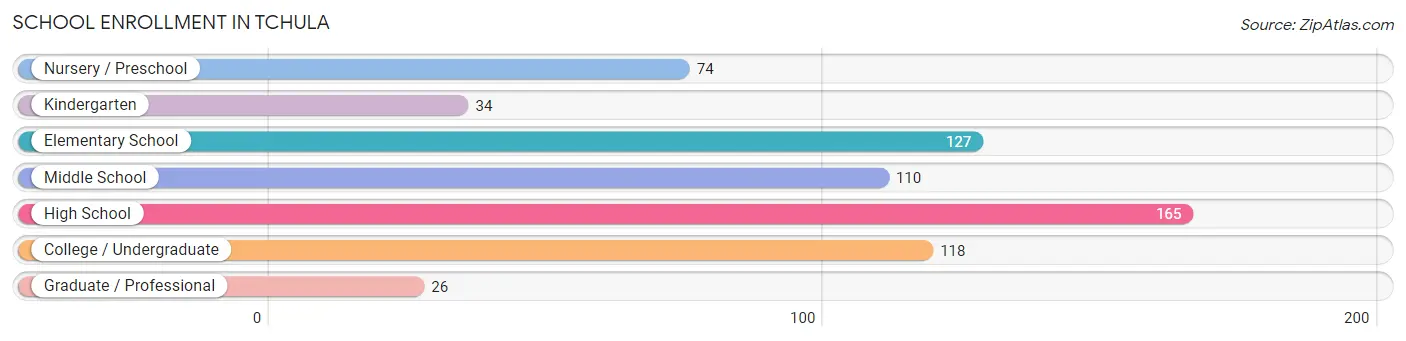
School Enrollment in Tchula
The most common levels of schooling among the 654 students in Tchula are high school (165 | 25.2%), elementary school (127 | 19.4%), and college / undergraduate (118 | 18.0%).
| School Level | # Students | % Students |
| Nursery / Preschool | 74 | 11.3% |
| Kindergarten | 34 | 5.2% |
| Elementary School | 127 | 19.4% |
| Middle School | 110 | 16.8% |
| High School | 165 | 25.2% |
| College / Undergraduate | 118 | 18.0% |
| Graduate / Professional | 26 | 4.0% |
| Total | 654 | 100.0% |
School Enrollment by Age by Funding Source in Tchula
Out of a total of 654 students who are enrolled in schools in Tchula, 22 (3.4%) attend a private institution, while the remaining 632 (96.6%) are enrolled in public schools. The age group of 20 to 24 year olds has the highest likelihood of being enrolled in private schools, with 11 (61.1% in the age bracket) enrolled. Conversely, the age group of 3 to 4 year olds has the lowest likelihood of being enrolled in a private school, with 83 (100.0% in the age bracket) attending a public institution.
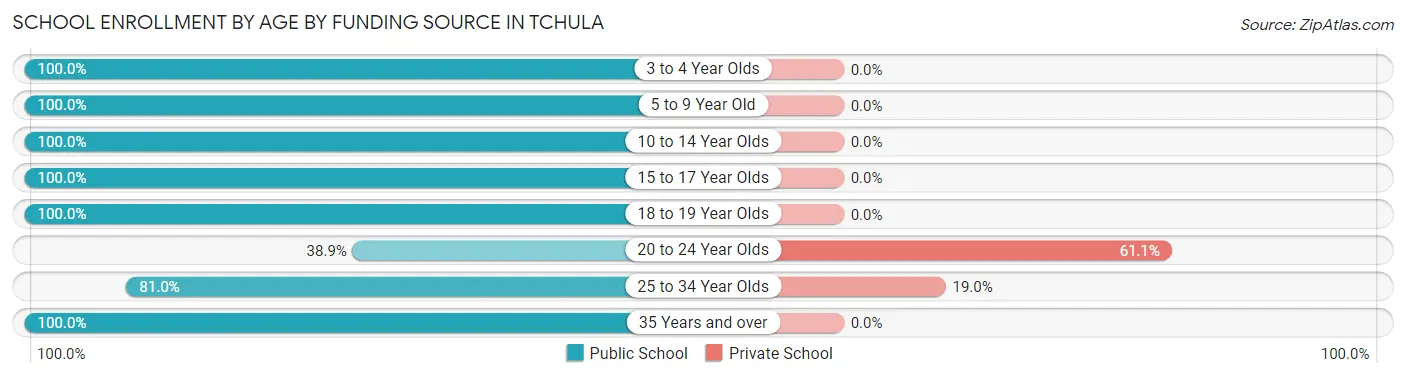
| Age Bracket | Public School | Private School |
| 3 to 4 Year Olds | 83 (100.0%) | 0 (0.0%) |
| 5 to 9 Year Old | 130 (100.0%) | 0 (0.0%) |
| 10 to 14 Year Olds | 151 (100.0%) | 0 (0.0%) |
| 15 to 17 Year Olds | 146 (100.0%) | 0 (0.0%) |
| 18 to 19 Year Olds | 9 (100.0%) | 0 (0.0%) |
| 20 to 24 Year Olds | 7 (38.9%) | 11 (61.1%) |
| 25 to 34 Year Olds | 47 (81.0%) | 11 (19.0%) |
| 35 Years and over | 59 (100.0%) | 0 (0.0%) |
| Total | 632 (96.6%) | 22 (3.4%) |
Educational Attainment by Field of Study in Tchula
Business (98 | 40.3%), education (83 | 34.2%), science & technology (25 | 10.3%), arts & humanities (16 | 6.6%), and social sciences (8 | 3.3%) are the most common fields of study among 243 individuals in Tchula who have obtained a bachelor's degree or higher.
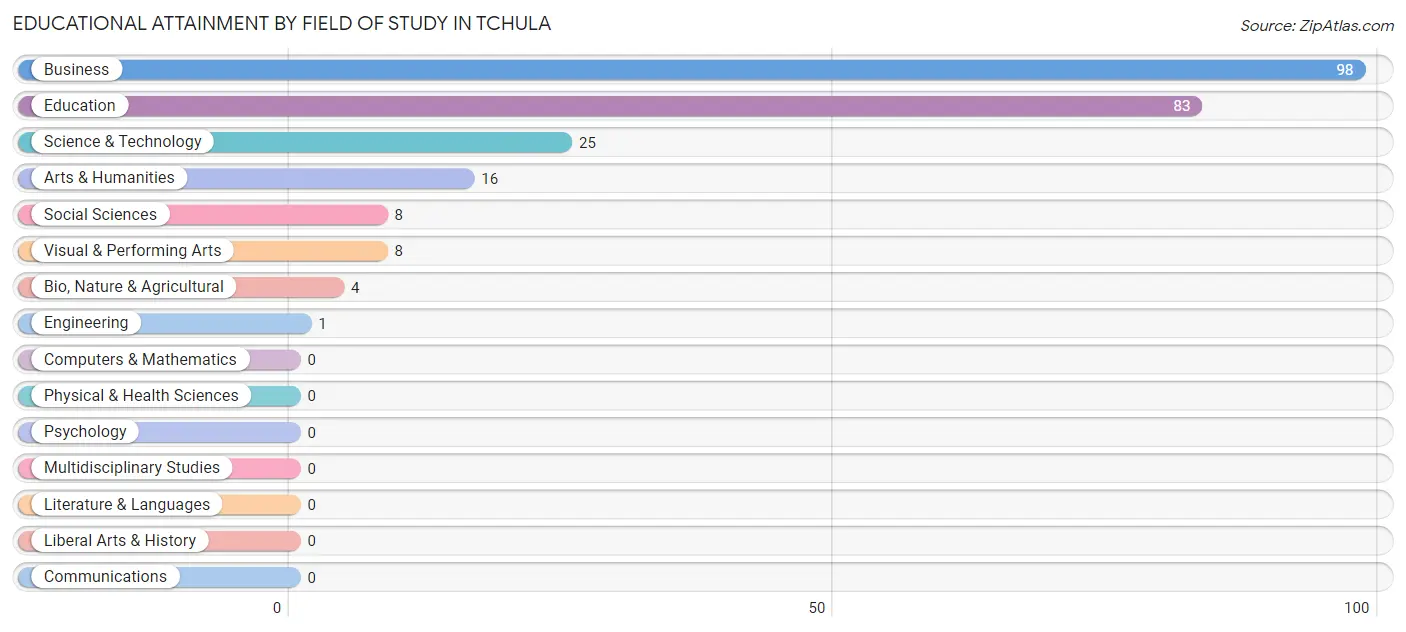
| Field of Study | # Graduates | % Graduates |
| Computers & Mathematics | 0 | 0.0% |
| Bio, Nature & Agricultural | 4 | 1.7% |
| Physical & Health Sciences | 0 | 0.0% |
| Psychology | 0 | 0.0% |
| Social Sciences | 8 | 3.3% |
| Engineering | 1 | 0.4% |
| Multidisciplinary Studies | 0 | 0.0% |
| Science & Technology | 25 | 10.3% |
| Business | 98 | 40.3% |
| Education | 83 | 34.2% |
| Literature & Languages | 0 | 0.0% |
| Liberal Arts & History | 0 | 0.0% |
| Visual & Performing Arts | 8 | 3.3% |
| Communications | 0 | 0.0% |
| Arts & Humanities | 16 | 6.6% |
| Total | 243 | 100.0% |
Transportation & Commute in Tchula
Vehicle Availability by Sex in Tchula
The most prevalent vehicle ownership categories in Tchula are males with 4 vehicles (97, accounting for 35.1%) and females with 4 vehicles (114, making up 28.5%).
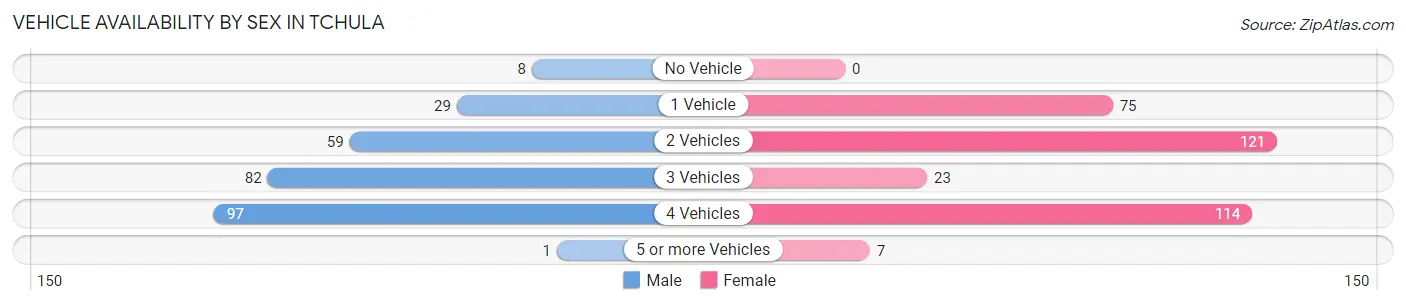
| Vehicles Available | Male | Female |
| No Vehicle | 8 (2.9%) | 0 (0.0%) |
| 1 Vehicle | 29 (10.5%) | 75 (22.1%) |
| 2 Vehicles | 59 (21.4%) | 121 (35.6%) |
| 3 Vehicles | 82 (29.7%) | 23 (6.8%) |
| 4 Vehicles | 97 (35.1%) | 114 (33.5%) |
| 5 or more Vehicles | 1 (0.4%) | 7 (2.1%) |
| Total | 276 (100.0%) | 340 (100.0%) |
Commute Time in Tchula
The most frequently occuring commute durations in Tchula are 45 to 59 minutes (122 commuters, 20.4%), 60 to 89 minutes (99 commuters, 16.6%), and 35 to 39 minutes (70 commuters, 11.7%).
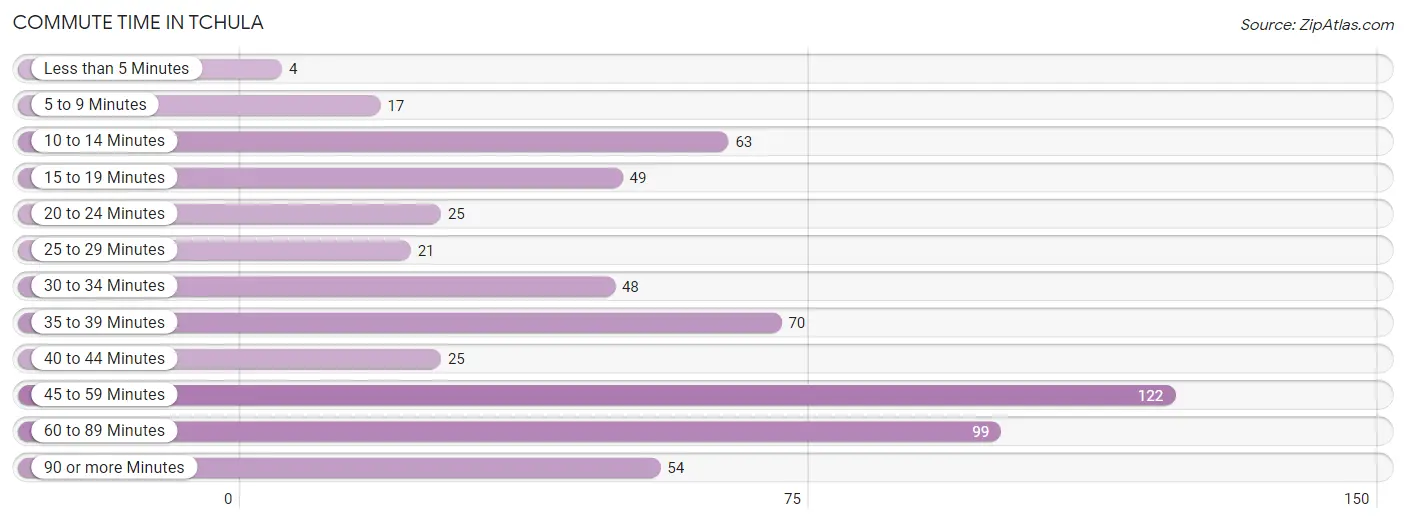
| Commute Time | # Commuters | % Commuters |
| Less than 5 Minutes | 4 | 0.7% |
| 5 to 9 Minutes | 17 | 2.9% |
| 10 to 14 Minutes | 63 | 10.5% |
| 15 to 19 Minutes | 49 | 8.2% |
| 20 to 24 Minutes | 25 | 4.2% |
| 25 to 29 Minutes | 21 | 3.5% |
| 30 to 34 Minutes | 48 | 8.0% |
| 35 to 39 Minutes | 70 | 11.7% |
| 40 to 44 Minutes | 25 | 4.2% |
| 45 to 59 Minutes | 122 | 20.4% |
| 60 to 89 Minutes | 99 | 16.6% |
| 90 or more Minutes | 54 | 9.0% |
Commute Time by Sex in Tchula
The most common commute times in Tchula are 60 to 89 minutes (70 commuters, 26.1%) for males and 45 to 59 minutes (56 commuters, 17.0%) for females.
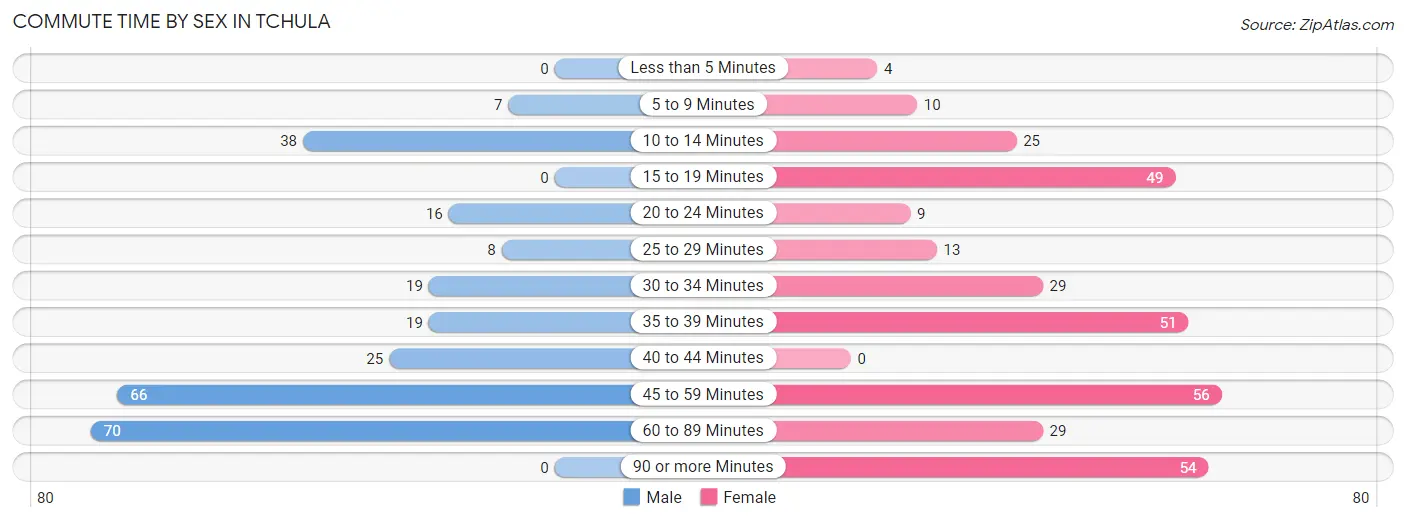
| Commute Time | Male | Female |
| Less than 5 Minutes | 0 (0.0%) | 4 (1.2%) |
| 5 to 9 Minutes | 7 (2.6%) | 10 (3.0%) |
| 10 to 14 Minutes | 38 (14.2%) | 25 (7.6%) |
| 15 to 19 Minutes | 0 (0.0%) | 49 (14.9%) |
| 20 to 24 Minutes | 16 (6.0%) | 9 (2.7%) |
| 25 to 29 Minutes | 8 (3.0%) | 13 (4.0%) |
| 30 to 34 Minutes | 19 (7.1%) | 29 (8.8%) |
| 35 to 39 Minutes | 19 (7.1%) | 51 (15.5%) |
| 40 to 44 Minutes | 25 (9.3%) | 0 (0.0%) |
| 45 to 59 Minutes | 66 (24.6%) | 56 (17.0%) |
| 60 to 89 Minutes | 70 (26.1%) | 29 (8.8%) |
| 90 or more Minutes | 0 (0.0%) | 54 (16.4%) |
Time of Departure to Work by Sex in Tchula
The most frequent times of departure to work in Tchula are 4:00 PM to 11:59 PM (105, 39.2%) for males and 4:00 PM to 11:59 PM (65, 19.8%) for females.
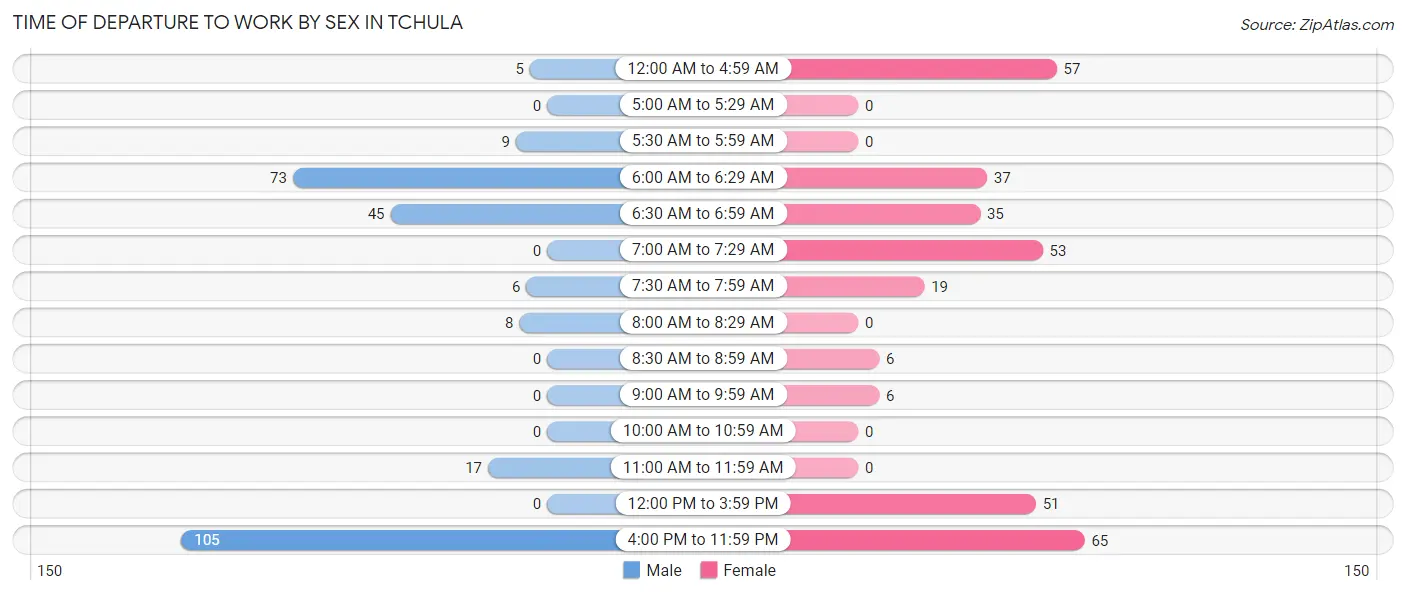
| Time of Departure | Male | Female |
| 12:00 AM to 4:59 AM | 5 (1.9%) | 57 (17.3%) |
| 5:00 AM to 5:29 AM | 0 (0.0%) | 0 (0.0%) |
| 5:30 AM to 5:59 AM | 9 (3.4%) | 0 (0.0%) |
| 6:00 AM to 6:29 AM | 73 (27.2%) | 37 (11.3%) |
| 6:30 AM to 6:59 AM | 45 (16.8%) | 35 (10.6%) |
| 7:00 AM to 7:29 AM | 0 (0.0%) | 53 (16.1%) |
| 7:30 AM to 7:59 AM | 6 (2.2%) | 19 (5.8%) |
| 8:00 AM to 8:29 AM | 8 (3.0%) | 0 (0.0%) |
| 8:30 AM to 8:59 AM | 0 (0.0%) | 6 (1.8%) |
| 9:00 AM to 9:59 AM | 0 (0.0%) | 6 (1.8%) |
| 10:00 AM to 10:59 AM | 0 (0.0%) | 0 (0.0%) |
| 11:00 AM to 11:59 AM | 17 (6.3%) | 0 (0.0%) |
| 12:00 PM to 3:59 PM | 0 (0.0%) | 51 (15.5%) |
| 4:00 PM to 11:59 PM | 105 (39.2%) | 65 (19.8%) |
| Total | 268 (100.0%) | 329 (100.0%) |
Housing Occupancy in Tchula
Occupancy by Ownership in Tchula
Of the total 777 dwellings in Tchula, owner-occupied units account for 325 (41.8%), while renter-occupied units make up 452 (58.2%).
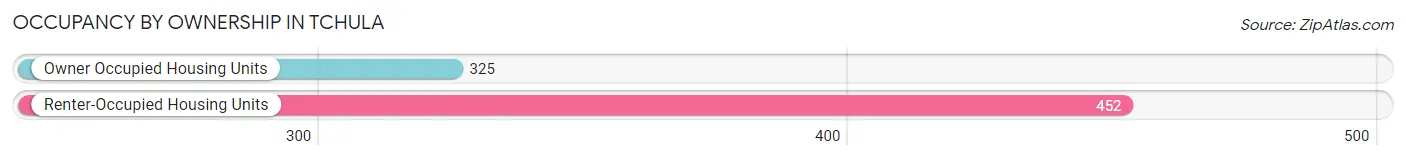
| Occupancy | # Housing Units | % Housing Units |
| Owner Occupied Housing Units | 325 | 41.8% |
| Renter-Occupied Housing Units | 452 | 58.2% |
| Total Occupied Housing Units | 777 | 100.0% |
Occupancy by Household Size in Tchula
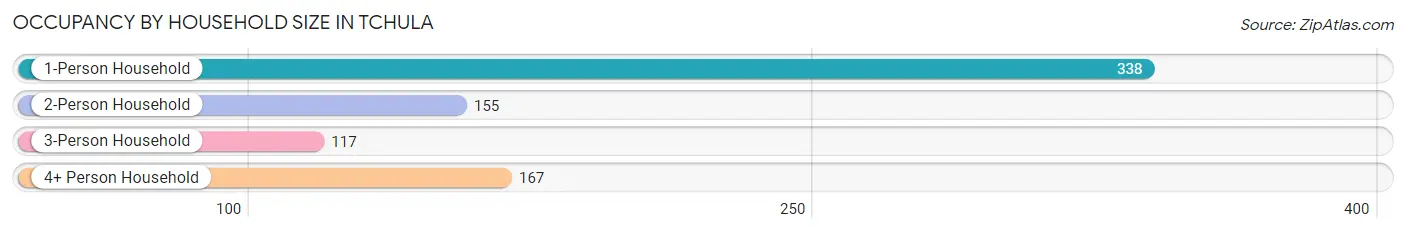
| Household Size | # Housing Units | % Housing Units |
| 1-Person Household | 338 | 43.5% |
| 2-Person Household | 155 | 20.0% |
| 3-Person Household | 117 | 15.1% |
| 4+ Person Household | 167 | 21.5% |
| Total Housing Units | 777 | 100.0% |
Occupancy by Ownership by Household Size in Tchula
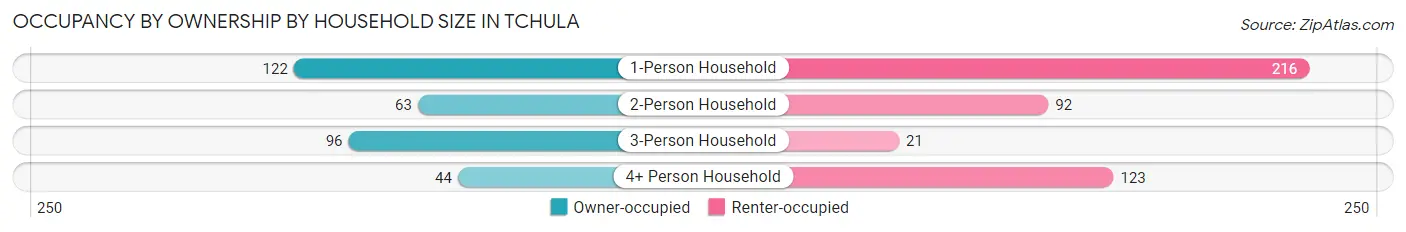
| Household Size | Owner-occupied | Renter-occupied |
| 1-Person Household | 122 (36.1%) | 216 (63.9%) |
| 2-Person Household | 63 (40.6%) | 92 (59.4%) |
| 3-Person Household | 96 (82.1%) | 21 (17.9%) |
| 4+ Person Household | 44 (26.4%) | 123 (73.7%) |
| Total Housing Units | 325 (41.8%) | 452 (58.2%) |
Occupancy by Educational Attainment in Tchula
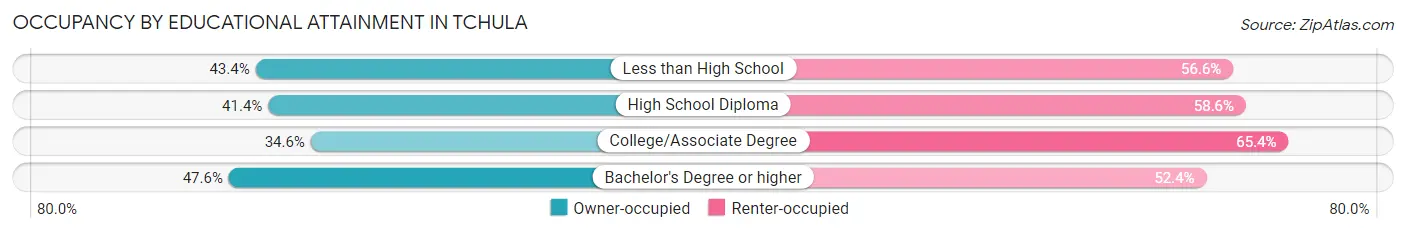
| Household Size | Owner-occupied | Renter-occupied |
| Less than High School | 59 (43.4%) | 77 (56.6%) |
| High School Diploma | 103 (41.4%) | 146 (58.6%) |
| College/Associate Degree | 63 (34.6%) | 119 (65.4%) |
| Bachelor's Degree or higher | 100 (47.6%) | 110 (52.4%) |
Occupancy by Age of Householder in Tchula
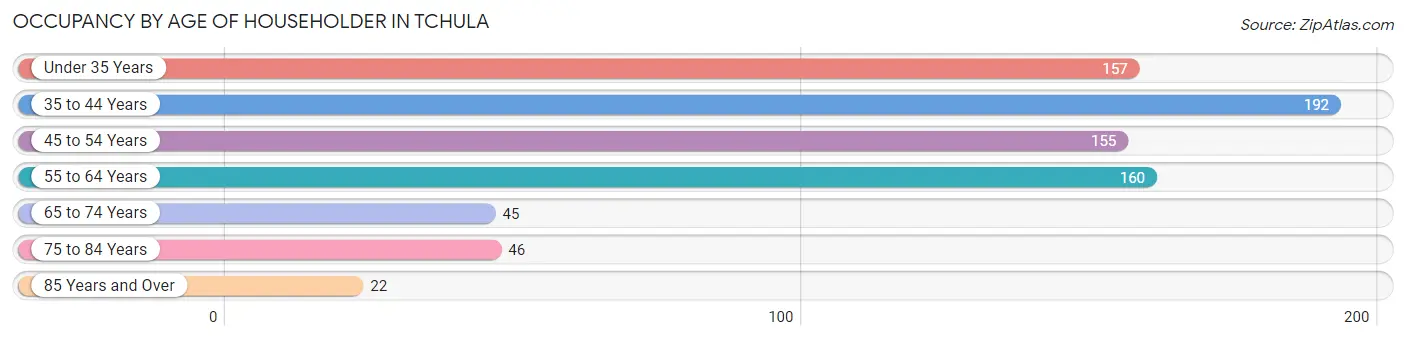
| Age Bracket | # Households | % Households |
| Under 35 Years | 157 | 20.2% |
| 35 to 44 Years | 192 | 24.7% |
| 45 to 54 Years | 155 | 20.0% |
| 55 to 64 Years | 160 | 20.6% |
| 65 to 74 Years | 45 | 5.8% |
| 75 to 84 Years | 46 | 5.9% |
| 85 Years and Over | 22 | 2.8% |
| Total | 777 | 100.0% |
Housing Finances in Tchula
Median Income by Occupancy in Tchula
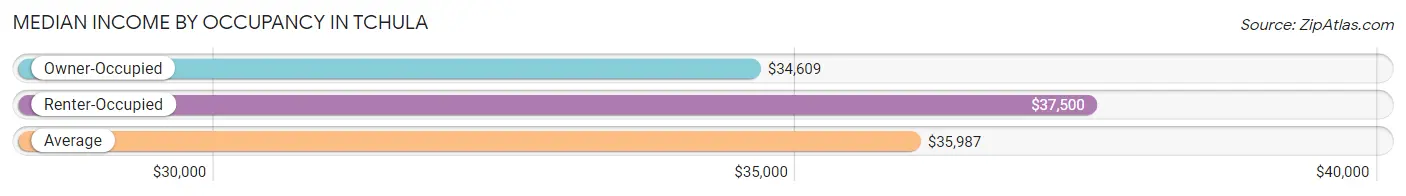
| Occupancy Type | # Households | Median Income |
| Owner-Occupied | 325 (41.8%) | $34,609 |
| Renter-Occupied | 452 (58.2%) | $37,500 |
| Average | 777 (100.0%) | $35,987 |
Occupancy by Householder Income Bracket in Tchula
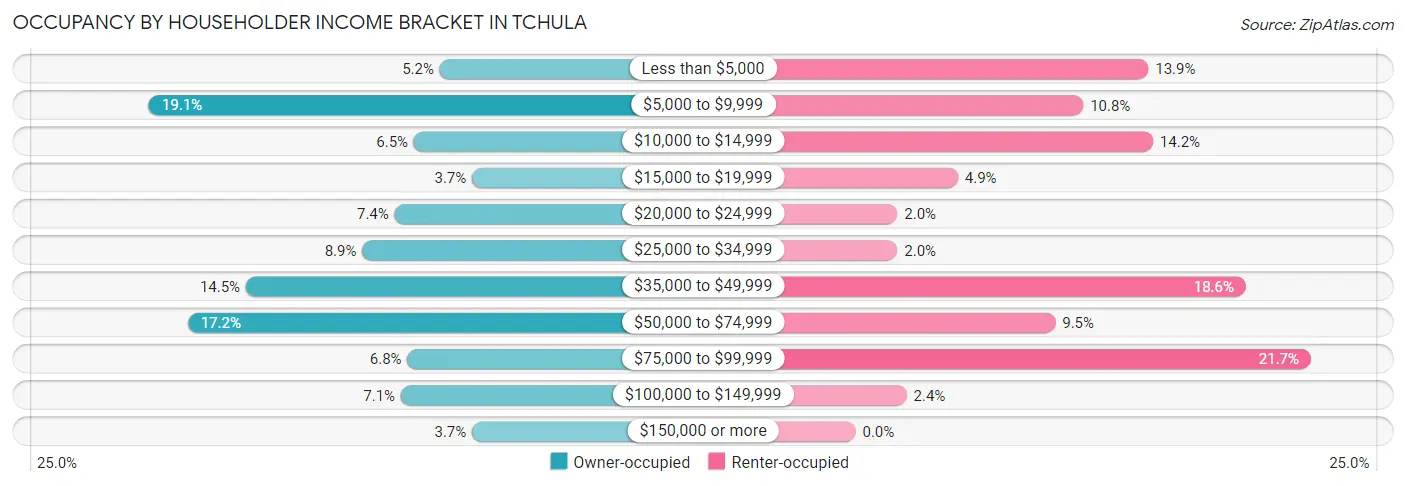
| Income Bracket | Owner-occupied | Renter-occupied |
| Less than $5,000 | 17 (5.2%) | 63 (13.9%) |
| $5,000 to $9,999 | 62 (19.1%) | 49 (10.8%) |
| $10,000 to $14,999 | 21 (6.5%) | 64 (14.2%) |
| $15,000 to $19,999 | 12 (3.7%) | 22 (4.9%) |
| $20,000 to $24,999 | 24 (7.4%) | 9 (2.0%) |
| $25,000 to $34,999 | 29 (8.9%) | 9 (2.0%) |
| $35,000 to $49,999 | 47 (14.5%) | 84 (18.6%) |
| $50,000 to $74,999 | 56 (17.2%) | 43 (9.5%) |
| $75,000 to $99,999 | 22 (6.8%) | 98 (21.7%) |
| $100,000 to $149,999 | 23 (7.1%) | 11 (2.4%) |
| $150,000 or more | 12 (3.7%) | 0 (0.0%) |
| Total | 325 (100.0%) | 452 (100.0%) |
Monthly Housing Cost Tiers in Tchula
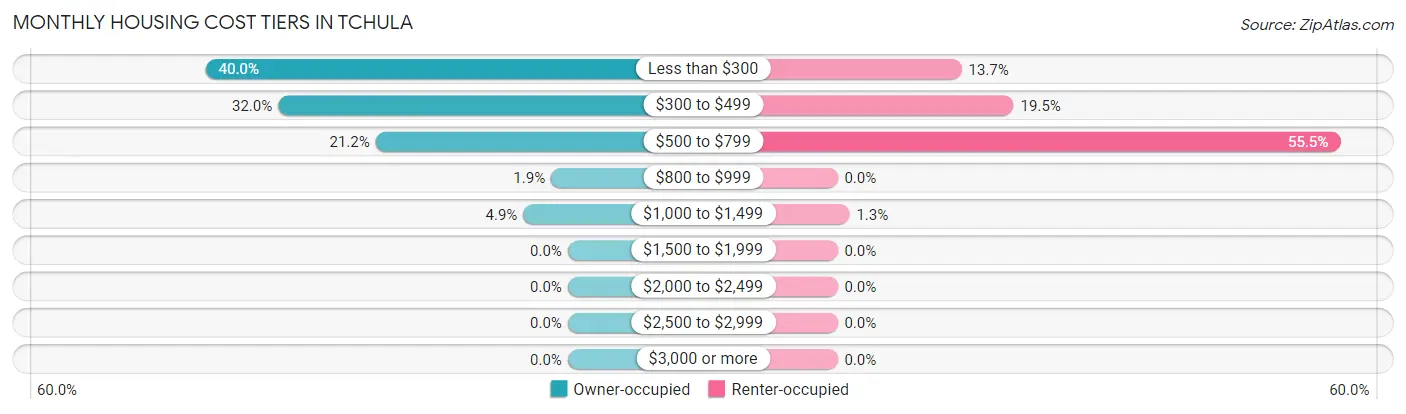
| Monthly Cost | Owner-occupied | Renter-occupied |
| Less than $300 | 130 (40.0%) | 62 (13.7%) |
| $300 to $499 | 104 (32.0%) | 88 (19.5%) |
| $500 to $799 | 69 (21.2%) | 251 (55.5%) |
| $800 to $999 | 6 (1.8%) | 0 (0.0%) |
| $1,000 to $1,499 | 16 (4.9%) | 6 (1.3%) |
| $1,500 to $1,999 | 0 (0.0%) | 0 (0.0%) |
| $2,000 to $2,499 | 0 (0.0%) | 0 (0.0%) |
| $2,500 to $2,999 | 0 (0.0%) | 0 (0.0%) |
| $3,000 or more | 0 (0.0%) | 0 (0.0%) |
| Total | 325 (100.0%) | 452 (100.0%) |
Physical Housing Characteristics in Tchula
Housing Structures in Tchula
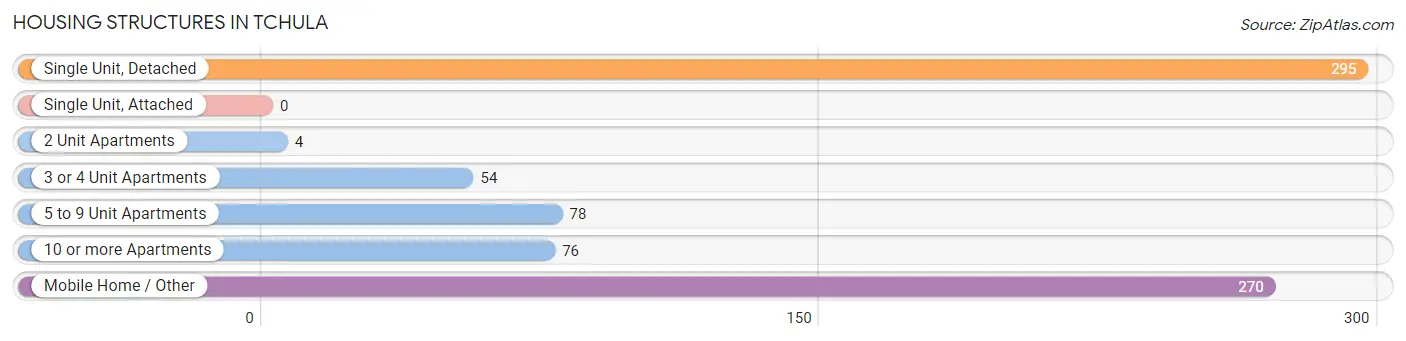
| Structure Type | # Housing Units | % Housing Units |
| Single Unit, Detached | 295 | 38.0% |
| Single Unit, Attached | 0 | 0.0% |
| 2 Unit Apartments | 4 | 0.5% |
| 3 or 4 Unit Apartments | 54 | 7.0% |
| 5 to 9 Unit Apartments | 78 | 10.0% |
| 10 or more Apartments | 76 | 9.8% |
| Mobile Home / Other | 270 | 34.7% |
| Total | 777 | 100.0% |
Housing Structures by Occupancy in Tchula
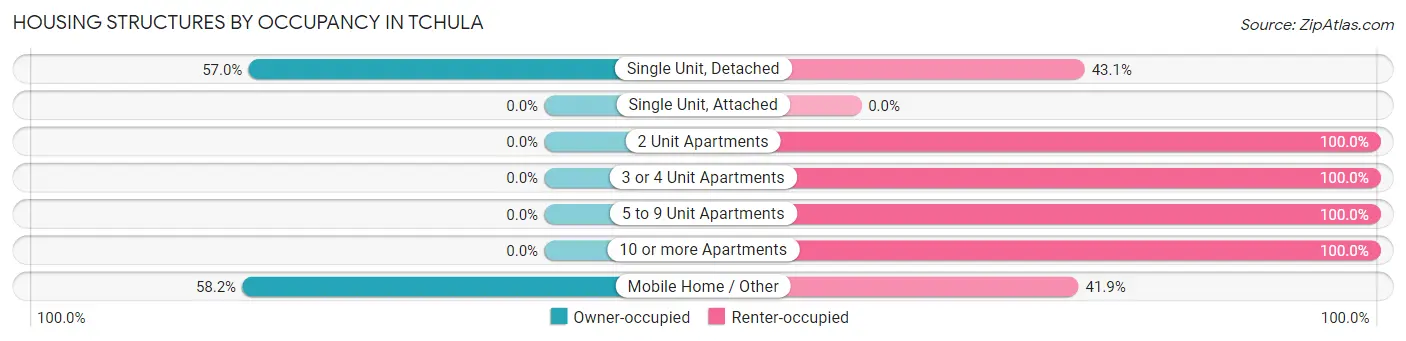
| Structure Type | Owner-occupied | Renter-occupied |
| Single Unit, Detached | 168 (57.0%) | 127 (43.0%) |
| Single Unit, Attached | 0 (0.0%) | 0 (0.0%) |
| 2 Unit Apartments | 0 (0.0%) | 4 (100.0%) |
| 3 or 4 Unit Apartments | 0 (0.0%) | 54 (100.0%) |
| 5 to 9 Unit Apartments | 0 (0.0%) | 78 (100.0%) |
| 10 or more Apartments | 0 (0.0%) | 76 (100.0%) |
| Mobile Home / Other | 157 (58.2%) | 113 (41.8%) |
| Total | 325 (41.8%) | 452 (58.2%) |
Housing Structures by Number of Rooms in Tchula
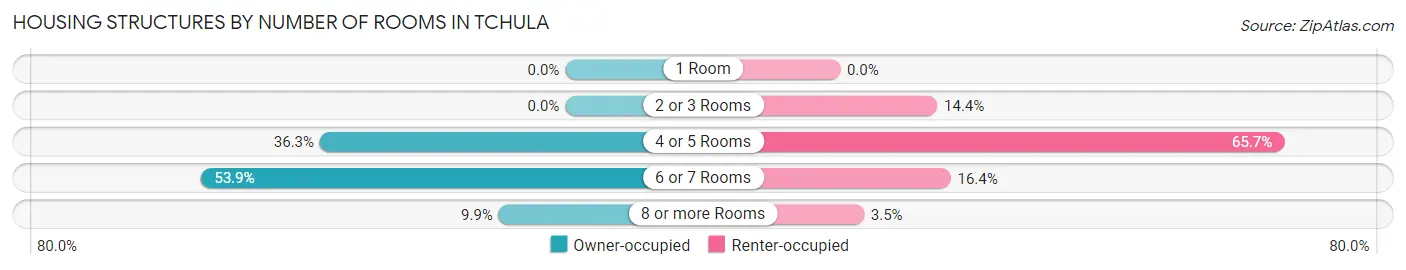
| Number of Rooms | Owner-occupied | Renter-occupied |
| 1 Room | 0 (0.0%) | 0 (0.0%) |
| 2 or 3 Rooms | 0 (0.0%) | 65 (14.4%) |
| 4 or 5 Rooms | 118 (36.3%) | 297 (65.7%) |
| 6 or 7 Rooms | 175 (53.8%) | 74 (16.4%) |
| 8 or more Rooms | 32 (9.9%) | 16 (3.5%) |
| Total | 325 (100.0%) | 452 (100.0%) |
Housing Structure by Heating Type in Tchula
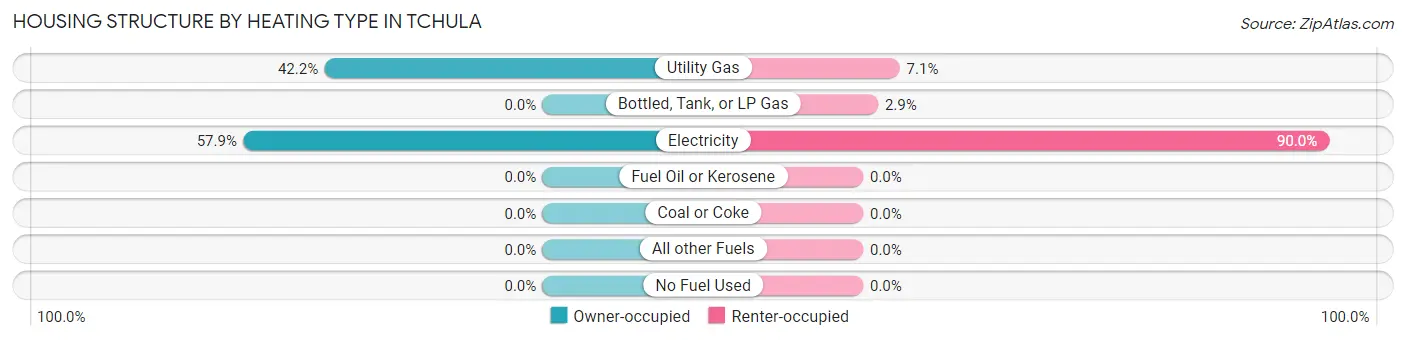
| Heating Type | Owner-occupied | Renter-occupied |
| Utility Gas | 137 (42.1%) | 32 (7.1%) |
| Bottled, Tank, or LP Gas | 0 (0.0%) | 13 (2.9%) |
| Electricity | 188 (57.9%) | 407 (90.0%) |
| Fuel Oil or Kerosene | 0 (0.0%) | 0 (0.0%) |
| Coal or Coke | 0 (0.0%) | 0 (0.0%) |
| All other Fuels | 0 (0.0%) | 0 (0.0%) |
| No Fuel Used | 0 (0.0%) | 0 (0.0%) |
| Total | 325 (100.0%) | 452 (100.0%) |
Household Vehicle Usage in Tchula
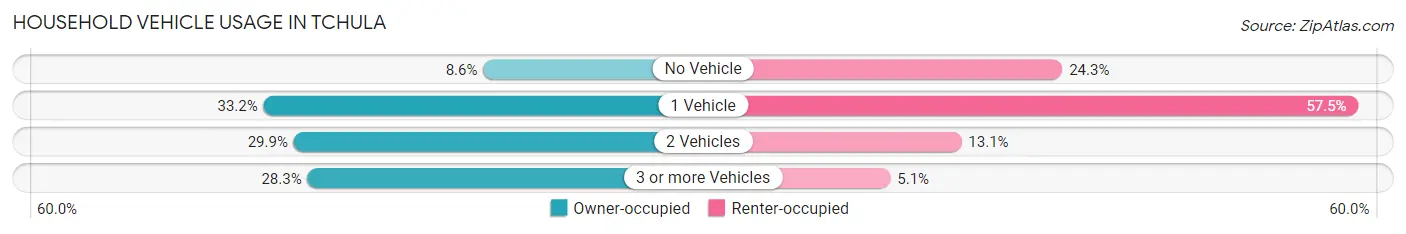
| Vehicles per Household | Owner-occupied | Renter-occupied |
| No Vehicle | 28 (8.6%) | 110 (24.3%) |
| 1 Vehicle | 108 (33.2%) | 260 (57.5%) |
| 2 Vehicles | 97 (29.8%) | 59 (13.1%) |
| 3 or more Vehicles | 92 (28.3%) | 23 (5.1%) |
| Total | 325 (100.0%) | 452 (100.0%) |
Real Estate & Mortgages in Tchula
Real Estate and Mortgage Overview in Tchula
| Characteristic | Without Mortgage | With Mortgage |
| Housing Units | 259 | 66 |
| Median Property Value | $68,800 | $0 |
| Median Household Income | $32,981 | $4 |
| Monthly Housing Costs | $300 | $0 |
| Real Estate Taxes | $216 | $41 |
Property Value by Mortgage Status in Tchula
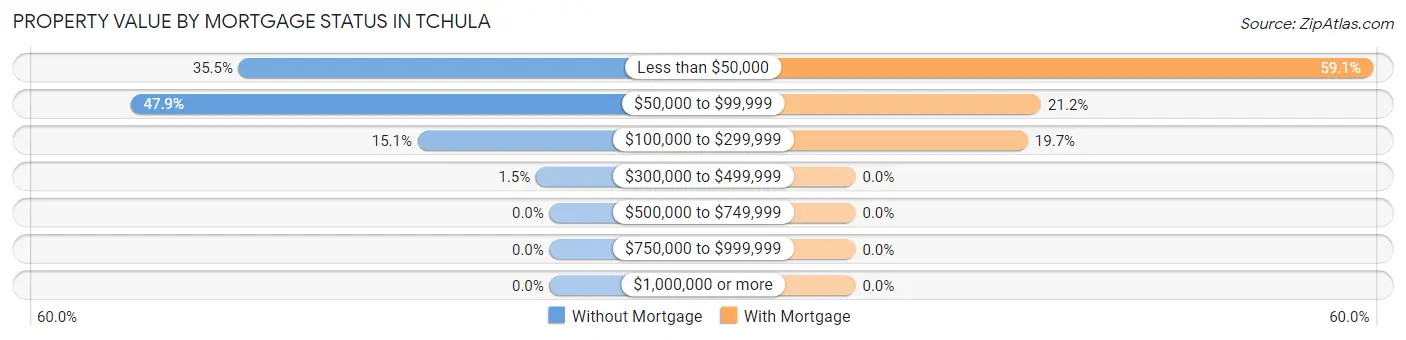
| Property Value | Without Mortgage | With Mortgage |
| Less than $50,000 | 92 (35.5%) | 39 (59.1%) |
| $50,000 to $99,999 | 124 (47.9%) | 14 (21.2%) |
| $100,000 to $299,999 | 39 (15.1%) | 13 (19.7%) |
| $300,000 to $499,999 | 4 (1.5%) | 0 (0.0%) |
| $500,000 to $749,999 | 0 (0.0%) | 0 (0.0%) |
| $750,000 to $999,999 | 0 (0.0%) | 0 (0.0%) |
| $1,000,000 or more | 0 (0.0%) | 0 (0.0%) |
| Total | 259 (100.0%) | 66 (100.0%) |
Household Income by Mortgage Status in Tchula
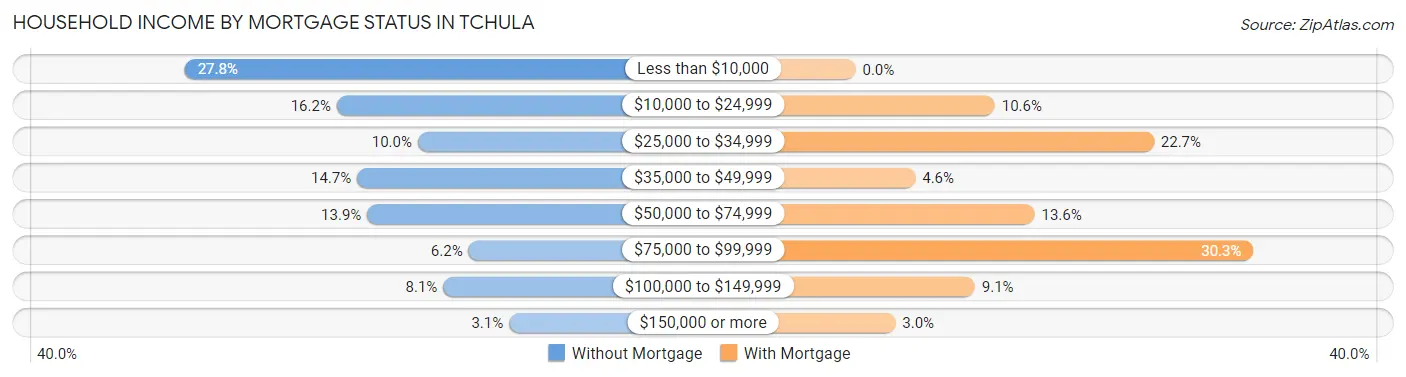
| Household Income | Without Mortgage | With Mortgage |
| Less than $10,000 | 72 (27.8%) | 0 (0.0%) |
| $10,000 to $24,999 | 42 (16.2%) | 7 (10.6%) |
| $25,000 to $34,999 | 26 (10.0%) | 15 (22.7%) |
| $35,000 to $49,999 | 38 (14.7%) | 3 (4.5%) |
| $50,000 to $74,999 | 36 (13.9%) | 9 (13.6%) |
| $75,000 to $99,999 | 16 (6.2%) | 20 (30.3%) |
| $100,000 to $149,999 | 21 (8.1%) | 6 (9.1%) |
| $150,000 or more | 8 (3.1%) | 2 (3.0%) |
| Total | 259 (100.0%) | 66 (100.0%) |
Property Value to Household Income Ratio in Tchula
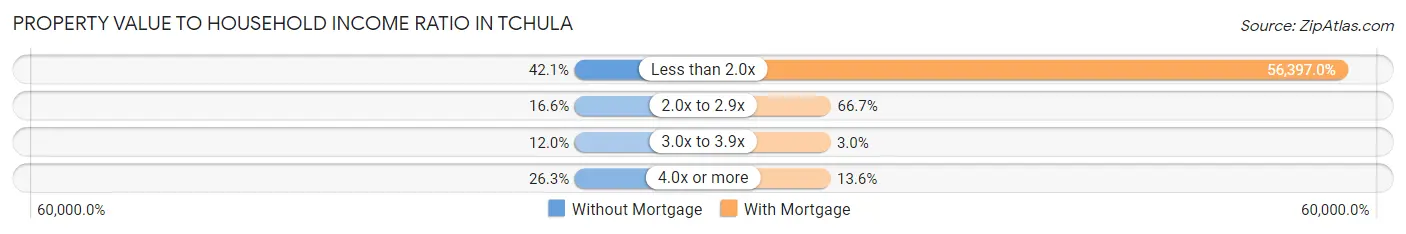
| Value-to-Income Ratio | Without Mortgage | With Mortgage |
| Less than 2.0x | 109 (42.1%) | 37,222 (56,397.0%) |
| 2.0x to 2.9x | 43 (16.6%) | 44 (66.7%) |
| 3.0x to 3.9x | 31 (12.0%) | 2 (3.0%) |
| 4.0x or more | 68 (26.3%) | 9 (13.6%) |
| Total | 259 (100.0%) | 66 (100.0%) |
Real Estate Taxes by Mortgage Status in Tchula
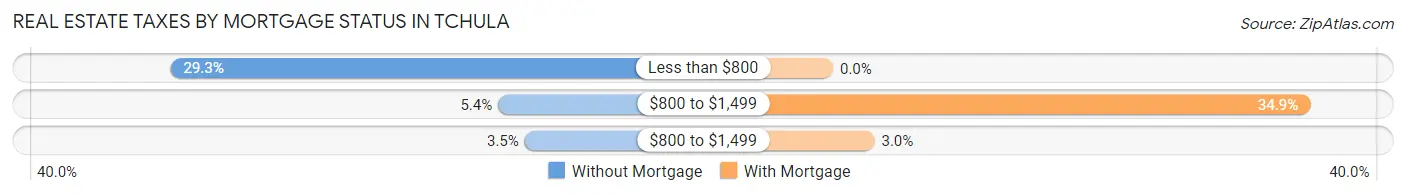
| Property Taxes | Without Mortgage | With Mortgage |
| Less than $800 | 76 (29.3%) | 0 (0.0%) |
| $800 to $1,499 | 14 (5.4%) | 23 (34.8%) |
| $800 to $1,499 | 9 (3.5%) | 2 (3.0%) |
| Total | 259 (100.0%) | 66 (100.0%) |
Health & Disability in Tchula
Health Insurance Coverage by Age in Tchula
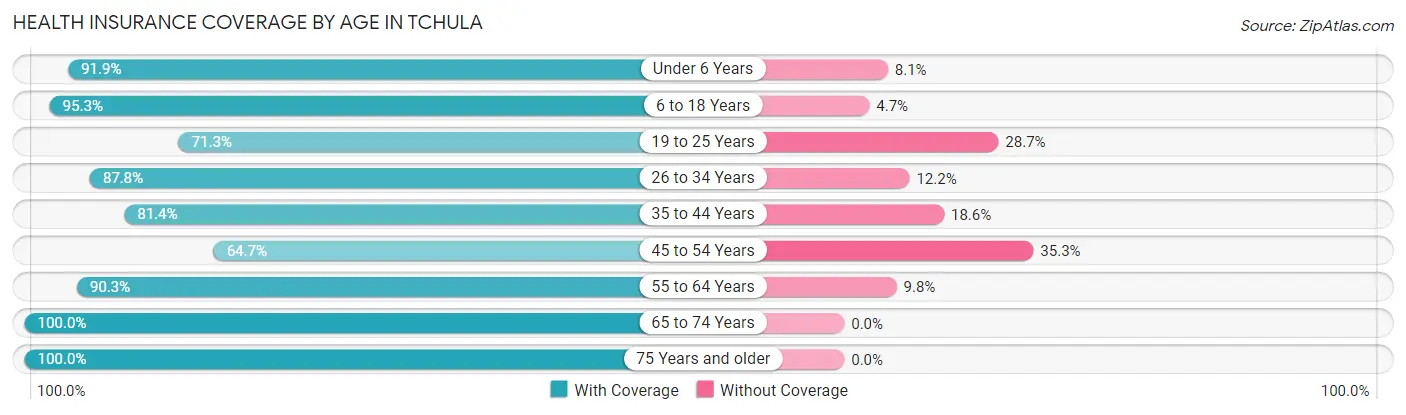
| Age Bracket | With Coverage | Without Coverage |
| Under 6 Years | 283 (91.9%) | 25 (8.1%) |
| 6 to 18 Years | 407 (95.3%) | 20 (4.7%) |
| 19 to 25 Years | 186 (71.3%) | 75 (28.7%) |
| 26 to 34 Years | 289 (87.8%) | 40 (12.2%) |
| 35 to 44 Years | 245 (81.4%) | 56 (18.6%) |
| 45 to 54 Years | 145 (64.7%) | 79 (35.3%) |
| 55 to 64 Years | 213 (90.2%) | 23 (9.8%) |
| 65 to 74 Years | 88 (100.0%) | 0 (0.0%) |
| 75 Years and older | 100 (100.0%) | 0 (0.0%) |
| Total | 1,956 (86.0%) | 318 (14.0%) |
Health Insurance Coverage by Citizenship Status in Tchula
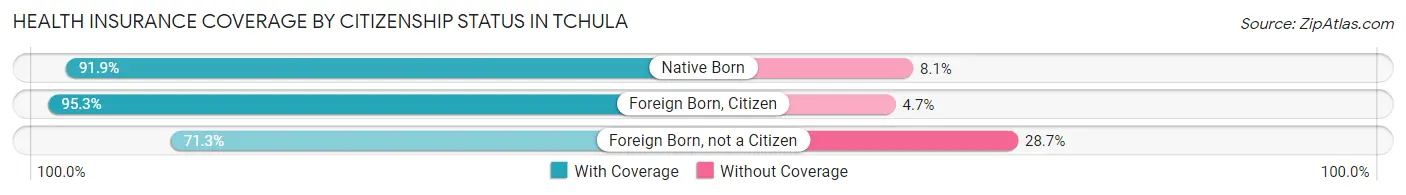
| Citizenship Status | With Coverage | Without Coverage |
| Native Born | 283 (91.9%) | 25 (8.1%) |
| Foreign Born, Citizen | 407 (95.3%) | 20 (4.7%) |
| Foreign Born, not a Citizen | 186 (71.3%) | 75 (28.7%) |
Health Insurance Coverage by Household Income in Tchula
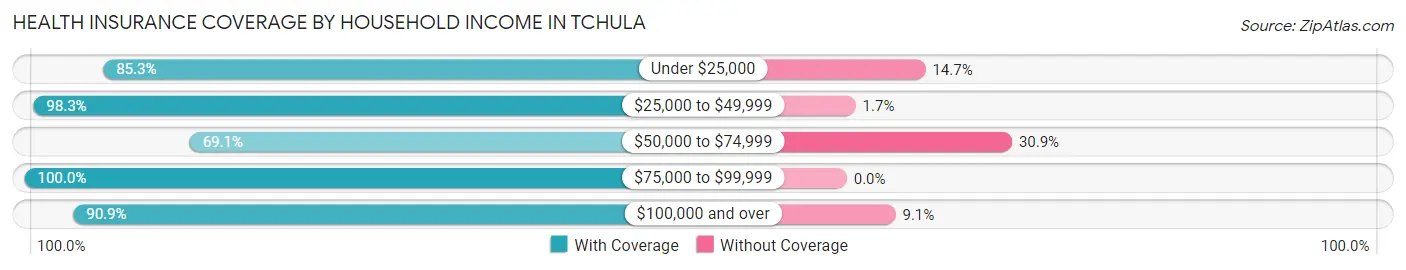
| Household Income | With Coverage | Without Coverage |
| Under $25,000 | 862 (85.3%) | 149 (14.7%) |
| $25,000 to $49,999 | 356 (98.3%) | 6 (1.7%) |
| $50,000 to $74,999 | 317 (69.1%) | 142 (30.9%) |
| $75,000 to $99,999 | 212 (100.0%) | 0 (0.0%) |
| $100,000 and over | 209 (90.9%) | 21 (9.1%) |
Public vs Private Health Insurance Coverage by Age in Tchula
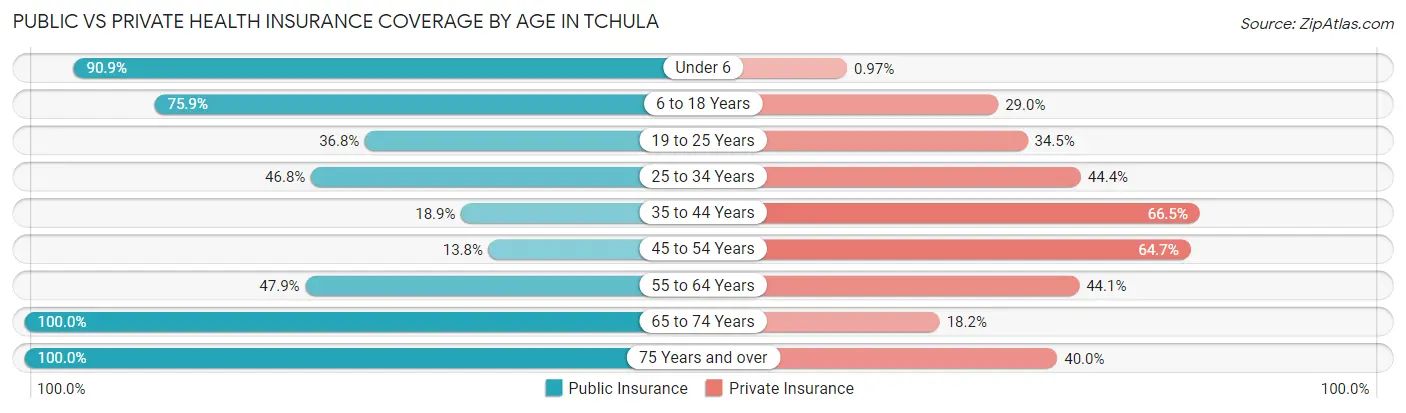
| Age Bracket | Public Insurance | Private Insurance |
| Under 6 | 280 (90.9%) | 3 (1.0%) |
| 6 to 18 Years | 324 (75.9%) | 124 (29.0%) |
| 19 to 25 Years | 96 (36.8%) | 90 (34.5%) |
| 25 to 34 Years | 154 (46.8%) | 146 (44.4%) |
| 35 to 44 Years | 57 (18.9%) | 200 (66.4%) |
| 45 to 54 Years | 31 (13.8%) | 145 (64.7%) |
| 55 to 64 Years | 113 (47.9%) | 104 (44.1%) |
| 65 to 74 Years | 88 (100.0%) | 16 (18.2%) |
| 75 Years and over | 100 (100.0%) | 40 (40.0%) |
| Total | 1,243 (54.7%) | 868 (38.2%) |
Disability Status by Sex by Age in Tchula
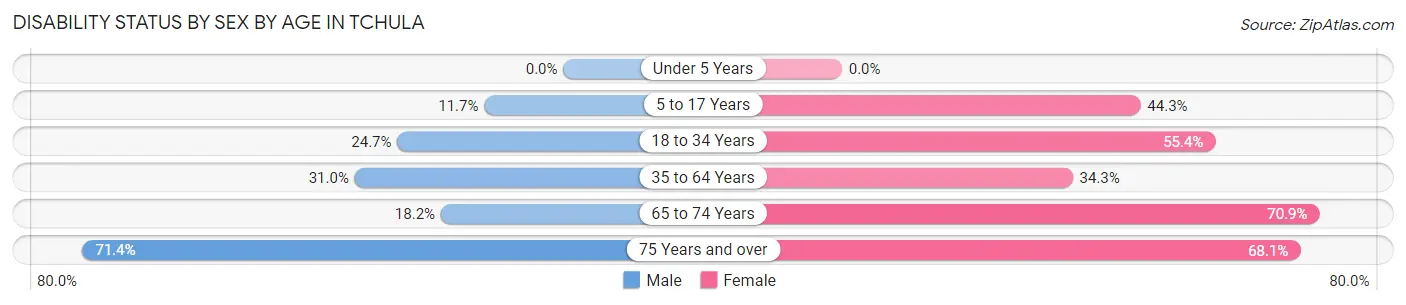
| Age Bracket | Male | Female |
| Under 5 Years | 0 (0.0%) | 0 (0.0%) |
| 5 to 17 Years | 27 (11.7%) | 94 (44.3%) |
| 18 to 34 Years | 53 (24.6%) | 214 (55.4%) |
| 35 to 64 Years | 92 (31.0%) | 159 (34.3%) |
| 65 to 74 Years | 6 (18.2%) | 39 (70.9%) |
| 75 Years and over | 20 (71.4%) | 49 (68.1%) |
Disability Class by Sex by Age in Tchula
Disability Class: Hearing Difficulty
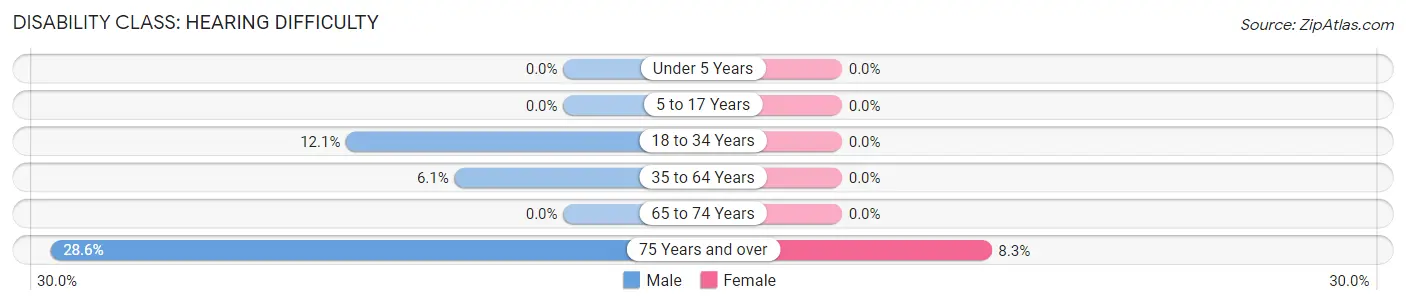
| Age Bracket | Male | Female |
| Under 5 Years | 0 (0.0%) | 0 (0.0%) |
| 5 to 17 Years | 0 (0.0%) | 0 (0.0%) |
| 18 to 34 Years | 26 (12.1%) | 0 (0.0%) |
| 35 to 64 Years | 18 (6.1%) | 0 (0.0%) |
| 65 to 74 Years | 0 (0.0%) | 0 (0.0%) |
| 75 Years and over | 8 (28.6%) | 6 (8.3%) |
Disability Class: Vision Difficulty
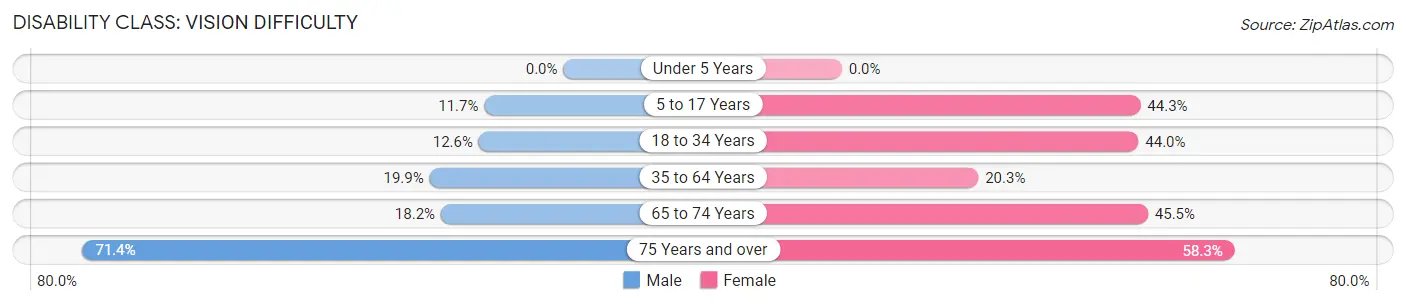
| Age Bracket | Male | Female |
| Under 5 Years | 0 (0.0%) | 0 (0.0%) |
| 5 to 17 Years | 27 (11.7%) | 94 (44.3%) |
| 18 to 34 Years | 27 (12.6%) | 170 (44.0%) |
| 35 to 64 Years | 59 (19.9%) | 94 (20.3%) |
| 65 to 74 Years | 6 (18.2%) | 25 (45.5%) |
| 75 Years and over | 20 (71.4%) | 42 (58.3%) |
Disability Class: Cognitive Difficulty
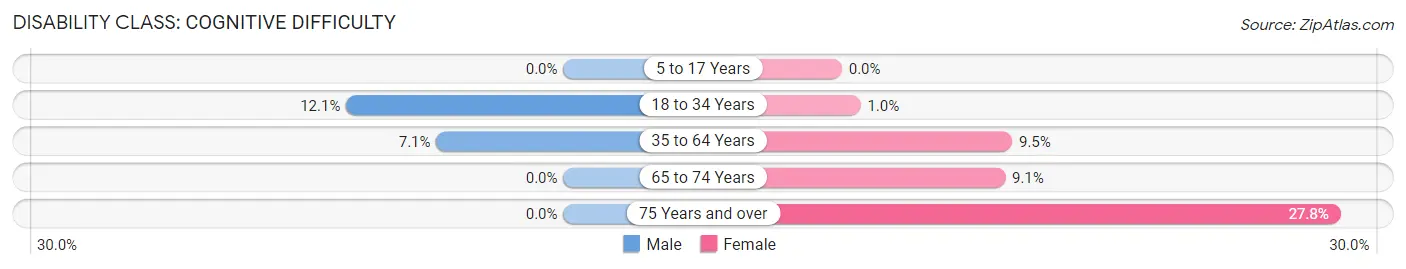
| Age Bracket | Male | Female |
| 5 to 17 Years | 0 (0.0%) | 0 (0.0%) |
| 18 to 34 Years | 26 (12.1%) | 4 (1.0%) |
| 35 to 64 Years | 21 (7.1%) | 44 (9.5%) |
| 65 to 74 Years | 0 (0.0%) | 5 (9.1%) |
| 75 Years and over | 0 (0.0%) | 20 (27.8%) |
Disability Class: Ambulatory Difficulty
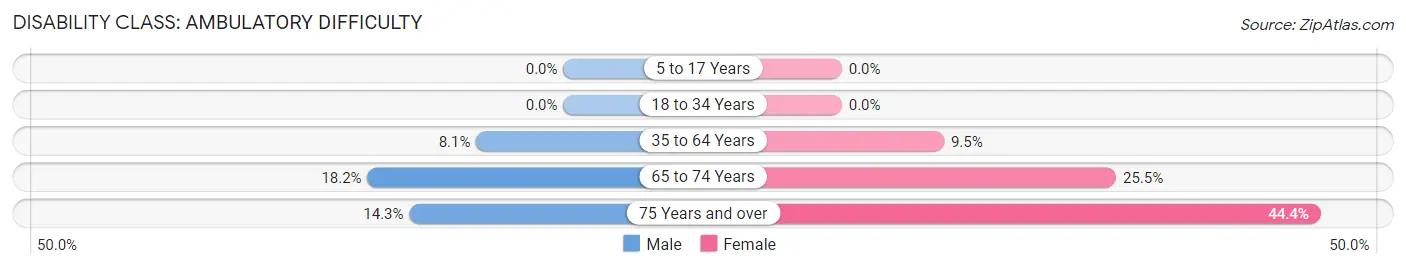
| Age Bracket | Male | Female |
| 5 to 17 Years | 0 (0.0%) | 0 (0.0%) |
| 18 to 34 Years | 0 (0.0%) | 0 (0.0%) |
| 35 to 64 Years | 24 (8.1%) | 44 (9.5%) |
| 65 to 74 Years | 6 (18.2%) | 14 (25.5%) |
| 75 Years and over | 4 (14.3%) | 32 (44.4%) |
Disability Class: Self-Care Difficulty
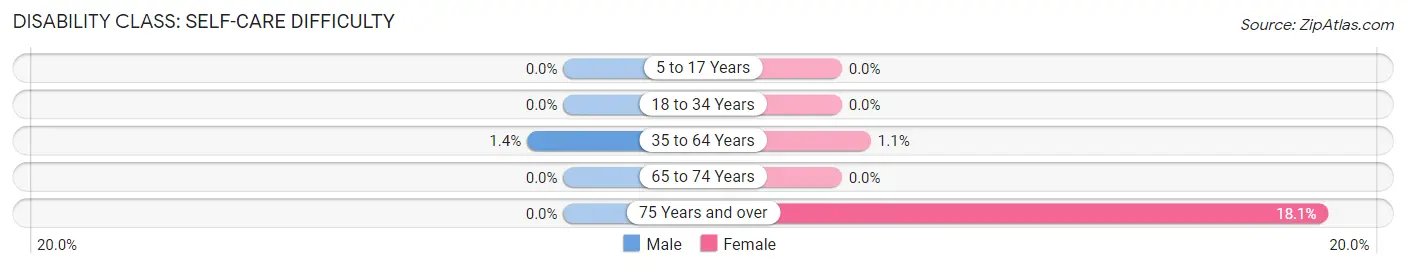
| Age Bracket | Male | Female |
| 5 to 17 Years | 0 (0.0%) | 0 (0.0%) |
| 18 to 34 Years | 0 (0.0%) | 0 (0.0%) |
| 35 to 64 Years | 4 (1.3%) | 5 (1.1%) |
| 65 to 74 Years | 0 (0.0%) | 0 (0.0%) |
| 75 Years and over | 0 (0.0%) | 13 (18.1%) |
Technology Access in Tchula
Computing Device Access in Tchula
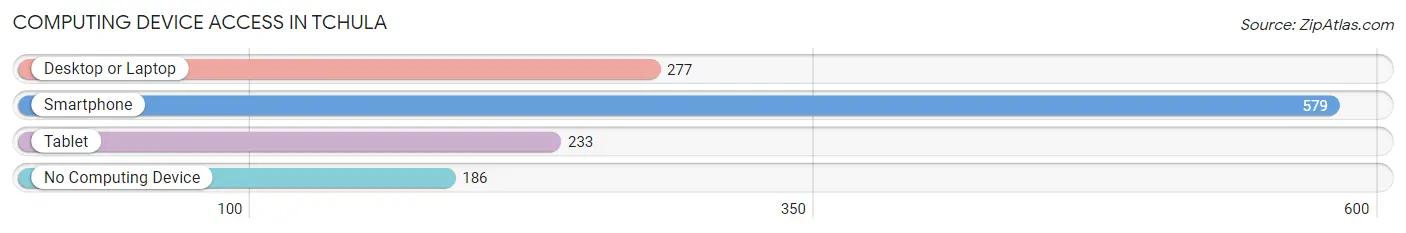
| Device Type | # Households | % Households |
| Desktop or Laptop | 277 | 35.6% |
| Smartphone | 579 | 74.5% |
| Tablet | 233 | 30.0% |
| No Computing Device | 186 | 23.9% |
| Total | 777 | 100.0% |
Internet Access in Tchula
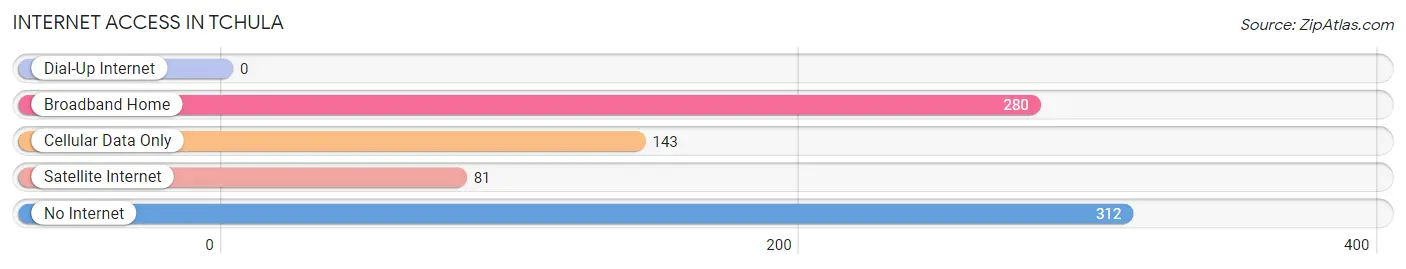
| Internet Type | # Households | % Households |
| Dial-Up Internet | 0 | 0.0% |
| Broadband Home | 280 | 36.0% |
| Cellular Data Only | 143 | 18.4% |
| Satellite Internet | 81 | 10.4% |
| No Internet | 312 | 40.2% |
| Total | 777 | 100.0% |
Tchula Summary
Tchula is a small town located in the heart of the Mississippi Delta, in Holmes County, Mississippi. It is situated on the banks of the Yazoo River, and is home to a population of approximately 2,000 people. The town was founded in 1871, and has a rich history of agriculture, industry, and culture.
Geography
Tchula is located in the heart of the Mississippi Delta, in Holmes County, Mississippi. It is situated on the banks of the Yazoo River, and is surrounded by flat, fertile farmland. The town is located approximately 30 miles south of the state capital, Jackson, and is accessible by US Highway 49.
Economy
Tchula’s economy is largely based on agriculture. The town is home to several large farms, which produce cotton, soybeans, corn, and other crops. The town also has a number of small businesses, including restaurants, convenience stores, and other retail outlets.
Demographics
As of the 2010 census, Tchula had a population of 2,039 people. The racial makeup of the town was 79.3% African American, 19.2% White, 0.3% Native American, 0.2% Asian, and 0.9% from other races. The median household income was $20,917, and the median family income was $25,917.
History
Tchula was founded in 1871 by a group of African American settlers who had been freed from slavery. The town was named after Chief Tchula, a Choctaw leader who had been instrumental in helping the settlers establish the town.
In the early 1900s, Tchula became a center of the cotton industry, and the town’s population grew rapidly. The town was also home to several large plantations, which employed many of the town’s residents.
In the 1950s, the town began to decline as the cotton industry moved away from the area. The town’s population decreased, and many of the town’s businesses closed.
In the late 1970s, the town began to experience a resurgence, as new businesses opened and the population began to grow again. Today, Tchula is a vibrant community, with a strong sense of history and culture. The town is home to several churches, a library, and a museum, as well as a number of small businesses.
Common Questions
What is Per Capita Income in Tchula?
Per Capita income in Tchula is $16,323.
What is the Median Family Income in Tchula?
Median Family Income in Tchula is $43,000.
What is the Median Household income in Tchula?
Median Household Income in Tchula is $35,987.
What is Income or Wage Gap in Tchula?
Income or Wage Gap in Tchula is 17.1%.
Women in Tchula earn 82.9 cents for every dollar earned by a man.
What is Inequality or Gini Index in Tchula?
Inequality or Gini Index in Tchula is 0.48.
What is the Total Population of Tchula?
Total Population of Tchula is 2,274.
What is the Total Male Population of Tchula?
Total Male Population of Tchula is 907.
What is the Total Female Population of Tchula?
Total Female Population of Tchula is 1,367.
What is the Ratio of Males per 100 Females in Tchula?
There are 66.35 Males per 100 Females in Tchula.
What is the Ratio of Females per 100 Males in Tchula?
There are 150.72 Females per 100 Males in Tchula.
What is the Median Population Age in Tchula?
Median Population Age in Tchula is 29.6 Years.
What is the Average Family Size in Tchula
Average Family Size in Tchula is 4.4 People.
What is the Average Household Size in Tchula
Average Household Size in Tchula is 2.9 People.
How Large is the Labor Force in Tchula?
There are 743 People in the Labor Forcein in Tchula.
What is the Percentage of People in the Labor Force in Tchula?
44.6% of People are in the Labor Force in Tchula.
What is the Unemployment Rate in Tchula?
Unemployment Rate in Tchula is 16.2%.