Summit, MS Map & Demographics
Summit Map
Summit Overview
$15,062
PER CAPITA INCOME
$36,696
AVG FAMILY INCOME
$33,340
AVG HOUSEHOLD INCOME
29.2%
WAGE / INCOME GAP [ % ]
70.8¢/ $1
WAGE / INCOME GAP [ $ ]
0.44
INEQUALITY / GINI INDEX
2,774
TOTAL POPULATION
1,258
MALE POPULATION
1,516
FEMALE POPULATION
82.98
MALES / 100 FEMALES
120.51
FEMALES / 100 MALES
27.1
MEDIAN AGE
4.9
AVG FAMILY SIZE
3.6
AVG HOUSEHOLD SIZE
1,081
LABOR FORCE [ PEOPLE ]
58.7%
PERCENT IN LABOR FORCE
9.2%
UNEMPLOYMENT RATE
Summit Zip Codes
Summit Area Codes
Income in Summit
Income Overview in Summit
Per Capita Income in Summit is $15,062, while median incomes of families and households are $36,696 and $33,340 respectively.
| Characteristic | Number | Measure |
| Per Capita Income | 2,774 | $15,062 |
| Median Family Income | 471 | $36,696 |
| Mean Family Income | 471 | $48,216 |
| Median Household Income | 779 | $33,340 |
| Mean Household Income | 779 | $41,738 |
| Income Deficit | 471 | $0 |
| Wage / Income Gap (%) | 2,774 | 29.18% |
| Wage / Income Gap ($) | 2,774 | 70.82¢ per $1 |
| Gini / Inequality Index | 2,774 | 0.44 |
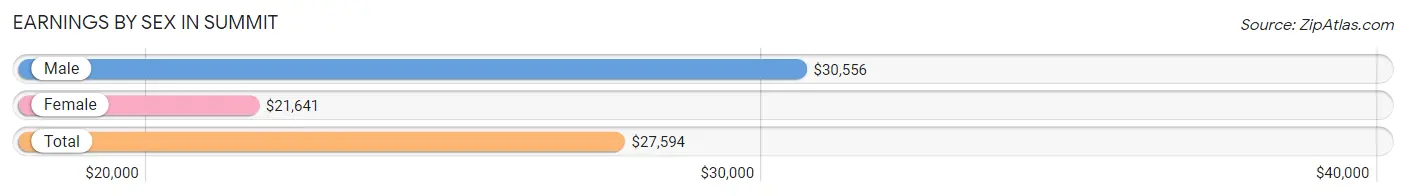
Earnings by Sex in Summit
Average Earnings in Summit are $27,594, $30,556 for men and $21,641 for women, a difference of 29.2%.
| Sex | Number | Average Earnings |
| Male | 404 (37.8%) | $30,556 |
| Female | 665 (62.2%) | $21,641 |
| Total | 1,069 (100.0%) | $27,594 |
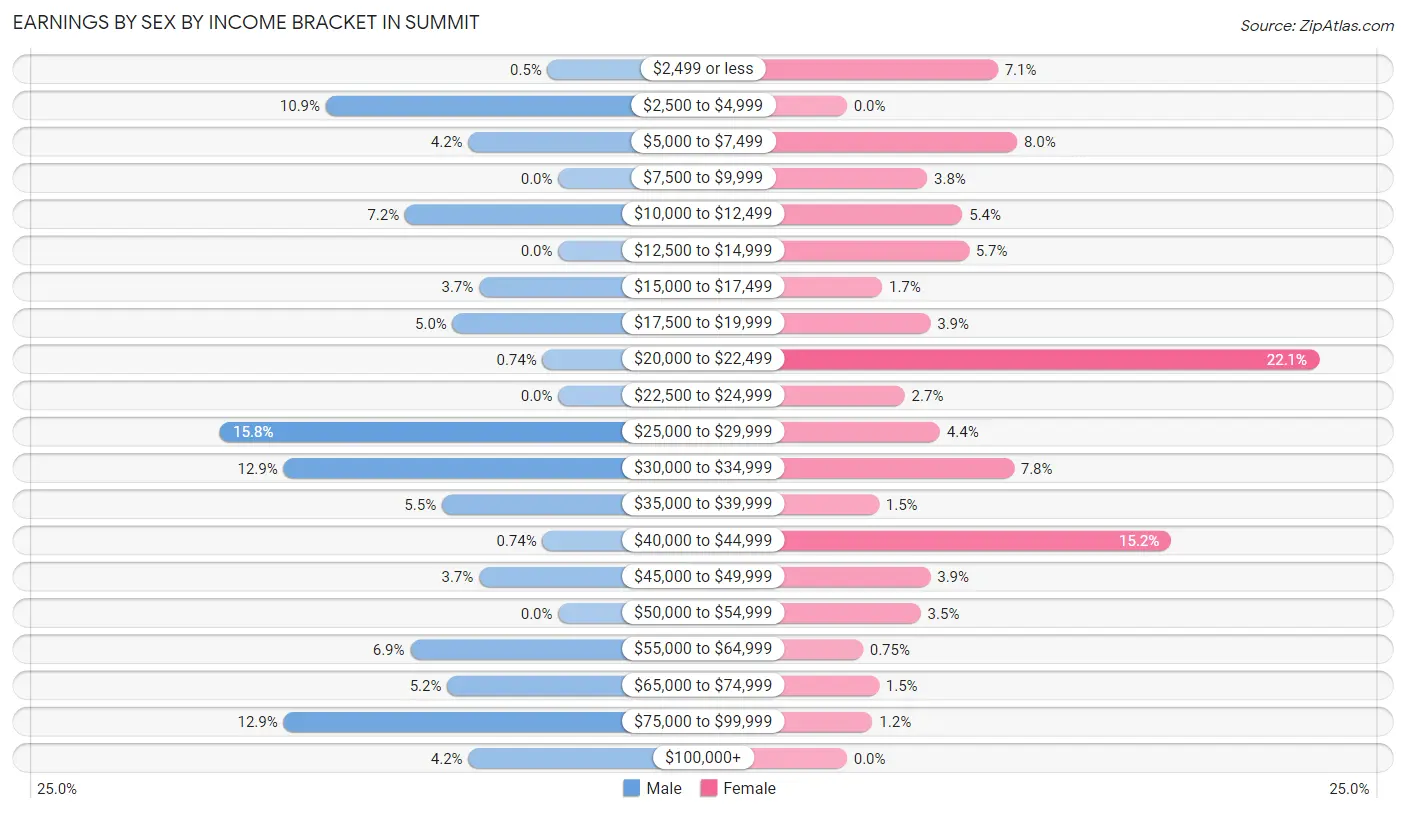
Earnings by Sex by Income Bracket in Summit
The most common earnings brackets in Summit are $25,000 to $29,999 for men (64 | 15.8%) and $20,000 to $22,499 for women (147 | 22.1%).
| Income | Male | Female |
| $2,499 or less | 2 (0.5%) | 47 (7.1%) |
| $2,500 to $4,999 | 44 (10.9%) | 0 (0.0%) |
| $5,000 to $7,499 | 17 (4.2%) | 53 (8.0%) |
| $7,500 to $9,999 | 0 (0.0%) | 25 (3.8%) |
| $10,000 to $12,499 | 29 (7.2%) | 36 (5.4%) |
| $12,500 to $14,999 | 0 (0.0%) | 38 (5.7%) |
| $15,000 to $17,499 | 15 (3.7%) | 11 (1.7%) |
| $17,500 to $19,999 | 20 (5.0%) | 26 (3.9%) |
| $20,000 to $22,499 | 3 (0.7%) | 147 (22.1%) |
| $22,500 to $24,999 | 0 (0.0%) | 18 (2.7%) |
| $25,000 to $29,999 | 64 (15.8%) | 29 (4.4%) |
| $30,000 to $34,999 | 52 (12.9%) | 52 (7.8%) |
| $35,000 to $39,999 | 22 (5.4%) | 10 (1.5%) |
| $40,000 to $44,999 | 3 (0.7%) | 101 (15.2%) |
| $45,000 to $49,999 | 15 (3.7%) | 26 (3.9%) |
| $50,000 to $54,999 | 0 (0.0%) | 23 (3.5%) |
| $55,000 to $64,999 | 28 (6.9%) | 5 (0.7%) |
| $65,000 to $74,999 | 21 (5.2%) | 10 (1.5%) |
| $75,000 to $99,999 | 52 (12.9%) | 8 (1.2%) |
| $100,000+ | 17 (4.2%) | 0 (0.0%) |
| Total | 404 (100.0%) | 665 (100.0%) |
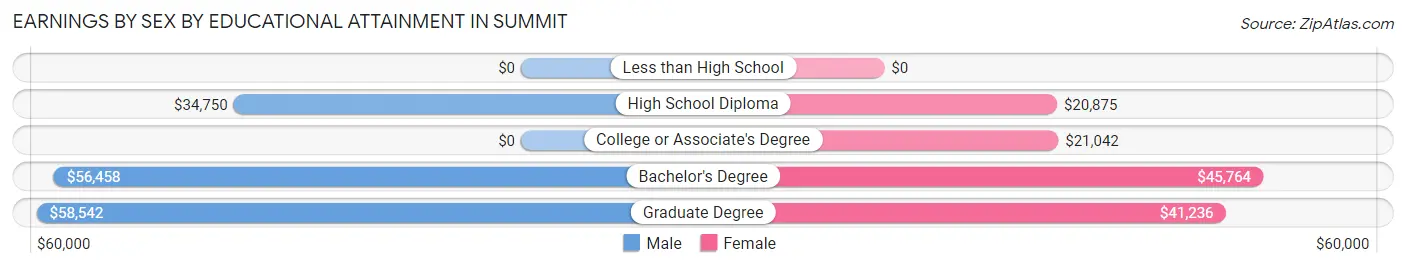
Earnings by Sex by Educational Attainment in Summit
Average earnings in Summit are $35,341 for men and $28,750 for women, a difference of 18.6%. Men with an educational attainment of graduate degree enjoy the highest average annual earnings of $58,542, while those with high school diploma education earn the least with $34,750. Women with an educational attainment of bachelor's degree earn the most with the average annual earnings of $45,764, while those with high school diploma education have the smallest earnings of $20,875.
| Educational Attainment | Male Income | Female Income |
| Less than High School | - | - |
| High School Diploma | $34,750 | $20,875 |
| College or Associate's Degree | - | - |
| Bachelor's Degree | $56,458 | $45,764 |
| Graduate Degree | $58,542 | $41,236 |
| Total | $35,341 | $28,750 |
Family Income in Summit
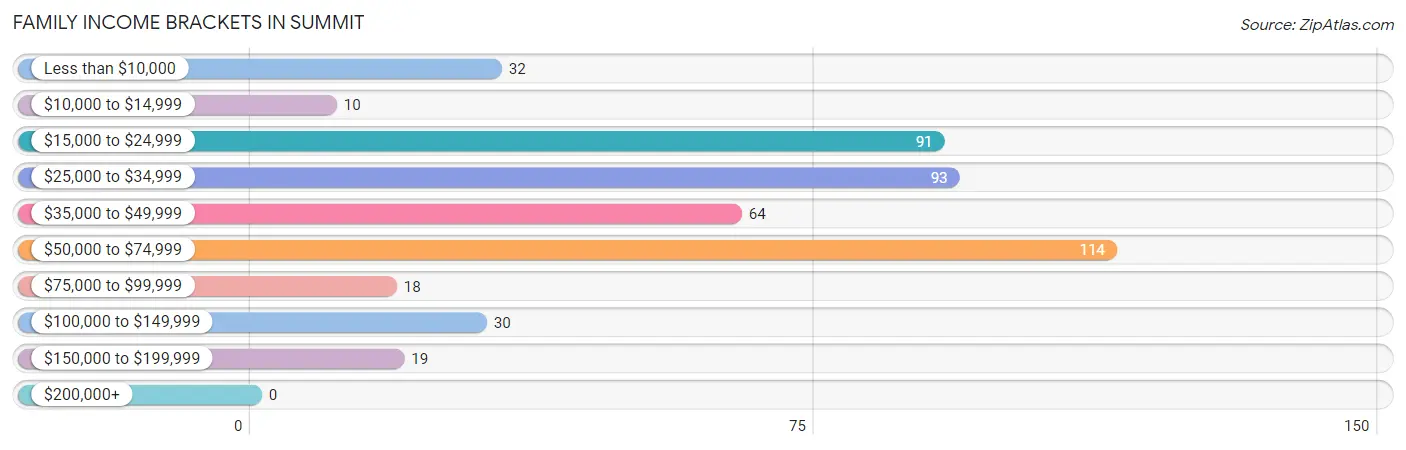
Family Income Brackets in Summit
According to the Summit family income data, there are 114 families falling into the $50,000 to $74,999 income range, which is the most common income bracket and makes up 24.2% of all families.
| Income Bracket | # Families | % Families |
| Less than $10,000 | 32 | 6.8% |
| $10,000 to $14,999 | 10 | 2.1% |
| $15,000 to $24,999 | 91 | 19.3% |
| $25,000 to $34,999 | 93 | 19.7% |
| $35,000 to $49,999 | 64 | 13.6% |
| $50,000 to $74,999 | 114 | 24.2% |
| $75,000 to $99,999 | 18 | 3.8% |
| $100,000 to $149,999 | 30 | 6.4% |
| $150,000 to $199,999 | 19 | 4.0% |
| $200,000+ | 0 | 0.0% |
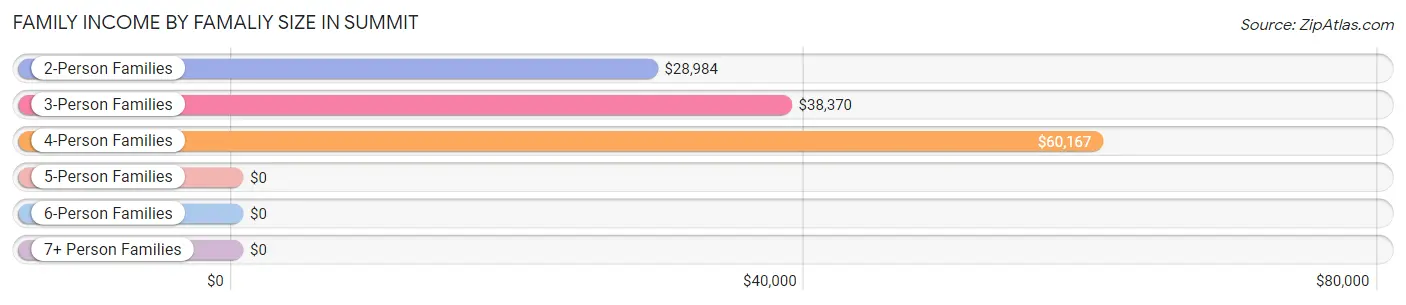
Family Income by Famaliy Size in Summit
4-person families (82 | 17.4%) account for the highest median family income in Summit with $60,167 per family, while 4-person families (82 | 17.4%) have the highest median income of $15,042 per family member.
| Income Bracket | # Families | Median Income |
| 2-Person Families | 203 (43.1%) | $28,984 |
| 3-Person Families | 104 (22.1%) | $38,370 |
| 4-Person Families | 82 (17.4%) | $60,167 |
| 5-Person Families | 7 (1.5%) | $0 |
| 6-Person Families | 12 (2.5%) | $0 |
| 7+ Person Families | 63 (13.4%) | $0 |
| Total | 471 (100.0%) | $36,696 |
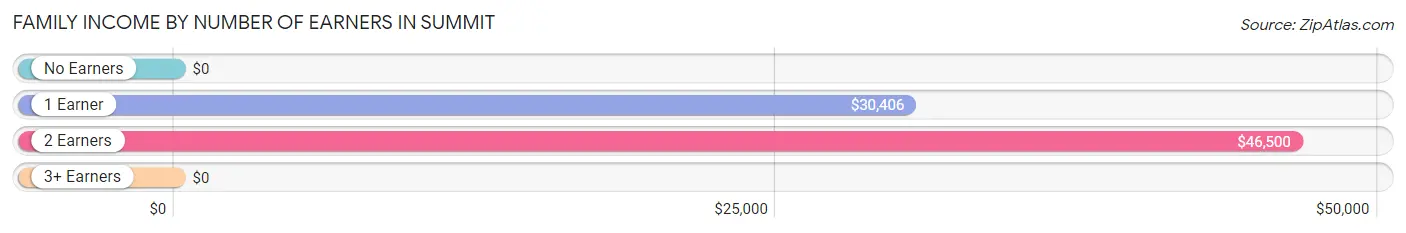
Family Income by Number of Earners in Summit
| Number of Earners | # Families | Median Income |
| No Earners | 57 (12.1%) | $0 |
| 1 Earner | 267 (56.7%) | $30,406 |
| 2 Earners | 118 (25.1%) | $46,500 |
| 3+ Earners | 29 (6.2%) | $0 |
| Total | 471 (100.0%) | $36,696 |
Household Income in Summit
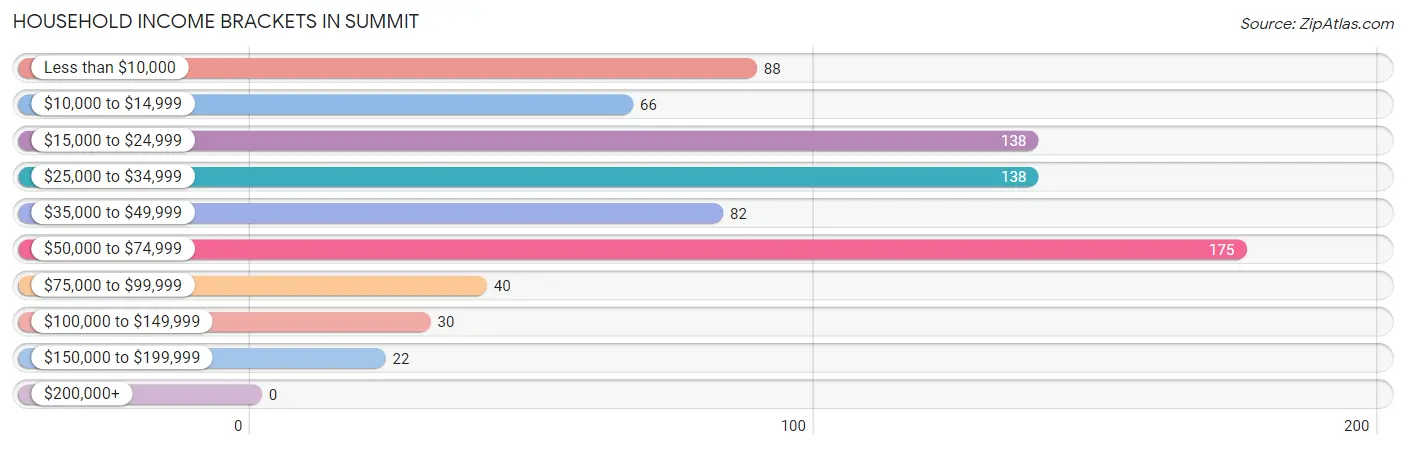
Household Income Brackets in Summit
With 175 households falling in the category, the $50,000 to $74,999 income range is the most frequent in Summit, accounting for 22.5% of all households.
| Income Bracket | # Households | % Households |
| Less than $10,000 | 88 | 11.3% |
| $10,000 to $14,999 | 66 | 8.5% |
| $15,000 to $24,999 | 138 | 17.7% |
| $25,000 to $34,999 | 138 | 17.7% |
| $35,000 to $49,999 | 82 | 10.5% |
| $50,000 to $74,999 | 175 | 22.5% |
| $75,000 to $99,999 | 40 | 5.1% |
| $100,000 to $149,999 | 30 | 3.9% |
| $150,000 to $199,999 | 22 | 2.8% |
| $200,000+ | 0 | 0.0% |
Household Income by Householder Age in Summit
The median household income in Summit is $33,340, with the highest median household income of $56,016 found in the 45 to 64 years age bracket for the primary householder. A total of 305 households (39.2%) fall into this category. Meanwhile, the 15 to 24 years age bracket for the primary householder has the lowest median household income of $0, with 31 households (4.0%) in this group.
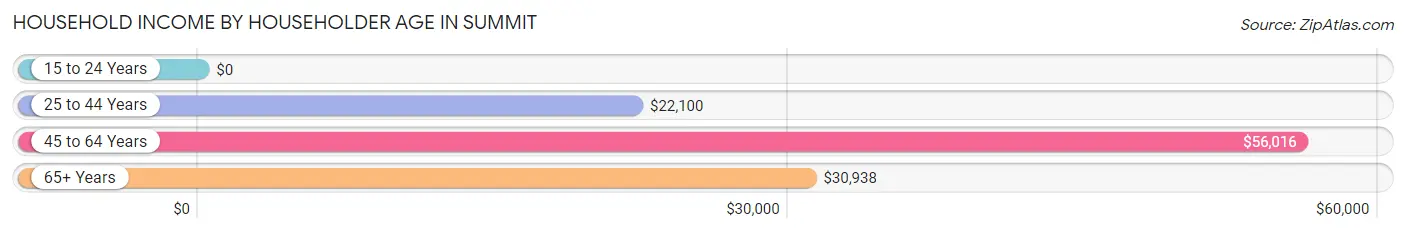
| Income Bracket | # Households | Median Income |
| 15 to 24 Years | 31 (4.0%) | $0 |
| 25 to 44 Years | 234 (30.0%) | $22,100 |
| 45 to 64 Years | 305 (39.2%) | $56,016 |
| 65+ Years | 209 (26.8%) | $30,938 |
| Total | 779 (100.0%) | $33,340 |
Poverty in Summit
Income Below Poverty by Sex and Age in Summit
With 42.8% poverty level for males and 31.6% for females among the residents of Summit, 5 year old males and 5 year old females are the most vulnerable to poverty, with 22 males (100.0%) and 61 females (100.0%) in their respective age groups living below the poverty level.
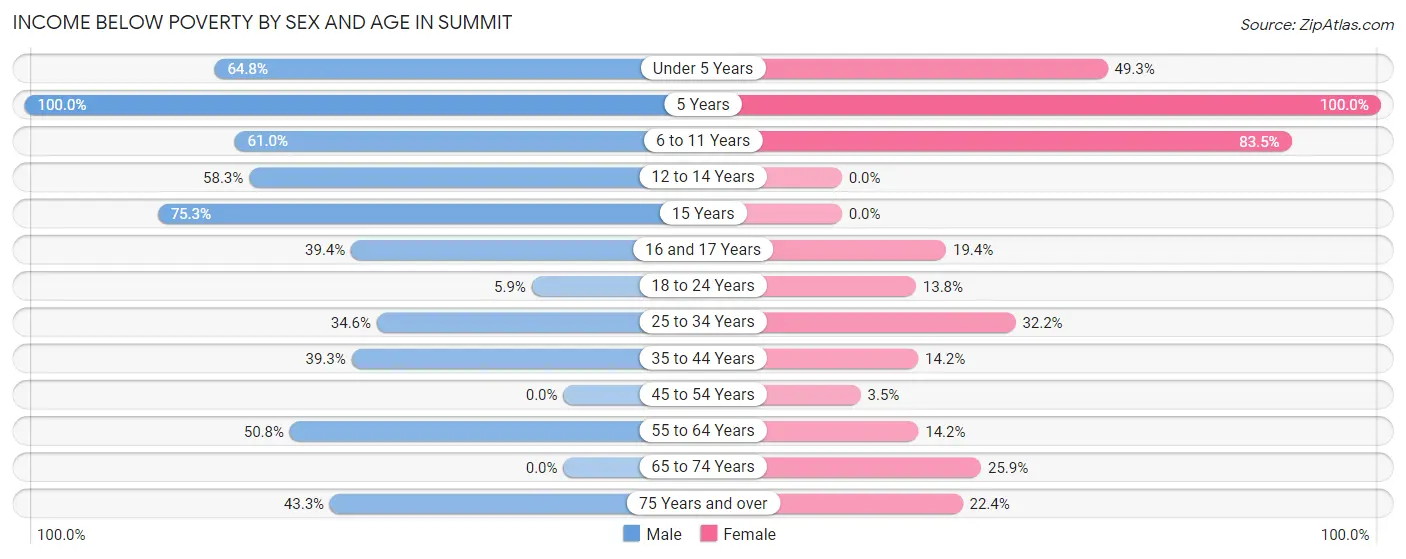
| Age Bracket | Male | Female |
| Under 5 Years | 90 (64.7%) | 74 (49.3%) |
| 5 Years | 22 (100.0%) | 61 (100.0%) |
| 6 to 11 Years | 122 (61.0%) | 116 (83.5%) |
| 12 to 14 Years | 35 (58.3%) | 0 (0.0%) |
| 15 Years | 67 (75.3%) | 0 (0.0%) |
| 16 and 17 Years | 26 (39.4%) | 6 (19.4%) |
| 18 to 24 Years | 4 (5.9%) | 33 (13.8%) |
| 25 to 34 Years | 36 (34.6%) | 78 (32.2%) |
| 35 to 44 Years | 57 (39.3%) | 17 (14.2%) |
| 45 to 54 Years | 0 (0.0%) | 3 (3.5%) |
| 55 to 64 Years | 66 (50.8%) | 24 (14.2%) |
| 65 to 74 Years | 0 (0.0%) | 38 (25.9%) |
| 75 Years and over | 13 (43.3%) | 13 (22.4%) |
| Total | 538 (42.8%) | 463 (31.6%) |
Income Above Poverty by Sex and Age in Summit
According to the poverty statistics in Summit, males aged 45 to 54 years and females aged 12 to 14 years are the age groups that are most secure financially, with 100.0% of males and 100.0% of females in these age groups living above the poverty line.
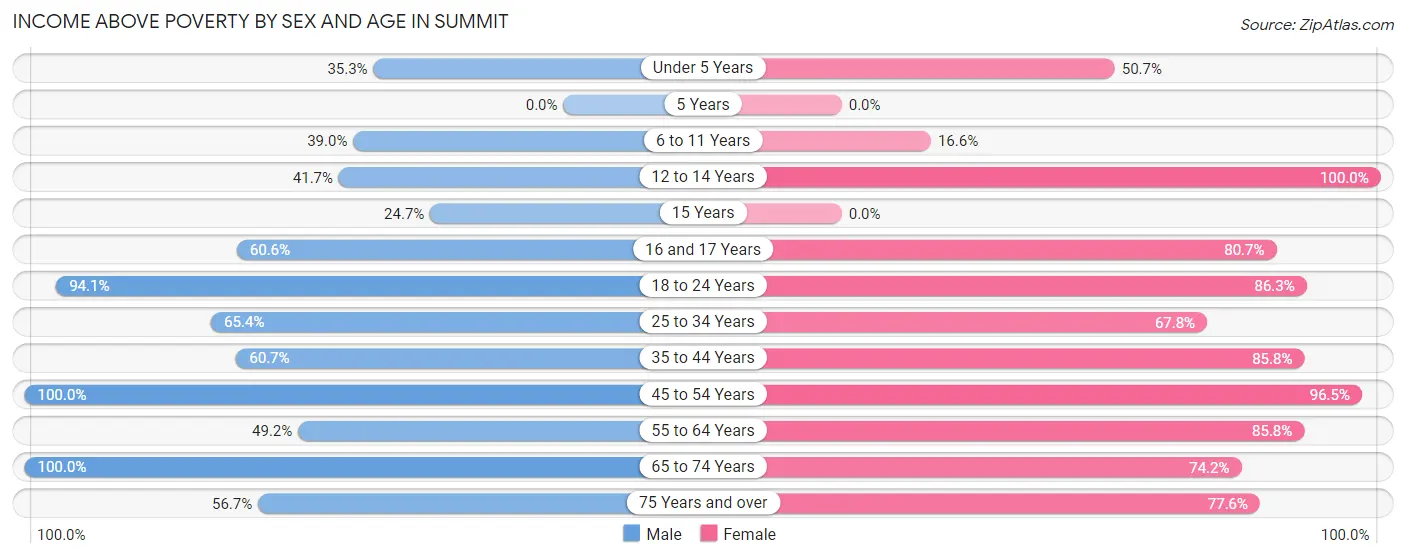
| Age Bracket | Male | Female |
| Under 5 Years | 49 (35.2%) | 76 (50.7%) |
| 5 Years | 0 (0.0%) | 0 (0.0%) |
| 6 to 11 Years | 78 (39.0%) | 23 (16.6%) |
| 12 to 14 Years | 25 (41.7%) | 24 (100.0%) |
| 15 Years | 22 (24.7%) | 0 (0.0%) |
| 16 and 17 Years | 40 (60.6%) | 25 (80.6%) |
| 18 to 24 Years | 64 (94.1%) | 207 (86.3%) |
| 25 to 34 Years | 68 (65.4%) | 164 (67.8%) |
| 35 to 44 Years | 88 (60.7%) | 103 (85.8%) |
| 45 to 54 Years | 139 (100.0%) | 83 (96.5%) |
| 55 to 64 Years | 64 (49.2%) | 145 (85.8%) |
| 65 to 74 Years | 66 (100.0%) | 109 (74.2%) |
| 75 Years and over | 17 (56.7%) | 45 (77.6%) |
| Total | 720 (57.2%) | 1,004 (68.4%) |
Income Below Poverty Among Married-Couple Families in Summit
The poverty statistics for married-couple families in Summit show that 11.3% or 18 of the total 160 families live below the poverty line. Families with no children have the highest poverty rate of 13.9%, comprising of 18 families. On the other hand, families with 1 or 2 children have the lowest poverty rate of 0.0%, which includes 0 families.
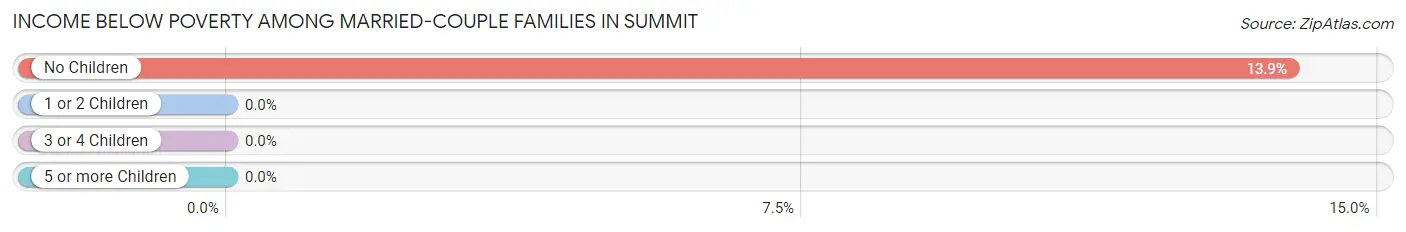
| Children | Above Poverty | Below Poverty |
| No Children | 112 (86.2%) | 18 (13.9%) |
| 1 or 2 Children | 30 (100.0%) | 0 (0.0%) |
| 3 or 4 Children | 0 (0.0%) | 0 (0.0%) |
| 5 or more Children | 0 (0.0%) | 0 (0.0%) |
| Total | 142 (88.7%) | 18 (11.3%) |
Income Below Poverty Among Single-Parent Households in Summit
According to the poverty data in Summit, 67.2% or 39 single-father households and 30.0% or 76 single-mother households are living below the poverty line. Among single-father households, those with 5 or more children have the highest poverty rate, with 36 households (100.0%) experiencing poverty. Likewise, among single-mother households, those with 3 or 4 children have the highest poverty rate, with 10 households (100.0%) falling below the poverty line.
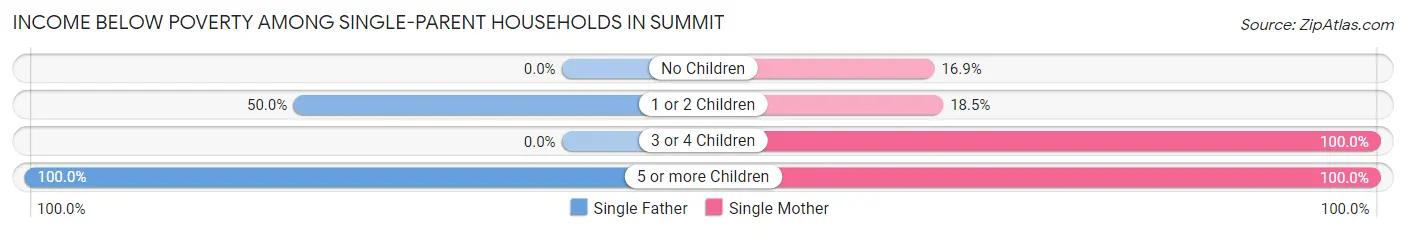
| Children | Single Father | Single Mother |
| No Children | 0 (0.0%) | 11 (16.9%) |
| 1 or 2 Children | 3 (50.0%) | 28 (18.5%) |
| 3 or 4 Children | 0 (0.0%) | 10 (100.0%) |
| 5 or more Children | 36 (100.0%) | 27 (100.0%) |
| Total | 39 (67.2%) | 76 (30.0%) |
Income Below Poverty Among Married-Couple vs Single-Parent Households in Summit
The poverty data for Summit shows that 18 of the married-couple family households (11.3%) and 115 of the single-parent households (37.0%) are living below the poverty level. Within the married-couple family households, those with no children have the highest poverty rate, with 18 households (13.9%) falling below the poverty line. Among the single-parent households, those with 3 or 4 children have the highest poverty rate, with 10 household (100.0%) living below poverty.
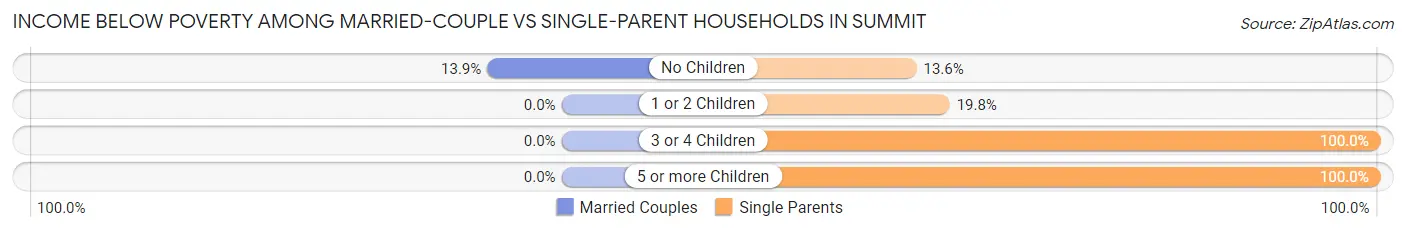
| Children | Married-Couple Families | Single-Parent Households |
| No Children | 18 (13.9%) | 11 (13.6%) |
| 1 or 2 Children | 0 (0.0%) | 31 (19.8%) |
| 3 or 4 Children | 0 (0.0%) | 10 (100.0%) |
| 5 or more Children | 0 (0.0%) | 63 (100.0%) |
| Total | 18 (11.3%) | 115 (37.0%) |
Race in Summit
The most populous races in Summit are Black / African American (2,505 | 90.3%), White / Caucasian (252 | 9.1%), and Two or more Races (17 | 0.6%).
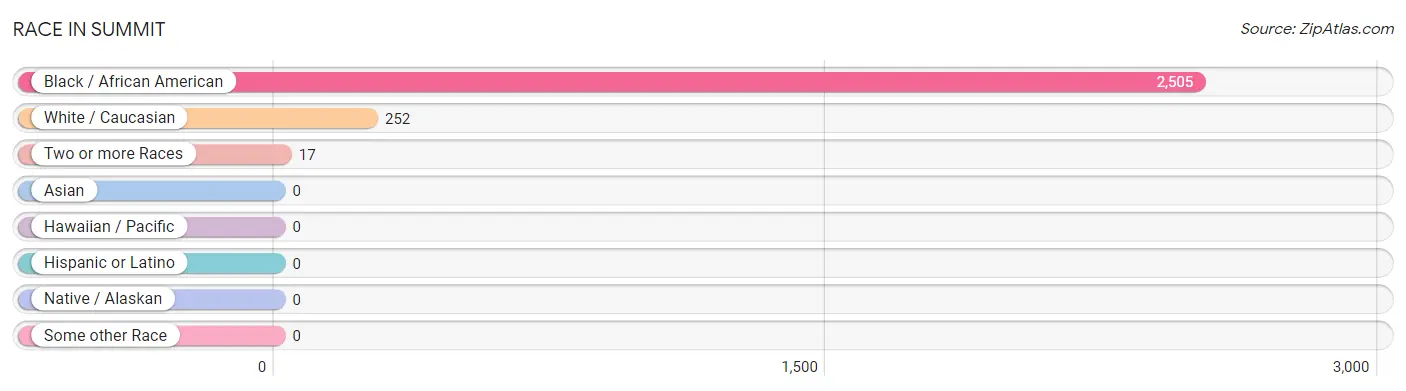
| Race | # Population | % Population |
| Asian | 0 | 0.0% |
| Black / African American | 2,505 | 90.3% |
| Hawaiian / Pacific | 0 | 0.0% |
| Hispanic or Latino | 0 | 0.0% |
| Native / Alaskan | 0 | 0.0% |
| White / Caucasian | 252 | 9.1% |
| Two or more Races | 17 | 0.6% |
| Some other Race | 0 | 0.0% |
| Total | 2,774 | 100.0% |
Ancestry in Summit
The most populous ancestries reported in Summit are American (126 | 4.5%), English (75 | 2.7%), German (46 | 1.7%), Irish (45 | 1.6%), and Arab (21 | 0.8%), together accounting for 11.3% of all Summit residents.
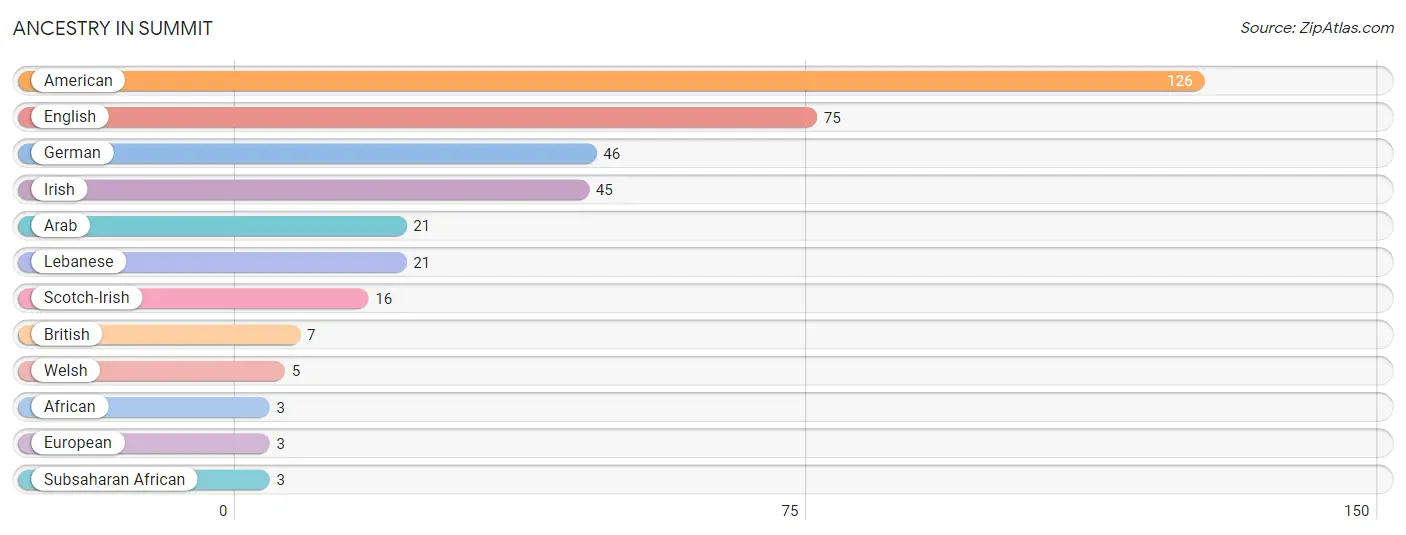
| Ancestry | # Population | % Population |
| African | 3 | 0.1% |
| American | 126 | 4.5% |
| Arab | 21 | 0.8% |
| British | 7 | 0.3% |
| English | 75 | 2.7% |
| European | 3 | 0.1% |
| German | 46 | 1.7% |
| Irish | 45 | 1.6% |
| Lebanese | 21 | 0.8% |
| Scotch-Irish | 16 | 0.6% |
| Subsaharan African | 3 | 0.1% |
| Welsh | 5 | 0.2% | View All 12 Rows |
Immigrants in Summit

| Immigration Origin | # Population | % Population | View All 0 Rows |
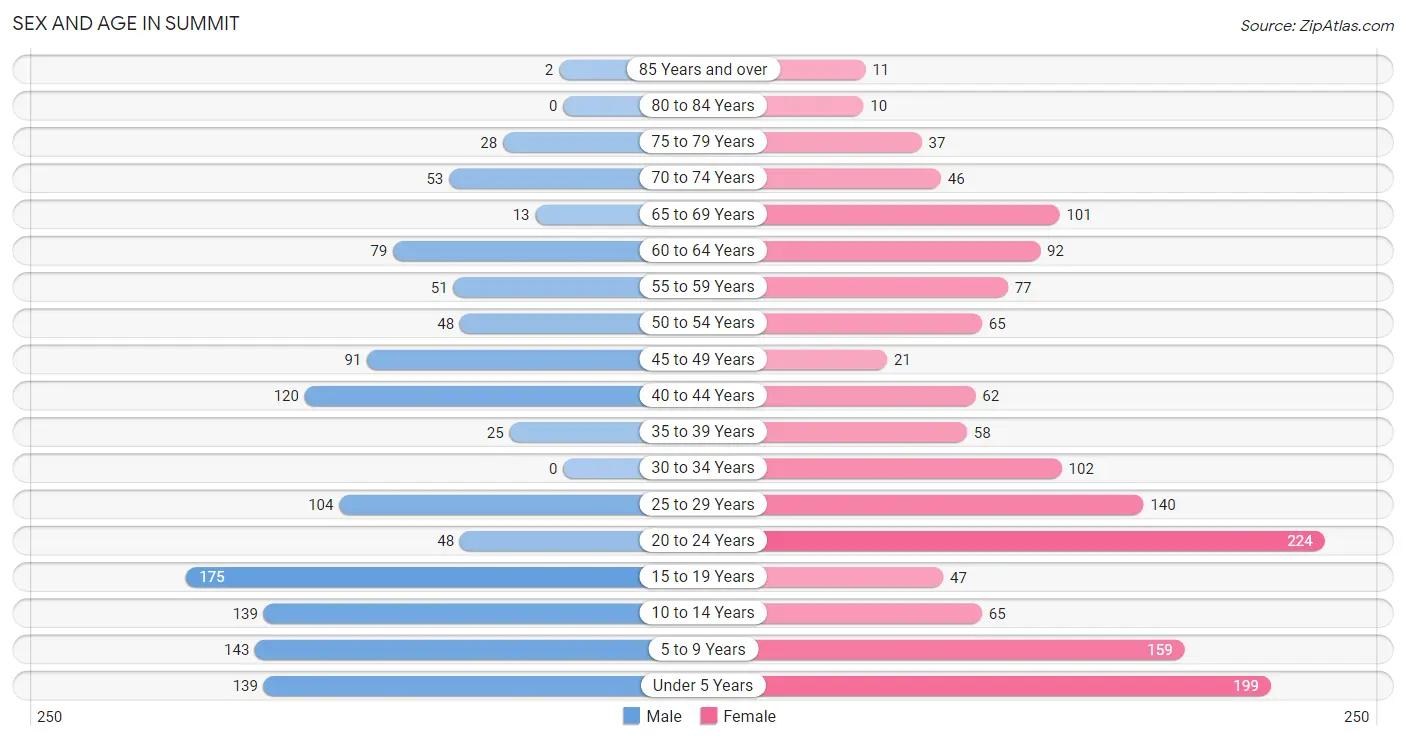
Sex and Age in Summit
Sex and Age in Summit
The most populous age groups in Summit are 15 to 19 Years (175 | 13.9%) for men and 20 to 24 Years (224 | 14.8%) for women.
| Age Bracket | Male | Female |
| Under 5 Years | 139 (11.1%) | 199 (13.1%) |
| 5 to 9 Years | 143 (11.4%) | 159 (10.5%) |
| 10 to 14 Years | 139 (11.1%) | 65 (4.3%) |
| 15 to 19 Years | 175 (13.9%) | 47 (3.1%) |
| 20 to 24 Years | 48 (3.8%) | 224 (14.8%) |
| 25 to 29 Years | 104 (8.3%) | 140 (9.2%) |
| 30 to 34 Years | 0 (0.0%) | 102 (6.7%) |
| 35 to 39 Years | 25 (2.0%) | 58 (3.8%) |
| 40 to 44 Years | 120 (9.5%) | 62 (4.1%) |
| 45 to 49 Years | 91 (7.2%) | 21 (1.4%) |
| 50 to 54 Years | 48 (3.8%) | 65 (4.3%) |
| 55 to 59 Years | 51 (4.1%) | 77 (5.1%) |
| 60 to 64 Years | 79 (6.3%) | 92 (6.1%) |
| 65 to 69 Years | 13 (1.0%) | 101 (6.7%) |
| 70 to 74 Years | 53 (4.2%) | 46 (3.0%) |
| 75 to 79 Years | 28 (2.2%) | 37 (2.4%) |
| 80 to 84 Years | 0 (0.0%) | 10 (0.7%) |
| 85 Years and over | 2 (0.2%) | 11 (0.7%) |
| Total | 1,258 (100.0%) | 1,516 (100.0%) |
Families and Households in Summit
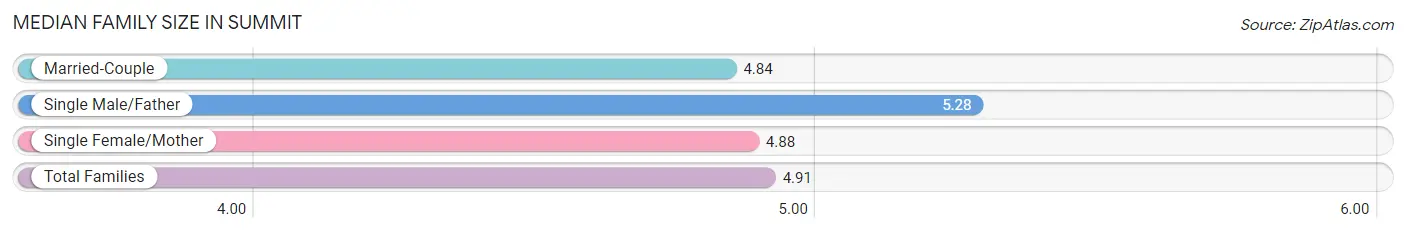
Median Family Size in Summit
The median family size in Summit is 4.91 persons per family, with single male/father families (58 | 12.3%) accounting for the largest median family size of 5.28 persons per family. On the other hand, married-couple families (160 | 34.0%) represent the smallest median family size with 4.84 persons per family.
| Family Type | # Families | Family Size |
| Married-Couple | 160 (34.0%) | 4.84 |
| Single Male/Father | 58 (12.3%) | 5.28 |
| Single Female/Mother | 253 (53.7%) | 4.88 |
| Total Families | 471 (100.0%) | 4.91 |
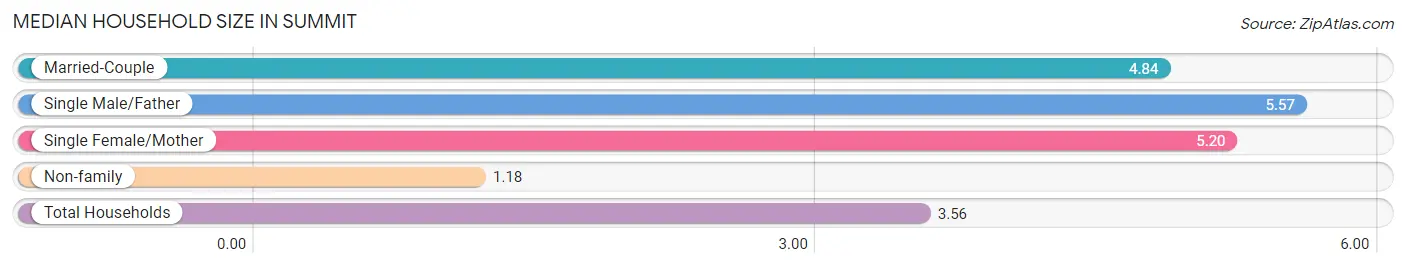
Median Household Size in Summit
The median household size in Summit is 3.56 persons per household, with single male/father households (58 | 7.4%) accounting for the largest median household size of 5.57 persons per household. non-family households (308 | 39.5%) represent the smallest median household size with 1.18 persons per household.
| Household Type | # Households | Household Size |
| Married-Couple | 160 (20.5%) | 4.84 |
| Single Male/Father | 58 (7.4%) | 5.57 |
| Single Female/Mother | 253 (32.5%) | 5.20 |
| Non-family | 308 (39.5%) | 1.18 |
| Total Households | 779 (100.0%) | 3.56 |
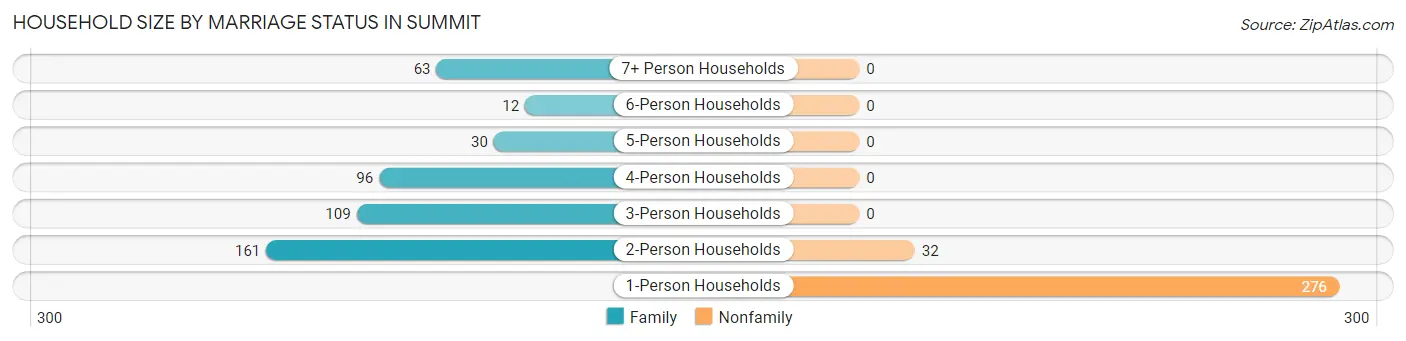
Household Size by Marriage Status in Summit
Out of a total of 779 households in Summit, 471 (60.5%) are family households, while 308 (39.5%) are nonfamily households. The most numerous type of family households are 2-person households, comprising 161, and the most common type of nonfamily households are 1-person households, comprising 276.
| Household Size | Family Households | Nonfamily Households |
| 1-Person Households | - | 276 (35.4%) |
| 2-Person Households | 161 (20.7%) | 32 (4.1%) |
| 3-Person Households | 109 (14.0%) | 0 (0.0%) |
| 4-Person Households | 96 (12.3%) | 0 (0.0%) |
| 5-Person Households | 30 (3.8%) | 0 (0.0%) |
| 6-Person Households | 12 (1.5%) | 0 (0.0%) |
| 7+ Person Households | 63 (8.1%) | 0 (0.0%) |
| Total | 471 (60.5%) | 308 (39.5%) |
Female Fertility in Summit
Fertility by Age in Summit
Average fertility rate in Summit is 226.0 births per 1,000 women. Women in the age bracket of 20 to 34 years have the highest fertility rate with 326.0 births per 1,000 women. Women in the age bracket of 20 to 34 years acount for 100.0% of all women with births.
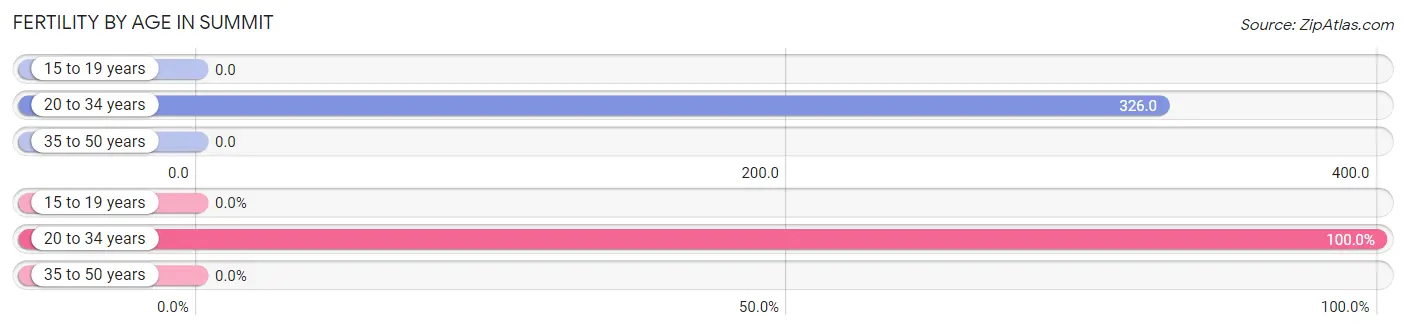
| Age Bracket | Women with Births | Births / 1,000 Women |
| 15 to 19 years | 0 (0.0%) | 0.0 |
| 20 to 34 years | 152 (100.0%) | 326.0 |
| 35 to 50 years | 0 (0.0%) | 0.0 |
| Total | 152 (100.0%) | 226.0 |
Fertility by Age by Marriage Status in Summit
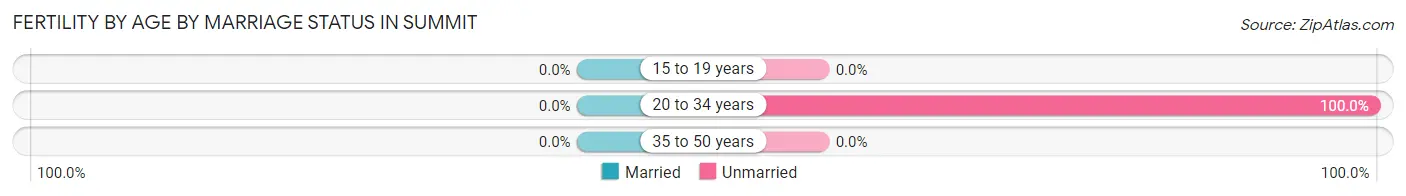
| Age Bracket | Married | Unmarried |
| 15 to 19 years | 0 (0.0%) | 0 (0.0%) |
| 20 to 34 years | 0 (0.0%) | 152 (100.0%) |
| 35 to 50 years | 0 (0.0%) | 0 (0.0%) |
| Total | 0 (0.0%) | 152 (100.0%) |
Fertility by Education in Summit
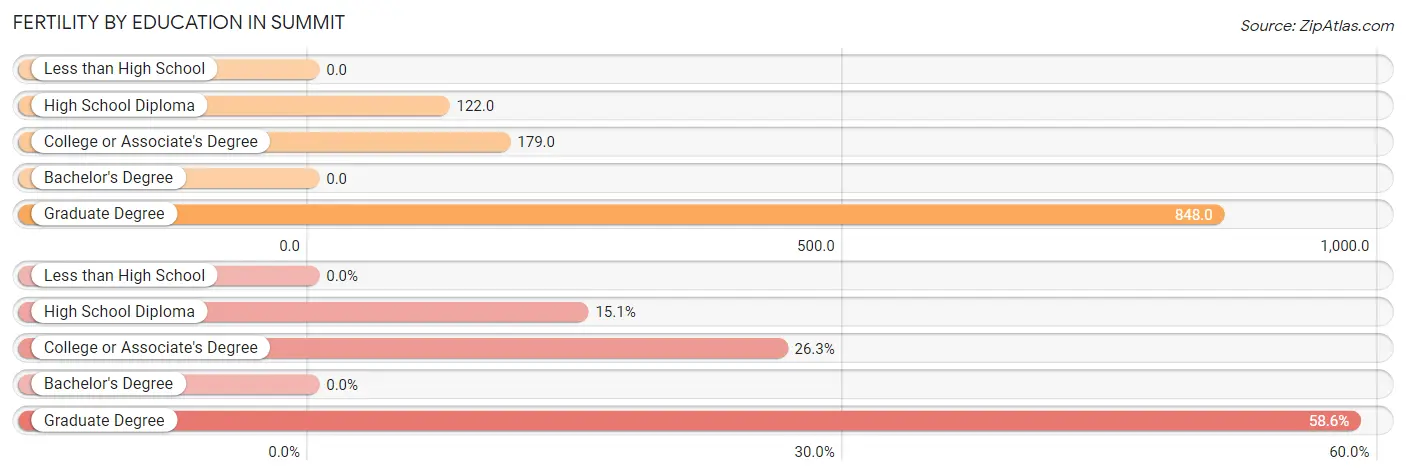
| Educational Attainment | Women with Births | Births / 1,000 Women |
| Less than High School | 0 (0.0%) | 0.0 |
| High School Diploma | 23 (15.1%) | 122.0 |
| College or Associate's Degree | 40 (26.3%) | 179.0 |
| Bachelor's Degree | 0 (0.0%) | 0.0 |
| Graduate Degree | 89 (58.6%) | 848.0 |
| Total | 152 (100.0%) | 226.0 |
Fertility by Education by Marriage Status in Summit
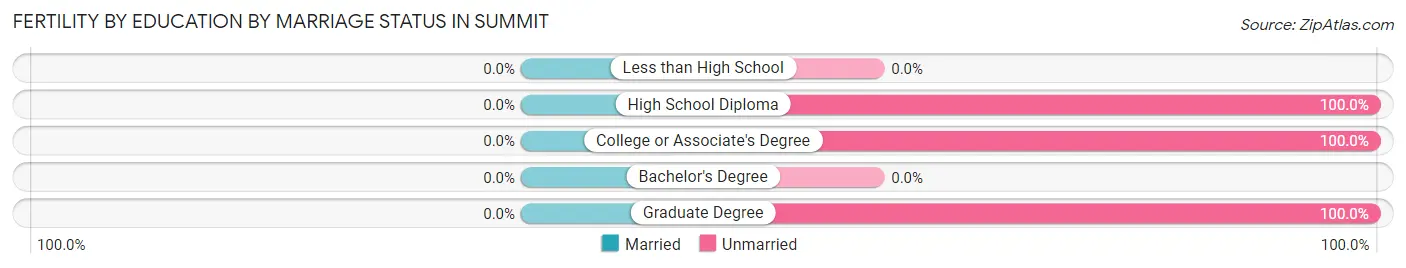
| Educational Attainment | Married | Unmarried |
| Less than High School | 0 (0.0%) | 0 (0.0%) |
| High School Diploma | 0 (0.0%) | 23 (100.0%) |
| College or Associate's Degree | 0 (0.0%) | 40 (100.0%) |
| Bachelor's Degree | 0 (0.0%) | 0 (0.0%) |
| Graduate Degree | 0 (0.0%) | 89 (100.0%) |
| Total | 0 (0.0%) | 152 (100.0%) |
Employment Characteristics in Summit
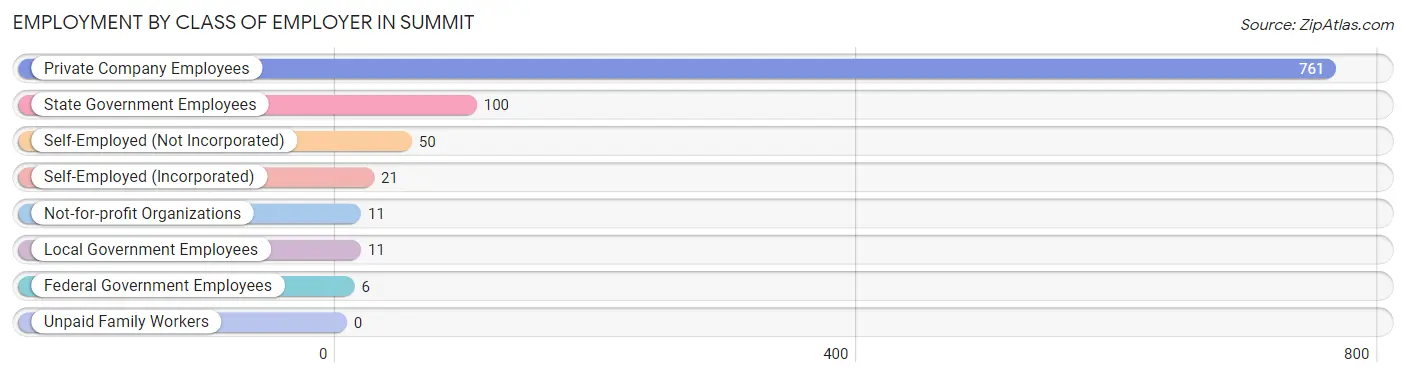
Employment by Class of Employer in Summit
Among the 960 employed individuals in Summit, private company employees (761 | 79.3%), state government employees (100 | 10.4%), and self-employed (not incorporated) (50 | 5.2%) make up the most common classes of employment.
| Employer Class | # Employees | % Employees |
| Private Company Employees | 761 | 79.3% |
| Self-Employed (Incorporated) | 21 | 2.2% |
| Self-Employed (Not Incorporated) | 50 | 5.2% |
| Not-for-profit Organizations | 11 | 1.1% |
| Local Government Employees | 11 | 1.1% |
| State Government Employees | 100 | 10.4% |
| Federal Government Employees | 6 | 0.6% |
| Unpaid Family Workers | 0 | 0.0% |
| Total | 960 | 100.0% |
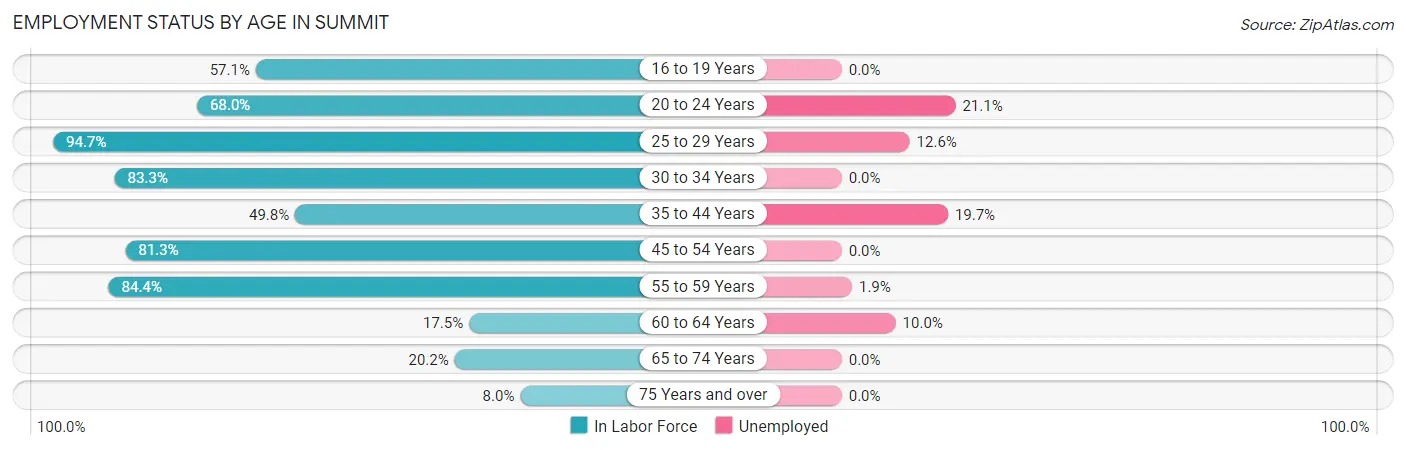
Employment Status by Age in Summit
According to the labor force statistics for Summit, out of the total population over 16 years of age (1,841), 58.7% or 1,081 individuals are in the labor force, with 9.2% or 99 of them unemployed. The age group with the highest labor force participation rate is 25 to 29 years, with 94.7% or 231 individuals in the labor force. Within the labor force, the 20 to 24 years age range has the highest percentage of unemployed individuals, with 21.1% or 39 of them being unemployed.
| Age Bracket | In Labor Force | Unemployed |
| 16 to 19 Years | 76 (57.1%) | 0 (0.0%) |
| 20 to 24 Years | 185 (68.0%) | 39 (21.1%) |
| 25 to 29 Years | 231 (94.7%) | 29 (12.6%) |
| 30 to 34 Years | 85 (83.3%) | 0 (0.0%) |
| 35 to 44 Years | 132 (49.8%) | 26 (19.7%) |
| 45 to 54 Years | 183 (81.3%) | 0 (0.0%) |
| 55 to 59 Years | 108 (84.4%) | 2 (1.9%) |
| 60 to 64 Years | 30 (17.5%) | 3 (10.0%) |
| 65 to 74 Years | 43 (20.2%) | 0 (0.0%) |
| 75 Years and over | 7 (8.0%) | 0 (0.0%) |
| Total | 1,081 (58.7%) | 99 (9.2%) |
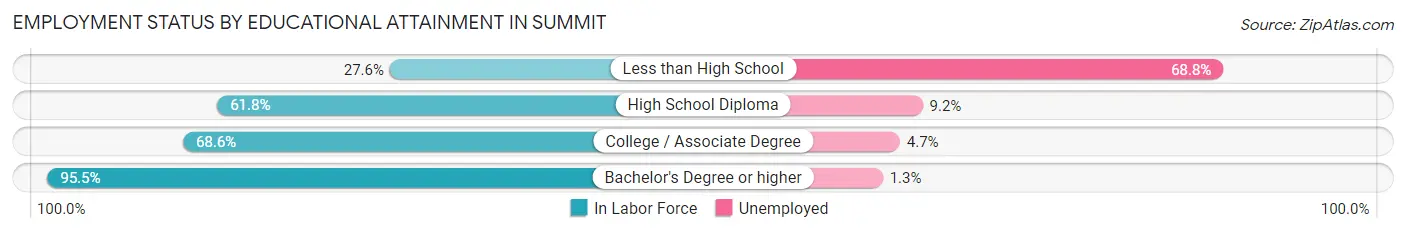
Employment Status by Educational Attainment in Summit
According to labor force statistics for Summit, 67.8% of individuals (770) out of the total population between 25 and 64 years of age (1,135) are in the labor force, with 7.8% or 60 of them being unemployed. The group with the highest labor force participation rate are those with the educational attainment of bachelor's degree or higher, with 95.5% or 232 individuals in the labor force. Within the labor force, individuals with less than high school education have the highest percentage of unemployment, with 68.8% or 22 of them being unemployed.
| Educational Attainment | In Labor Force | Unemployed |
| Less than High School | 32 (27.6%) | 80 (68.8%) |
| High School Diploma | 251 (61.8%) | 37 (9.2%) |
| College / Associate Degree | 254 (68.6%) | 17 (4.7%) |
| Bachelor's Degree or higher | 232 (95.5%) | 3 (1.3%) |
| Total | 770 (67.8%) | 89 (7.8%) |
Employment Occupations by Sex in Summit
Management, Business, Science and Arts Occupations
The most common Management, Business, Science and Arts occupations in Summit are Health Diagnosing & Treating (106 | 10.8%), Community & Social Service (102 | 10.4%), Health Technologists (94 | 9.6%), Management (89 | 9.1%), and Education Instruction & Library (82 | 8.4%).
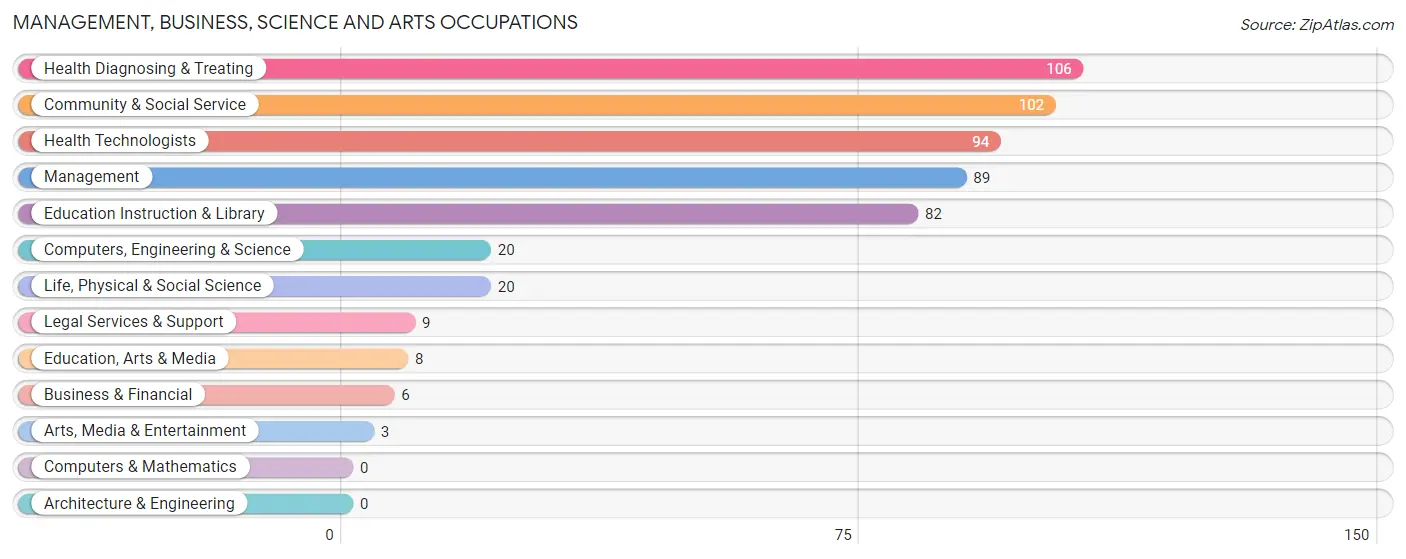
Management, Business, Science and Arts Occupations by Sex
Within the Management, Business, Science and Arts occupations in Summit, the most male-oriented occupations are Business & Financial (100.0%), Computers, Engineering & Science (100.0%), and Life, Physical & Social Science (100.0%), while the most female-oriented occupations are Health Diagnosing & Treating (100.0%), Health Technologists (100.0%), and Education Instruction & Library (48.8%).
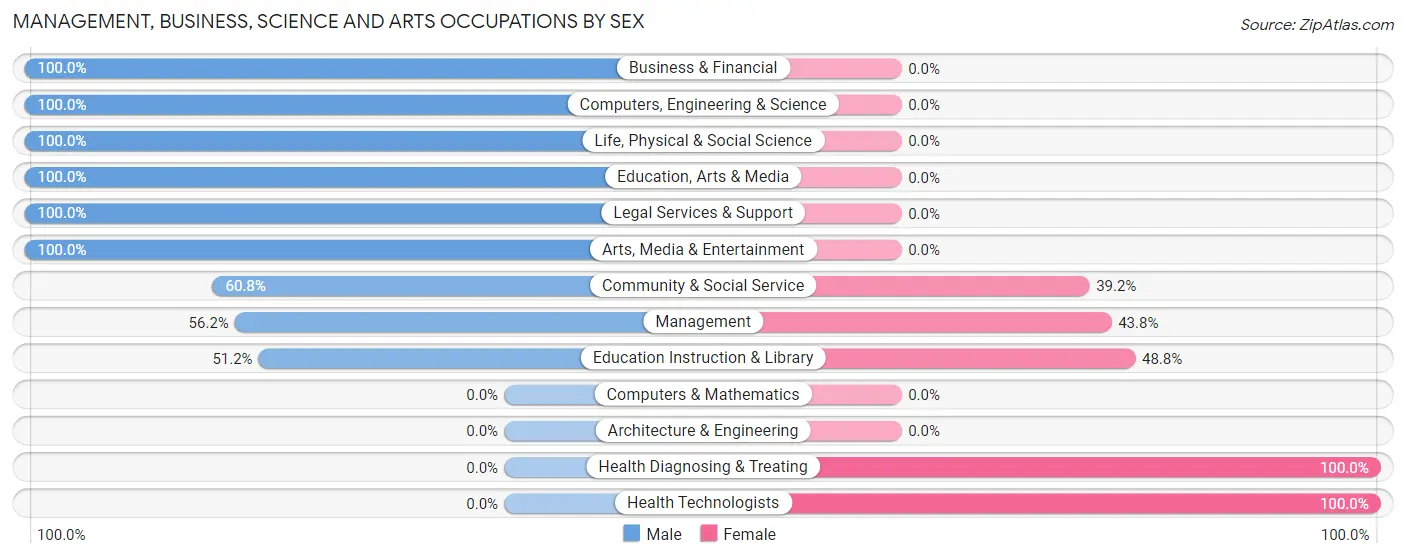
| Occupation | Male | Female |
| Management | 50 (56.2%) | 39 (43.8%) |
| Business & Financial | 6 (100.0%) | 0 (0.0%) |
| Computers, Engineering & Science | 20 (100.0%) | 0 (0.0%) |
| Computers & Mathematics | 0 (0.0%) | 0 (0.0%) |
| Architecture & Engineering | 0 (0.0%) | 0 (0.0%) |
| Life, Physical & Social Science | 20 (100.0%) | 0 (0.0%) |
| Community & Social Service | 62 (60.8%) | 40 (39.2%) |
| Education, Arts & Media | 8 (100.0%) | 0 (0.0%) |
| Legal Services & Support | 9 (100.0%) | 0 (0.0%) |
| Education Instruction & Library | 42 (51.2%) | 40 (48.8%) |
| Arts, Media & Entertainment | 3 (100.0%) | 0 (0.0%) |
| Health Diagnosing & Treating | 0 (0.0%) | 106 (100.0%) |
| Health Technologists | 0 (0.0%) | 94 (100.0%) |
| Total (Category) | 138 (42.7%) | 185 (57.3%) |
| Total (Overall) | 389 (39.7%) | 592 (60.4%) |
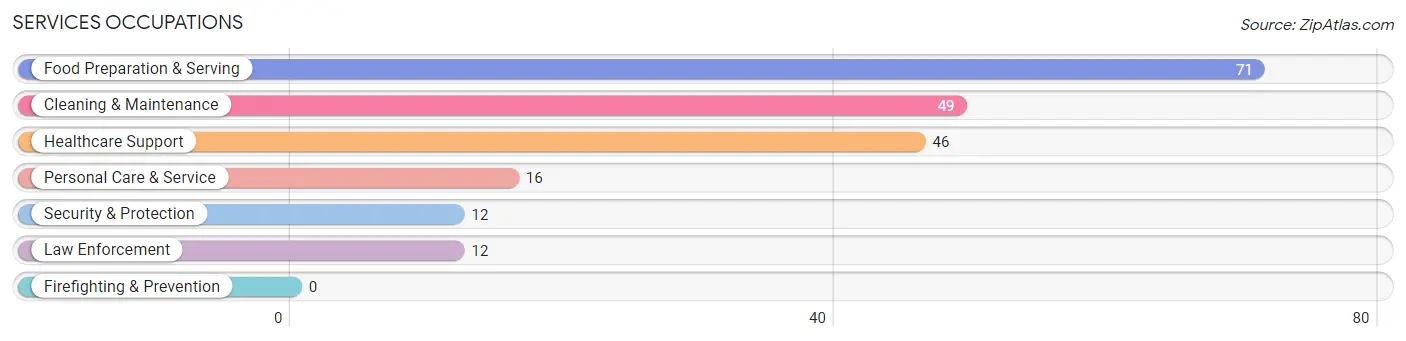
Services Occupations
The most common Services occupations in Summit are Food Preparation & Serving (71 | 7.2%), Cleaning & Maintenance (49 | 5.0%), Healthcare Support (46 | 4.7%), Personal Care & Service (16 | 1.6%), and Security & Protection (12 | 1.2%).
Services Occupations by Sex
Within the Services occupations in Summit, the most male-oriented occupations are Security & Protection (100.0%), Law Enforcement (100.0%), and Cleaning & Maintenance (75.5%), while the most female-oriented occupations are Healthcare Support (100.0%), Personal Care & Service (100.0%), and Food Preparation & Serving (43.7%).
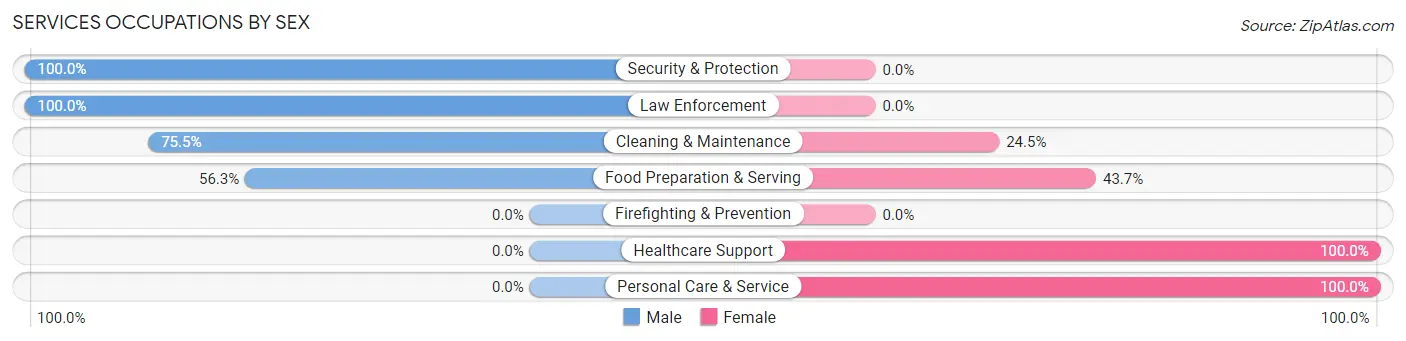
| Occupation | Male | Female |
| Healthcare Support | 0 (0.0%) | 46 (100.0%) |
| Security & Protection | 12 (100.0%) | 0 (0.0%) |
| Firefighting & Prevention | 0 (0.0%) | 0 (0.0%) |
| Law Enforcement | 12 (100.0%) | 0 (0.0%) |
| Food Preparation & Serving | 40 (56.3%) | 31 (43.7%) |
| Cleaning & Maintenance | 37 (75.5%) | 12 (24.5%) |
| Personal Care & Service | 0 (0.0%) | 16 (100.0%) |
| Total (Category) | 89 (45.9%) | 105 (54.1%) |
| Total (Overall) | 389 (39.7%) | 592 (60.4%) |
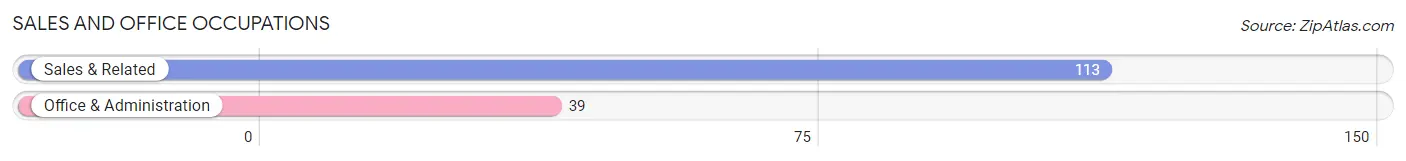
Sales and Office Occupations
The most common Sales and Office occupations in Summit are Sales & Related (113 | 11.5%), and Office & Administration (39 | 4.0%).
Sales and Office Occupations by Sex
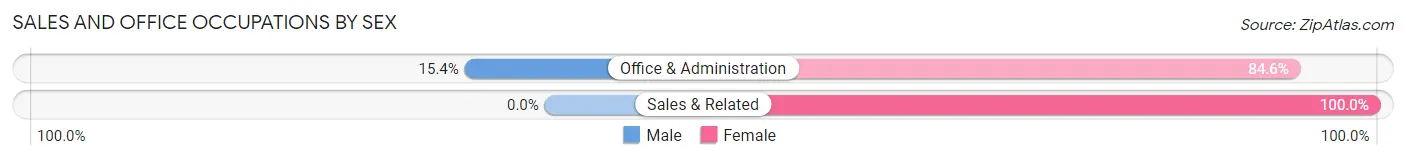
| Occupation | Male | Female |
| Sales & Related | 0 (0.0%) | 113 (100.0%) |
| Office & Administration | 6 (15.4%) | 33 (84.6%) |
| Total (Category) | 6 (4.0%) | 146 (96.1%) |
| Total (Overall) | 389 (39.7%) | 592 (60.4%) |
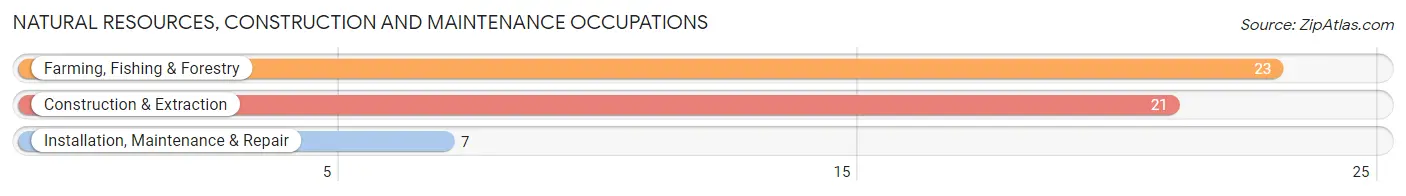
Natural Resources, Construction and Maintenance Occupations
The most common Natural Resources, Construction and Maintenance occupations in Summit are Farming, Fishing & Forestry (23 | 2.3%), Construction & Extraction (21 | 2.1%), and Installation, Maintenance & Repair (7 | 0.7%).
Natural Resources, Construction and Maintenance Occupations by Sex
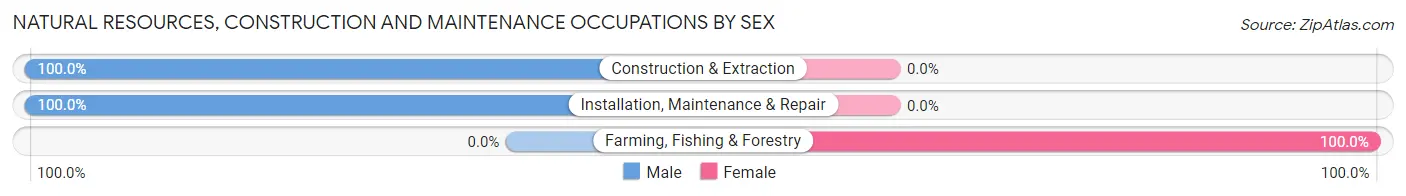
| Occupation | Male | Female |
| Farming, Fishing & Forestry | 0 (0.0%) | 23 (100.0%) |
| Construction & Extraction | 21 (100.0%) | 0 (0.0%) |
| Installation, Maintenance & Repair | 7 (100.0%) | 0 (0.0%) |
| Total (Category) | 28 (54.9%) | 23 (45.1%) |
| Total (Overall) | 389 (39.7%) | 592 (60.4%) |
Production, Transportation and Moving Occupations
The most common Production, Transportation and Moving occupations in Summit are Material Moving (108 | 11.0%), Production (85 | 8.7%), and Transportation (68 | 6.9%).
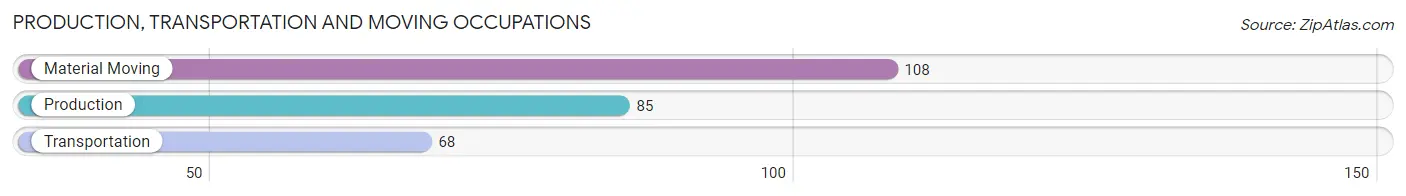
Production, Transportation and Moving Occupations by Sex
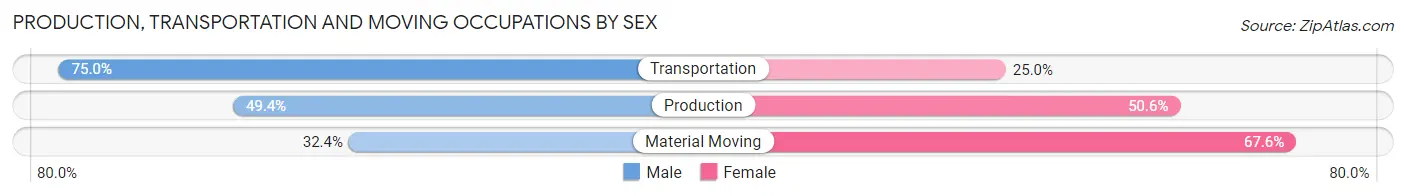
| Occupation | Male | Female |
| Production | 42 (49.4%) | 43 (50.6%) |
| Transportation | 51 (75.0%) | 17 (25.0%) |
| Material Moving | 35 (32.4%) | 73 (67.6%) |
| Total (Category) | 128 (49.0%) | 133 (51.0%) |
| Total (Overall) | 389 (39.7%) | 592 (60.4%) |
Employment Industries by Sex in Summit
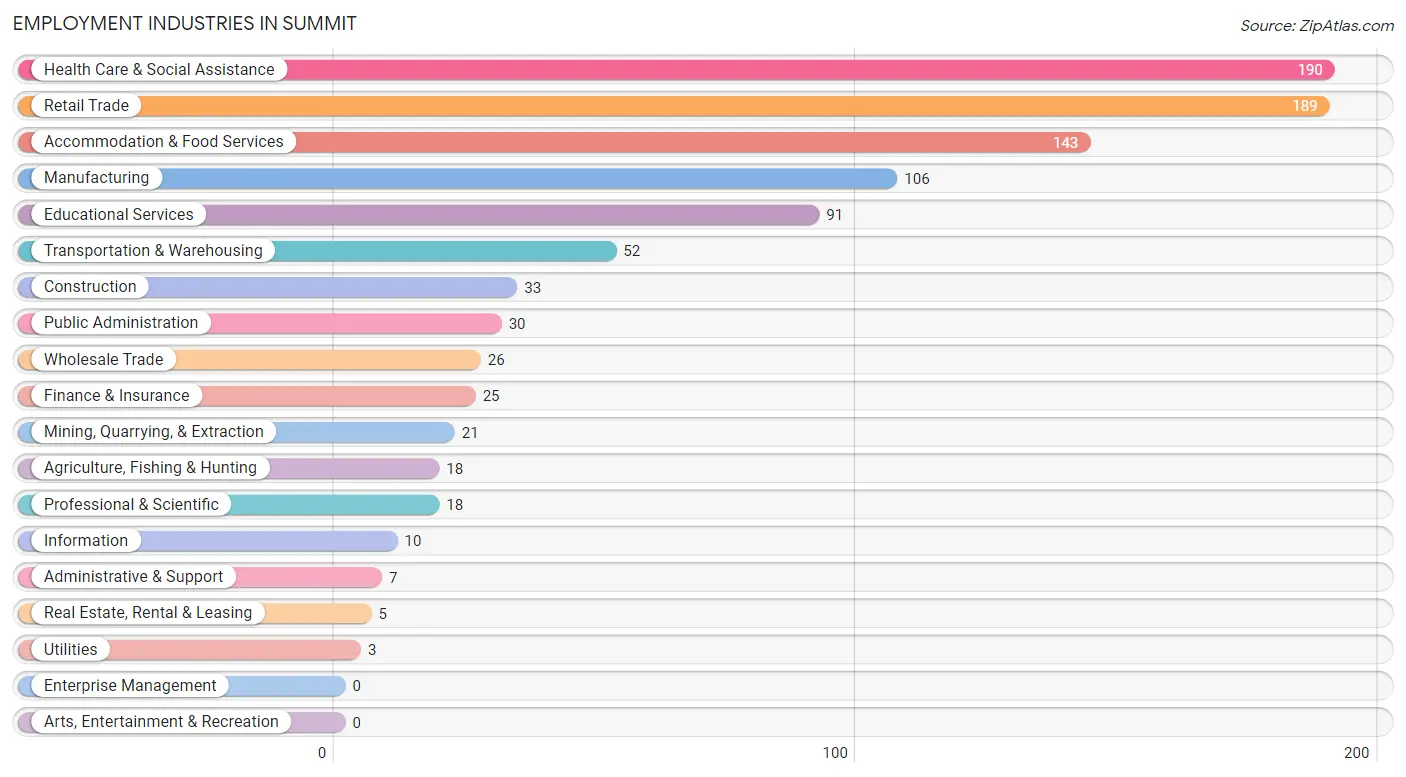
Employment Industries in Summit
The major employment industries in Summit include Health Care & Social Assistance (190 | 19.4%), Retail Trade (189 | 19.3%), Accommodation & Food Services (143 | 14.6%), Manufacturing (106 | 10.8%), and Educational Services (91 | 9.3%).
Employment Industries by Sex in Summit
The Summit industries that see more men than women are Mining, Quarrying, & Extraction (100.0%), Construction (100.0%), and Real Estate, Rental & Leasing (100.0%), whereas the industries that tend to have a higher number of women are Agriculture, Fishing & Hunting (100.0%), Wholesale Trade (100.0%), and Utilities (100.0%).
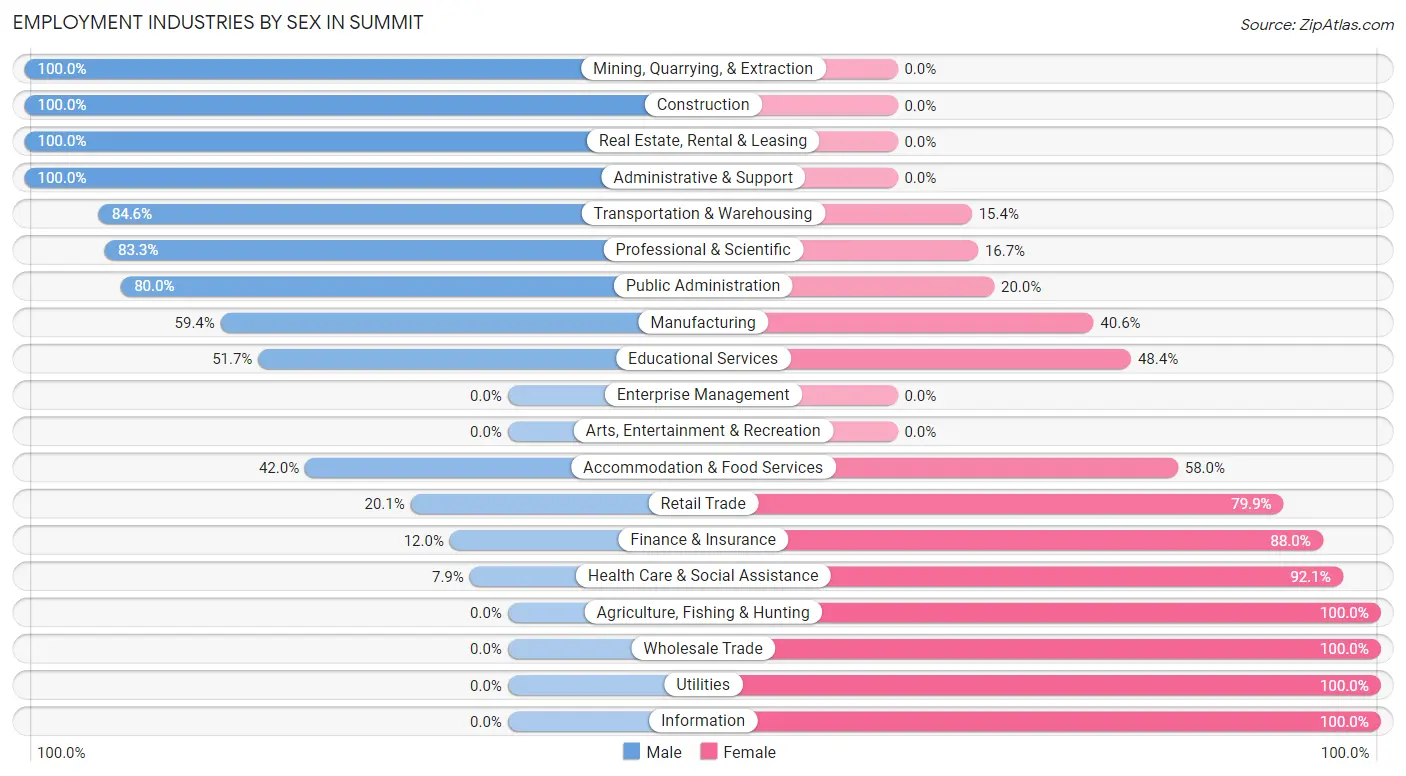
| Industry | Male | Female |
| Agriculture, Fishing & Hunting | 0 (0.0%) | 18 (100.0%) |
| Mining, Quarrying, & Extraction | 21 (100.0%) | 0 (0.0%) |
| Construction | 33 (100.0%) | 0 (0.0%) |
| Manufacturing | 63 (59.4%) | 43 (40.6%) |
| Wholesale Trade | 0 (0.0%) | 26 (100.0%) |
| Retail Trade | 38 (20.1%) | 151 (79.9%) |
| Transportation & Warehousing | 44 (84.6%) | 8 (15.4%) |
| Utilities | 0 (0.0%) | 3 (100.0%) |
| Information | 0 (0.0%) | 10 (100.0%) |
| Finance & Insurance | 3 (12.0%) | 22 (88.0%) |
| Real Estate, Rental & Leasing | 5 (100.0%) | 0 (0.0%) |
| Professional & Scientific | 15 (83.3%) | 3 (16.7%) |
| Enterprise Management | 0 (0.0%) | 0 (0.0%) |
| Administrative & Support | 7 (100.0%) | 0 (0.0%) |
| Educational Services | 47 (51.6%) | 44 (48.3%) |
| Health Care & Social Assistance | 15 (7.9%) | 175 (92.1%) |
| Arts, Entertainment & Recreation | 0 (0.0%) | 0 (0.0%) |
| Accommodation & Food Services | 60 (42.0%) | 83 (58.0%) |
| Public Administration | 24 (80.0%) | 6 (20.0%) |
| Total | 389 (39.7%) | 592 (60.4%) |
Education in Summit
School Enrollment in Summit
The most common levels of schooling among the 950 students in Summit are elementary school (200 | 21.0%), high school (197 | 20.7%), and middle school (186 | 19.6%).
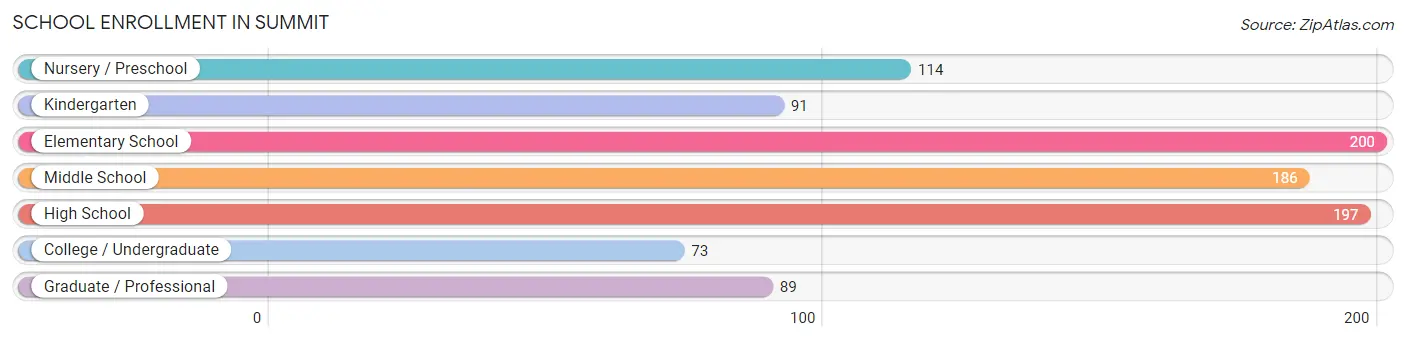
| School Level | # Students | % Students |
| Nursery / Preschool | 114 | 12.0% |
| Kindergarten | 91 | 9.6% |
| Elementary School | 200 | 21.0% |
| Middle School | 186 | 19.6% |
| High School | 197 | 20.7% |
| College / Undergraduate | 73 | 7.7% |
| Graduate / Professional | 89 | 9.4% |
| Total | 950 | 100.0% |
School Enrollment by Age by Funding Source in Summit
Out of a total of 950 students who are enrolled in schools in Summit, 321 (33.8%) attend a private institution, while the remaining 629 (66.2%) are enrolled in public schools. The age group of 3 to 4 year olds has the highest likelihood of being enrolled in private schools, with 65 (68.4% in the age bracket) enrolled. Conversely, the age group of 18 to 19 year olds has the lowest likelihood of being enrolled in a private school, with 11 (100.0% in the age bracket) attending a public institution.
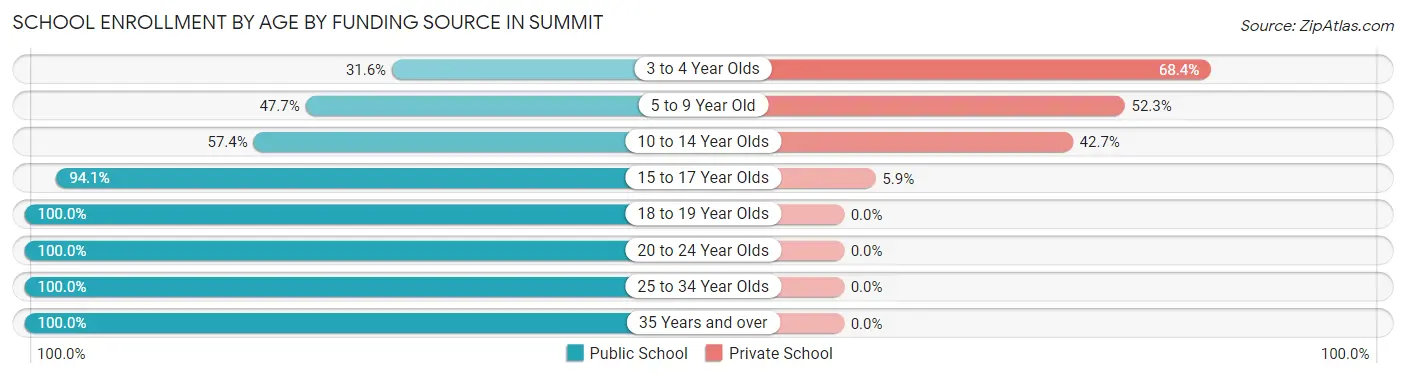
| Age Bracket | Public School | Private School |
| 3 to 4 Year Olds | 30 (31.6%) | 65 (68.4%) |
| 5 to 9 Year Old | 144 (47.7%) | 158 (52.3%) |
| 10 to 14 Year Olds | 117 (57.4%) | 87 (42.6%) |
| 15 to 17 Year Olds | 175 (94.1%) | 11 (5.9%) |
| 18 to 19 Year Olds | 11 (100.0%) | 0 (0.0%) |
| 20 to 24 Year Olds | 35 (100.0%) | 0 (0.0%) |
| 25 to 34 Year Olds | 116 (100.0%) | 0 (0.0%) |
| 35 Years and over | 1 (100.0%) | 0 (0.0%) |
| Total | 629 (66.2%) | 321 (33.8%) |
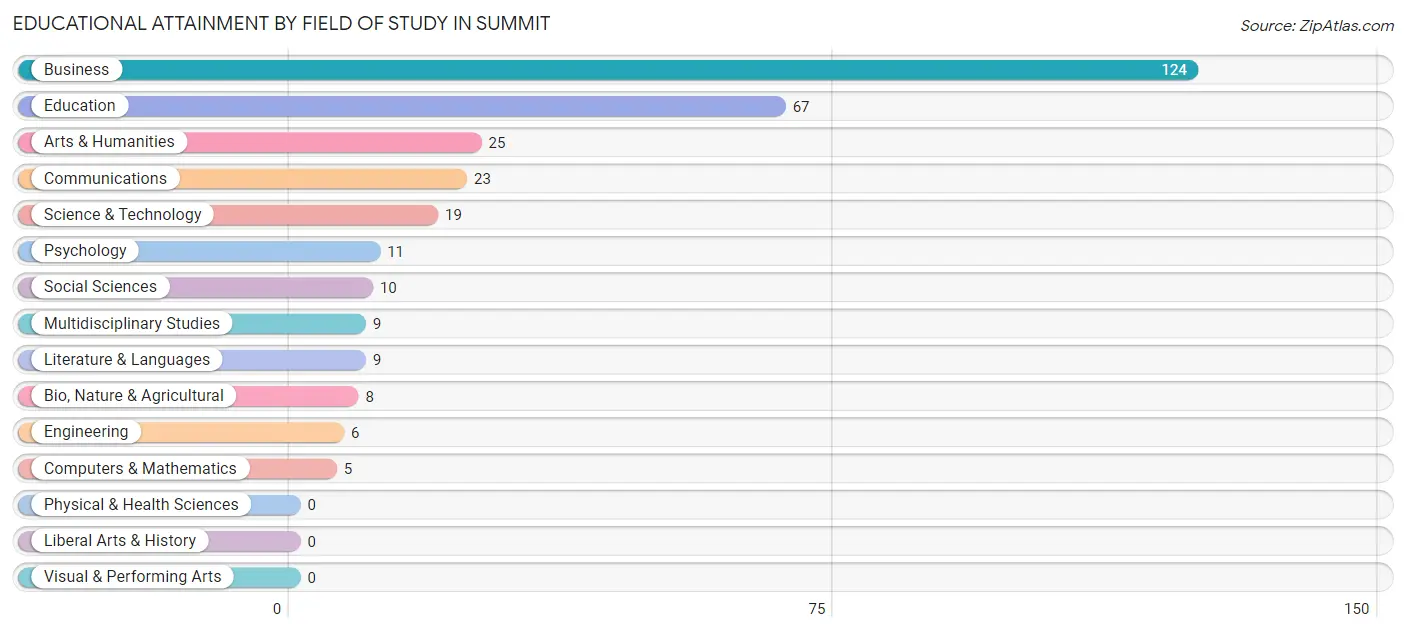
Educational Attainment by Field of Study in Summit
Business (124 | 39.2%), education (67 | 21.2%), arts & humanities (25 | 7.9%), communications (23 | 7.3%), and science & technology (19 | 6.0%) are the most common fields of study among 316 individuals in Summit who have obtained a bachelor's degree or higher.
| Field of Study | # Graduates | % Graduates |
| Computers & Mathematics | 5 | 1.6% |
| Bio, Nature & Agricultural | 8 | 2.5% |
| Physical & Health Sciences | 0 | 0.0% |
| Psychology | 11 | 3.5% |
| Social Sciences | 10 | 3.2% |
| Engineering | 6 | 1.9% |
| Multidisciplinary Studies | 9 | 2.9% |
| Science & Technology | 19 | 6.0% |
| Business | 124 | 39.2% |
| Education | 67 | 21.2% |
| Literature & Languages | 9 | 2.9% |
| Liberal Arts & History | 0 | 0.0% |
| Visual & Performing Arts | 0 | 0.0% |
| Communications | 23 | 7.3% |
| Arts & Humanities | 25 | 7.9% |
| Total | 316 | 100.0% |
Transportation & Commute in Summit
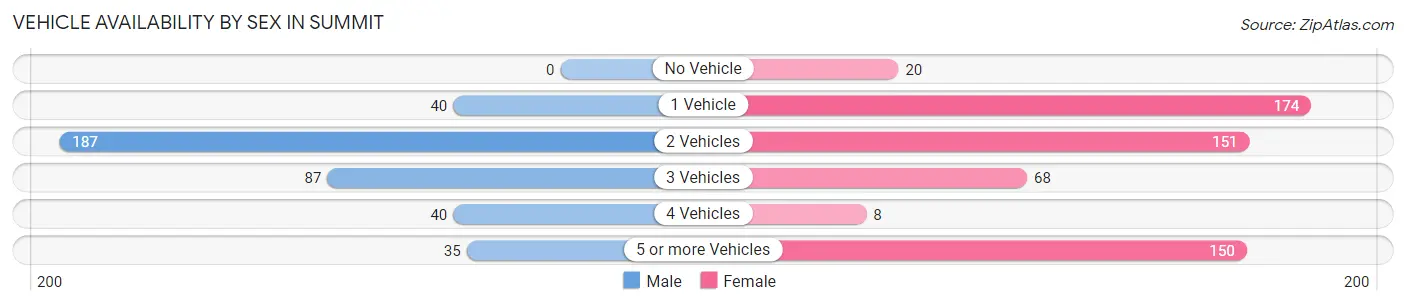
Vehicle Availability by Sex in Summit
The most prevalent vehicle ownership categories in Summit are males with 2 vehicles (187, accounting for 48.1%) and females with 2 vehicles (151, making up 32.8%).
| Vehicles Available | Male | Female |
| No Vehicle | 0 (0.0%) | 20 (3.5%) |
| 1 Vehicle | 40 (10.3%) | 174 (30.5%) |
| 2 Vehicles | 187 (48.1%) | 151 (26.4%) |
| 3 Vehicles | 87 (22.4%) | 68 (11.9%) |
| 4 Vehicles | 40 (10.3%) | 8 (1.4%) |
| 5 or more Vehicles | 35 (9.0%) | 150 (26.3%) |
| Total | 389 (100.0%) | 571 (100.0%) |
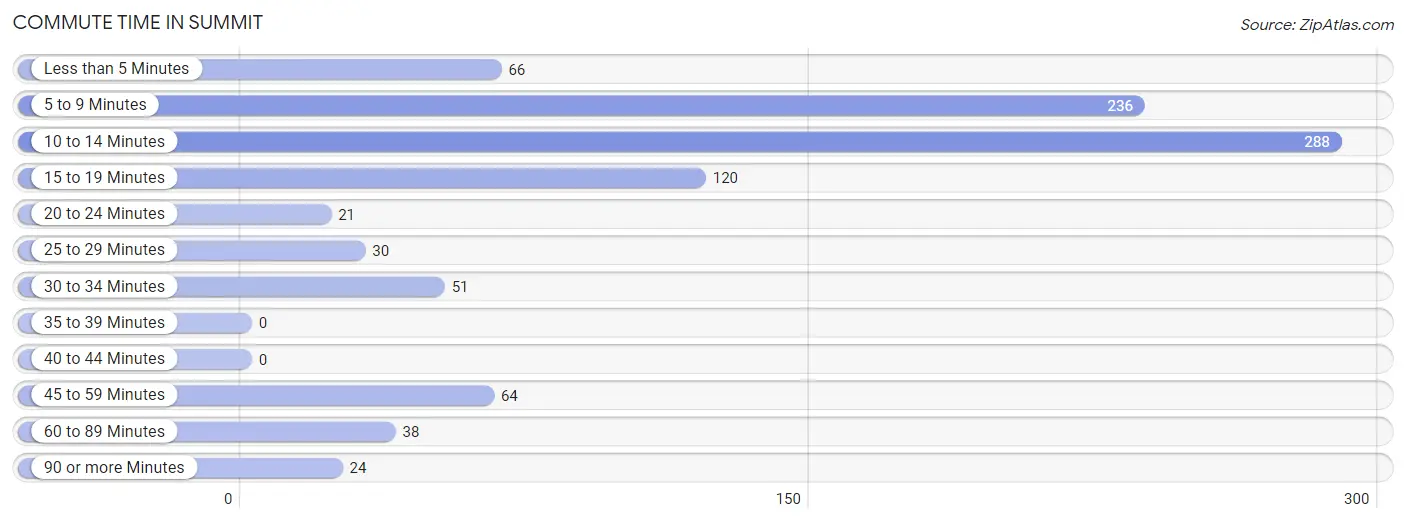
Commute Time in Summit
The most frequently occuring commute durations in Summit are 10 to 14 minutes (288 commuters, 30.7%), 5 to 9 minutes (236 commuters, 25.2%), and 15 to 19 minutes (120 commuters, 12.8%).
| Commute Time | # Commuters | % Commuters |
| Less than 5 Minutes | 66 | 7.0% |
| 5 to 9 Minutes | 236 | 25.2% |
| 10 to 14 Minutes | 288 | 30.7% |
| 15 to 19 Minutes | 120 | 12.8% |
| 20 to 24 Minutes | 21 | 2.2% |
| 25 to 29 Minutes | 30 | 3.2% |
| 30 to 34 Minutes | 51 | 5.4% |
| 35 to 39 Minutes | 0 | 0.0% |
| 40 to 44 Minutes | 0 | 0.0% |
| 45 to 59 Minutes | 64 | 6.8% |
| 60 to 89 Minutes | 38 | 4.1% |
| 90 or more Minutes | 24 | 2.6% |
Commute Time by Sex in Summit
The most common commute times in Summit are 5 to 9 minutes (101 commuters, 26.0%) for males and 10 to 14 minutes (201 commuters, 36.6%) for females.
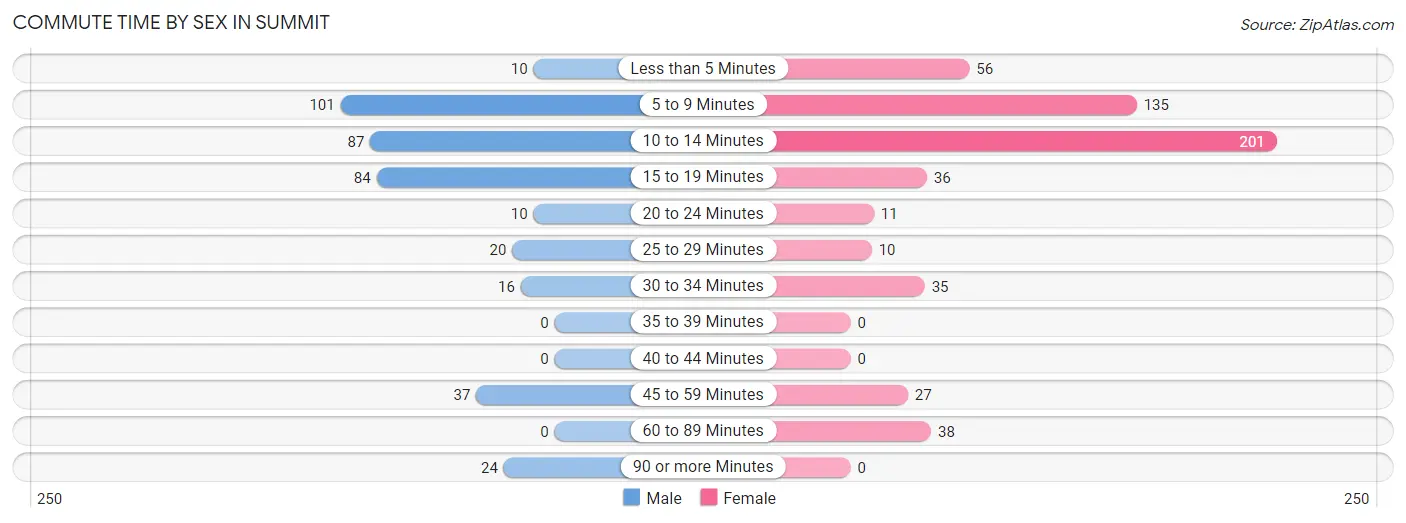
| Commute Time | Male | Female |
| Less than 5 Minutes | 10 (2.6%) | 56 (10.2%) |
| 5 to 9 Minutes | 101 (26.0%) | 135 (24.6%) |
| 10 to 14 Minutes | 87 (22.4%) | 201 (36.6%) |
| 15 to 19 Minutes | 84 (21.6%) | 36 (6.6%) |
| 20 to 24 Minutes | 10 (2.6%) | 11 (2.0%) |
| 25 to 29 Minutes | 20 (5.1%) | 10 (1.8%) |
| 30 to 34 Minutes | 16 (4.1%) | 35 (6.4%) |
| 35 to 39 Minutes | 0 (0.0%) | 0 (0.0%) |
| 40 to 44 Minutes | 0 (0.0%) | 0 (0.0%) |
| 45 to 59 Minutes | 37 (9.5%) | 27 (4.9%) |
| 60 to 89 Minutes | 0 (0.0%) | 38 (6.9%) |
| 90 or more Minutes | 24 (6.2%) | 0 (0.0%) |
Time of Departure to Work by Sex in Summit
The most frequent times of departure to work in Summit are 12:00 PM to 3:59 PM (135, 34.7%) for males and 8:00 AM to 8:29 AM (113, 20.6%) for females.
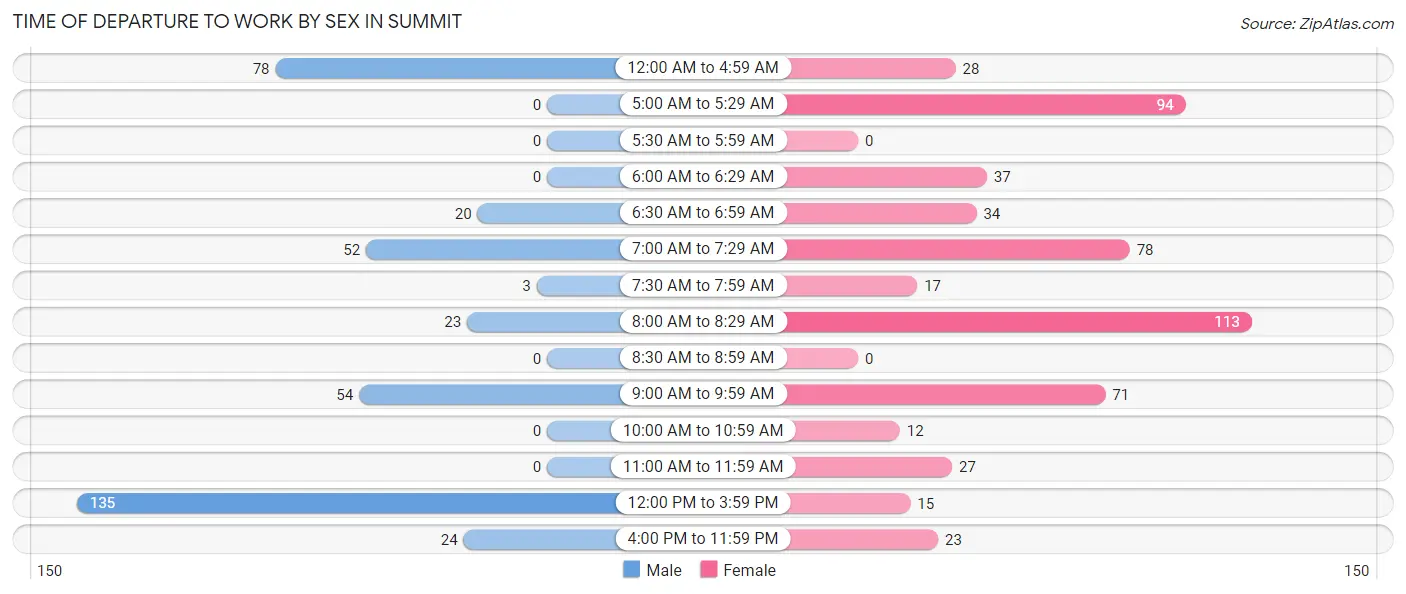
| Time of Departure | Male | Female |
| 12:00 AM to 4:59 AM | 78 (20.1%) | 28 (5.1%) |
| 5:00 AM to 5:29 AM | 0 (0.0%) | 94 (17.1%) |
| 5:30 AM to 5:59 AM | 0 (0.0%) | 0 (0.0%) |
| 6:00 AM to 6:29 AM | 0 (0.0%) | 37 (6.7%) |
| 6:30 AM to 6:59 AM | 20 (5.1%) | 34 (6.2%) |
| 7:00 AM to 7:29 AM | 52 (13.4%) | 78 (14.2%) |
| 7:30 AM to 7:59 AM | 3 (0.8%) | 17 (3.1%) |
| 8:00 AM to 8:29 AM | 23 (5.9%) | 113 (20.6%) |
| 8:30 AM to 8:59 AM | 0 (0.0%) | 0 (0.0%) |
| 9:00 AM to 9:59 AM | 54 (13.9%) | 71 (12.9%) |
| 10:00 AM to 10:59 AM | 0 (0.0%) | 12 (2.2%) |
| 11:00 AM to 11:59 AM | 0 (0.0%) | 27 (4.9%) |
| 12:00 PM to 3:59 PM | 135 (34.7%) | 15 (2.7%) |
| 4:00 PM to 11:59 PM | 24 (6.2%) | 23 (4.2%) |
| Total | 389 (100.0%) | 549 (100.0%) |
Housing Occupancy in Summit
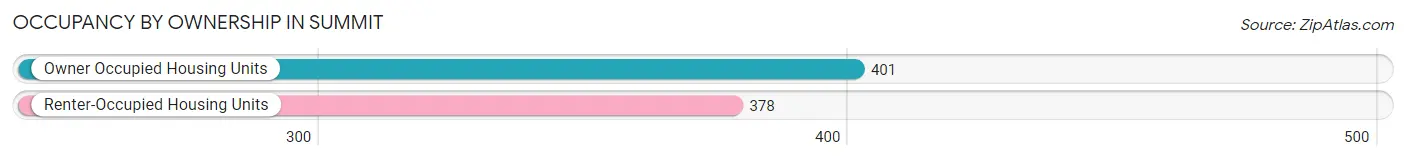
Occupancy by Ownership in Summit
Of the total 779 dwellings in Summit, owner-occupied units account for 401 (51.5%), while renter-occupied units make up 378 (48.5%).
| Occupancy | # Housing Units | % Housing Units |
| Owner Occupied Housing Units | 401 | 51.5% |
| Renter-Occupied Housing Units | 378 | 48.5% |
| Total Occupied Housing Units | 779 | 100.0% |
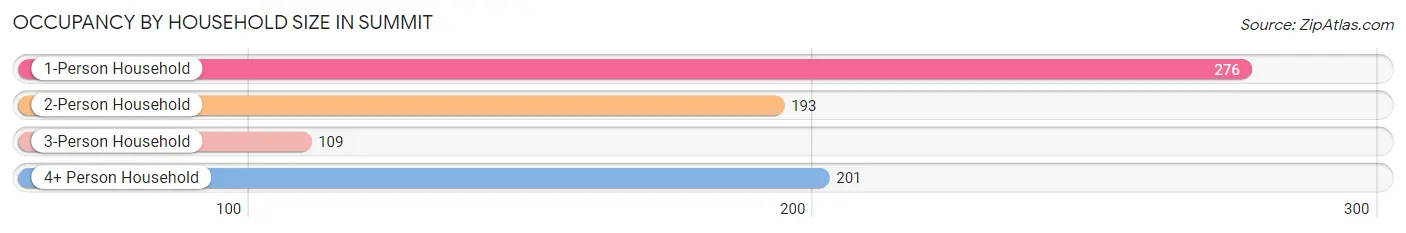
Occupancy by Household Size in Summit
| Household Size | # Housing Units | % Housing Units |
| 1-Person Household | 276 | 35.4% |
| 2-Person Household | 193 | 24.8% |
| 3-Person Household | 109 | 14.0% |
| 4+ Person Household | 201 | 25.8% |
| Total Housing Units | 779 | 100.0% |
Occupancy by Ownership by Household Size in Summit
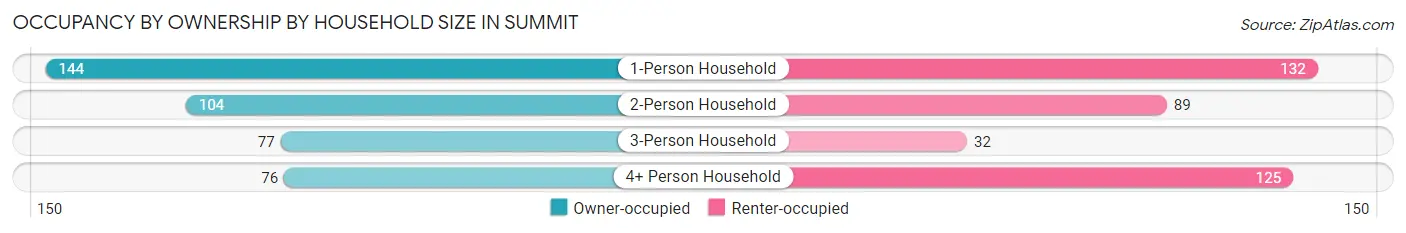
| Household Size | Owner-occupied | Renter-occupied |
| 1-Person Household | 144 (52.2%) | 132 (47.8%) |
| 2-Person Household | 104 (53.9%) | 89 (46.1%) |
| 3-Person Household | 77 (70.6%) | 32 (29.4%) |
| 4+ Person Household | 76 (37.8%) | 125 (62.2%) |
| Total Housing Units | 401 (51.5%) | 378 (48.5%) |
Occupancy by Educational Attainment in Summit
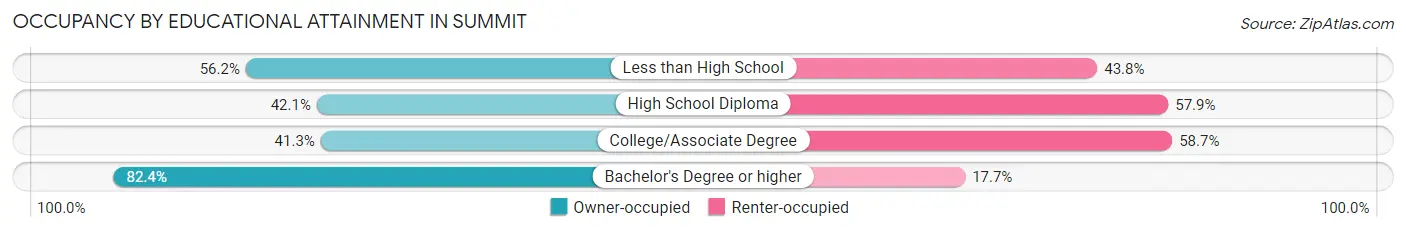
| Household Size | Owner-occupied | Renter-occupied |
| Less than High School | 82 (56.2%) | 64 (43.8%) |
| High School Diploma | 93 (42.1%) | 128 (57.9%) |
| College/Associate Degree | 114 (41.3%) | 162 (58.7%) |
| Bachelor's Degree or higher | 112 (82.4%) | 24 (17.6%) |
Occupancy by Age of Householder in Summit
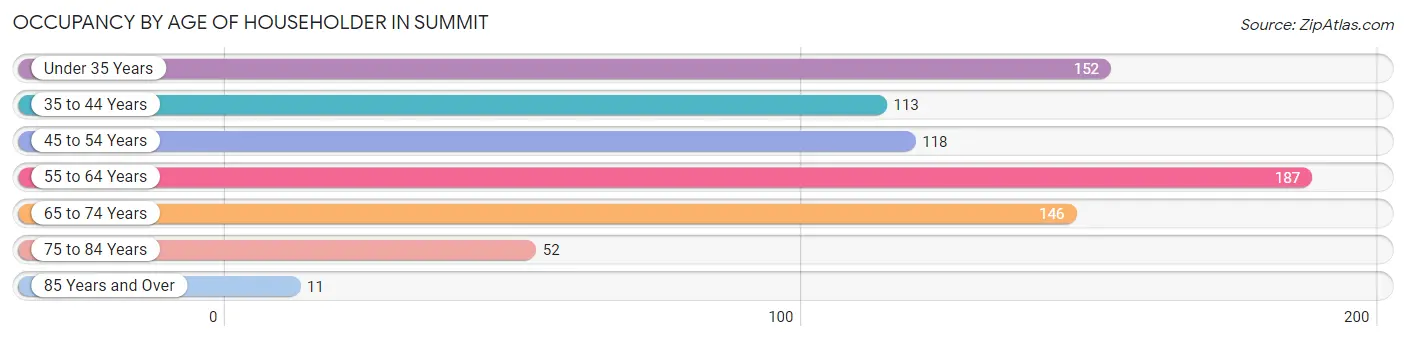
| Age Bracket | # Households | % Households |
| Under 35 Years | 152 | 19.5% |
| 35 to 44 Years | 113 | 14.5% |
| 45 to 54 Years | 118 | 15.1% |
| 55 to 64 Years | 187 | 24.0% |
| 65 to 74 Years | 146 | 18.7% |
| 75 to 84 Years | 52 | 6.7% |
| 85 Years and Over | 11 | 1.4% |
| Total | 779 | 100.0% |
Housing Finances in Summit
Median Income by Occupancy in Summit
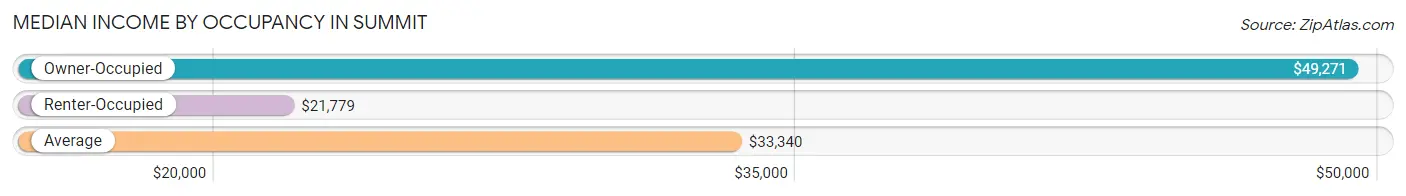
| Occupancy Type | # Households | Median Income |
| Owner-Occupied | 401 (51.5%) | $49,271 |
| Renter-Occupied | 378 (48.5%) | $21,779 |
| Average | 779 (100.0%) | $33,340 |
Occupancy by Householder Income Bracket in Summit
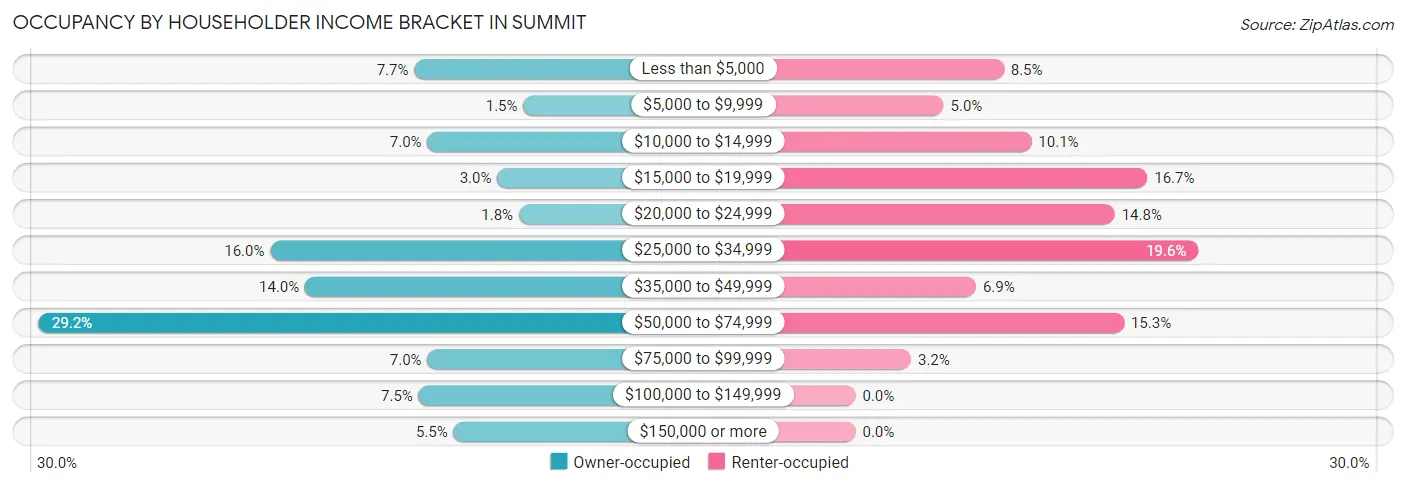
| Income Bracket | Owner-occupied | Renter-occupied |
| Less than $5,000 | 31 (7.7%) | 32 (8.5%) |
| $5,000 to $9,999 | 6 (1.5%) | 19 (5.0%) |
| $10,000 to $14,999 | 28 (7.0%) | 38 (10.1%) |
| $15,000 to $19,999 | 12 (3.0%) | 63 (16.7%) |
| $20,000 to $24,999 | 7 (1.8%) | 56 (14.8%) |
| $25,000 to $34,999 | 64 (16.0%) | 74 (19.6%) |
| $35,000 to $49,999 | 56 (14.0%) | 26 (6.9%) |
| $50,000 to $74,999 | 117 (29.2%) | 58 (15.3%) |
| $75,000 to $99,999 | 28 (7.0%) | 12 (3.2%) |
| $100,000 to $149,999 | 30 (7.5%) | 0 (0.0%) |
| $150,000 or more | 22 (5.5%) | 0 (0.0%) |
| Total | 401 (100.0%) | 378 (100.0%) |
Monthly Housing Cost Tiers in Summit
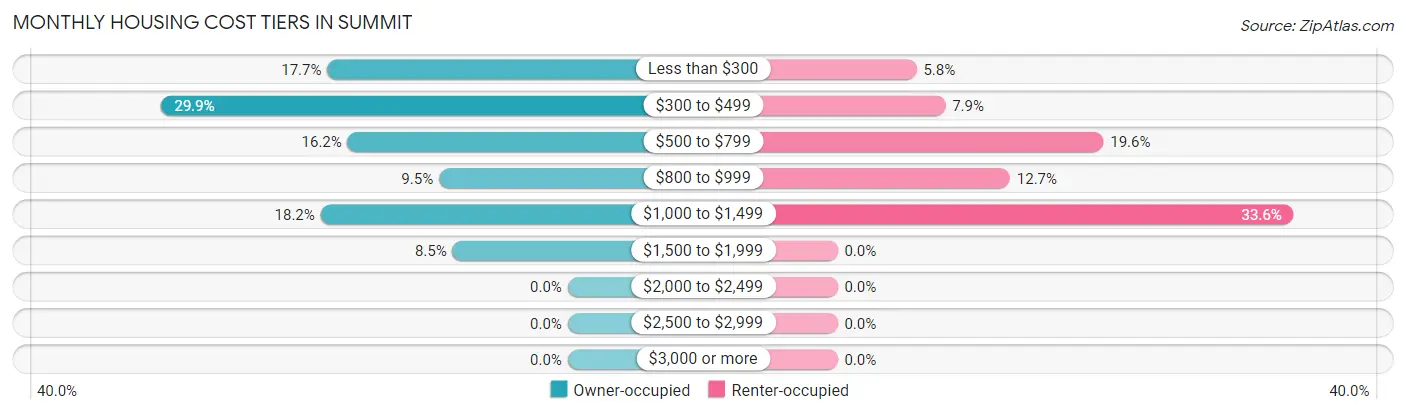
| Monthly Cost | Owner-occupied | Renter-occupied |
| Less than $300 | 71 (17.7%) | 22 (5.8%) |
| $300 to $499 | 120 (29.9%) | 30 (7.9%) |
| $500 to $799 | 65 (16.2%) | 74 (19.6%) |
| $800 to $999 | 38 (9.5%) | 48 (12.7%) |
| $1,000 to $1,499 | 73 (18.2%) | 127 (33.6%) |
| $1,500 to $1,999 | 34 (8.5%) | 0 (0.0%) |
| $2,000 to $2,499 | 0 (0.0%) | 0 (0.0%) |
| $2,500 to $2,999 | 0 (0.0%) | 0 (0.0%) |
| $3,000 or more | 0 (0.0%) | 0 (0.0%) |
| Total | 401 (100.0%) | 378 (100.0%) |
Physical Housing Characteristics in Summit
Housing Structures in Summit
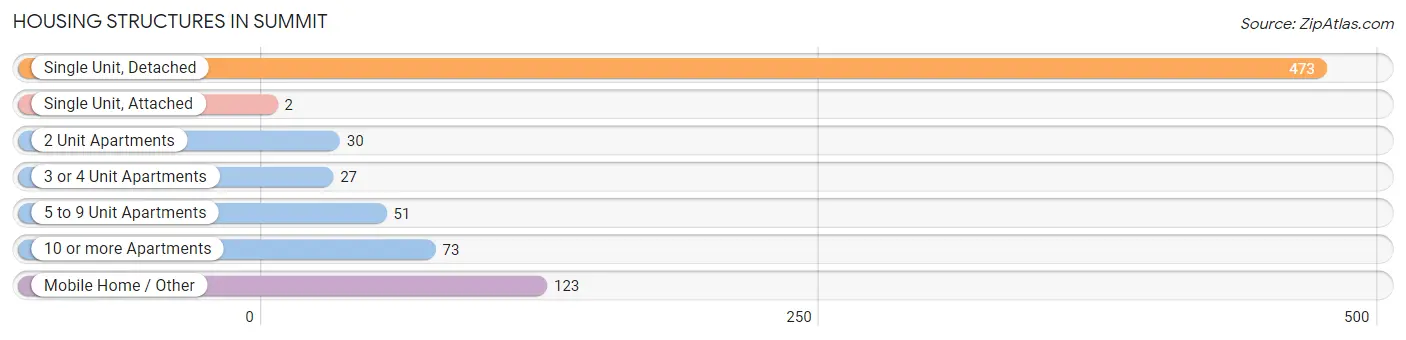
| Structure Type | # Housing Units | % Housing Units |
| Single Unit, Detached | 473 | 60.7% |
| Single Unit, Attached | 2 | 0.3% |
| 2 Unit Apartments | 30 | 3.8% |
| 3 or 4 Unit Apartments | 27 | 3.5% |
| 5 to 9 Unit Apartments | 51 | 6.6% |
| 10 or more Apartments | 73 | 9.4% |
| Mobile Home / Other | 123 | 15.8% |
| Total | 779 | 100.0% |
Housing Structures by Occupancy in Summit
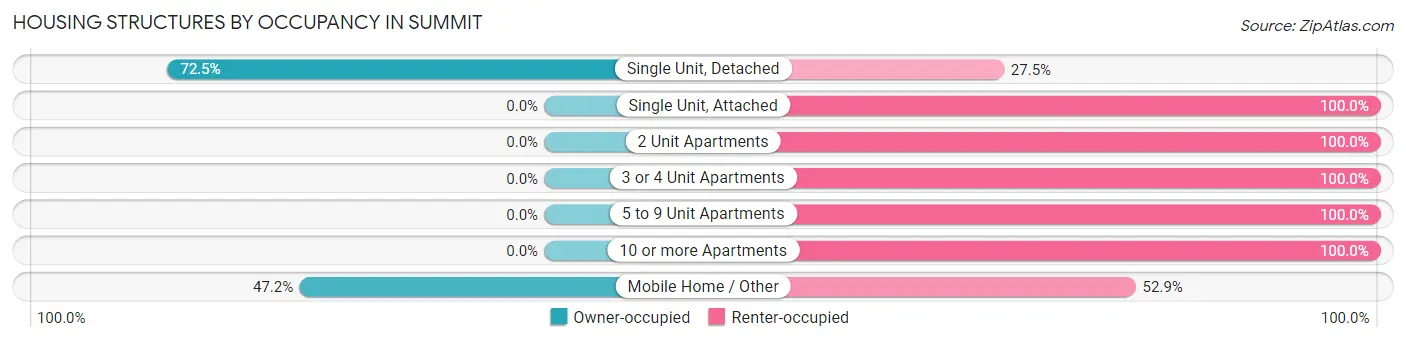
| Structure Type | Owner-occupied | Renter-occupied |
| Single Unit, Detached | 343 (72.5%) | 130 (27.5%) |
| Single Unit, Attached | 0 (0.0%) | 2 (100.0%) |
| 2 Unit Apartments | 0 (0.0%) | 30 (100.0%) |
| 3 or 4 Unit Apartments | 0 (0.0%) | 27 (100.0%) |
| 5 to 9 Unit Apartments | 0 (0.0%) | 51 (100.0%) |
| 10 or more Apartments | 0 (0.0%) | 73 (100.0%) |
| Mobile Home / Other | 58 (47.1%) | 65 (52.8%) |
| Total | 401 (51.5%) | 378 (48.5%) |
Housing Structures by Number of Rooms in Summit
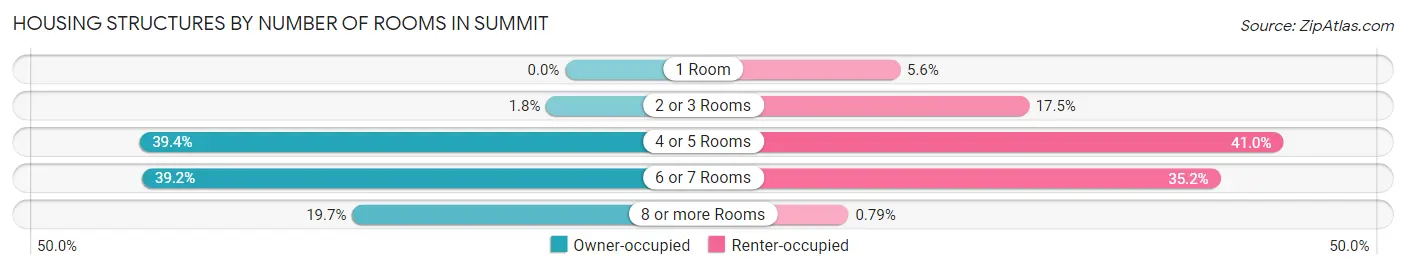
| Number of Rooms | Owner-occupied | Renter-occupied |
| 1 Room | 0 (0.0%) | 21 (5.6%) |
| 2 or 3 Rooms | 7 (1.8%) | 66 (17.5%) |
| 4 or 5 Rooms | 158 (39.4%) | 155 (41.0%) |
| 6 or 7 Rooms | 157 (39.2%) | 133 (35.2%) |
| 8 or more Rooms | 79 (19.7%) | 3 (0.8%) |
| Total | 401 (100.0%) | 378 (100.0%) |
Housing Structure by Heating Type in Summit
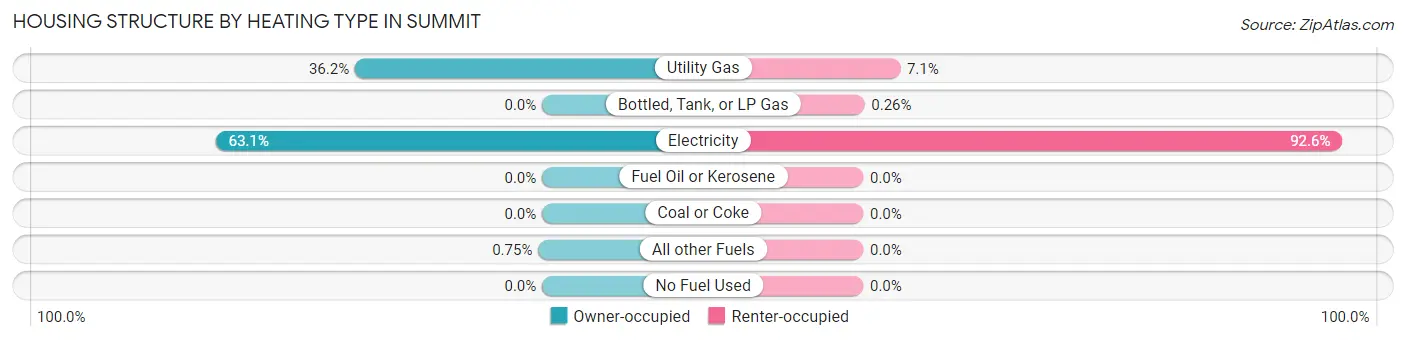
| Heating Type | Owner-occupied | Renter-occupied |
| Utility Gas | 145 (36.2%) | 27 (7.1%) |
| Bottled, Tank, or LP Gas | 0 (0.0%) | 1 (0.3%) |
| Electricity | 253 (63.1%) | 350 (92.6%) |
| Fuel Oil or Kerosene | 0 (0.0%) | 0 (0.0%) |
| Coal or Coke | 0 (0.0%) | 0 (0.0%) |
| All other Fuels | 3 (0.7%) | 0 (0.0%) |
| No Fuel Used | 0 (0.0%) | 0 (0.0%) |
| Total | 401 (100.0%) | 378 (100.0%) |
Household Vehicle Usage in Summit
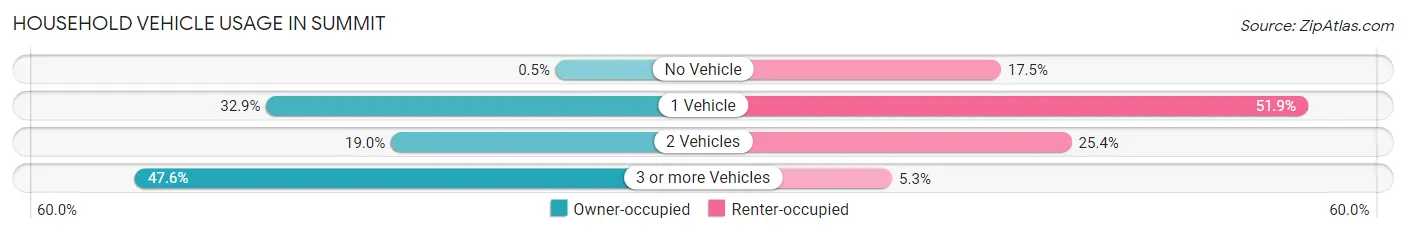
| Vehicles per Household | Owner-occupied | Renter-occupied |
| No Vehicle | 2 (0.5%) | 66 (17.5%) |
| 1 Vehicle | 132 (32.9%) | 196 (51.8%) |
| 2 Vehicles | 76 (19.0%) | 96 (25.4%) |
| 3 or more Vehicles | 191 (47.6%) | 20 (5.3%) |
| Total | 401 (100.0%) | 378 (100.0%) |
Real Estate & Mortgages in Summit
Real Estate and Mortgage Overview in Summit
| Characteristic | Without Mortgage | With Mortgage |
| Housing Units | 227 | 174 |
| Median Property Value | $106,000 | $97,100 |
| Median Household Income | $38,641 | $10 |
| Monthly Housing Costs | $382 | $0 |
| Real Estate Taxes | $664 | $47 |
Property Value by Mortgage Status in Summit
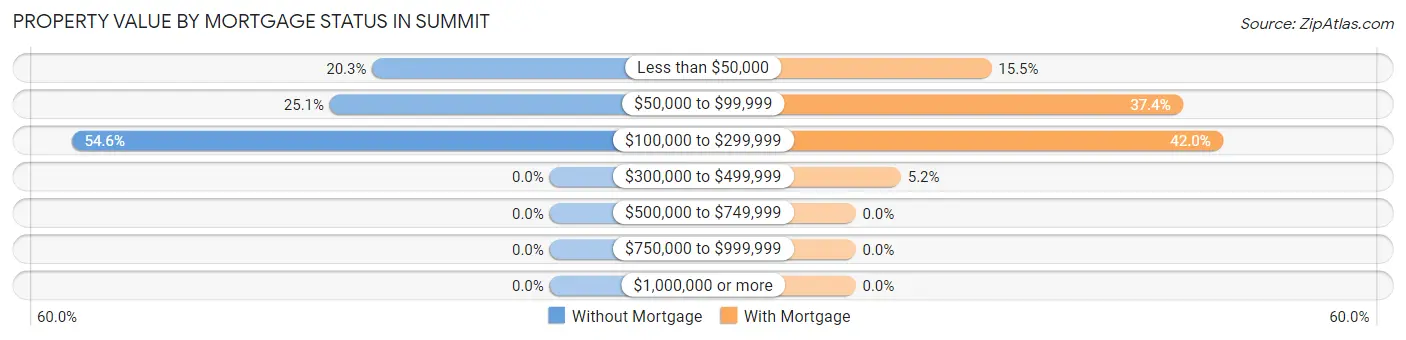
| Property Value | Without Mortgage | With Mortgage |
| Less than $50,000 | 46 (20.3%) | 27 (15.5%) |
| $50,000 to $99,999 | 57 (25.1%) | 65 (37.4%) |
| $100,000 to $299,999 | 124 (54.6%) | 73 (41.9%) |
| $300,000 to $499,999 | 0 (0.0%) | 9 (5.2%) |
| $500,000 to $749,999 | 0 (0.0%) | 0 (0.0%) |
| $750,000 to $999,999 | 0 (0.0%) | 0 (0.0%) |
| $1,000,000 or more | 0 (0.0%) | 0 (0.0%) |
| Total | 227 (100.0%) | 174 (100.0%) |
Household Income by Mortgage Status in Summit
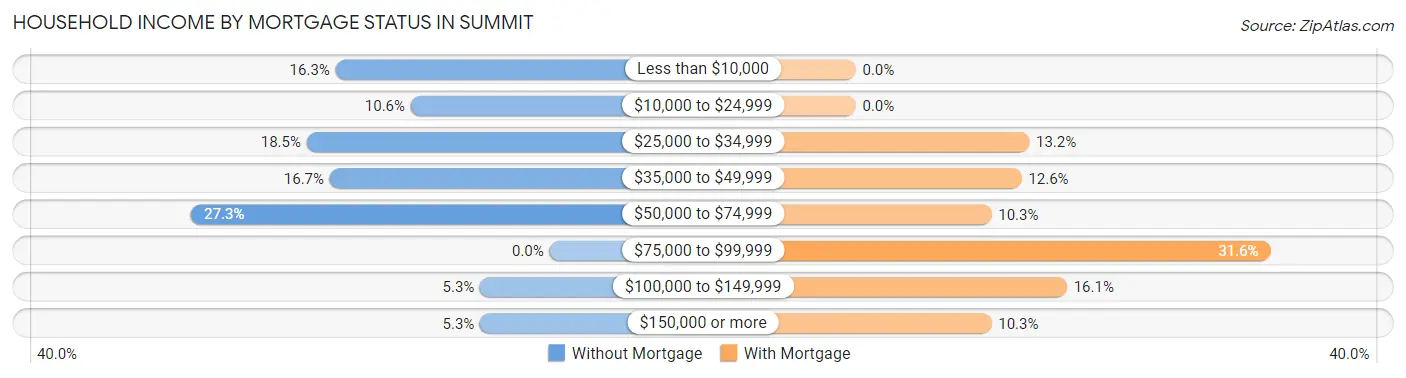
| Household Income | Without Mortgage | With Mortgage |
| Less than $10,000 | 37 (16.3%) | 0 (0.0%) |
| $10,000 to $24,999 | 24 (10.6%) | 0 (0.0%) |
| $25,000 to $34,999 | 42 (18.5%) | 23 (13.2%) |
| $35,000 to $49,999 | 38 (16.7%) | 22 (12.6%) |
| $50,000 to $74,999 | 62 (27.3%) | 18 (10.3%) |
| $75,000 to $99,999 | 0 (0.0%) | 55 (31.6%) |
| $100,000 to $149,999 | 12 (5.3%) | 28 (16.1%) |
| $150,000 or more | 12 (5.3%) | 18 (10.3%) |
| Total | 227 (100.0%) | 174 (100.0%) |
Property Value to Household Income Ratio in Summit
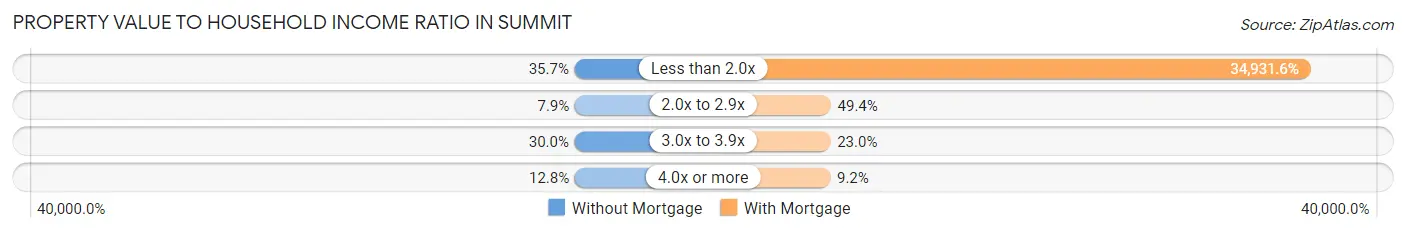
| Value-to-Income Ratio | Without Mortgage | With Mortgage |
| Less than 2.0x | 81 (35.7%) | 60,781 (34,931.6%) |
| 2.0x to 2.9x | 18 (7.9%) | 86 (49.4%) |
| 3.0x to 3.9x | 68 (30.0%) | 40 (23.0%) |
| 4.0x or more | 29 (12.8%) | 16 (9.2%) |
| Total | 227 (100.0%) | 174 (100.0%) |
Real Estate Taxes by Mortgage Status in Summit
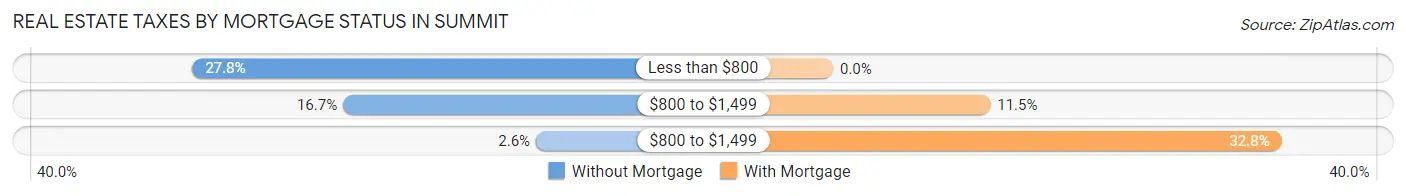
| Property Taxes | Without Mortgage | With Mortgage |
| Less than $800 | 63 (27.8%) | 0 (0.0%) |
| $800 to $1,499 | 38 (16.7%) | 20 (11.5%) |
| $800 to $1,499 | 6 (2.6%) | 57 (32.8%) |
| Total | 227 (100.0%) | 174 (100.0%) |
Health & Disability in Summit
Health Insurance Coverage by Age in Summit
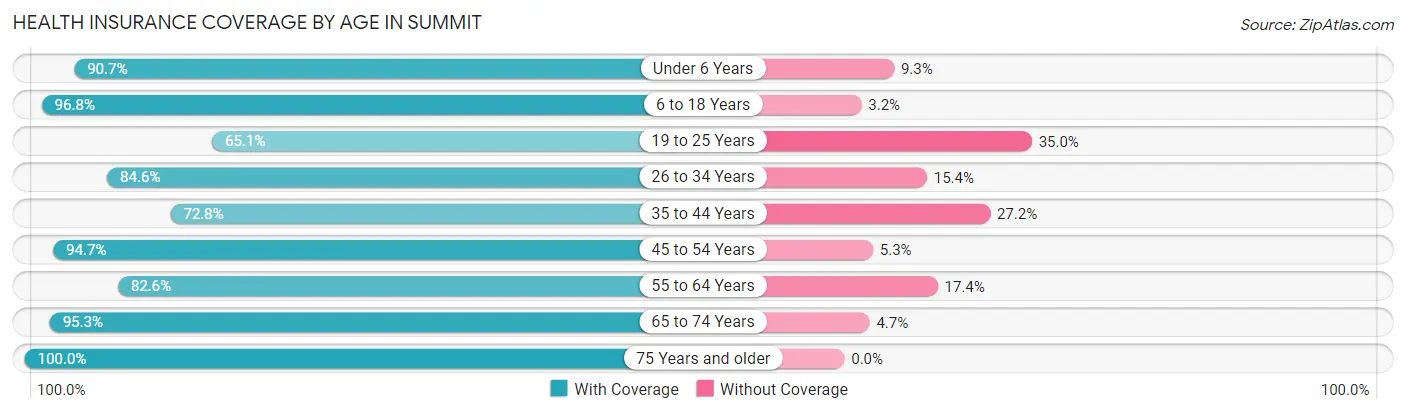
| Age Bracket | With Coverage | Without Coverage |
| Under 6 Years | 382 (90.7%) | 39 (9.3%) |
| 6 to 18 Years | 609 (96.8%) | 20 (3.2%) |
| 19 to 25 Years | 201 (65.0%) | 108 (34.9%) |
| 26 to 34 Years | 275 (84.6%) | 50 (15.4%) |
| 35 to 44 Years | 193 (72.8%) | 72 (27.2%) |
| 45 to 54 Years | 213 (94.7%) | 12 (5.3%) |
| 55 to 64 Years | 247 (82.6%) | 52 (17.4%) |
| 65 to 74 Years | 203 (95.3%) | 10 (4.7%) |
| 75 Years and older | 88 (100.0%) | 0 (0.0%) |
| Total | 2,411 (86.9%) | 363 (13.1%) |
Health Insurance Coverage by Citizenship Status in Summit
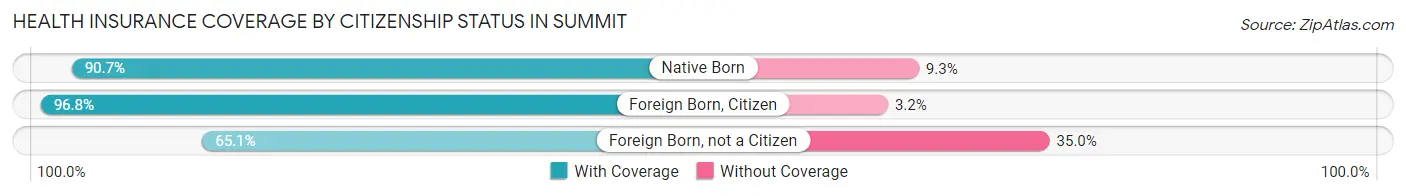
| Citizenship Status | With Coverage | Without Coverage |
| Native Born | 382 (90.7%) | 39 (9.3%) |
| Foreign Born, Citizen | 609 (96.8%) | 20 (3.2%) |
| Foreign Born, not a Citizen | 201 (65.0%) | 108 (34.9%) |
Health Insurance Coverage by Household Income in Summit
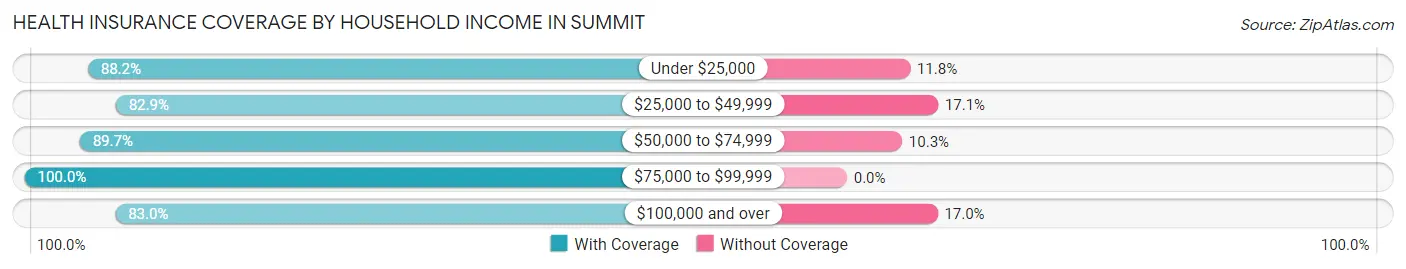
| Household Income | With Coverage | Without Coverage |
| Under $25,000 | 767 (88.2%) | 103 (11.8%) |
| $25,000 to $49,999 | 636 (82.9%) | 131 (17.1%) |
| $50,000 to $74,999 | 651 (89.7%) | 75 (10.3%) |
| $75,000 to $99,999 | 93 (100.0%) | 0 (0.0%) |
| $100,000 and over | 264 (83.0%) | 54 (17.0%) |
Public vs Private Health Insurance Coverage by Age in Summit
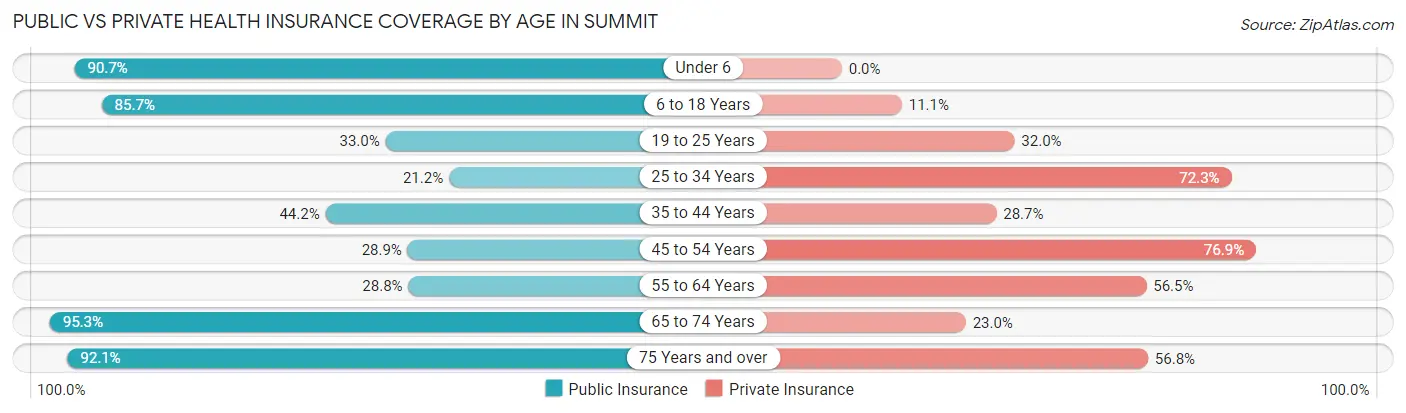
| Age Bracket | Public Insurance | Private Insurance |
| Under 6 | 382 (90.7%) | 0 (0.0%) |
| 6 to 18 Years | 539 (85.7%) | 70 (11.1%) |
| 19 to 25 Years | 102 (33.0%) | 99 (32.0%) |
| 25 to 34 Years | 69 (21.2%) | 235 (72.3%) |
| 35 to 44 Years | 117 (44.2%) | 76 (28.7%) |
| 45 to 54 Years | 65 (28.9%) | 173 (76.9%) |
| 55 to 64 Years | 86 (28.8%) | 169 (56.5%) |
| 65 to 74 Years | 203 (95.3%) | 49 (23.0%) |
| 75 Years and over | 81 (92.0%) | 50 (56.8%) |
| Total | 1,644 (59.3%) | 921 (33.2%) |
Disability Status by Sex by Age in Summit
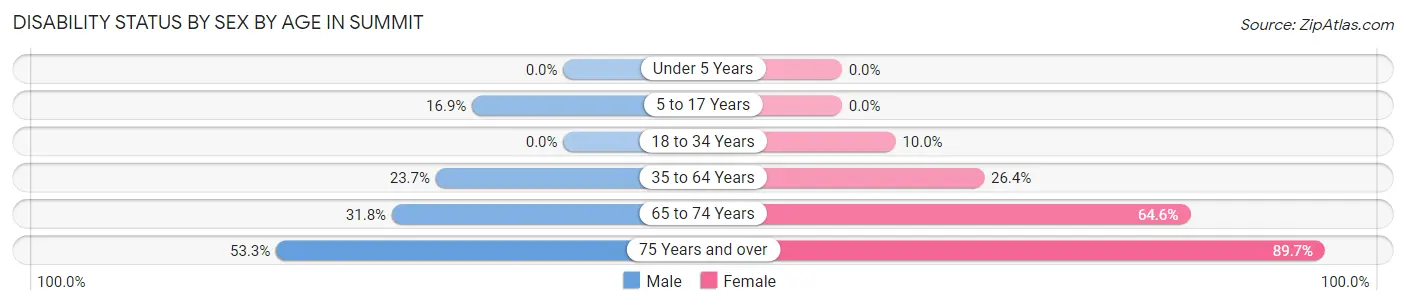
| Age Bracket | Male | Female |
| Under 5 Years | 0 (0.0%) | 0 (0.0%) |
| 5 to 17 Years | 74 (16.9%) | 0 (0.0%) |
| 18 to 34 Years | 0 (0.0%) | 48 (10.0%) |
| 35 to 64 Years | 98 (23.7%) | 99 (26.4%) |
| 65 to 74 Years | 21 (31.8%) | 95 (64.6%) |
| 75 Years and over | 16 (53.3%) | 52 (89.7%) |
Disability Class by Sex by Age in Summit
Disability Class: Hearing Difficulty
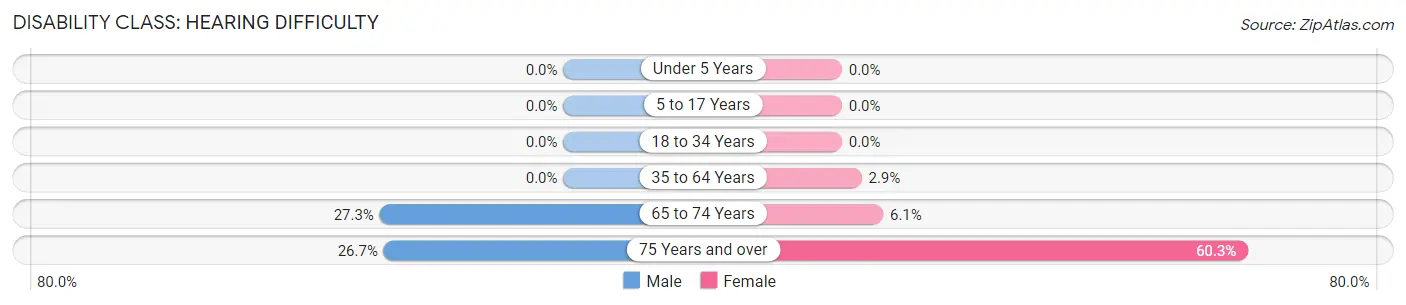
| Age Bracket | Male | Female |
| Under 5 Years | 0 (0.0%) | 0 (0.0%) |
| 5 to 17 Years | 0 (0.0%) | 0 (0.0%) |
| 18 to 34 Years | 0 (0.0%) | 0 (0.0%) |
| 35 to 64 Years | 0 (0.0%) | 11 (2.9%) |
| 65 to 74 Years | 18 (27.3%) | 9 (6.1%) |
| 75 Years and over | 8 (26.7%) | 35 (60.3%) |
Disability Class: Vision Difficulty
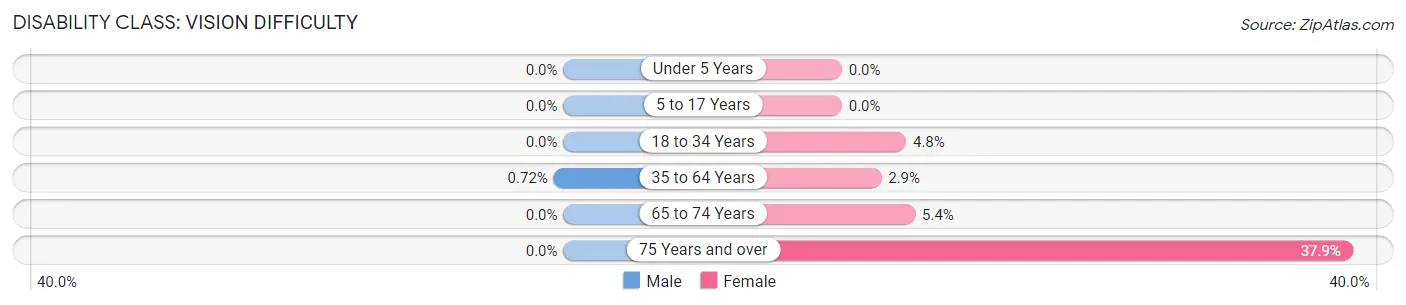
| Age Bracket | Male | Female |
| Under 5 Years | 0 (0.0%) | 0 (0.0%) |
| 5 to 17 Years | 0 (0.0%) | 0 (0.0%) |
| 18 to 34 Years | 0 (0.0%) | 23 (4.8%) |
| 35 to 64 Years | 3 (0.7%) | 11 (2.9%) |
| 65 to 74 Years | 0 (0.0%) | 8 (5.4%) |
| 75 Years and over | 0 (0.0%) | 22 (37.9%) |
Disability Class: Cognitive Difficulty
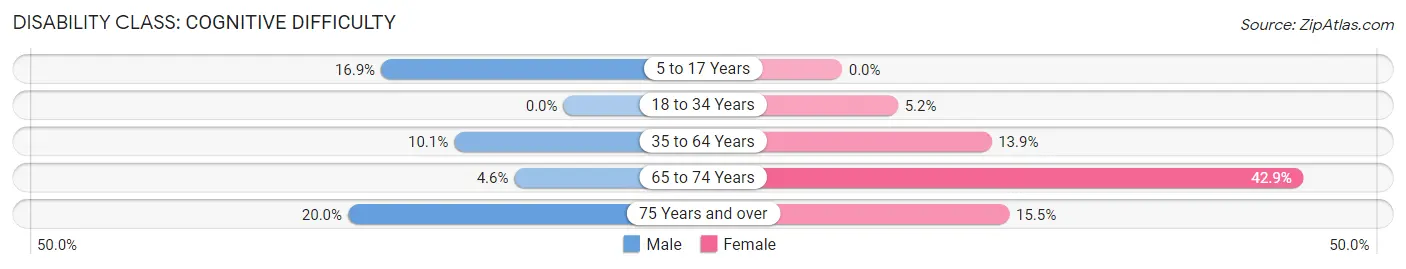
| Age Bracket | Male | Female |
| 5 to 17 Years | 74 (16.9%) | 0 (0.0%) |
| 18 to 34 Years | 0 (0.0%) | 25 (5.2%) |
| 35 to 64 Years | 42 (10.1%) | 52 (13.9%) |
| 65 to 74 Years | 3 (4.5%) | 63 (42.9%) |
| 75 Years and over | 6 (20.0%) | 9 (15.5%) |
Disability Class: Ambulatory Difficulty
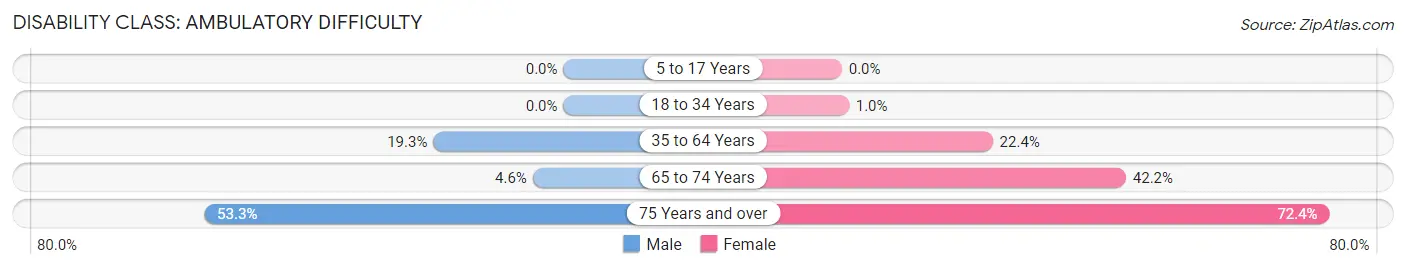
| Age Bracket | Male | Female |
| 5 to 17 Years | 0 (0.0%) | 0 (0.0%) |
| 18 to 34 Years | 0 (0.0%) | 5 (1.0%) |
| 35 to 64 Years | 80 (19.3%) | 84 (22.4%) |
| 65 to 74 Years | 3 (4.5%) | 62 (42.2%) |
| 75 Years and over | 16 (53.3%) | 42 (72.4%) |
Disability Class: Self-Care Difficulty
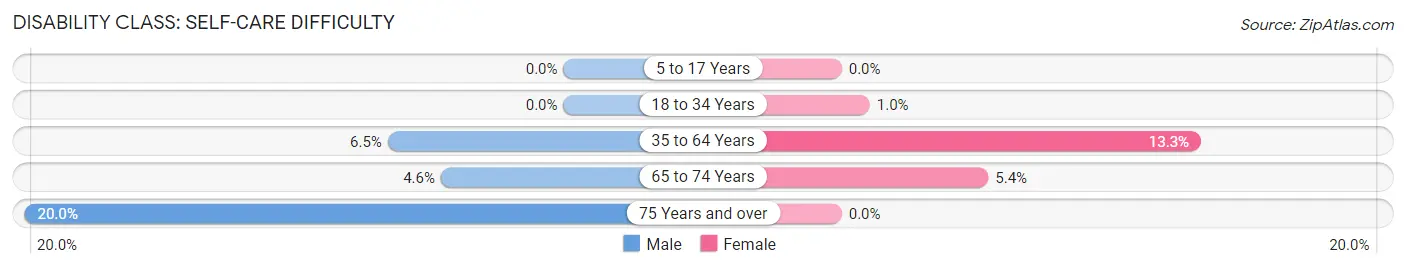
| Age Bracket | Male | Female |
| 5 to 17 Years | 0 (0.0%) | 0 (0.0%) |
| 18 to 34 Years | 0 (0.0%) | 5 (1.0%) |
| 35 to 64 Years | 27 (6.5%) | 50 (13.3%) |
| 65 to 74 Years | 3 (4.5%) | 8 (5.4%) |
| 75 Years and over | 6 (20.0%) | 0 (0.0%) |
Technology Access in Summit
Computing Device Access in Summit
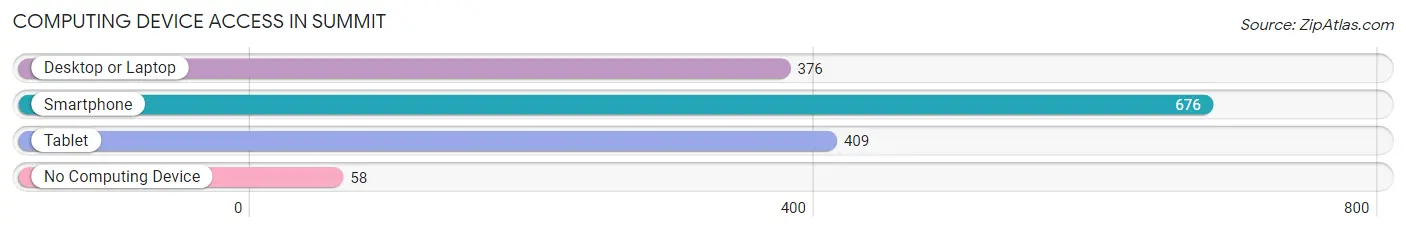
| Device Type | # Households | % Households |
| Desktop or Laptop | 376 | 48.3% |
| Smartphone | 676 | 86.8% |
| Tablet | 409 | 52.5% |
| No Computing Device | 58 | 7.4% |
| Total | 779 | 100.0% |
Internet Access in Summit
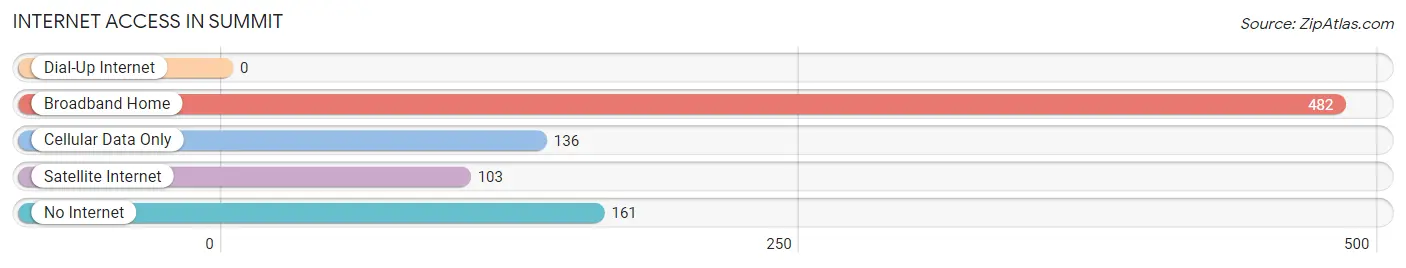
| Internet Type | # Households | % Households |
| Dial-Up Internet | 0 | 0.0% |
| Broadband Home | 482 | 61.9% |
| Cellular Data Only | 136 | 17.5% |
| Satellite Internet | 103 | 13.2% |
| No Internet | 161 | 20.7% |
| Total | 779 | 100.0% |
Summit Summary
Summit is a small town located in the state of Mississippi, in the United States of America. It is situated in the southwestern part of the state, in the county of Pike. The town has a population of approximately 1,500 people, according to the 2010 census.
History
The town of Summit was founded in 1837, when the first settlers arrived in the area. The town was originally known as “Summit Station”, due to its location at the highest point of the railroad line that ran through the area. The town was officially incorporated in 1845, and the name was changed to “Summit”.
The town was an important stop on the railroad line, and it was also a major trading center for the surrounding area. The town was also home to a number of businesses, including a sawmill, a gristmill, and a cotton gin.
In the late 19th century, the town began to decline in population, as the railroad line was rerouted and the businesses began to close. The town was also affected by the Great Depression, and the population continued to decline until the 1950s.
In the 1950s, the town began to experience a resurgence, as new businesses began to open and the population began to increase. The town has continued to grow since then, and it is now home to a number of businesses, including a grocery store, a hardware store, and a number of restaurants.
Geography
Summit is located in the southwestern part of the state of Mississippi, in the county of Pike. The town is situated at the intersection of two major highways, US Highway 98 and Mississippi Highway 24. The town is located at an elevation of approximately 500 feet above sea level.
The town is surrounded by a number of small towns and villages, including Osyka, Magnolia, and McComb. The town is also located near the Pearl River, which is a major tributary of the Mississippi River.
Economy
The economy of Summit is largely based on agriculture and tourism. The town is home to a number of farms, which produce a variety of crops, including corn, soybeans, cotton, and hay. The town is also home to a number of tourist attractions, including the Summit Museum, which is dedicated to the history of the town.
The town is also home to a number of businesses, including a grocery store, a hardware store, and a number of restaurants. The town is also home to a number of manufacturing companies, which produce a variety of products, including furniture, clothing, and electronics.
Demographics
According to the 2010 census, the population of Summit was 1,500 people. The town has a population that is predominantly white, with approximately 90% of the population being white. The town also has a small African American population, with approximately 5% of the population being African American. The town also has a small Hispanic population, with approximately 2% of the population being Hispanic. The town also has a small Asian population, with approximately 1% of the population being Asian.
Common Questions
What is Per Capita Income in Summit?
Per Capita income in Summit is $15,062.
What is the Median Family Income in Summit?
Median Family Income in Summit is $36,696.
What is the Median Household income in Summit?
Median Household Income in Summit is $33,340.
What is Income or Wage Gap in Summit?
Income or Wage Gap in Summit is 29.2%.
Women in Summit earn 70.8 cents for every dollar earned by a man.
What is Inequality or Gini Index in Summit?
Inequality or Gini Index in Summit is 0.44.
What is the Total Population of Summit?
Total Population of Summit is 2,774.
What is the Total Male Population of Summit?
Total Male Population of Summit is 1,258.
What is the Total Female Population of Summit?
Total Female Population of Summit is 1,516.
What is the Ratio of Males per 100 Females in Summit?
There are 82.98 Males per 100 Females in Summit.
What is the Ratio of Females per 100 Males in Summit?
There are 120.51 Females per 100 Males in Summit.
What is the Median Population Age in Summit?
Median Population Age in Summit is 27.1 Years.
What is the Average Family Size in Summit
Average Family Size in Summit is 4.9 People.
What is the Average Household Size in Summit
Average Household Size in Summit is 3.6 People.
How Large is the Labor Force in Summit?
There are 1,081 People in the Labor Forcein in Summit.
What is the Percentage of People in the Labor Force in Summit?
58.7% of People are in the Labor Force in Summit.
What is the Unemployment Rate in Summit?
Unemployment Rate in Summit is 9.2%.