Shubuta, MS Map & Demographics
Shubuta Map
Shubuta Overview
$19,218
PER CAPITA INCOME
$50,063
AVG FAMILY INCOME
$32,159
AVG HOUSEHOLD INCOME
32.1%
WAGE / INCOME GAP [ % ]
67.9¢/ $1
WAGE / INCOME GAP [ $ ]
0.33
INEQUALITY / GINI INDEX
414
TOTAL POPULATION
176
MALE POPULATION
238
FEMALE POPULATION
73.95
MALES / 100 FEMALES
135.23
FEMALES / 100 MALES
44.4
MEDIAN AGE
3.5
AVG FAMILY SIZE
2.8
AVG HOUSEHOLD SIZE
165
LABOR FORCE [ PEOPLE ]
48.2%
PERCENT IN LABOR FORCE
11.5%
UNEMPLOYMENT RATE
Shubuta Zip Codes
Shubuta Area Codes
Income in Shubuta
Income Overview in Shubuta
Per Capita Income in Shubuta is $19,218, while median incomes of families and households are $50,063 and $32,159 respectively.
| Characteristic | Number | Measure |
| Per Capita Income | 414 | $19,218 |
| Median Family Income | 101 | $50,063 |
| Mean Family Income | 101 | $50,800 |
| Median Household Income | 149 | $32,159 |
| Mean Household Income | 149 | $44,826 |
| Income Deficit | 101 | $0 |
| Wage / Income Gap (%) | 414 | 32.14% |
| Wage / Income Gap ($) | 414 | 67.86¢ per $1 |
| Gini / Inequality Index | 414 | 0.33 |
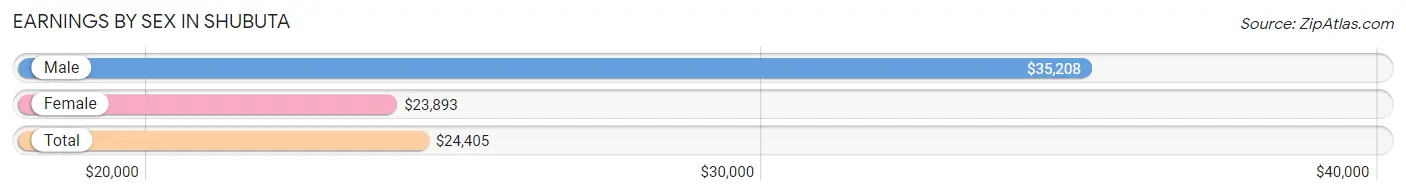
Earnings by Sex in Shubuta
Average Earnings in Shubuta are $24,405, $35,208 for men and $23,893 for women, a difference of 32.1%.
| Sex | Number | Average Earnings |
| Male | 79 (47.6%) | $35,208 |
| Female | 87 (52.4%) | $23,893 |
| Total | 166 (100.0%) | $24,405 |
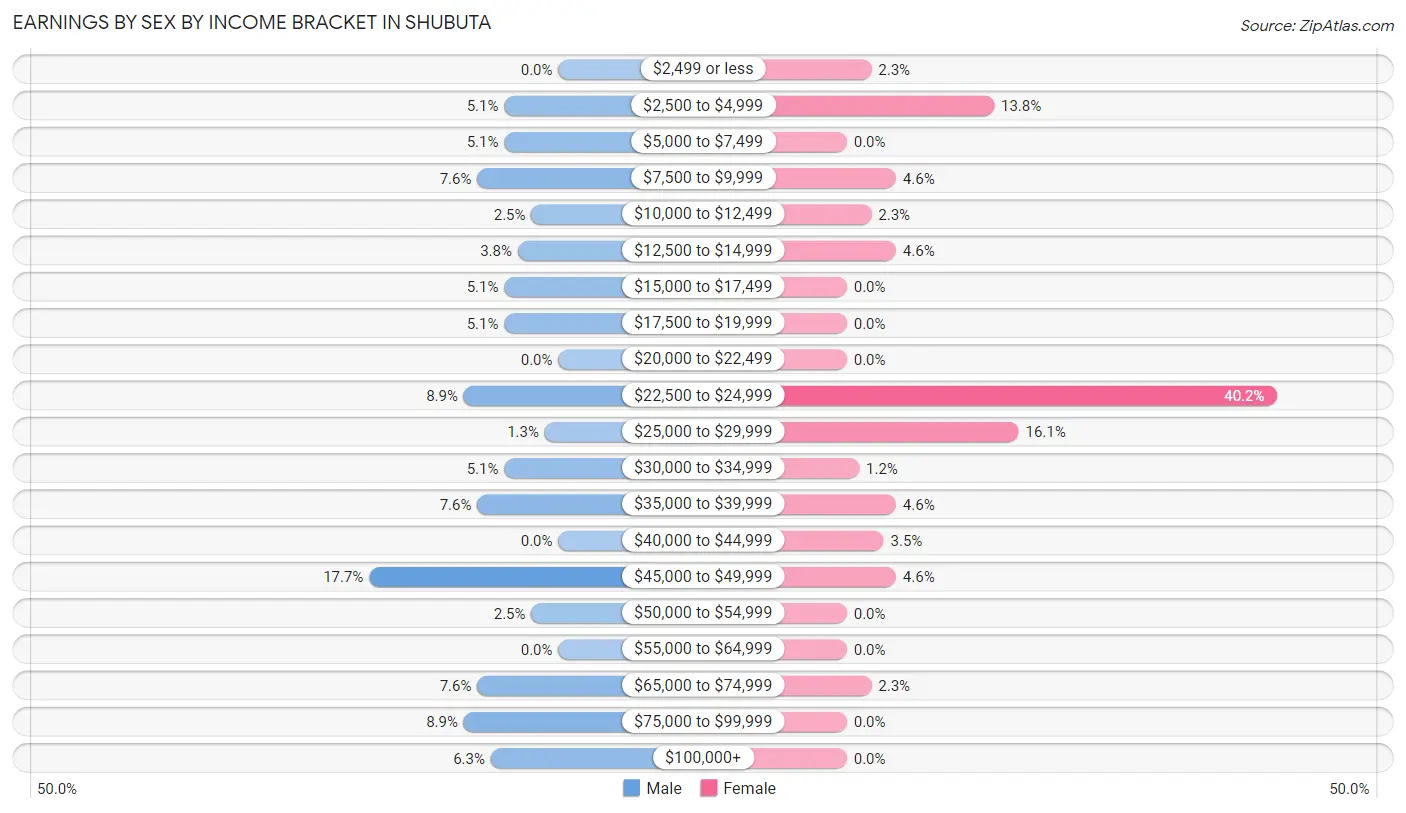
Earnings by Sex by Income Bracket in Shubuta
The most common earnings brackets in Shubuta are $45,000 to $49,999 for men (14 | 17.7%) and $22,500 to $24,999 for women (35 | 40.2%).
| Income | Male | Female |
| $2,499 or less | 0 (0.0%) | 2 (2.3%) |
| $2,500 to $4,999 | 4 (5.1%) | 12 (13.8%) |
| $5,000 to $7,499 | 4 (5.1%) | 0 (0.0%) |
| $7,500 to $9,999 | 6 (7.6%) | 4 (4.6%) |
| $10,000 to $12,499 | 2 (2.5%) | 2 (2.3%) |
| $12,500 to $14,999 | 3 (3.8%) | 4 (4.6%) |
| $15,000 to $17,499 | 4 (5.1%) | 0 (0.0%) |
| $17,500 to $19,999 | 4 (5.1%) | 0 (0.0%) |
| $20,000 to $22,499 | 0 (0.0%) | 0 (0.0%) |
| $22,500 to $24,999 | 7 (8.9%) | 35 (40.2%) |
| $25,000 to $29,999 | 1 (1.3%) | 14 (16.1%) |
| $30,000 to $34,999 | 4 (5.1%) | 1 (1.1%) |
| $35,000 to $39,999 | 6 (7.6%) | 4 (4.6%) |
| $40,000 to $44,999 | 0 (0.0%) | 3 (3.5%) |
| $45,000 to $49,999 | 14 (17.7%) | 4 (4.6%) |
| $50,000 to $54,999 | 2 (2.5%) | 0 (0.0%) |
| $55,000 to $64,999 | 0 (0.0%) | 0 (0.0%) |
| $65,000 to $74,999 | 6 (7.6%) | 2 (2.3%) |
| $75,000 to $99,999 | 7 (8.9%) | 0 (0.0%) |
| $100,000+ | 5 (6.3%) | 0 (0.0%) |
| Total | 79 (100.0%) | 87 (100.0%) |
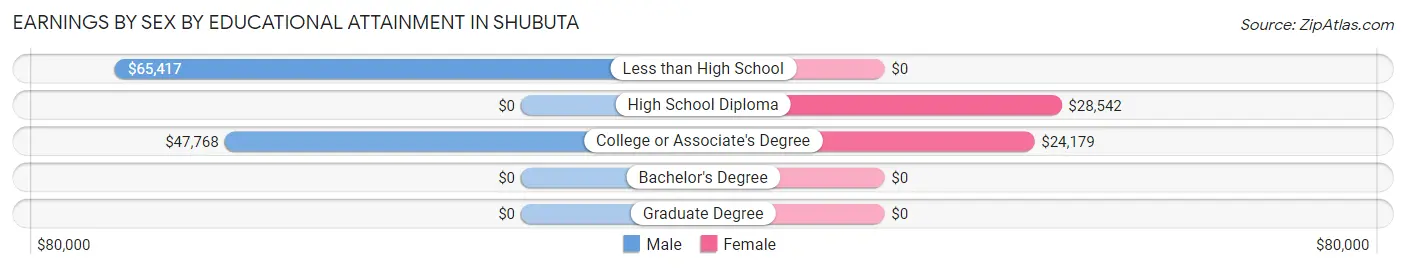
Earnings by Sex by Educational Attainment in Shubuta
Average earnings in Shubuta are $36,875 for men and $24,214 for women, a difference of 34.3%. Men with an educational attainment of less than high school enjoy the highest average annual earnings of $65,417, while those with college or associate's degree education earn the least with $47,768. Women with an educational attainment of high school diploma earn the most with the average annual earnings of $28,542, while those with college or associate's degree education have the smallest earnings of $24,179.
| Educational Attainment | Male Income | Female Income |
| Less than High School | $65,417 | $0 |
| High School Diploma | - | - |
| College or Associate's Degree | $47,768 | $24,179 |
| Bachelor's Degree | - | - |
| Graduate Degree | - | - |
| Total | $36,875 | $24,214 |
Family Income in Shubuta
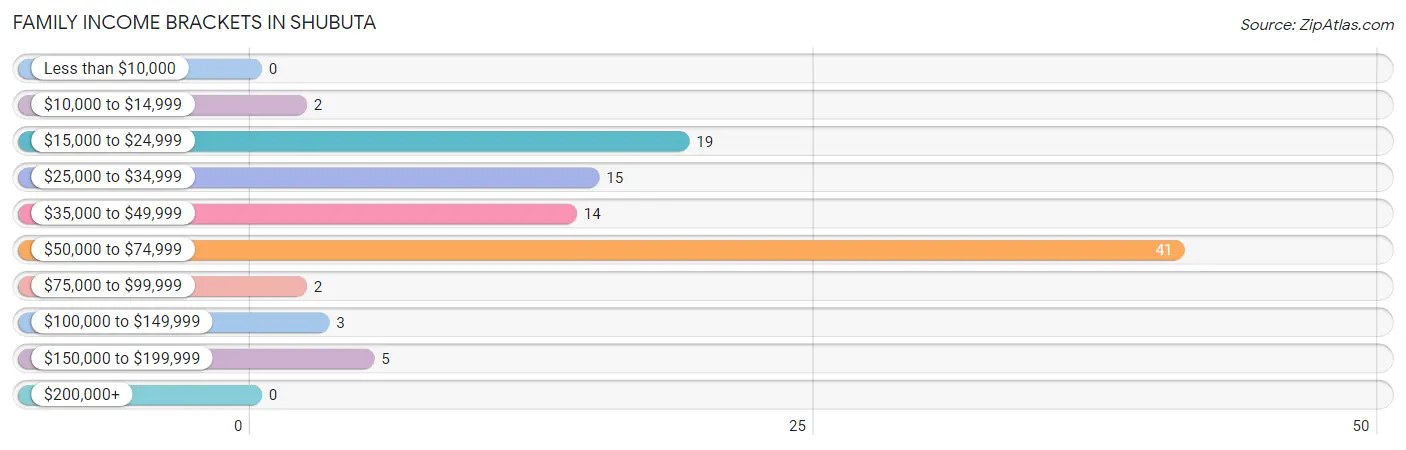
Family Income Brackets in Shubuta
According to the Shubuta family income data, there are 41 families falling into the $50,000 to $74,999 income range, which is the most common income bracket and makes up 40.6% of all families.
| Income Bracket | # Families | % Families |
| Less than $10,000 | 0 | 0.0% |
| $10,000 to $14,999 | 2 | 2.0% |
| $15,000 to $24,999 | 19 | 18.8% |
| $25,000 to $34,999 | 15 | 14.9% |
| $35,000 to $49,999 | 14 | 13.9% |
| $50,000 to $74,999 | 41 | 40.6% |
| $75,000 to $99,999 | 2 | 2.0% |
| $100,000 to $149,999 | 3 | 3.0% |
| $150,000 to $199,999 | 5 | 5.0% |
| $200,000+ | 0 | 0.0% |
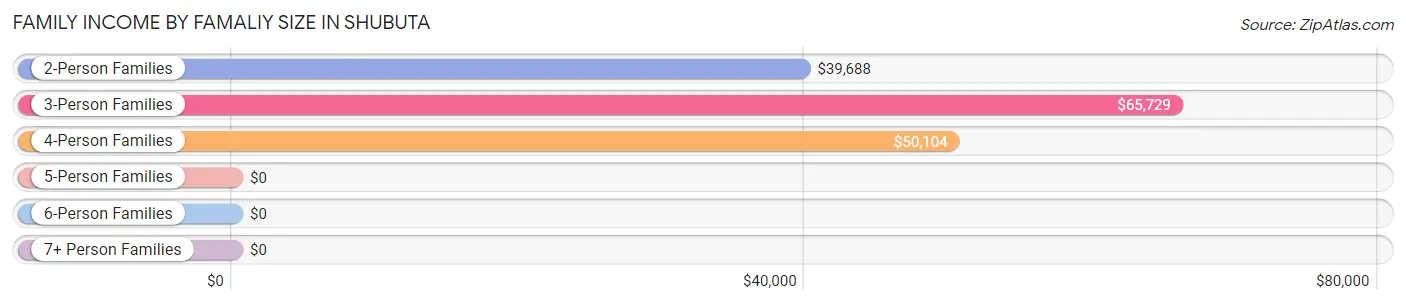
Family Income by Famaliy Size in Shubuta
3-person families (37 | 36.6%) account for the highest median family income in Shubuta with $65,729 per family, while 3-person families (37 | 36.6%) have the highest median income of $21,910 per family member.
| Income Bracket | # Families | Median Income |
| 2-Person Families | 39 (38.6%) | $39,688 |
| 3-Person Families | 37 (36.6%) | $65,729 |
| 4-Person Families | 23 (22.8%) | $50,104 |
| 5-Person Families | 0 (0.0%) | $0 |
| 6-Person Families | 0 (0.0%) | $0 |
| 7+ Person Families | 2 (2.0%) | $0 |
| Total | 101 (100.0%) | $50,063 |
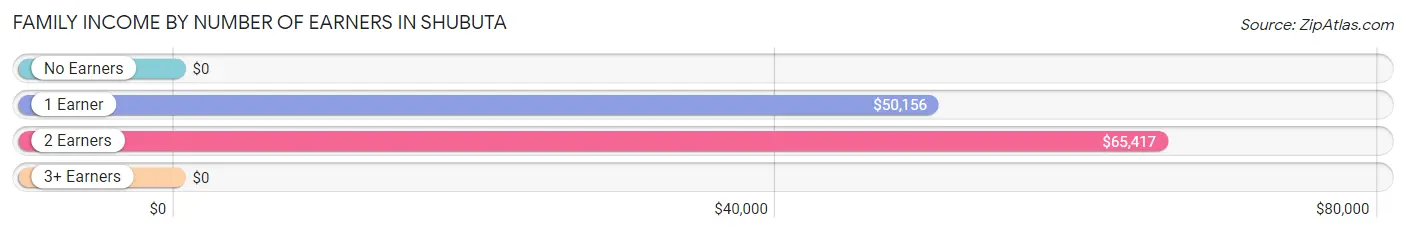
Family Income by Number of Earners in Shubuta
| Number of Earners | # Families | Median Income |
| No Earners | 19 (18.8%) | $0 |
| 1 Earner | 58 (57.4%) | $50,156 |
| 2 Earners | 24 (23.8%) | $65,417 |
| 3+ Earners | 0 (0.0%) | $0 |
| Total | 101 (100.0%) | $50,063 |
Household Income in Shubuta
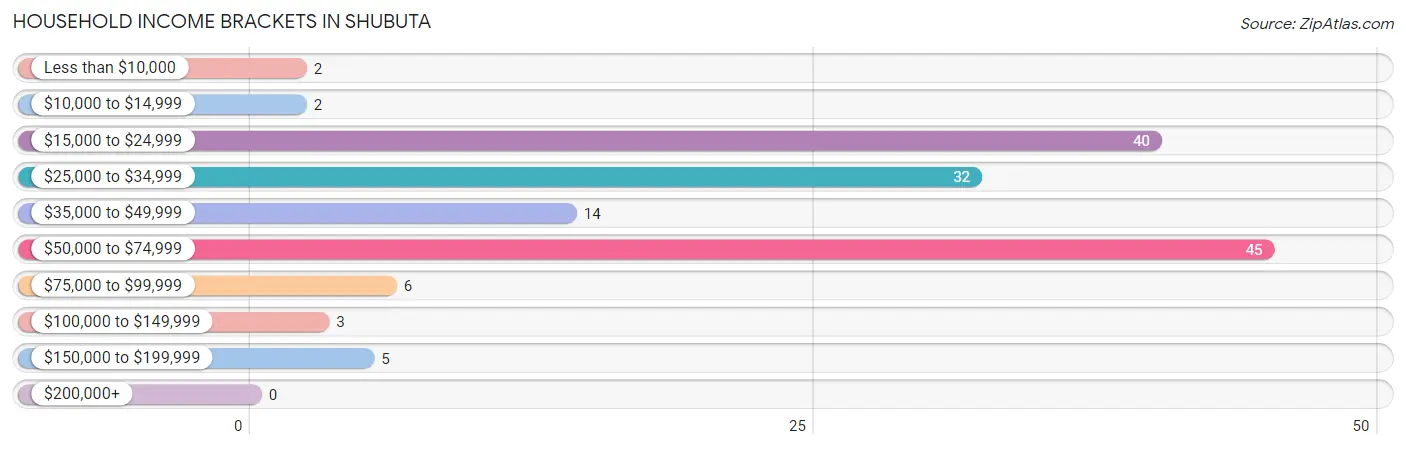
Household Income Brackets in Shubuta
With 45 households falling in the category, the $50,000 to $74,999 income range is the most frequent in Shubuta, accounting for 30.2% of all households.
| Income Bracket | # Households | % Households |
| Less than $10,000 | 2 | 1.3% |
| $10,000 to $14,999 | 2 | 1.3% |
| $15,000 to $24,999 | 40 | 26.8% |
| $25,000 to $34,999 | 32 | 21.5% |
| $35,000 to $49,999 | 14 | 9.4% |
| $50,000 to $74,999 | 45 | 30.2% |
| $75,000 to $99,999 | 6 | 4.0% |
| $100,000 to $149,999 | 3 | 2.0% |
| $150,000 to $199,999 | 5 | 3.4% |
| $200,000+ | 0 | 0.0% |
Household Income by Householder Age in Shubuta
The median household income in Shubuta is $32,159, with the highest median household income of $51,250 found in the 25 to 44 years age bracket for the primary householder. A total of 31 households (20.8%) fall into this category.
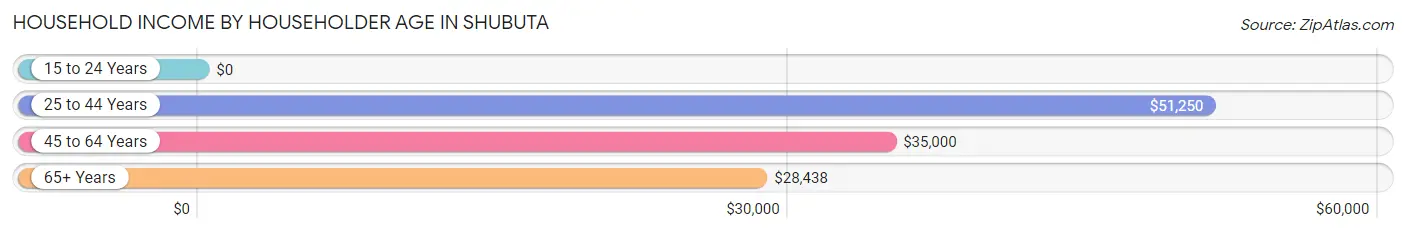
| Income Bracket | # Households | Median Income |
| 15 to 24 Years | 0 (0.0%) | $0 |
| 25 to 44 Years | 31 (20.8%) | $51,250 |
| 45 to 64 Years | 58 (38.9%) | $35,000 |
| 65+ Years | 60 (40.3%) | $28,438 |
| Total | 149 (100.0%) | $32,159 |
Poverty in Shubuta
Income Below Poverty by Sex and Age in Shubuta
With 13.6% poverty level for males and 21.0% for females among the residents of Shubuta, 6 to 11 year old males and under 5 year old females are the most vulnerable to poverty, with 11 males (100.0%) and 17 females (100.0%) in their respective age groups living below the poverty level.
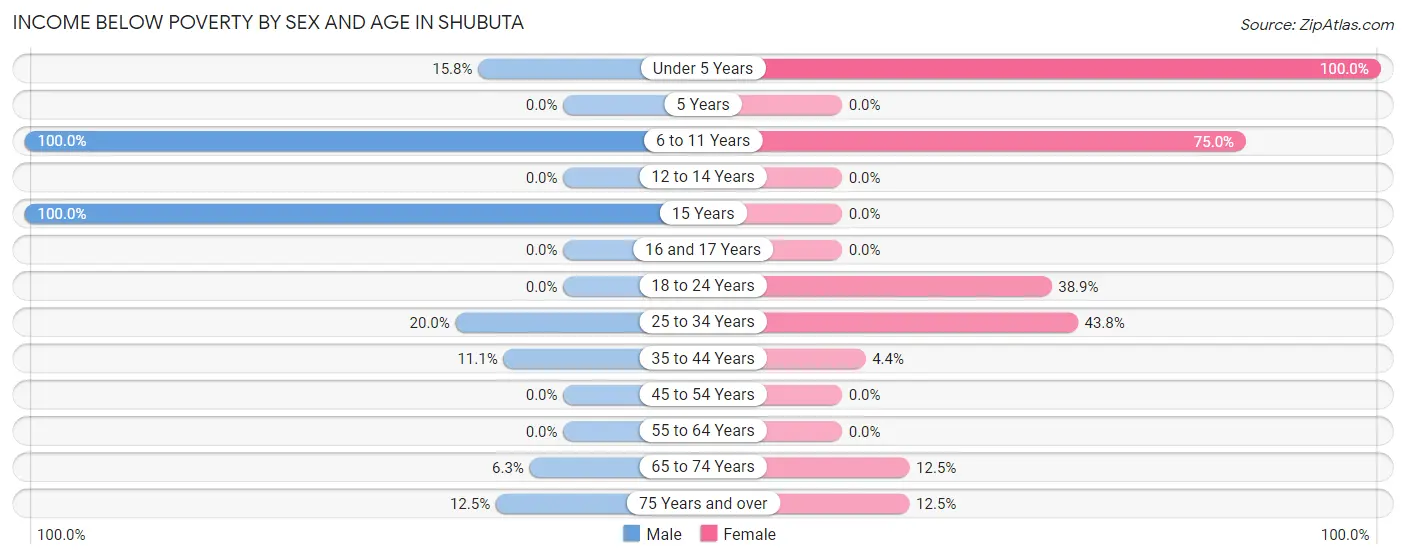
| Age Bracket | Male | Female |
| Under 5 Years | 3 (15.8%) | 17 (100.0%) |
| 5 Years | 0 (0.0%) | 0 (0.0%) |
| 6 to 11 Years | 11 (100.0%) | 3 (75.0%) |
| 12 to 14 Years | 0 (0.0%) | 0 (0.0%) |
| 15 Years | 1 (100.0%) | 0 (0.0%) |
| 16 and 17 Years | 0 (0.0%) | 0 (0.0%) |
| 18 to 24 Years | 0 (0.0%) | 14 (38.9%) |
| 25 to 34 Years | 4 (20.0%) | 7 (43.8%) |
| 35 to 44 Years | 2 (11.1%) | 2 (4.3%) |
| 45 to 54 Years | 0 (0.0%) | 0 (0.0%) |
| 55 to 64 Years | 0 (0.0%) | 0 (0.0%) |
| 65 to 74 Years | 2 (6.2%) | 5 (12.5%) |
| 75 Years and over | 1 (12.5%) | 2 (12.5%) |
| Total | 24 (13.6%) | 50 (21.0%) |
Income Above Poverty by Sex and Age in Shubuta
According to the poverty statistics in Shubuta, males aged 5 years and females aged 12 to 14 years are the age groups that are most secure financially, with 100.0% of males and 100.0% of females in these age groups living above the poverty line.
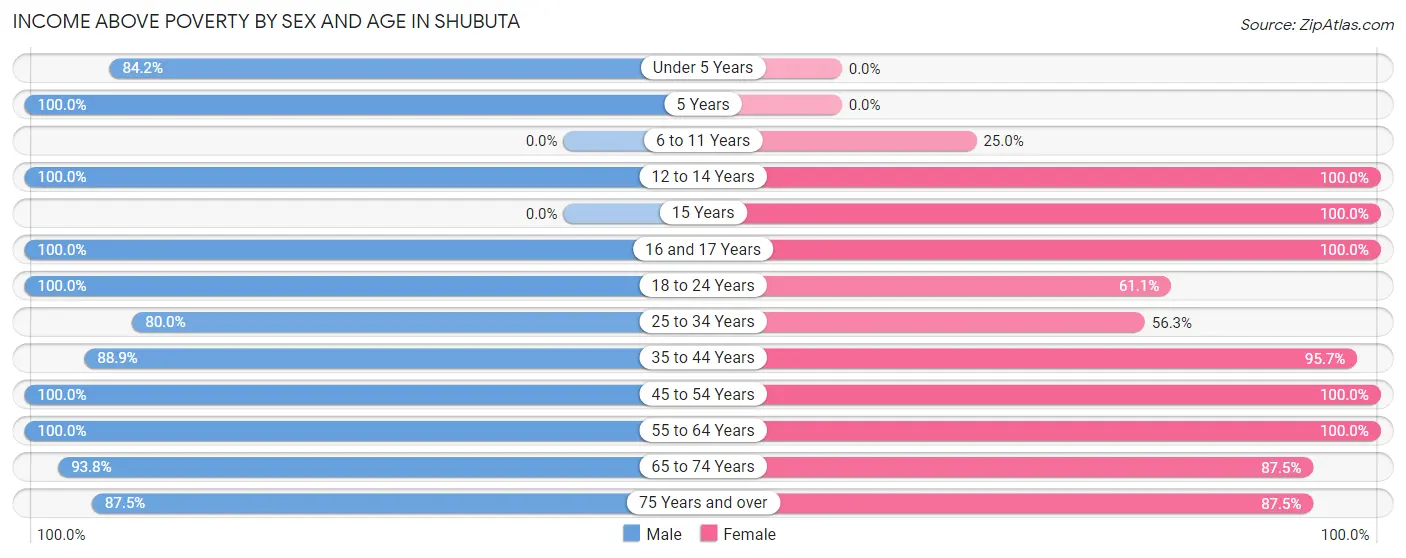
| Age Bracket | Male | Female |
| Under 5 Years | 16 (84.2%) | 0 (0.0%) |
| 5 Years | 4 (100.0%) | 0 (0.0%) |
| 6 to 11 Years | 0 (0.0%) | 1 (25.0%) |
| 12 to 14 Years | 5 (100.0%) | 1 (100.0%) |
| 15 Years | 0 (0.0%) | 10 (100.0%) |
| 16 and 17 Years | 6 (100.0%) | 4 (100.0%) |
| 18 to 24 Years | 7 (100.0%) | 22 (61.1%) |
| 25 to 34 Years | 16 (80.0%) | 9 (56.2%) |
| 35 to 44 Years | 16 (88.9%) | 44 (95.7%) |
| 45 to 54 Years | 31 (100.0%) | 15 (100.0%) |
| 55 to 64 Years | 14 (100.0%) | 33 (100.0%) |
| 65 to 74 Years | 30 (93.8%) | 35 (87.5%) |
| 75 Years and over | 7 (87.5%) | 14 (87.5%) |
| Total | 152 (86.4%) | 188 (79.0%) |
Income Below Poverty Among Married-Couple Families in Shubuta
The poverty statistics for married-couple families in Shubuta show that 12.2% or 6 of the total 49 families live below the poverty line. Families with 5 or more children have the highest poverty rate of 100.0%, comprising of 2 families. On the other hand, families with no children have the lowest poverty rate of 0.0%, which includes 0 families.
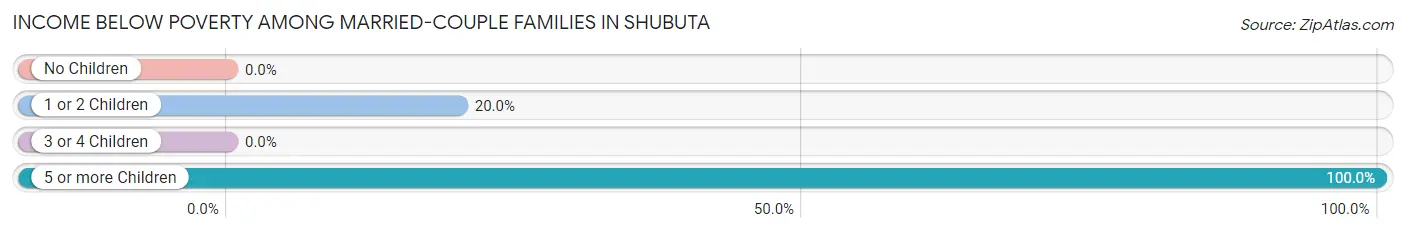
| Children | Above Poverty | Below Poverty |
| No Children | 27 (100.0%) | 0 (0.0%) |
| 1 or 2 Children | 16 (80.0%) | 4 (20.0%) |
| 3 or 4 Children | 0 (0.0%) | 0 (0.0%) |
| 5 or more Children | 0 (0.0%) | 2 (100.0%) |
| Total | 43 (87.8%) | 6 (12.2%) |
Income Below Poverty Among Single-Parent Households in Shubuta
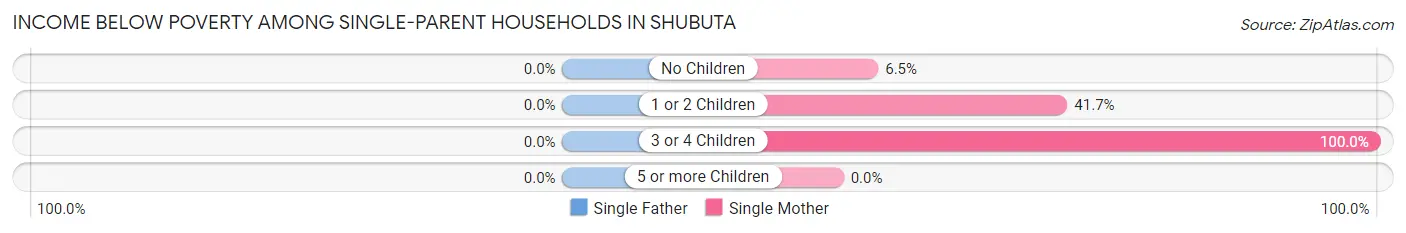
| Children | Single Father | Single Mother |
| No Children | 0 (0.0%) | 2 (6.5%) |
| 1 or 2 Children | 0 (0.0%) | 5 (41.7%) |
| 3 or 4 Children | 0 (0.0%) | 3 (100.0%) |
| 5 or more Children | 0 (0.0%) | 0 (0.0%) |
| Total | 0 (0.0%) | 10 (21.7%) |
Income Below Poverty Among Married-Couple vs Single-Parent Households in Shubuta
The poverty data for Shubuta shows that 6 of the married-couple family households (12.2%) and 10 of the single-parent households (19.2%) are living below the poverty level. Within the married-couple family households, those with 5 or more children have the highest poverty rate, with 2 households (100.0%) falling below the poverty line. Among the single-parent households, those with 3 or 4 children have the highest poverty rate, with 3 household (100.0%) living below poverty.
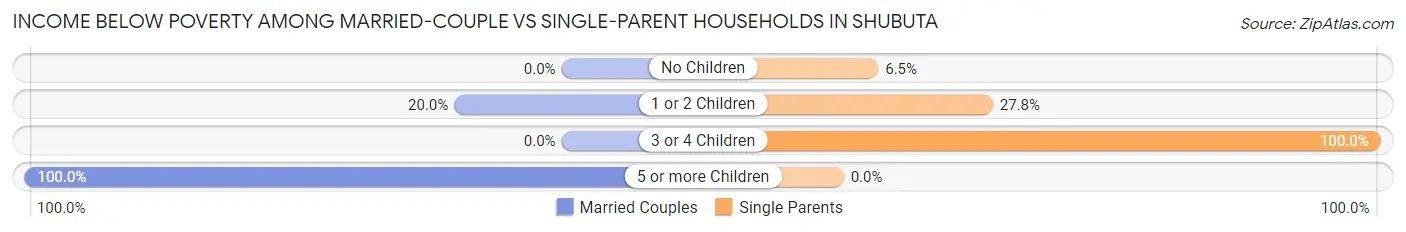
| Children | Married-Couple Families | Single-Parent Households |
| No Children | 0 (0.0%) | 2 (6.5%) |
| 1 or 2 Children | 4 (20.0%) | 5 (27.8%) |
| 3 or 4 Children | 0 (0.0%) | 3 (100.0%) |
| 5 or more Children | 2 (100.0%) | 0 (0.0%) |
| Total | 6 (12.2%) | 10 (19.2%) |
Race in Shubuta
The most populous races in Shubuta are Black / African American (317 | 76.6%), White / Caucasian (94 | 22.7%), and Hispanic or Latino (5 | 1.2%).
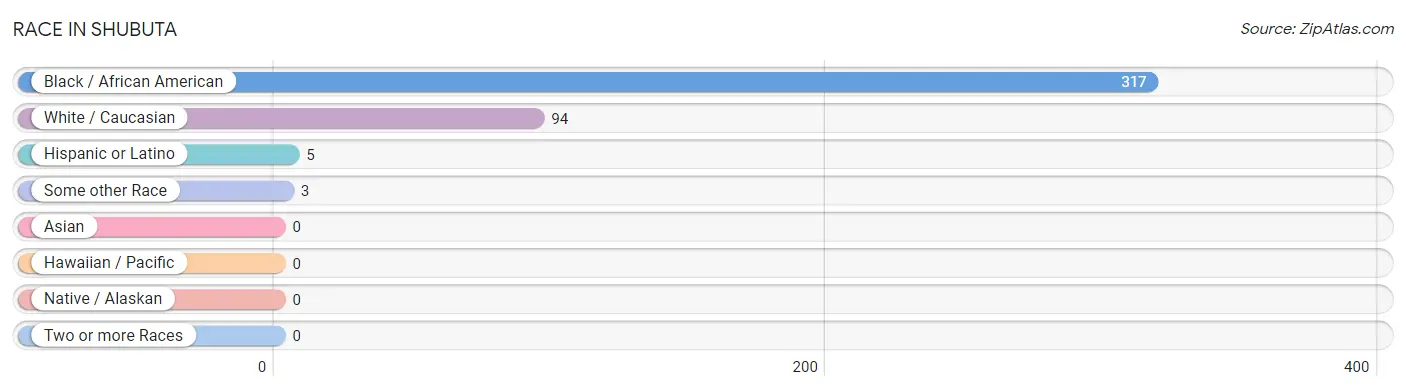
| Race | # Population | % Population |
| Asian | 0 | 0.0% |
| Black / African American | 317 | 76.6% |
| Hawaiian / Pacific | 0 | 0.0% |
| Hispanic or Latino | 5 | 1.2% |
| Native / Alaskan | 0 | 0.0% |
| White / Caucasian | 94 | 22.7% |
| Two or more Races | 0 | 0.0% |
| Some other Race | 3 | 0.7% |
| Total | 414 | 100.0% |
Ancestry in Shubuta
The most populous ancestries reported in Shubuta are English (43 | 10.4%), Irish (11 | 2.7%), Mexican (5 | 1.2%), European (2 | 0.5%), and French (1 | 0.2%), together accounting for 15.0% of all Shubuta residents.
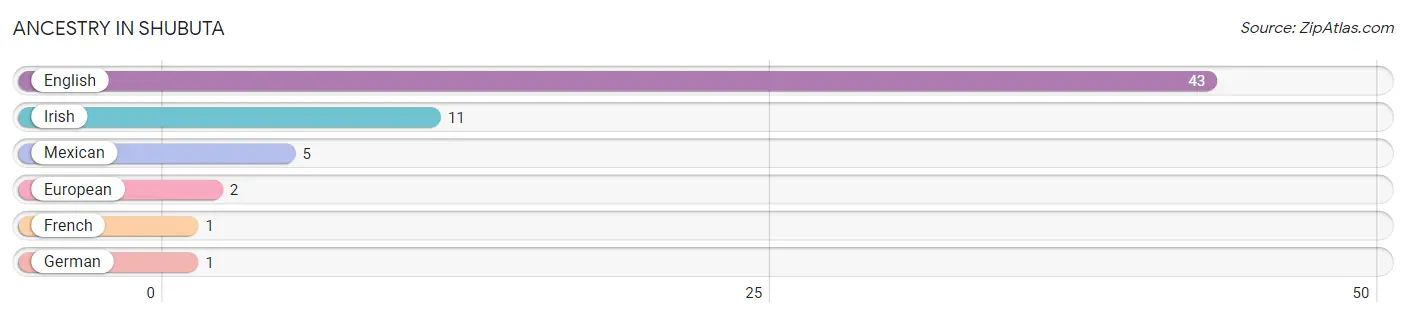
| Ancestry | # Population | % Population |
| English | 43 | 10.4% |
| European | 2 | 0.5% |
| French | 1 | 0.2% |
| German | 1 | 0.2% |
| Irish | 11 | 2.7% |
| Mexican | 5 | 1.2% | View All 6 Rows |
Immigrants in Shubuta
The most numerous immigrant groups reported in Shubuta came from Central America (3 | 0.7%), Latin America (3 | 0.7%), and Mexico (3 | 0.7%), together accounting for 2.2% of all Shubuta residents.
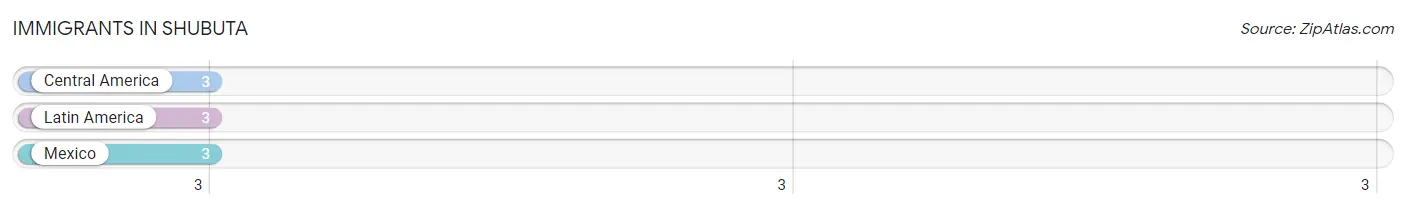
| Immigration Origin | # Population | % Population |
| Central America | 3 | 0.7% |
| Latin America | 3 | 0.7% |
| Mexico | 3 | 0.7% | View All 3 Rows |
Sex and Age in Shubuta
Sex and Age in Shubuta
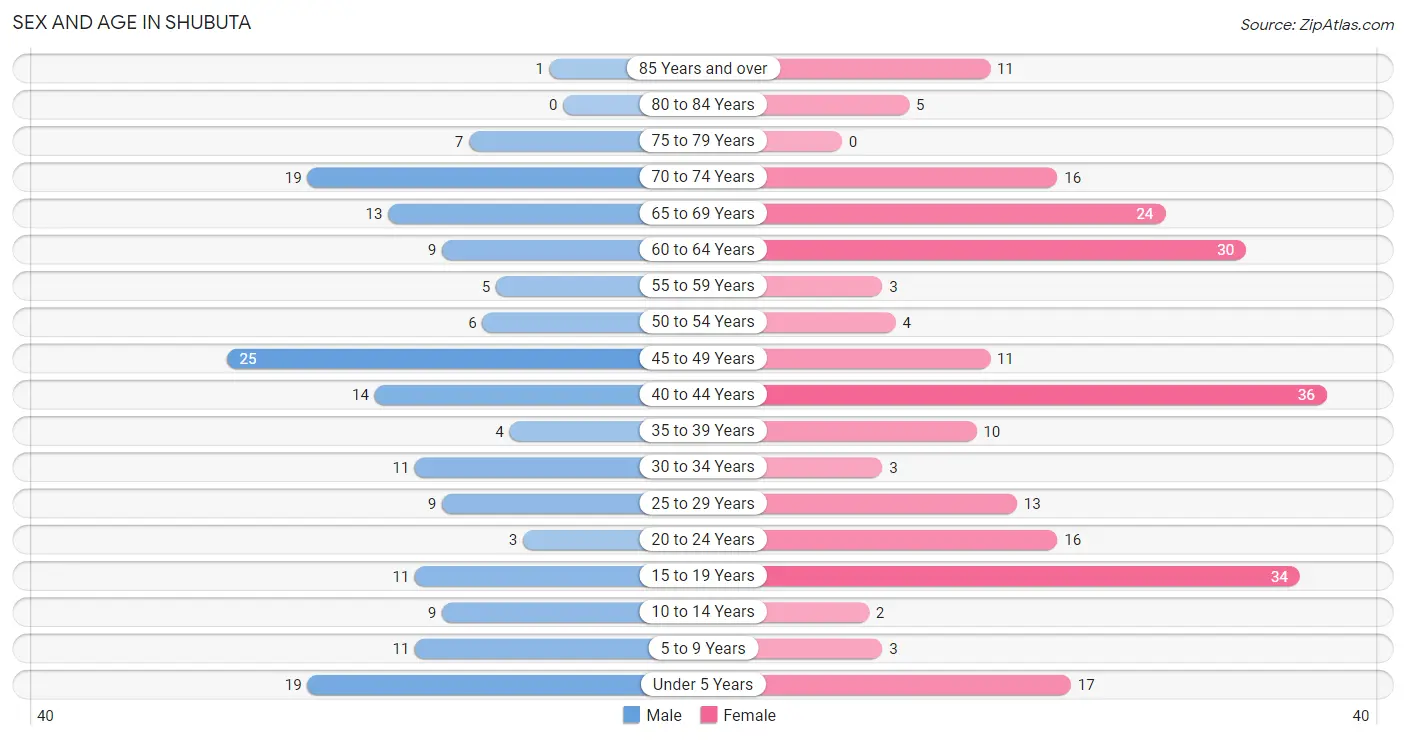
The most populous age groups in Shubuta are 45 to 49 Years (25 | 14.2%) for men and 40 to 44 Years (36 | 15.1%) for women.
| Age Bracket | Male | Female |
| Under 5 Years | 19 (10.8%) | 17 (7.1%) |
| 5 to 9 Years | 11 (6.2%) | 3 (1.3%) |
| 10 to 14 Years | 9 (5.1%) | 2 (0.8%) |
| 15 to 19 Years | 11 (6.2%) | 34 (14.3%) |
| 20 to 24 Years | 3 (1.7%) | 16 (6.7%) |
| 25 to 29 Years | 9 (5.1%) | 13 (5.5%) |
| 30 to 34 Years | 11 (6.2%) | 3 (1.3%) |
| 35 to 39 Years | 4 (2.3%) | 10 (4.2%) |
| 40 to 44 Years | 14 (8.0%) | 36 (15.1%) |
| 45 to 49 Years | 25 (14.2%) | 11 (4.6%) |
| 50 to 54 Years | 6 (3.4%) | 4 (1.7%) |
| 55 to 59 Years | 5 (2.8%) | 3 (1.3%) |
| 60 to 64 Years | 9 (5.1%) | 30 (12.6%) |
| 65 to 69 Years | 13 (7.4%) | 24 (10.1%) |
| 70 to 74 Years | 19 (10.8%) | 16 (6.7%) |
| 75 to 79 Years | 7 (4.0%) | 0 (0.0%) |
| 80 to 84 Years | 0 (0.0%) | 5 (2.1%) |
| 85 Years and over | 1 (0.6%) | 11 (4.6%) |
| Total | 176 (100.0%) | 238 (100.0%) |
Families and Households in Shubuta
Median Family Size in Shubuta
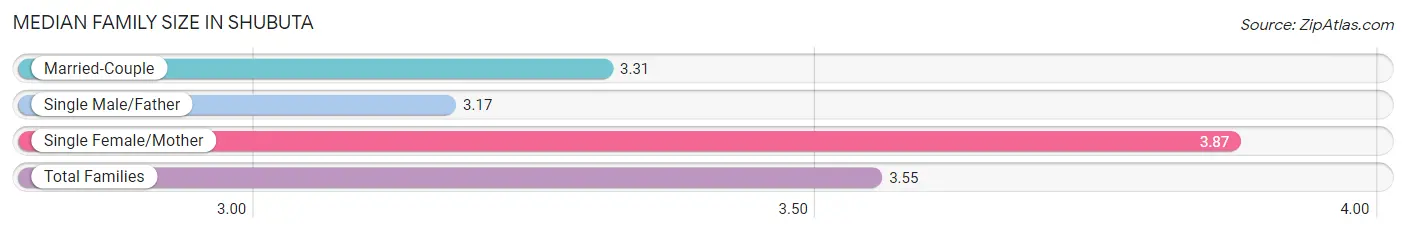
The median family size in Shubuta is 3.55 persons per family, with single female/mother families (46 | 45.5%) accounting for the largest median family size of 3.87 persons per family. On the other hand, single male/father families (6 | 5.9%) represent the smallest median family size with 3.17 persons per family.
| Family Type | # Families | Family Size |
| Married-Couple | 49 (48.5%) | 3.31 |
| Single Male/Father | 6 (5.9%) | 3.17 |
| Single Female/Mother | 46 (45.5%) | 3.87 |
| Total Families | 101 (100.0%) | 3.55 |
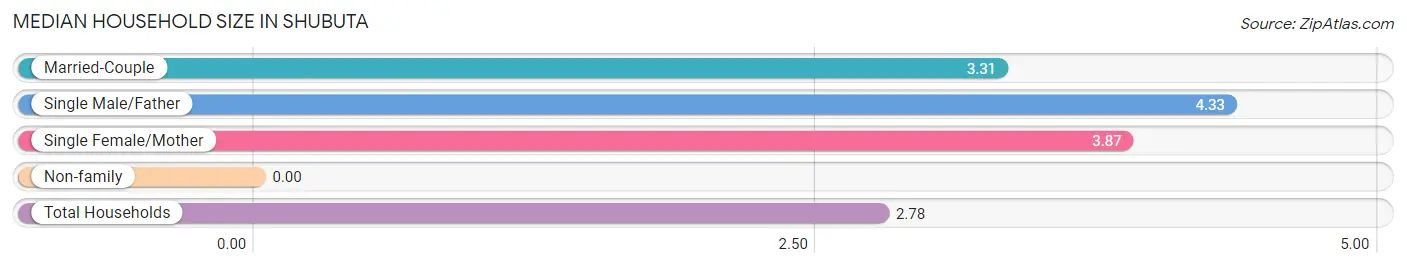
Median Household Size in Shubuta
| Household Type | # Households | Household Size |
| Married-Couple | 49 (32.9%) | 3.31 |
| Single Male/Father | 6 (4.0%) | 4.33 |
| Single Female/Mother | 46 (30.9%) | 3.87 |
| Non-family | 48 (32.2%) | - |
| Total Households | 149 (100.0%) | 2.78 |
Household Size by Marriage Status in Shubuta
Out of a total of 149 households in Shubuta, 101 (67.8%) are family households, while 48 (32.2%) are nonfamily households. The most numerous type of family households are 2-person households, comprising 39, and the most common type of nonfamily households are 1-person households, comprising 48.
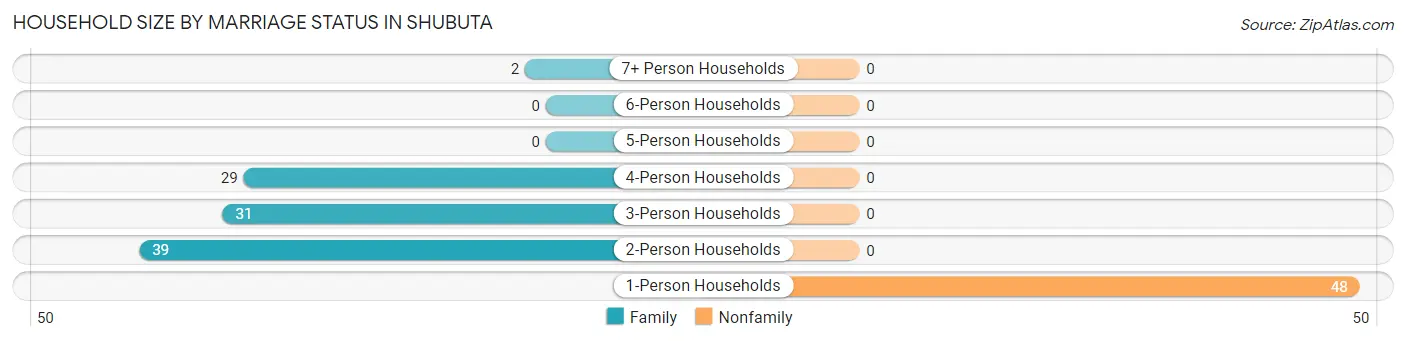
| Household Size | Family Households | Nonfamily Households |
| 1-Person Households | - | 48 (32.2%) |
| 2-Person Households | 39 (26.2%) | 0 (0.0%) |
| 3-Person Households | 31 (20.8%) | 0 (0.0%) |
| 4-Person Households | 29 (19.5%) | 0 (0.0%) |
| 5-Person Households | 0 (0.0%) | 0 (0.0%) |
| 6-Person Households | 0 (0.0%) | 0 (0.0%) |
| 7+ Person Households | 2 (1.3%) | 0 (0.0%) |
| Total | 101 (67.8%) | 48 (32.2%) |
Female Fertility in Shubuta
Fertility by Age in Shubuta
Average fertility rate in Shubuta is 55.0 births per 1,000 women. Women in the age bracket of 20 to 34 years have the highest fertility rate with 219.0 births per 1,000 women. Women in the age bracket of 20 to 34 years acount for 100.0% of all women with births.
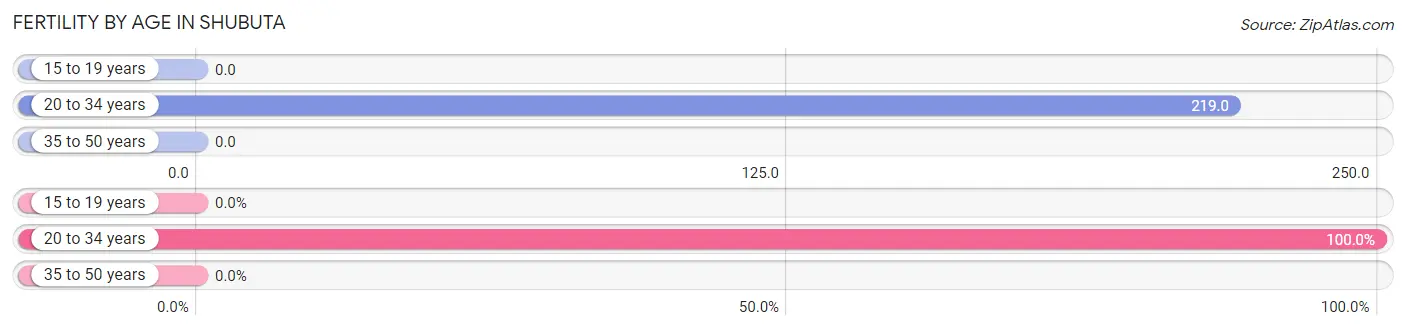
| Age Bracket | Women with Births | Births / 1,000 Women |
| 15 to 19 years | 0 (0.0%) | 0.0 |
| 20 to 34 years | 7 (100.0%) | 219.0 |
| 35 to 50 years | 0 (0.0%) | 0.0 |
| Total | 7 (100.0%) | 55.0 |
Fertility by Age by Marriage Status in Shubuta
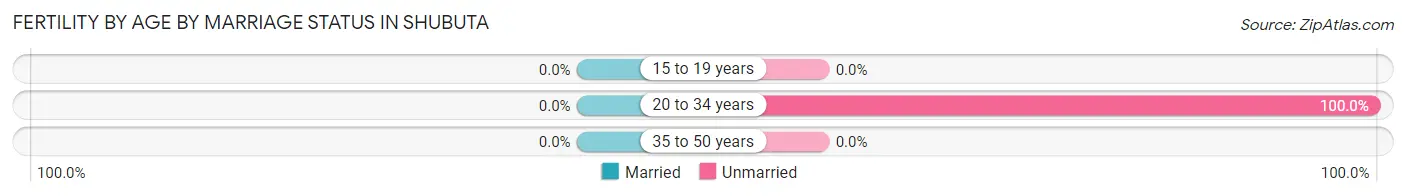
| Age Bracket | Married | Unmarried |
| 15 to 19 years | 0 (0.0%) | 0 (0.0%) |
| 20 to 34 years | 0 (0.0%) | 7 (100.0%) |
| 35 to 50 years | 0 (0.0%) | 0 (0.0%) |
| Total | 0 (0.0%) | 7 (100.0%) |
Fertility by Education in Shubuta
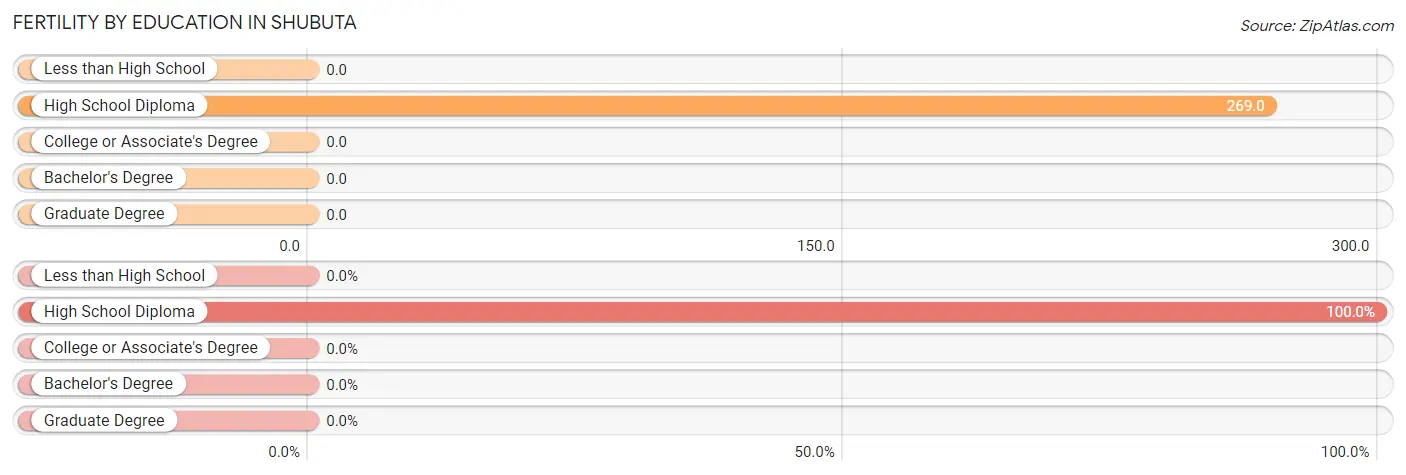
| Educational Attainment | Women with Births | Births / 1,000 Women |
| Less than High School | 0 (0.0%) | 0.0 |
| High School Diploma | 7 (100.0%) | 269.0 |
| College or Associate's Degree | 0 (0.0%) | 0.0 |
| Bachelor's Degree | 0 (0.0%) | 0.0 |
| Graduate Degree | 0 (0.0%) | 0.0 |
| Total | 7 (100.0%) | 55.0 |
Fertility by Education by Marriage Status in Shubuta
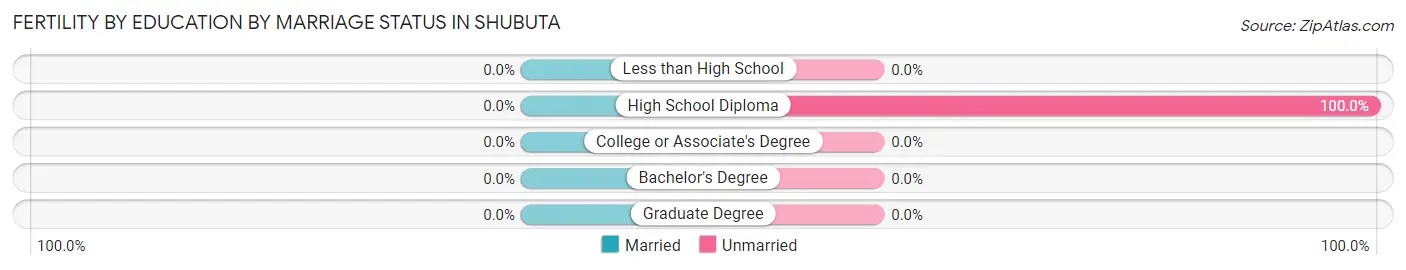
| Educational Attainment | Married | Unmarried |
| Less than High School | 0 (0.0%) | 0 (0.0%) |
| High School Diploma | 0 (0.0%) | 7 (100.0%) |
| College or Associate's Degree | 0 (0.0%) | 0 (0.0%) |
| Bachelor's Degree | 0 (0.0%) | 0 (0.0%) |
| Graduate Degree | 0 (0.0%) | 0 (0.0%) |
| Total | 0 (0.0%) | 7 (100.0%) |
Employment Characteristics in Shubuta
Employment by Class of Employer in Shubuta
Among the 114 employed individuals in Shubuta, private company employees (89 | 78.1%), self-employed (not incorporated) (13 | 11.4%), and state government employees (12 | 10.5%) make up the most common classes of employment.
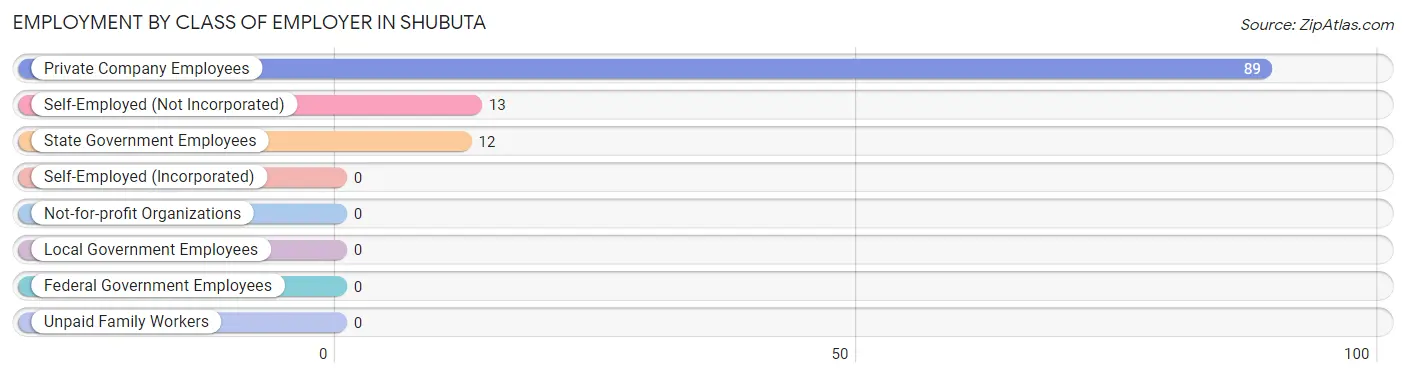
| Employer Class | # Employees | % Employees |
| Private Company Employees | 89 | 78.1% |
| Self-Employed (Incorporated) | 0 | 0.0% |
| Self-Employed (Not Incorporated) | 13 | 11.4% |
| Not-for-profit Organizations | 0 | 0.0% |
| Local Government Employees | 0 | 0.0% |
| State Government Employees | 12 | 10.5% |
| Federal Government Employees | 0 | 0.0% |
| Unpaid Family Workers | 0 | 0.0% |
| Total | 114 | 100.0% |
Employment Status by Age in Shubuta
According to the labor force statistics for Shubuta, out of the total population over 16 years of age (342), 48.2% or 165 individuals are in the labor force, with 11.5% or 19 of them unemployed. The age group with the highest labor force participation rate is 20 to 24 years, with 100.0% or 19 individuals in the labor force. Within the labor force, the 20 to 24 years age range has the highest percentage of unemployed individuals, with 36.8% or 7 of them being unemployed.
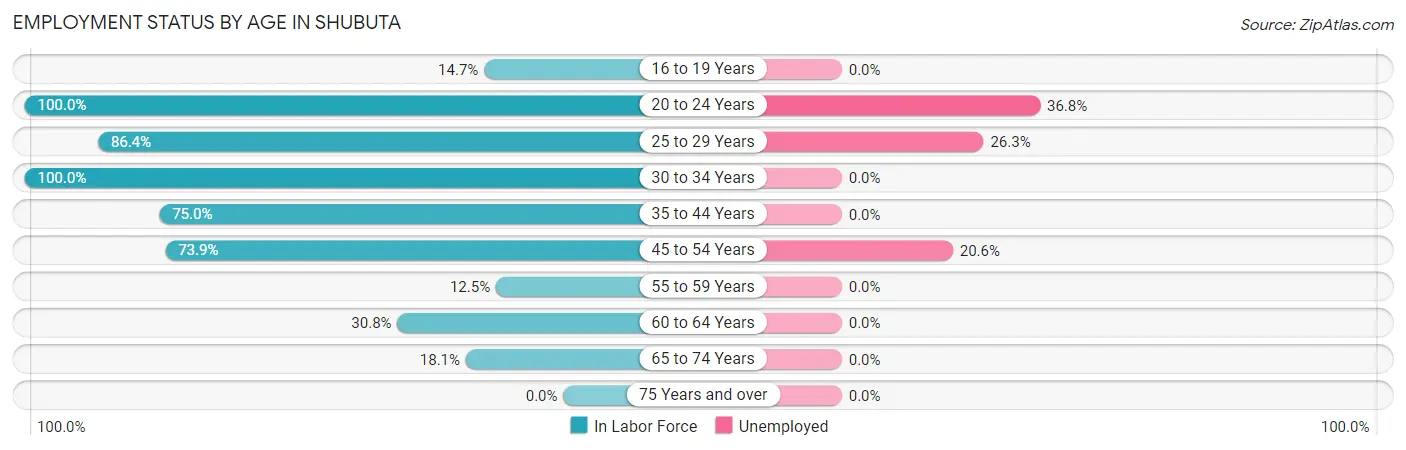
| Age Bracket | In Labor Force | Unemployed |
| 16 to 19 Years | 5 (14.7%) | 0 (0.0%) |
| 20 to 24 Years | 19 (100.0%) | 7 (36.8%) |
| 25 to 29 Years | 19 (86.4%) | 5 (26.3%) |
| 30 to 34 Years | 14 (100.0%) | 0 (0.0%) |
| 35 to 44 Years | 48 (75.0%) | 0 (0.0%) |
| 45 to 54 Years | 34 (73.9%) | 7 (20.6%) |
| 55 to 59 Years | 1 (12.5%) | 0 (0.0%) |
| 60 to 64 Years | 12 (30.8%) | 0 (0.0%) |
| 65 to 74 Years | 13 (18.1%) | 0 (0.0%) |
| 75 Years and over | 0 (0.0%) | 0 (0.0%) |
| Total | 165 (48.2%) | 19 (11.5%) |
Employment Status by Educational Attainment in Shubuta
According to labor force statistics for Shubuta, 66.3% of individuals (128) out of the total population between 25 and 64 years of age (193) are in the labor force, with 9.4% or 12 of them being unemployed. The group with the highest labor force participation rate are those with the educational attainment of college / associate degree, with 82.3% or 79 individuals in the labor force. Within the labor force, individuals with high school diploma education have the highest percentage of unemployment, with 32.4% or 12 of them being unemployed.
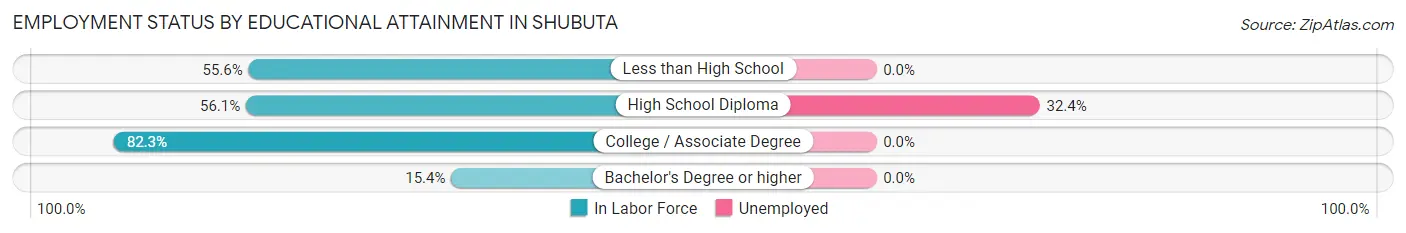
| Educational Attainment | In Labor Force | Unemployed |
| Less than High School | 10 (55.6%) | 0 (0.0%) |
| High School Diploma | 37 (56.1%) | 21 (32.4%) |
| College / Associate Degree | 79 (82.3%) | 0 (0.0%) |
| Bachelor's Degree or higher | 2 (15.4%) | 0 (0.0%) |
| Total | 128 (66.3%) | 18 (9.4%) |
Employment Occupations by Sex in Shubuta
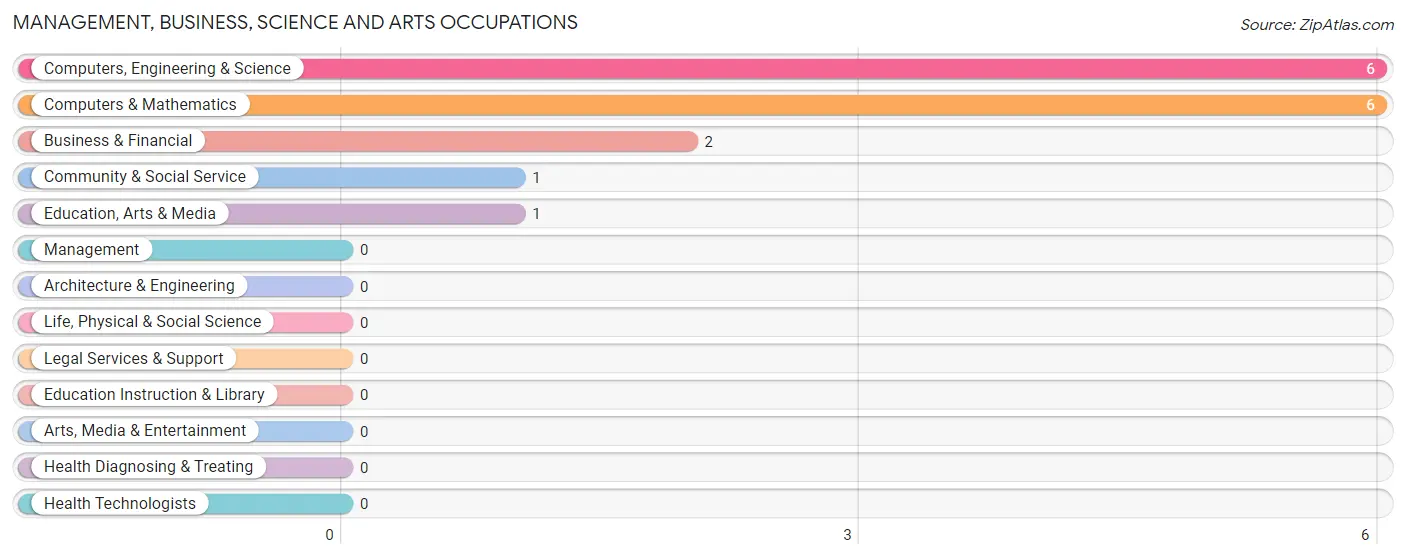
Management, Business, Science and Arts Occupations
The most common Management, Business, Science and Arts occupations in Shubuta are Computers, Engineering & Science (6 | 4.1%), Computers & Mathematics (6 | 4.1%), Business & Financial (2 | 1.4%), Community & Social Service (1 | 0.7%), and Education, Arts & Media (1 | 0.7%).
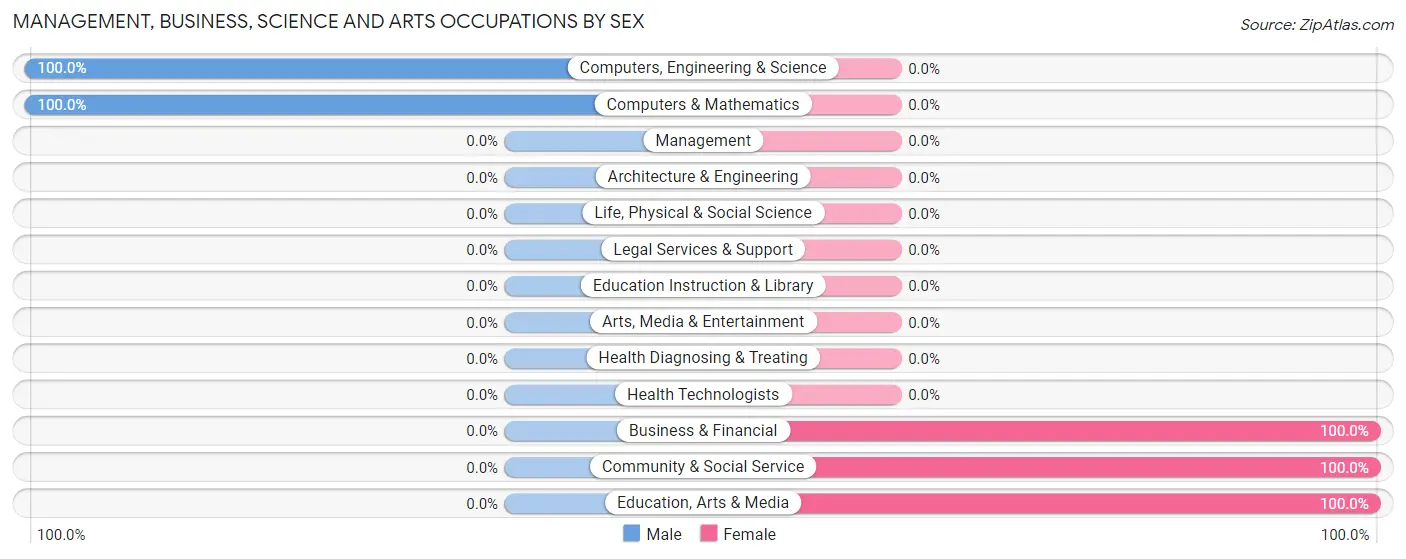
Management, Business, Science and Arts Occupations by Sex
Within the Management, Business, Science and Arts occupations in Shubuta, the most male-oriented occupations are Computers, Engineering & Science (100.0%), and Computers & Mathematics (100.0%), while the most female-oriented occupations are Business & Financial (100.0%), Community & Social Service (100.0%), and Education, Arts & Media (100.0%).
| Occupation | Male | Female |
| Management | 0 (0.0%) | 0 (0.0%) |
| Business & Financial | 0 (0.0%) | 2 (100.0%) |
| Computers, Engineering & Science | 6 (100.0%) | 0 (0.0%) |
| Computers & Mathematics | 6 (100.0%) | 0 (0.0%) |
| Architecture & Engineering | 0 (0.0%) | 0 (0.0%) |
| Life, Physical & Social Science | 0 (0.0%) | 0 (0.0%) |
| Community & Social Service | 0 (0.0%) | 1 (100.0%) |
| Education, Arts & Media | 0 (0.0%) | 1 (100.0%) |
| Legal Services & Support | 0 (0.0%) | 0 (0.0%) |
| Education Instruction & Library | 0 (0.0%) | 0 (0.0%) |
| Arts, Media & Entertainment | 0 (0.0%) | 0 (0.0%) |
| Health Diagnosing & Treating | 0 (0.0%) | 0 (0.0%) |
| Health Technologists | 0 (0.0%) | 0 (0.0%) |
| Total (Category) | 6 (66.7%) | 3 (33.3%) |
| Total (Overall) | 70 (47.9%) | 76 (52.0%) |
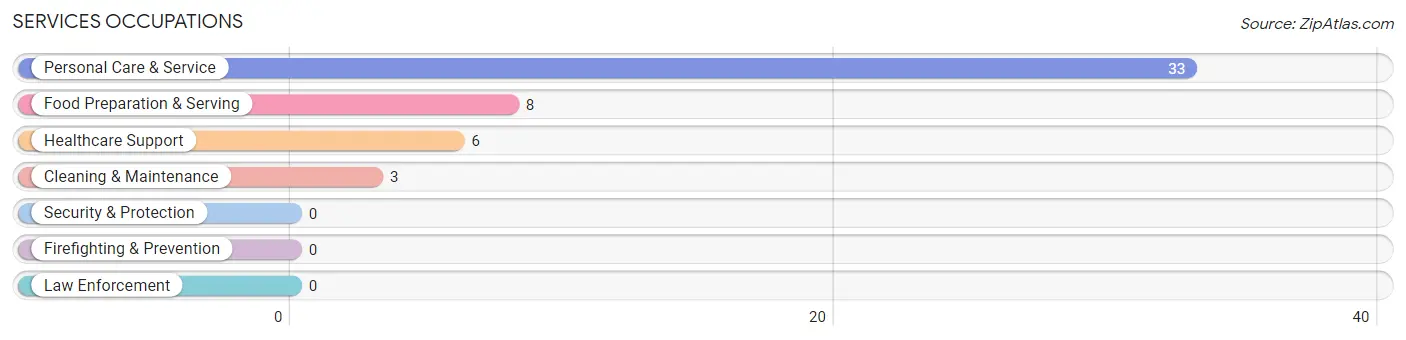
Services Occupations
The most common Services occupations in Shubuta are Personal Care & Service (33 | 22.6%), Food Preparation & Serving (8 | 5.5%), Healthcare Support (6 | 4.1%), and Cleaning & Maintenance (3 | 2.1%).
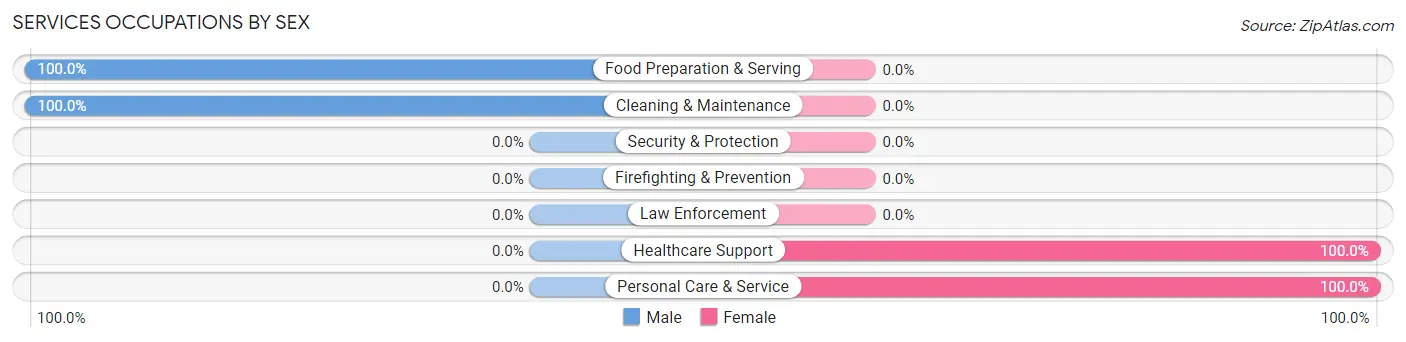
Services Occupations by Sex
Within the Services occupations in Shubuta, the most male-oriented occupations are Food Preparation & Serving (100.0%), and Cleaning & Maintenance (100.0%), while the most female-oriented occupations are Healthcare Support (100.0%), and Personal Care & Service (100.0%).
| Occupation | Male | Female |
| Healthcare Support | 0 (0.0%) | 6 (100.0%) |
| Security & Protection | 0 (0.0%) | 0 (0.0%) |
| Firefighting & Prevention | 0 (0.0%) | 0 (0.0%) |
| Law Enforcement | 0 (0.0%) | 0 (0.0%) |
| Food Preparation & Serving | 8 (100.0%) | 0 (0.0%) |
| Cleaning & Maintenance | 3 (100.0%) | 0 (0.0%) |
| Personal Care & Service | 0 (0.0%) | 33 (100.0%) |
| Total (Category) | 11 (22.0%) | 39 (78.0%) |
| Total (Overall) | 70 (47.9%) | 76 (52.0%) |
Sales and Office Occupations
The most common Sales and Office occupations in Shubuta are Office & Administration (12 | 8.2%), and Sales & Related (4 | 2.7%).
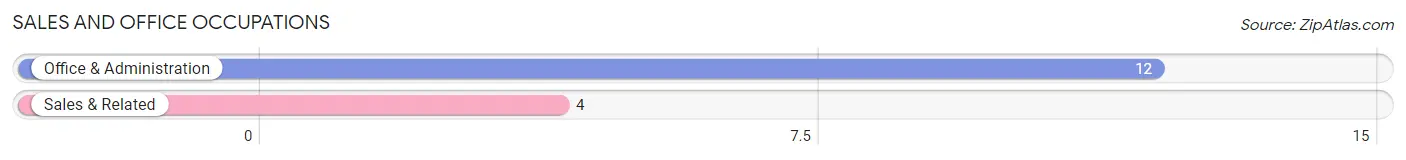
Sales and Office Occupations by Sex
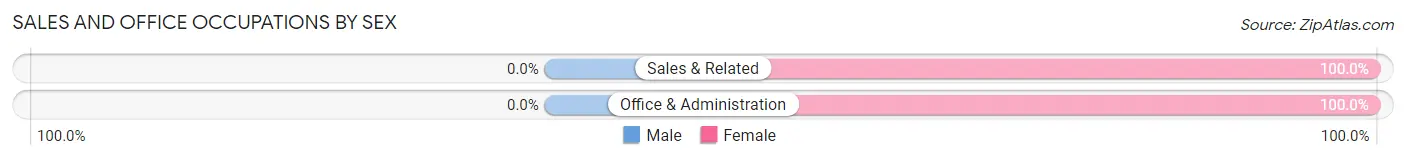
| Occupation | Male | Female |
| Sales & Related | 0 (0.0%) | 4 (100.0%) |
| Office & Administration | 0 (0.0%) | 12 (100.0%) |
| Total (Category) | 0 (0.0%) | 16 (100.0%) |
| Total (Overall) | 70 (47.9%) | 76 (52.0%) |
Natural Resources, Construction and Maintenance Occupations
The most common Natural Resources, Construction and Maintenance occupations in Shubuta are , and Construction & Extraction (9 | 6.2%).
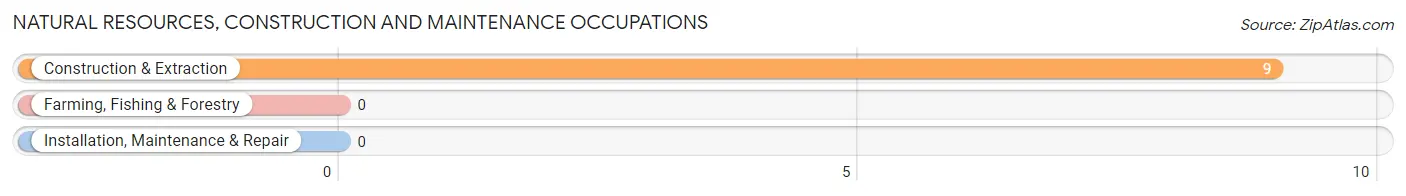
Natural Resources, Construction and Maintenance Occupations by Sex
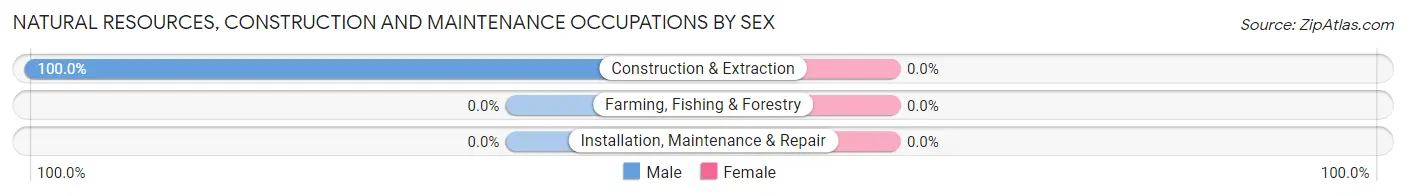
| Occupation | Male | Female |
| Farming, Fishing & Forestry | 0 (0.0%) | 0 (0.0%) |
| Construction & Extraction | 9 (100.0%) | 0 (0.0%) |
| Installation, Maintenance & Repair | 0 (0.0%) | 0 (0.0%) |
| Total (Category) | 9 (100.0%) | 0 (0.0%) |
| Total (Overall) | 70 (47.9%) | 76 (52.0%) |
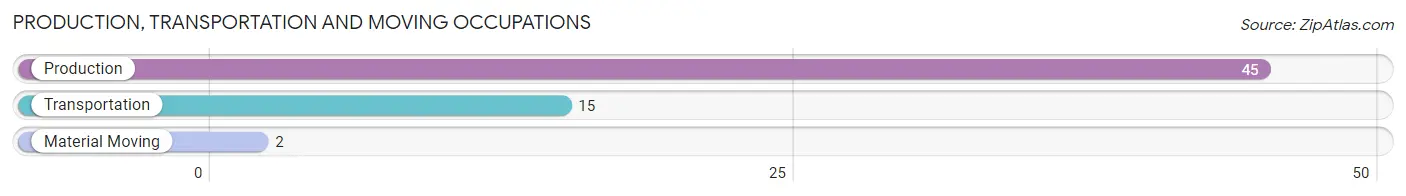
Production, Transportation and Moving Occupations
The most common Production, Transportation and Moving occupations in Shubuta are Production (45 | 30.8%), Transportation (15 | 10.3%), and Material Moving (2 | 1.4%).
Production, Transportation and Moving Occupations by Sex
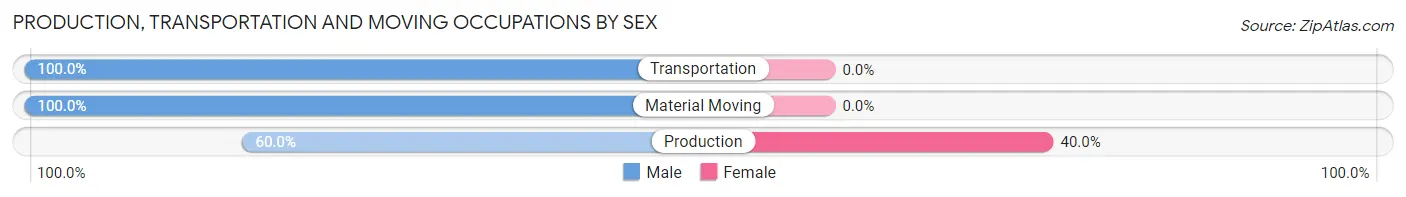
| Occupation | Male | Female |
| Production | 27 (60.0%) | 18 (40.0%) |
| Transportation | 15 (100.0%) | 0 (0.0%) |
| Material Moving | 2 (100.0%) | 0 (0.0%) |
| Total (Category) | 44 (71.0%) | 18 (29.0%) |
| Total (Overall) | 70 (47.9%) | 76 (52.0%) |
Employment Industries by Sex in Shubuta
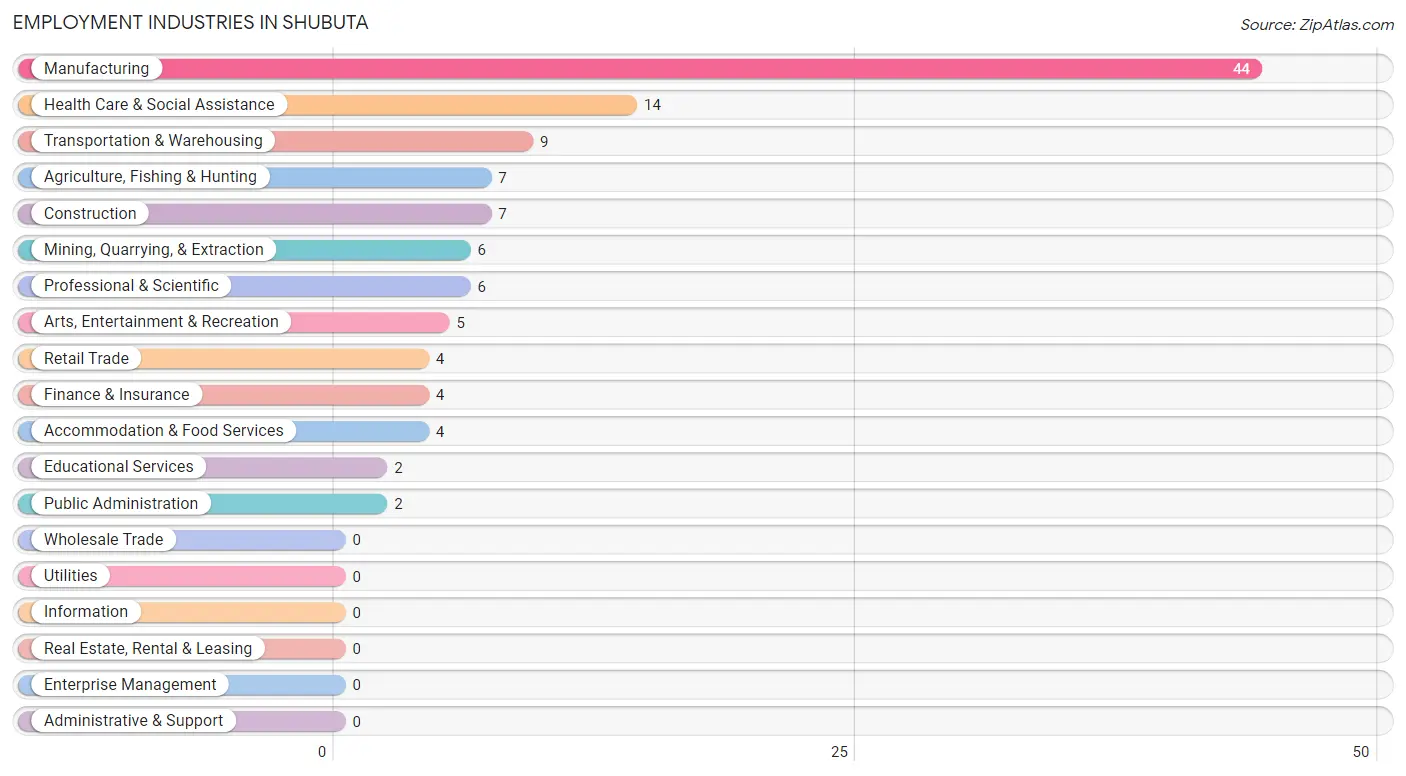
Employment Industries in Shubuta
The major employment industries in Shubuta include Manufacturing (44 | 30.1%), Health Care & Social Assistance (14 | 9.6%), Transportation & Warehousing (9 | 6.2%), Agriculture, Fishing & Hunting (7 | 4.8%), and Construction (7 | 4.8%).
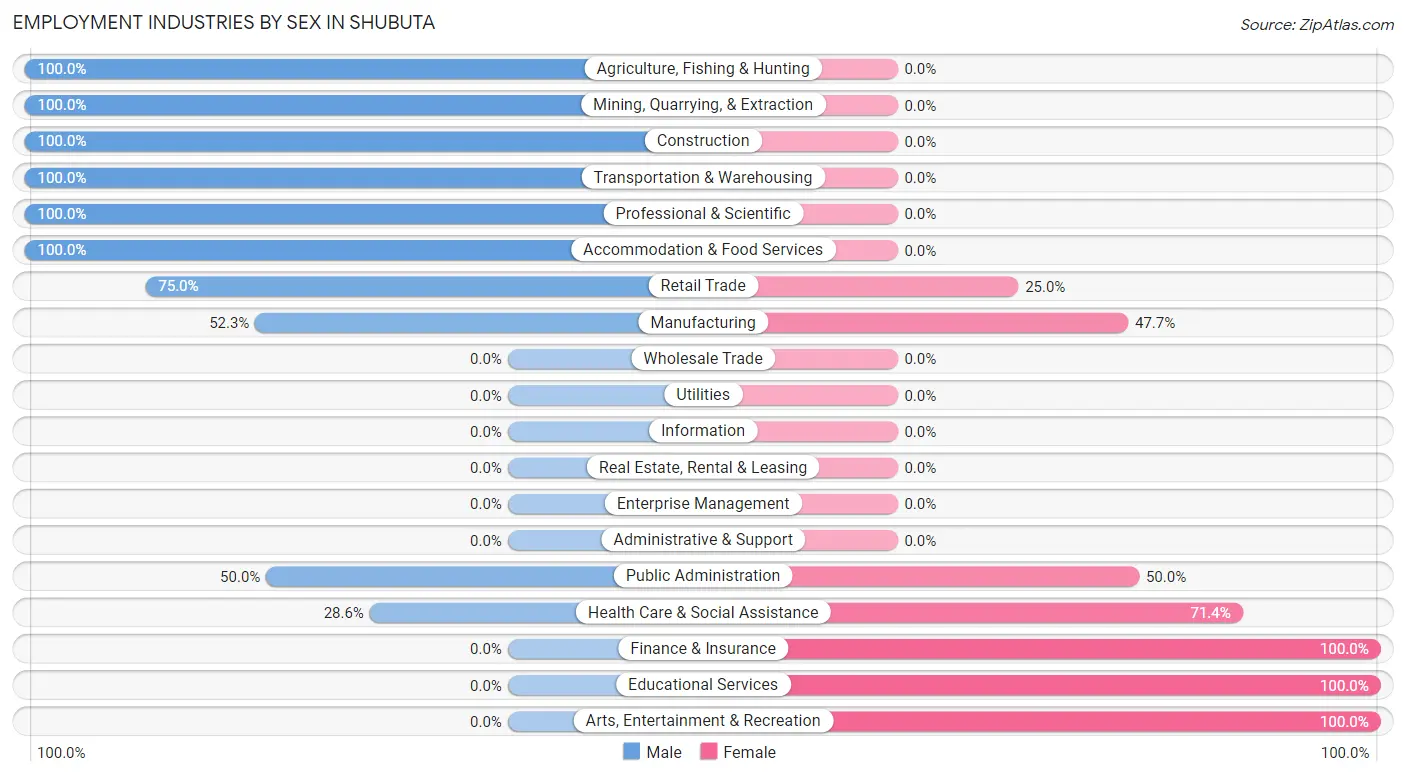
Employment Industries by Sex in Shubuta
The Shubuta industries that see more men than women are Agriculture, Fishing & Hunting (100.0%), Mining, Quarrying, & Extraction (100.0%), and Construction (100.0%), whereas the industries that tend to have a higher number of women are Finance & Insurance (100.0%), Educational Services (100.0%), and Arts, Entertainment & Recreation (100.0%).
| Industry | Male | Female |
| Agriculture, Fishing & Hunting | 7 (100.0%) | 0 (0.0%) |
| Mining, Quarrying, & Extraction | 6 (100.0%) | 0 (0.0%) |
| Construction | 7 (100.0%) | 0 (0.0%) |
| Manufacturing | 23 (52.3%) | 21 (47.7%) |
| Wholesale Trade | 0 (0.0%) | 0 (0.0%) |
| Retail Trade | 3 (75.0%) | 1 (25.0%) |
| Transportation & Warehousing | 9 (100.0%) | 0 (0.0%) |
| Utilities | 0 (0.0%) | 0 (0.0%) |
| Information | 0 (0.0%) | 0 (0.0%) |
| Finance & Insurance | 0 (0.0%) | 4 (100.0%) |
| Real Estate, Rental & Leasing | 0 (0.0%) | 0 (0.0%) |
| Professional & Scientific | 6 (100.0%) | 0 (0.0%) |
| Enterprise Management | 0 (0.0%) | 0 (0.0%) |
| Administrative & Support | 0 (0.0%) | 0 (0.0%) |
| Educational Services | 0 (0.0%) | 2 (100.0%) |
| Health Care & Social Assistance | 4 (28.6%) | 10 (71.4%) |
| Arts, Entertainment & Recreation | 0 (0.0%) | 5 (100.0%) |
| Accommodation & Food Services | 4 (100.0%) | 0 (0.0%) |
| Public Administration | 1 (50.0%) | 1 (50.0%) |
| Total | 70 (47.9%) | 76 (52.0%) |
Education in Shubuta
School Enrollment in Shubuta
The most common levels of schooling among the 70 students in Shubuta are high school (45 | 64.3%), elementary school (11 | 15.7%), and middle school (9 | 12.9%).
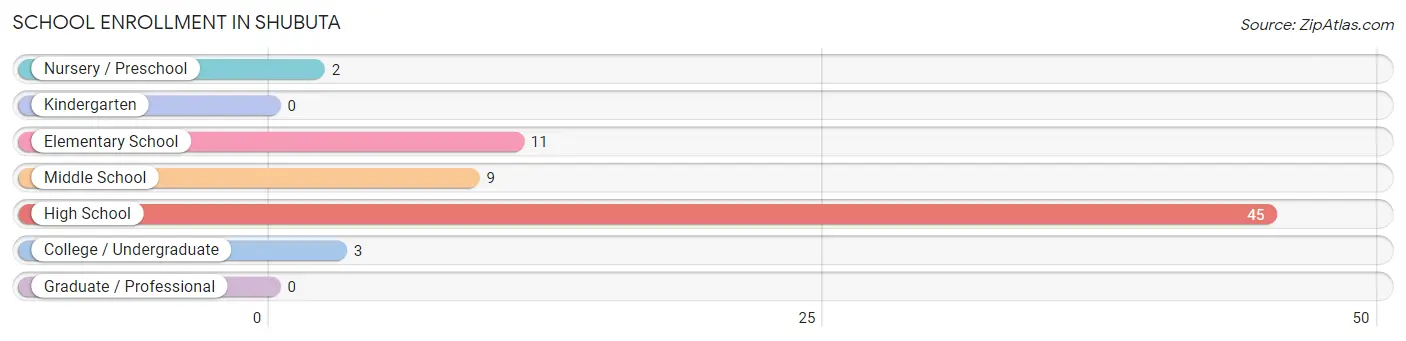
| School Level | # Students | % Students |
| Nursery / Preschool | 2 | 2.9% |
| Kindergarten | 0 | 0.0% |
| Elementary School | 11 | 15.7% |
| Middle School | 9 | 12.9% |
| High School | 45 | 64.3% |
| College / Undergraduate | 3 | 4.3% |
| Graduate / Professional | 0 | 0.0% |
| Total | 70 | 100.0% |
School Enrollment by Age by Funding Source in Shubuta
Out of a total of 70 students who are enrolled in schools in Shubuta, 6 (8.6%) attend a private institution, while the remaining 64 (91.4%) are enrolled in public schools. The age group of 15 to 17 year olds has the highest likelihood of being enrolled in private schools, with 6 (28.6% in the age bracket) enrolled. Conversely, the age group of 3 to 4 year olds has the lowest likelihood of being enrolled in a private school, with 2 (100.0% in the age bracket) attending a public institution.
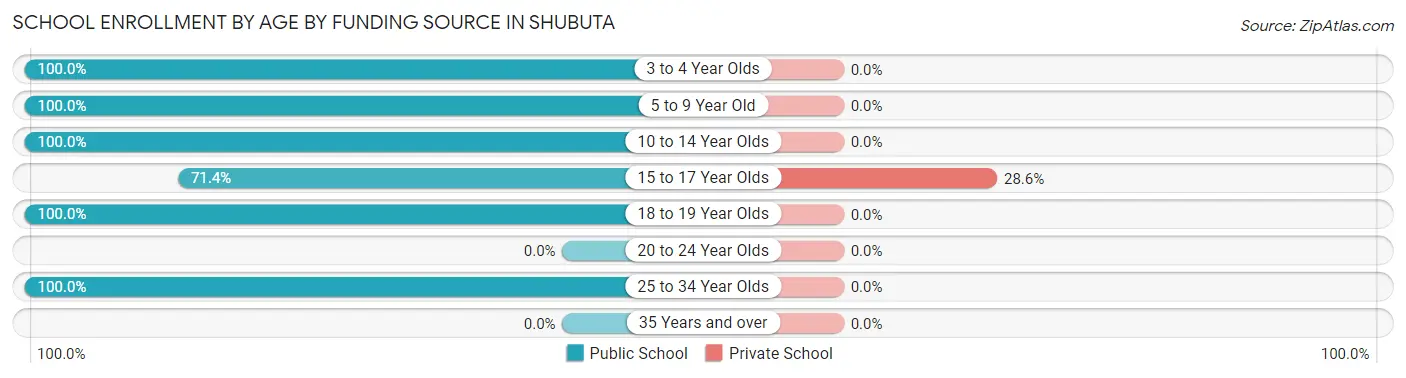
| Age Bracket | Public School | Private School |
| 3 to 4 Year Olds | 2 (100.0%) | 0 (0.0%) |
| 5 to 9 Year Old | 9 (100.0%) | 0 (0.0%) |
| 10 to 14 Year Olds | 11 (100.0%) | 0 (0.0%) |
| 15 to 17 Year Olds | 15 (71.4%) | 6 (28.6%) |
| 18 to 19 Year Olds | 24 (100.0%) | 0 (0.0%) |
| 20 to 24 Year Olds | 0 (0.0%) | 0 (0.0%) |
| 25 to 34 Year Olds | 3 (100.0%) | 0 (0.0%) |
| 35 Years and over | 0 (0.0%) | 0 (0.0%) |
| Total | 64 (91.4%) | 6 (8.6%) |
Educational Attainment by Field of Study in Shubuta
Education (12 | 50.0%), business (4 | 16.7%), social sciences (3 | 12.5%), literature & languages (3 | 12.5%), and liberal arts & history (2 | 8.3%) are the most common fields of study among 24 individuals in Shubuta who have obtained a bachelor's degree or higher.
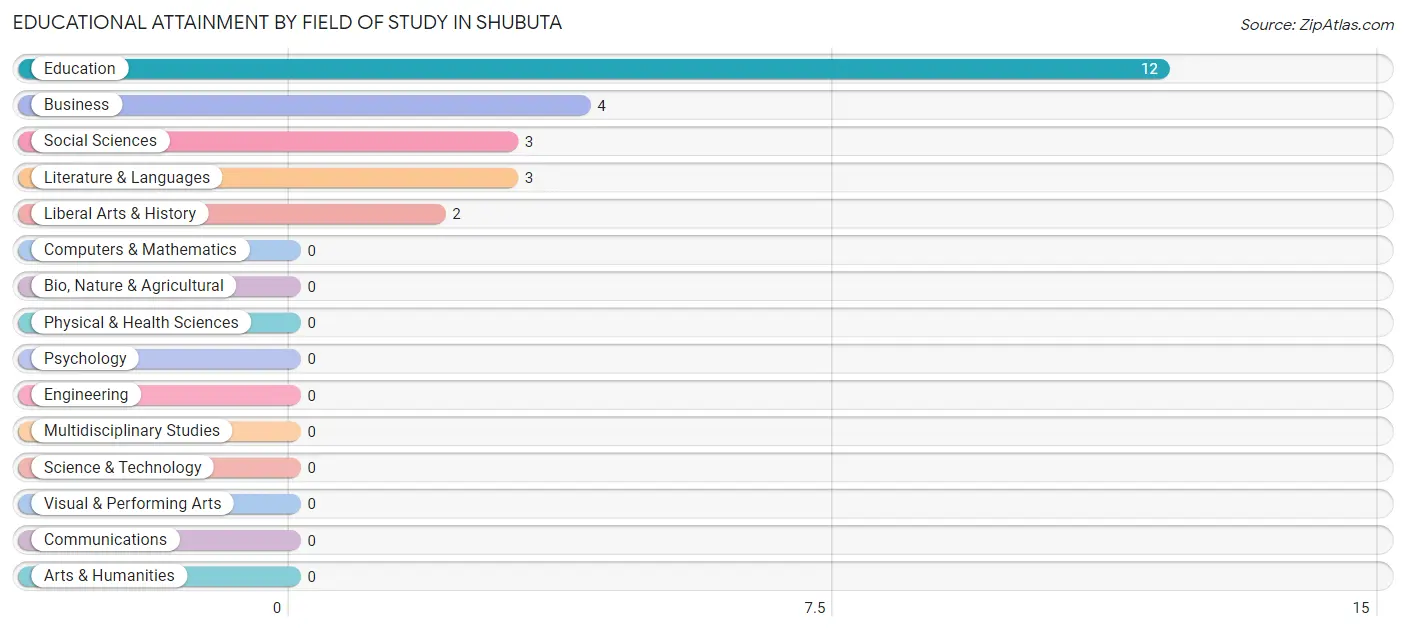
| Field of Study | # Graduates | % Graduates |
| Computers & Mathematics | 0 | 0.0% |
| Bio, Nature & Agricultural | 0 | 0.0% |
| Physical & Health Sciences | 0 | 0.0% |
| Psychology | 0 | 0.0% |
| Social Sciences | 3 | 12.5% |
| Engineering | 0 | 0.0% |
| Multidisciplinary Studies | 0 | 0.0% |
| Science & Technology | 0 | 0.0% |
| Business | 4 | 16.7% |
| Education | 12 | 50.0% |
| Literature & Languages | 3 | 12.5% |
| Liberal Arts & History | 2 | 8.3% |
| Visual & Performing Arts | 0 | 0.0% |
| Communications | 0 | 0.0% |
| Arts & Humanities | 0 | 0.0% |
| Total | 24 | 100.0% |
Transportation & Commute in Shubuta
Vehicle Availability by Sex in Shubuta
The most prevalent vehicle ownership categories in Shubuta are males with 2 vehicles (34, accounting for 48.6%) and females with 2 vehicles (13, making up 77.3%).
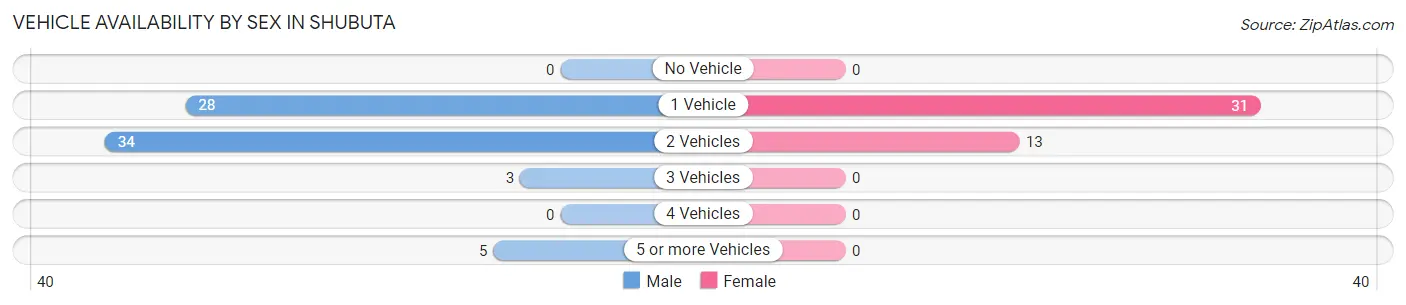
| Vehicles Available | Male | Female |
| No Vehicle | 0 (0.0%) | 0 (0.0%) |
| 1 Vehicle | 28 (40.0%) | 31 (70.5%) |
| 2 Vehicles | 34 (48.6%) | 13 (29.5%) |
| 3 Vehicles | 3 (4.3%) | 0 (0.0%) |
| 4 Vehicles | 0 (0.0%) | 0 (0.0%) |
| 5 or more Vehicles | 5 (7.1%) | 0 (0.0%) |
| Total | 70 (100.0%) | 44 (100.0%) |
Commute Time in Shubuta
The most frequently occuring commute durations in Shubuta are 45 to 59 minutes (35 commuters, 31.8%), 60 to 89 minutes (22 commuters, 20.0%), and 15 to 19 minutes (17 commuters, 15.4%).
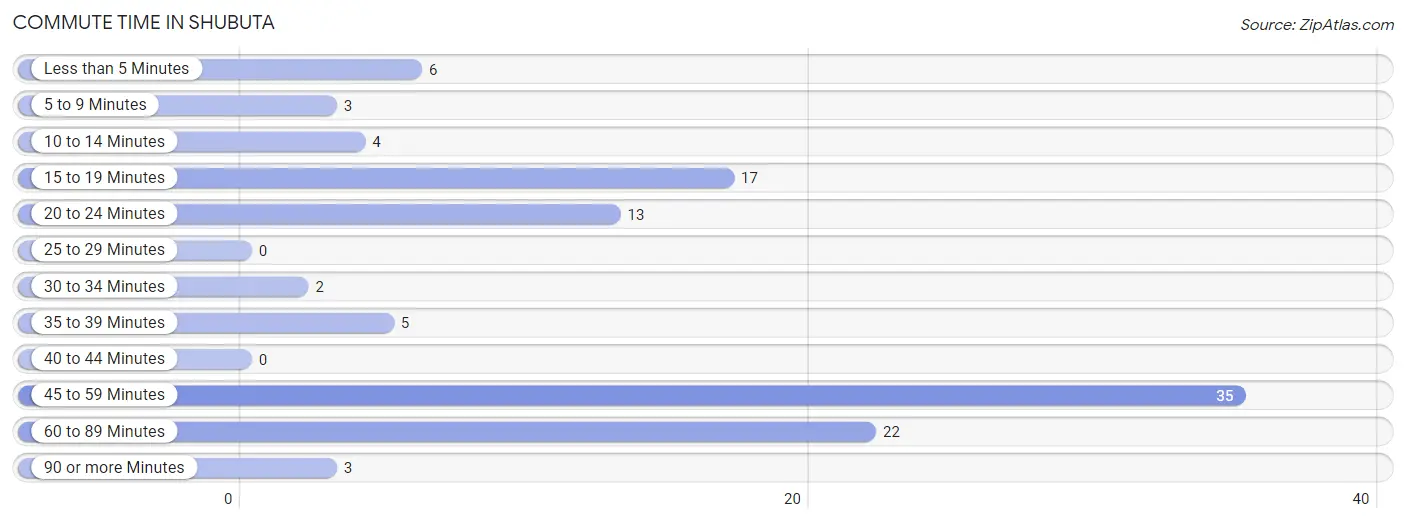
| Commute Time | # Commuters | % Commuters |
| Less than 5 Minutes | 6 | 5.4% |
| 5 to 9 Minutes | 3 | 2.7% |
| 10 to 14 Minutes | 4 | 3.6% |
| 15 to 19 Minutes | 17 | 15.4% |
| 20 to 24 Minutes | 13 | 11.8% |
| 25 to 29 Minutes | 0 | 0.0% |
| 30 to 34 Minutes | 2 | 1.8% |
| 35 to 39 Minutes | 5 | 4.5% |
| 40 to 44 Minutes | 0 | 0.0% |
| 45 to 59 Minutes | 35 | 31.8% |
| 60 to 89 Minutes | 22 | 20.0% |
| 90 or more Minutes | 3 | 2.7% |
Commute Time by Sex in Shubuta
The most common commute times in Shubuta are 45 to 59 minutes (27 commuters, 38.6%) for males and 60 to 89 minutes (9 commuters, 22.5%) for females.
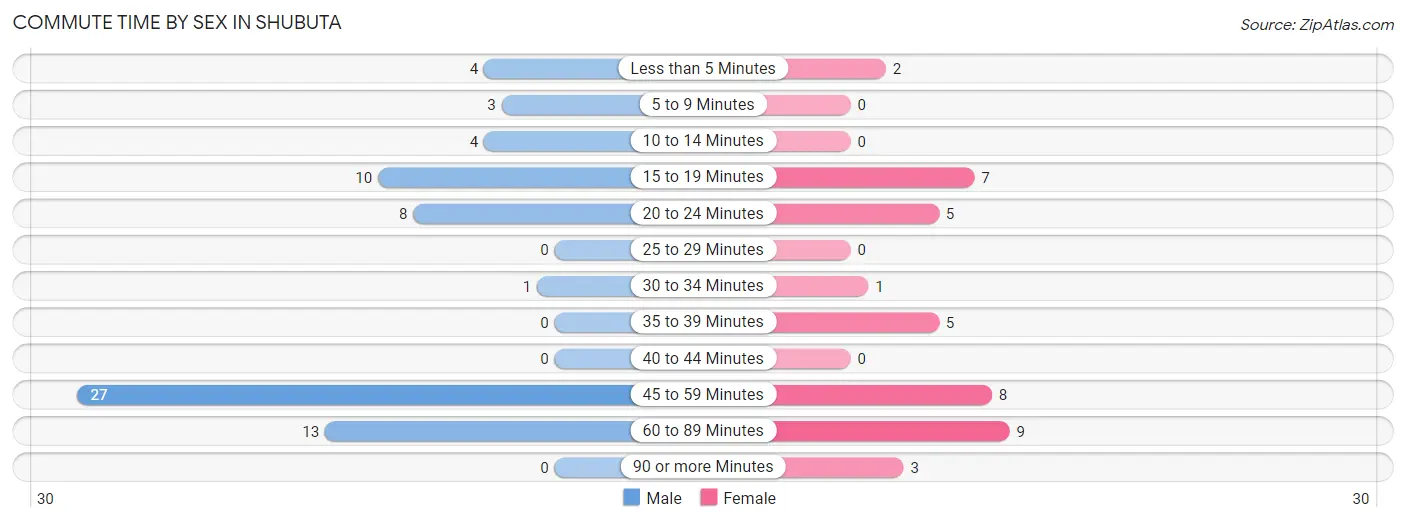
| Commute Time | Male | Female |
| Less than 5 Minutes | 4 (5.7%) | 2 (5.0%) |
| 5 to 9 Minutes | 3 (4.3%) | 0 (0.0%) |
| 10 to 14 Minutes | 4 (5.7%) | 0 (0.0%) |
| 15 to 19 Minutes | 10 (14.3%) | 7 (17.5%) |
| 20 to 24 Minutes | 8 (11.4%) | 5 (12.5%) |
| 25 to 29 Minutes | 0 (0.0%) | 0 (0.0%) |
| 30 to 34 Minutes | 1 (1.4%) | 1 (2.5%) |
| 35 to 39 Minutes | 0 (0.0%) | 5 (12.5%) |
| 40 to 44 Minutes | 0 (0.0%) | 0 (0.0%) |
| 45 to 59 Minutes | 27 (38.6%) | 8 (20.0%) |
| 60 to 89 Minutes | 13 (18.6%) | 9 (22.5%) |
| 90 or more Minutes | 0 (0.0%) | 3 (7.5%) |
Time of Departure to Work by Sex in Shubuta
The most frequent times of departure to work in Shubuta are 5:30 AM to 5:59 AM (24, 34.3%) for males and 5:30 AM to 5:59 AM (11, 27.5%) for females.
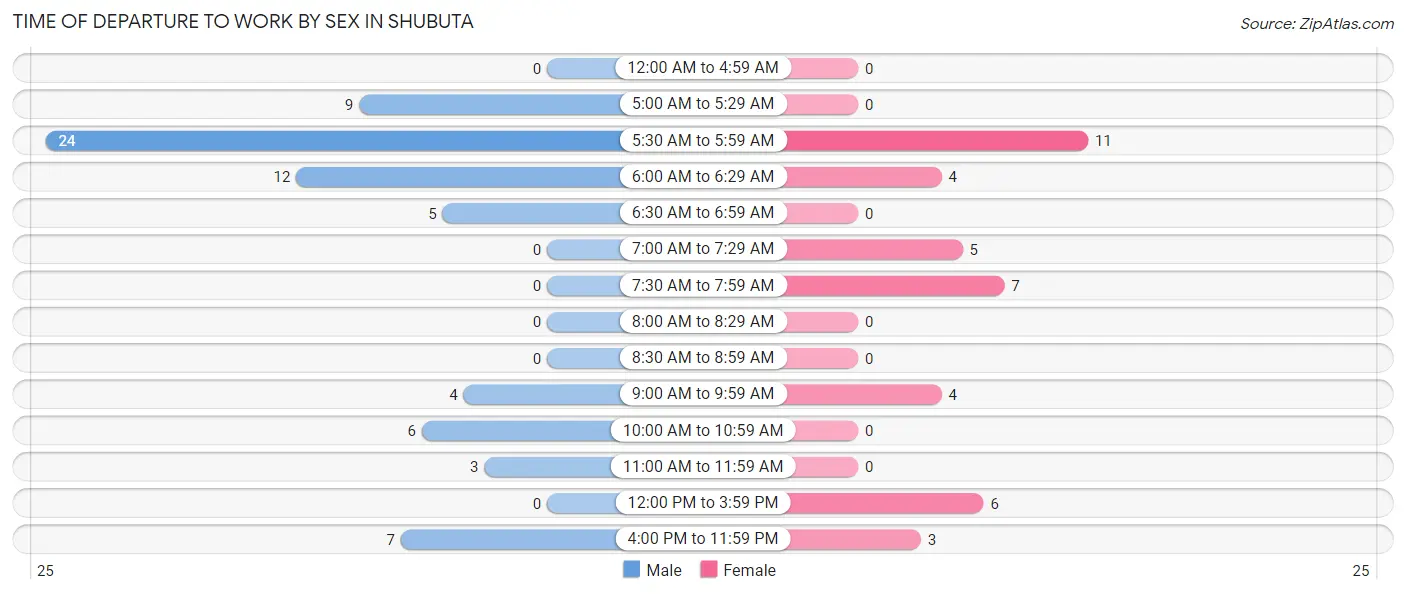
| Time of Departure | Male | Female |
| 12:00 AM to 4:59 AM | 0 (0.0%) | 0 (0.0%) |
| 5:00 AM to 5:29 AM | 9 (12.9%) | 0 (0.0%) |
| 5:30 AM to 5:59 AM | 24 (34.3%) | 11 (27.5%) |
| 6:00 AM to 6:29 AM | 12 (17.1%) | 4 (10.0%) |
| 6:30 AM to 6:59 AM | 5 (7.1%) | 0 (0.0%) |
| 7:00 AM to 7:29 AM | 0 (0.0%) | 5 (12.5%) |
| 7:30 AM to 7:59 AM | 0 (0.0%) | 7 (17.5%) |
| 8:00 AM to 8:29 AM | 0 (0.0%) | 0 (0.0%) |
| 8:30 AM to 8:59 AM | 0 (0.0%) | 0 (0.0%) |
| 9:00 AM to 9:59 AM | 4 (5.7%) | 4 (10.0%) |
| 10:00 AM to 10:59 AM | 6 (8.6%) | 0 (0.0%) |
| 11:00 AM to 11:59 AM | 3 (4.3%) | 0 (0.0%) |
| 12:00 PM to 3:59 PM | 0 (0.0%) | 6 (15.0%) |
| 4:00 PM to 11:59 PM | 7 (10.0%) | 3 (7.5%) |
| Total | 70 (100.0%) | 40 (100.0%) |
Housing Occupancy in Shubuta
Occupancy by Ownership in Shubuta
Of the total 149 dwellings in Shubuta, owner-occupied units account for 115 (77.2%), while renter-occupied units make up 34 (22.8%).
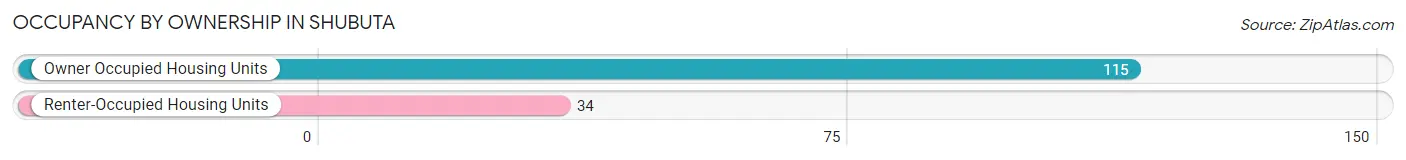
| Occupancy | # Housing Units | % Housing Units |
| Owner Occupied Housing Units | 115 | 77.2% |
| Renter-Occupied Housing Units | 34 | 22.8% |
| Total Occupied Housing Units | 149 | 100.0% |
Occupancy by Household Size in Shubuta
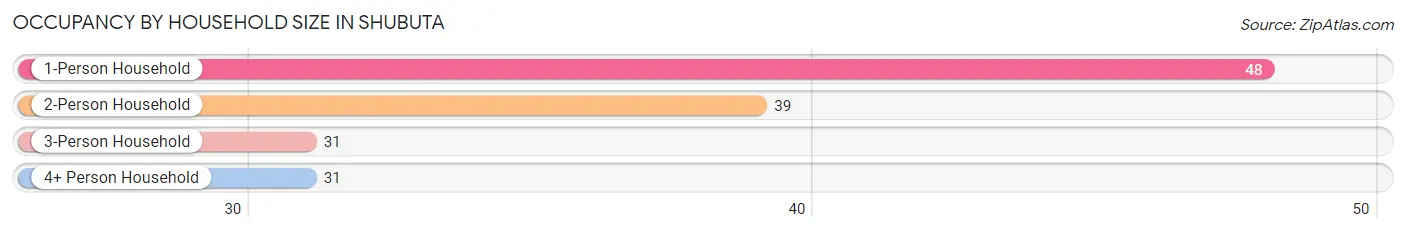
| Household Size | # Housing Units | % Housing Units |
| 1-Person Household | 48 | 32.2% |
| 2-Person Household | 39 | 26.2% |
| 3-Person Household | 31 | 20.8% |
| 4+ Person Household | 31 | 20.8% |
| Total Housing Units | 149 | 100.0% |
Occupancy by Ownership by Household Size in Shubuta
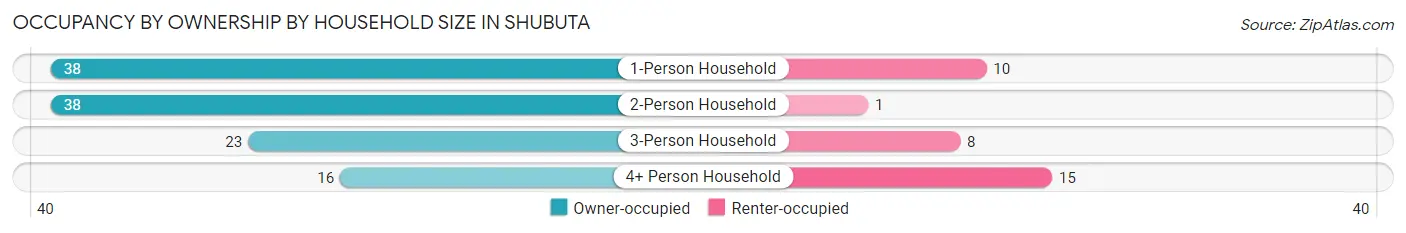
| Household Size | Owner-occupied | Renter-occupied |
| 1-Person Household | 38 (79.2%) | 10 (20.8%) |
| 2-Person Household | 38 (97.4%) | 1 (2.6%) |
| 3-Person Household | 23 (74.2%) | 8 (25.8%) |
| 4+ Person Household | 16 (51.6%) | 15 (48.4%) |
| Total Housing Units | 115 (77.2%) | 34 (22.8%) |
Occupancy by Educational Attainment in Shubuta
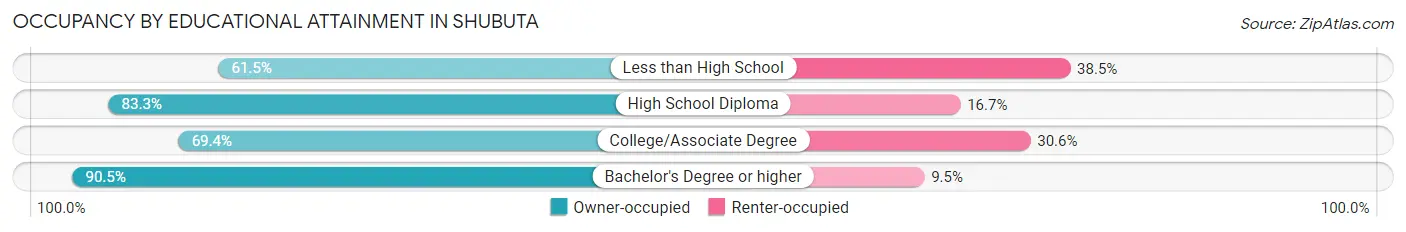
| Household Size | Owner-occupied | Renter-occupied |
| Less than High School | 16 (61.5%) | 10 (38.5%) |
| High School Diploma | 55 (83.3%) | 11 (16.7%) |
| College/Associate Degree | 25 (69.4%) | 11 (30.6%) |
| Bachelor's Degree or higher | 19 (90.5%) | 2 (9.5%) |
Occupancy by Age of Householder in Shubuta
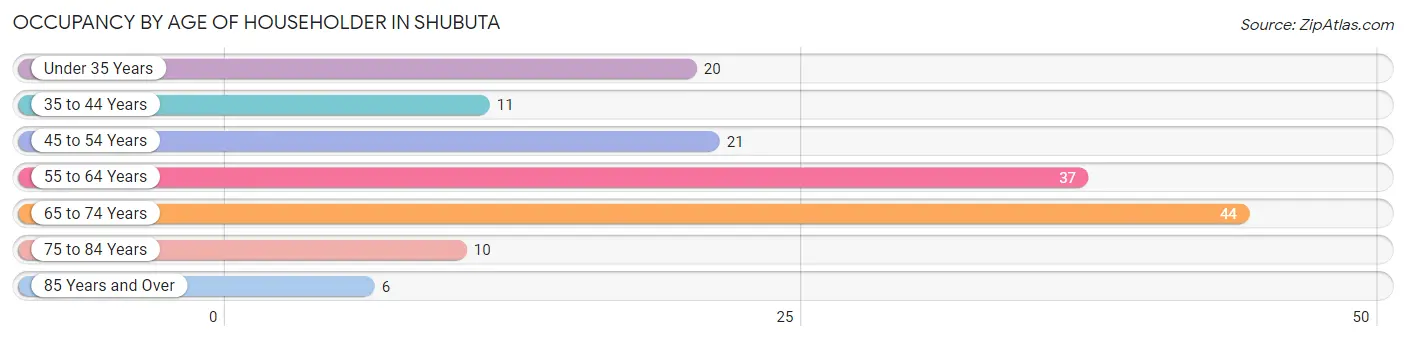
| Age Bracket | # Households | % Households |
| Under 35 Years | 20 | 13.4% |
| 35 to 44 Years | 11 | 7.4% |
| 45 to 54 Years | 21 | 14.1% |
| 55 to 64 Years | 37 | 24.8% |
| 65 to 74 Years | 44 | 29.5% |
| 75 to 84 Years | 10 | 6.7% |
| 85 Years and Over | 6 | 4.0% |
| Total | 149 | 100.0% |
Housing Finances in Shubuta
Median Income by Occupancy in Shubuta
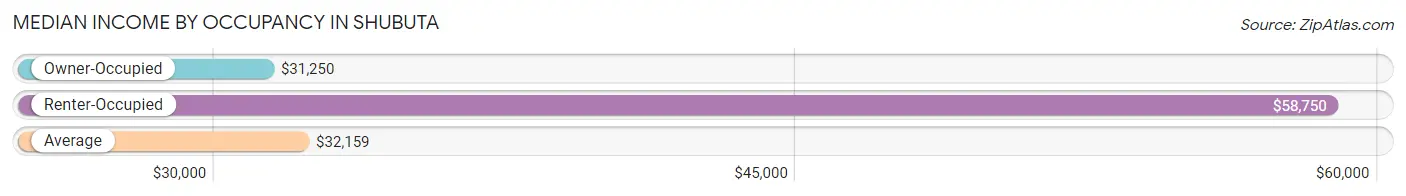
| Occupancy Type | # Households | Median Income |
| Owner-Occupied | 115 (77.2%) | $31,250 |
| Renter-Occupied | 34 (22.8%) | $58,750 |
| Average | 149 (100.0%) | $32,159 |
Occupancy by Householder Income Bracket in Shubuta
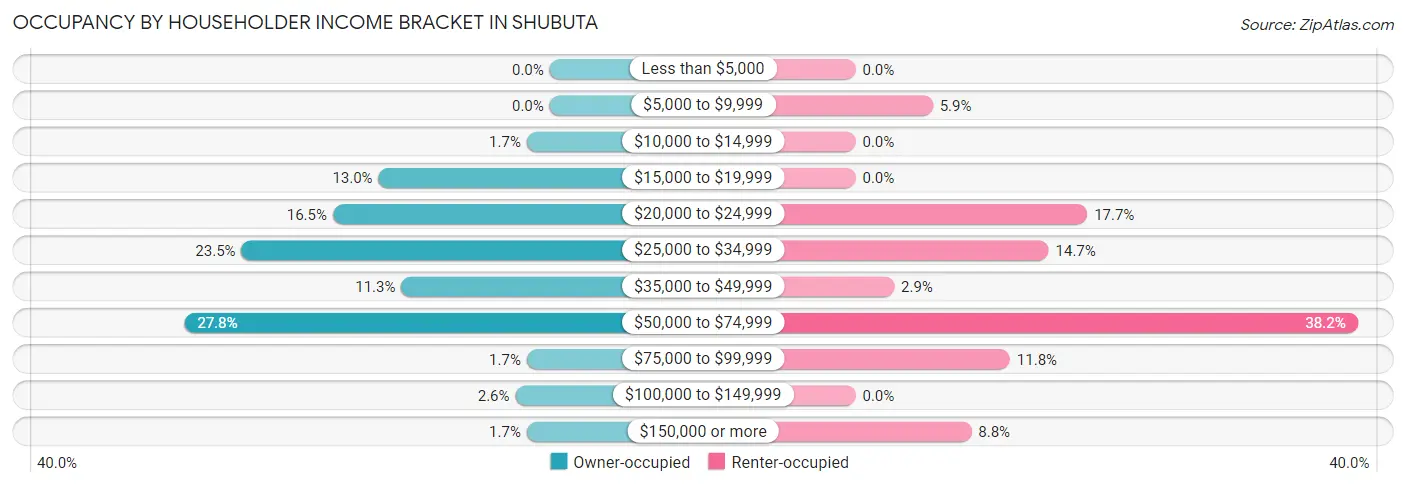
| Income Bracket | Owner-occupied | Renter-occupied |
| Less than $5,000 | 0 (0.0%) | 0 (0.0%) |
| $5,000 to $9,999 | 0 (0.0%) | 2 (5.9%) |
| $10,000 to $14,999 | 2 (1.7%) | 0 (0.0%) |
| $15,000 to $19,999 | 15 (13.0%) | 0 (0.0%) |
| $20,000 to $24,999 | 19 (16.5%) | 6 (17.6%) |
| $25,000 to $34,999 | 27 (23.5%) | 5 (14.7%) |
| $35,000 to $49,999 | 13 (11.3%) | 1 (2.9%) |
| $50,000 to $74,999 | 32 (27.8%) | 13 (38.2%) |
| $75,000 to $99,999 | 2 (1.7%) | 4 (11.8%) |
| $100,000 to $149,999 | 3 (2.6%) | 0 (0.0%) |
| $150,000 or more | 2 (1.7%) | 3 (8.8%) |
| Total | 115 (100.0%) | 34 (100.0%) |
Monthly Housing Cost Tiers in Shubuta
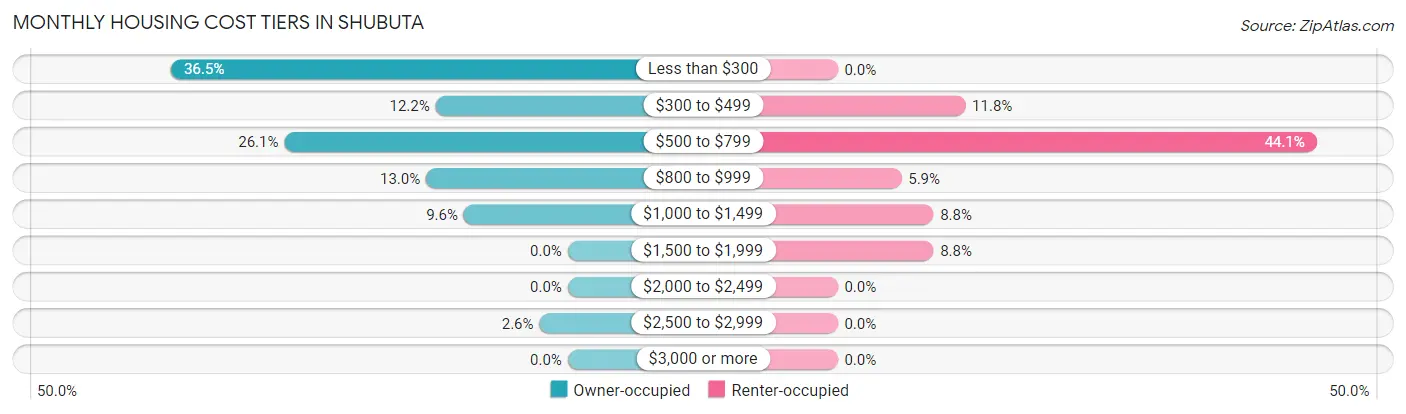
| Monthly Cost | Owner-occupied | Renter-occupied |
| Less than $300 | 42 (36.5%) | 0 (0.0%) |
| $300 to $499 | 14 (12.2%) | 4 (11.8%) |
| $500 to $799 | 30 (26.1%) | 15 (44.1%) |
| $800 to $999 | 15 (13.0%) | 2 (5.9%) |
| $1,000 to $1,499 | 11 (9.6%) | 3 (8.8%) |
| $1,500 to $1,999 | 0 (0.0%) | 3 (8.8%) |
| $2,000 to $2,499 | 0 (0.0%) | 0 (0.0%) |
| $2,500 to $2,999 | 3 (2.6%) | 0 (0.0%) |
| $3,000 or more | 0 (0.0%) | 0 (0.0%) |
| Total | 115 (100.0%) | 34 (100.0%) |
Physical Housing Characteristics in Shubuta
Housing Structures in Shubuta
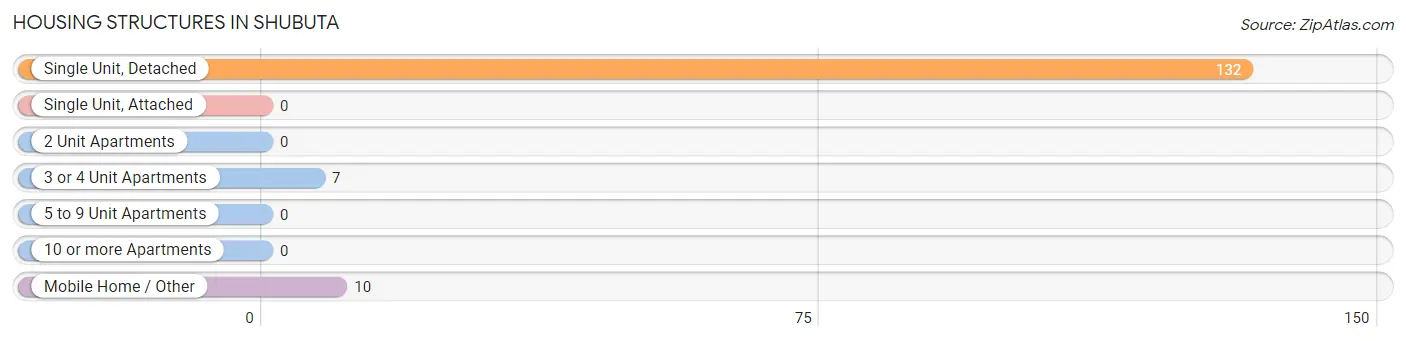
| Structure Type | # Housing Units | % Housing Units |
| Single Unit, Detached | 132 | 88.6% |
| Single Unit, Attached | 0 | 0.0% |
| 2 Unit Apartments | 0 | 0.0% |
| 3 or 4 Unit Apartments | 7 | 4.7% |
| 5 to 9 Unit Apartments | 0 | 0.0% |
| 10 or more Apartments | 0 | 0.0% |
| Mobile Home / Other | 10 | 6.7% |
| Total | 149 | 100.0% |
Housing Structures by Occupancy in Shubuta
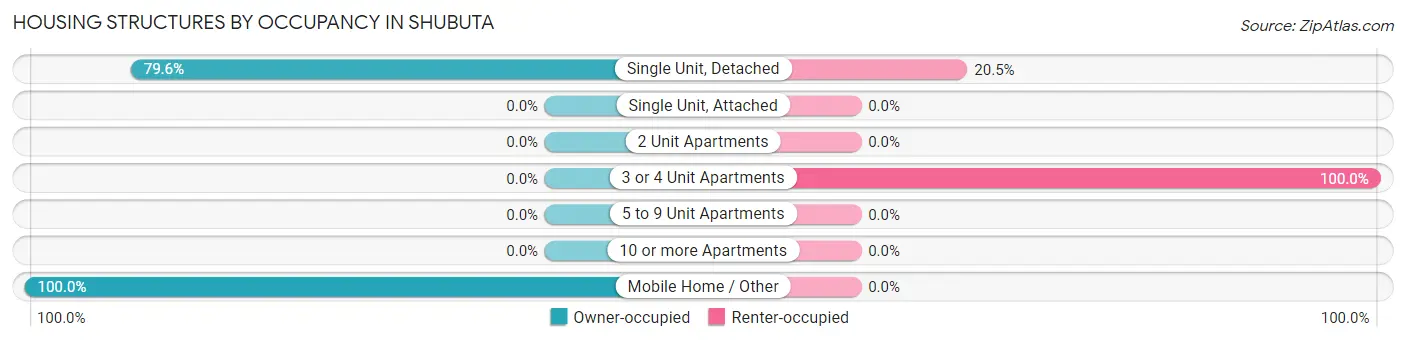
| Structure Type | Owner-occupied | Renter-occupied |
| Single Unit, Detached | 105 (79.5%) | 27 (20.4%) |
| Single Unit, Attached | 0 (0.0%) | 0 (0.0%) |
| 2 Unit Apartments | 0 (0.0%) | 0 (0.0%) |
| 3 or 4 Unit Apartments | 0 (0.0%) | 7 (100.0%) |
| 5 to 9 Unit Apartments | 0 (0.0%) | 0 (0.0%) |
| 10 or more Apartments | 0 (0.0%) | 0 (0.0%) |
| Mobile Home / Other | 10 (100.0%) | 0 (0.0%) |
| Total | 115 (77.2%) | 34 (22.8%) |
Housing Structures by Number of Rooms in Shubuta
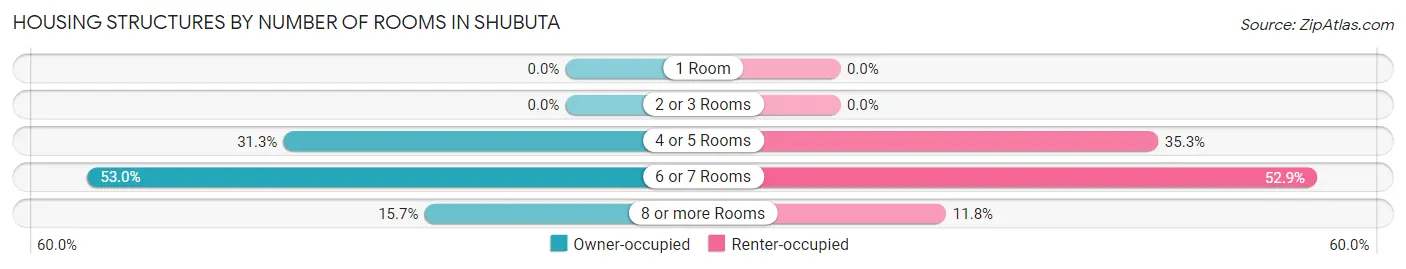
| Number of Rooms | Owner-occupied | Renter-occupied |
| 1 Room | 0 (0.0%) | 0 (0.0%) |
| 2 or 3 Rooms | 0 (0.0%) | 0 (0.0%) |
| 4 or 5 Rooms | 36 (31.3%) | 12 (35.3%) |
| 6 or 7 Rooms | 61 (53.0%) | 18 (52.9%) |
| 8 or more Rooms | 18 (15.7%) | 4 (11.8%) |
| Total | 115 (100.0%) | 34 (100.0%) |
Housing Structure by Heating Type in Shubuta
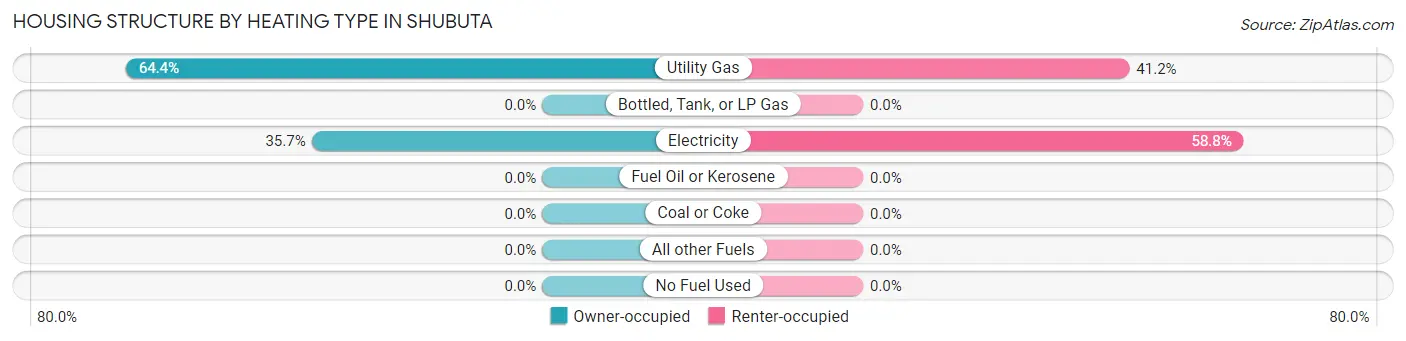
| Heating Type | Owner-occupied | Renter-occupied |
| Utility Gas | 74 (64.3%) | 14 (41.2%) |
| Bottled, Tank, or LP Gas | 0 (0.0%) | 0 (0.0%) |
| Electricity | 41 (35.6%) | 20 (58.8%) |
| Fuel Oil or Kerosene | 0 (0.0%) | 0 (0.0%) |
| Coal or Coke | 0 (0.0%) | 0 (0.0%) |
| All other Fuels | 0 (0.0%) | 0 (0.0%) |
| No Fuel Used | 0 (0.0%) | 0 (0.0%) |
| Total | 115 (100.0%) | 34 (100.0%) |
Household Vehicle Usage in Shubuta
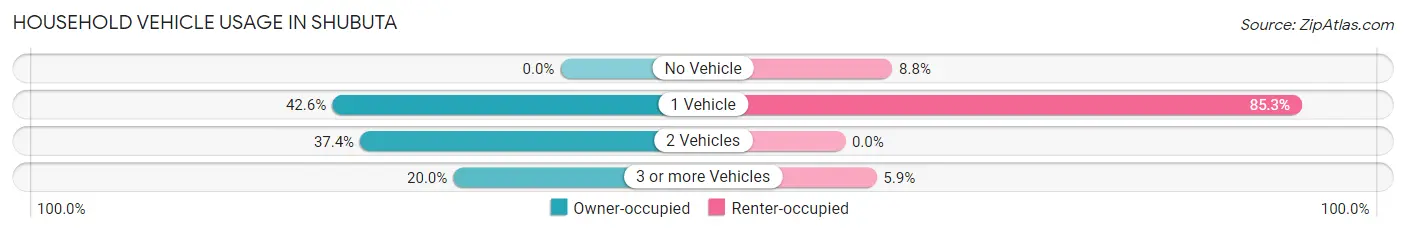
| Vehicles per Household | Owner-occupied | Renter-occupied |
| No Vehicle | 0 (0.0%) | 3 (8.8%) |
| 1 Vehicle | 49 (42.6%) | 29 (85.3%) |
| 2 Vehicles | 43 (37.4%) | 0 (0.0%) |
| 3 or more Vehicles | 23 (20.0%) | 2 (5.9%) |
| Total | 115 (100.0%) | 34 (100.0%) |
Real Estate & Mortgages in Shubuta
Real Estate and Mortgage Overview in Shubuta
| Characteristic | Without Mortgage | With Mortgage |
| Housing Units | 64 | 51 |
| Median Property Value | $72,000 | $76,300 |
| Median Household Income | $29,643 | $0 |
| Monthly Housing Costs | $242 | $0 |
| Real Estate Taxes | $350 | $15 |
Property Value by Mortgage Status in Shubuta
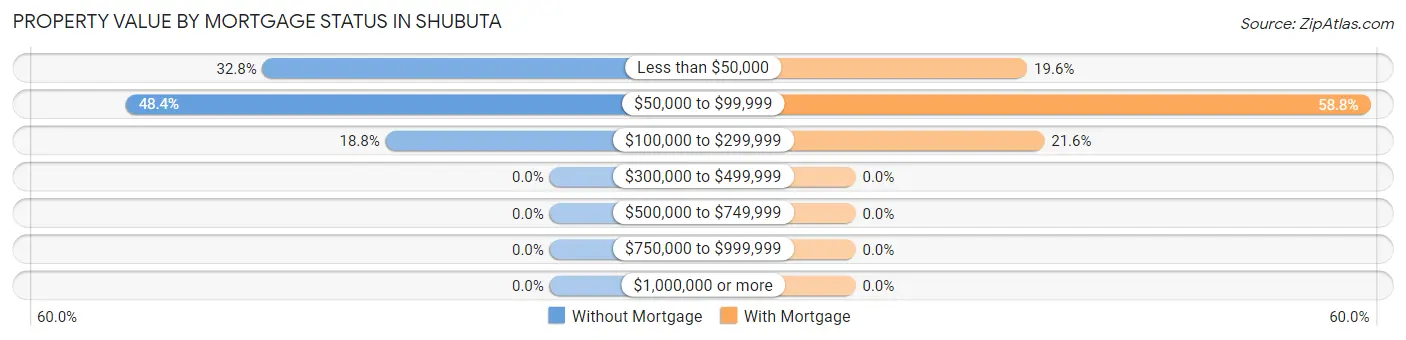
| Property Value | Without Mortgage | With Mortgage |
| Less than $50,000 | 21 (32.8%) | 10 (19.6%) |
| $50,000 to $99,999 | 31 (48.4%) | 30 (58.8%) |
| $100,000 to $299,999 | 12 (18.8%) | 11 (21.6%) |
| $300,000 to $499,999 | 0 (0.0%) | 0 (0.0%) |
| $500,000 to $749,999 | 0 (0.0%) | 0 (0.0%) |
| $750,000 to $999,999 | 0 (0.0%) | 0 (0.0%) |
| $1,000,000 or more | 0 (0.0%) | 0 (0.0%) |
| Total | 64 (100.0%) | 51 (100.0%) |
Household Income by Mortgage Status in Shubuta
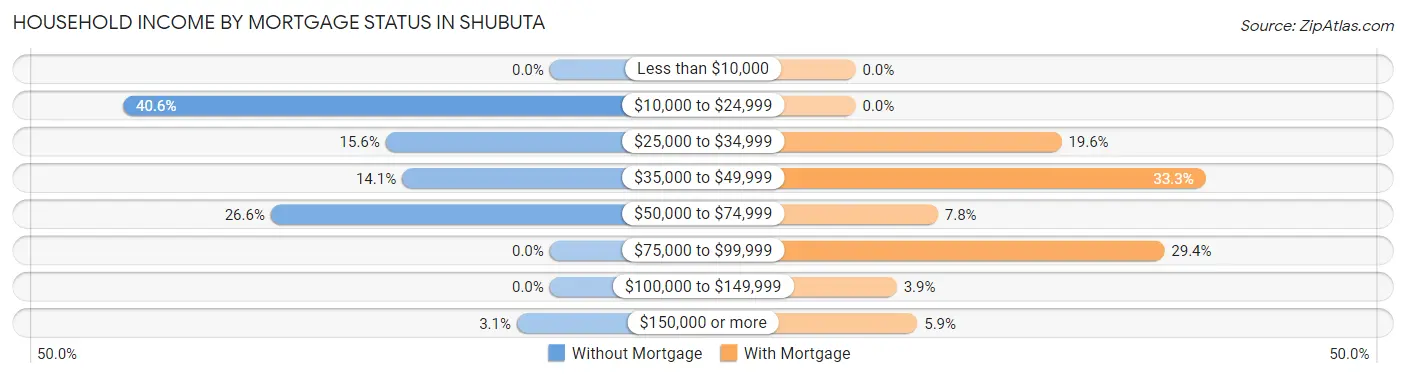
| Household Income | Without Mortgage | With Mortgage |
| Less than $10,000 | 0 (0.0%) | 0 (0.0%) |
| $10,000 to $24,999 | 26 (40.6%) | 0 (0.0%) |
| $25,000 to $34,999 | 10 (15.6%) | 10 (19.6%) |
| $35,000 to $49,999 | 9 (14.1%) | 17 (33.3%) |
| $50,000 to $74,999 | 17 (26.6%) | 4 (7.8%) |
| $75,000 to $99,999 | 0 (0.0%) | 15 (29.4%) |
| $100,000 to $149,999 | 0 (0.0%) | 2 (3.9%) |
| $150,000 or more | 2 (3.1%) | 3 (5.9%) |
| Total | 64 (100.0%) | 51 (100.0%) |
Property Value to Household Income Ratio in Shubuta
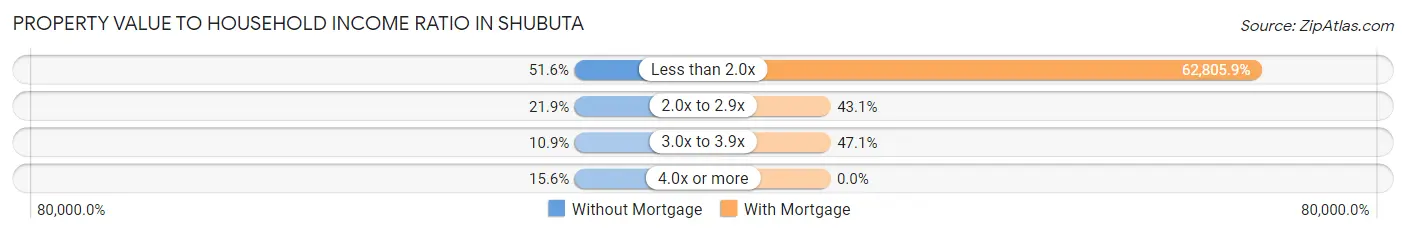
| Value-to-Income Ratio | Without Mortgage | With Mortgage |
| Less than 2.0x | 33 (51.6%) | 32,031 (62,805.9%) |
| 2.0x to 2.9x | 14 (21.9%) | 22 (43.1%) |
| 3.0x to 3.9x | 7 (10.9%) | 24 (47.1%) |
| 4.0x or more | 10 (15.6%) | 0 (0.0%) |
| Total | 64 (100.0%) | 51 (100.0%) |
Real Estate Taxes by Mortgage Status in Shubuta
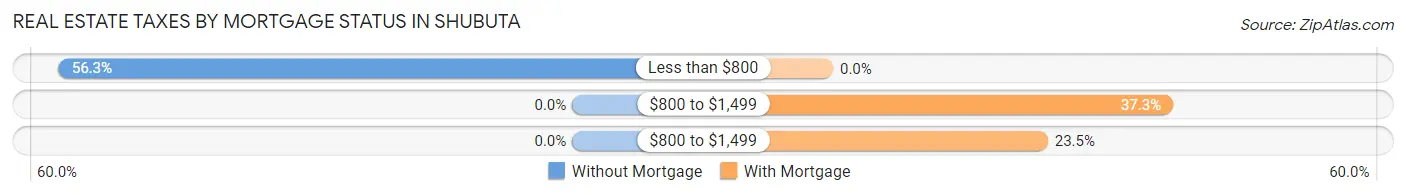
| Property Taxes | Without Mortgage | With Mortgage |
| Less than $800 | 36 (56.2%) | 0 (0.0%) |
| $800 to $1,499 | 0 (0.0%) | 19 (37.2%) |
| $800 to $1,499 | 0 (0.0%) | 12 (23.5%) |
| Total | 64 (100.0%) | 51 (100.0%) |
Health & Disability in Shubuta
Health Insurance Coverage by Age in Shubuta
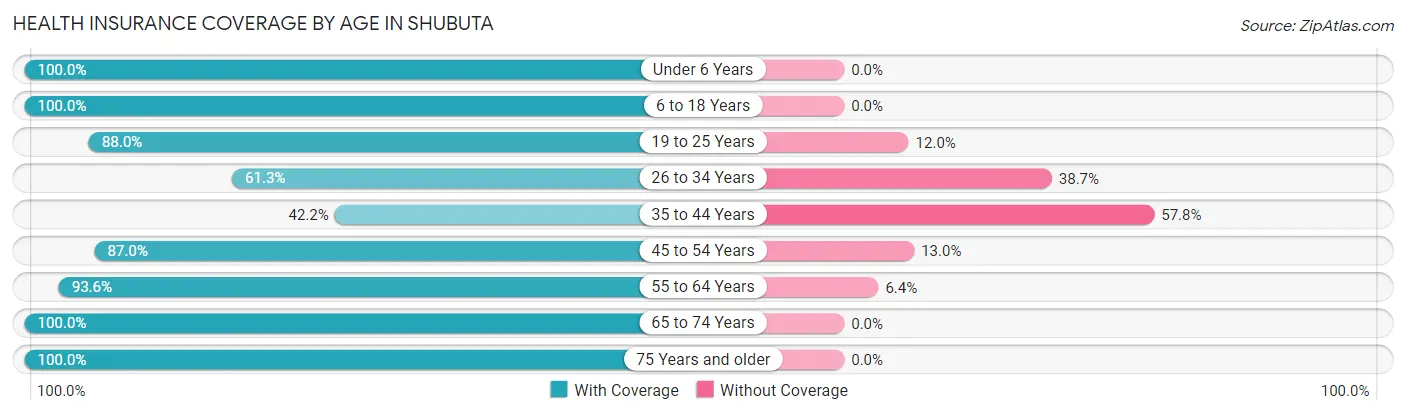
| Age Bracket | With Coverage | Without Coverage |
| Under 6 Years | 40 (100.0%) | 0 (0.0%) |
| 6 to 18 Years | 65 (100.0%) | 0 (0.0%) |
| 19 to 25 Years | 22 (88.0%) | 3 (12.0%) |
| 26 to 34 Years | 19 (61.3%) | 12 (38.7%) |
| 35 to 44 Years | 27 (42.2%) | 37 (57.8%) |
| 45 to 54 Years | 40 (87.0%) | 6 (13.0%) |
| 55 to 64 Years | 44 (93.6%) | 3 (6.4%) |
| 65 to 74 Years | 72 (100.0%) | 0 (0.0%) |
| 75 Years and older | 24 (100.0%) | 0 (0.0%) |
| Total | 353 (85.3%) | 61 (14.7%) |
Health Insurance Coverage by Citizenship Status in Shubuta
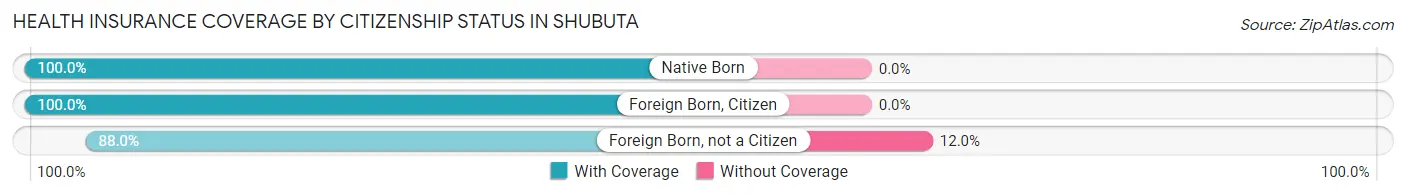
| Citizenship Status | With Coverage | Without Coverage |
| Native Born | 40 (100.0%) | 0 (0.0%) |
| Foreign Born, Citizen | 65 (100.0%) | 0 (0.0%) |
| Foreign Born, not a Citizen | 22 (88.0%) | 3 (12.0%) |
Health Insurance Coverage by Household Income in Shubuta
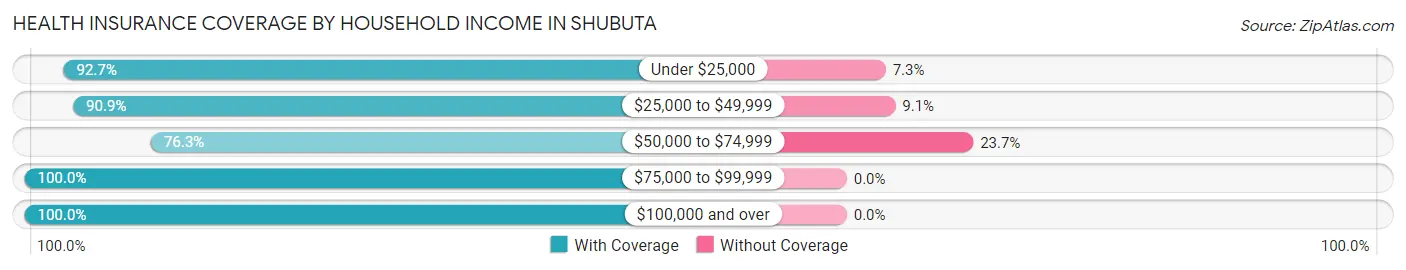
| Household Income | With Coverage | Without Coverage |
| Under $25,000 | 89 (92.7%) | 7 (7.3%) |
| $25,000 to $49,999 | 90 (90.9%) | 9 (9.1%) |
| $50,000 to $74,999 | 145 (76.3%) | 45 (23.7%) |
| $75,000 to $99,999 | 7 (100.0%) | 0 (0.0%) |
| $100,000 and over | 22 (100.0%) | 0 (0.0%) |
Public vs Private Health Insurance Coverage by Age in Shubuta
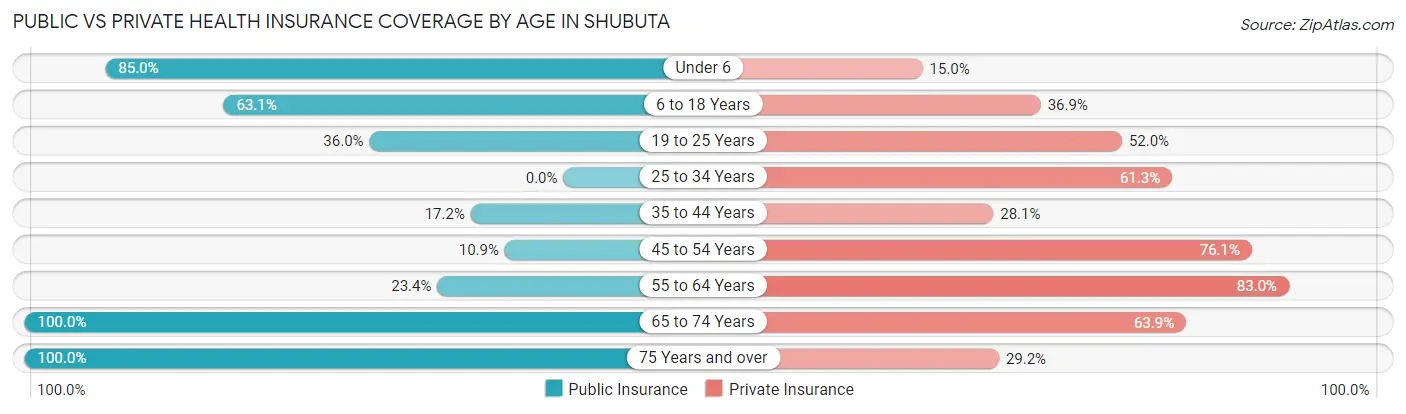
| Age Bracket | Public Insurance | Private Insurance |
| Under 6 | 34 (85.0%) | 6 (15.0%) |
| 6 to 18 Years | 41 (63.1%) | 24 (36.9%) |
| 19 to 25 Years | 9 (36.0%) | 13 (52.0%) |
| 25 to 34 Years | 0 (0.0%) | 19 (61.3%) |
| 35 to 44 Years | 11 (17.2%) | 18 (28.1%) |
| 45 to 54 Years | 5 (10.9%) | 35 (76.1%) |
| 55 to 64 Years | 11 (23.4%) | 39 (83.0%) |
| 65 to 74 Years | 72 (100.0%) | 46 (63.9%) |
| 75 Years and over | 24 (100.0%) | 7 (29.2%) |
| Total | 207 (50.0%) | 207 (50.0%) |
Disability Status by Sex by Age in Shubuta
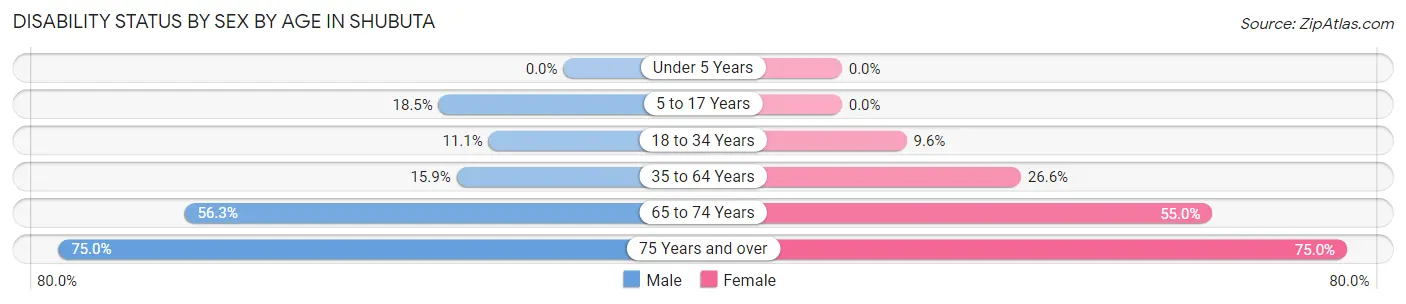
| Age Bracket | Male | Female |
| Under 5 Years | 0 (0.0%) | 0 (0.0%) |
| 5 to 17 Years | 5 (18.5%) | 0 (0.0%) |
| 18 to 34 Years | 3 (11.1%) | 5 (9.6%) |
| 35 to 64 Years | 10 (15.9%) | 25 (26.6%) |
| 65 to 74 Years | 18 (56.2%) | 22 (55.0%) |
| 75 Years and over | 6 (75.0%) | 12 (75.0%) |
Disability Class by Sex by Age in Shubuta
Disability Class: Hearing Difficulty
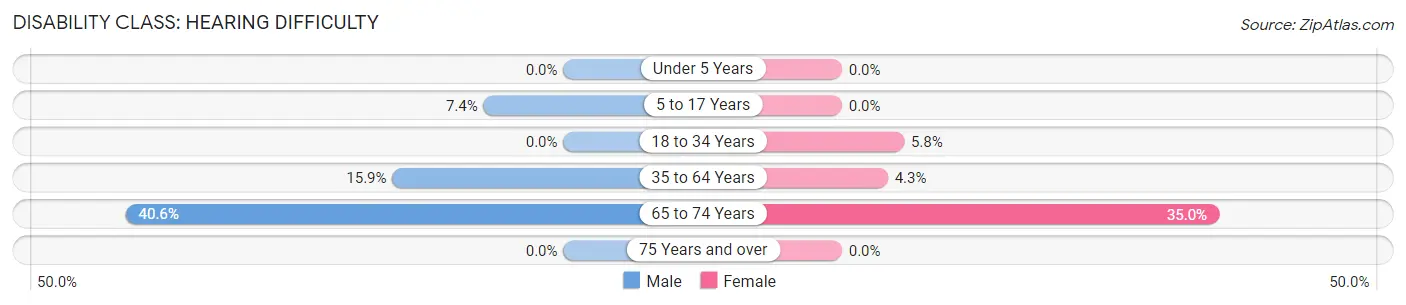
| Age Bracket | Male | Female |
| Under 5 Years | 0 (0.0%) | 0 (0.0%) |
| 5 to 17 Years | 2 (7.4%) | 0 (0.0%) |
| 18 to 34 Years | 0 (0.0%) | 3 (5.8%) |
| 35 to 64 Years | 10 (15.9%) | 4 (4.3%) |
| 65 to 74 Years | 13 (40.6%) | 14 (35.0%) |
| 75 Years and over | 0 (0.0%) | 0 (0.0%) |
Disability Class: Vision Difficulty
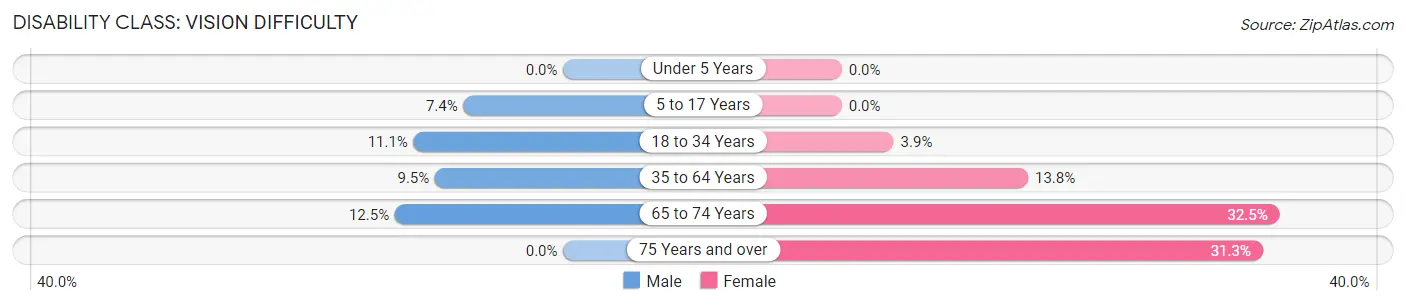
| Age Bracket | Male | Female |
| Under 5 Years | 0 (0.0%) | 0 (0.0%) |
| 5 to 17 Years | 2 (7.4%) | 0 (0.0%) |
| 18 to 34 Years | 3 (11.1%) | 2 (3.8%) |
| 35 to 64 Years | 6 (9.5%) | 13 (13.8%) |
| 65 to 74 Years | 4 (12.5%) | 13 (32.5%) |
| 75 Years and over | 0 (0.0%) | 5 (31.2%) |
Disability Class: Cognitive Difficulty
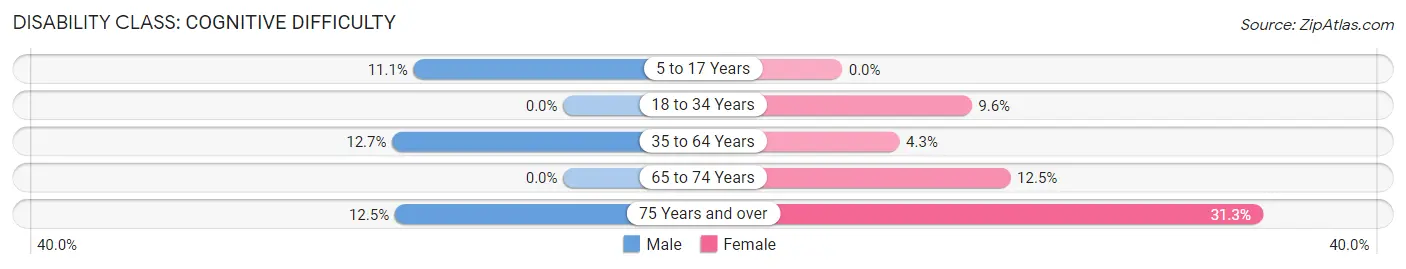
| Age Bracket | Male | Female |
| 5 to 17 Years | 3 (11.1%) | 0 (0.0%) |
| 18 to 34 Years | 0 (0.0%) | 5 (9.6%) |
| 35 to 64 Years | 8 (12.7%) | 4 (4.3%) |
| 65 to 74 Years | 0 (0.0%) | 5 (12.5%) |
| 75 Years and over | 1 (12.5%) | 5 (31.2%) |
Disability Class: Ambulatory Difficulty
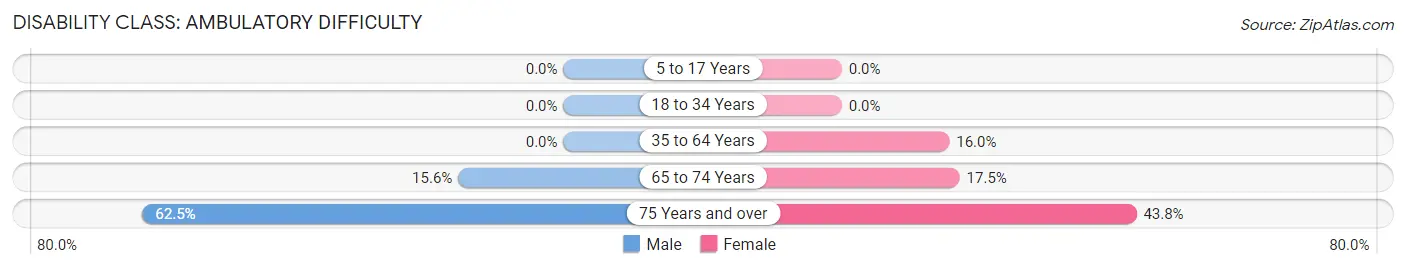
| Age Bracket | Male | Female |
| 5 to 17 Years | 0 (0.0%) | 0 (0.0%) |
| 18 to 34 Years | 0 (0.0%) | 0 (0.0%) |
| 35 to 64 Years | 0 (0.0%) | 15 (16.0%) |
| 65 to 74 Years | 5 (15.6%) | 7 (17.5%) |
| 75 Years and over | 5 (62.5%) | 7 (43.8%) |
Disability Class: Self-Care Difficulty
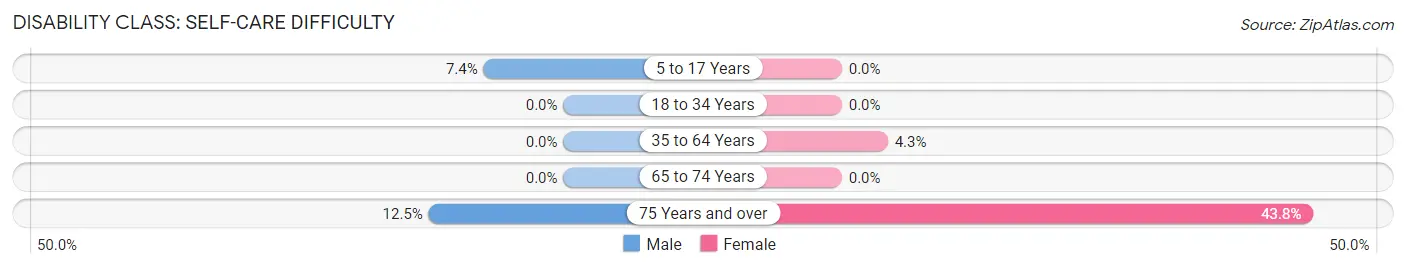
| Age Bracket | Male | Female |
| 5 to 17 Years | 2 (7.4%) | 0 (0.0%) |
| 18 to 34 Years | 0 (0.0%) | 0 (0.0%) |
| 35 to 64 Years | 0 (0.0%) | 4 (4.3%) |
| 65 to 74 Years | 0 (0.0%) | 0 (0.0%) |
| 75 Years and over | 1 (12.5%) | 7 (43.8%) |
Technology Access in Shubuta
Computing Device Access in Shubuta
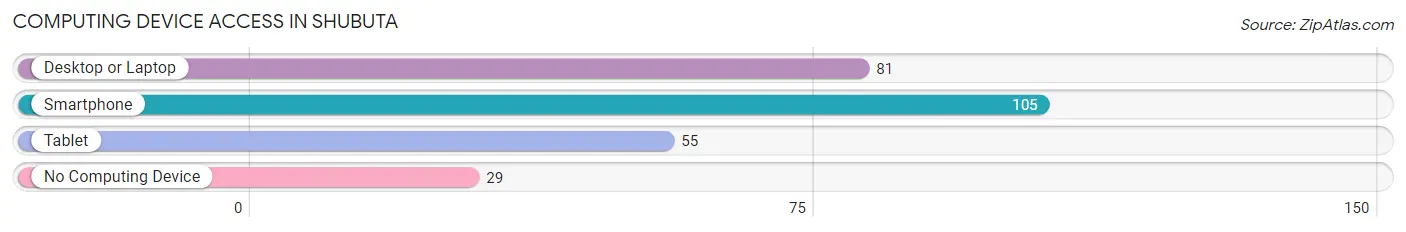
| Device Type | # Households | % Households |
| Desktop or Laptop | 81 | 54.4% |
| Smartphone | 105 | 70.5% |
| Tablet | 55 | 36.9% |
| No Computing Device | 29 | 19.5% |
| Total | 149 | 100.0% |
Internet Access in Shubuta
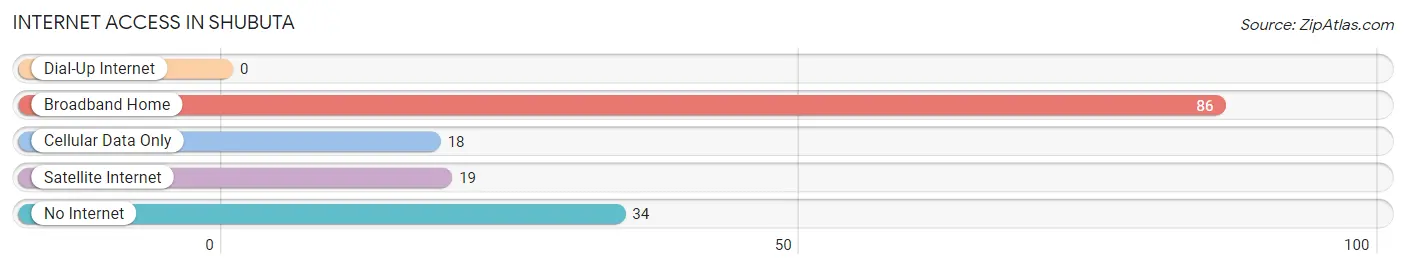
| Internet Type | # Households | % Households |
| Dial-Up Internet | 0 | 0.0% |
| Broadband Home | 86 | 57.7% |
| Cellular Data Only | 18 | 12.1% |
| Satellite Internet | 19 | 12.8% |
| No Internet | 34 | 22.8% |
| Total | 149 | 100.0% |
Shubuta Summary
Shubuta, Mississippi is a small town located in Clarke County, Mississippi. It is situated on the banks of the Chickasawhay River, about 20 miles south of Meridian. The town was founded in 1832 and is the oldest settlement in Clarke County. The population of Shubuta was 1,093 at the 2010 census.
History
Shubuta was founded in 1832 by a group of settlers from Georgia and South Carolina. The town was named after a Choctaw chief, Shubuta, who lived in the area. The town was originally a trading post and was the first settlement in Clarke County.
In 1836, the town was incorporated and a post office was established. The town grew rapidly and by the mid-1800s, it was a thriving commercial center. The town was home to several stores, a hotel, a sawmill, and a cotton gin.
During the Civil War, Shubuta was a Confederate stronghold. The town was the site of several skirmishes between Union and Confederate forces. After the war, the town slowly began to rebuild.
Geography
Shubuta is located in Clarke County, Mississippi. It is situated on the banks of the Chickasawhay River, about 20 miles south of Meridian. The town is located in the Piney Woods region of Mississippi and is surrounded by forests and rolling hills.
The climate in Shubuta is humid subtropical, with hot, humid summers and mild winters. The average annual temperature is around 68°F (20°C). The average annual precipitation is around 50 inches (127 cm).
Economy
The economy of Shubuta is largely based on agriculture. The town is home to several farms, which produce cotton, soybeans, corn, and other crops. The town is also home to several small businesses, including restaurants, stores, and service providers.
Demographics
As of the 2010 census, the population of Shubuta was 1,093. The racial makeup of the town was 79.3% White, 19.2% African American, 0.2% Native American, 0.2% Asian, and 0.9% from other races. The median household income was $25,938. The per capita income was $14,945.
Conclusion
Shubuta, Mississippi is a small town located in Clarke County, Mississippi. It was founded in 1832 and is the oldest settlement in the county. The town is situated on the banks of the Chickasawhay River and is surrounded by forests and rolling hills. The economy of Shubuta is largely based on agriculture and the town is home to several small businesses. The population of Shubuta was 1,093 at the 2010 census.
Common Questions
What is Per Capita Income in Shubuta?
Per Capita income in Shubuta is $19,218.
What is the Median Family Income in Shubuta?
Median Family Income in Shubuta is $50,063.
What is the Median Household income in Shubuta?
Median Household Income in Shubuta is $32,159.
What is Income or Wage Gap in Shubuta?
Income or Wage Gap in Shubuta is 32.1%.
Women in Shubuta earn 67.9 cents for every dollar earned by a man.
What is Inequality or Gini Index in Shubuta?
Inequality or Gini Index in Shubuta is 0.33.
What is the Total Population of Shubuta?
Total Population of Shubuta is 414.
What is the Total Male Population of Shubuta?
Total Male Population of Shubuta is 176.
What is the Total Female Population of Shubuta?
Total Female Population of Shubuta is 238.
What is the Ratio of Males per 100 Females in Shubuta?
There are 73.95 Males per 100 Females in Shubuta.
What is the Ratio of Females per 100 Males in Shubuta?
There are 135.23 Females per 100 Males in Shubuta.
What is the Median Population Age in Shubuta?
Median Population Age in Shubuta is 44.4 Years.
What is the Average Family Size in Shubuta
Average Family Size in Shubuta is 3.5 People.
What is the Average Household Size in Shubuta
Average Household Size in Shubuta is 2.8 People.
How Large is the Labor Force in Shubuta?
There are 165 People in the Labor Forcein in Shubuta.
What is the Percentage of People in the Labor Force in Shubuta?
48.2% of People are in the Labor Force in Shubuta.
What is the Unemployment Rate in Shubuta?
Unemployment Rate in Shubuta is 11.5%.