Shaw, MS Map & Demographics
Shaw Map
Shaw Overview
$15,275
PER CAPITA INCOME
$29,271
AVG FAMILY INCOME
$23,875
AVG HOUSEHOLD INCOME
33.3%
WAGE / INCOME GAP [ % ]
66.7¢/ $1
WAGE / INCOME GAP [ $ ]
$14,186
FAMILY INCOME DEFICIT
0.48
INEQUALITY / GINI INDEX
1,615
TOTAL POPULATION
656
MALE POPULATION
959
FEMALE POPULATION
68.40
MALES / 100 FEMALES
146.19
FEMALES / 100 MALES
38.3
MEDIAN AGE
2.8
AVG FAMILY SIZE
2.4
AVG HOUSEHOLD SIZE
577
LABOR FORCE [ PEOPLE ]
46.6%
PERCENT IN LABOR FORCE
8.1%
UNEMPLOYMENT RATE
Shaw Zip Codes
Shaw Area Codes
Income in Shaw
Income Overview in Shaw
Per Capita Income in Shaw is $15,275, while median incomes of families and households are $29,271 and $23,875 respectively.
| Characteristic | Number | Measure |
| Per Capita Income | 1,615 | $15,275 |
| Median Family Income | 484 | $29,271 |
| Mean Family Income | 484 | $40,196 |
| Median Household Income | 686 | $23,875 |
| Mean Household Income | 686 | $35,834 |
| Income Deficit | 484 | $14,186 |
| Wage / Income Gap (%) | 1,615 | 33.30% |
| Wage / Income Gap ($) | 1,615 | 66.70¢ per $1 |
| Gini / Inequality Index | 1,615 | 0.48 |
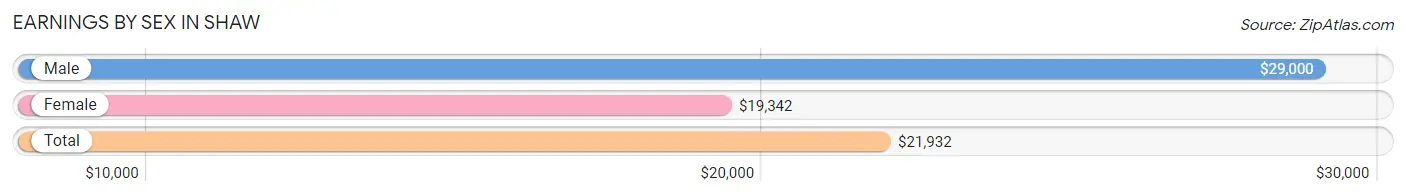
Earnings by Sex in Shaw
Average Earnings in Shaw are $21,932, $29,000 for men and $19,342 for women, a difference of 33.3%.
| Sex | Number | Average Earnings |
| Male | 202 (34.9%) | $29,000 |
| Female | 376 (65.0%) | $19,342 |
| Total | 578 (100.0%) | $21,932 |
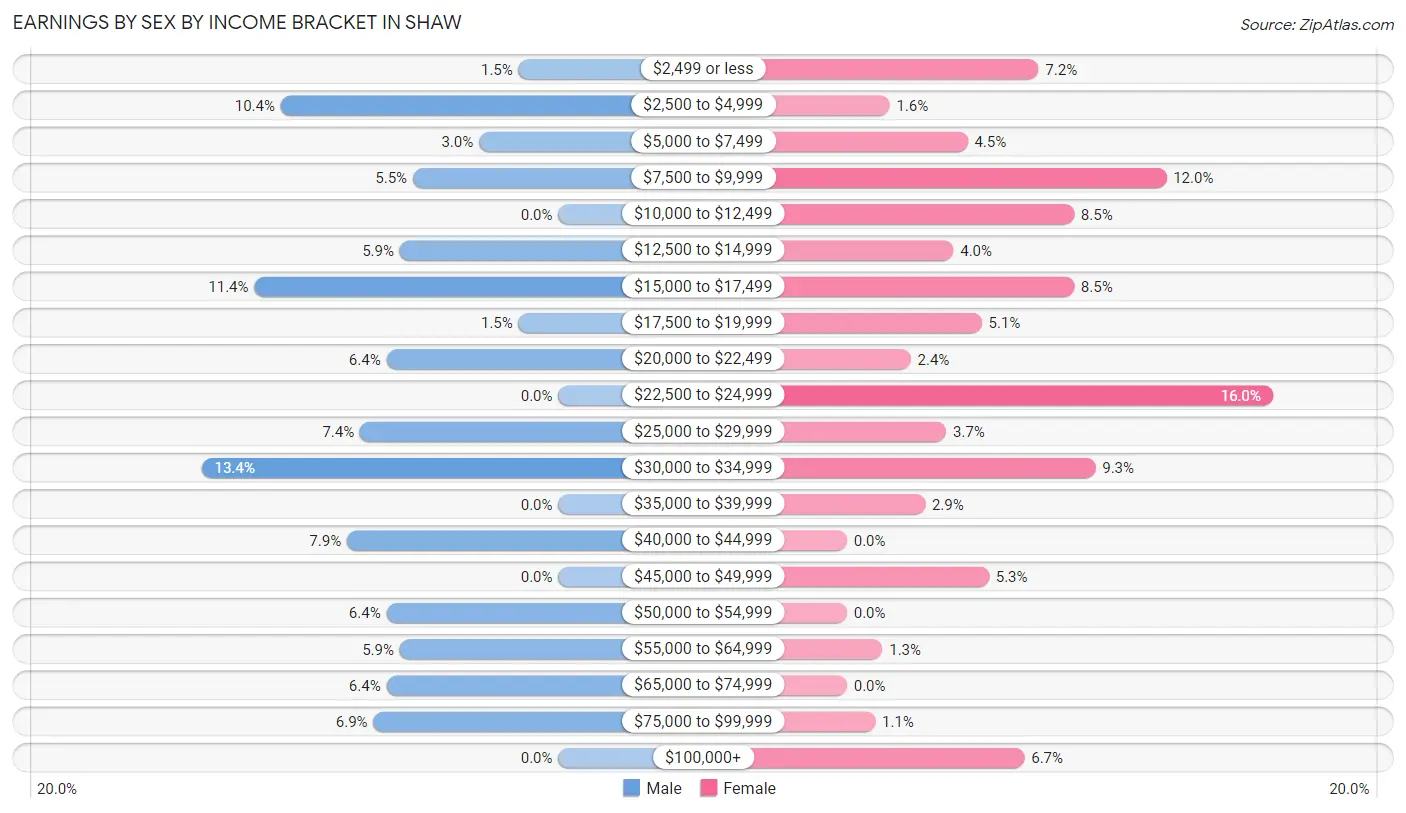
Earnings by Sex by Income Bracket in Shaw
The most common earnings brackets in Shaw are $30,000 to $34,999 for men (27 | 13.4%) and $22,500 to $24,999 for women (60 | 16.0%).
| Income | Male | Female |
| $2,499 or less | 3 (1.5%) | 27 (7.2%) |
| $2,500 to $4,999 | 21 (10.4%) | 6 (1.6%) |
| $5,000 to $7,499 | 6 (3.0%) | 17 (4.5%) |
| $7,500 to $9,999 | 11 (5.4%) | 45 (12.0%) |
| $10,000 to $12,499 | 0 (0.0%) | 32 (8.5%) |
| $12,500 to $14,999 | 12 (5.9%) | 15 (4.0%) |
| $15,000 to $17,499 | 23 (11.4%) | 32 (8.5%) |
| $17,500 to $19,999 | 3 (1.5%) | 19 (5.1%) |
| $20,000 to $22,499 | 13 (6.4%) | 9 (2.4%) |
| $22,500 to $24,999 | 0 (0.0%) | 60 (16.0%) |
| $25,000 to $29,999 | 15 (7.4%) | 14 (3.7%) |
| $30,000 to $34,999 | 27 (13.4%) | 35 (9.3%) |
| $35,000 to $39,999 | 0 (0.0%) | 11 (2.9%) |
| $40,000 to $44,999 | 16 (7.9%) | 0 (0.0%) |
| $45,000 to $49,999 | 0 (0.0%) | 20 (5.3%) |
| $50,000 to $54,999 | 13 (6.4%) | 0 (0.0%) |
| $55,000 to $64,999 | 12 (5.9%) | 5 (1.3%) |
| $65,000 to $74,999 | 13 (6.4%) | 0 (0.0%) |
| $75,000 to $99,999 | 14 (6.9%) | 4 (1.1%) |
| $100,000+ | 0 (0.0%) | 25 (6.7%) |
| Total | 202 (100.0%) | 376 (100.0%) |
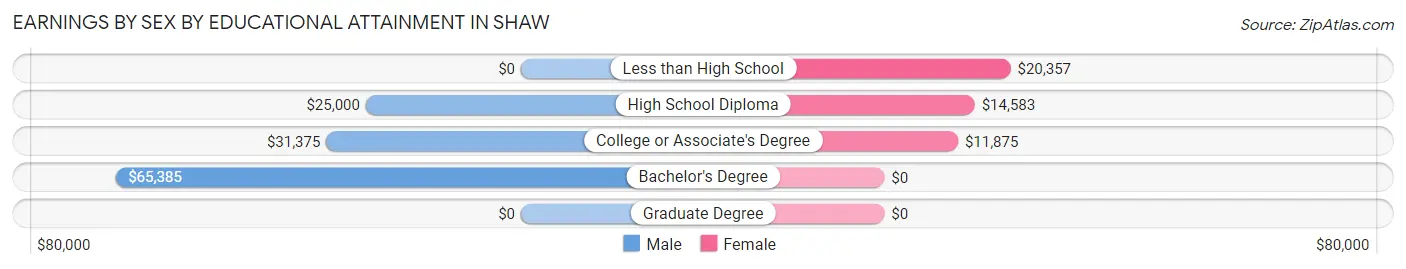
Earnings by Sex by Educational Attainment in Shaw
Average earnings in Shaw are $31,625 for men and $17,895 for women, a difference of 43.4%. Men with an educational attainment of bachelor's degree enjoy the highest average annual earnings of $65,385, while those with high school diploma education earn the least with $25,000. Women with an educational attainment of less than high school earn the most with the average annual earnings of $20,357, while those with college or associate's degree education have the smallest earnings of $11,875.
| Educational Attainment | Male Income | Female Income |
| Less than High School | - | - |
| High School Diploma | $25,000 | $14,583 |
| College or Associate's Degree | $31,375 | $11,875 |
| Bachelor's Degree | $65,385 | $0 |
| Graduate Degree | - | - |
| Total | $31,625 | $17,895 |
Family Income in Shaw
Family Income Brackets in Shaw
According to the Shaw family income data, there are 99 families falling into the less than $10,000 income range, which is the most common income bracket and makes up 20.4% of all families.
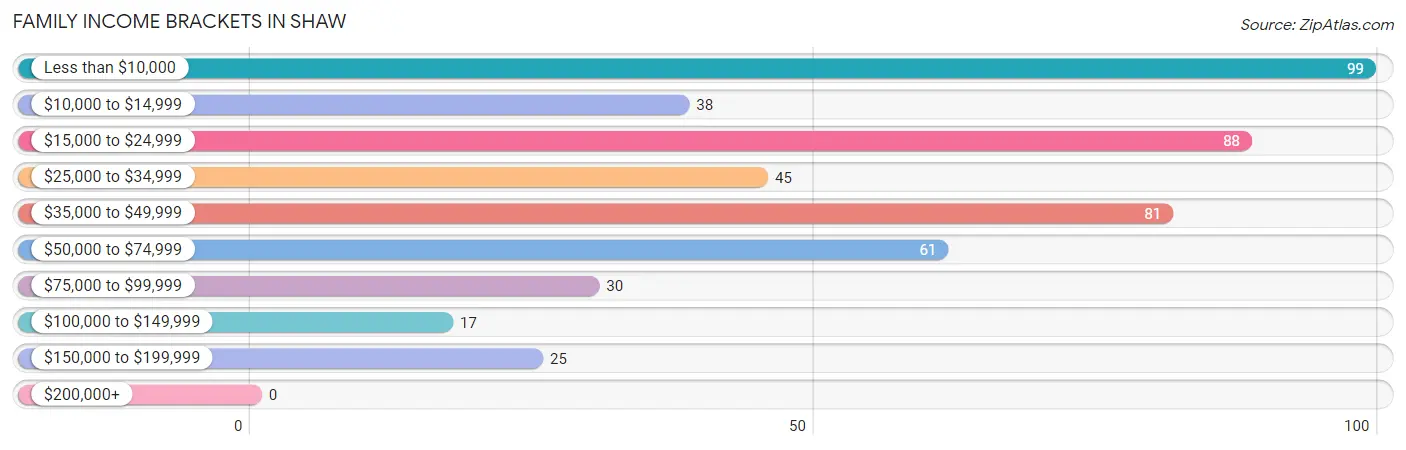
| Income Bracket | # Families | % Families |
| Less than $10,000 | 99 | 20.5% |
| $10,000 to $14,999 | 38 | 7.9% |
| $15,000 to $24,999 | 88 | 18.2% |
| $25,000 to $34,999 | 45 | 9.3% |
| $35,000 to $49,999 | 81 | 16.7% |
| $50,000 to $74,999 | 61 | 12.6% |
| $75,000 to $99,999 | 30 | 6.2% |
| $100,000 to $149,999 | 17 | 3.5% |
| $150,000 to $199,999 | 25 | 5.2% |
| $200,000+ | 0 | 0.0% |
Family Income by Famaliy Size in Shaw
3-person families (85 | 17.6%) account for the highest median family income in Shaw with $72,321 per family, while 3-person families (85 | 17.6%) have the highest median income of $24,107 per family member.
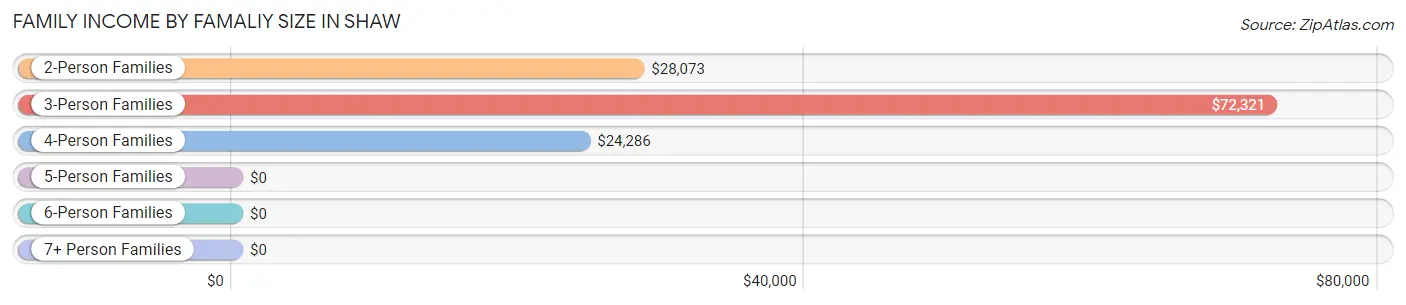
| Income Bracket | # Families | Median Income |
| 2-Person Families | 255 (52.7%) | $28,073 |
| 3-Person Families | 85 (17.6%) | $72,321 |
| 4-Person Families | 82 (16.9%) | $24,286 |
| 5-Person Families | 30 (6.2%) | $0 |
| 6-Person Families | 32 (6.6%) | $0 |
| 7+ Person Families | 0 (0.0%) | $0 |
| Total | 484 (100.0%) | $29,271 |
Family Income by Number of Earners in Shaw
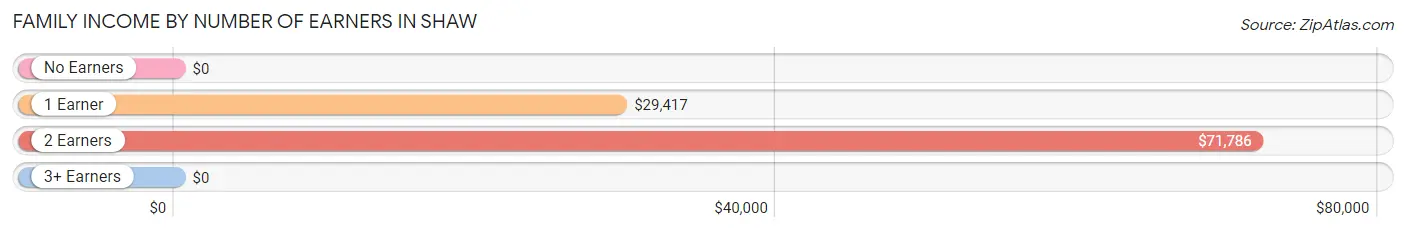
| Number of Earners | # Families | Median Income |
| No Earners | 132 (27.3%) | $0 |
| 1 Earner | 243 (50.2%) | $29,417 |
| 2 Earners | 104 (21.5%) | $71,786 |
| 3+ Earners | 5 (1.0%) | $0 |
| Total | 484 (100.0%) | $29,271 |
Household Income in Shaw
Household Income Brackets in Shaw
With 159 households falling in the category, the $15,000 to $24,999 income range is the most frequent in Shaw, accounting for 23.2% of all households.
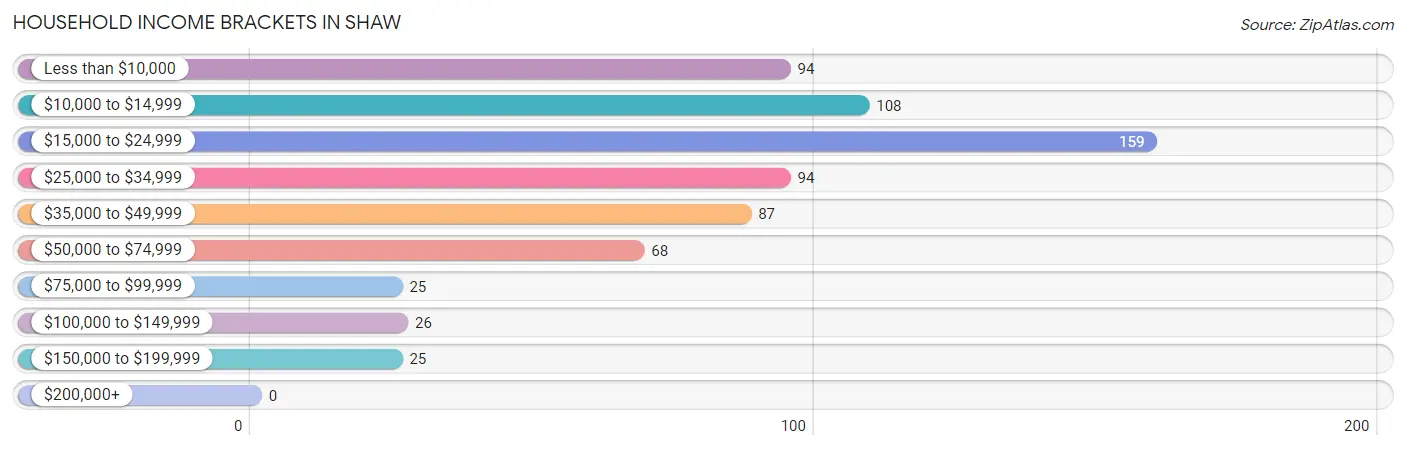
| Income Bracket | # Households | % Households |
| Less than $10,000 | 94 | 13.7% |
| $10,000 to $14,999 | 108 | 15.7% |
| $15,000 to $24,999 | 159 | 23.2% |
| $25,000 to $34,999 | 94 | 13.7% |
| $35,000 to $49,999 | 87 | 12.7% |
| $50,000 to $74,999 | 68 | 9.9% |
| $75,000 to $99,999 | 25 | 3.6% |
| $100,000 to $149,999 | 26 | 3.8% |
| $150,000 to $199,999 | 25 | 3.6% |
| $200,000+ | 0 | 0.0% |
Household Income by Householder Age in Shaw
The median household income in Shaw is $23,875, with the highest median household income of $32,000 found in the 45 to 64 years age bracket for the primary householder. A total of 202 households (29.4%) fall into this category.
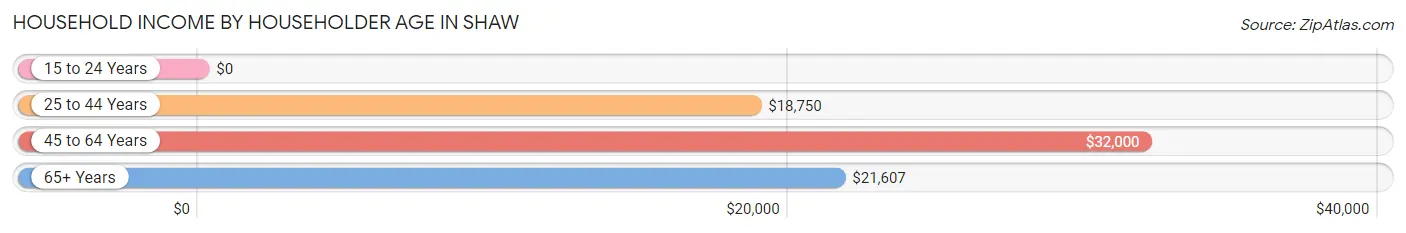
| Income Bracket | # Households | Median Income |
| 15 to 24 Years | 0 (0.0%) | $0 |
| 25 to 44 Years | 192 (28.0%) | $18,750 |
| 45 to 64 Years | 202 (29.4%) | $32,000 |
| 65+ Years | 292 (42.6%) | $21,607 |
| Total | 686 (100.0%) | $23,875 |
Poverty in Shaw
Income Below Poverty by Sex and Age in Shaw
With 41.0% poverty level for males and 43.8% for females among the residents of Shaw, 6 to 11 year old males and 25 to 34 year old females are the most vulnerable to poverty, with 59 males (88.1%) and 83 females (69.2%) in their respective age groups living below the poverty level.
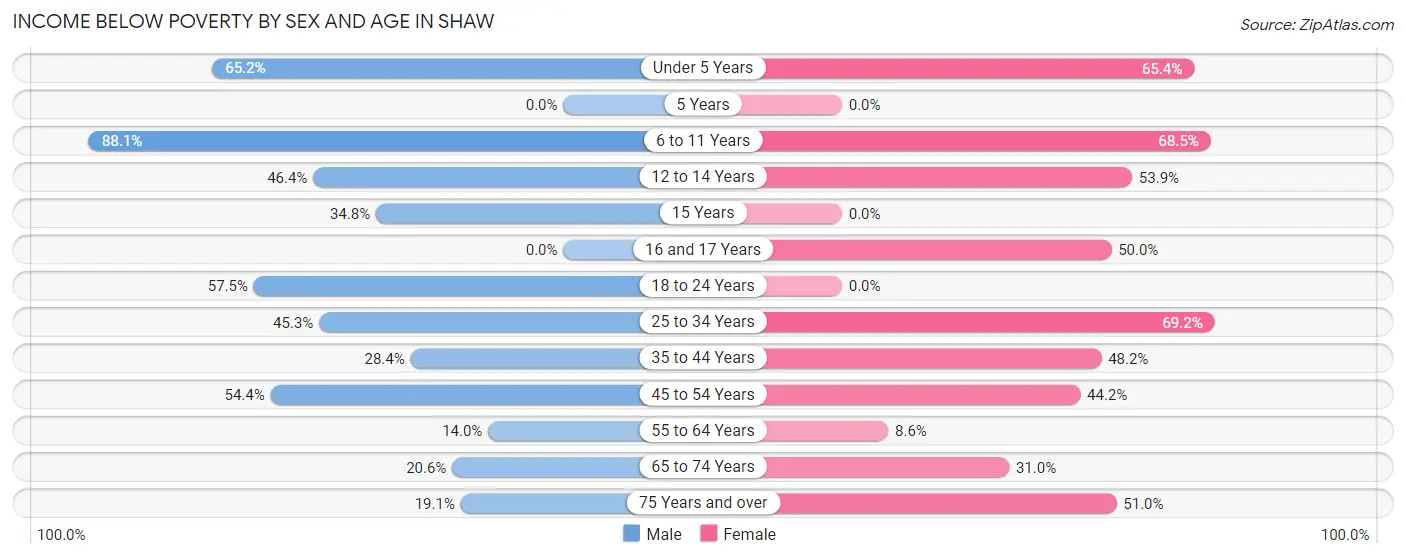
| Age Bracket | Male | Female |
| Under 5 Years | 43 (65.1%) | 17 (65.4%) |
| 5 Years | 0 (0.0%) | 0 (0.0%) |
| 6 to 11 Years | 59 (88.1%) | 89 (68.5%) |
| 12 to 14 Years | 13 (46.4%) | 7 (53.8%) |
| 15 Years | 16 (34.8%) | 0 (0.0%) |
| 16 and 17 Years | 0 (0.0%) | 27 (50.0%) |
| 18 to 24 Years | 27 (57.5%) | 0 (0.0%) |
| 25 to 34 Years | 34 (45.3%) | 83 (69.2%) |
| 35 to 44 Years | 19 (28.4%) | 65 (48.1%) |
| 45 to 54 Years | 25 (54.3%) | 23 (44.2%) |
| 55 to 64 Years | 12 (14.0%) | 11 (8.6%) |
| 65 to 74 Years | 13 (20.6%) | 45 (31.0%) |
| 75 Years and over | 8 (19.1%) | 53 (51.0%) |
| Total | 269 (41.0%) | 420 (43.8%) |
Income Above Poverty by Sex and Age in Shaw
According to the poverty statistics in Shaw, males aged 16 and 17 years and females aged 18 to 24 years are the age groups that are most secure financially, with 100.0% of males and 100.0% of females in these age groups living above the poverty line.
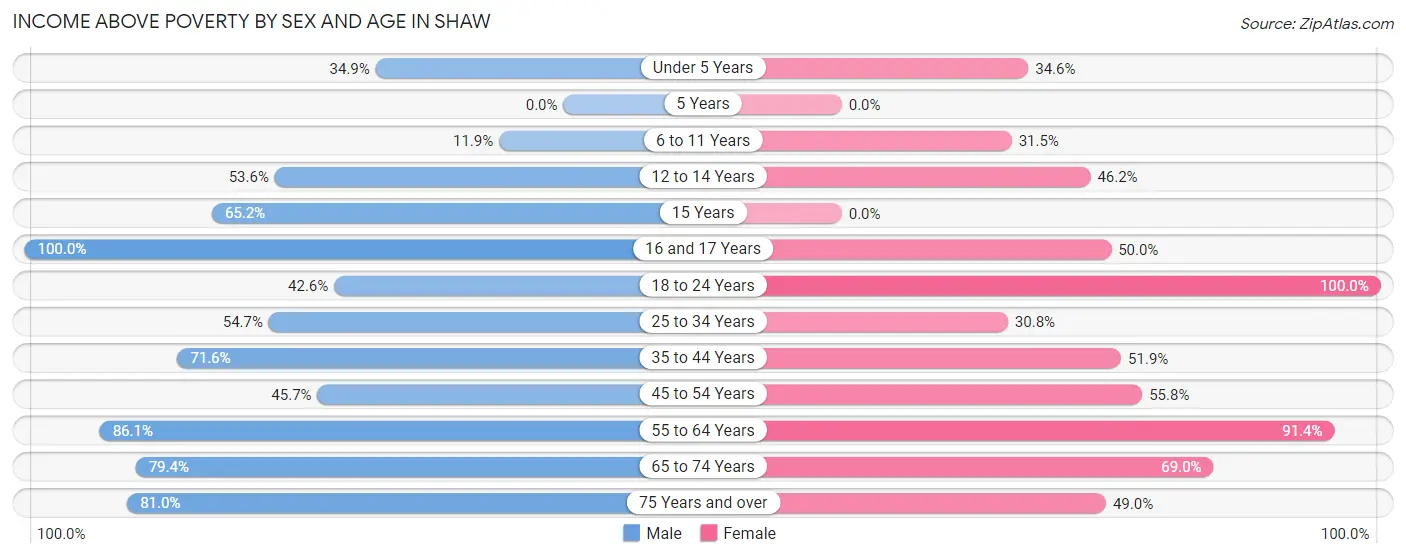
| Age Bracket | Male | Female |
| Under 5 Years | 23 (34.8%) | 9 (34.6%) |
| 5 Years | 0 (0.0%) | 0 (0.0%) |
| 6 to 11 Years | 8 (11.9%) | 41 (31.5%) |
| 12 to 14 Years | 15 (53.6%) | 6 (46.2%) |
| 15 Years | 30 (65.2%) | 0 (0.0%) |
| 16 and 17 Years | 23 (100.0%) | 27 (50.0%) |
| 18 to 24 Years | 20 (42.5%) | 52 (100.0%) |
| 25 to 34 Years | 41 (54.7%) | 37 (30.8%) |
| 35 to 44 Years | 48 (71.6%) | 70 (51.8%) |
| 45 to 54 Years | 21 (45.7%) | 29 (55.8%) |
| 55 to 64 Years | 74 (86.1%) | 117 (91.4%) |
| 65 to 74 Years | 50 (79.4%) | 100 (69.0%) |
| 75 Years and over | 34 (80.9%) | 51 (49.0%) |
| Total | 387 (59.0%) | 539 (56.2%) |
Income Below Poverty Among Married-Couple Families in Shaw
The poverty statistics for married-couple families in Shaw show that 25.7% or 44 of the total 171 families live below the poverty line. Families with 1 or 2 children have the highest poverty rate of 57.1%, comprising of 20 families. On the other hand, families with no children have the lowest poverty rate of 17.6%, which includes 24 families.
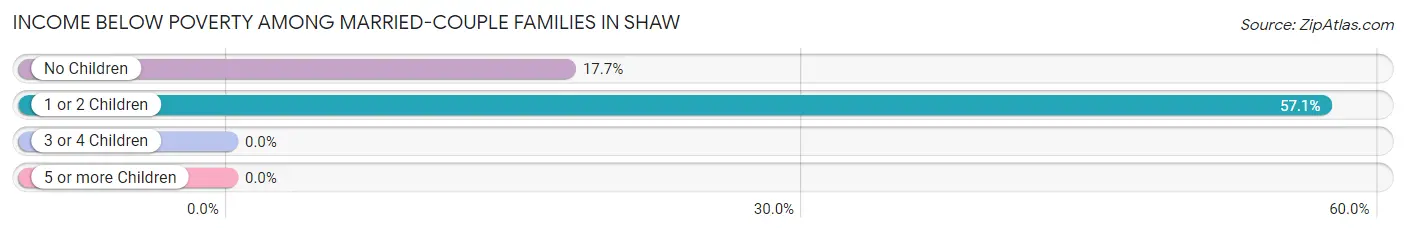
| Children | Above Poverty | Below Poverty |
| No Children | 112 (82.4%) | 24 (17.6%) |
| 1 or 2 Children | 15 (42.9%) | 20 (57.1%) |
| 3 or 4 Children | 0 (0.0%) | 0 (0.0%) |
| 5 or more Children | 0 (0.0%) | 0 (0.0%) |
| Total | 127 (74.3%) | 44 (25.7%) |
Income Below Poverty Among Single-Parent Households in Shaw
According to the poverty data in Shaw, 34.6% or 28 single-father households and 56.0% or 130 single-mother households are living below the poverty line. Among single-father households, those with 5 or more children have the highest poverty rate, with 12 households (100.0%) experiencing poverty. Likewise, among single-mother households, those with 5 or more children have the highest poverty rate, with 20 households (100.0%) falling below the poverty line.
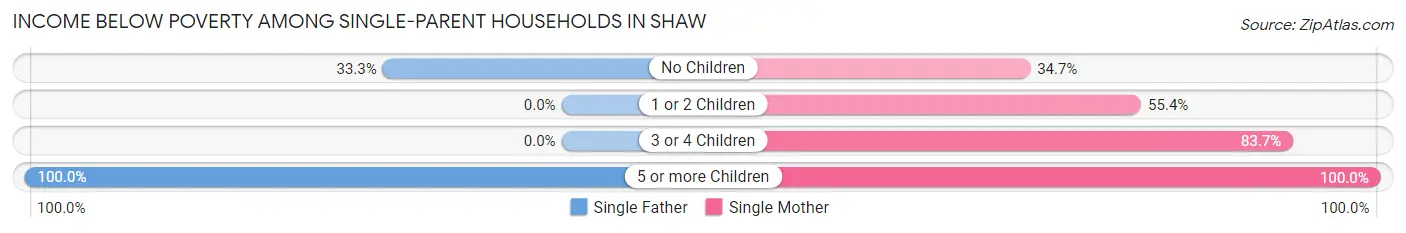
| Children | Single Father | Single Mother |
| No Children | 16 (33.3%) | 33 (34.7%) |
| 1 or 2 Children | 0 (0.0%) | 41 (55.4%) |
| 3 or 4 Children | 0 (0.0%) | 36 (83.7%) |
| 5 or more Children | 12 (100.0%) | 20 (100.0%) |
| Total | 28 (34.6%) | 130 (56.0%) |
Income Below Poverty Among Married-Couple vs Single-Parent Households in Shaw
The poverty data for Shaw shows that 44 of the married-couple family households (25.7%) and 158 of the single-parent households (50.5%) are living below the poverty level. Within the married-couple family households, those with 1 or 2 children have the highest poverty rate, with 20 households (57.1%) falling below the poverty line. Among the single-parent households, those with 5 or more children have the highest poverty rate, with 32 household (100.0%) living below poverty.
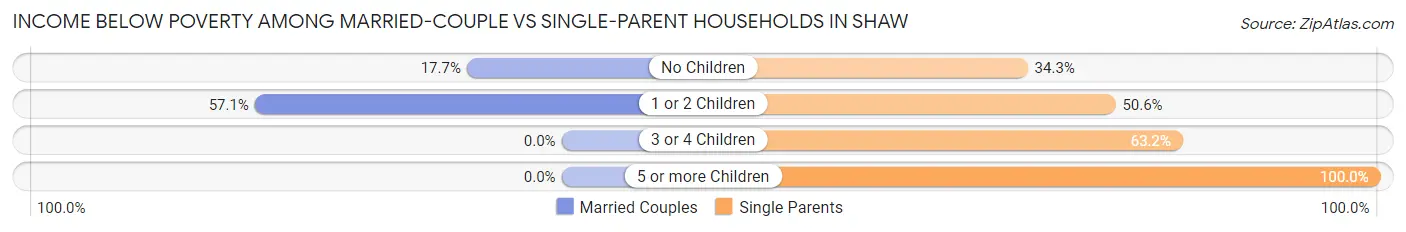
| Children | Married-Couple Families | Single-Parent Households |
| No Children | 24 (17.6%) | 49 (34.3%) |
| 1 or 2 Children | 20 (57.1%) | 41 (50.6%) |
| 3 or 4 Children | 0 (0.0%) | 36 (63.2%) |
| 5 or more Children | 0 (0.0%) | 32 (100.0%) |
| Total | 44 (25.7%) | 158 (50.5%) |
Race in Shaw
The most populous races in Shaw are Black / African American (1,464 | 90.6%), White / Caucasian (111 | 6.9%), and Hispanic or Latino (40 | 2.5%).
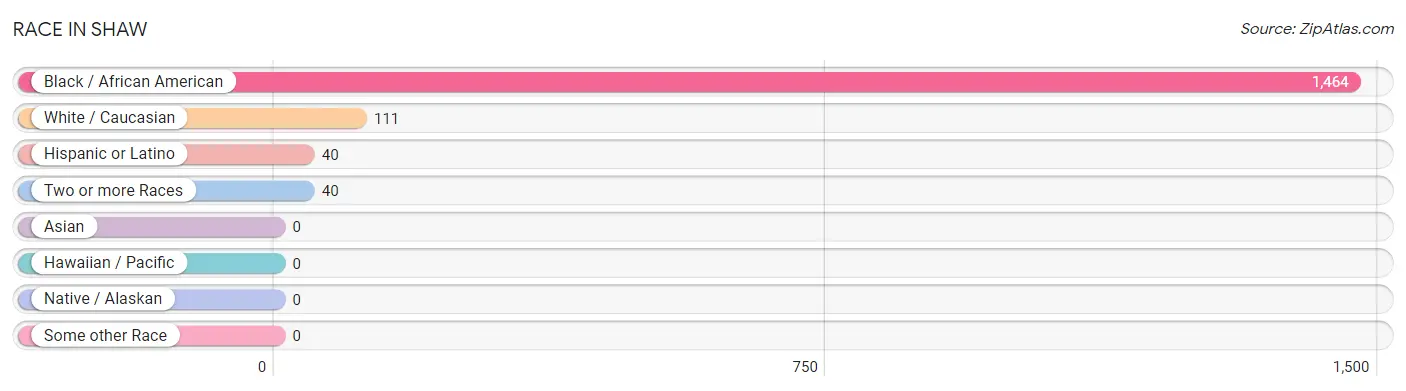
| Race | # Population | % Population |
| Asian | 0 | 0.0% |
| Black / African American | 1,464 | 90.6% |
| Hawaiian / Pacific | 0 | 0.0% |
| Hispanic or Latino | 40 | 2.5% |
| Native / Alaskan | 0 | 0.0% |
| White / Caucasian | 111 | 6.9% |
| Two or more Races | 40 | 2.5% |
| Some other Race | 0 | 0.0% |
| Total | 1,615 | 100.0% |
Ancestry in Shaw
The most populous ancestries reported in Shaw are Jamaican (67 | 4.2%), African (49 | 3.0%), Subsaharan African (49 | 3.0%), German (48 | 3.0%), and Puerto Rican (40 | 2.5%), together accounting for 15.7% of all Shaw residents.
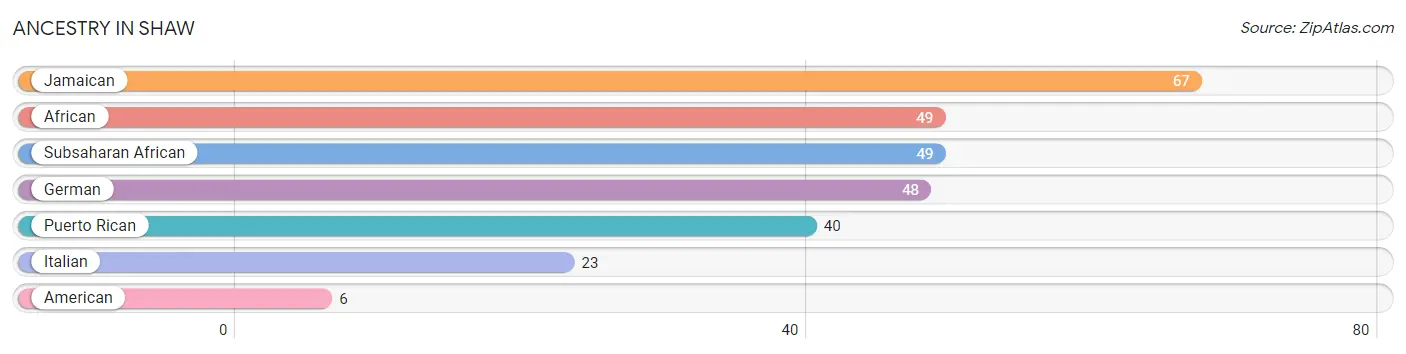
| Ancestry | # Population | % Population |
| African | 49 | 3.0% |
| American | 6 | 0.4% |
| German | 48 | 3.0% |
| Italian | 23 | 1.4% |
| Jamaican | 67 | 4.2% |
| Puerto Rican | 40 | 2.5% |
| Subsaharan African | 49 | 3.0% | View All 7 Rows |
Immigrants in Shaw

| Immigration Origin | # Population | % Population | View All 0 Rows |
Sex and Age in Shaw
Sex and Age in Shaw
The most populous age groups in Shaw are 15 to 19 Years (78 | 11.9%) for men and 35 to 39 Years (98 | 10.2%) for women.
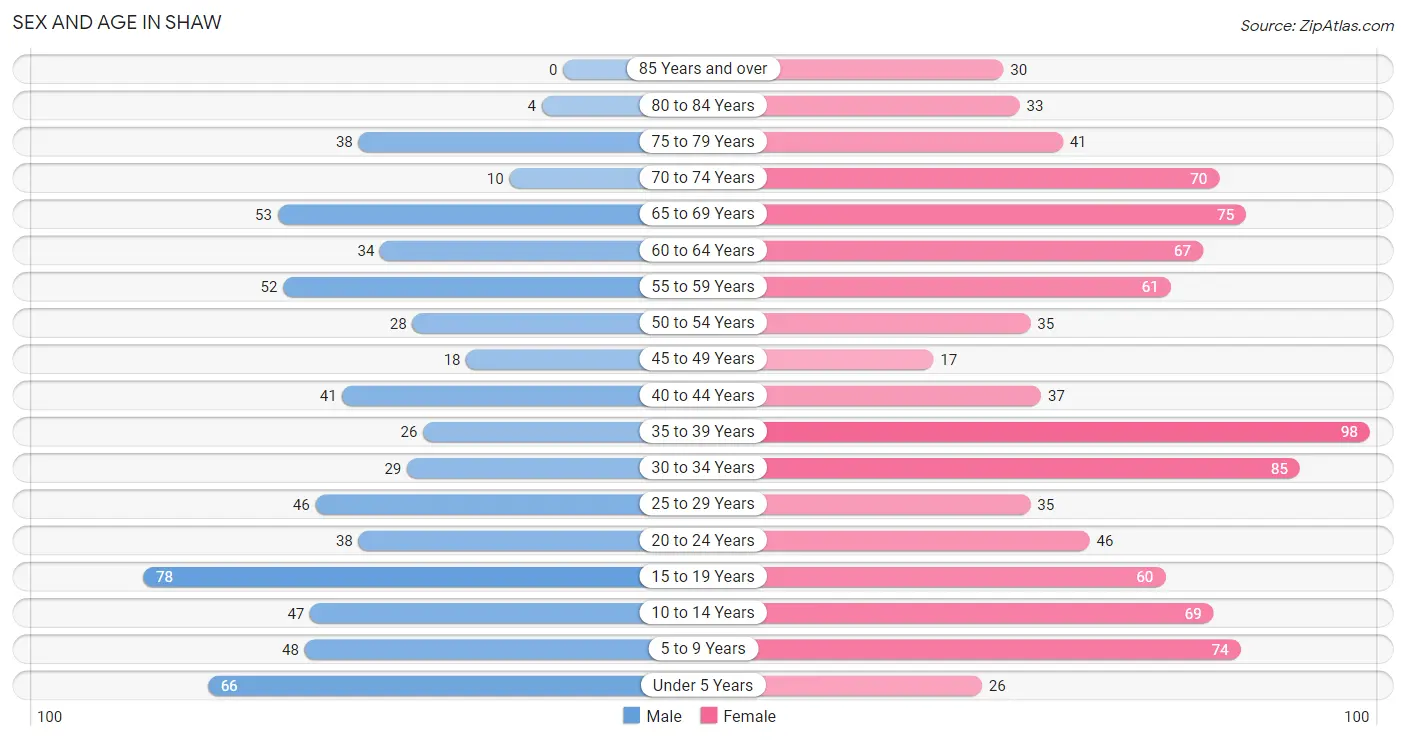
| Age Bracket | Male | Female |
| Under 5 Years | 66 (10.1%) | 26 (2.7%) |
| 5 to 9 Years | 48 (7.3%) | 74 (7.7%) |
| 10 to 14 Years | 47 (7.2%) | 69 (7.2%) |
| 15 to 19 Years | 78 (11.9%) | 60 (6.3%) |
| 20 to 24 Years | 38 (5.8%) | 46 (4.8%) |
| 25 to 29 Years | 46 (7.0%) | 35 (3.6%) |
| 30 to 34 Years | 29 (4.4%) | 85 (8.9%) |
| 35 to 39 Years | 26 (4.0%) | 98 (10.2%) |
| 40 to 44 Years | 41 (6.2%) | 37 (3.9%) |
| 45 to 49 Years | 18 (2.7%) | 17 (1.8%) |
| 50 to 54 Years | 28 (4.3%) | 35 (3.6%) |
| 55 to 59 Years | 52 (7.9%) | 61 (6.4%) |
| 60 to 64 Years | 34 (5.2%) | 67 (7.0%) |
| 65 to 69 Years | 53 (8.1%) | 75 (7.8%) |
| 70 to 74 Years | 10 (1.5%) | 70 (7.3%) |
| 75 to 79 Years | 38 (5.8%) | 41 (4.3%) |
| 80 to 84 Years | 4 (0.6%) | 33 (3.4%) |
| 85 Years and over | 0 (0.0%) | 30 (3.1%) |
| Total | 656 (100.0%) | 959 (100.0%) |
Families and Households in Shaw
Median Family Size in Shaw
The median family size in Shaw is 2.82 persons per family, with single male/father families (81 | 16.7%) accounting for the largest median family size of 3.44 persons per family. On the other hand, married-couple families (171 | 35.3%) represent the smallest median family size with 2.51 persons per family.
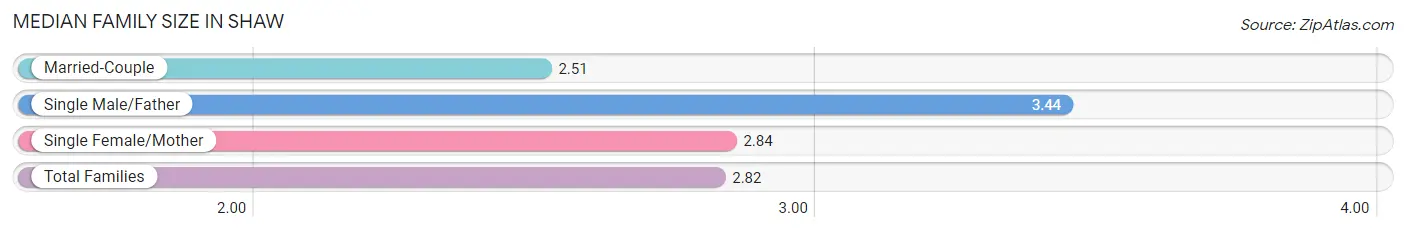
| Family Type | # Families | Family Size |
| Married-Couple | 171 (35.3%) | 2.51 |
| Single Male/Father | 81 (16.7%) | 3.44 |
| Single Female/Mother | 232 (47.9%) | 2.84 |
| Total Families | 484 (100.0%) | 2.82 |
Median Household Size in Shaw
The median household size in Shaw is 2.35 persons per household, with single male/father households (81 | 11.8%) accounting for the largest median household size of 3.81 persons per household. non-family households (202 | 29.4%) represent the smallest median household size with 1.05 persons per household.
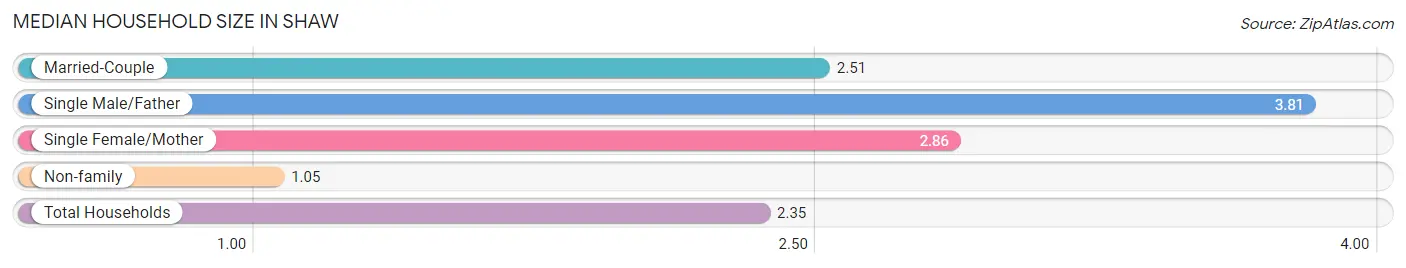
| Household Type | # Households | Household Size |
| Married-Couple | 171 (24.9%) | 2.51 |
| Single Male/Father | 81 (11.8%) | 3.81 |
| Single Female/Mother | 232 (33.8%) | 2.86 |
| Non-family | 202 (29.4%) | 1.05 |
| Total Households | 686 (100.0%) | 2.35 |
Household Size by Marriage Status in Shaw
Out of a total of 686 households in Shaw, 484 (70.6%) are family households, while 202 (29.4%) are nonfamily households. The most numerous type of family households are 2-person households, comprising 248, and the most common type of nonfamily households are 1-person households, comprising 183.
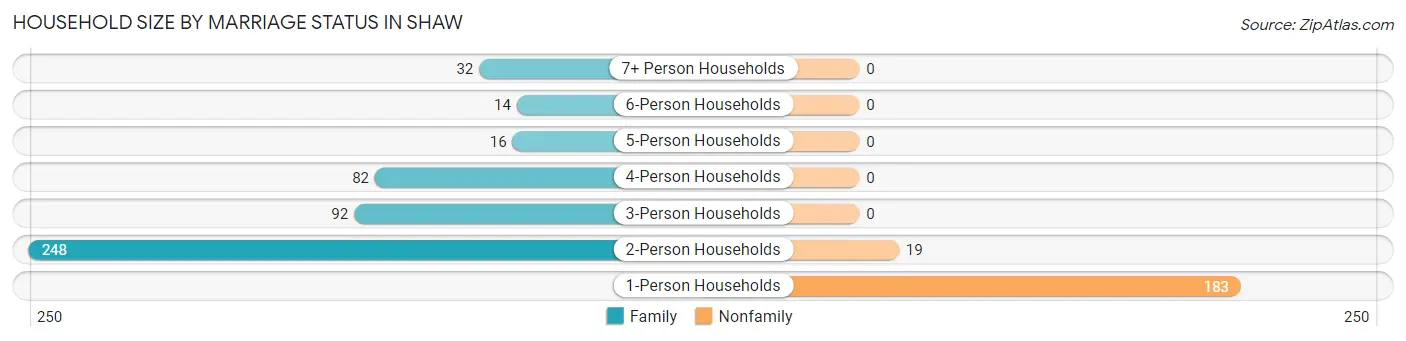
| Household Size | Family Households | Nonfamily Households |
| 1-Person Households | - | 183 (26.7%) |
| 2-Person Households | 248 (36.1%) | 19 (2.8%) |
| 3-Person Households | 92 (13.4%) | 0 (0.0%) |
| 4-Person Households | 82 (11.9%) | 0 (0.0%) |
| 5-Person Households | 16 (2.3%) | 0 (0.0%) |
| 6-Person Households | 14 (2.0%) | 0 (0.0%) |
| 7+ Person Households | 32 (4.7%) | 0 (0.0%) |
| Total | 484 (70.6%) | 202 (29.4%) |
Female Fertility in Shaw
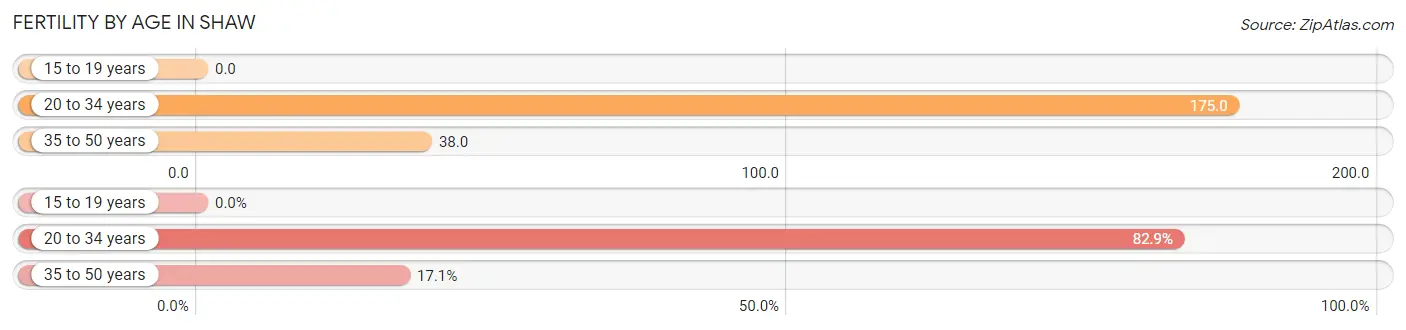
Fertility by Age in Shaw
Average fertility rate in Shaw is 91.0 births per 1,000 women. Women in the age bracket of 20 to 34 years have the highest fertility rate with 175.0 births per 1,000 women. Women in the age bracket of 20 to 34 years acount for 82.9% of all women with births.
| Age Bracket | Women with Births | Births / 1,000 Women |
| 15 to 19 years | 0 (0.0%) | 0.0 |
| 20 to 34 years | 29 (82.9%) | 175.0 |
| 35 to 50 years | 6 (17.1%) | 38.0 |
| Total | 35 (100.0%) | 91.0 |
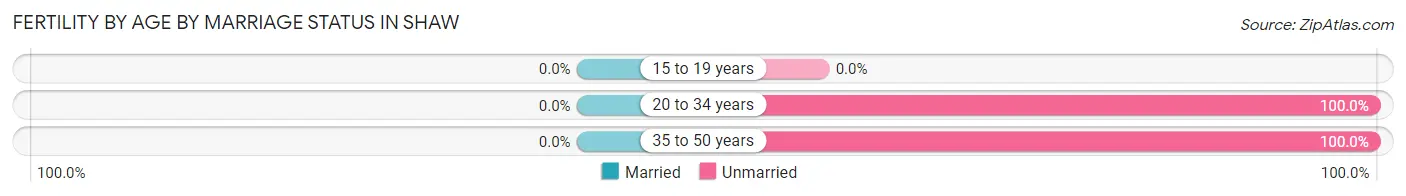
Fertility by Age by Marriage Status in Shaw
| Age Bracket | Married | Unmarried |
| 15 to 19 years | 0 (0.0%) | 0 (0.0%) |
| 20 to 34 years | 0 (0.0%) | 29 (100.0%) |
| 35 to 50 years | 0 (0.0%) | 6 (100.0%) |
| Total | 0 (0.0%) | 35 (100.0%) |
Fertility by Education in Shaw
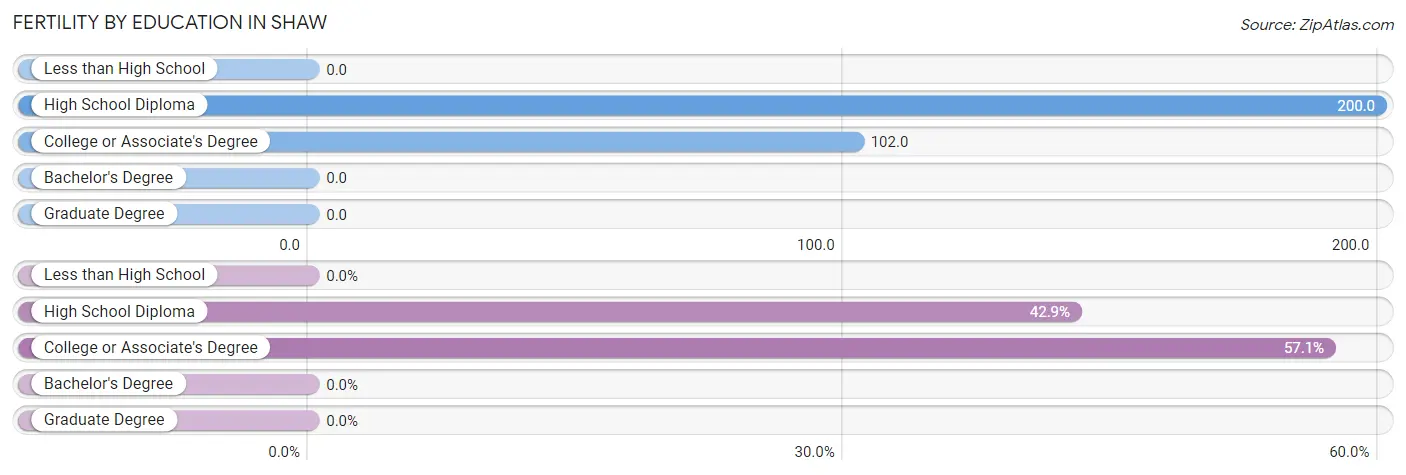
| Educational Attainment | Women with Births | Births / 1,000 Women |
| Less than High School | 0 (0.0%) | 0.0 |
| High School Diploma | 15 (42.9%) | 200.0 |
| College or Associate's Degree | 20 (57.1%) | 102.0 |
| Bachelor's Degree | 0 (0.0%) | 0.0 |
| Graduate Degree | 0 (0.0%) | 0.0 |
| Total | 35 (100.0%) | 91.0 |
Fertility by Education by Marriage Status in Shaw
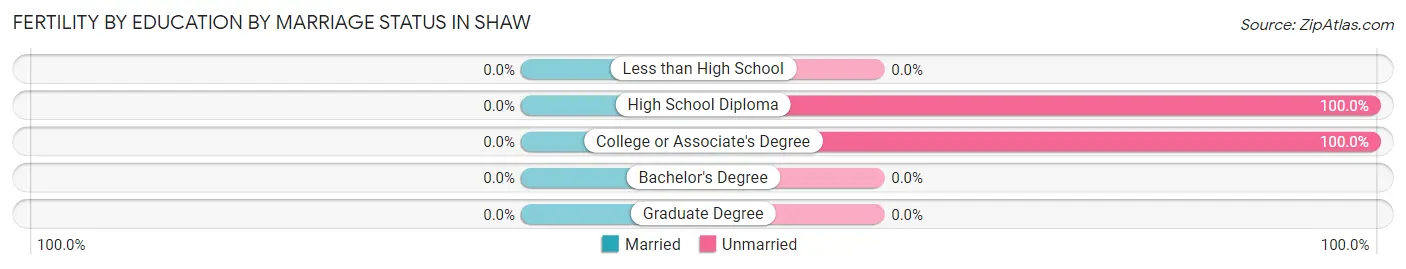
| Educational Attainment | Married | Unmarried |
| Less than High School | 0 (0.0%) | 0 (0.0%) |
| High School Diploma | 0 (0.0%) | 15 (100.0%) |
| College or Associate's Degree | 0 (0.0%) | 20 (100.0%) |
| Bachelor's Degree | 0 (0.0%) | 0 (0.0%) |
| Graduate Degree | 0 (0.0%) | 0 (0.0%) |
| Total | 0 (0.0%) | 35 (100.0%) |
Employment Characteristics in Shaw
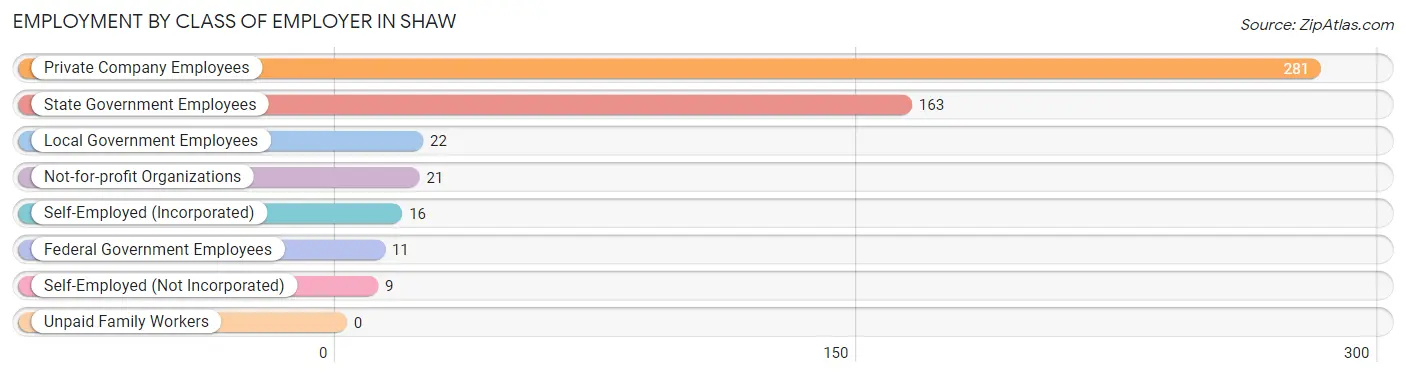
Employment by Class of Employer in Shaw
Among the 523 employed individuals in Shaw, private company employees (281 | 53.7%), state government employees (163 | 31.2%), and local government employees (22 | 4.2%) make up the most common classes of employment.
| Employer Class | # Employees | % Employees |
| Private Company Employees | 281 | 53.7% |
| Self-Employed (Incorporated) | 16 | 3.1% |
| Self-Employed (Not Incorporated) | 9 | 1.7% |
| Not-for-profit Organizations | 21 | 4.0% |
| Local Government Employees | 22 | 4.2% |
| State Government Employees | 163 | 31.2% |
| Federal Government Employees | 11 | 2.1% |
| Unpaid Family Workers | 0 | 0.0% |
| Total | 523 | 100.0% |
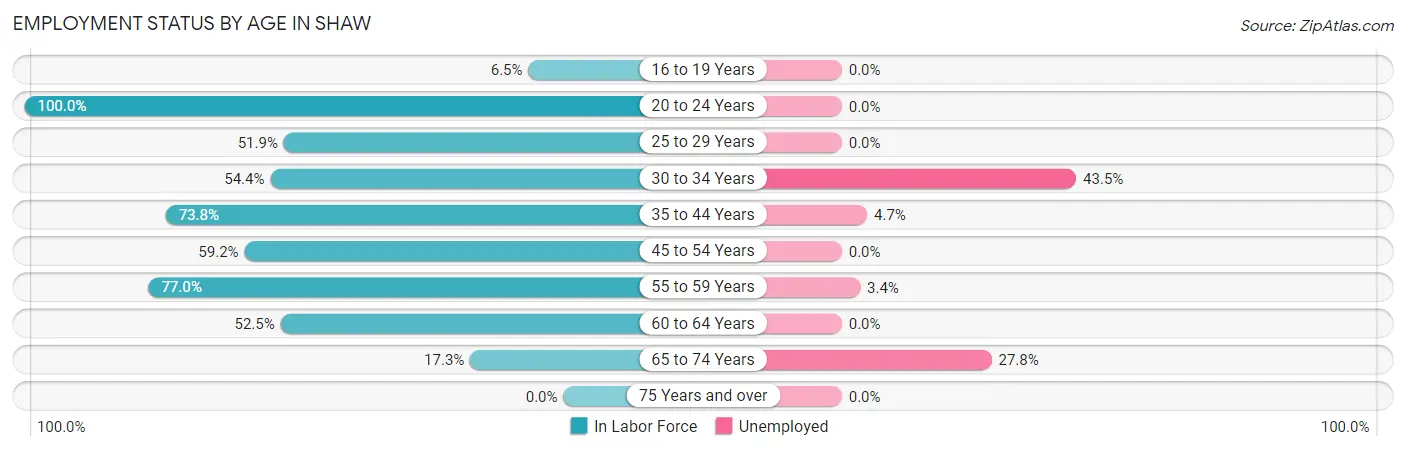
Employment Status by Age in Shaw
According to the labor force statistics for Shaw, out of the total population over 16 years of age (1,239), 46.6% or 577 individuals are in the labor force, with 8.1% or 47 of them unemployed. The age group with the highest labor force participation rate is 20 to 24 years, with 100.0% or 84 individuals in the labor force. Within the labor force, the 30 to 34 years age range has the highest percentage of unemployed individuals, with 43.5% or 27 of them being unemployed.
| Age Bracket | In Labor Force | Unemployed |
| 16 to 19 Years | 6 (6.5%) | 0 (0.0%) |
| 20 to 24 Years | 84 (100.0%) | 0 (0.0%) |
| 25 to 29 Years | 42 (51.9%) | 0 (0.0%) |
| 30 to 34 Years | 62 (54.4%) | 27 (43.5%) |
| 35 to 44 Years | 149 (73.8%) | 7 (4.7%) |
| 45 to 54 Years | 58 (59.2%) | 0 (0.0%) |
| 55 to 59 Years | 87 (77.0%) | 3 (3.4%) |
| 60 to 64 Years | 53 (52.5%) | 0 (0.0%) |
| 65 to 74 Years | 36 (17.3%) | 10 (27.8%) |
| 75 Years and over | 0 (0.0%) | 0 (0.0%) |
| Total | 577 (46.6%) | 47 (8.1%) |
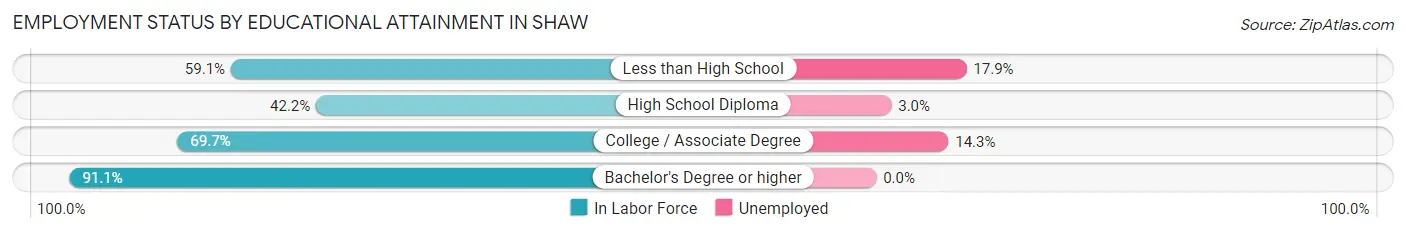
Employment Status by Educational Attainment in Shaw
According to labor force statistics for Shaw, 63.6% of individuals (451) out of the total population between 25 and 64 years of age (709) are in the labor force, with 8.2% or 37 of them being unemployed. The group with the highest labor force participation rate are those with the educational attainment of bachelor's degree or higher, with 91.1% or 123 individuals in the labor force. Within the labor force, individuals with less than high school education have the highest percentage of unemployment, with 17.9% or 7 of them being unemployed.
| Educational Attainment | In Labor Force | Unemployed |
| Less than High School | 39 (59.1%) | 12 (17.9%) |
| High School Diploma | 100 (42.2%) | 7 (3.0%) |
| College / Associate Degree | 189 (69.7%) | 39 (14.3%) |
| Bachelor's Degree or higher | 123 (91.1%) | 0 (0.0%) |
| Total | 451 (63.6%) | 58 (8.2%) |
Employment Occupations by Sex in Shaw
Management, Business, Science and Arts Occupations
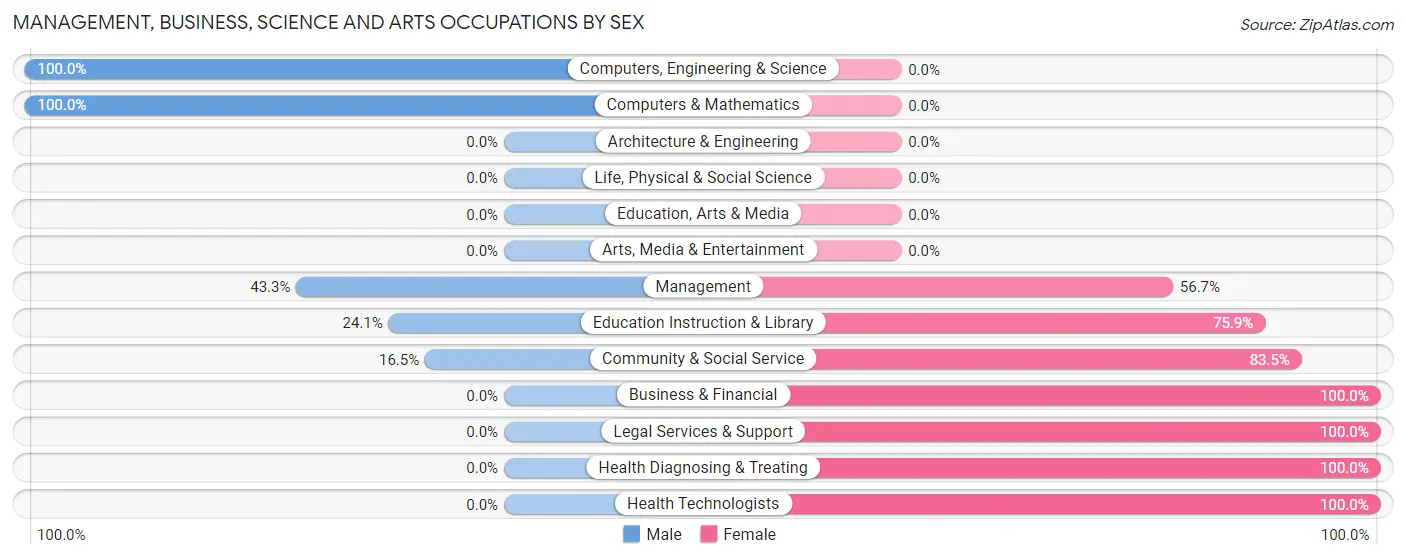
The most common Management, Business, Science and Arts occupations in Shaw are Community & Social Service (79 | 14.9%), Education Instruction & Library (54 | 10.2%), Management (30 | 5.7%), Legal Services & Support (25 | 4.7%), and Business & Financial (20 | 3.8%).
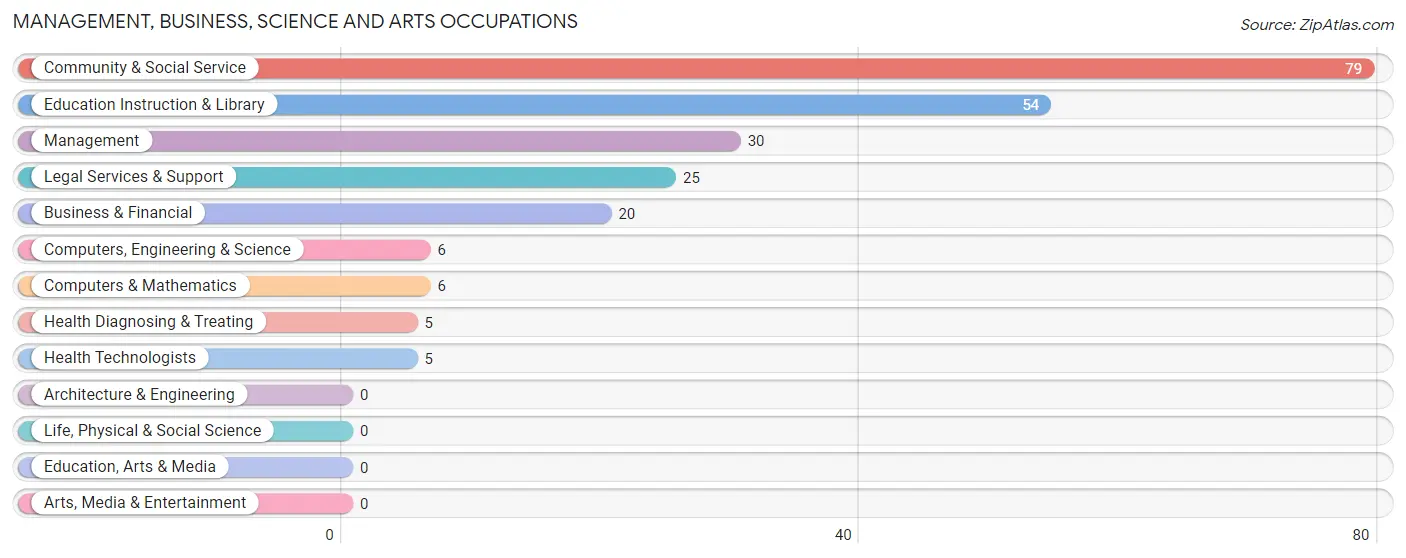
Management, Business, Science and Arts Occupations by Sex
Within the Management, Business, Science and Arts occupations in Shaw, the most male-oriented occupations are Computers, Engineering & Science (100.0%), Computers & Mathematics (100.0%), and Management (43.3%), while the most female-oriented occupations are Business & Financial (100.0%), Legal Services & Support (100.0%), and Health Diagnosing & Treating (100.0%).
| Occupation | Male | Female |
| Management | 13 (43.3%) | 17 (56.7%) |
| Business & Financial | 0 (0.0%) | 20 (100.0%) |
| Computers, Engineering & Science | 6 (100.0%) | 0 (0.0%) |
| Computers & Mathematics | 6 (100.0%) | 0 (0.0%) |
| Architecture & Engineering | 0 (0.0%) | 0 (0.0%) |
| Life, Physical & Social Science | 0 (0.0%) | 0 (0.0%) |
| Community & Social Service | 13 (16.5%) | 66 (83.5%) |
| Education, Arts & Media | 0 (0.0%) | 0 (0.0%) |
| Legal Services & Support | 0 (0.0%) | 25 (100.0%) |
| Education Instruction & Library | 13 (24.1%) | 41 (75.9%) |
| Arts, Media & Entertainment | 0 (0.0%) | 0 (0.0%) |
| Health Diagnosing & Treating | 0 (0.0%) | 5 (100.0%) |
| Health Technologists | 0 (0.0%) | 5 (100.0%) |
| Total (Category) | 32 (22.9%) | 108 (77.1%) |
| Total (Overall) | 193 (36.4%) | 337 (63.6%) |
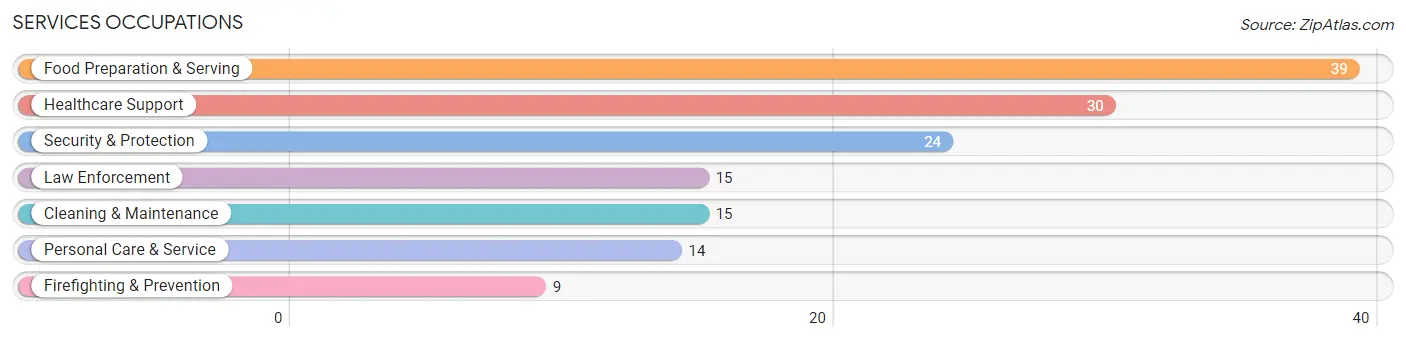
Services Occupations
The most common Services occupations in Shaw are Food Preparation & Serving (39 | 7.4%), Healthcare Support (30 | 5.7%), Security & Protection (24 | 4.5%), Law Enforcement (15 | 2.8%), and Cleaning & Maintenance (15 | 2.8%).
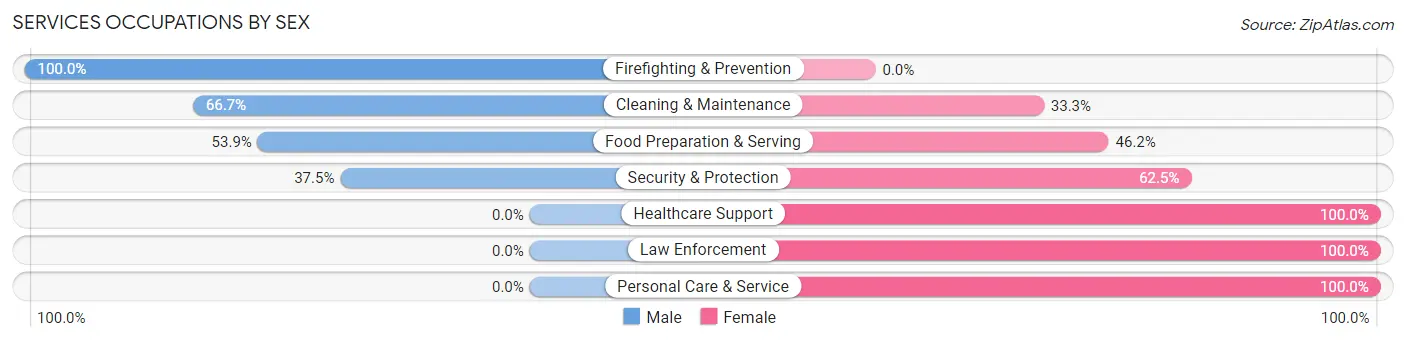
Services Occupations by Sex
Within the Services occupations in Shaw, the most male-oriented occupations are Firefighting & Prevention (100.0%), Cleaning & Maintenance (66.7%), and Food Preparation & Serving (53.8%), while the most female-oriented occupations are Healthcare Support (100.0%), Law Enforcement (100.0%), and Personal Care & Service (100.0%).
| Occupation | Male | Female |
| Healthcare Support | 0 (0.0%) | 30 (100.0%) |
| Security & Protection | 9 (37.5%) | 15 (62.5%) |
| Firefighting & Prevention | 9 (100.0%) | 0 (0.0%) |
| Law Enforcement | 0 (0.0%) | 15 (100.0%) |
| Food Preparation & Serving | 21 (53.8%) | 18 (46.2%) |
| Cleaning & Maintenance | 10 (66.7%) | 5 (33.3%) |
| Personal Care & Service | 0 (0.0%) | 14 (100.0%) |
| Total (Category) | 40 (32.8%) | 82 (67.2%) |
| Total (Overall) | 193 (36.4%) | 337 (63.6%) |
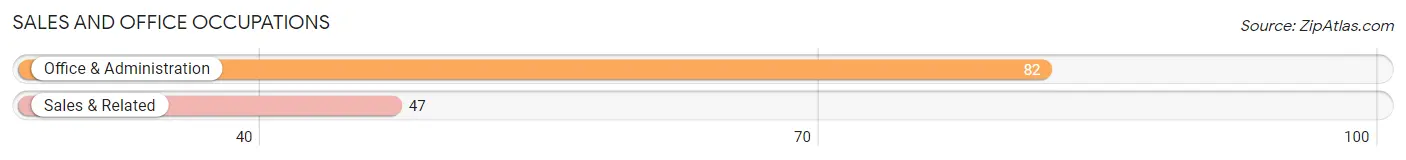
Sales and Office Occupations
The most common Sales and Office occupations in Shaw are Office & Administration (82 | 15.5%), and Sales & Related (47 | 8.9%).
Sales and Office Occupations by Sex
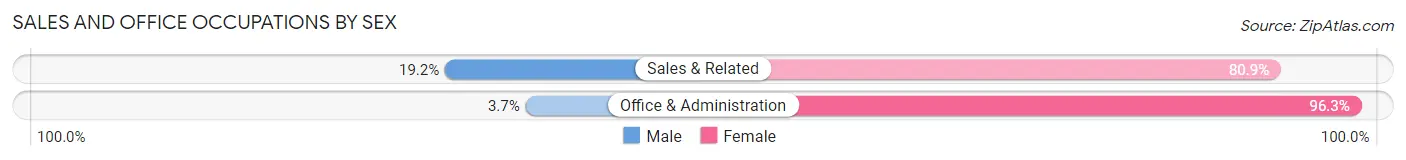
| Occupation | Male | Female |
| Sales & Related | 9 (19.2%) | 38 (80.8%) |
| Office & Administration | 3 (3.7%) | 79 (96.3%) |
| Total (Category) | 12 (9.3%) | 117 (90.7%) |
| Total (Overall) | 193 (36.4%) | 337 (63.6%) |
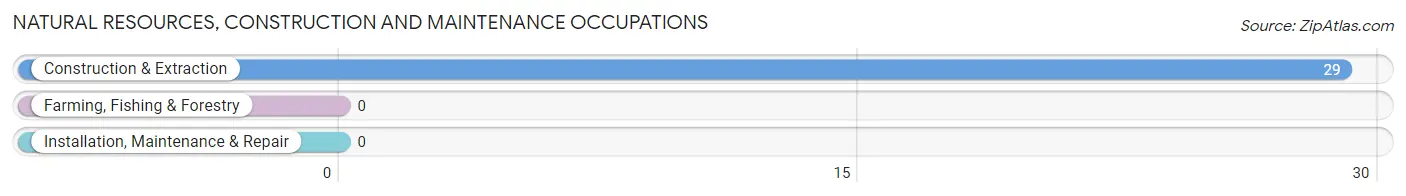
Natural Resources, Construction and Maintenance Occupations
The most common Natural Resources, Construction and Maintenance occupations in Shaw are , and Construction & Extraction (29 | 5.5%).
Natural Resources, Construction and Maintenance Occupations by Sex
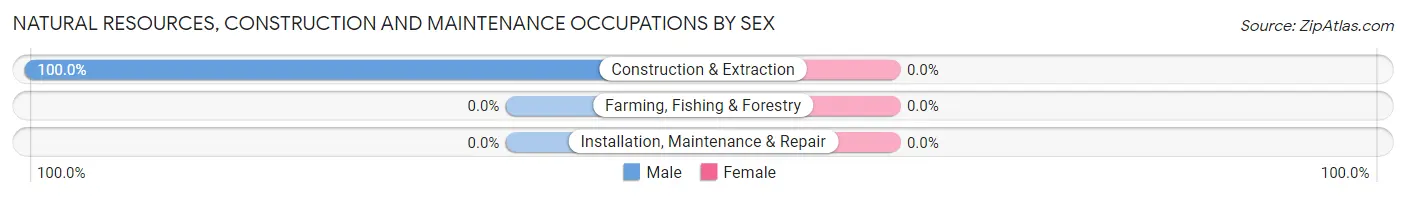
| Occupation | Male | Female |
| Farming, Fishing & Forestry | 0 (0.0%) | 0 (0.0%) |
| Construction & Extraction | 29 (100.0%) | 0 (0.0%) |
| Installation, Maintenance & Repair | 0 (0.0%) | 0 (0.0%) |
| Total (Category) | 29 (100.0%) | 0 (0.0%) |
| Total (Overall) | 193 (36.4%) | 337 (63.6%) |
Production, Transportation and Moving Occupations
The most common Production, Transportation and Moving occupations in Shaw are Transportation (55 | 10.4%), Material Moving (30 | 5.7%), and Production (25 | 4.7%).
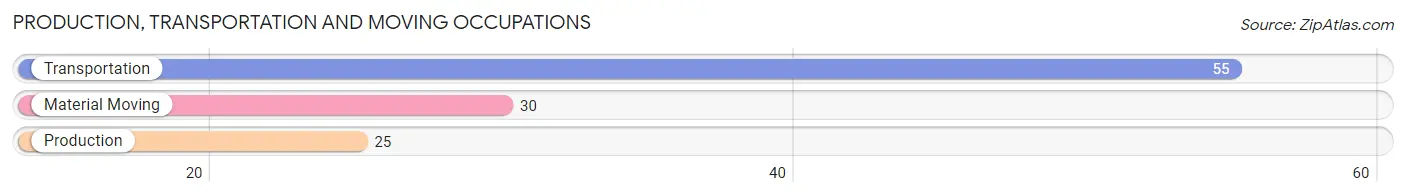
Production, Transportation and Moving Occupations by Sex
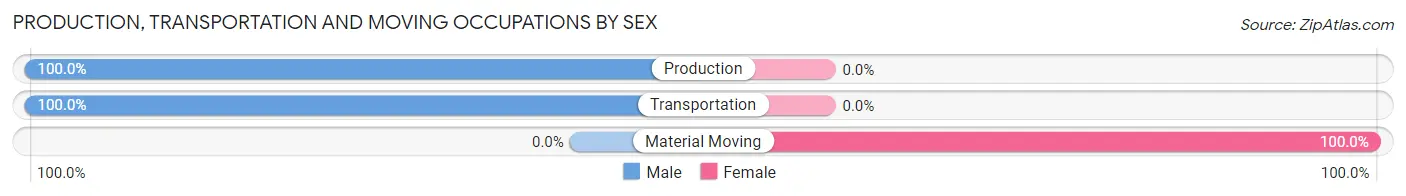
| Occupation | Male | Female |
| Production | 25 (100.0%) | 0 (0.0%) |
| Transportation | 55 (100.0%) | 0 (0.0%) |
| Material Moving | 0 (0.0%) | 30 (100.0%) |
| Total (Category) | 80 (72.7%) | 30 (27.3%) |
| Total (Overall) | 193 (36.4%) | 337 (63.6%) |
Employment Industries by Sex in Shaw
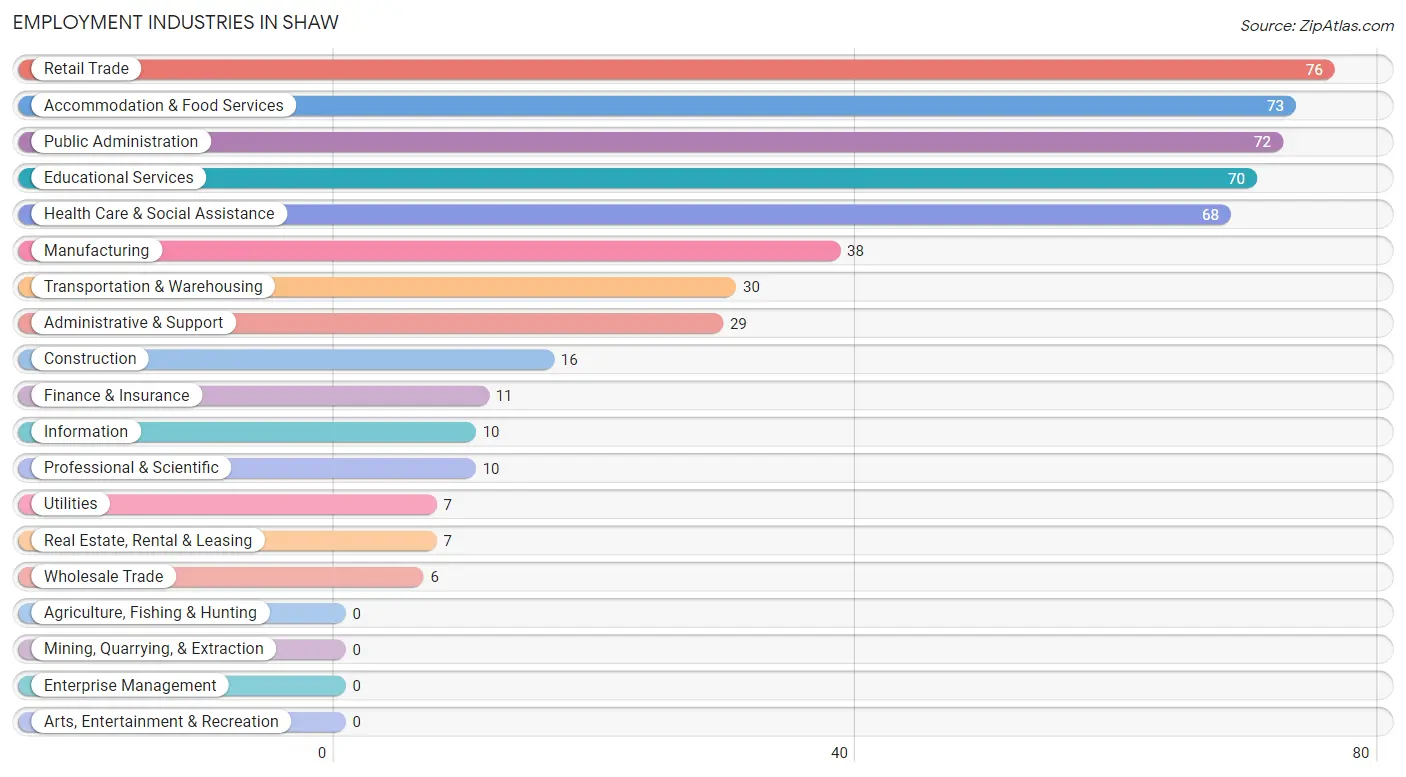
Employment Industries in Shaw
The major employment industries in Shaw include Retail Trade (76 | 14.3%), Accommodation & Food Services (73 | 13.8%), Public Administration (72 | 13.6%), Educational Services (70 | 13.2%), and Health Care & Social Assistance (68 | 12.8%).
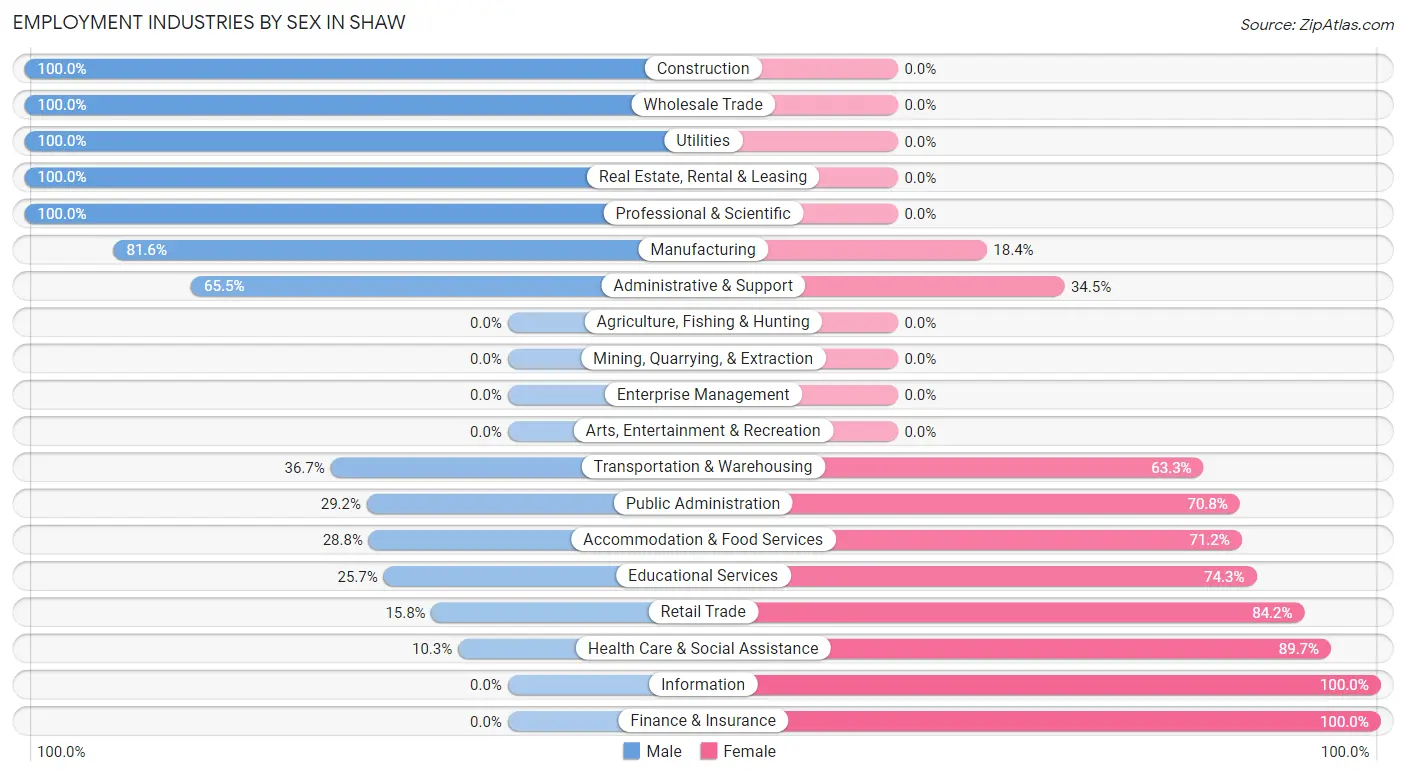
Employment Industries by Sex in Shaw
The Shaw industries that see more men than women are Construction (100.0%), Wholesale Trade (100.0%), and Utilities (100.0%), whereas the industries that tend to have a higher number of women are Information (100.0%), Finance & Insurance (100.0%), and Health Care & Social Assistance (89.7%).
| Industry | Male | Female |
| Agriculture, Fishing & Hunting | 0 (0.0%) | 0 (0.0%) |
| Mining, Quarrying, & Extraction | 0 (0.0%) | 0 (0.0%) |
| Construction | 16 (100.0%) | 0 (0.0%) |
| Manufacturing | 31 (81.6%) | 7 (18.4%) |
| Wholesale Trade | 6 (100.0%) | 0 (0.0%) |
| Retail Trade | 12 (15.8%) | 64 (84.2%) |
| Transportation & Warehousing | 11 (36.7%) | 19 (63.3%) |
| Utilities | 7 (100.0%) | 0 (0.0%) |
| Information | 0 (0.0%) | 10 (100.0%) |
| Finance & Insurance | 0 (0.0%) | 11 (100.0%) |
| Real Estate, Rental & Leasing | 7 (100.0%) | 0 (0.0%) |
| Professional & Scientific | 10 (100.0%) | 0 (0.0%) |
| Enterprise Management | 0 (0.0%) | 0 (0.0%) |
| Administrative & Support | 19 (65.5%) | 10 (34.5%) |
| Educational Services | 18 (25.7%) | 52 (74.3%) |
| Health Care & Social Assistance | 7 (10.3%) | 61 (89.7%) |
| Arts, Entertainment & Recreation | 0 (0.0%) | 0 (0.0%) |
| Accommodation & Food Services | 21 (28.8%) | 52 (71.2%) |
| Public Administration | 21 (29.2%) | 51 (70.8%) |
| Total | 193 (36.4%) | 337 (63.6%) |
Education in Shaw
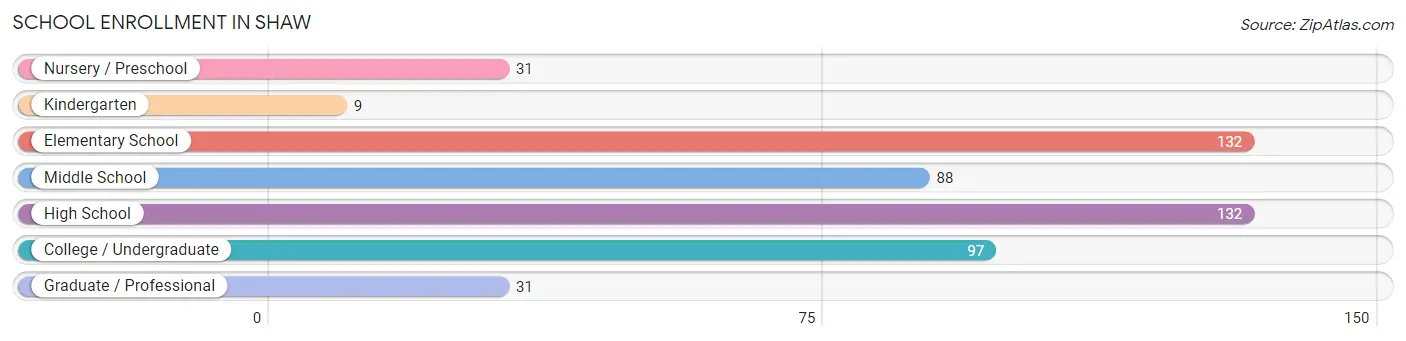
School Enrollment in Shaw
The most common levels of schooling among the 520 students in Shaw are elementary school (132 | 25.4%), high school (132 | 25.4%), and college / undergraduate (97 | 18.6%).
| School Level | # Students | % Students |
| Nursery / Preschool | 31 | 6.0% |
| Kindergarten | 9 | 1.7% |
| Elementary School | 132 | 25.4% |
| Middle School | 88 | 16.9% |
| High School | 132 | 25.4% |
| College / Undergraduate | 97 | 18.6% |
| Graduate / Professional | 31 | 6.0% |
| Total | 520 | 100.0% |
School Enrollment by Age by Funding Source in Shaw
Out of a total of 520 students who are enrolled in schools in Shaw, 60 (11.5%) attend a private institution, while the remaining 460 (88.5%) are enrolled in public schools. The age group of 35 years and over has the highest likelihood of being enrolled in private schools, with 31 (54.4% in the age bracket) enrolled. Conversely, the age group of 3 to 4 year olds has the lowest likelihood of being enrolled in a private school, with 31 (100.0% in the age bracket) attending a public institution.
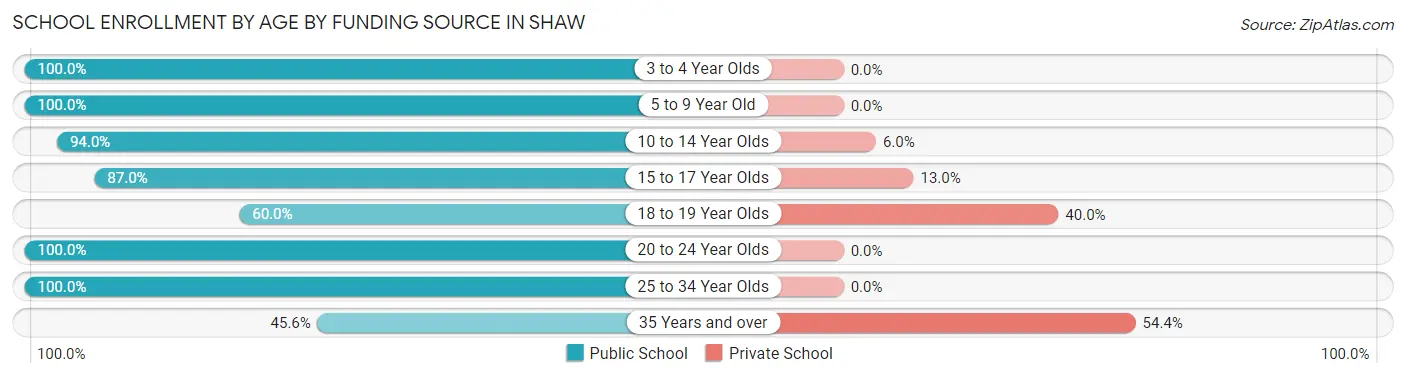
| Age Bracket | Public School | Private School |
| 3 to 4 Year Olds | 31 (100.0%) | 0 (0.0%) |
| 5 to 9 Year Old | 122 (100.0%) | 0 (0.0%) |
| 10 to 14 Year Olds | 109 (94.0%) | 7 (6.0%) |
| 15 to 17 Year Olds | 107 (87.0%) | 16 (13.0%) |
| 18 to 19 Year Olds | 9 (60.0%) | 6 (40.0%) |
| 20 to 24 Year Olds | 15 (100.0%) | 0 (0.0%) |
| 25 to 34 Year Olds | 41 (100.0%) | 0 (0.0%) |
| 35 Years and over | 26 (45.6%) | 31 (54.4%) |
| Total | 460 (88.5%) | 60 (11.5%) |
Educational Attainment by Field of Study in Shaw
Education (56 | 32.4%), arts & humanities (33 | 19.1%), science & technology (25 | 14.4%), business (22 | 12.7%), and bio, nature & agricultural (7 | 4.1%) are the most common fields of study among 173 individuals in Shaw who have obtained a bachelor's degree or higher.
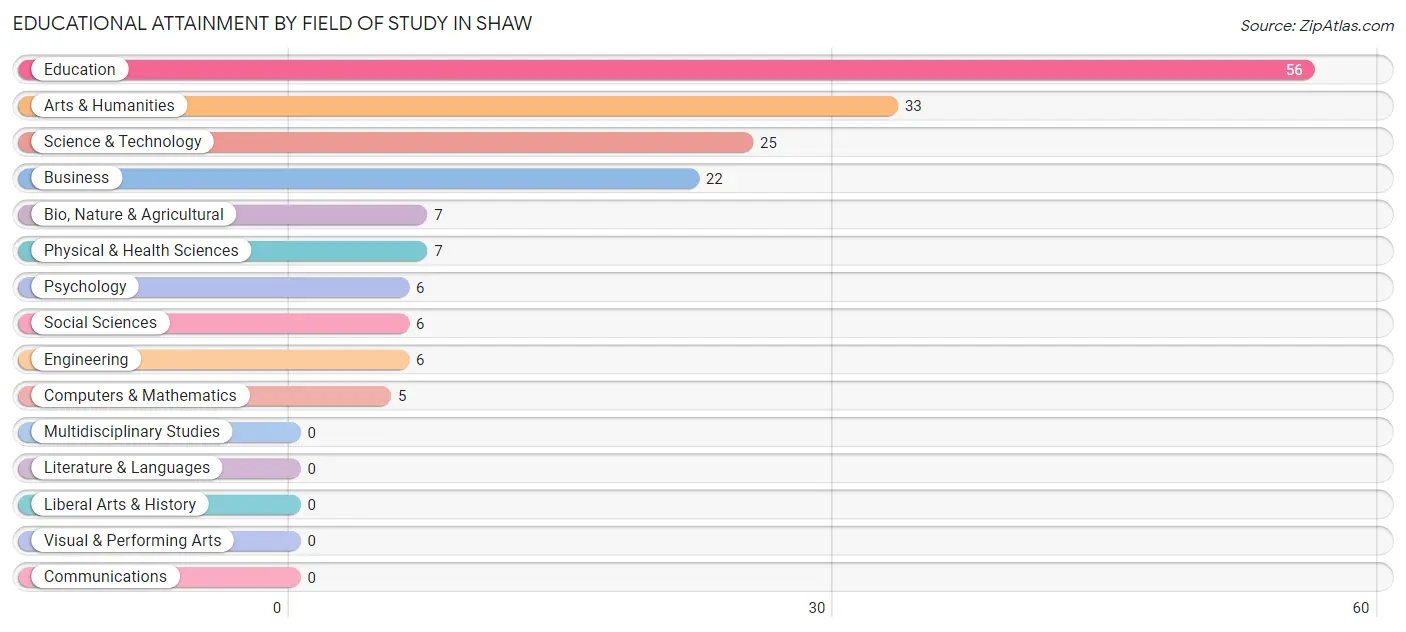
| Field of Study | # Graduates | % Graduates |
| Computers & Mathematics | 5 | 2.9% |
| Bio, Nature & Agricultural | 7 | 4.1% |
| Physical & Health Sciences | 7 | 4.1% |
| Psychology | 6 | 3.5% |
| Social Sciences | 6 | 3.5% |
| Engineering | 6 | 3.5% |
| Multidisciplinary Studies | 0 | 0.0% |
| Science & Technology | 25 | 14.4% |
| Business | 22 | 12.7% |
| Education | 56 | 32.4% |
| Literature & Languages | 0 | 0.0% |
| Liberal Arts & History | 0 | 0.0% |
| Visual & Performing Arts | 0 | 0.0% |
| Communications | 0 | 0.0% |
| Arts & Humanities | 33 | 19.1% |
| Total | 173 | 100.0% |
Transportation & Commute in Shaw
Vehicle Availability by Sex in Shaw
The most prevalent vehicle ownership categories in Shaw are males with 3 vehicles (80, accounting for 43.0%) and females with 3 vehicles (119, making up 23.7%).
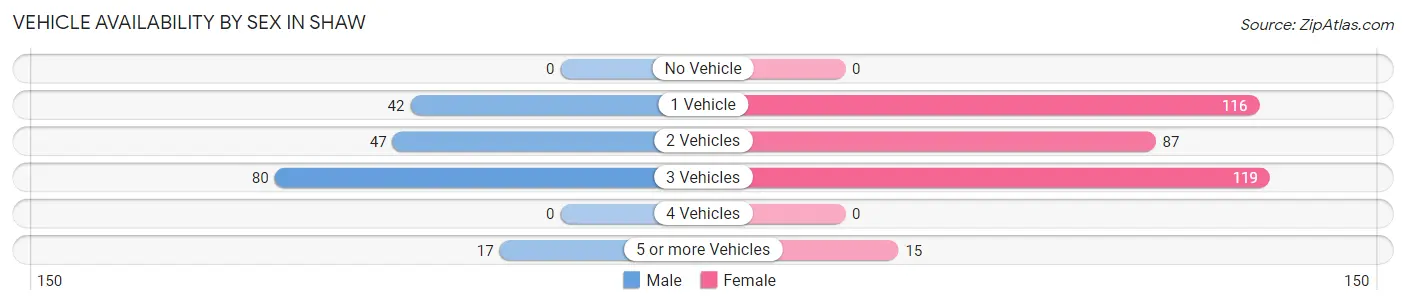
| Vehicles Available | Male | Female |
| No Vehicle | 0 (0.0%) | 0 (0.0%) |
| 1 Vehicle | 42 (22.6%) | 116 (34.4%) |
| 2 Vehicles | 47 (25.3%) | 87 (25.8%) |
| 3 Vehicles | 80 (43.0%) | 119 (35.3%) |
| 4 Vehicles | 0 (0.0%) | 0 (0.0%) |
| 5 or more Vehicles | 17 (9.1%) | 15 (4.4%) |
| Total | 186 (100.0%) | 337 (100.0%) |
Commute Time in Shaw
The most frequently occuring commute durations in Shaw are 20 to 24 minutes (106 commuters, 20.3%), 15 to 19 minutes (103 commuters, 19.7%), and 5 to 9 minutes (85 commuters, 16.3%).
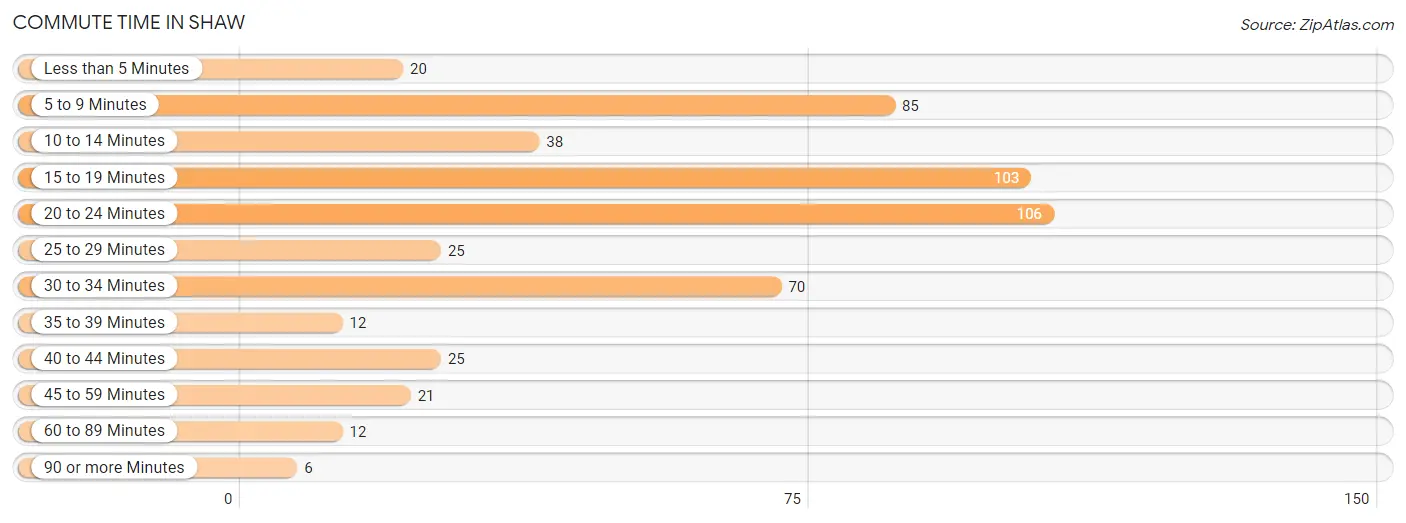
| Commute Time | # Commuters | % Commuters |
| Less than 5 Minutes | 20 | 3.8% |
| 5 to 9 Minutes | 85 | 16.3% |
| 10 to 14 Minutes | 38 | 7.3% |
| 15 to 19 Minutes | 103 | 19.7% |
| 20 to 24 Minutes | 106 | 20.3% |
| 25 to 29 Minutes | 25 | 4.8% |
| 30 to 34 Minutes | 70 | 13.4% |
| 35 to 39 Minutes | 12 | 2.3% |
| 40 to 44 Minutes | 25 | 4.8% |
| 45 to 59 Minutes | 21 | 4.0% |
| 60 to 89 Minutes | 12 | 2.3% |
| 90 or more Minutes | 6 | 1.1% |
Commute Time by Sex in Shaw
The most common commute times in Shaw are 5 to 9 minutes (44 commuters, 23.7%) for males and 20 to 24 minutes (81 commuters, 24.0%) for females.
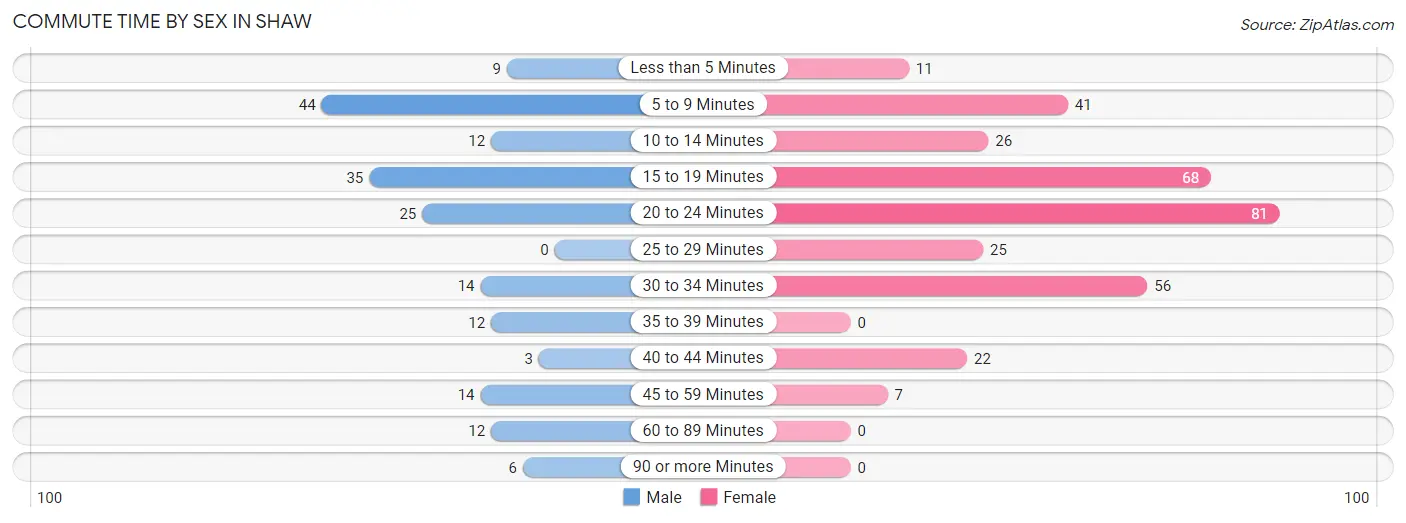
| Commute Time | Male | Female |
| Less than 5 Minutes | 9 (4.8%) | 11 (3.3%) |
| 5 to 9 Minutes | 44 (23.7%) | 41 (12.2%) |
| 10 to 14 Minutes | 12 (6.5%) | 26 (7.7%) |
| 15 to 19 Minutes | 35 (18.8%) | 68 (20.2%) |
| 20 to 24 Minutes | 25 (13.4%) | 81 (24.0%) |
| 25 to 29 Minutes | 0 (0.0%) | 25 (7.4%) |
| 30 to 34 Minutes | 14 (7.5%) | 56 (16.6%) |
| 35 to 39 Minutes | 12 (6.5%) | 0 (0.0%) |
| 40 to 44 Minutes | 3 (1.6%) | 22 (6.5%) |
| 45 to 59 Minutes | 14 (7.5%) | 7 (2.1%) |
| 60 to 89 Minutes | 12 (6.5%) | 0 (0.0%) |
| 90 or more Minutes | 6 (3.2%) | 0 (0.0%) |
Time of Departure to Work by Sex in Shaw
The most frequent times of departure to work in Shaw are 6:30 AM to 6:59 AM (76, 40.9%) for males and 6:30 AM to 6:59 AM (72, 21.4%) for females.
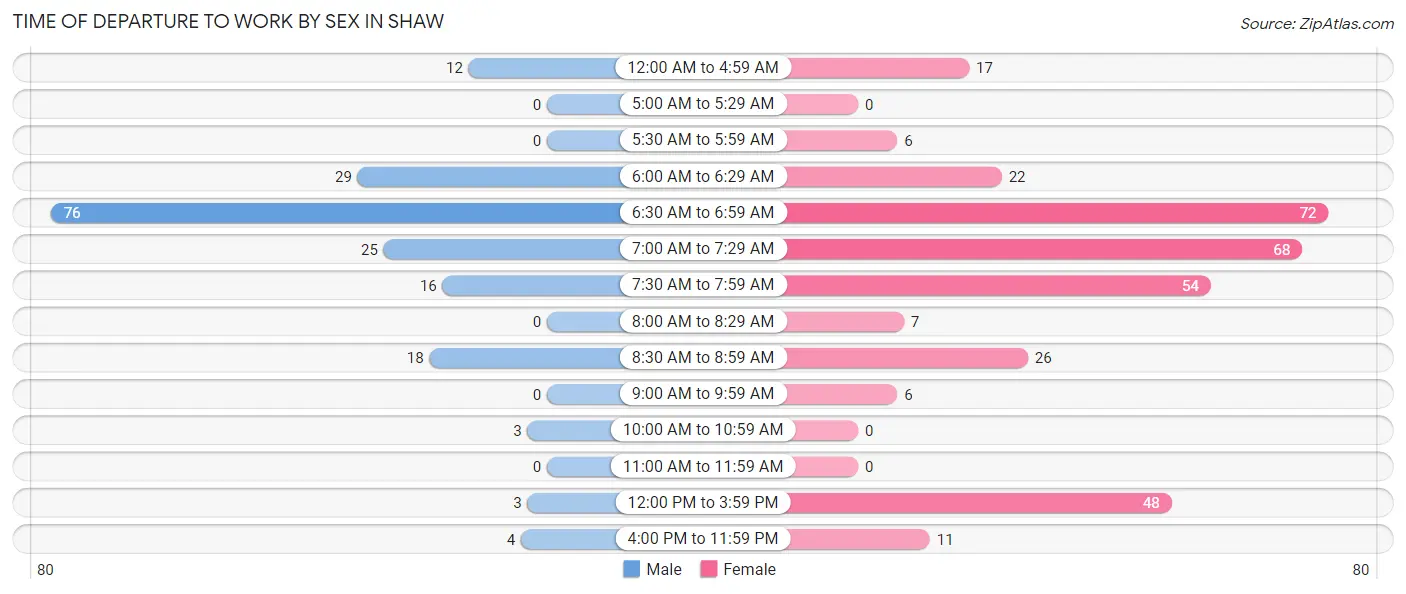
| Time of Departure | Male | Female |
| 12:00 AM to 4:59 AM | 12 (6.5%) | 17 (5.0%) |
| 5:00 AM to 5:29 AM | 0 (0.0%) | 0 (0.0%) |
| 5:30 AM to 5:59 AM | 0 (0.0%) | 6 (1.8%) |
| 6:00 AM to 6:29 AM | 29 (15.6%) | 22 (6.5%) |
| 6:30 AM to 6:59 AM | 76 (40.9%) | 72 (21.4%) |
| 7:00 AM to 7:29 AM | 25 (13.4%) | 68 (20.2%) |
| 7:30 AM to 7:59 AM | 16 (8.6%) | 54 (16.0%) |
| 8:00 AM to 8:29 AM | 0 (0.0%) | 7 (2.1%) |
| 8:30 AM to 8:59 AM | 18 (9.7%) | 26 (7.7%) |
| 9:00 AM to 9:59 AM | 0 (0.0%) | 6 (1.8%) |
| 10:00 AM to 10:59 AM | 3 (1.6%) | 0 (0.0%) |
| 11:00 AM to 11:59 AM | 0 (0.0%) | 0 (0.0%) |
| 12:00 PM to 3:59 PM | 3 (1.6%) | 48 (14.2%) |
| 4:00 PM to 11:59 PM | 4 (2.1%) | 11 (3.3%) |
| Total | 186 (100.0%) | 337 (100.0%) |
Housing Occupancy in Shaw
Occupancy by Ownership in Shaw
Of the total 686 dwellings in Shaw, owner-occupied units account for 393 (57.3%), while renter-occupied units make up 293 (42.7%).
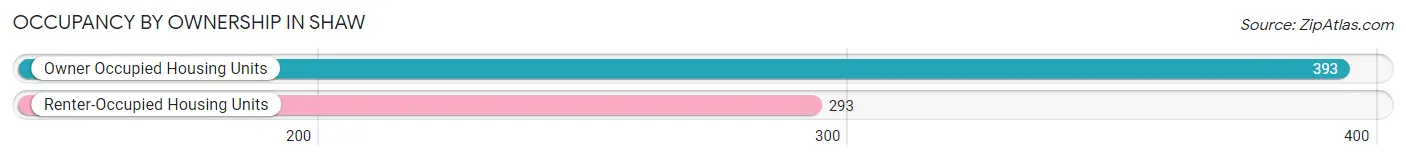
| Occupancy | # Housing Units | % Housing Units |
| Owner Occupied Housing Units | 393 | 57.3% |
| Renter-Occupied Housing Units | 293 | 42.7% |
| Total Occupied Housing Units | 686 | 100.0% |
Occupancy by Household Size in Shaw
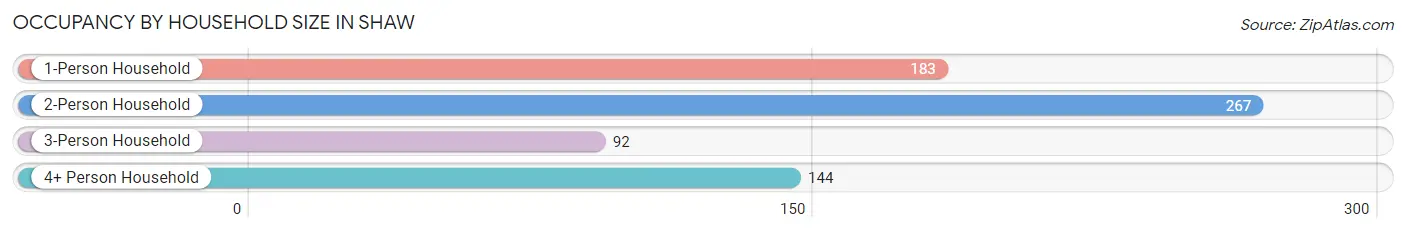
| Household Size | # Housing Units | % Housing Units |
| 1-Person Household | 183 | 26.7% |
| 2-Person Household | 267 | 38.9% |
| 3-Person Household | 92 | 13.4% |
| 4+ Person Household | 144 | 21.0% |
| Total Housing Units | 686 | 100.0% |
Occupancy by Ownership by Household Size in Shaw
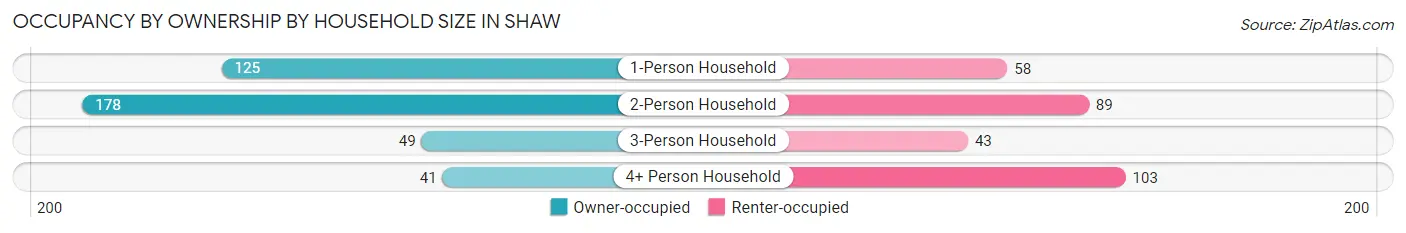
| Household Size | Owner-occupied | Renter-occupied |
| 1-Person Household | 125 (68.3%) | 58 (31.7%) |
| 2-Person Household | 178 (66.7%) | 89 (33.3%) |
| 3-Person Household | 49 (53.3%) | 43 (46.7%) |
| 4+ Person Household | 41 (28.5%) | 103 (71.5%) |
| Total Housing Units | 393 (57.3%) | 293 (42.7%) |
Occupancy by Educational Attainment in Shaw
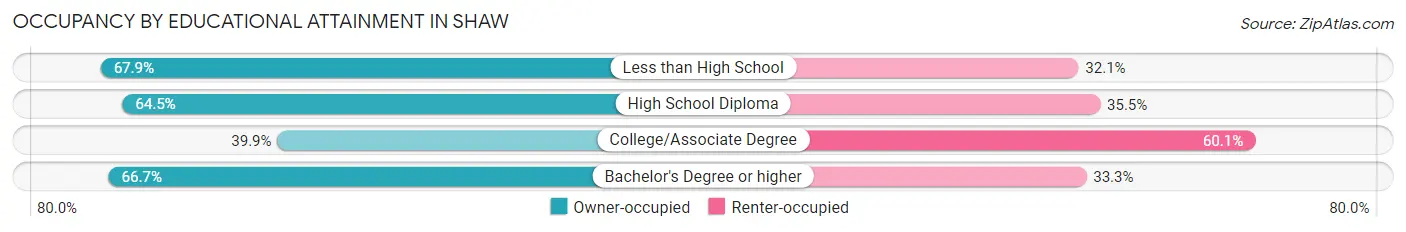
| Household Size | Owner-occupied | Renter-occupied |
| Less than High School | 108 (67.9%) | 51 (32.1%) |
| High School Diploma | 118 (64.5%) | 65 (35.5%) |
| College/Associate Degree | 93 (39.9%) | 140 (60.1%) |
| Bachelor's Degree or higher | 74 (66.7%) | 37 (33.3%) |
Occupancy by Age of Householder in Shaw
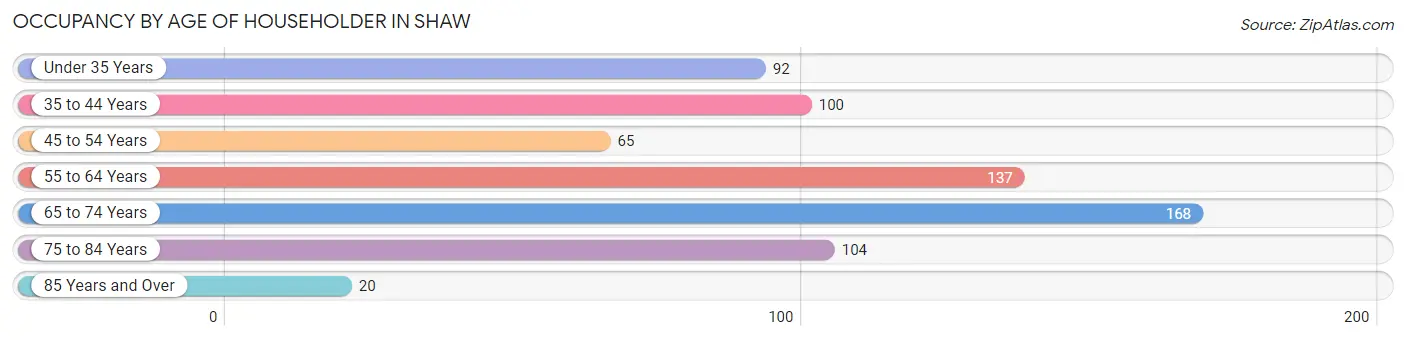
| Age Bracket | # Households | % Households |
| Under 35 Years | 92 | 13.4% |
| 35 to 44 Years | 100 | 14.6% |
| 45 to 54 Years | 65 | 9.5% |
| 55 to 64 Years | 137 | 20.0% |
| 65 to 74 Years | 168 | 24.5% |
| 75 to 84 Years | 104 | 15.2% |
| 85 Years and Over | 20 | 2.9% |
| Total | 686 | 100.0% |
Housing Finances in Shaw
Median Income by Occupancy in Shaw
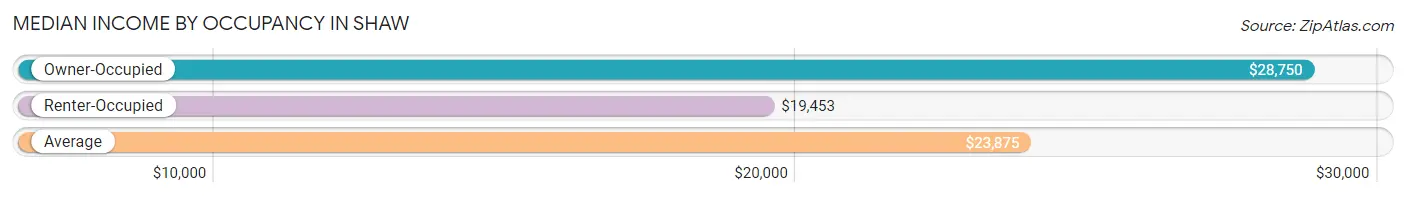
| Occupancy Type | # Households | Median Income |
| Owner-Occupied | 393 (57.3%) | $28,750 |
| Renter-Occupied | 293 (42.7%) | $19,453 |
| Average | 686 (100.0%) | $23,875 |
Occupancy by Householder Income Bracket in Shaw
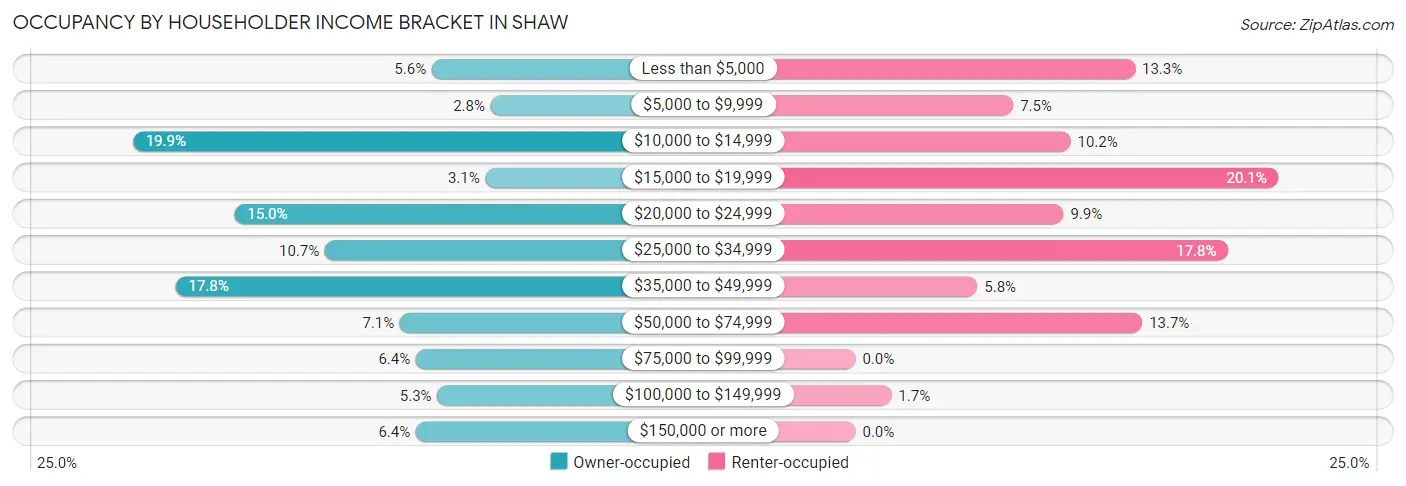
| Income Bracket | Owner-occupied | Renter-occupied |
| Less than $5,000 | 22 (5.6%) | 39 (13.3%) |
| $5,000 to $9,999 | 11 (2.8%) | 22 (7.5%) |
| $10,000 to $14,999 | 78 (19.9%) | 30 (10.2%) |
| $15,000 to $19,999 | 12 (3.0%) | 59 (20.1%) |
| $20,000 to $24,999 | 59 (15.0%) | 29 (9.9%) |
| $25,000 to $34,999 | 42 (10.7%) | 52 (17.7%) |
| $35,000 to $49,999 | 70 (17.8%) | 17 (5.8%) |
| $50,000 to $74,999 | 28 (7.1%) | 40 (13.7%) |
| $75,000 to $99,999 | 25 (6.4%) | 0 (0.0%) |
| $100,000 to $149,999 | 21 (5.3%) | 5 (1.7%) |
| $150,000 or more | 25 (6.4%) | 0 (0.0%) |
| Total | 393 (100.0%) | 293 (100.0%) |
Monthly Housing Cost Tiers in Shaw
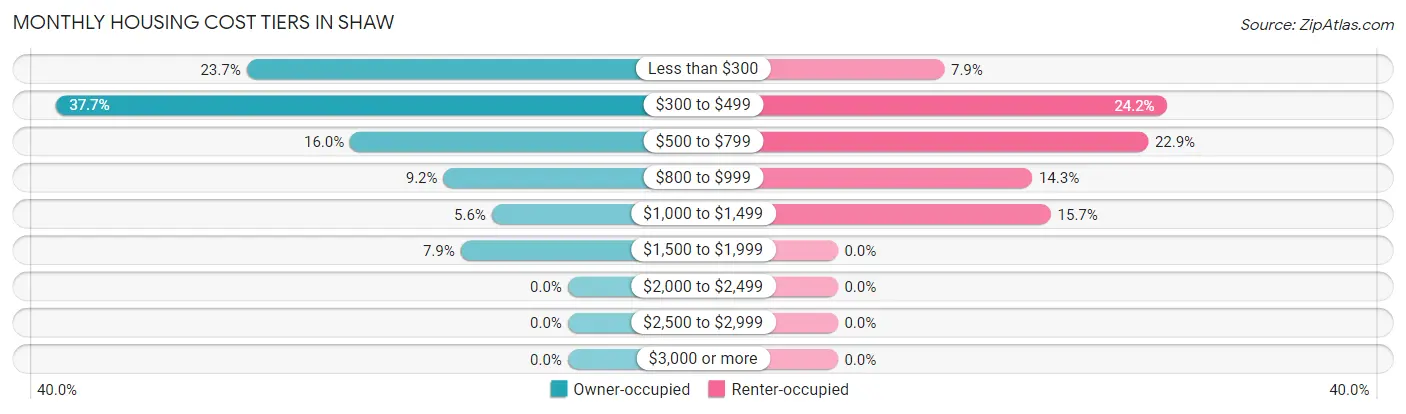
| Monthly Cost | Owner-occupied | Renter-occupied |
| Less than $300 | 93 (23.7%) | 23 (7.9%) |
| $300 to $499 | 148 (37.7%) | 71 (24.2%) |
| $500 to $799 | 63 (16.0%) | 67 (22.9%) |
| $800 to $999 | 36 (9.2%) | 42 (14.3%) |
| $1,000 to $1,499 | 22 (5.6%) | 46 (15.7%) |
| $1,500 to $1,999 | 31 (7.9%) | 0 (0.0%) |
| $2,000 to $2,499 | 0 (0.0%) | 0 (0.0%) |
| $2,500 to $2,999 | 0 (0.0%) | 0 (0.0%) |
| $3,000 or more | 0 (0.0%) | 0 (0.0%) |
| Total | 393 (100.0%) | 293 (100.0%) |
Physical Housing Characteristics in Shaw
Housing Structures in Shaw
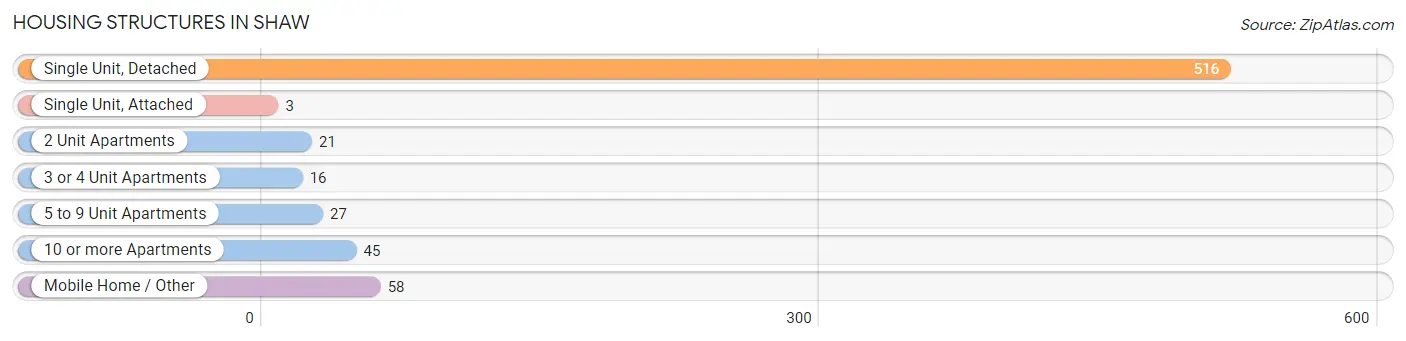
| Structure Type | # Housing Units | % Housing Units |
| Single Unit, Detached | 516 | 75.2% |
| Single Unit, Attached | 3 | 0.4% |
| 2 Unit Apartments | 21 | 3.1% |
| 3 or 4 Unit Apartments | 16 | 2.3% |
| 5 to 9 Unit Apartments | 27 | 3.9% |
| 10 or more Apartments | 45 | 6.6% |
| Mobile Home / Other | 58 | 8.5% |
| Total | 686 | 100.0% |
Housing Structures by Occupancy in Shaw
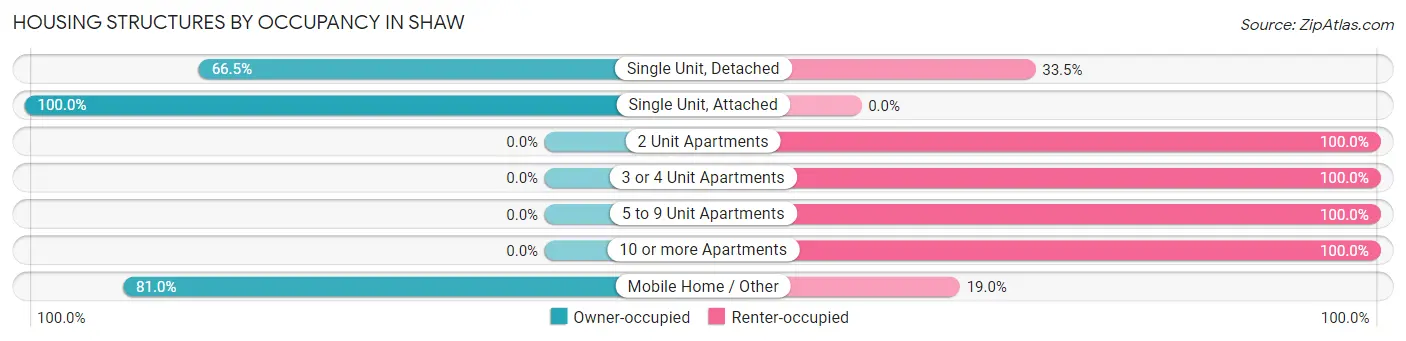
| Structure Type | Owner-occupied | Renter-occupied |
| Single Unit, Detached | 343 (66.5%) | 173 (33.5%) |
| Single Unit, Attached | 3 (100.0%) | 0 (0.0%) |
| 2 Unit Apartments | 0 (0.0%) | 21 (100.0%) |
| 3 or 4 Unit Apartments | 0 (0.0%) | 16 (100.0%) |
| 5 to 9 Unit Apartments | 0 (0.0%) | 27 (100.0%) |
| 10 or more Apartments | 0 (0.0%) | 45 (100.0%) |
| Mobile Home / Other | 47 (81.0%) | 11 (19.0%) |
| Total | 393 (57.3%) | 293 (42.7%) |
Housing Structures by Number of Rooms in Shaw
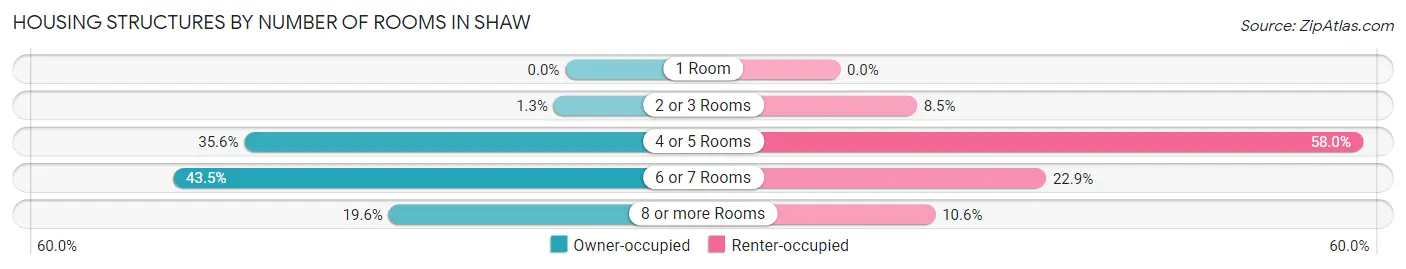
| Number of Rooms | Owner-occupied | Renter-occupied |
| 1 Room | 0 (0.0%) | 0 (0.0%) |
| 2 or 3 Rooms | 5 (1.3%) | 25 (8.5%) |
| 4 or 5 Rooms | 140 (35.6%) | 170 (58.0%) |
| 6 or 7 Rooms | 171 (43.5%) | 67 (22.9%) |
| 8 or more Rooms | 77 (19.6%) | 31 (10.6%) |
| Total | 393 (100.0%) | 293 (100.0%) |
Housing Structure by Heating Type in Shaw
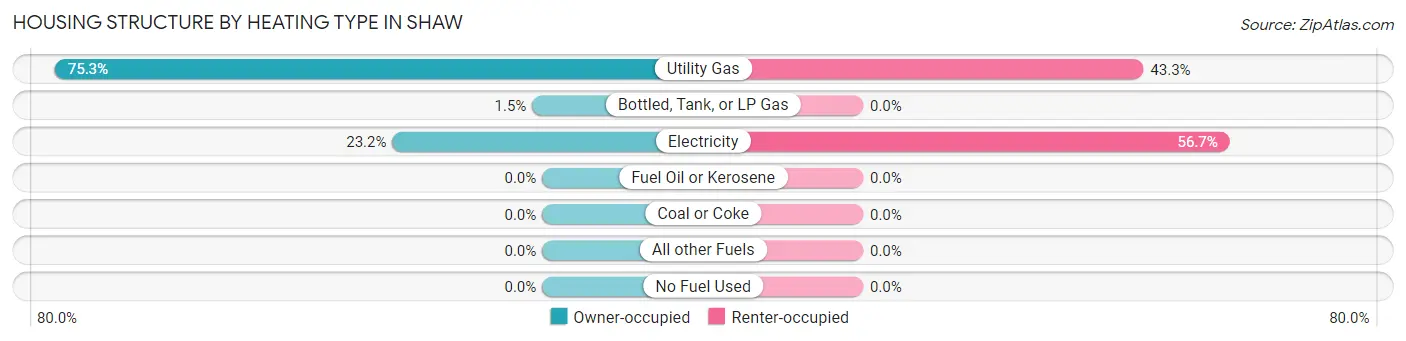
| Heating Type | Owner-occupied | Renter-occupied |
| Utility Gas | 296 (75.3%) | 127 (43.3%) |
| Bottled, Tank, or LP Gas | 6 (1.5%) | 0 (0.0%) |
| Electricity | 91 (23.2%) | 166 (56.7%) |
| Fuel Oil or Kerosene | 0 (0.0%) | 0 (0.0%) |
| Coal or Coke | 0 (0.0%) | 0 (0.0%) |
| All other Fuels | 0 (0.0%) | 0 (0.0%) |
| No Fuel Used | 0 (0.0%) | 0 (0.0%) |
| Total | 393 (100.0%) | 293 (100.0%) |
Household Vehicle Usage in Shaw
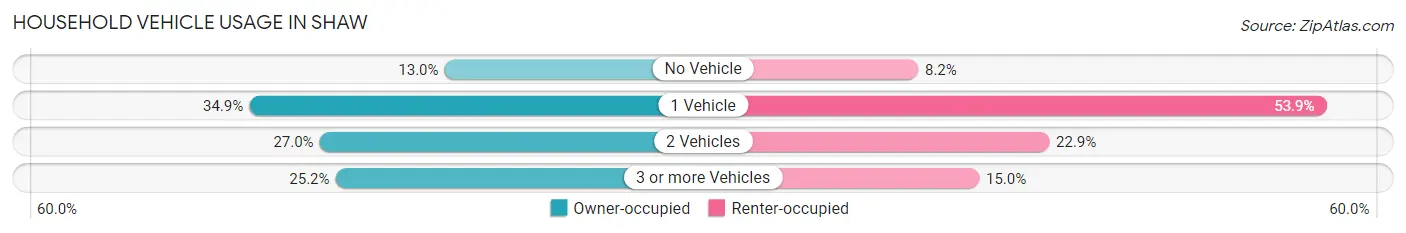
| Vehicles per Household | Owner-occupied | Renter-occupied |
| No Vehicle | 51 (13.0%) | 24 (8.2%) |
| 1 Vehicle | 137 (34.9%) | 158 (53.9%) |
| 2 Vehicles | 106 (27.0%) | 67 (22.9%) |
| 3 or more Vehicles | 99 (25.2%) | 44 (15.0%) |
| Total | 393 (100.0%) | 293 (100.0%) |
Real Estate & Mortgages in Shaw
Real Estate and Mortgage Overview in Shaw
| Characteristic | Without Mortgage | With Mortgage |
| Housing Units | 283 | 110 |
| Median Property Value | $70,800 | $0 |
| Median Household Income | $23,990 | $25 |
| Monthly Housing Costs | $376 | $0 |
| Real Estate Taxes | - | - |
Property Value by Mortgage Status in Shaw
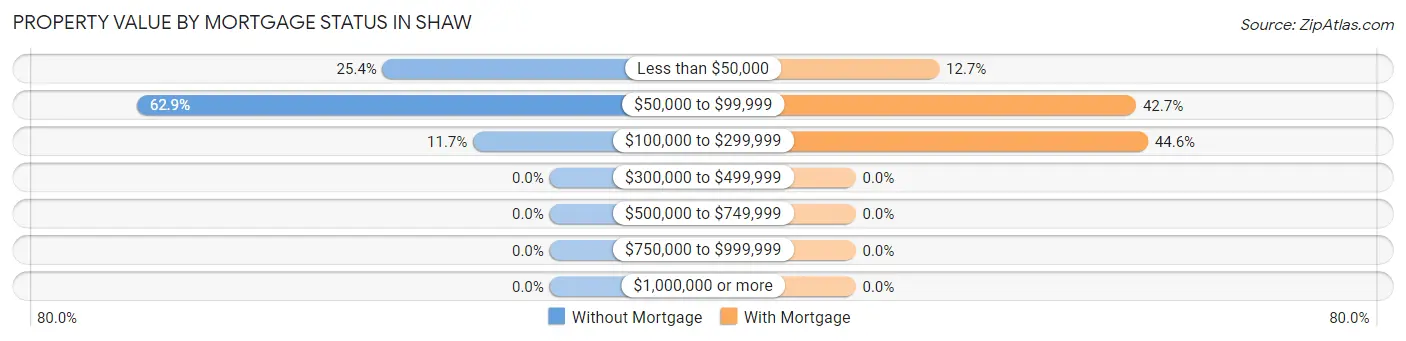
| Property Value | Without Mortgage | With Mortgage |
| Less than $50,000 | 72 (25.4%) | 14 (12.7%) |
| $50,000 to $99,999 | 178 (62.9%) | 47 (42.7%) |
| $100,000 to $299,999 | 33 (11.7%) | 49 (44.6%) |
| $300,000 to $499,999 | 0 (0.0%) | 0 (0.0%) |
| $500,000 to $749,999 | 0 (0.0%) | 0 (0.0%) |
| $750,000 to $999,999 | 0 (0.0%) | 0 (0.0%) |
| $1,000,000 or more | 0 (0.0%) | 0 (0.0%) |
| Total | 283 (100.0%) | 110 (100.0%) |
Household Income by Mortgage Status in Shaw
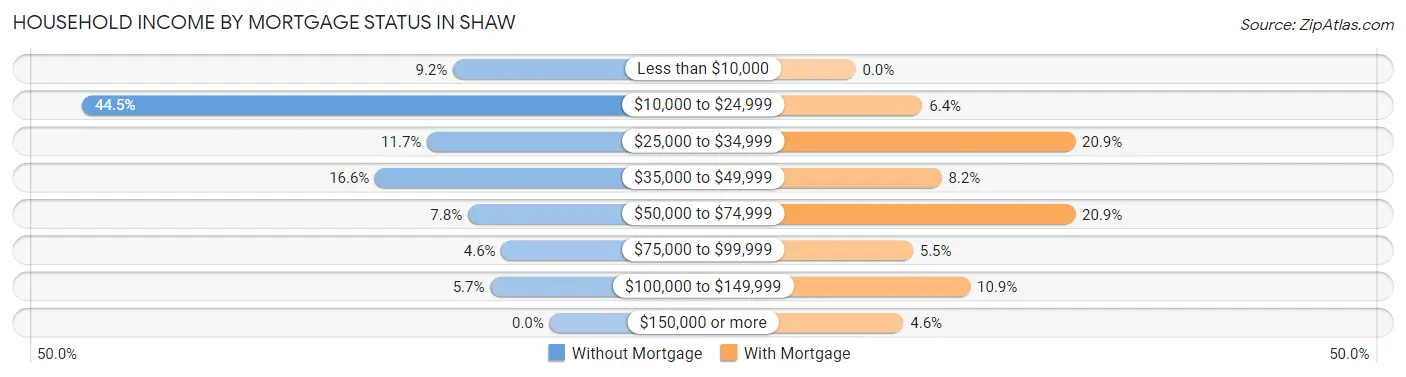
| Household Income | Without Mortgage | With Mortgage |
| Less than $10,000 | 26 (9.2%) | 0 (0.0%) |
| $10,000 to $24,999 | 126 (44.5%) | 7 (6.4%) |
| $25,000 to $34,999 | 33 (11.7%) | 23 (20.9%) |
| $35,000 to $49,999 | 47 (16.6%) | 9 (8.2%) |
| $50,000 to $74,999 | 22 (7.8%) | 23 (20.9%) |
| $75,000 to $99,999 | 13 (4.6%) | 6 (5.4%) |
| $100,000 to $149,999 | 16 (5.7%) | 12 (10.9%) |
| $150,000 or more | 0 (0.0%) | 5 (4.5%) |
| Total | 283 (100.0%) | 110 (100.0%) |
Property Value to Household Income Ratio in Shaw
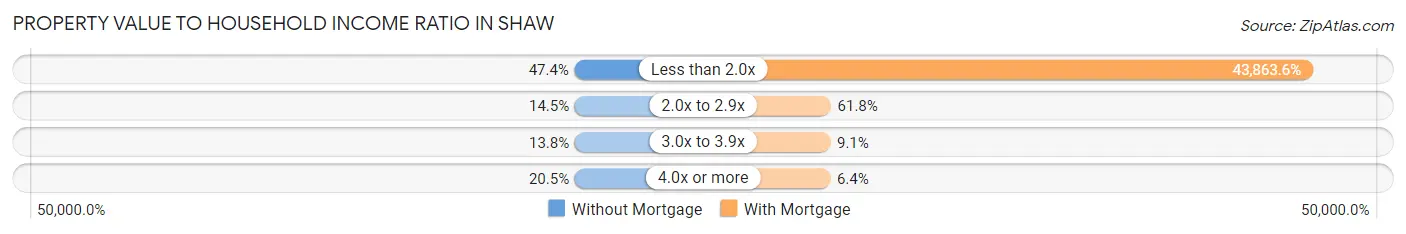
| Value-to-Income Ratio | Without Mortgage | With Mortgage |
| Less than 2.0x | 134 (47.3%) | 48,250 (43,863.6%) |
| 2.0x to 2.9x | 41 (14.5%) | 68 (61.8%) |
| 3.0x to 3.9x | 39 (13.8%) | 10 (9.1%) |
| 4.0x or more | 58 (20.5%) | 7 (6.4%) |
| Total | 283 (100.0%) | 110 (100.0%) |
Real Estate Taxes by Mortgage Status in Shaw
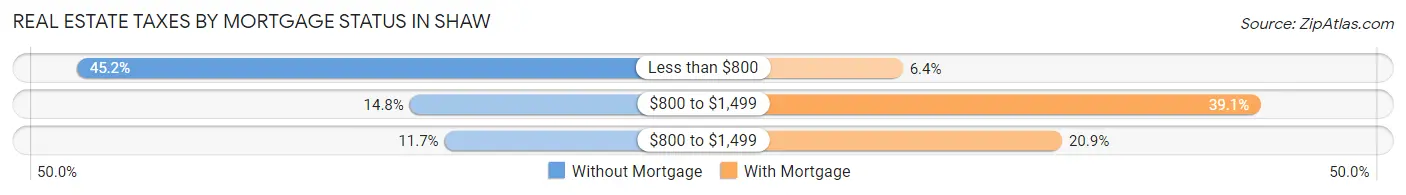
| Property Taxes | Without Mortgage | With Mortgage |
| Less than $800 | 128 (45.2%) | 7 (6.4%) |
| $800 to $1,499 | 42 (14.8%) | 43 (39.1%) |
| $800 to $1,499 | 33 (11.7%) | 23 (20.9%) |
| Total | 283 (100.0%) | 110 (100.0%) |
Health & Disability in Shaw
Health Insurance Coverage by Age in Shaw
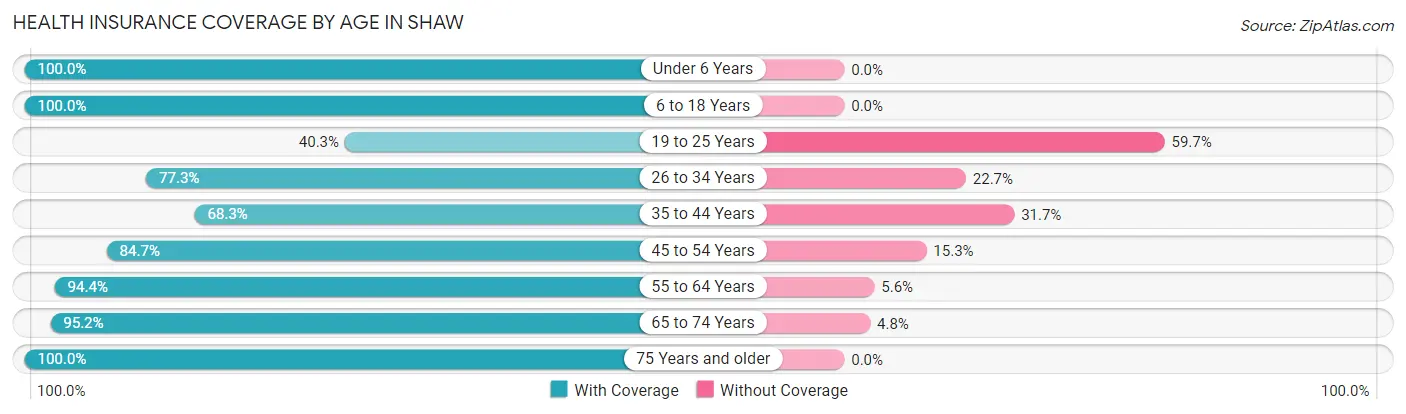
| Age Bracket | With Coverage | Without Coverage |
| Under 6 Years | 92 (100.0%) | 0 (0.0%) |
| 6 to 18 Years | 361 (100.0%) | 0 (0.0%) |
| 19 to 25 Years | 58 (40.3%) | 86 (59.7%) |
| 26 to 34 Years | 116 (77.3%) | 34 (22.7%) |
| 35 to 44 Years | 138 (68.3%) | 64 (31.7%) |
| 45 to 54 Years | 83 (84.7%) | 15 (15.3%) |
| 55 to 64 Years | 202 (94.4%) | 12 (5.6%) |
| 65 to 74 Years | 198 (95.2%) | 10 (4.8%) |
| 75 Years and older | 146 (100.0%) | 0 (0.0%) |
| Total | 1,394 (86.3%) | 221 (13.7%) |
Health Insurance Coverage by Citizenship Status in Shaw
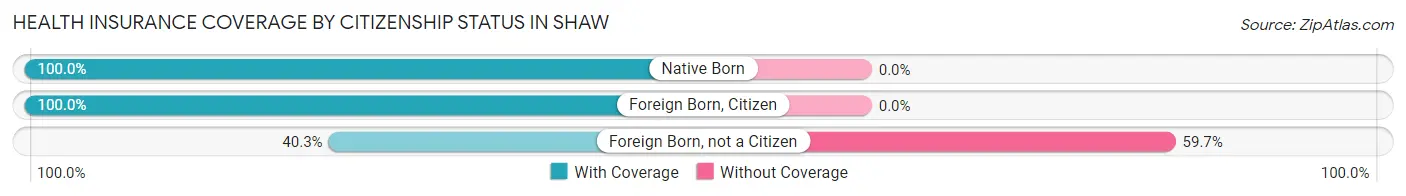
| Citizenship Status | With Coverage | Without Coverage |
| Native Born | 92 (100.0%) | 0 (0.0%) |
| Foreign Born, Citizen | 361 (100.0%) | 0 (0.0%) |
| Foreign Born, not a Citizen | 58 (40.3%) | 86 (59.7%) |
Health Insurance Coverage by Household Income in Shaw
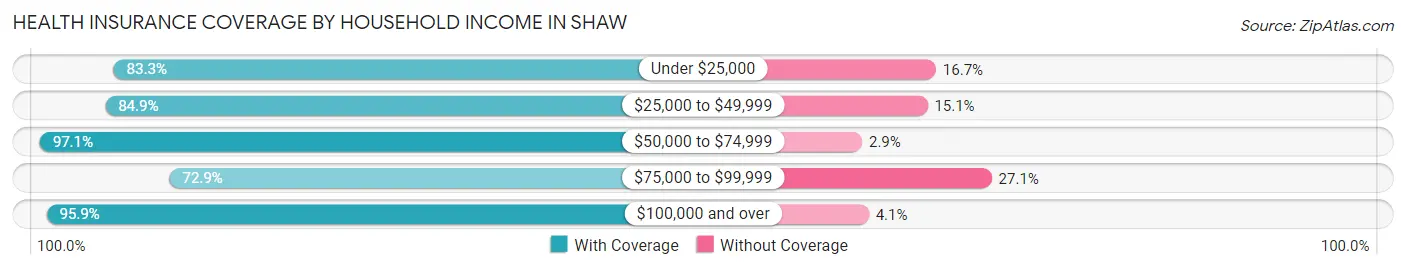
| Household Income | With Coverage | Without Coverage |
| Under $25,000 | 634 (83.3%) | 127 (16.7%) |
| $25,000 to $49,999 | 354 (84.9%) | 63 (15.1%) |
| $50,000 to $74,999 | 238 (97.1%) | 7 (2.9%) |
| $75,000 to $99,999 | 51 (72.9%) | 19 (27.1%) |
| $100,000 and over | 117 (95.9%) | 5 (4.1%) |
Public vs Private Health Insurance Coverage by Age in Shaw
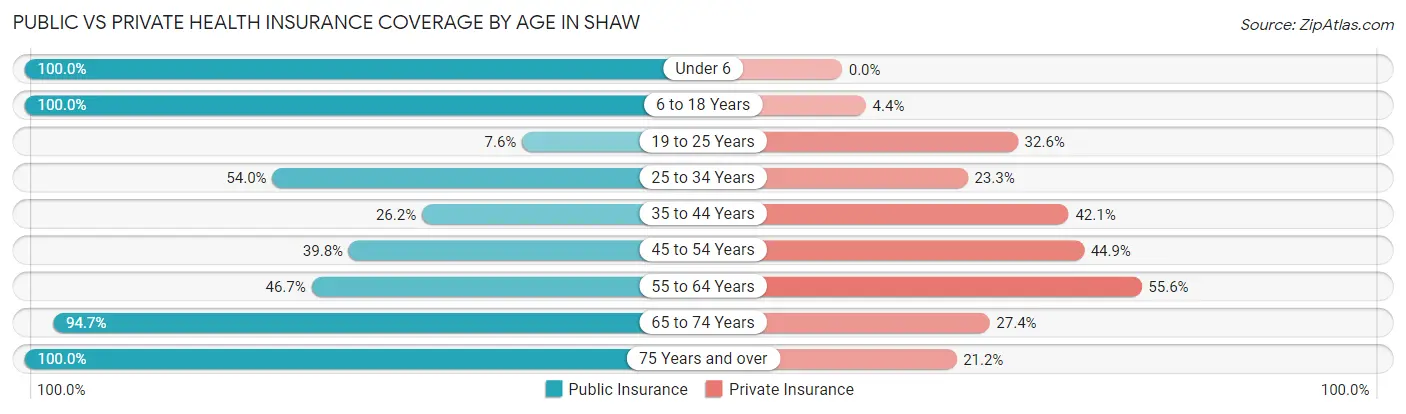
| Age Bracket | Public Insurance | Private Insurance |
| Under 6 | 92 (100.0%) | 0 (0.0%) |
| 6 to 18 Years | 361 (100.0%) | 16 (4.4%) |
| 19 to 25 Years | 11 (7.6%) | 47 (32.6%) |
| 25 to 34 Years | 81 (54.0%) | 35 (23.3%) |
| 35 to 44 Years | 53 (26.2%) | 85 (42.1%) |
| 45 to 54 Years | 39 (39.8%) | 44 (44.9%) |
| 55 to 64 Years | 100 (46.7%) | 119 (55.6%) |
| 65 to 74 Years | 197 (94.7%) | 57 (27.4%) |
| 75 Years and over | 146 (100.0%) | 31 (21.2%) |
| Total | 1,080 (66.9%) | 434 (26.9%) |
Disability Status by Sex by Age in Shaw
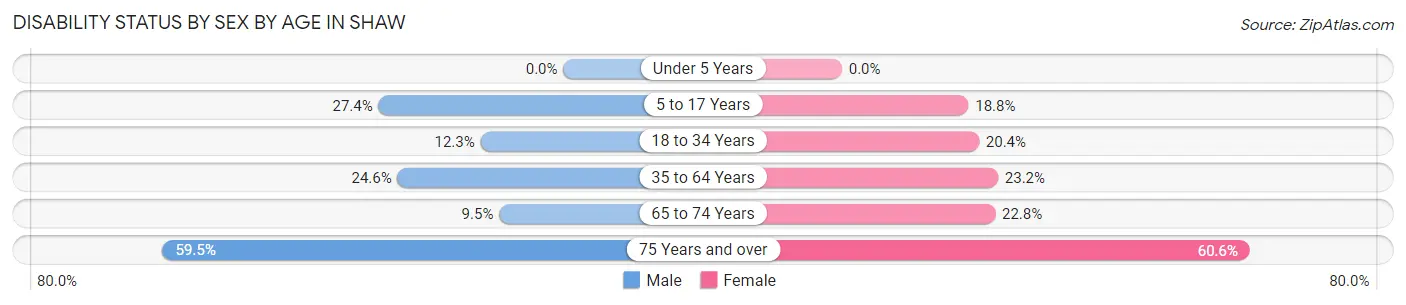
| Age Bracket | Male | Female |
| Under 5 Years | 0 (0.0%) | 0 (0.0%) |
| 5 to 17 Years | 45 (27.4%) | 37 (18.8%) |
| 18 to 34 Years | 15 (12.3%) | 35 (20.3%) |
| 35 to 64 Years | 49 (24.6%) | 73 (23.2%) |
| 65 to 74 Years | 6 (9.5%) | 33 (22.8%) |
| 75 Years and over | 25 (59.5%) | 63 (60.6%) |
Disability Class by Sex by Age in Shaw
Disability Class: Hearing Difficulty
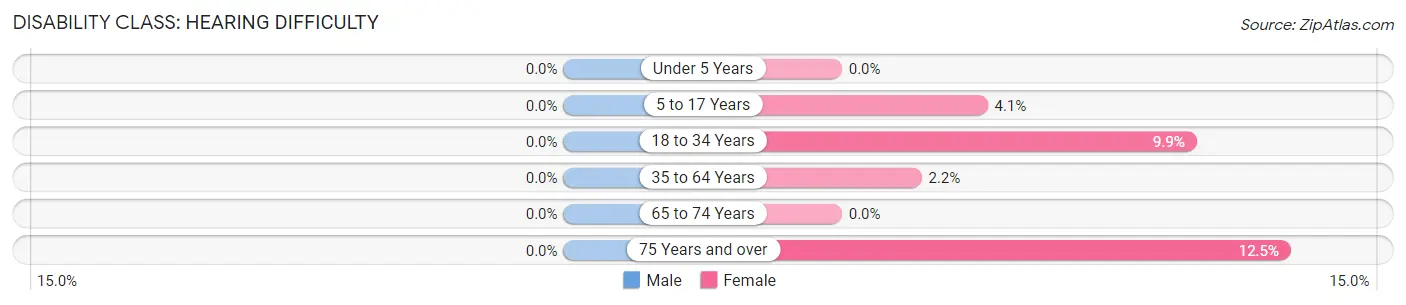
| Age Bracket | Male | Female |
| Under 5 Years | 0 (0.0%) | 0 (0.0%) |
| 5 to 17 Years | 0 (0.0%) | 8 (4.1%) |
| 18 to 34 Years | 0 (0.0%) | 17 (9.9%) |
| 35 to 64 Years | 0 (0.0%) | 7 (2.2%) |
| 65 to 74 Years | 0 (0.0%) | 0 (0.0%) |
| 75 Years and over | 0 (0.0%) | 13 (12.5%) |
Disability Class: Vision Difficulty
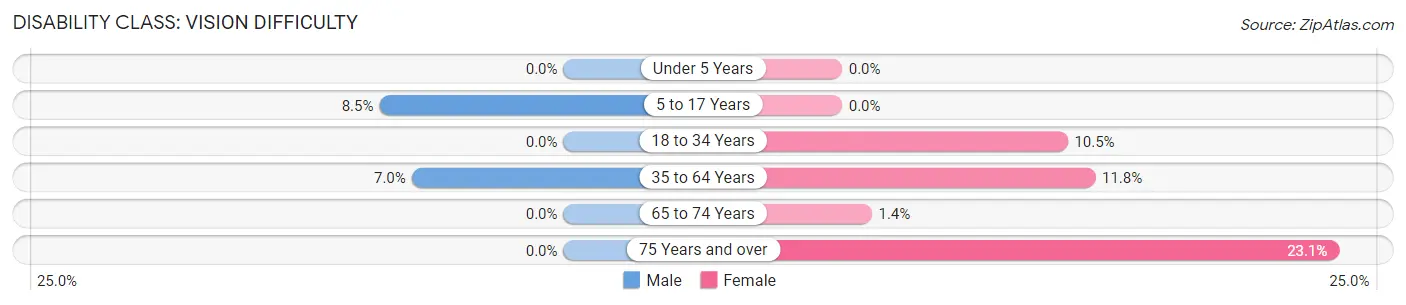
| Age Bracket | Male | Female |
| Under 5 Years | 0 (0.0%) | 0 (0.0%) |
| 5 to 17 Years | 14 (8.5%) | 0 (0.0%) |
| 18 to 34 Years | 0 (0.0%) | 18 (10.5%) |
| 35 to 64 Years | 14 (7.0%) | 37 (11.7%) |
| 65 to 74 Years | 0 (0.0%) | 2 (1.4%) |
| 75 Years and over | 0 (0.0%) | 24 (23.1%) |
Disability Class: Cognitive Difficulty
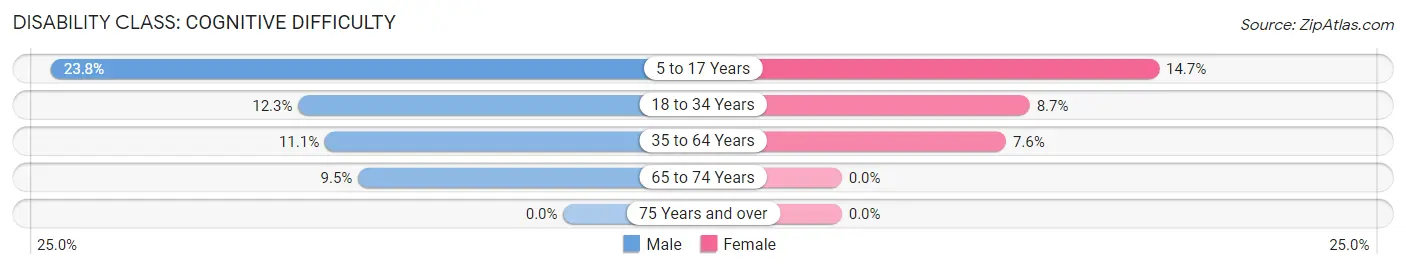
| Age Bracket | Male | Female |
| 5 to 17 Years | 39 (23.8%) | 29 (14.7%) |
| 18 to 34 Years | 15 (12.3%) | 15 (8.7%) |
| 35 to 64 Years | 22 (11.1%) | 24 (7.6%) |
| 65 to 74 Years | 6 (9.5%) | 0 (0.0%) |
| 75 Years and over | 0 (0.0%) | 0 (0.0%) |
Disability Class: Ambulatory Difficulty
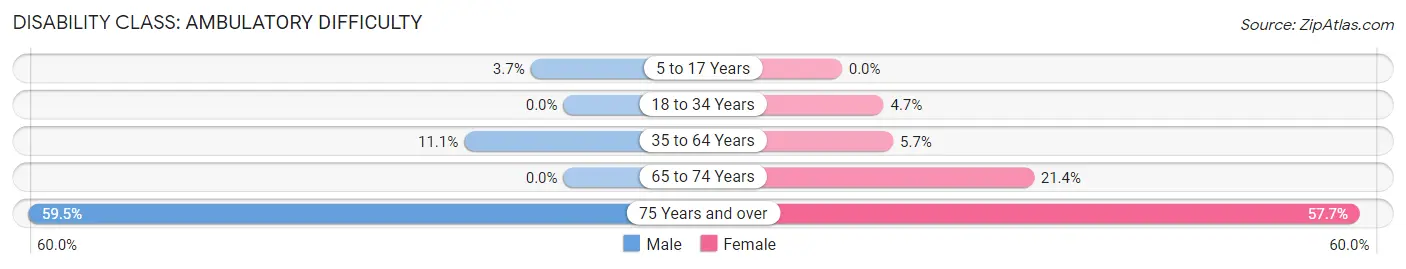
| Age Bracket | Male | Female |
| 5 to 17 Years | 6 (3.7%) | 0 (0.0%) |
| 18 to 34 Years | 0 (0.0%) | 8 (4.6%) |
| 35 to 64 Years | 22 (11.1%) | 18 (5.7%) |
| 65 to 74 Years | 0 (0.0%) | 31 (21.4%) |
| 75 Years and over | 25 (59.5%) | 60 (57.7%) |
Disability Class: Self-Care Difficulty
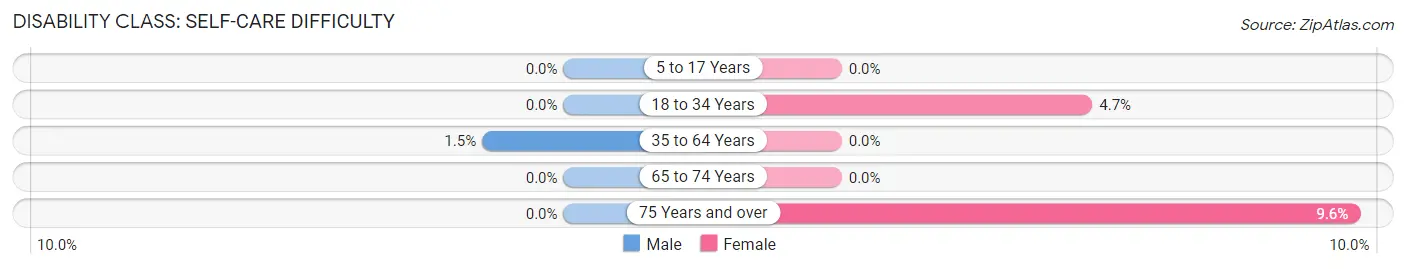
| Age Bracket | Male | Female |
| 5 to 17 Years | 0 (0.0%) | 0 (0.0%) |
| 18 to 34 Years | 0 (0.0%) | 8 (4.6%) |
| 35 to 64 Years | 3 (1.5%) | 0 (0.0%) |
| 65 to 74 Years | 0 (0.0%) | 0 (0.0%) |
| 75 Years and over | 0 (0.0%) | 10 (9.6%) |
Technology Access in Shaw
Computing Device Access in Shaw
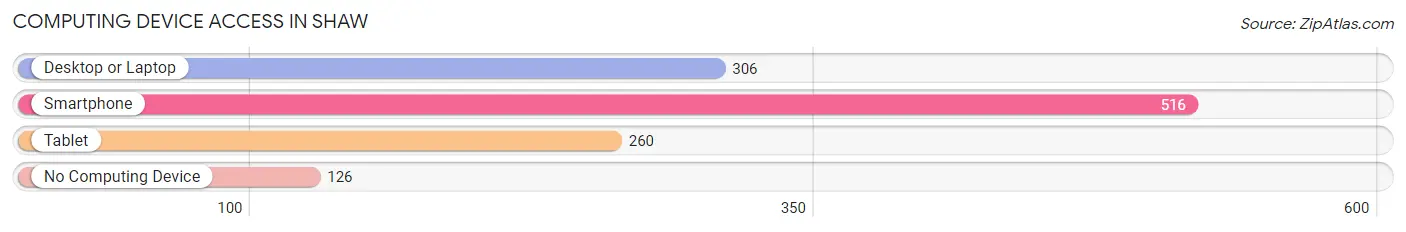
| Device Type | # Households | % Households |
| Desktop or Laptop | 306 | 44.6% |
| Smartphone | 516 | 75.2% |
| Tablet | 260 | 37.9% |
| No Computing Device | 126 | 18.4% |
| Total | 686 | 100.0% |
Internet Access in Shaw
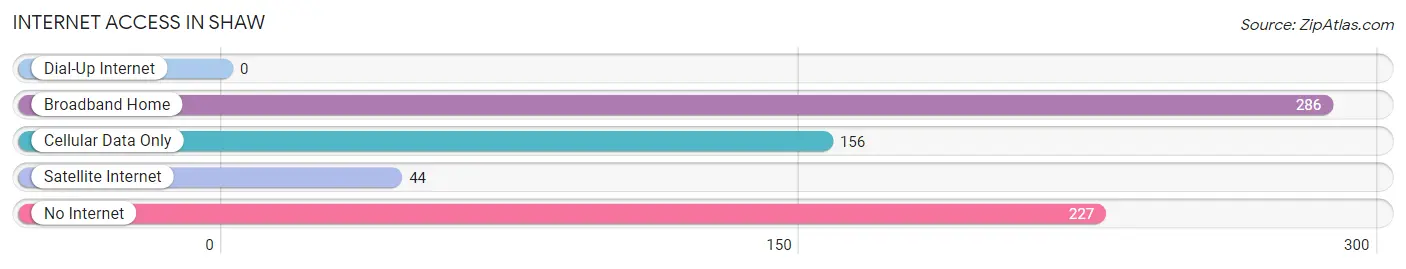
| Internet Type | # Households | % Households |
| Dial-Up Internet | 0 | 0.0% |
| Broadband Home | 286 | 41.7% |
| Cellular Data Only | 156 | 22.7% |
| Satellite Internet | 44 | 6.4% |
| No Internet | 227 | 33.1% |
| Total | 686 | 100.0% |
Shaw Summary
MS History
Mississippi is a state located in the southeastern region of the United States. It is bordered by Tennessee to the north, Alabama to the east, the Gulf of Mexico to the south, and Louisiana and Arkansas to the west. Mississippi has a rich and diverse history, with its roots stretching back to the early days of the United States.
The first inhabitants of the area that is now Mississippi were Native American tribes, including the Choctaw, Chickasaw, and Natchez. These tribes were largely nomadic, living off the land and trading with other tribes. The first Europeans to explore the area were Spanish explorers in the 16th century. The French later established a colony in the area in the early 1700s, and the British took control of the region in 1763.
In 1817, Mississippi became the 20th state to join the Union. During the 19th century, Mississippi was a major center of the cotton industry, and the state’s economy was heavily dependent on the labor of enslaved African Americans. After the Civil War, Mississippi was the first state to ratify the 13th Amendment, which abolished slavery.
In the early 20th century, Mississippi was a major center of the civil rights movement. In 1954, the Supreme Court ruled in Brown v. Board of Education that segregated schools were unconstitutional, and Mississippi was one of the first states to desegregate its schools. In 1964, the Civil Rights Act was passed, outlawing discrimination based on race, color, religion, sex, or national origin.
Geography
Mississippi is located in the southeastern region of the United States. It is bordered by Tennessee to the north, Alabama to the east, the Gulf of Mexico to the south, and Louisiana and Arkansas to the west. Mississippi is the 32nd largest state in the US, with an area of 48,430 square miles.
The state is divided into three distinct geographic regions: the Gulf Coastal Plain, the Mississippi Alluvial Plain, and the Mississippi Hills. The Gulf Coastal Plain is located along the Gulf of Mexico and is characterized by flat, low-lying land. The Mississippi Alluvial Plain is located in the northern part of the state and is characterized by flat, fertile land. The Mississippi Hills are located in the western part of the state and are characterized by rolling hills and valleys.
Economy
Mississippi’s economy is largely based on agriculture, manufacturing, and tourism. The state’s agricultural sector is the largest in the nation, with crops such as cotton, soybeans, corn, and rice being the main sources of income. The manufacturing sector is also important to the state’s economy, with products such as furniture, textiles, and chemicals being produced in the state.
Tourism is also a major contributor to the state’s economy. Mississippi is home to a number of popular tourist attractions, including the Gulf Coast beaches, the Mississippi River, and the Natchez Trace Parkway.
Demographics
As of 2020, Mississippi had an estimated population of 2,976,149. The state is predominantly white, with 73.3% of the population identifying as white. African Americans make up the largest minority group in the state, accounting for 37.3% of the population. Other racial groups include Hispanics (3.7%), Asians (1.2%), and Native Americans (0.7%).
The median household income in Mississippi is $45,919, and the poverty rate is 19.7%. The state’s unemployment rate is 5.2%. The largest cities in Mississippi are Jackson (population: 173,514), Gulfport (population: 71,844), and Southaven (population: 51,988).
Common Questions
What is Per Capita Income in Shaw?
Per Capita income in Shaw is $15,275.
What is the Median Family Income in Shaw?
Median Family Income in Shaw is $29,271.
What is the Median Household income in Shaw?
Median Household Income in Shaw is $23,875.
What is Income or Wage Gap in Shaw?
Income or Wage Gap in Shaw is 33.3%.
Women in Shaw earn 66.7 cents for every dollar earned by a man.
What is Family Income Deficit in Shaw?
Family Income Deficit in Shaw is $14,186.
Families that are below poverty line in Shaw earn $14,186 less on average than the poverty threshold level.
What is Inequality or Gini Index in Shaw?
Inequality or Gini Index in Shaw is 0.48.
What is the Total Population of Shaw?
Total Population of Shaw is 1,615.
What is the Total Male Population of Shaw?
Total Male Population of Shaw is 656.
What is the Total Female Population of Shaw?
Total Female Population of Shaw is 959.
What is the Ratio of Males per 100 Females in Shaw?
There are 68.40 Males per 100 Females in Shaw.
What is the Ratio of Females per 100 Males in Shaw?
There are 146.19 Females per 100 Males in Shaw.
What is the Median Population Age in Shaw?
Median Population Age in Shaw is 38.3 Years.
What is the Average Family Size in Shaw
Average Family Size in Shaw is 2.8 People.
What is the Average Household Size in Shaw
Average Household Size in Shaw is 2.4 People.
How Large is the Labor Force in Shaw?
There are 577 People in the Labor Forcein in Shaw.
What is the Percentage of People in the Labor Force in Shaw?
46.6% of People are in the Labor Force in Shaw.
What is the Unemployment Rate in Shaw?
Unemployment Rate in Shaw is 8.1%.