Shannon, MS Map & Demographics
Shannon Map
Shannon Overview
$20,060
PER CAPITA INCOME
$62,670
AVG FAMILY INCOME
$38,125
AVG HOUSEHOLD INCOME
5.7%
WAGE / INCOME GAP [ % ]
94.3¢/ $1
WAGE / INCOME GAP [ $ ]
0.44
INEQUALITY / GINI INDEX
1,663
TOTAL POPULATION
751
MALE POPULATION
912
FEMALE POPULATION
82.35
MALES / 100 FEMALES
121.44
FEMALES / 100 MALES
36.3
MEDIAN AGE
3.4
AVG FAMILY SIZE
2.4
AVG HOUSEHOLD SIZE
686
LABOR FORCE [ PEOPLE ]
55.6%
PERCENT IN LABOR FORCE
7.0%
UNEMPLOYMENT RATE
Shannon Zip Codes
Shannon Area Codes
Income in Shannon
Income Overview in Shannon
Per Capita Income in Shannon is $20,060, while median incomes of families and households are $62,670 and $38,125 respectively.
| Characteristic | Number | Measure |
| Per Capita Income | 1,663 | $20,060 |
| Median Family Income | 363 | $62,670 |
| Mean Family Income | 363 | $62,718 |
| Median Household Income | 708 | $38,125 |
| Mean Household Income | 708 | $46,160 |
| Income Deficit | 363 | $0 |
| Wage / Income Gap (%) | 1,663 | 5.66% |
| Wage / Income Gap ($) | 1,663 | 94.34¢ per $1 |
| Gini / Inequality Index | 1,663 | 0.44 |
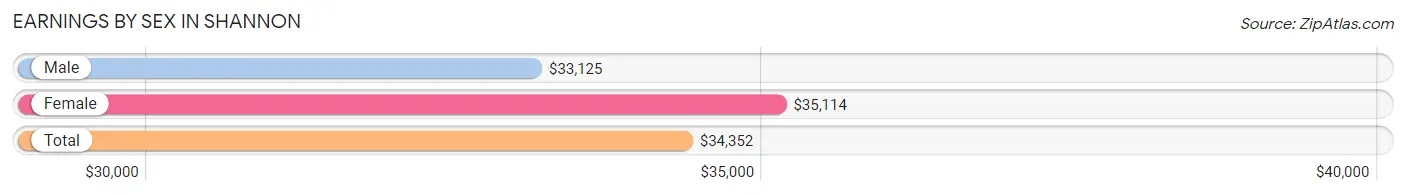
Earnings by Sex in Shannon
Average Earnings in Shannon are $34,352, $33,125 for men and $35,114 for women, a difference of 5.7%.
| Sex | Number | Average Earnings |
| Male | 351 (50.6%) | $33,125 |
| Female | 343 (49.4%) | $35,114 |
| Total | 694 (100.0%) | $34,352 |
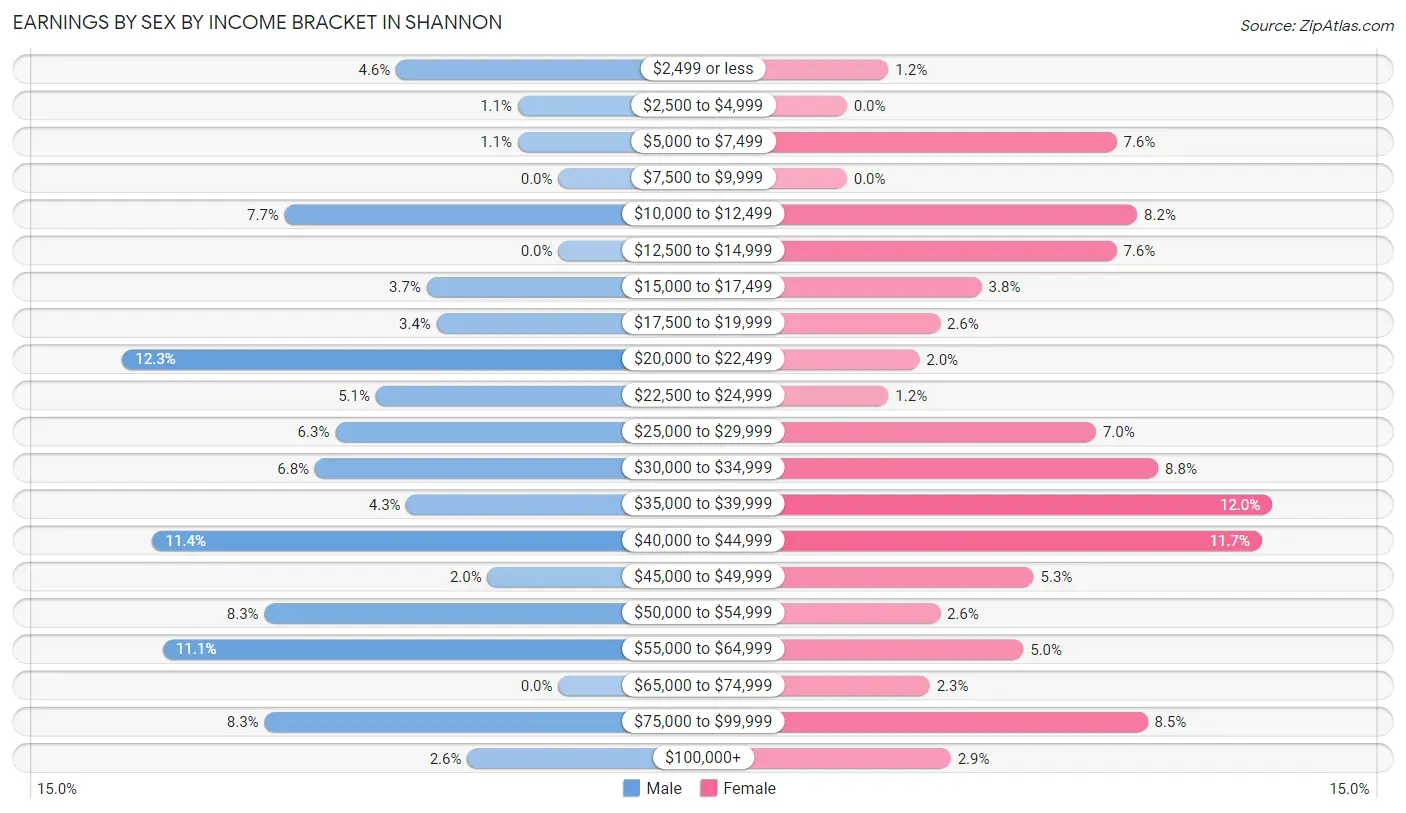
Earnings by Sex by Income Bracket in Shannon
The most common earnings brackets in Shannon are $20,000 to $22,499 for men (43 | 12.2%) and $35,000 to $39,999 for women (41 | 11.9%).
| Income | Male | Female |
| $2,499 or less | 16 (4.6%) | 4 (1.2%) |
| $2,500 to $4,999 | 4 (1.1%) | 0 (0.0%) |
| $5,000 to $7,499 | 4 (1.1%) | 26 (7.6%) |
| $7,500 to $9,999 | 0 (0.0%) | 0 (0.0%) |
| $10,000 to $12,499 | 27 (7.7%) | 28 (8.2%) |
| $12,500 to $14,999 | 0 (0.0%) | 26 (7.6%) |
| $15,000 to $17,499 | 13 (3.7%) | 13 (3.8%) |
| $17,500 to $19,999 | 12 (3.4%) | 9 (2.6%) |
| $20,000 to $22,499 | 43 (12.2%) | 7 (2.0%) |
| $22,500 to $24,999 | 18 (5.1%) | 4 (1.2%) |
| $25,000 to $29,999 | 22 (6.3%) | 24 (7.0%) |
| $30,000 to $34,999 | 24 (6.8%) | 30 (8.7%) |
| $35,000 to $39,999 | 15 (4.3%) | 41 (11.9%) |
| $40,000 to $44,999 | 40 (11.4%) | 40 (11.7%) |
| $45,000 to $49,999 | 7 (2.0%) | 18 (5.2%) |
| $50,000 to $54,999 | 29 (8.3%) | 9 (2.6%) |
| $55,000 to $64,999 | 39 (11.1%) | 17 (5.0%) |
| $65,000 to $74,999 | 0 (0.0%) | 8 (2.3%) |
| $75,000 to $99,999 | 29 (8.3%) | 29 (8.5%) |
| $100,000+ | 9 (2.6%) | 10 (2.9%) |
| Total | 351 (100.0%) | 343 (100.0%) |
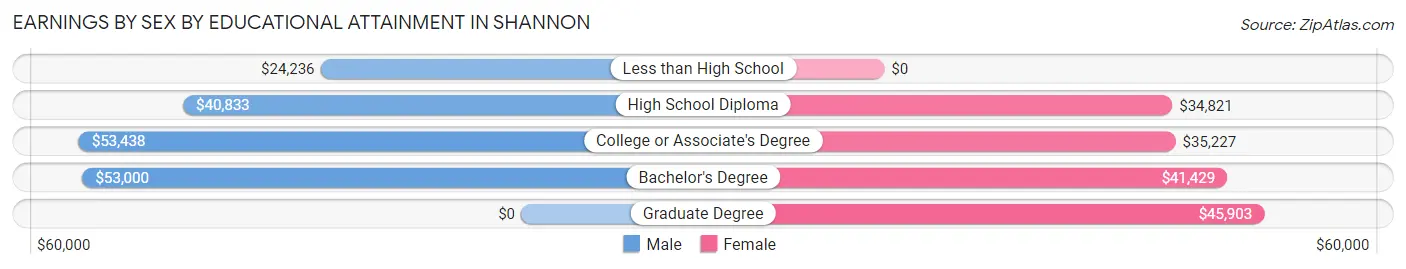
Earnings by Sex by Educational Attainment in Shannon
Average earnings in Shannon are $40,694 for men and $38,250 for women, a difference of 6.0%. Men with an educational attainment of college or associate's degree enjoy the highest average annual earnings of $53,438, while those with less than high school education earn the least with $24,236. Women with an educational attainment of graduate degree earn the most with the average annual earnings of $45,903, while those with high school diploma education have the smallest earnings of $34,821.
| Educational Attainment | Male Income | Female Income |
| Less than High School | $24,236 | $0 |
| High School Diploma | $40,833 | $34,821 |
| College or Associate's Degree | $53,438 | $35,227 |
| Bachelor's Degree | $53,000 | $41,429 |
| Graduate Degree | - | - |
| Total | $40,694 | $38,250 |
Family Income in Shannon
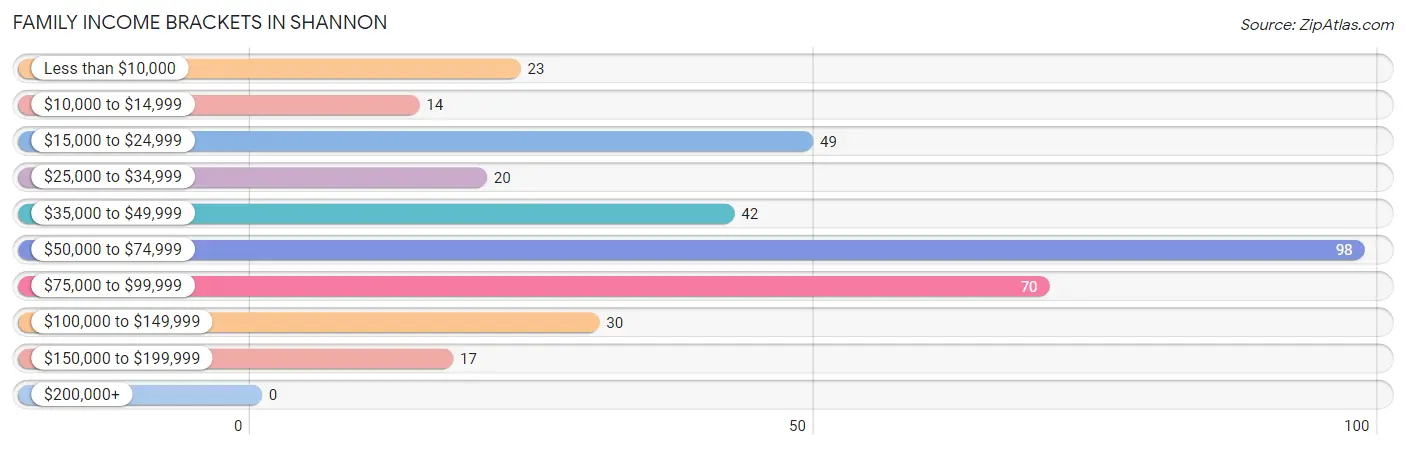
Family Income Brackets in Shannon
According to the Shannon family income data, there are 98 families falling into the $50,000 to $74,999 income range, which is the most common income bracket and makes up 27.0% of all families.
| Income Bracket | # Families | % Families |
| Less than $10,000 | 23 | 6.3% |
| $10,000 to $14,999 | 14 | 3.9% |
| $15,000 to $24,999 | 49 | 13.5% |
| $25,000 to $34,999 | 20 | 5.5% |
| $35,000 to $49,999 | 42 | 11.6% |
| $50,000 to $74,999 | 98 | 27.0% |
| $75,000 to $99,999 | 70 | 19.3% |
| $100,000 to $149,999 | 30 | 8.3% |
| $150,000 to $199,999 | 17 | 4.7% |
| $200,000+ | 0 | 0.0% |
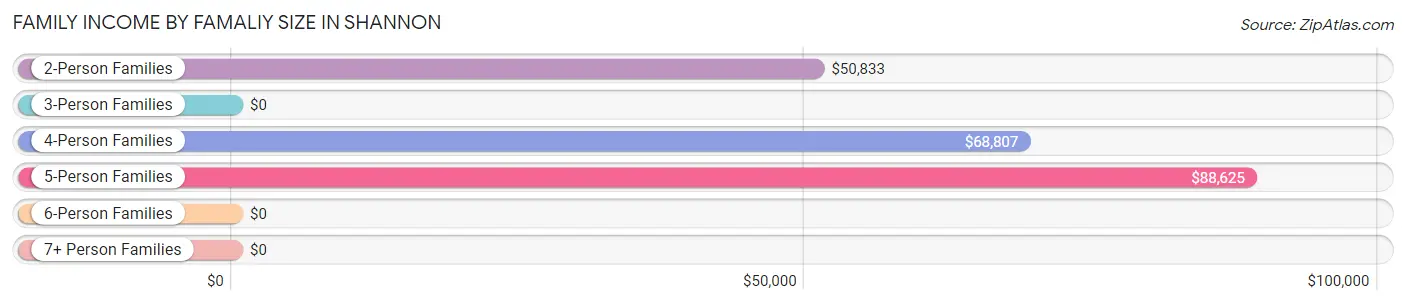
Family Income by Famaliy Size in Shannon
5-person families (53 | 14.6%) account for the highest median family income in Shannon with $88,625 per family, while 2-person families (142 | 39.1%) have the highest median income of $25,416 per family member.
| Income Bracket | # Families | Median Income |
| 2-Person Families | 142 (39.1%) | $50,833 |
| 3-Person Families | 94 (25.9%) | $0 |
| 4-Person Families | 69 (19.0%) | $68,807 |
| 5-Person Families | 53 (14.6%) | $88,625 |
| 6-Person Families | 5 (1.4%) | $0 |
| 7+ Person Families | 0 (0.0%) | $0 |
| Total | 363 (100.0%) | $62,670 |
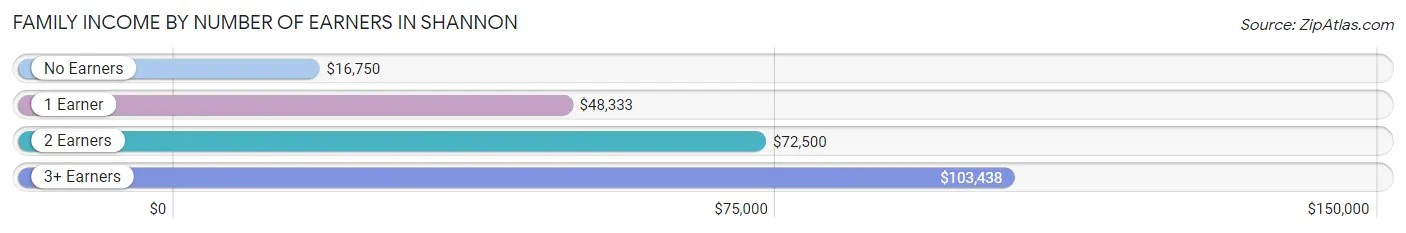
Family Income by Number of Earners in Shannon
The median family income in Shannon is $62,670, with families comprising 3+ earners (27) having the highest median family income of $103,438, while families with no earners (88) have the lowest median family income of $16,750, accounting for 7.4% and 24.2% of families, respectively.
| Number of Earners | # Families | Median Income |
| No Earners | 88 (24.2%) | $16,750 |
| 1 Earner | 116 (32.0%) | $48,333 |
| 2 Earners | 132 (36.4%) | $72,500 |
| 3+ Earners | 27 (7.4%) | $103,438 |
| Total | 363 (100.0%) | $62,670 |
Household Income in Shannon
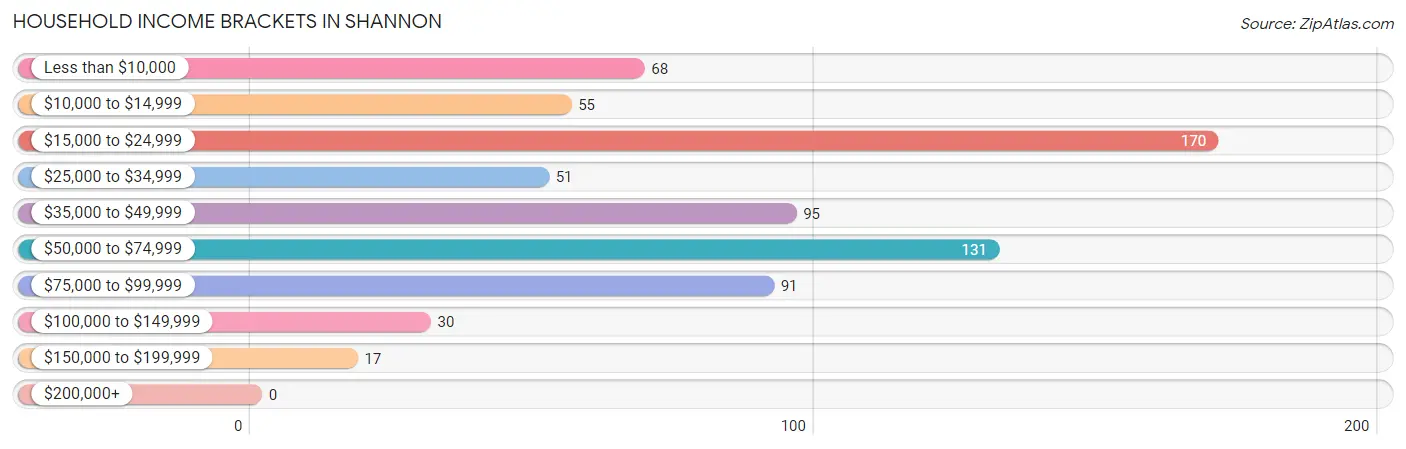
Household Income Brackets in Shannon
With 170 households falling in the category, the $15,000 to $24,999 income range is the most frequent in Shannon, accounting for 24.0% of all households.
| Income Bracket | # Households | % Households |
| Less than $10,000 | 68 | 9.6% |
| $10,000 to $14,999 | 55 | 7.8% |
| $15,000 to $24,999 | 170 | 24.0% |
| $25,000 to $34,999 | 51 | 7.2% |
| $35,000 to $49,999 | 95 | 13.4% |
| $50,000 to $74,999 | 131 | 18.5% |
| $75,000 to $99,999 | 91 | 12.9% |
| $100,000 to $149,999 | 30 | 4.2% |
| $150,000 to $199,999 | 17 | 2.4% |
| $200,000+ | 0 | 0.0% |
Household Income by Householder Age in Shannon
The median household income in Shannon is $38,125, with the highest median household income of $45,500 found in the 25 to 44 years age bracket for the primary householder. A total of 254 households (35.9%) fall into this category. Meanwhile, the 15 to 24 years age bracket for the primary householder has the lowest median household income of $0, with 5 households (0.7%) in this group.
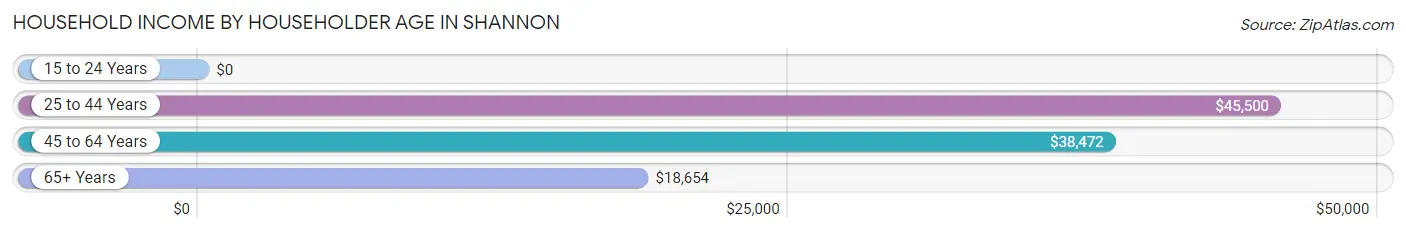
| Income Bracket | # Households | Median Income |
| 15 to 24 Years | 5 (0.7%) | $0 |
| 25 to 44 Years | 254 (35.9%) | $45,500 |
| 45 to 64 Years | 249 (35.2%) | $38,472 |
| 65+ Years | 200 (28.2%) | $18,654 |
| Total | 708 (100.0%) | $38,125 |
Poverty in Shannon
Income Below Poverty by Sex and Age in Shannon
With 20.0% poverty level for males and 26.3% for females among the residents of Shannon, under 5 year old males and 65 to 74 year old females are the most vulnerable to poverty, with 26 males (68.4%) and 48 females (48.0%) in their respective age groups living below the poverty level.
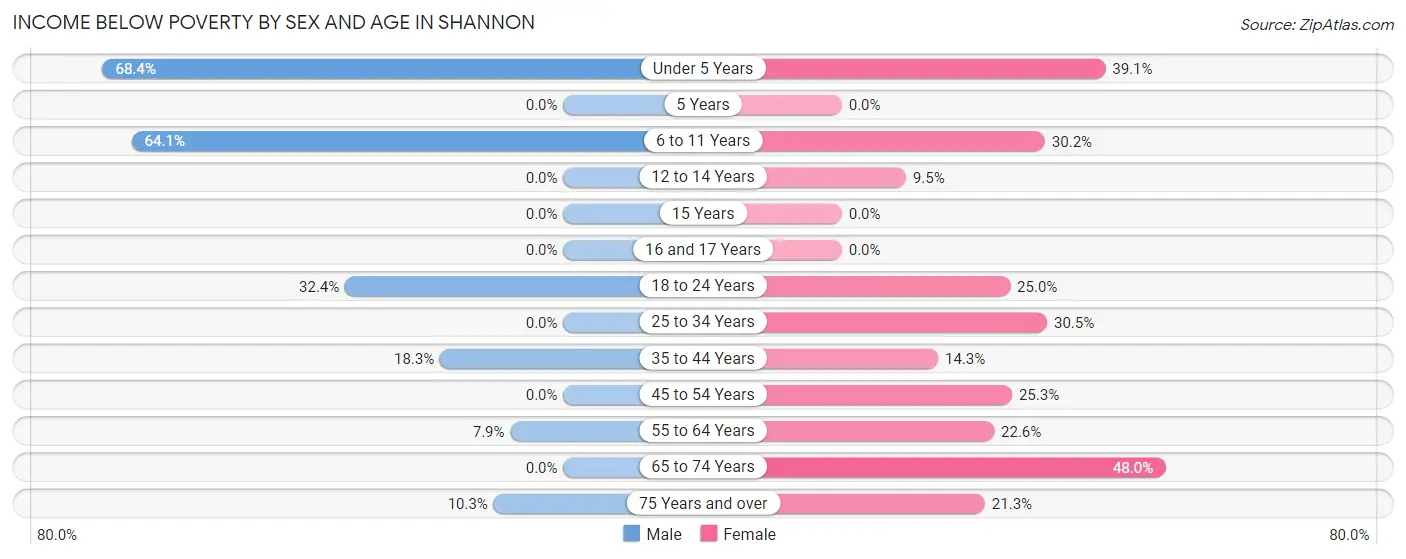
| Age Bracket | Male | Female |
| Under 5 Years | 26 (68.4%) | 36 (39.1%) |
| 5 Years | 0 (0.0%) | 0 (0.0%) |
| 6 to 11 Years | 50 (64.1%) | 19 (30.2%) |
| 12 to 14 Years | 0 (0.0%) | 6 (9.5%) |
| 15 Years | 0 (0.0%) | 0 (0.0%) |
| 16 and 17 Years | 0 (0.0%) | 0 (0.0%) |
| 18 to 24 Years | 35 (32.4%) | 17 (25.0%) |
| 25 to 34 Years | 0 (0.0%) | 32 (30.5%) |
| 35 to 44 Years | 26 (18.3%) | 19 (14.3%) |
| 45 to 54 Years | 0 (0.0%) | 23 (25.3%) |
| 55 to 64 Years | 10 (7.9%) | 19 (22.6%) |
| 65 to 74 Years | 0 (0.0%) | 48 (48.0%) |
| 75 Years and over | 3 (10.3%) | 17 (21.2%) |
| Total | 150 (20.0%) | 236 (26.3%) |
Income Above Poverty by Sex and Age in Shannon
According to the poverty statistics in Shannon, males aged 12 to 14 years and females aged 15 years are the age groups that are most secure financially, with 100.0% of males and 100.0% of females in these age groups living above the poverty line.
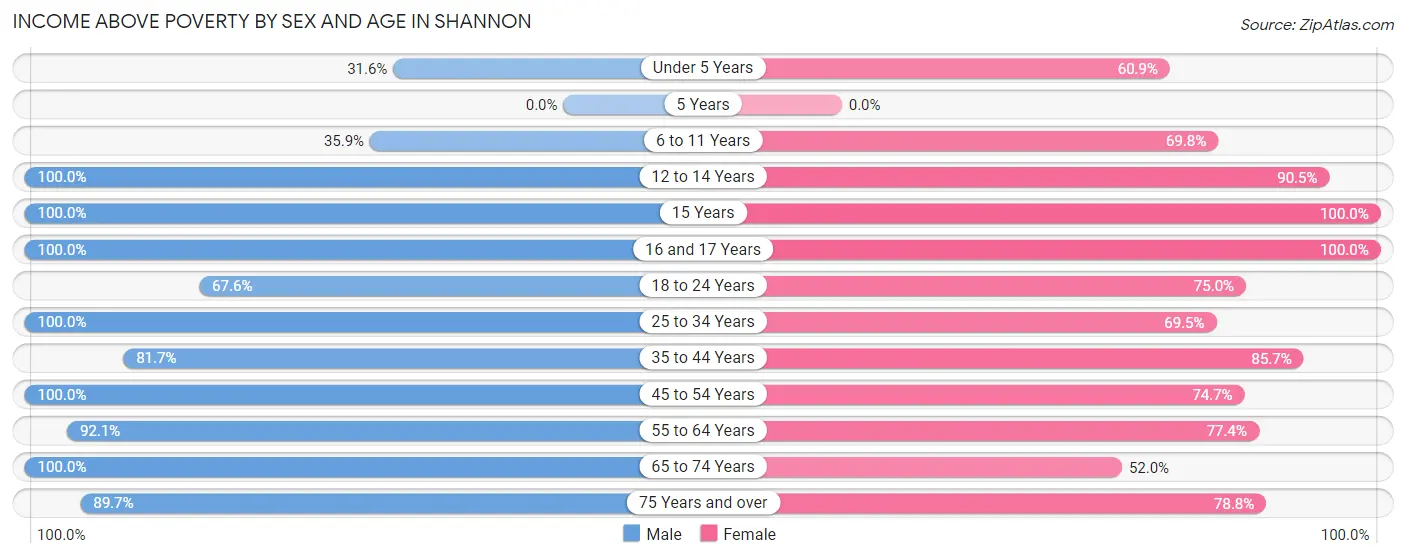
| Age Bracket | Male | Female |
| Under 5 Years | 12 (31.6%) | 56 (60.9%) |
| 5 Years | 0 (0.0%) | 0 (0.0%) |
| 6 to 11 Years | 28 (35.9%) | 44 (69.8%) |
| 12 to 14 Years | 48 (100.0%) | 57 (90.5%) |
| 15 Years | 21 (100.0%) | 11 (100.0%) |
| 16 and 17 Years | 5 (100.0%) | 6 (100.0%) |
| 18 to 24 Years | 73 (67.6%) | 51 (75.0%) |
| 25 to 34 Years | 53 (100.0%) | 73 (69.5%) |
| 35 to 44 Years | 116 (81.7%) | 114 (85.7%) |
| 45 to 54 Years | 54 (100.0%) | 68 (74.7%) |
| 55 to 64 Years | 117 (92.1%) | 65 (77.4%) |
| 65 to 74 Years | 48 (100.0%) | 52 (52.0%) |
| 75 Years and over | 26 (89.7%) | 63 (78.7%) |
| Total | 601 (80.0%) | 660 (73.7%) |
Income Below Poverty Among Married-Couple Families in Shannon
The poverty statistics for married-couple families in Shannon show that 4.1% or 9 of the total 221 families live below the poverty line. Families with 1 or 2 children have the highest poverty rate of 6.2%, comprising of 5 families. On the other hand, families with 3 or 4 children have the lowest poverty rate of 0.0%, which includes 0 families.
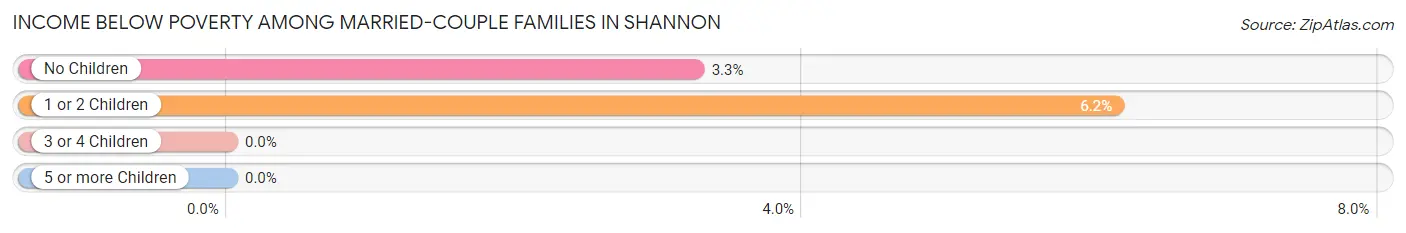
| Children | Above Poverty | Below Poverty |
| No Children | 119 (96.8%) | 4 (3.3%) |
| 1 or 2 Children | 76 (93.8%) | 5 (6.2%) |
| 3 or 4 Children | 17 (100.0%) | 0 (0.0%) |
| 5 or more Children | 0 (0.0%) | 0 (0.0%) |
| Total | 212 (95.9%) | 9 (4.1%) |
Income Below Poverty Among Single-Parent Households in Shannon
According to the poverty data in Shannon, 18.8% or 3 single-father households and 49.2% or 62 single-mother households are living below the poverty line. Among single-father households, those with no children have the highest poverty rate, with 3 households (100.0%) experiencing poverty. Likewise, among single-mother households, those with 3 or 4 children have the highest poverty rate, with 11 households (100.0%) falling below the poverty line.
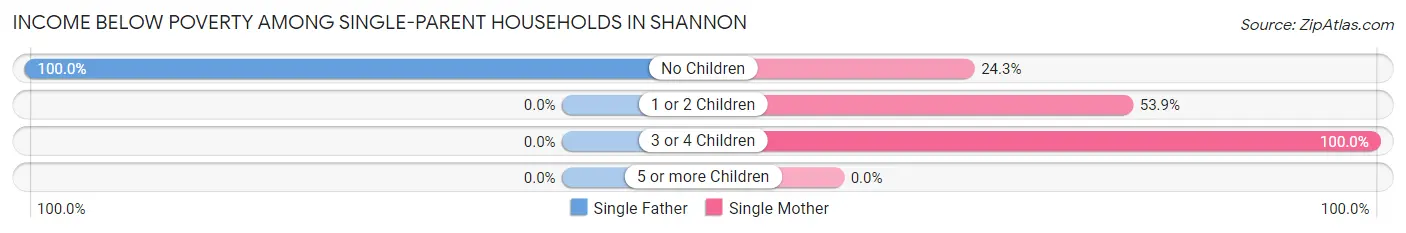
| Children | Single Father | Single Mother |
| No Children | 3 (100.0%) | 9 (24.3%) |
| 1 or 2 Children | 0 (0.0%) | 42 (53.8%) |
| 3 or 4 Children | 0 (0.0%) | 11 (100.0%) |
| 5 or more Children | 0 (0.0%) | 0 (0.0%) |
| Total | 3 (18.8%) | 62 (49.2%) |
Income Below Poverty Among Married-Couple vs Single-Parent Households in Shannon
The poverty data for Shannon shows that 9 of the married-couple family households (4.1%) and 65 of the single-parent households (45.8%) are living below the poverty level. Within the married-couple family households, those with 1 or 2 children have the highest poverty rate, with 5 households (6.2%) falling below the poverty line. Among the single-parent households, those with 3 or 4 children have the highest poverty rate, with 11 household (55.0%) living below poverty.
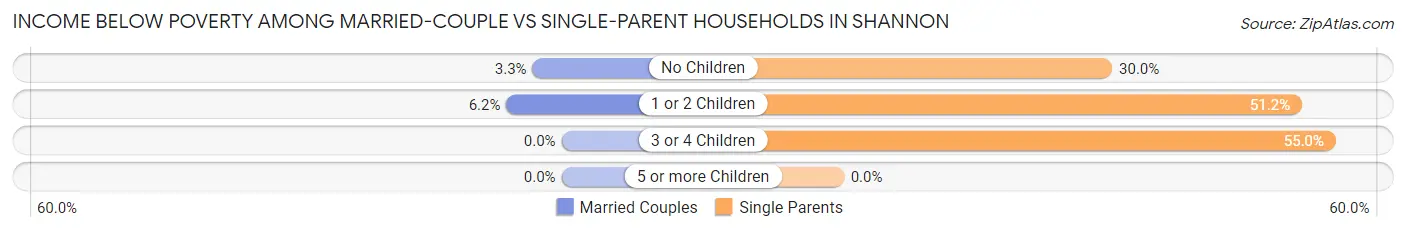
| Children | Married-Couple Families | Single-Parent Households |
| No Children | 4 (3.3%) | 12 (30.0%) |
| 1 or 2 Children | 5 (6.2%) | 42 (51.2%) |
| 3 or 4 Children | 0 (0.0%) | 11 (55.0%) |
| 5 or more Children | 0 (0.0%) | 0 (0.0%) |
| Total | 9 (4.1%) | 65 (45.8%) |
Race in Shannon
The most populous races in Shannon are Black / African American (974 | 58.6%), White / Caucasian (529 | 31.8%), and Hispanic or Latino (123 | 7.4%).
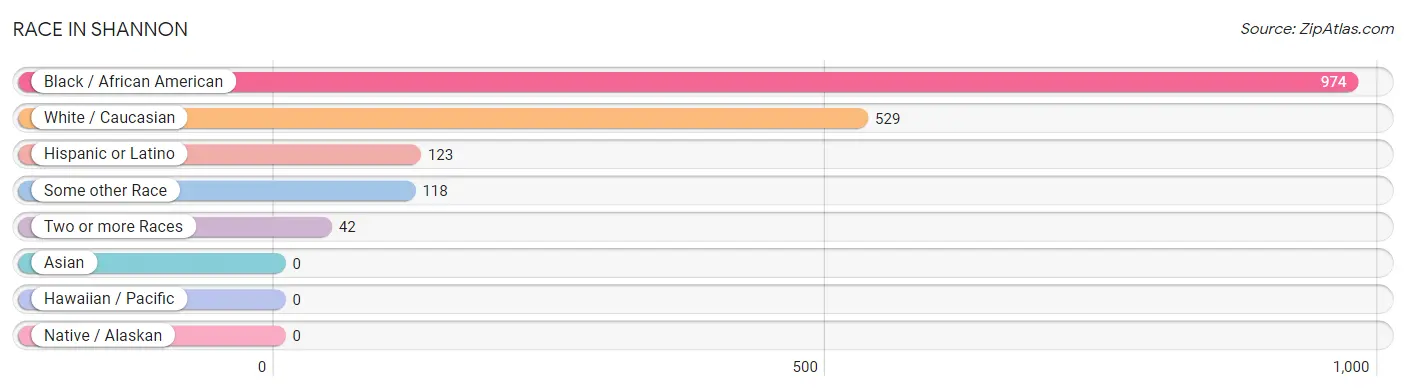
| Race | # Population | % Population |
| Asian | 0 | 0.0% |
| Black / African American | 974 | 58.6% |
| Hawaiian / Pacific | 0 | 0.0% |
| Hispanic or Latino | 123 | 7.4% |
| Native / Alaskan | 0 | 0.0% |
| White / Caucasian | 529 | 31.8% |
| Two or more Races | 42 | 2.5% |
| Some other Race | 118 | 7.1% |
| Total | 1,663 | 100.0% |
Ancestry in Shannon
The most populous ancestries reported in Shannon are Mexican (123 | 7.4%), English (86 | 5.2%), American (64 | 3.8%), Irish (39 | 2.4%), and German (17 | 1.0%), together accounting for 19.8% of all Shannon residents.
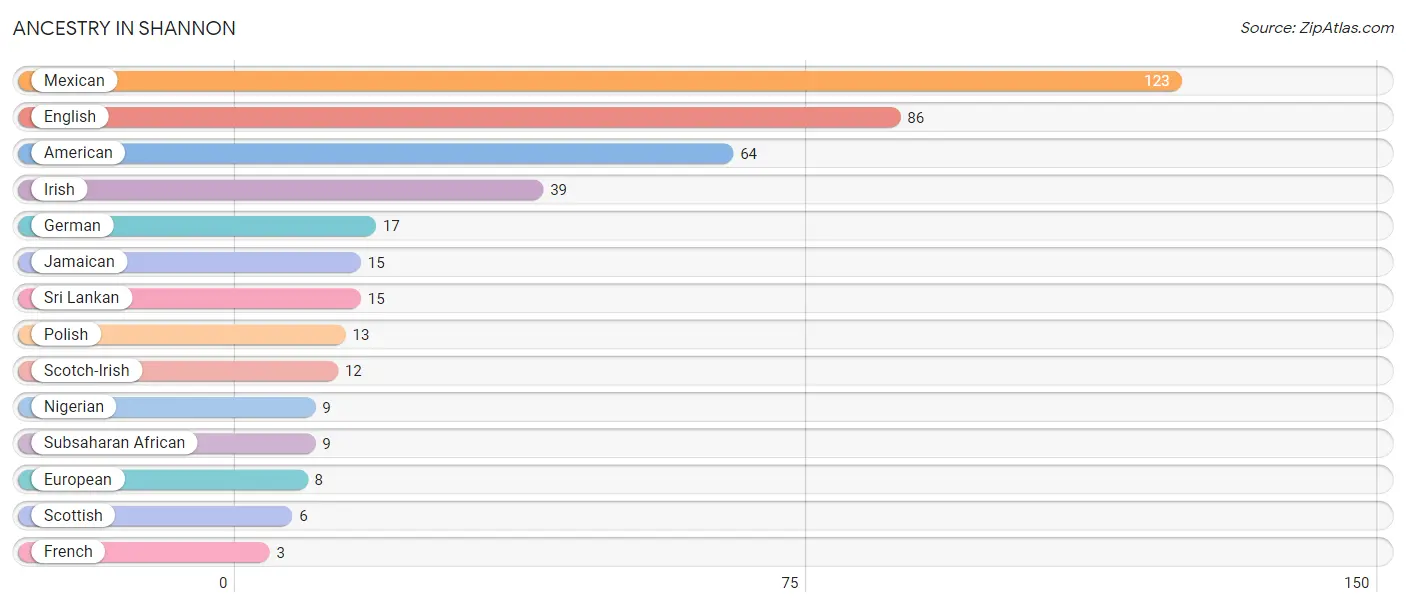
| Ancestry | # Population | % Population |
| American | 64 | 3.8% |
| English | 86 | 5.2% |
| European | 8 | 0.5% |
| French | 3 | 0.2% |
| German | 17 | 1.0% |
| Irish | 39 | 2.4% |
| Jamaican | 15 | 0.9% |
| Mexican | 123 | 7.4% |
| Nigerian | 9 | 0.5% |
| Polish | 13 | 0.8% |
| Scotch-Irish | 12 | 0.7% |
| Scottish | 6 | 0.4% |
| Sri Lankan | 15 | 0.9% |
| Subsaharan African | 9 | 0.5% | View All 14 Rows |
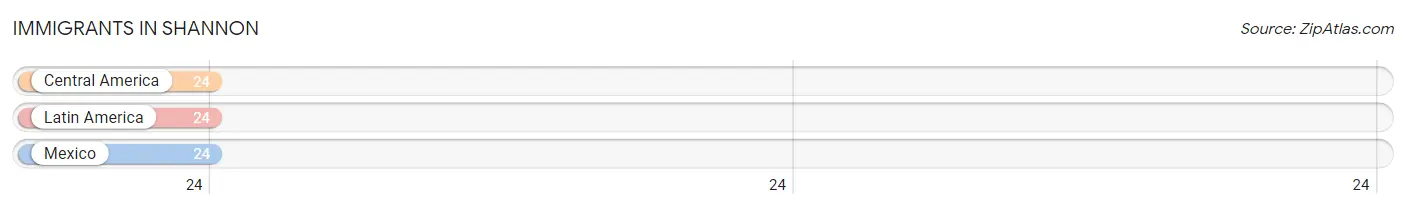
Immigrants in Shannon
The most numerous immigrant groups reported in Shannon came from Central America (24 | 1.4%), Latin America (24 | 1.4%), and Mexico (24 | 1.4%), together accounting for 4.3% of all Shannon residents.
| Immigration Origin | # Population | % Population |
| Central America | 24 | 1.4% |
| Latin America | 24 | 1.4% |
| Mexico | 24 | 1.4% | View All 3 Rows |
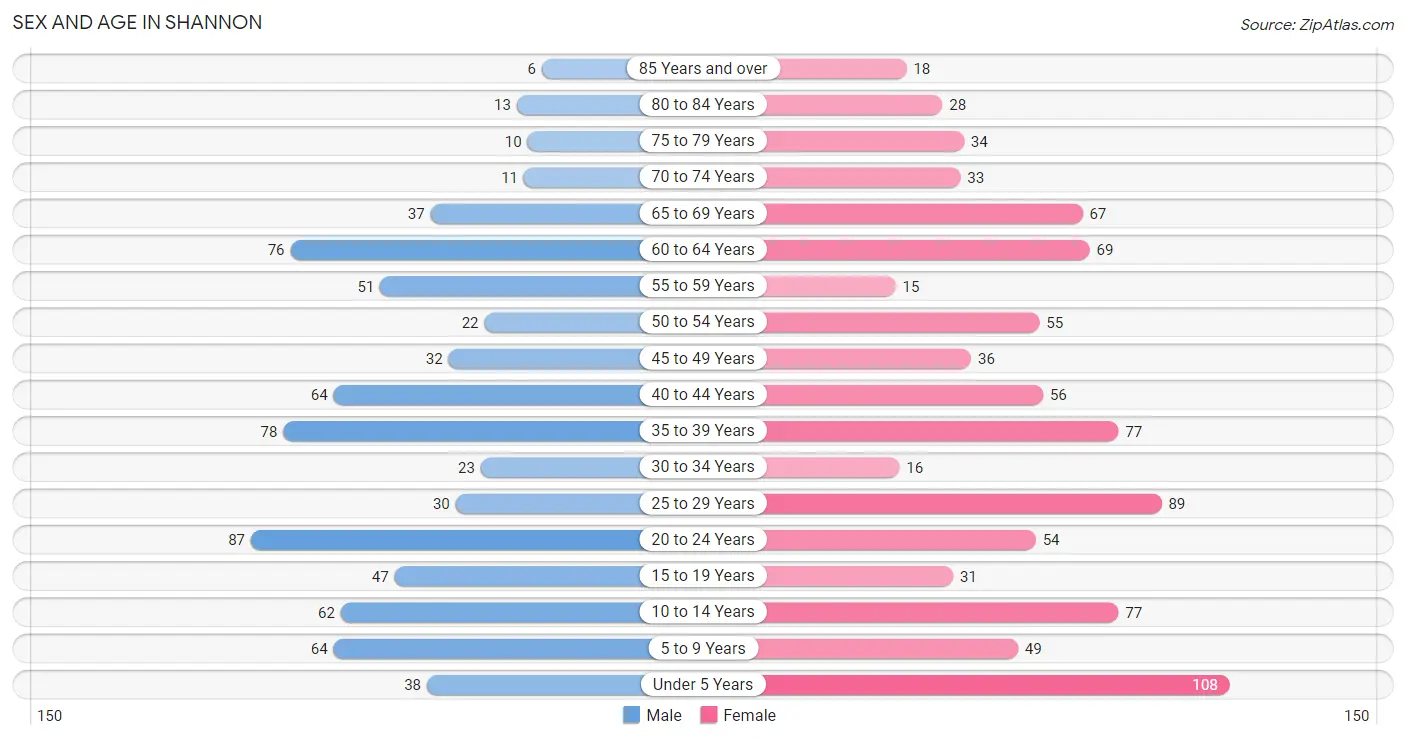
Sex and Age in Shannon
Sex and Age in Shannon
The most populous age groups in Shannon are 20 to 24 Years (87 | 11.6%) for men and Under 5 Years (108 | 11.8%) for women.
| Age Bracket | Male | Female |
| Under 5 Years | 38 (5.1%) | 108 (11.8%) |
| 5 to 9 Years | 64 (8.5%) | 49 (5.4%) |
| 10 to 14 Years | 62 (8.3%) | 77 (8.4%) |
| 15 to 19 Years | 47 (6.3%) | 31 (3.4%) |
| 20 to 24 Years | 87 (11.6%) | 54 (5.9%) |
| 25 to 29 Years | 30 (4.0%) | 89 (9.8%) |
| 30 to 34 Years | 23 (3.1%) | 16 (1.8%) |
| 35 to 39 Years | 78 (10.4%) | 77 (8.4%) |
| 40 to 44 Years | 64 (8.5%) | 56 (6.1%) |
| 45 to 49 Years | 32 (4.3%) | 36 (4.0%) |
| 50 to 54 Years | 22 (2.9%) | 55 (6.0%) |
| 55 to 59 Years | 51 (6.8%) | 15 (1.6%) |
| 60 to 64 Years | 76 (10.1%) | 69 (7.6%) |
| 65 to 69 Years | 37 (4.9%) | 67 (7.3%) |
| 70 to 74 Years | 11 (1.5%) | 33 (3.6%) |
| 75 to 79 Years | 10 (1.3%) | 34 (3.7%) |
| 80 to 84 Years | 13 (1.7%) | 28 (3.1%) |
| 85 Years and over | 6 (0.8%) | 18 (2.0%) |
| Total | 751 (100.0%) | 912 (100.0%) |
Families and Households in Shannon
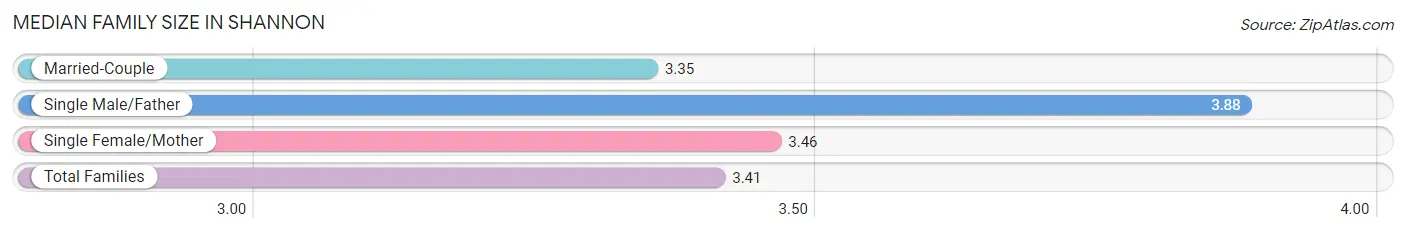
Median Family Size in Shannon
The median family size in Shannon is 3.41 persons per family, with single male/father families (16 | 4.4%) accounting for the largest median family size of 3.88 persons per family. On the other hand, married-couple families (221 | 60.9%) represent the smallest median family size with 3.35 persons per family.
| Family Type | # Families | Family Size |
| Married-Couple | 221 (60.9%) | 3.35 |
| Single Male/Father | 16 (4.4%) | 3.88 |
| Single Female/Mother | 126 (34.7%) | 3.46 |
| Total Families | 363 (100.0%) | 3.41 |
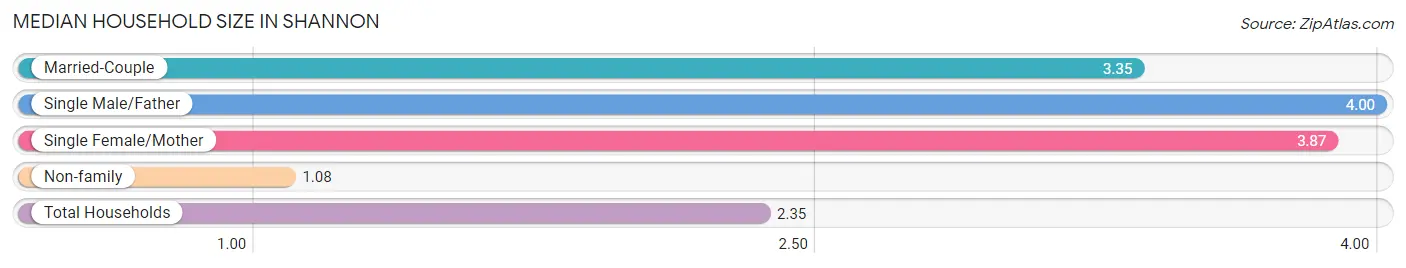
Median Household Size in Shannon
The median household size in Shannon is 2.35 persons per household, with single male/father households (16 | 2.3%) accounting for the largest median household size of 4 persons per household. non-family households (345 | 48.7%) represent the smallest median household size with 1.08 persons per household.
| Household Type | # Households | Household Size |
| Married-Couple | 221 (31.2%) | 3.35 |
| Single Male/Father | 16 (2.3%) | 4.00 |
| Single Female/Mother | 126 (17.8%) | 3.87 |
| Non-family | 345 (48.7%) | 1.08 |
| Total Households | 708 (100.0%) | 2.35 |
Household Size by Marriage Status in Shannon
Out of a total of 708 households in Shannon, 363 (51.3%) are family households, while 345 (48.7%) are nonfamily households. The most numerous type of family households are 2-person households, comprising 136, and the most common type of nonfamily households are 1-person households, comprising 314.
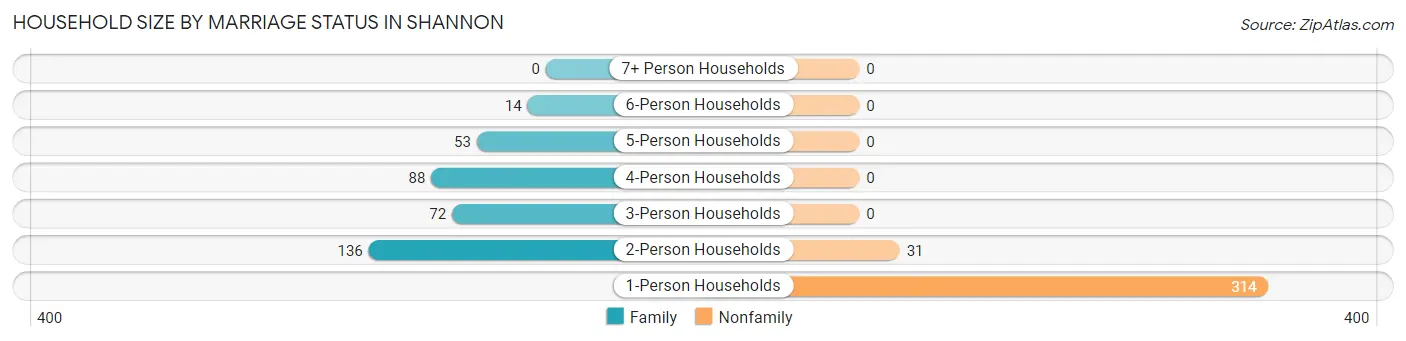
| Household Size | Family Households | Nonfamily Households |
| 1-Person Households | - | 314 (44.4%) |
| 2-Person Households | 136 (19.2%) | 31 (4.4%) |
| 3-Person Households | 72 (10.2%) | 0 (0.0%) |
| 4-Person Households | 88 (12.4%) | 0 (0.0%) |
| 5-Person Households | 53 (7.5%) | 0 (0.0%) |
| 6-Person Households | 14 (2.0%) | 0 (0.0%) |
| 7+ Person Households | 0 (0.0%) | 0 (0.0%) |
| Total | 363 (51.3%) | 345 (48.7%) |
Female Fertility in Shannon
Fertility by Age in Shannon
Average fertility rate in Shannon is 110.0 births per 1,000 women. Women in the age bracket of 20 to 34 years have the highest fertility rate with 189.0 births per 1,000 women. Women in the age bracket of 20 to 34 years acount for 75.0% of all women with births.
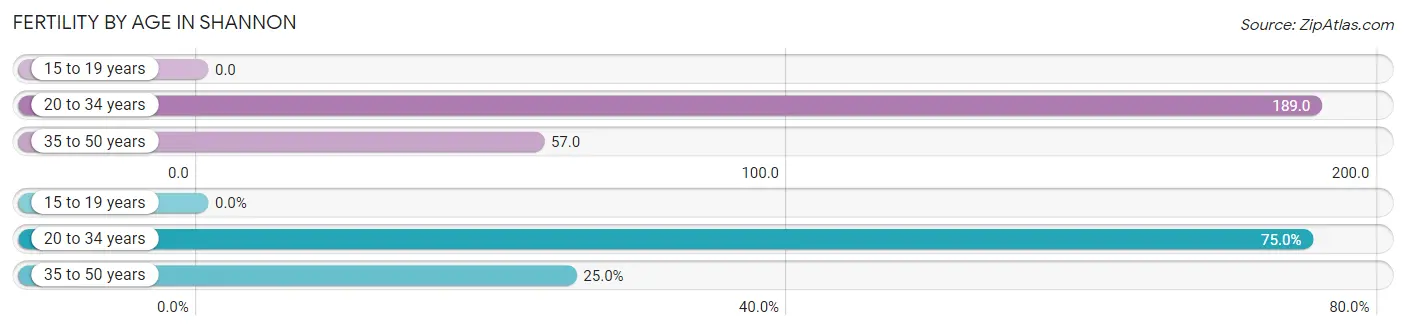
| Age Bracket | Women with Births | Births / 1,000 Women |
| 15 to 19 years | 0 (0.0%) | 0.0 |
| 20 to 34 years | 30 (75.0%) | 189.0 |
| 35 to 50 years | 10 (25.0%) | 57.0 |
| Total | 40 (100.0%) | 110.0 |
Fertility by Age by Marriage Status in Shannon
45.0% of women with births (40) in Shannon are married. The highest percentage of unmarried women with births falls into 20 to 34 years age bracket with 73.3% of them unmarried at the time of birth, while the lowest percentage of unmarried women with births belong to 35 to 50 years age bracket with 0.0% of them unmarried.
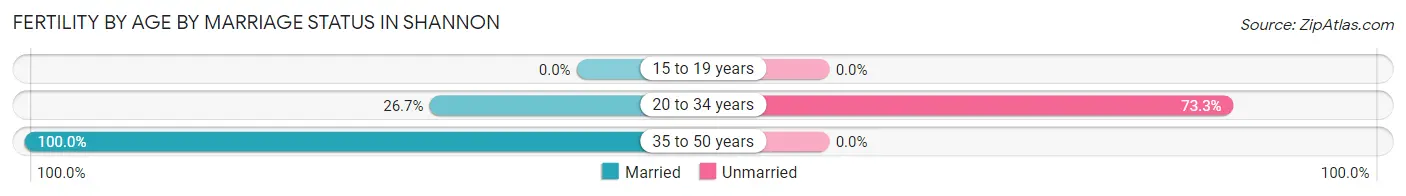
| Age Bracket | Married | Unmarried |
| 15 to 19 years | 0 (0.0%) | 0 (0.0%) |
| 20 to 34 years | 8 (26.7%) | 22 (73.3%) |
| 35 to 50 years | 10 (100.0%) | 0 (0.0%) |
| Total | 18 (45.0%) | 22 (55.0%) |
Fertility by Education in Shannon
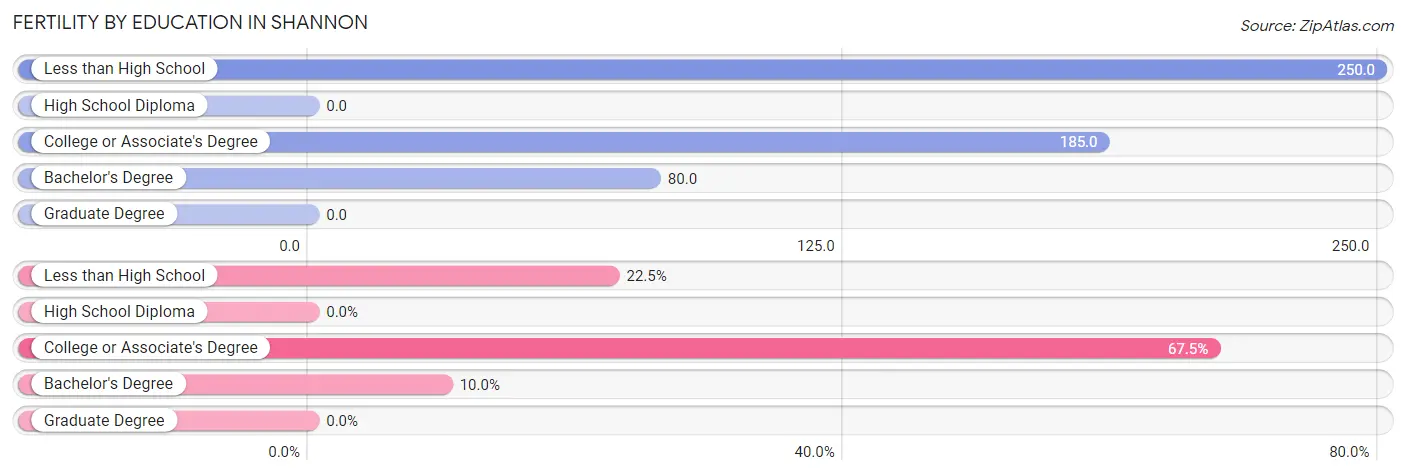
| Educational Attainment | Women with Births | Births / 1,000 Women |
| Less than High School | 9 (22.5%) | 250.0 |
| High School Diploma | 0 (0.0%) | 0.0 |
| College or Associate's Degree | 27 (67.5%) | 185.0 |
| Bachelor's Degree | 4 (10.0%) | 80.0 |
| Graduate Degree | 0 (0.0%) | 0.0 |
| Total | 40 (100.0%) | 110.0 |
Fertility by Education by Marriage Status in Shannon
55.0% of women with births in Shannon are unmarried. Women with the educational attainment of bachelor's degree are most likely to be married with 100.0% of them married at childbirth, while women with the educational attainment of less than high school are least likely to be married with 100.0% of them unmarried at childbirth.
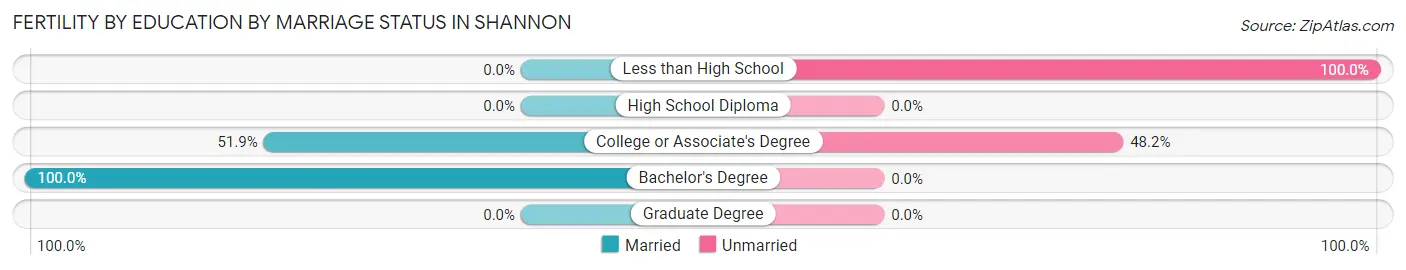
| Educational Attainment | Married | Unmarried |
| Less than High School | 0 (0.0%) | 9 (100.0%) |
| High School Diploma | 0 (0.0%) | 0 (0.0%) |
| College or Associate's Degree | 14 (51.8%) | 13 (48.1%) |
| Bachelor's Degree | 4 (100.0%) | 0 (0.0%) |
| Graduate Degree | 0 (0.0%) | 0 (0.0%) |
| Total | 18 (45.0%) | 22 (55.0%) |
Employment Characteristics in Shannon
Employment by Class of Employer in Shannon
Among the 622 employed individuals in Shannon, private company employees (433 | 69.6%), self-employed (not incorporated) (82 | 13.2%), and local government employees (62 | 10.0%) make up the most common classes of employment.
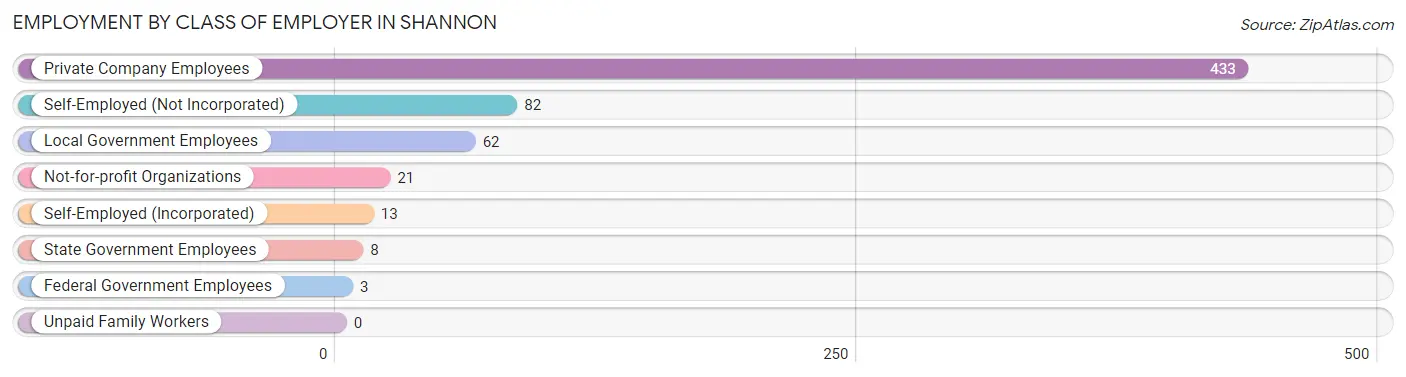
| Employer Class | # Employees | % Employees |
| Private Company Employees | 433 | 69.6% |
| Self-Employed (Incorporated) | 13 | 2.1% |
| Self-Employed (Not Incorporated) | 82 | 13.2% |
| Not-for-profit Organizations | 21 | 3.4% |
| Local Government Employees | 62 | 10.0% |
| State Government Employees | 8 | 1.3% |
| Federal Government Employees | 3 | 0.5% |
| Unpaid Family Workers | 0 | 0.0% |
| Total | 622 | 100.0% |
Employment Status by Age in Shannon
According to the labor force statistics for Shannon, out of the total population over 16 years of age (1,233), 55.6% or 686 individuals are in the labor force, with 7.0% or 48 of them unemployed. The age group with the highest labor force participation rate is 30 to 34 years, with 100.0% or 39 individuals in the labor force. Within the labor force, the 25 to 29 years age range has the highest percentage of unemployed individuals, with 18.4% or 19 of them being unemployed.
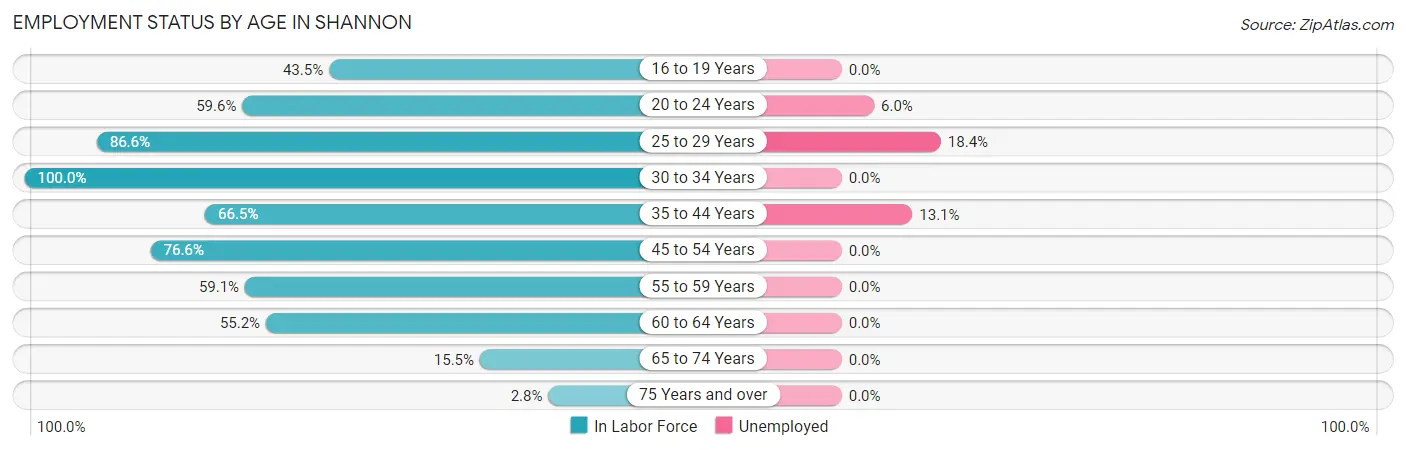
| Age Bracket | In Labor Force | Unemployed |
| 16 to 19 Years | 20 (43.5%) | 0 (0.0%) |
| 20 to 24 Years | 84 (59.6%) | 5 (6.0%) |
| 25 to 29 Years | 103 (86.6%) | 19 (18.4%) |
| 30 to 34 Years | 39 (100.0%) | 0 (0.0%) |
| 35 to 44 Years | 183 (66.5%) | 24 (13.1%) |
| 45 to 54 Years | 111 (76.6%) | 0 (0.0%) |
| 55 to 59 Years | 39 (59.1%) | 0 (0.0%) |
| 60 to 64 Years | 80 (55.2%) | 0 (0.0%) |
| 65 to 74 Years | 23 (15.5%) | 0 (0.0%) |
| 75 Years and over | 3 (2.8%) | 0 (0.0%) |
| Total | 686 (55.6%) | 48 (7.0%) |
Employment Status by Educational Attainment in Shannon
According to labor force statistics for Shannon, 70.3% of individuals (555) out of the total population between 25 and 64 years of age (789) are in the labor force, with 7.7% or 43 of them being unemployed. The group with the highest labor force participation rate are those with the educational attainment of bachelor's degree or higher, with 100.0% or 100 individuals in the labor force. Within the labor force, individuals with less than high school education have the highest percentage of unemployment, with 10.8% or 9 of them being unemployed.
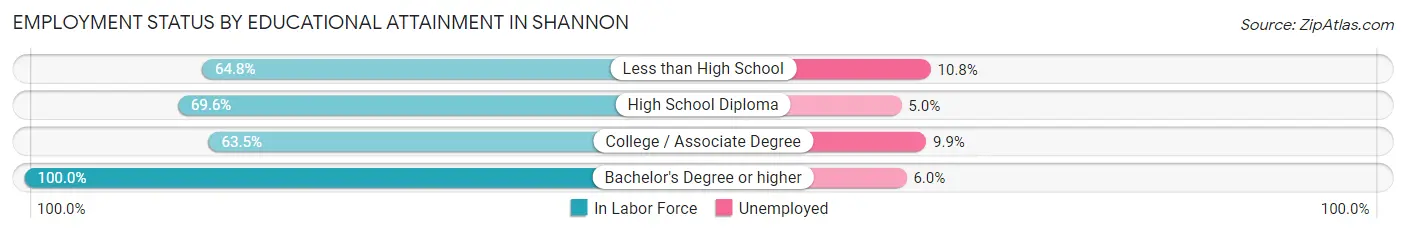
| Educational Attainment | In Labor Force | Unemployed |
| Less than High School | 83 (64.8%) | 14 (10.8%) |
| High School Diploma | 181 (69.6%) | 13 (5.0%) |
| College / Associate Degree | 191 (63.5%) | 30 (9.9%) |
| Bachelor's Degree or higher | 100 (100.0%) | 6 (6.0%) |
| Total | 555 (70.3%) | 61 (7.7%) |
Employment Occupations by Sex in Shannon
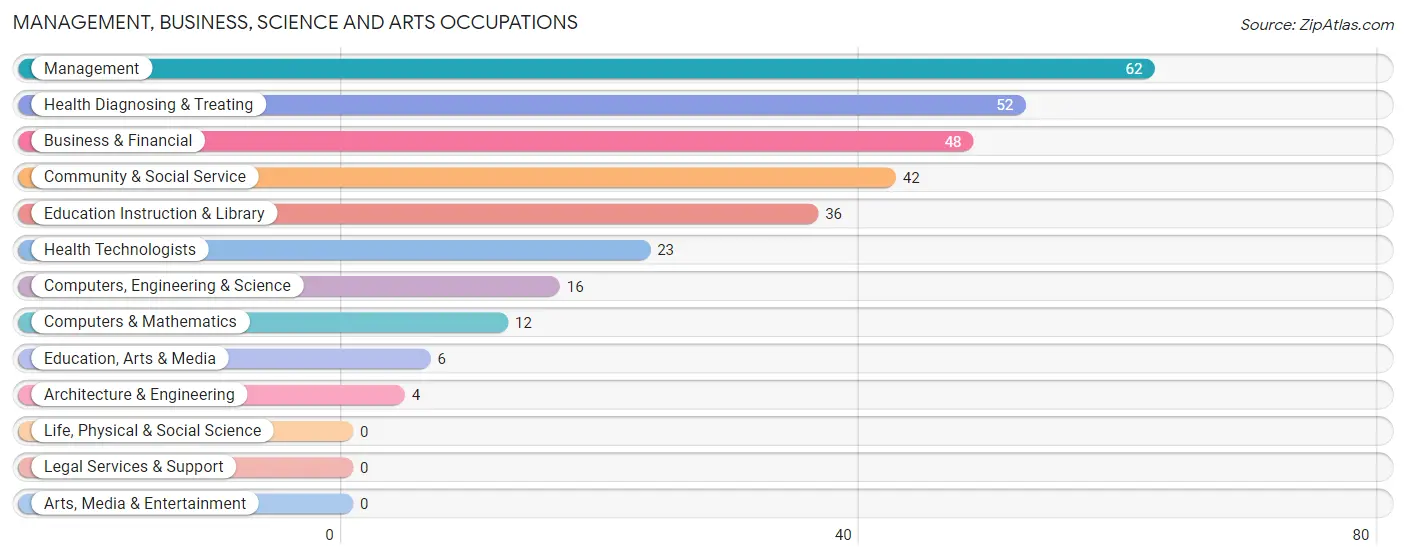
Management, Business, Science and Arts Occupations
The most common Management, Business, Science and Arts occupations in Shannon are Management (62 | 9.7%), Health Diagnosing & Treating (52 | 8.2%), Business & Financial (48 | 7.5%), Community & Social Service (42 | 6.6%), and Education Instruction & Library (36 | 5.7%).
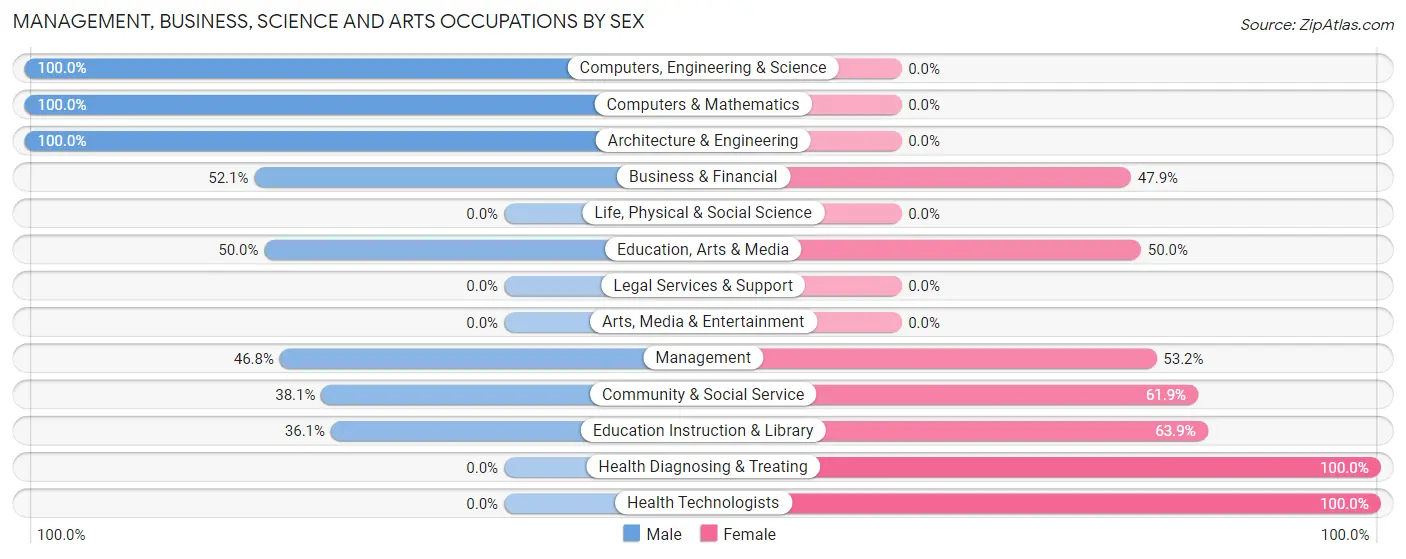
Management, Business, Science and Arts Occupations by Sex
Within the Management, Business, Science and Arts occupations in Shannon, the most male-oriented occupations are Computers, Engineering & Science (100.0%), Computers & Mathematics (100.0%), and Architecture & Engineering (100.0%), while the most female-oriented occupations are Health Diagnosing & Treating (100.0%), Health Technologists (100.0%), and Education Instruction & Library (63.9%).
| Occupation | Male | Female |
| Management | 29 (46.8%) | 33 (53.2%) |
| Business & Financial | 25 (52.1%) | 23 (47.9%) |
| Computers, Engineering & Science | 16 (100.0%) | 0 (0.0%) |
| Computers & Mathematics | 12 (100.0%) | 0 (0.0%) |
| Architecture & Engineering | 4 (100.0%) | 0 (0.0%) |
| Life, Physical & Social Science | 0 (0.0%) | 0 (0.0%) |
| Community & Social Service | 16 (38.1%) | 26 (61.9%) |
| Education, Arts & Media | 3 (50.0%) | 3 (50.0%) |
| Legal Services & Support | 0 (0.0%) | 0 (0.0%) |
| Education Instruction & Library | 13 (36.1%) | 23 (63.9%) |
| Arts, Media & Entertainment | 0 (0.0%) | 0 (0.0%) |
| Health Diagnosing & Treating | 0 (0.0%) | 52 (100.0%) |
| Health Technologists | 0 (0.0%) | 23 (100.0%) |
| Total (Category) | 86 (39.1%) | 134 (60.9%) |
| Total (Overall) | 328 (51.5%) | 309 (48.5%) |
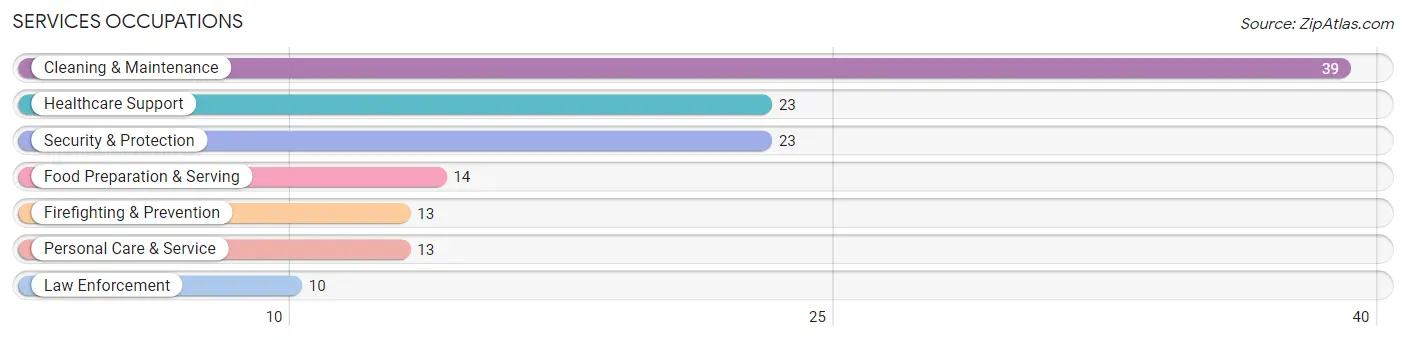
Services Occupations
The most common Services occupations in Shannon are Cleaning & Maintenance (39 | 6.1%), Healthcare Support (23 | 3.6%), Security & Protection (23 | 3.6%), Food Preparation & Serving (14 | 2.2%), and Firefighting & Prevention (13 | 2.0%).
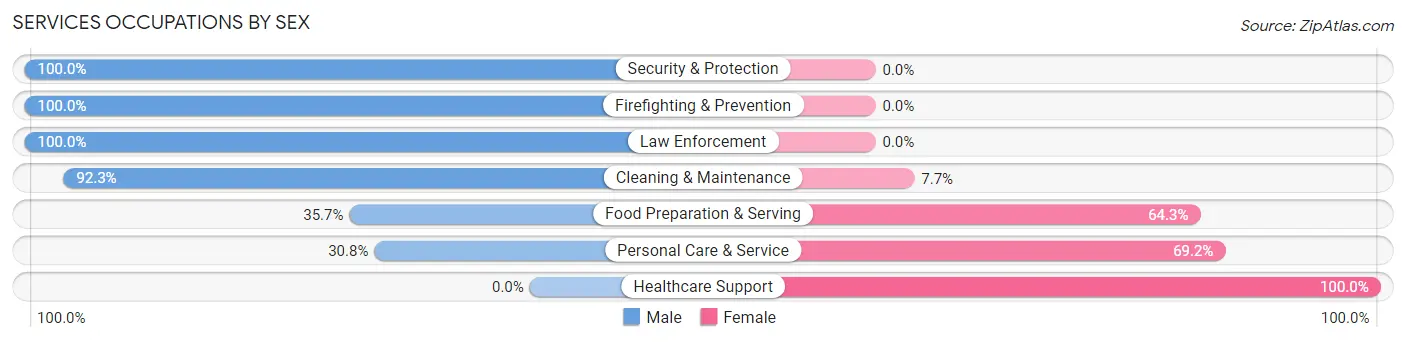
Services Occupations by Sex
Within the Services occupations in Shannon, the most male-oriented occupations are Security & Protection (100.0%), Firefighting & Prevention (100.0%), and Law Enforcement (100.0%), while the most female-oriented occupations are Healthcare Support (100.0%), Personal Care & Service (69.2%), and Food Preparation & Serving (64.3%).
| Occupation | Male | Female |
| Healthcare Support | 0 (0.0%) | 23 (100.0%) |
| Security & Protection | 23 (100.0%) | 0 (0.0%) |
| Firefighting & Prevention | 13 (100.0%) | 0 (0.0%) |
| Law Enforcement | 10 (100.0%) | 0 (0.0%) |
| Food Preparation & Serving | 5 (35.7%) | 9 (64.3%) |
| Cleaning & Maintenance | 36 (92.3%) | 3 (7.7%) |
| Personal Care & Service | 4 (30.8%) | 9 (69.2%) |
| Total (Category) | 68 (60.7%) | 44 (39.3%) |
| Total (Overall) | 328 (51.5%) | 309 (48.5%) |
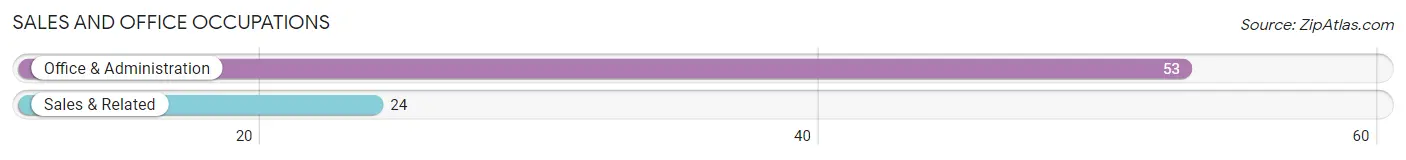
Sales and Office Occupations
The most common Sales and Office occupations in Shannon are Office & Administration (53 | 8.3%), and Sales & Related (24 | 3.8%).
Sales and Office Occupations by Sex
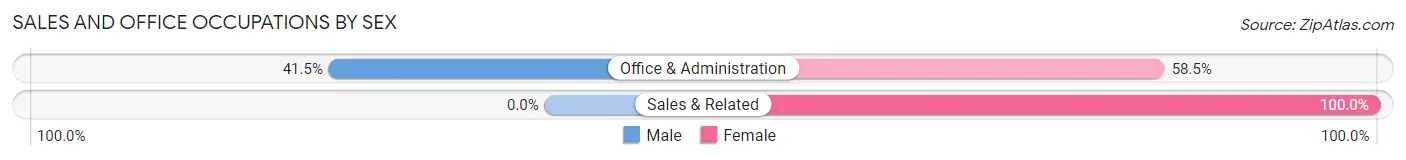
| Occupation | Male | Female |
| Sales & Related | 0 (0.0%) | 24 (100.0%) |
| Office & Administration | 22 (41.5%) | 31 (58.5%) |
| Total (Category) | 22 (28.6%) | 55 (71.4%) |
| Total (Overall) | 328 (51.5%) | 309 (48.5%) |
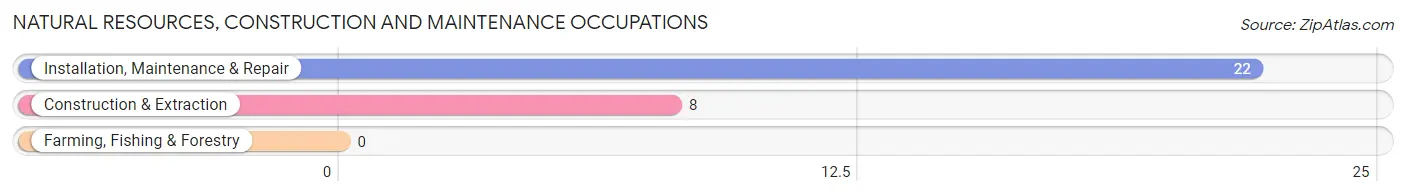
Natural Resources, Construction and Maintenance Occupations
The most common Natural Resources, Construction and Maintenance occupations in Shannon are Installation, Maintenance & Repair (22 | 3.5%), and Construction & Extraction (8 | 1.3%).
Natural Resources, Construction and Maintenance Occupations by Sex
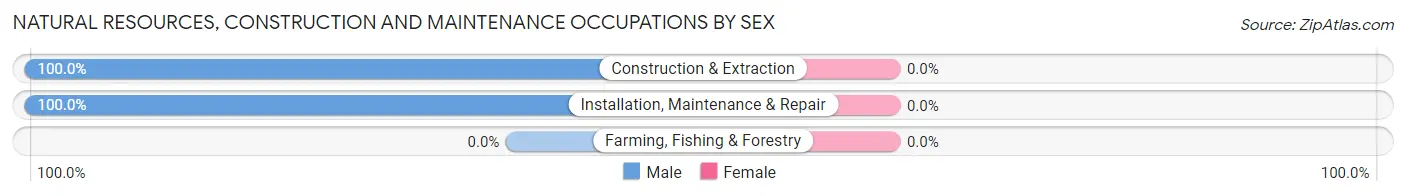
| Occupation | Male | Female |
| Farming, Fishing & Forestry | 0 (0.0%) | 0 (0.0%) |
| Construction & Extraction | 8 (100.0%) | 0 (0.0%) |
| Installation, Maintenance & Repair | 22 (100.0%) | 0 (0.0%) |
| Total (Category) | 30 (100.0%) | 0 (0.0%) |
| Total (Overall) | 328 (51.5%) | 309 (48.5%) |
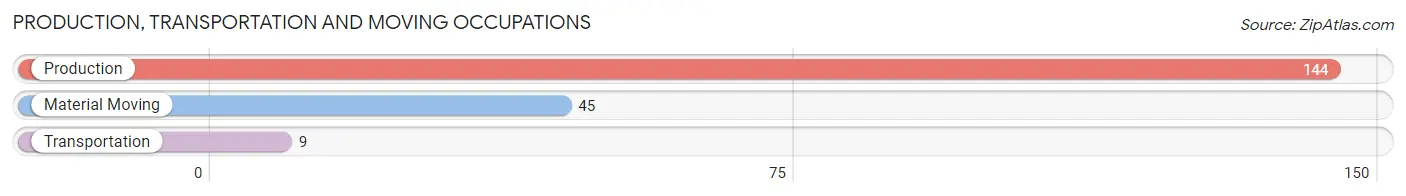
Production, Transportation and Moving Occupations
The most common Production, Transportation and Moving occupations in Shannon are Production (144 | 22.6%), Material Moving (45 | 7.1%), and Transportation (9 | 1.4%).
Production, Transportation and Moving Occupations by Sex
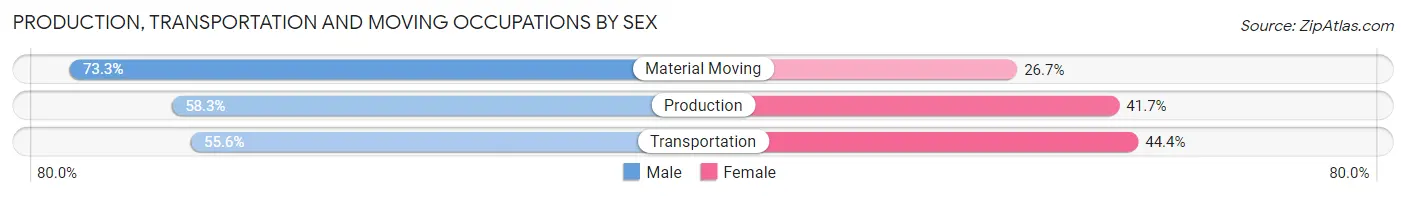
| Occupation | Male | Female |
| Production | 84 (58.3%) | 60 (41.7%) |
| Transportation | 5 (55.6%) | 4 (44.4%) |
| Material Moving | 33 (73.3%) | 12 (26.7%) |
| Total (Category) | 122 (61.6%) | 76 (38.4%) |
| Total (Overall) | 328 (51.5%) | 309 (48.5%) |
Employment Industries by Sex in Shannon
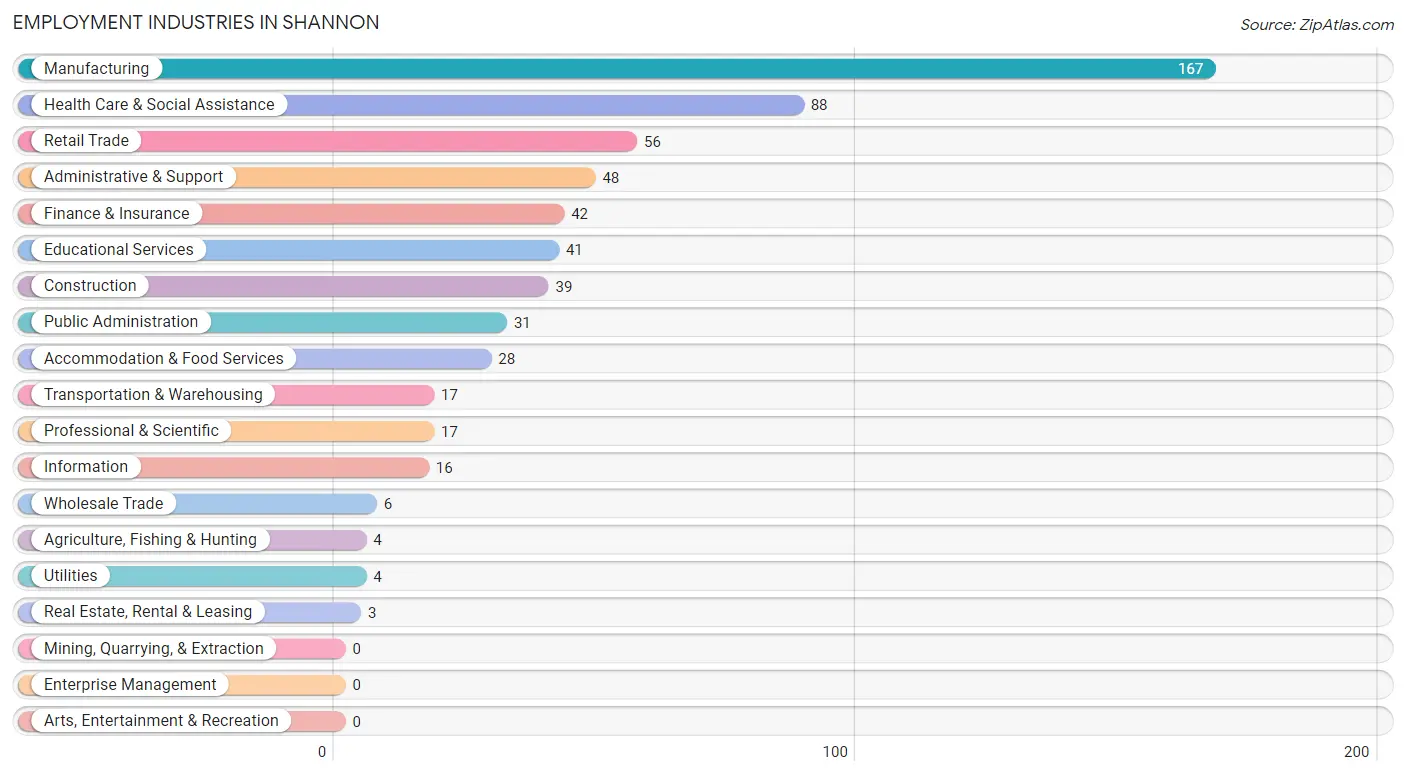
Employment Industries in Shannon
The major employment industries in Shannon include Manufacturing (167 | 26.2%), Health Care & Social Assistance (88 | 13.8%), Retail Trade (56 | 8.8%), Administrative & Support (48 | 7.5%), and Finance & Insurance (42 | 6.6%).
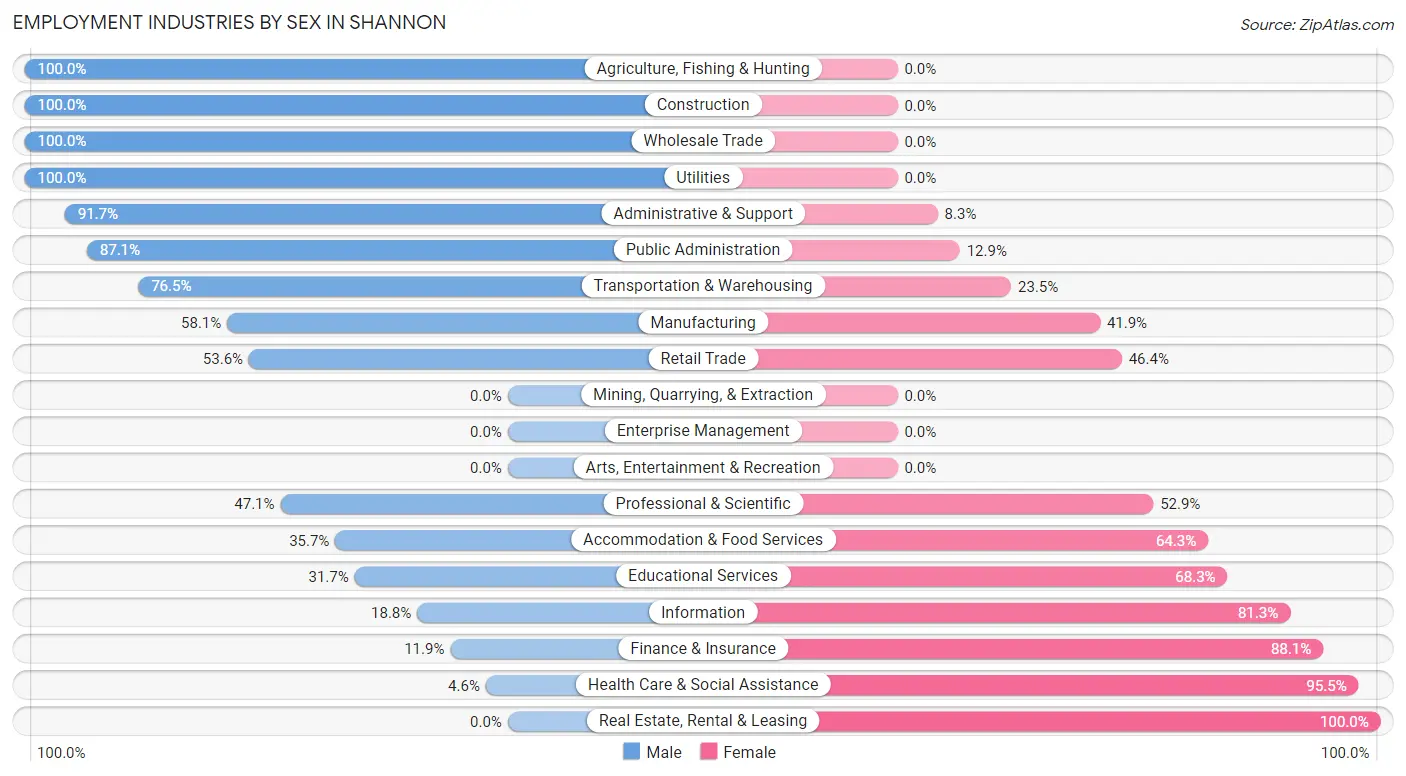
Employment Industries by Sex in Shannon
The Shannon industries that see more men than women are Agriculture, Fishing & Hunting (100.0%), Construction (100.0%), and Wholesale Trade (100.0%), whereas the industries that tend to have a higher number of women are Real Estate, Rental & Leasing (100.0%), Health Care & Social Assistance (95.5%), and Finance & Insurance (88.1%).
| Industry | Male | Female |
| Agriculture, Fishing & Hunting | 4 (100.0%) | 0 (0.0%) |
| Mining, Quarrying, & Extraction | 0 (0.0%) | 0 (0.0%) |
| Construction | 39 (100.0%) | 0 (0.0%) |
| Manufacturing | 97 (58.1%) | 70 (41.9%) |
| Wholesale Trade | 6 (100.0%) | 0 (0.0%) |
| Retail Trade | 30 (53.6%) | 26 (46.4%) |
| Transportation & Warehousing | 13 (76.5%) | 4 (23.5%) |
| Utilities | 4 (100.0%) | 0 (0.0%) |
| Information | 3 (18.8%) | 13 (81.2%) |
| Finance & Insurance | 5 (11.9%) | 37 (88.1%) |
| Real Estate, Rental & Leasing | 0 (0.0%) | 3 (100.0%) |
| Professional & Scientific | 8 (47.1%) | 9 (52.9%) |
| Enterprise Management | 0 (0.0%) | 0 (0.0%) |
| Administrative & Support | 44 (91.7%) | 4 (8.3%) |
| Educational Services | 13 (31.7%) | 28 (68.3%) |
| Health Care & Social Assistance | 4 (4.5%) | 84 (95.5%) |
| Arts, Entertainment & Recreation | 0 (0.0%) | 0 (0.0%) |
| Accommodation & Food Services | 10 (35.7%) | 18 (64.3%) |
| Public Administration | 27 (87.1%) | 4 (12.9%) |
| Total | 328 (51.5%) | 309 (48.5%) |
Education in Shannon
School Enrollment in Shannon
The most common levels of schooling among the 422 students in Shannon are high school (108 | 25.6%), middle school (105 | 24.9%), and elementary school (103 | 24.4%).
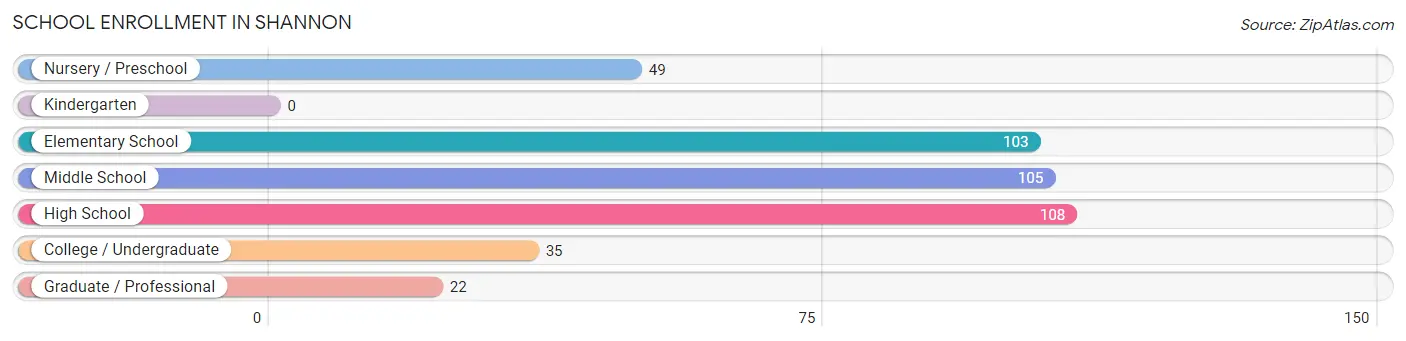
| School Level | # Students | % Students |
| Nursery / Preschool | 49 | 11.6% |
| Kindergarten | 0 | 0.0% |
| Elementary School | 103 | 24.4% |
| Middle School | 105 | 24.9% |
| High School | 108 | 25.6% |
| College / Undergraduate | 35 | 8.3% |
| Graduate / Professional | 22 | 5.2% |
| Total | 422 | 100.0% |
School Enrollment by Age by Funding Source in Shannon
Out of a total of 422 students who are enrolled in schools in Shannon, 58 (13.7%) attend a private institution, while the remaining 364 (86.3%) are enrolled in public schools. The age group of 25 to 34 year olds has the highest likelihood of being enrolled in private schools, with 13 (50.0% in the age bracket) enrolled. Conversely, the age group of 5 to 9 year old has the lowest likelihood of being enrolled in a private school, with 113 (100.0% in the age bracket) attending a public institution.
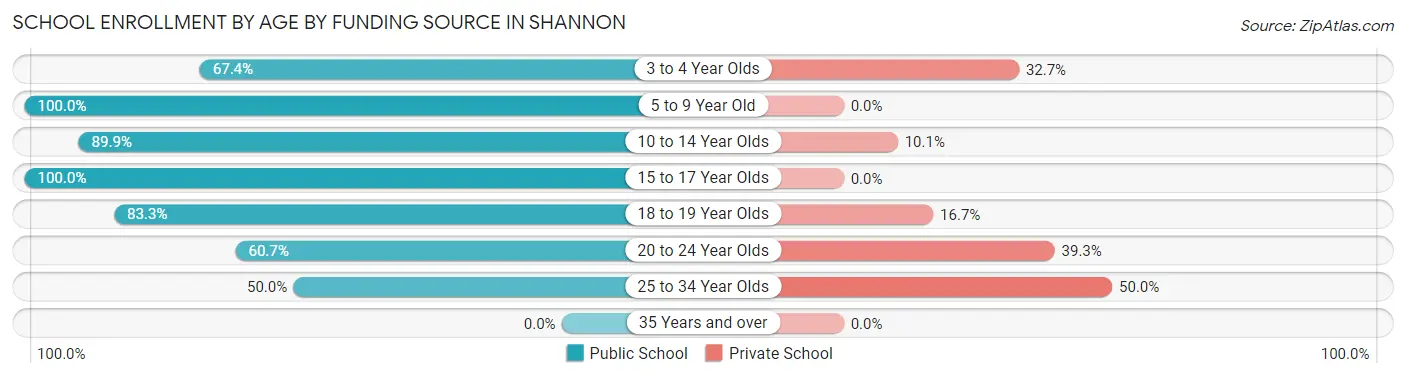
| Age Bracket | Public School | Private School |
| 3 to 4 Year Olds | 33 (67.3%) | 16 (32.7%) |
| 5 to 9 Year Old | 113 (100.0%) | 0 (0.0%) |
| 10 to 14 Year Olds | 125 (89.9%) | 14 (10.1%) |
| 15 to 17 Year Olds | 43 (100.0%) | 0 (0.0%) |
| 18 to 19 Year Olds | 20 (83.3%) | 4 (16.7%) |
| 20 to 24 Year Olds | 17 (60.7%) | 11 (39.3%) |
| 25 to 34 Year Olds | 13 (50.0%) | 13 (50.0%) |
| 35 Years and over | 0 (0.0%) | 0 (0.0%) |
| Total | 364 (86.3%) | 58 (13.7%) |
Educational Attainment by Field of Study in Shannon
Education (86 | 54.8%), science & technology (15 | 9.6%), arts & humanities (15 | 9.6%), business (14 | 8.9%), and liberal arts & history (13 | 8.3%) are the most common fields of study among 157 individuals in Shannon who have obtained a bachelor's degree or higher.
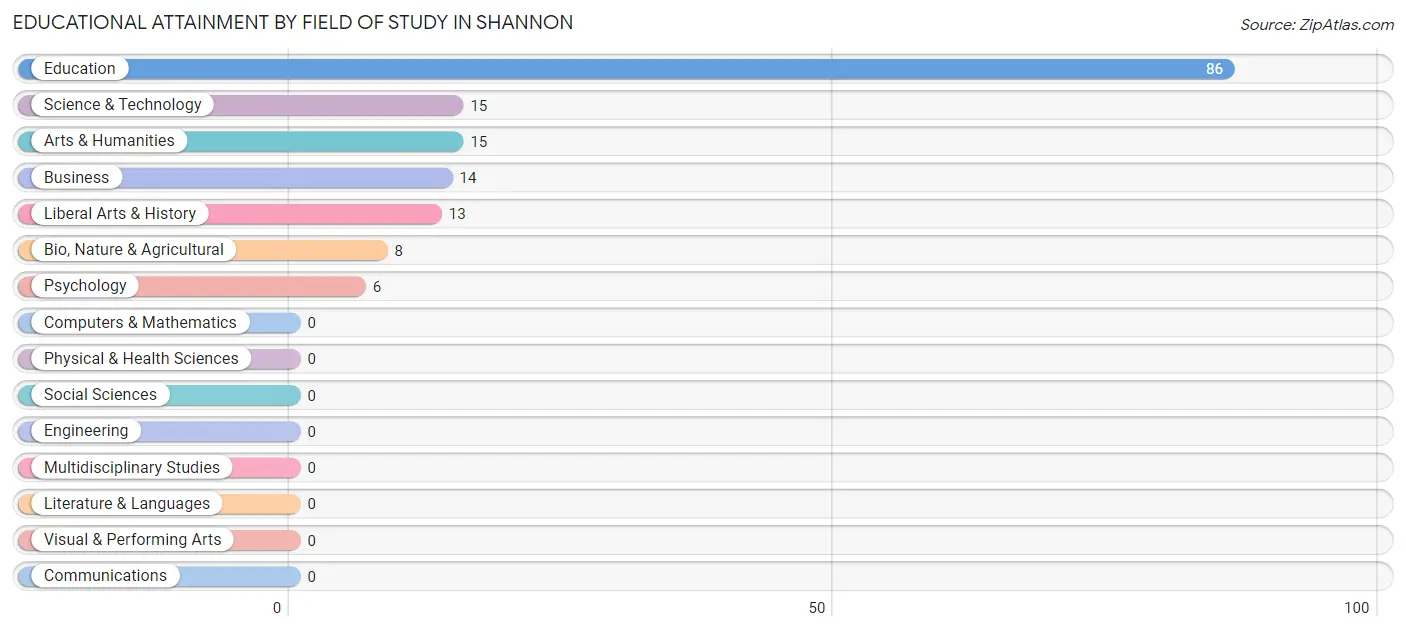
| Field of Study | # Graduates | % Graduates |
| Computers & Mathematics | 0 | 0.0% |
| Bio, Nature & Agricultural | 8 | 5.1% |
| Physical & Health Sciences | 0 | 0.0% |
| Psychology | 6 | 3.8% |
| Social Sciences | 0 | 0.0% |
| Engineering | 0 | 0.0% |
| Multidisciplinary Studies | 0 | 0.0% |
| Science & Technology | 15 | 9.6% |
| Business | 14 | 8.9% |
| Education | 86 | 54.8% |
| Literature & Languages | 0 | 0.0% |
| Liberal Arts & History | 13 | 8.3% |
| Visual & Performing Arts | 0 | 0.0% |
| Communications | 0 | 0.0% |
| Arts & Humanities | 15 | 9.6% |
| Total | 157 | 100.0% |
Transportation & Commute in Shannon
Vehicle Availability by Sex in Shannon
The most prevalent vehicle ownership categories in Shannon are males with 2 vehicles (140, accounting for 44.3%) and females with 2 vehicles (109, making up 45.8%).
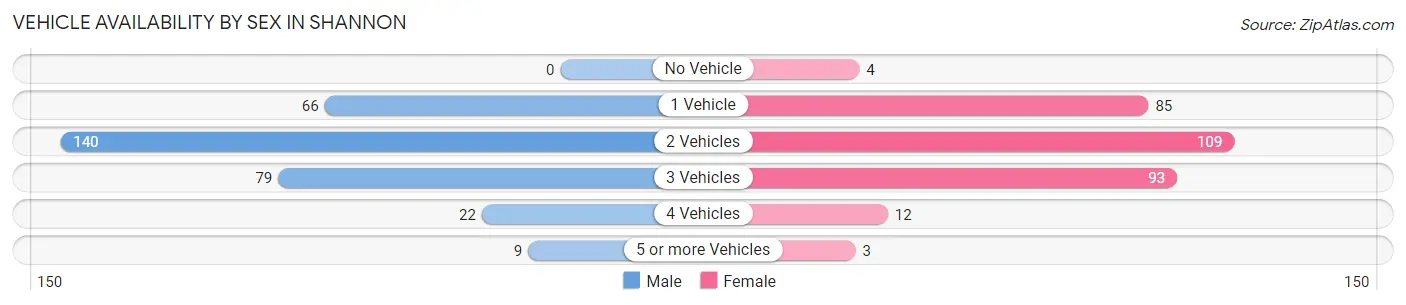
| Vehicles Available | Male | Female |
| No Vehicle | 0 (0.0%) | 4 (1.3%) |
| 1 Vehicle | 66 (20.9%) | 85 (27.8%) |
| 2 Vehicles | 140 (44.3%) | 109 (35.6%) |
| 3 Vehicles | 79 (25.0%) | 93 (30.4%) |
| 4 Vehicles | 22 (7.0%) | 12 (3.9%) |
| 5 or more Vehicles | 9 (2.9%) | 3 (1.0%) |
| Total | 316 (100.0%) | 306 (100.0%) |
Commute Time in Shannon
The most frequently occuring commute durations in Shannon are 15 to 19 minutes (178 commuters, 29.2%), 20 to 24 minutes (123 commuters, 20.2%), and 30 to 34 minutes (84 commuters, 13.8%).
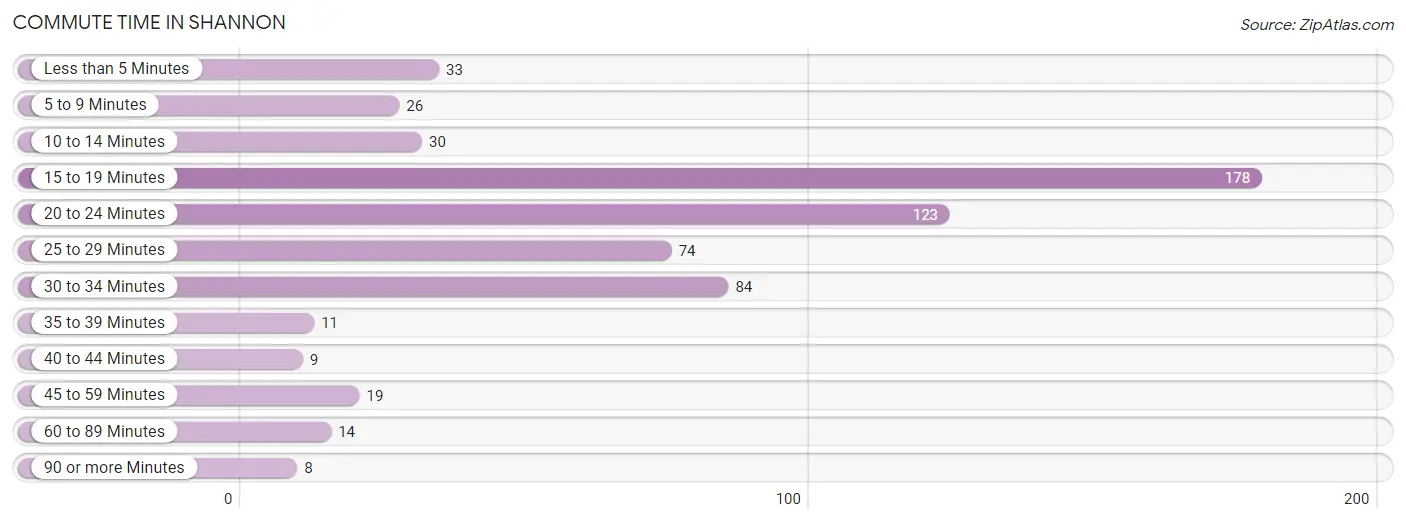
| Commute Time | # Commuters | % Commuters |
| Less than 5 Minutes | 33 | 5.4% |
| 5 to 9 Minutes | 26 | 4.3% |
| 10 to 14 Minutes | 30 | 4.9% |
| 15 to 19 Minutes | 178 | 29.2% |
| 20 to 24 Minutes | 123 | 20.2% |
| 25 to 29 Minutes | 74 | 12.1% |
| 30 to 34 Minutes | 84 | 13.8% |
| 35 to 39 Minutes | 11 | 1.8% |
| 40 to 44 Minutes | 9 | 1.5% |
| 45 to 59 Minutes | 19 | 3.1% |
| 60 to 89 Minutes | 14 | 2.3% |
| 90 or more Minutes | 8 | 1.3% |
Commute Time by Sex in Shannon
The most common commute times in Shannon are 15 to 19 minutes (114 commuters, 37.6%) for males and 20 to 24 minutes (85 commuters, 27.8%) for females.
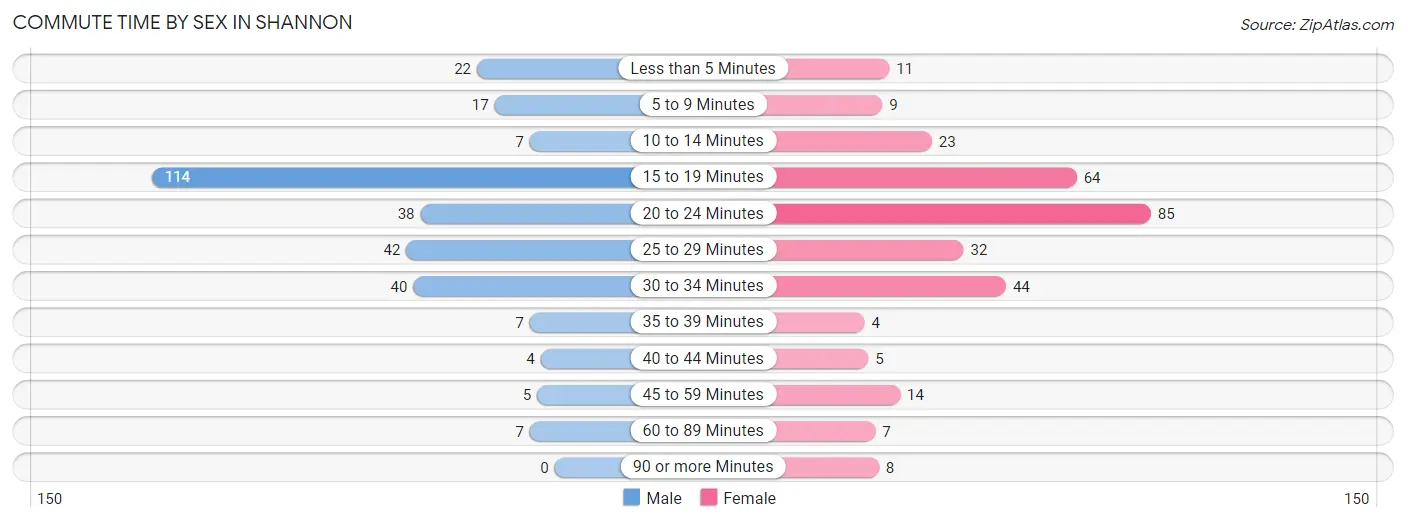
| Commute Time | Male | Female |
| Less than 5 Minutes | 22 (7.3%) | 11 (3.6%) |
| 5 to 9 Minutes | 17 (5.6%) | 9 (2.9%) |
| 10 to 14 Minutes | 7 (2.3%) | 23 (7.5%) |
| 15 to 19 Minutes | 114 (37.6%) | 64 (20.9%) |
| 20 to 24 Minutes | 38 (12.5%) | 85 (27.8%) |
| 25 to 29 Minutes | 42 (13.9%) | 32 (10.5%) |
| 30 to 34 Minutes | 40 (13.2%) | 44 (14.4%) |
| 35 to 39 Minutes | 7 (2.3%) | 4 (1.3%) |
| 40 to 44 Minutes | 4 (1.3%) | 5 (1.6%) |
| 45 to 59 Minutes | 5 (1.7%) | 14 (4.6%) |
| 60 to 89 Minutes | 7 (2.3%) | 7 (2.3%) |
| 90 or more Minutes | 0 (0.0%) | 8 (2.6%) |
Time of Departure to Work by Sex in Shannon
The most frequent times of departure to work in Shannon are 6:30 AM to 6:59 AM (62, 20.5%) for males and 7:00 AM to 7:29 AM (76, 24.8%) for females.
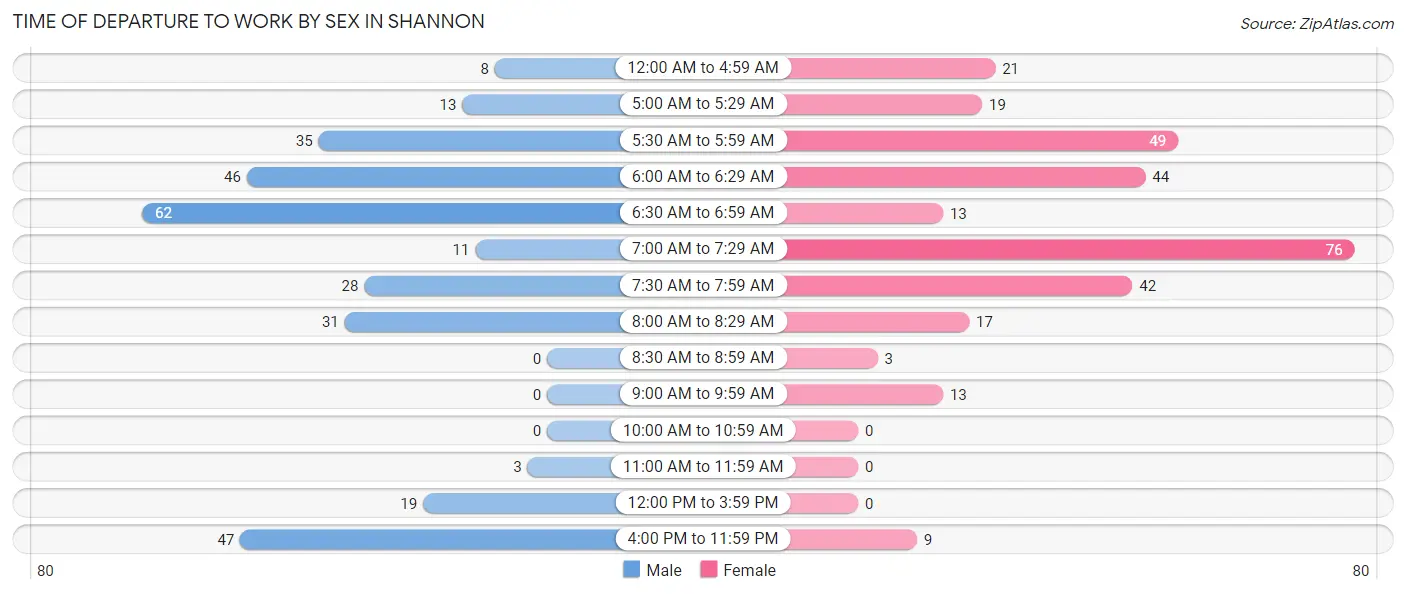
| Time of Departure | Male | Female |
| 12:00 AM to 4:59 AM | 8 (2.6%) | 21 (6.9%) |
| 5:00 AM to 5:29 AM | 13 (4.3%) | 19 (6.2%) |
| 5:30 AM to 5:59 AM | 35 (11.6%) | 49 (16.0%) |
| 6:00 AM to 6:29 AM | 46 (15.2%) | 44 (14.4%) |
| 6:30 AM to 6:59 AM | 62 (20.5%) | 13 (4.3%) |
| 7:00 AM to 7:29 AM | 11 (3.6%) | 76 (24.8%) |
| 7:30 AM to 7:59 AM | 28 (9.2%) | 42 (13.7%) |
| 8:00 AM to 8:29 AM | 31 (10.2%) | 17 (5.6%) |
| 8:30 AM to 8:59 AM | 0 (0.0%) | 3 (1.0%) |
| 9:00 AM to 9:59 AM | 0 (0.0%) | 13 (4.3%) |
| 10:00 AM to 10:59 AM | 0 (0.0%) | 0 (0.0%) |
| 11:00 AM to 11:59 AM | 3 (1.0%) | 0 (0.0%) |
| 12:00 PM to 3:59 PM | 19 (6.3%) | 0 (0.0%) |
| 4:00 PM to 11:59 PM | 47 (15.5%) | 9 (2.9%) |
| Total | 303 (100.0%) | 306 (100.0%) |
Housing Occupancy in Shannon
Occupancy by Ownership in Shannon
Of the total 708 dwellings in Shannon, owner-occupied units account for 453 (64.0%), while renter-occupied units make up 255 (36.0%).
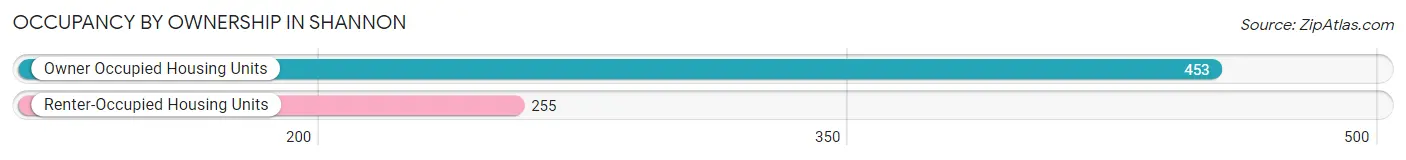
| Occupancy | # Housing Units | % Housing Units |
| Owner Occupied Housing Units | 453 | 64.0% |
| Renter-Occupied Housing Units | 255 | 36.0% |
| Total Occupied Housing Units | 708 | 100.0% |
Occupancy by Household Size in Shannon
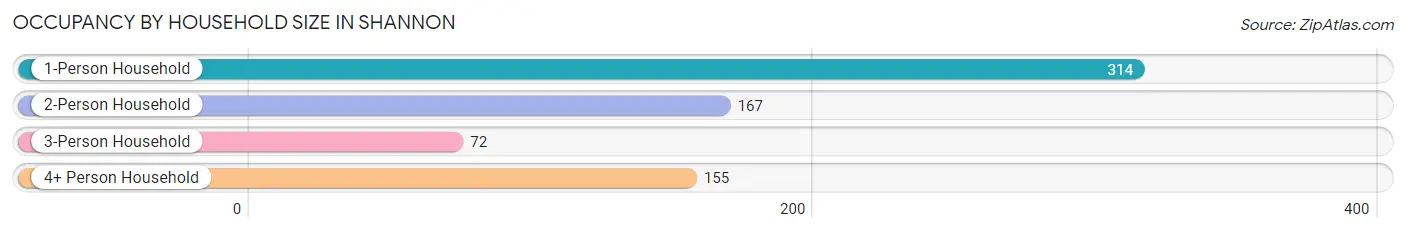
| Household Size | # Housing Units | % Housing Units |
| 1-Person Household | 314 | 44.4% |
| 2-Person Household | 167 | 23.6% |
| 3-Person Household | 72 | 10.2% |
| 4+ Person Household | 155 | 21.9% |
| Total Housing Units | 708 | 100.0% |
Occupancy by Ownership by Household Size in Shannon
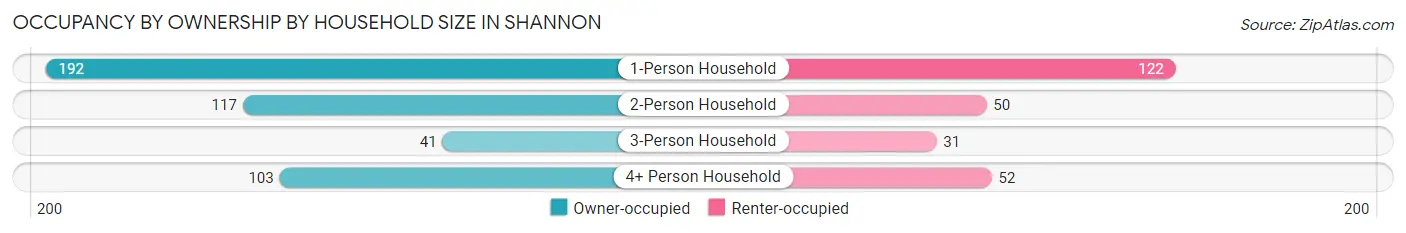
| Household Size | Owner-occupied | Renter-occupied |
| 1-Person Household | 192 (61.2%) | 122 (38.9%) |
| 2-Person Household | 117 (70.1%) | 50 (29.9%) |
| 3-Person Household | 41 (56.9%) | 31 (43.1%) |
| 4+ Person Household | 103 (66.4%) | 52 (33.6%) |
| Total Housing Units | 453 (64.0%) | 255 (36.0%) |
Occupancy by Educational Attainment in Shannon
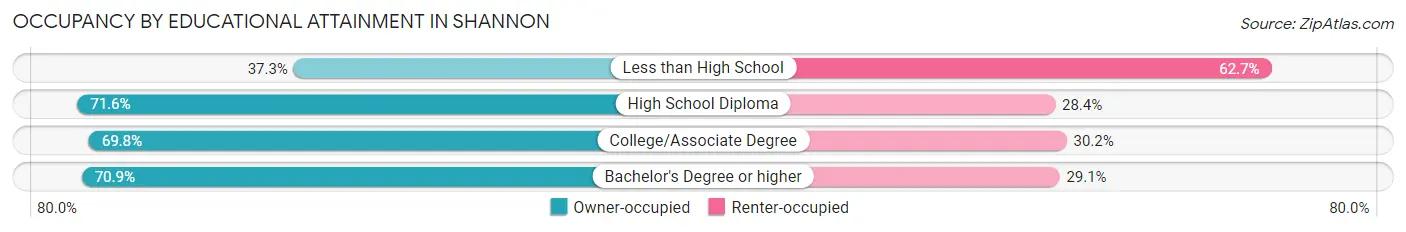
| Household Size | Owner-occupied | Renter-occupied |
| Less than High School | 53 (37.3%) | 89 (62.7%) |
| High School Diploma | 154 (71.6%) | 61 (28.4%) |
| College/Associate Degree | 185 (69.8%) | 80 (30.2%) |
| Bachelor's Degree or higher | 61 (70.9%) | 25 (29.1%) |
Occupancy by Age of Householder in Shannon
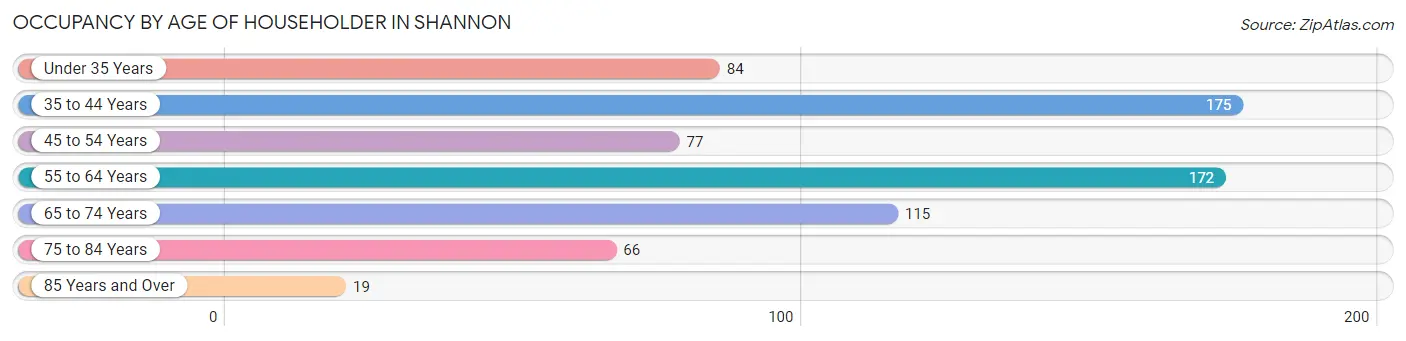
| Age Bracket | # Households | % Households |
| Under 35 Years | 84 | 11.9% |
| 35 to 44 Years | 175 | 24.7% |
| 45 to 54 Years | 77 | 10.9% |
| 55 to 64 Years | 172 | 24.3% |
| 65 to 74 Years | 115 | 16.2% |
| 75 to 84 Years | 66 | 9.3% |
| 85 Years and Over | 19 | 2.7% |
| Total | 708 | 100.0% |
Housing Finances in Shannon
Median Income by Occupancy in Shannon
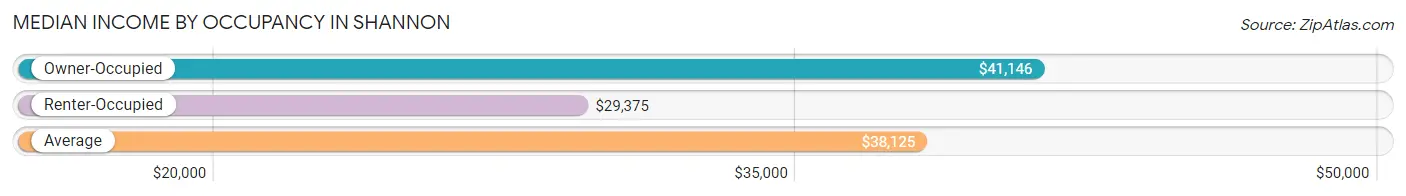
| Occupancy Type | # Households | Median Income |
| Owner-Occupied | 453 (64.0%) | $41,146 |
| Renter-Occupied | 255 (36.0%) | $29,375 |
| Average | 708 (100.0%) | $38,125 |
Occupancy by Householder Income Bracket in Shannon
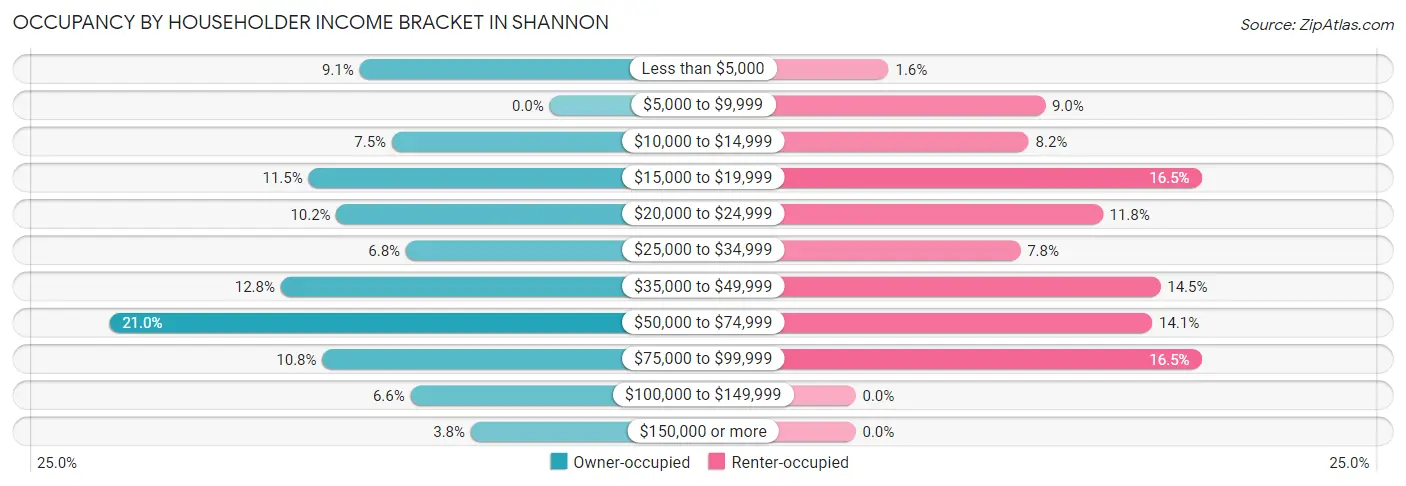
| Income Bracket | Owner-occupied | Renter-occupied |
| Less than $5,000 | 41 (9.0%) | 4 (1.6%) |
| $5,000 to $9,999 | 0 (0.0%) | 23 (9.0%) |
| $10,000 to $14,999 | 34 (7.5%) | 21 (8.2%) |
| $15,000 to $19,999 | 52 (11.5%) | 42 (16.5%) |
| $20,000 to $24,999 | 46 (10.2%) | 30 (11.8%) |
| $25,000 to $34,999 | 31 (6.8%) | 20 (7.8%) |
| $35,000 to $49,999 | 58 (12.8%) | 37 (14.5%) |
| $50,000 to $74,999 | 95 (21.0%) | 36 (14.1%) |
| $75,000 to $99,999 | 49 (10.8%) | 42 (16.5%) |
| $100,000 to $149,999 | 30 (6.6%) | 0 (0.0%) |
| $150,000 or more | 17 (3.7%) | 0 (0.0%) |
| Total | 453 (100.0%) | 255 (100.0%) |
Monthly Housing Cost Tiers in Shannon
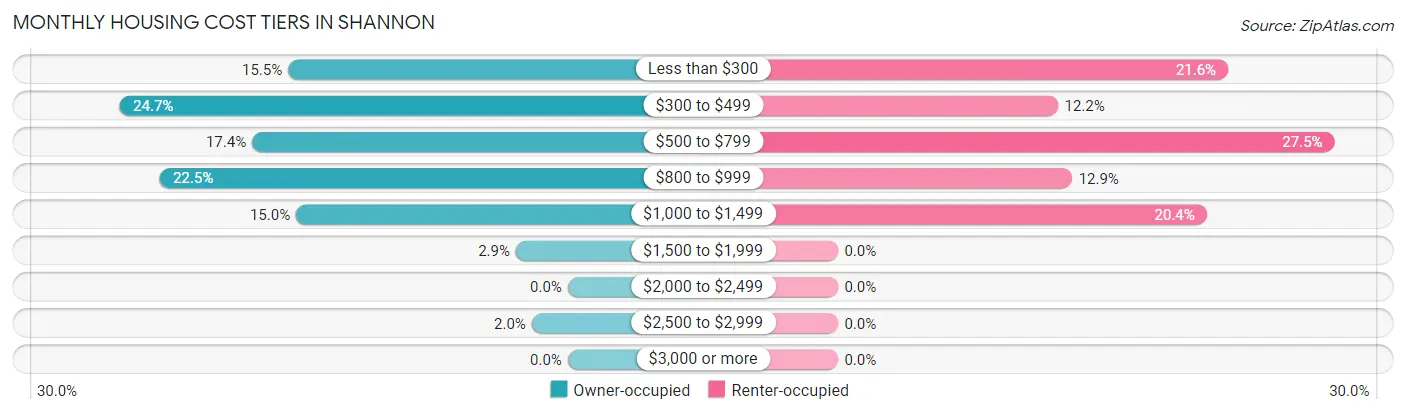
| Monthly Cost | Owner-occupied | Renter-occupied |
| Less than $300 | 70 (15.4%) | 55 (21.6%) |
| $300 to $499 | 112 (24.7%) | 31 (12.2%) |
| $500 to $799 | 79 (17.4%) | 70 (27.5%) |
| $800 to $999 | 102 (22.5%) | 33 (12.9%) |
| $1,000 to $1,499 | 68 (15.0%) | 52 (20.4%) |
| $1,500 to $1,999 | 13 (2.9%) | 0 (0.0%) |
| $2,000 to $2,499 | 0 (0.0%) | 0 (0.0%) |
| $2,500 to $2,999 | 9 (2.0%) | 0 (0.0%) |
| $3,000 or more | 0 (0.0%) | 0 (0.0%) |
| Total | 453 (100.0%) | 255 (100.0%) |
Physical Housing Characteristics in Shannon
Housing Structures in Shannon
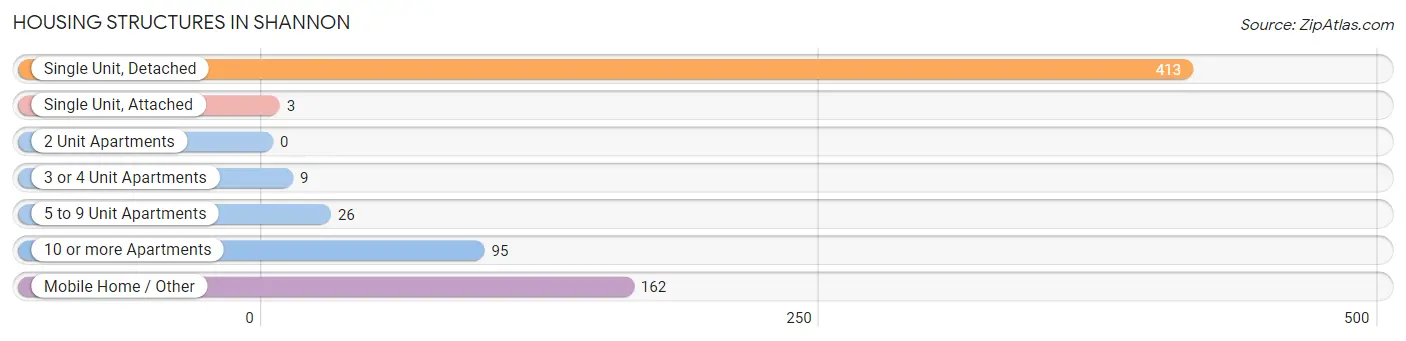
| Structure Type | # Housing Units | % Housing Units |
| Single Unit, Detached | 413 | 58.3% |
| Single Unit, Attached | 3 | 0.4% |
| 2 Unit Apartments | 0 | 0.0% |
| 3 or 4 Unit Apartments | 9 | 1.3% |
| 5 to 9 Unit Apartments | 26 | 3.7% |
| 10 or more Apartments | 95 | 13.4% |
| Mobile Home / Other | 162 | 22.9% |
| Total | 708 | 100.0% |
Housing Structures by Occupancy in Shannon
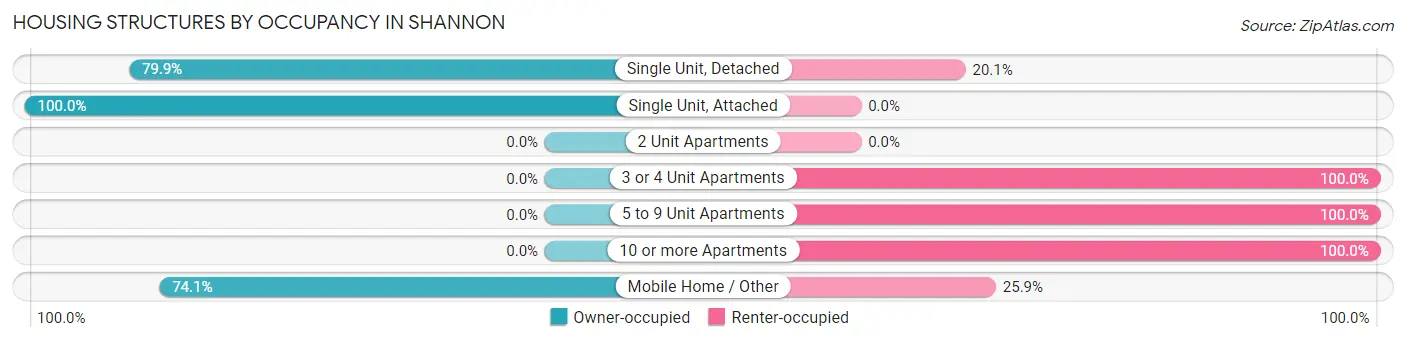
| Structure Type | Owner-occupied | Renter-occupied |
| Single Unit, Detached | 330 (79.9%) | 83 (20.1%) |
| Single Unit, Attached | 3 (100.0%) | 0 (0.0%) |
| 2 Unit Apartments | 0 (0.0%) | 0 (0.0%) |
| 3 or 4 Unit Apartments | 0 (0.0%) | 9 (100.0%) |
| 5 to 9 Unit Apartments | 0 (0.0%) | 26 (100.0%) |
| 10 or more Apartments | 0 (0.0%) | 95 (100.0%) |
| Mobile Home / Other | 120 (74.1%) | 42 (25.9%) |
| Total | 453 (64.0%) | 255 (36.0%) |
Housing Structures by Number of Rooms in Shannon
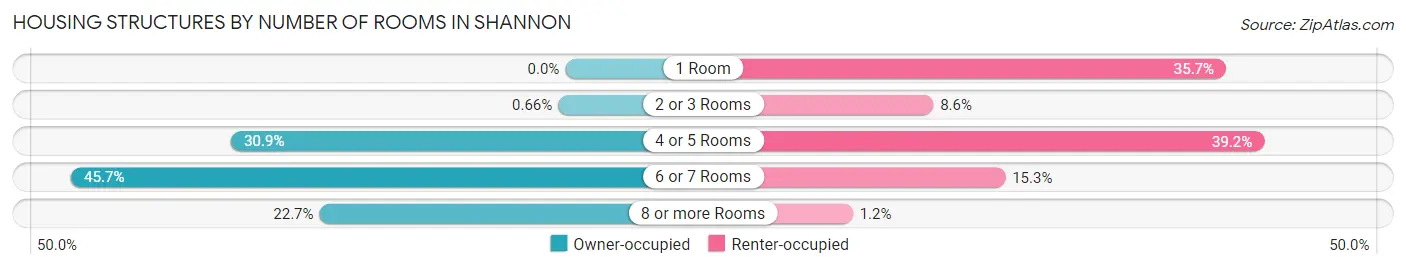
| Number of Rooms | Owner-occupied | Renter-occupied |
| 1 Room | 0 (0.0%) | 91 (35.7%) |
| 2 or 3 Rooms | 3 (0.7%) | 22 (8.6%) |
| 4 or 5 Rooms | 140 (30.9%) | 100 (39.2%) |
| 6 or 7 Rooms | 207 (45.7%) | 39 (15.3%) |
| 8 or more Rooms | 103 (22.7%) | 3 (1.2%) |
| Total | 453 (100.0%) | 255 (100.0%) |
Housing Structure by Heating Type in Shannon
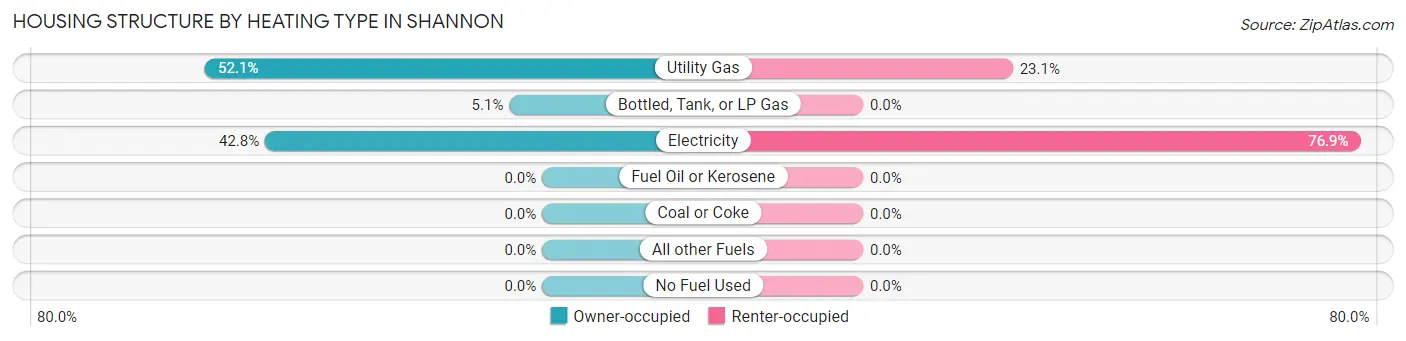
| Heating Type | Owner-occupied | Renter-occupied |
| Utility Gas | 236 (52.1%) | 59 (23.1%) |
| Bottled, Tank, or LP Gas | 23 (5.1%) | 0 (0.0%) |
| Electricity | 194 (42.8%) | 196 (76.9%) |
| Fuel Oil or Kerosene | 0 (0.0%) | 0 (0.0%) |
| Coal or Coke | 0 (0.0%) | 0 (0.0%) |
| All other Fuels | 0 (0.0%) | 0 (0.0%) |
| No Fuel Used | 0 (0.0%) | 0 (0.0%) |
| Total | 453 (100.0%) | 255 (100.0%) |
Household Vehicle Usage in Shannon
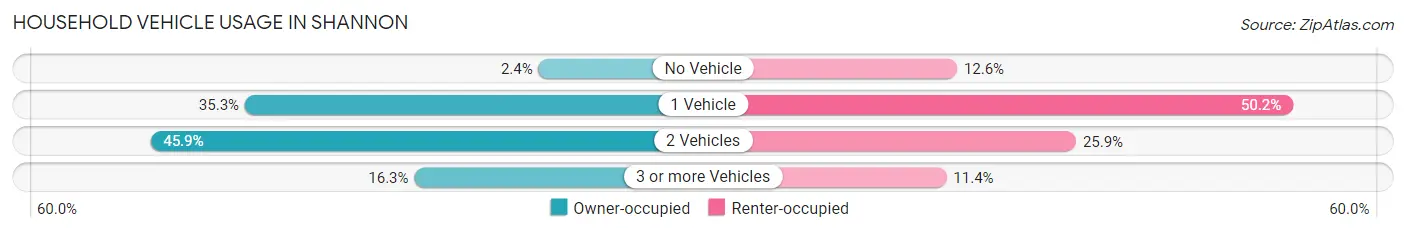
| Vehicles per Household | Owner-occupied | Renter-occupied |
| No Vehicle | 11 (2.4%) | 32 (12.6%) |
| 1 Vehicle | 160 (35.3%) | 128 (50.2%) |
| 2 Vehicles | 208 (45.9%) | 66 (25.9%) |
| 3 or more Vehicles | 74 (16.3%) | 29 (11.4%) |
| Total | 453 (100.0%) | 255 (100.0%) |
Real Estate & Mortgages in Shannon
Real Estate and Mortgage Overview in Shannon
| Characteristic | Without Mortgage | With Mortgage |
| Housing Units | 258 | 195 |
| Median Property Value | $95,400 | $137,500 |
| Median Household Income | $37,778 | $13 |
| Monthly Housing Costs | $390 | $0 |
| Real Estate Taxes | $480 | $23 |
Property Value by Mortgage Status in Shannon
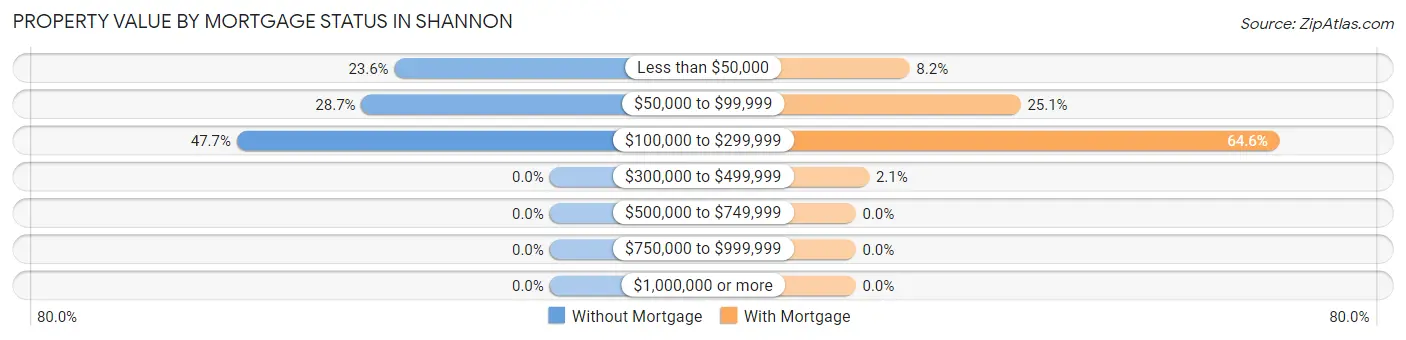
| Property Value | Without Mortgage | With Mortgage |
| Less than $50,000 | 61 (23.6%) | 16 (8.2%) |
| $50,000 to $99,999 | 74 (28.7%) | 49 (25.1%) |
| $100,000 to $299,999 | 123 (47.7%) | 126 (64.6%) |
| $300,000 to $499,999 | 0 (0.0%) | 4 (2.1%) |
| $500,000 to $749,999 | 0 (0.0%) | 0 (0.0%) |
| $750,000 to $999,999 | 0 (0.0%) | 0 (0.0%) |
| $1,000,000 or more | 0 (0.0%) | 0 (0.0%) |
| Total | 258 (100.0%) | 195 (100.0%) |
Household Income by Mortgage Status in Shannon
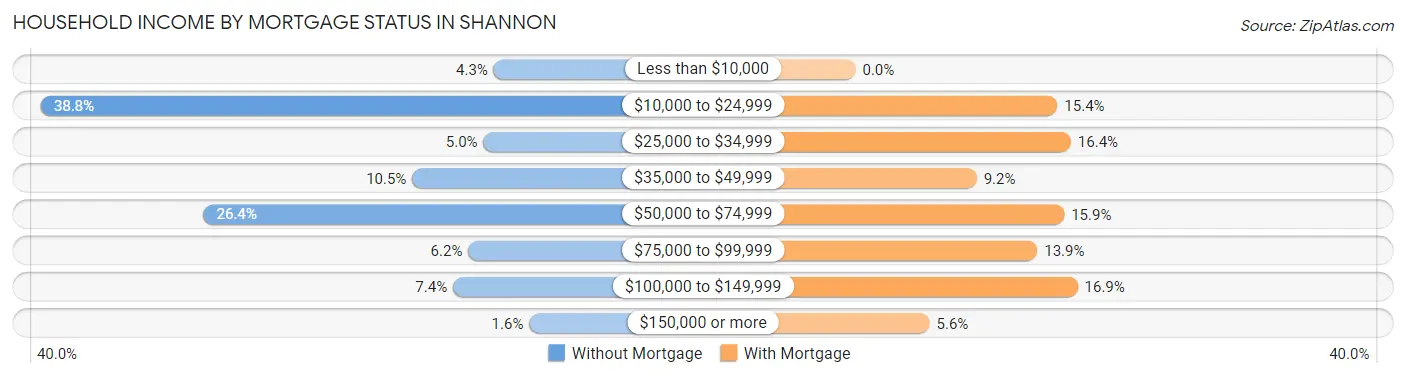
| Household Income | Without Mortgage | With Mortgage |
| Less than $10,000 | 11 (4.3%) | 0 (0.0%) |
| $10,000 to $24,999 | 100 (38.8%) | 30 (15.4%) |
| $25,000 to $34,999 | 13 (5.0%) | 32 (16.4%) |
| $35,000 to $49,999 | 27 (10.5%) | 18 (9.2%) |
| $50,000 to $74,999 | 68 (26.4%) | 31 (15.9%) |
| $75,000 to $99,999 | 16 (6.2%) | 27 (13.9%) |
| $100,000 to $149,999 | 19 (7.4%) | 33 (16.9%) |
| $150,000 or more | 4 (1.5%) | 11 (5.6%) |
| Total | 258 (100.0%) | 195 (100.0%) |
Property Value to Household Income Ratio in Shannon
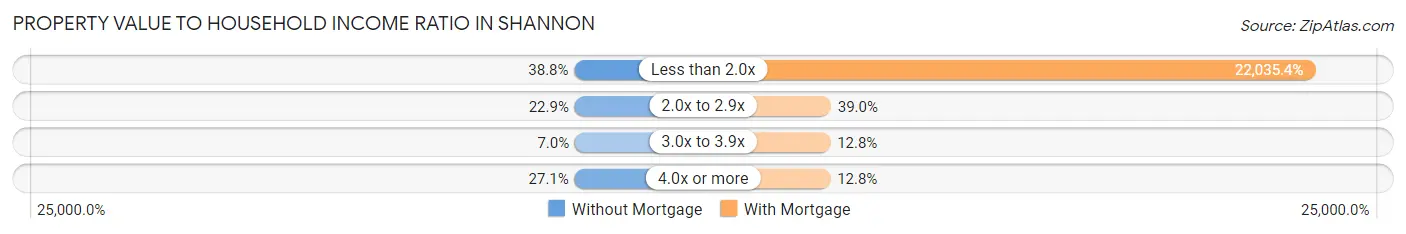
| Value-to-Income Ratio | Without Mortgage | With Mortgage |
| Less than 2.0x | 100 (38.8%) | 42,969 (22,035.4%) |
| 2.0x to 2.9x | 59 (22.9%) | 76 (39.0%) |
| 3.0x to 3.9x | 18 (7.0%) | 25 (12.8%) |
| 4.0x or more | 70 (27.1%) | 25 (12.8%) |
| Total | 258 (100.0%) | 195 (100.0%) |
Real Estate Taxes by Mortgage Status in Shannon
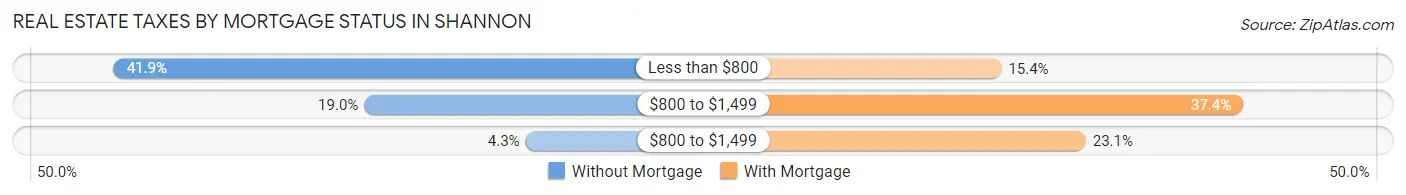
| Property Taxes | Without Mortgage | With Mortgage |
| Less than $800 | 108 (41.9%) | 30 (15.4%) |
| $800 to $1,499 | 49 (19.0%) | 73 (37.4%) |
| $800 to $1,499 | 11 (4.3%) | 45 (23.1%) |
| Total | 258 (100.0%) | 195 (100.0%) |
Health & Disability in Shannon
Health Insurance Coverage by Age in Shannon
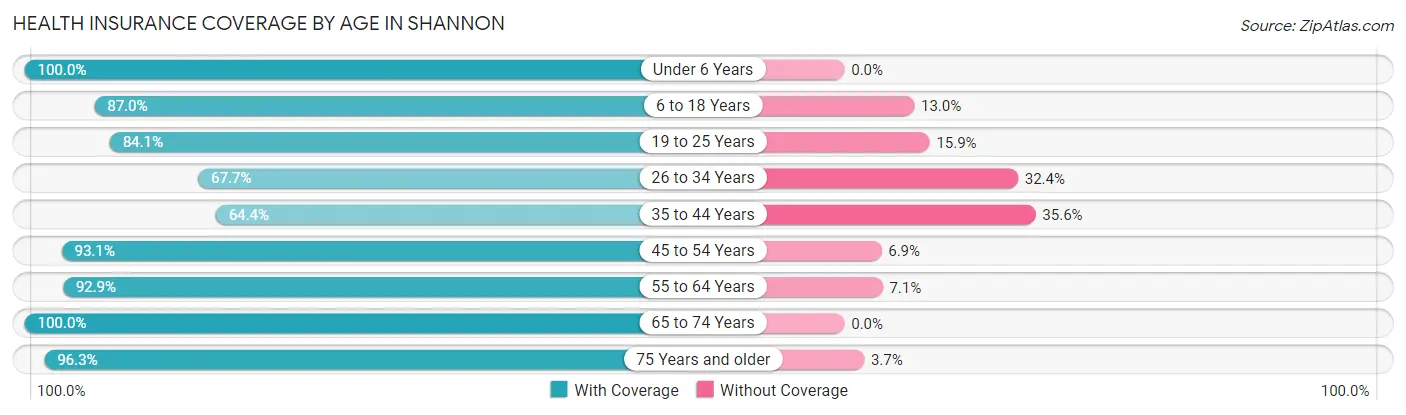
| Age Bracket | With Coverage | Without Coverage |
| Under 6 Years | 146 (100.0%) | 0 (0.0%) |
| 6 to 18 Years | 281 (87.0%) | 42 (13.0%) |
| 19 to 25 Years | 143 (84.1%) | 27 (15.9%) |
| 26 to 34 Years | 92 (67.6%) | 44 (32.4%) |
| 35 to 44 Years | 177 (64.4%) | 98 (35.6%) |
| 45 to 54 Years | 135 (93.1%) | 10 (6.9%) |
| 55 to 64 Years | 196 (92.9%) | 15 (7.1%) |
| 65 to 74 Years | 148 (100.0%) | 0 (0.0%) |
| 75 Years and older | 105 (96.3%) | 4 (3.7%) |
| Total | 1,423 (85.6%) | 240 (14.4%) |
Health Insurance Coverage by Citizenship Status in Shannon
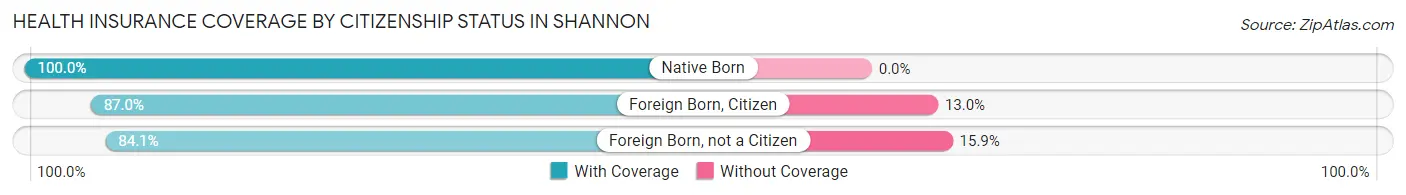
| Citizenship Status | With Coverage | Without Coverage |
| Native Born | 146 (100.0%) | 0 (0.0%) |
| Foreign Born, Citizen | 281 (87.0%) | 42 (13.0%) |
| Foreign Born, not a Citizen | 143 (84.1%) | 27 (15.9%) |
Health Insurance Coverage by Household Income in Shannon
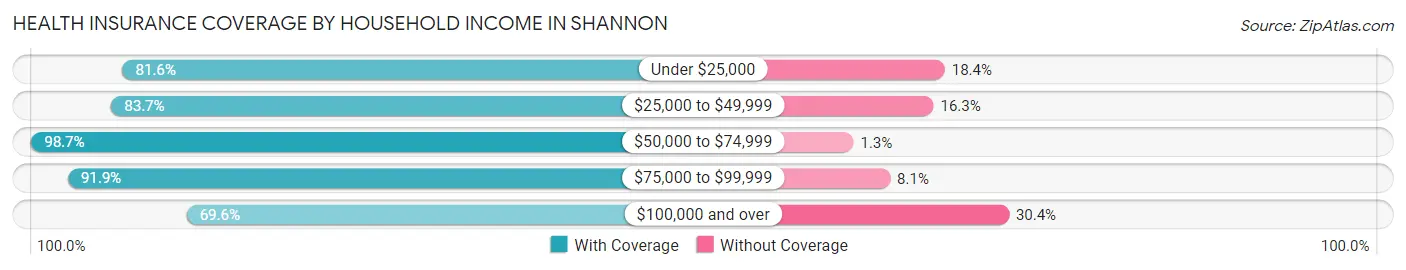
| Household Income | With Coverage | Without Coverage |
| Under $25,000 | 378 (81.6%) | 85 (18.4%) |
| $25,000 to $49,999 | 273 (83.7%) | 53 (16.3%) |
| $50,000 to $74,999 | 313 (98.7%) | 4 (1.3%) |
| $75,000 to $99,999 | 294 (91.9%) | 26 (8.1%) |
| $100,000 and over | 165 (69.6%) | 72 (30.4%) |
Public vs Private Health Insurance Coverage by Age in Shannon
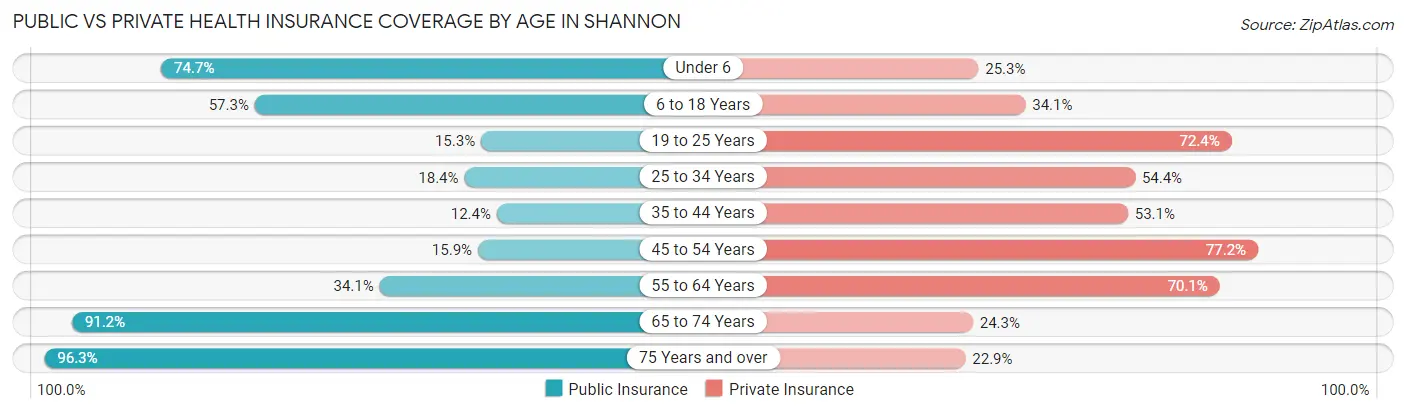
| Age Bracket | Public Insurance | Private Insurance |
| Under 6 | 109 (74.7%) | 37 (25.3%) |
| 6 to 18 Years | 185 (57.3%) | 110 (34.1%) |
| 19 to 25 Years | 26 (15.3%) | 123 (72.4%) |
| 25 to 34 Years | 25 (18.4%) | 74 (54.4%) |
| 35 to 44 Years | 34 (12.4%) | 146 (53.1%) |
| 45 to 54 Years | 23 (15.9%) | 112 (77.2%) |
| 55 to 64 Years | 72 (34.1%) | 148 (70.1%) |
| 65 to 74 Years | 135 (91.2%) | 36 (24.3%) |
| 75 Years and over | 105 (96.3%) | 25 (22.9%) |
| Total | 714 (42.9%) | 811 (48.8%) |
Disability Status by Sex by Age in Shannon
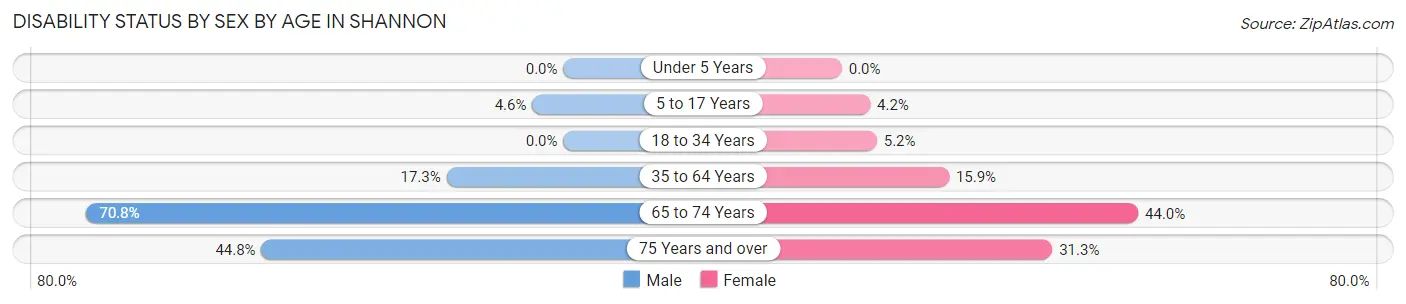
| Age Bracket | Male | Female |
| Under 5 Years | 0 (0.0%) | 0 (0.0%) |
| 5 to 17 Years | 7 (4.6%) | 6 (4.2%) |
| 18 to 34 Years | 0 (0.0%) | 9 (5.2%) |
| 35 to 64 Years | 56 (17.3%) | 49 (15.9%) |
| 65 to 74 Years | 34 (70.8%) | 44 (44.0%) |
| 75 Years and over | 13 (44.8%) | 25 (31.2%) |
Disability Class by Sex by Age in Shannon
Disability Class: Hearing Difficulty
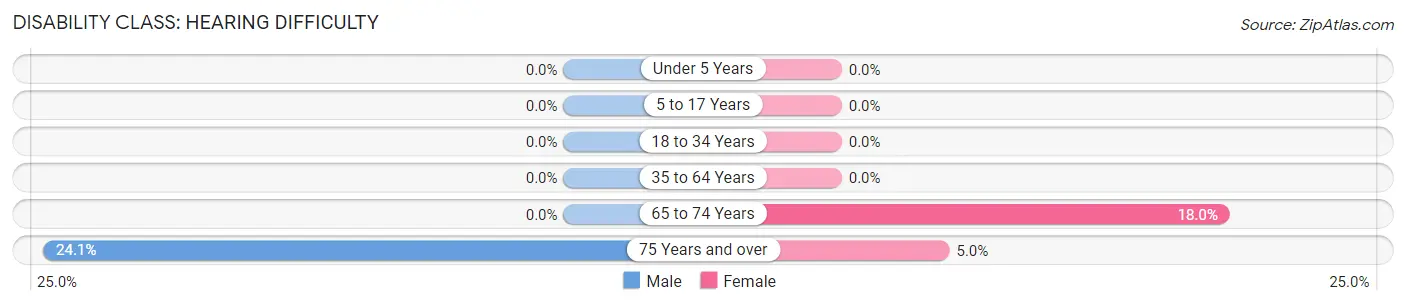
| Age Bracket | Male | Female |
| Under 5 Years | 0 (0.0%) | 0 (0.0%) |
| 5 to 17 Years | 0 (0.0%) | 0 (0.0%) |
| 18 to 34 Years | 0 (0.0%) | 0 (0.0%) |
| 35 to 64 Years | 0 (0.0%) | 0 (0.0%) |
| 65 to 74 Years | 0 (0.0%) | 18 (18.0%) |
| 75 Years and over | 7 (24.1%) | 4 (5.0%) |
Disability Class: Vision Difficulty
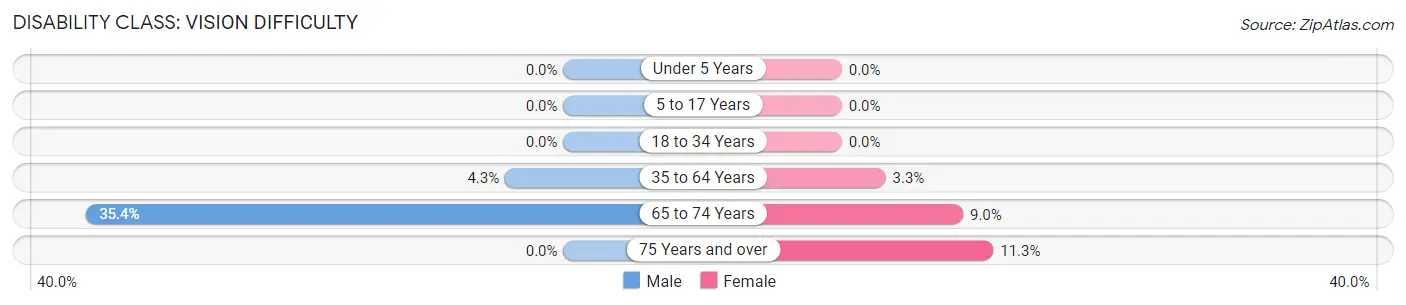
| Age Bracket | Male | Female |
| Under 5 Years | 0 (0.0%) | 0 (0.0%) |
| 5 to 17 Years | 0 (0.0%) | 0 (0.0%) |
| 18 to 34 Years | 0 (0.0%) | 0 (0.0%) |
| 35 to 64 Years | 14 (4.3%) | 10 (3.3%) |
| 65 to 74 Years | 17 (35.4%) | 9 (9.0%) |
| 75 Years and over | 0 (0.0%) | 9 (11.3%) |
Disability Class: Cognitive Difficulty
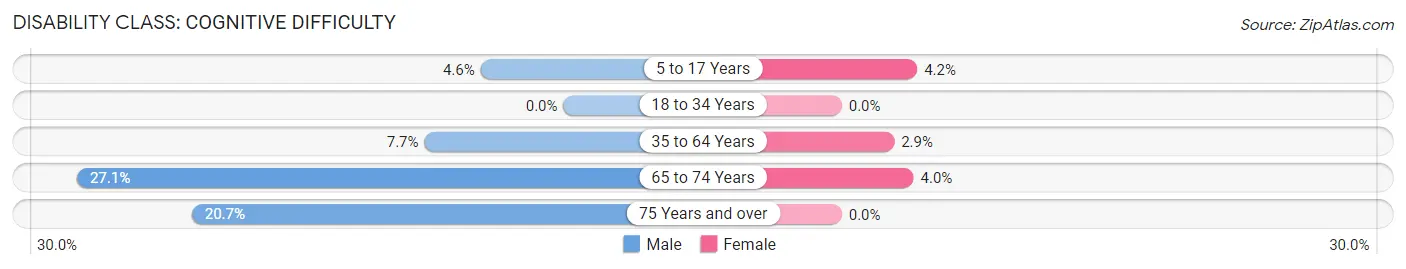
| Age Bracket | Male | Female |
| 5 to 17 Years | 7 (4.6%) | 6 (4.2%) |
| 18 to 34 Years | 0 (0.0%) | 0 (0.0%) |
| 35 to 64 Years | 25 (7.7%) | 9 (2.9%) |
| 65 to 74 Years | 13 (27.1%) | 4 (4.0%) |
| 75 Years and over | 6 (20.7%) | 0 (0.0%) |
Disability Class: Ambulatory Difficulty
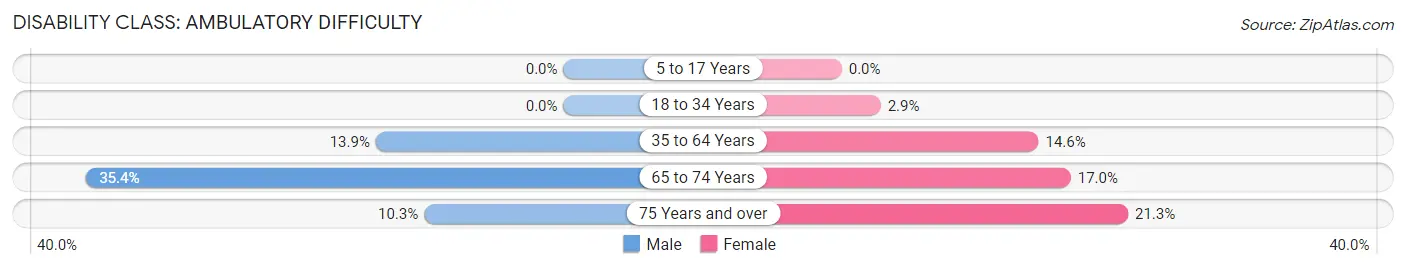
| Age Bracket | Male | Female |
| 5 to 17 Years | 0 (0.0%) | 0 (0.0%) |
| 18 to 34 Years | 0 (0.0%) | 5 (2.9%) |
| 35 to 64 Years | 45 (13.9%) | 45 (14.6%) |
| 65 to 74 Years | 17 (35.4%) | 17 (17.0%) |
| 75 Years and over | 3 (10.3%) | 17 (21.2%) |
Disability Class: Self-Care Difficulty
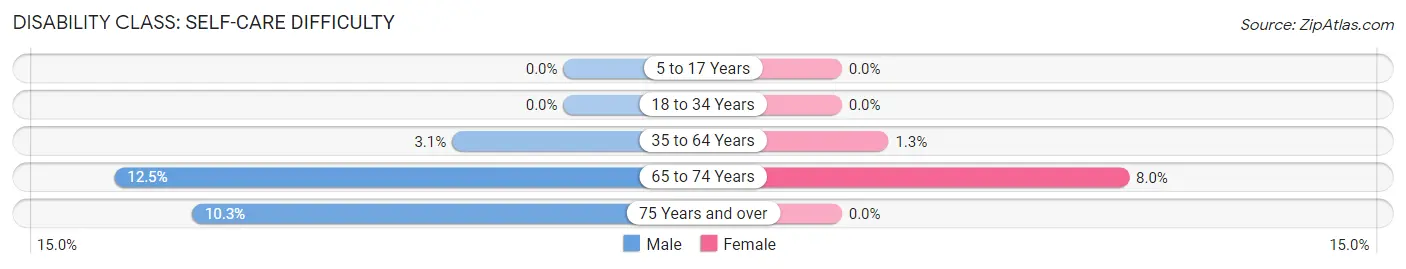
| Age Bracket | Male | Female |
| 5 to 17 Years | 0 (0.0%) | 0 (0.0%) |
| 18 to 34 Years | 0 (0.0%) | 0 (0.0%) |
| 35 to 64 Years | 10 (3.1%) | 4 (1.3%) |
| 65 to 74 Years | 6 (12.5%) | 8 (8.0%) |
| 75 Years and over | 3 (10.3%) | 0 (0.0%) |
Technology Access in Shannon
Computing Device Access in Shannon
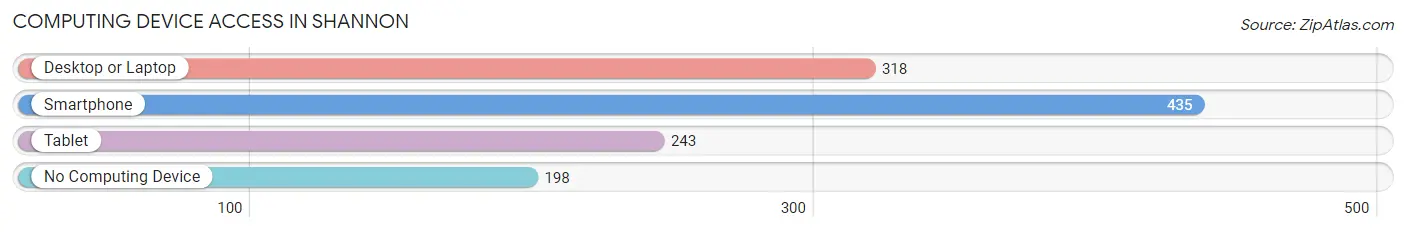
| Device Type | # Households | % Households |
| Desktop or Laptop | 318 | 44.9% |
| Smartphone | 435 | 61.4% |
| Tablet | 243 | 34.3% |
| No Computing Device | 198 | 28.0% |
| Total | 708 | 100.0% |
Internet Access in Shannon
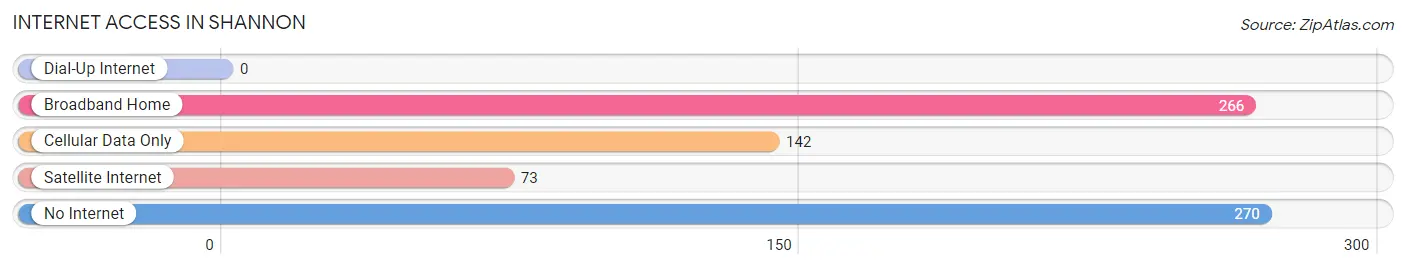
| Internet Type | # Households | % Households |
| Dial-Up Internet | 0 | 0.0% |
| Broadband Home | 266 | 37.6% |
| Cellular Data Only | 142 | 20.1% |
| Satellite Internet | 73 | 10.3% |
| No Internet | 270 | 38.1% |
| Total | 708 | 100.0% |
Shannon Summary
Shannon is a small town located in the state of Mississippi, in the United States of America. It is situated in Lee County, and is part of the Tupelo Metropolitan Statistical Area. The town has a population of approximately 1,500 people, and is located about 20 miles east of Tupelo.
Geography
Shannon is located in the northeastern part of Lee County, in the state of Mississippi. It is situated at an elevation of about 300 feet above sea level. The town is located in the Tombigbee River Valley, and is surrounded by rolling hills and forests. The town is located about 20 miles east of Tupelo, and is about an hour and a half drive from Memphis, Tennessee.
The climate in Shannon is humid subtropical, with hot, humid summers and mild winters. The average annual temperature is around 70 degrees Fahrenheit, with the average high temperature in the summer months reaching into the mid-90s. The average low temperature in the winter months is around 40 degrees Fahrenheit.
Economy
The economy of Shannon is largely based on agriculture and manufacturing. The town is home to several large manufacturing plants, including a furniture factory, a paper mill, and a plastics plant. The town also has a number of small businesses, including restaurants, retail stores, and service providers.
The town is also home to a number of agricultural operations, including cattle farms, poultry farms, and vegetable farms. The town is also home to a number of small businesses, including restaurants, retail stores, and service providers.
Demographics
As of the 2010 census, the population of Shannon was 1,500 people. The racial makeup of the town was 79.2% White, 17.7% African American, 0.7% Native American, 0.3% Asian, 0.1% Pacific Islander, and 1.9% from other races. The median household income in Shannon was $30,000, and the median family income was $35,000.
The town is served by the Lee County School District, which includes two elementary schools, one middle school, and one high school. The town is also home to a number of churches, including Baptist, Methodist, and Pentecostal.
Conclusion
Shannon is a small town located in the state of Mississippi, in the United States of America. It is situated in Lee County, and is part of the Tupelo Metropolitan Statistical Area. The town has a population of approximately 1,500 people, and is located about 20 miles east of Tupelo. The economy of Shannon is largely based on agriculture and manufacturing, and the town is served by the Lee County School District. The racial makeup of the town is 79.2% White, 17.7% African American, 0.7% Native American, 0.3% Asian, 0.1% Pacific Islander, and 1.9% from other races. The median household income in Shannon was $30,000, and the median family income was $35,000.
Common Questions
What is Per Capita Income in Shannon?
Per Capita income in Shannon is $20,060.
What is the Median Family Income in Shannon?
Median Family Income in Shannon is $62,670.
What is the Median Household income in Shannon?
Median Household Income in Shannon is $38,125.
What is Income or Wage Gap in Shannon?
Income or Wage Gap in Shannon is 5.7%.
Women in Shannon earn 94.3 cents for every dollar earned by a man.
What is Inequality or Gini Index in Shannon?
Inequality or Gini Index in Shannon is 0.44.
What is the Total Population of Shannon?
Total Population of Shannon is 1,663.
What is the Total Male Population of Shannon?
Total Male Population of Shannon is 751.
What is the Total Female Population of Shannon?
Total Female Population of Shannon is 912.
What is the Ratio of Males per 100 Females in Shannon?
There are 82.35 Males per 100 Females in Shannon.
What is the Ratio of Females per 100 Males in Shannon?
There are 121.44 Females per 100 Males in Shannon.
What is the Median Population Age in Shannon?
Median Population Age in Shannon is 36.3 Years.
What is the Average Family Size in Shannon
Average Family Size in Shannon is 3.4 People.
What is the Average Household Size in Shannon
Average Household Size in Shannon is 2.4 People.
How Large is the Labor Force in Shannon?
There are 686 People in the Labor Forcein in Shannon.
What is the Percentage of People in the Labor Force in Shannon?
55.6% of People are in the Labor Force in Shannon.
What is the Unemployment Rate in Shannon?
Unemployment Rate in Shannon is 7.0%.