Ripley, MS Map & Demographics
Ripley Map
Ripley Overview
$26,000
PER CAPITA INCOME
$68,136
AVG FAMILY INCOME
$53,175
AVG HOUSEHOLD INCOME
42.3%
WAGE / INCOME GAP [ % ]
57.7¢/ $1
WAGE / INCOME GAP [ $ ]
0.39
INEQUALITY / GINI INDEX
5,440
TOTAL POPULATION
2,708
MALE POPULATION
2,732
FEMALE POPULATION
99.12
MALES / 100 FEMALES
100.89
FEMALES / 100 MALES
39.0
MEDIAN AGE
3.3
AVG FAMILY SIZE
2.6
AVG HOUSEHOLD SIZE
2,907
LABOR FORCE [ PEOPLE ]
67.6%
PERCENT IN LABOR FORCE
9.6%
UNEMPLOYMENT RATE
Ripley Zip Codes
Ripley Area Codes
Income in Ripley
Income Overview in Ripley
Per Capita Income in Ripley is $26,000, while median incomes of families and households are $68,136 and $53,175 respectively.
| Characteristic | Number | Measure |
| Per Capita Income | 5,440 | $26,000 |
| Median Family Income | 1,276 | $68,136 |
| Mean Family Income | 1,276 | $76,558 |
| Median Household Income | 2,058 | $53,175 |
| Mean Household Income | 2,058 | $64,659 |
| Income Deficit | 1,276 | $0 |
| Wage / Income Gap (%) | 5,440 | 42.30% |
| Wage / Income Gap ($) | 5,440 | 57.70¢ per $1 |
| Gini / Inequality Index | 5,440 | 0.39 |
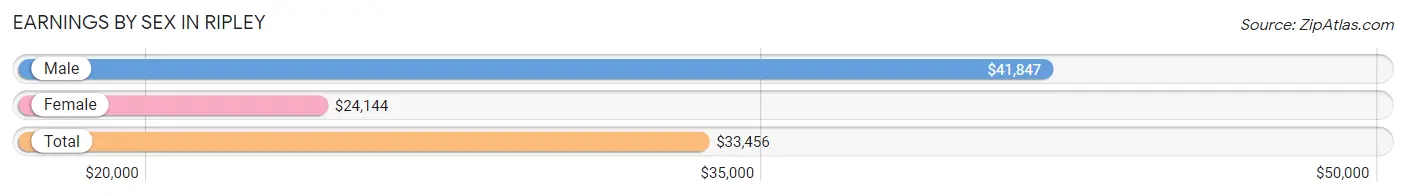
Earnings by Sex in Ripley
Average Earnings in Ripley are $33,456, $41,847 for men and $24,144 for women, a difference of 42.3%.
| Sex | Number | Average Earnings |
| Male | 1,516 (52.1%) | $41,847 |
| Female | 1,393 (47.9%) | $24,144 |
| Total | 2,909 (100.0%) | $33,456 |
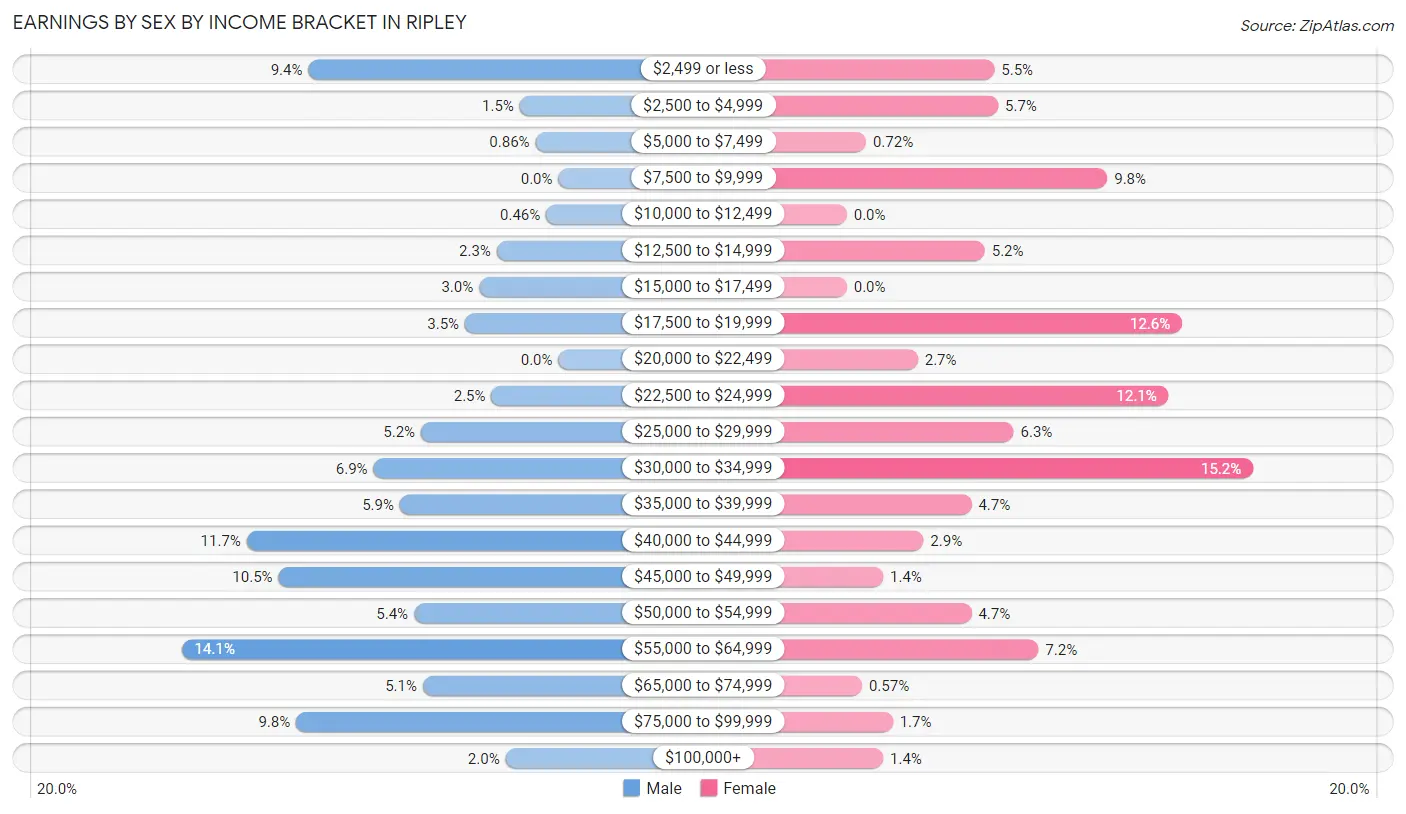
Earnings by Sex by Income Bracket in Ripley
The most common earnings brackets in Ripley are $55,000 to $64,999 for men (214 | 14.1%) and $30,000 to $34,999 for women (212 | 15.2%).
| Income | Male | Female |
| $2,499 or less | 142 (9.4%) | 77 (5.5%) |
| $2,500 to $4,999 | 22 (1.5%) | 79 (5.7%) |
| $5,000 to $7,499 | 13 (0.9%) | 10 (0.7%) |
| $7,500 to $9,999 | 0 (0.0%) | 136 (9.8%) |
| $10,000 to $12,499 | 7 (0.5%) | 0 (0.0%) |
| $12,500 to $14,999 | 35 (2.3%) | 72 (5.2%) |
| $15,000 to $17,499 | 45 (3.0%) | 0 (0.0%) |
| $17,500 to $19,999 | 53 (3.5%) | 175 (12.6%) |
| $20,000 to $22,499 | 0 (0.0%) | 37 (2.7%) |
| $22,500 to $24,999 | 38 (2.5%) | 168 (12.1%) |
| $25,000 to $29,999 | 78 (5.1%) | 87 (6.2%) |
| $30,000 to $34,999 | 105 (6.9%) | 212 (15.2%) |
| $35,000 to $39,999 | 90 (5.9%) | 65 (4.7%) |
| $40,000 to $44,999 | 177 (11.7%) | 40 (2.9%) |
| $45,000 to $49,999 | 159 (10.5%) | 19 (1.4%) |
| $50,000 to $54,999 | 82 (5.4%) | 65 (4.7%) |
| $55,000 to $64,999 | 214 (14.1%) | 100 (7.2%) |
| $65,000 to $74,999 | 77 (5.1%) | 8 (0.6%) |
| $75,000 to $99,999 | 149 (9.8%) | 24 (1.7%) |
| $100,000+ | 30 (2.0%) | 19 (1.4%) |
| Total | 1,516 (100.0%) | 1,393 (100.0%) |
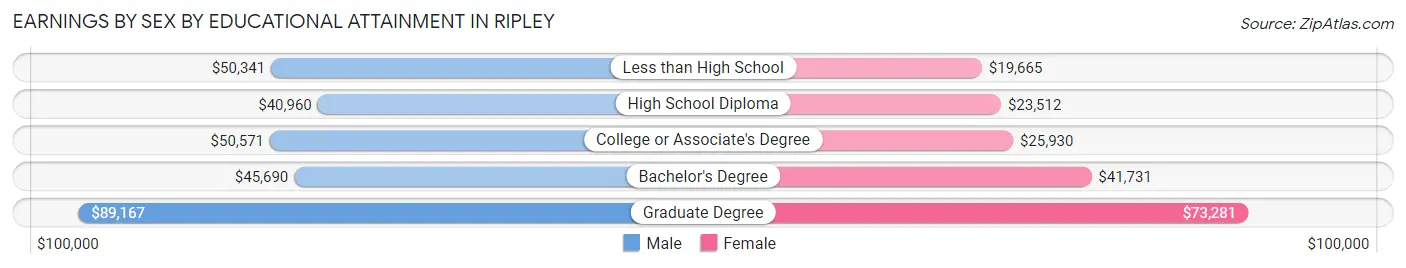
Earnings by Sex by Educational Attainment in Ripley
Average earnings in Ripley are $48,075 for men and $25,378 for women, a difference of 47.2%. Men with an educational attainment of graduate degree enjoy the highest average annual earnings of $89,167, while those with high school diploma education earn the least with $40,960. Women with an educational attainment of graduate degree earn the most with the average annual earnings of $73,281, while those with less than high school education have the smallest earnings of $19,665.
| Educational Attainment | Male Income | Female Income |
| Less than High School | $50,341 | $19,665 |
| High School Diploma | $40,960 | $23,512 |
| College or Associate's Degree | $50,571 | $25,930 |
| Bachelor's Degree | $45,690 | $41,731 |
| Graduate Degree | $89,167 | $73,281 |
| Total | $48,075 | $25,378 |
Family Income in Ripley
Family Income Brackets in Ripley
According to the Ripley family income data, there are 259 families falling into the $75,000 to $99,999 income range, which is the most common income bracket and makes up 20.3% of all families. Conversely, the $10,000 to $14,999 income bracket is the least frequent group with only 23 families (1.8%) belonging to this category.
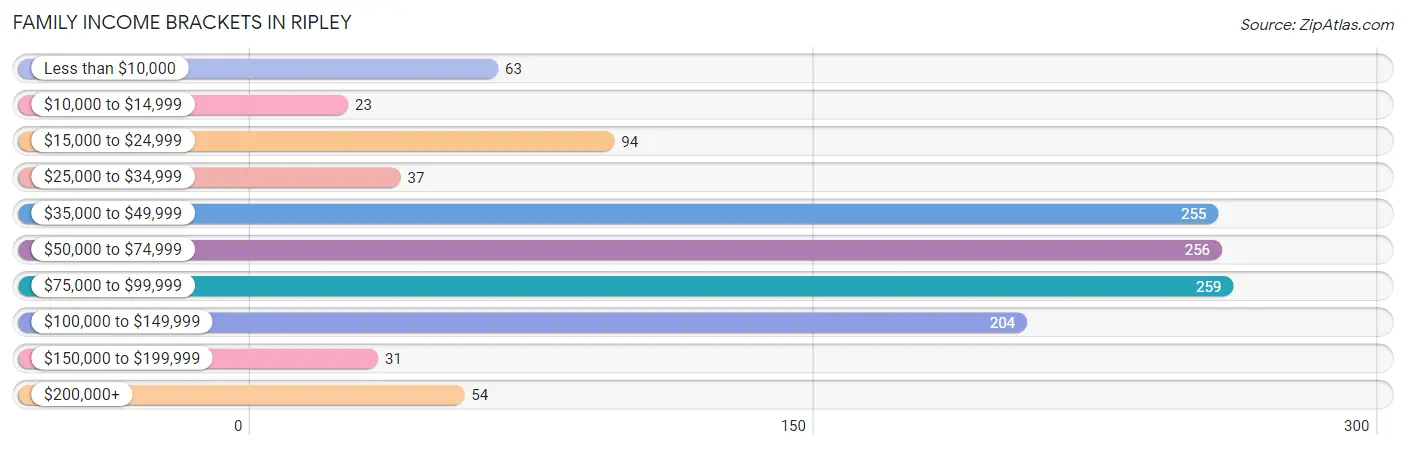
| Income Bracket | # Families | % Families |
| Less than $10,000 | 63 | 4.9% |
| $10,000 to $14,999 | 23 | 1.8% |
| $15,000 to $24,999 | 94 | 7.4% |
| $25,000 to $34,999 | 37 | 2.9% |
| $35,000 to $49,999 | 255 | 20.0% |
| $50,000 to $74,999 | 256 | 20.1% |
| $75,000 to $99,999 | 259 | 20.3% |
| $100,000 to $149,999 | 204 | 16.0% |
| $150,000 to $199,999 | 31 | 2.4% |
| $200,000+ | 54 | 4.2% |
Family Income by Famaliy Size in Ripley
4-person families (215 | 16.9%) account for the highest median family income in Ripley with $121,301 per family, while 4-person families (215 | 16.9%) have the highest median income of $30,325 per family member.
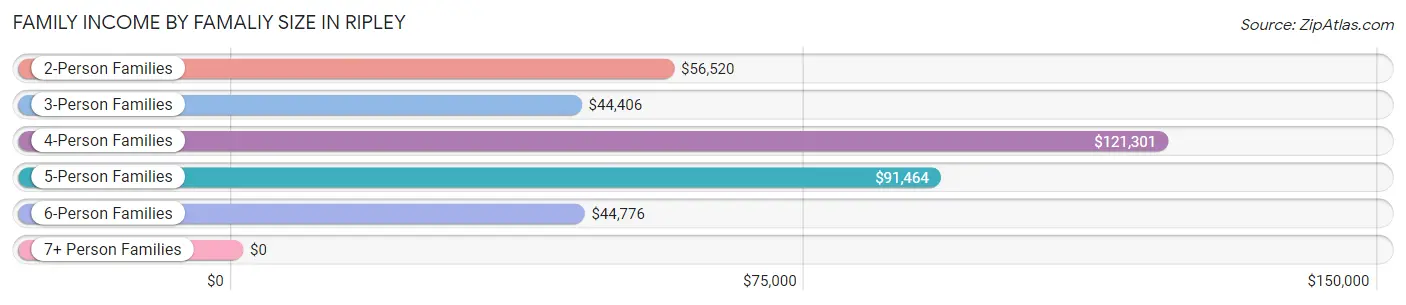
| Income Bracket | # Families | Median Income |
| 2-Person Families | 707 (55.4%) | $56,520 |
| 3-Person Families | 177 (13.9%) | $44,406 |
| 4-Person Families | 215 (16.9%) | $121,301 |
| 5-Person Families | 89 (7.0%) | $91,464 |
| 6-Person Families | 71 (5.6%) | $44,776 |
| 7+ Person Families | 17 (1.3%) | $0 |
| Total | 1,276 (100.0%) | $68,136 |
Family Income by Number of Earners in Ripley
The median family income in Ripley is $68,136, with families comprising 3+ earners (129) having the highest median family income of $121,743, while families with no earners (96) have the lowest median family income of $35,192, accounting for 10.1% and 7.5% of families, respectively.
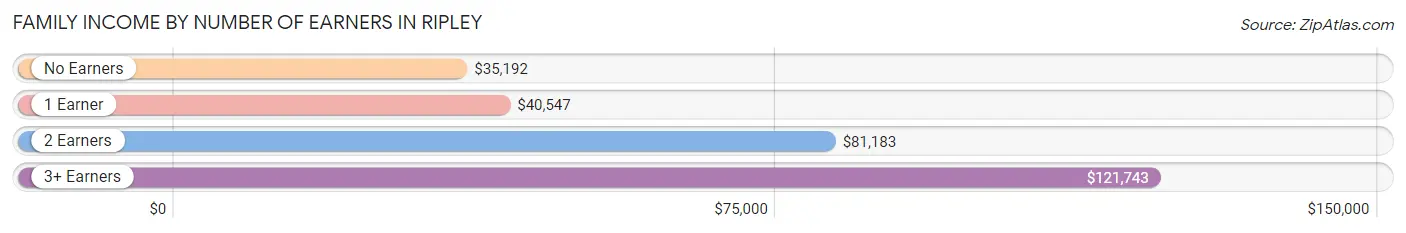
| Number of Earners | # Families | Median Income |
| No Earners | 96 (7.5%) | $35,192 |
| 1 Earner | 401 (31.4%) | $40,547 |
| 2 Earners | 650 (50.9%) | $81,183 |
| 3+ Earners | 129 (10.1%) | $121,743 |
| Total | 1,276 (100.0%) | $68,136 |
Household Income in Ripley
Household Income Brackets in Ripley
With 395 households falling in the category, the $75,000 to $99,999 income range is the most frequent in Ripley, accounting for 19.2% of all households. In contrast, only 31 households (1.5%) fall into the $150,000 to $199,999 income bracket, making it the least populous group.
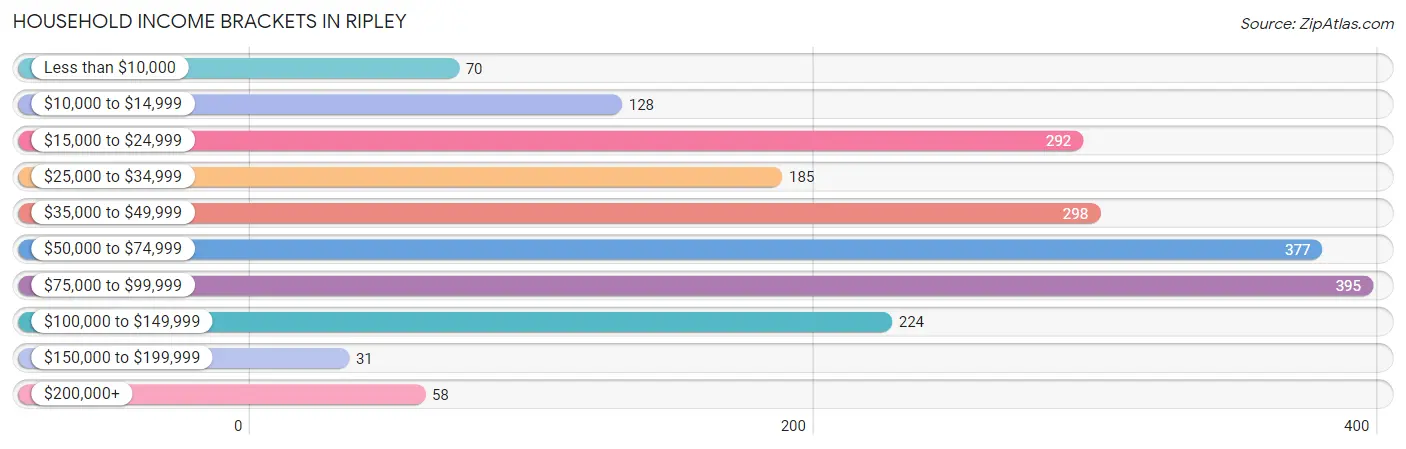
| Income Bracket | # Households | % Households |
| Less than $10,000 | 70 | 3.4% |
| $10,000 to $14,999 | 128 | 6.2% |
| $15,000 to $24,999 | 292 | 14.2% |
| $25,000 to $34,999 | 185 | 9.0% |
| $35,000 to $49,999 | 298 | 14.5% |
| $50,000 to $74,999 | 377 | 18.3% |
| $75,000 to $99,999 | 395 | 19.2% |
| $100,000 to $149,999 | 224 | 10.9% |
| $150,000 to $199,999 | 31 | 1.5% |
| $200,000+ | 58 | 2.8% |
Household Income by Householder Age in Ripley
The median household income in Ripley is $53,175, with the highest median household income of $67,908 found in the 25 to 44 years age bracket for the primary householder. A total of 662 households (32.2%) fall into this category. Meanwhile, the 15 to 24 years age bracket for the primary householder has the lowest median household income of $0, with 78 households (3.8%) in this group.
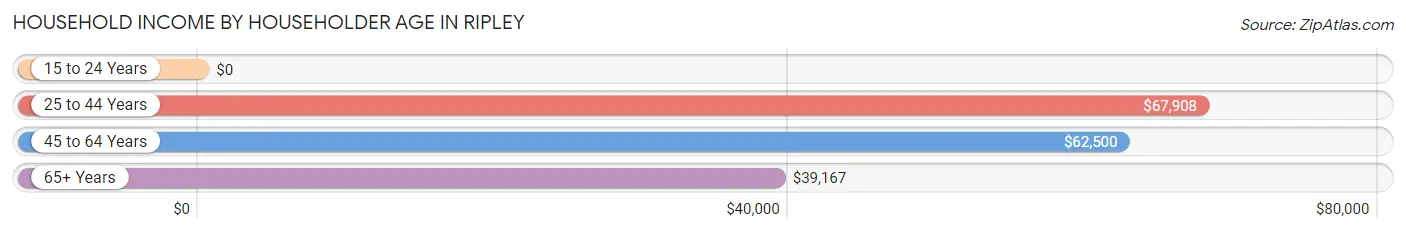
| Income Bracket | # Households | Median Income |
| 15 to 24 Years | 78 (3.8%) | $0 |
| 25 to 44 Years | 662 (32.2%) | $67,908 |
| 45 to 64 Years | 678 (32.9%) | $62,500 |
| 65+ Years | 640 (31.1%) | $39,167 |
| Total | 2,058 (100.0%) | $53,175 |
Poverty in Ripley
Income Below Poverty by Sex and Age in Ripley
With 12.0% poverty level for males and 19.6% for females among the residents of Ripley, 75 year old and over males and 15 year old females are the most vulnerable to poverty, with 9 males (36.0%) and 63 females (53.4%) in their respective age groups living below the poverty level.
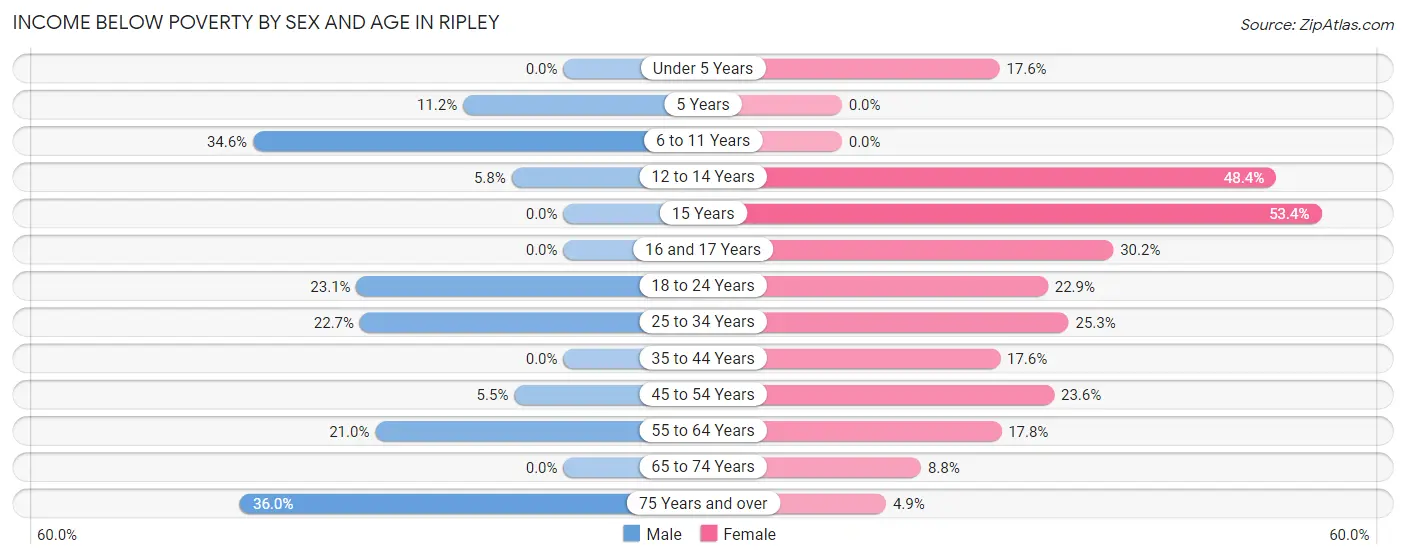
| Age Bracket | Male | Female |
| Under 5 Years | 0 (0.0%) | 23 (17.6%) |
| 5 Years | 18 (11.2%) | 0 (0.0%) |
| 6 to 11 Years | 84 (34.6%) | 0 (0.0%) |
| 12 to 14 Years | 12 (5.8%) | 44 (48.3%) |
| 15 Years | 0 (0.0%) | 63 (53.4%) |
| 16 and 17 Years | 0 (0.0%) | 13 (30.2%) |
| 18 to 24 Years | 77 (23.1%) | 64 (22.9%) |
| 25 to 34 Years | 58 (22.7%) | 75 (25.3%) |
| 35 to 44 Years | 0 (0.0%) | 89 (17.6%) |
| 45 to 54 Years | 27 (5.5%) | 52 (23.6%) |
| 55 to 64 Years | 31 (20.9%) | 49 (17.7%) |
| 65 to 74 Years | 0 (0.0%) | 33 (8.8%) |
| 75 Years and over | 9 (36.0%) | 9 (4.9%) |
| Total | 316 (12.0%) | 514 (19.6%) |
Income Above Poverty by Sex and Age in Ripley
According to the poverty statistics in Ripley, males aged under 5 years and females aged 5 years are the age groups that are most secure financially, with 100.0% of males and 100.0% of females in these age groups living above the poverty line.
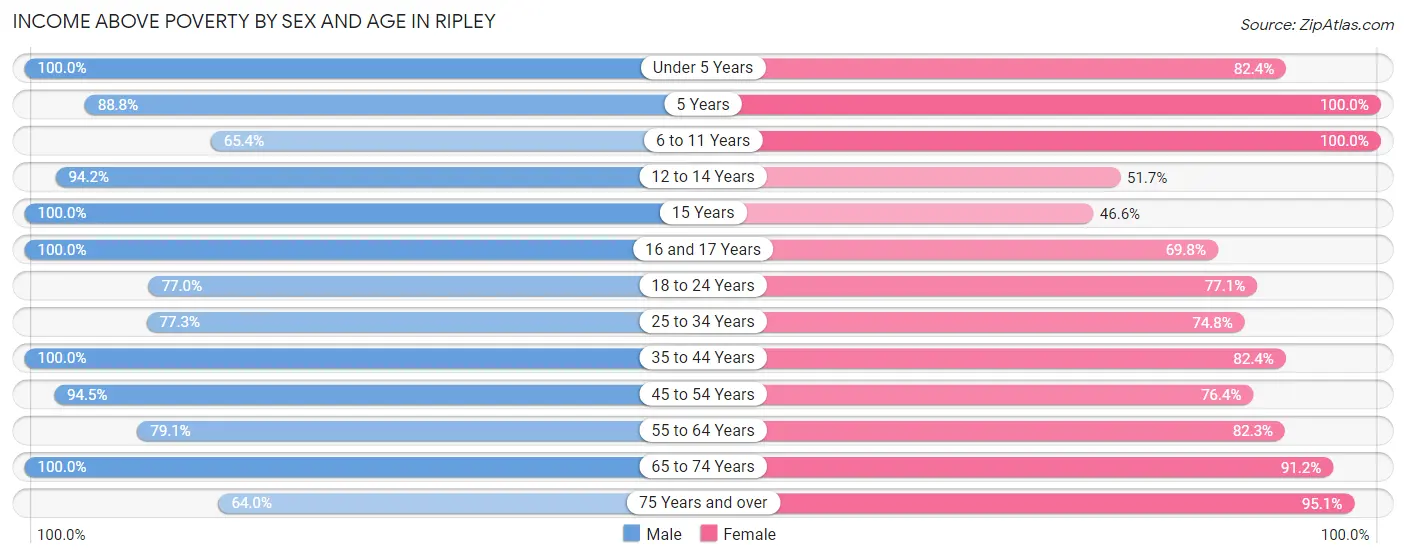
| Age Bracket | Male | Female |
| Under 5 Years | 38 (100.0%) | 108 (82.4%) |
| 5 Years | 143 (88.8%) | 45 (100.0%) |
| 6 to 11 Years | 159 (65.4%) | 57 (100.0%) |
| 12 to 14 Years | 196 (94.2%) | 47 (51.6%) |
| 15 Years | 29 (100.0%) | 55 (46.6%) |
| 16 and 17 Years | 141 (100.0%) | 30 (69.8%) |
| 18 to 24 Years | 257 (76.9%) | 215 (77.1%) |
| 25 to 34 Years | 198 (77.3%) | 222 (74.8%) |
| 35 to 44 Years | 246 (100.0%) | 416 (82.4%) |
| 45 to 54 Years | 467 (94.5%) | 168 (76.4%) |
| 55 to 64 Years | 117 (79.0%) | 227 (82.3%) |
| 65 to 74 Years | 302 (100.0%) | 341 (91.2%) |
| 75 Years and over | 16 (64.0%) | 174 (95.1%) |
| Total | 2,309 (88.0%) | 2,105 (80.4%) |
Income Below Poverty Among Married-Couple Families in Ripley
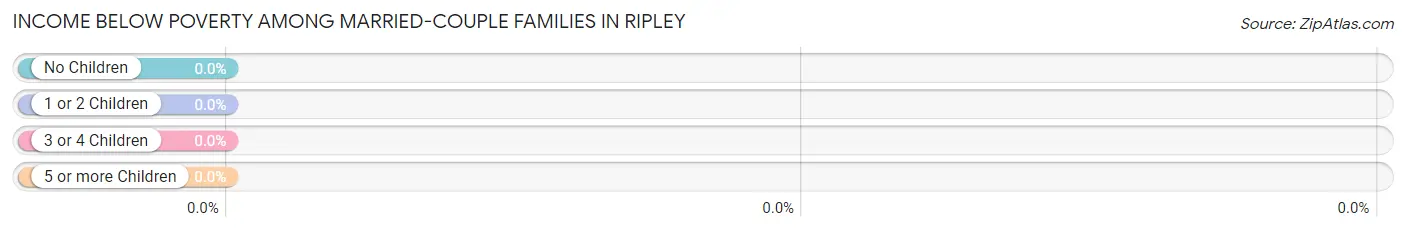
| Children | Above Poverty | Below Poverty |
| No Children | 626 (100.0%) | 0 (0.0%) |
| 1 or 2 Children | 201 (100.0%) | 0 (0.0%) |
| 3 or 4 Children | 123 (100.0%) | 0 (0.0%) |
| 5 or more Children | 0 (0.0%) | 0 (0.0%) |
| Total | 950 (100.0%) | 0 (0.0%) |
Income Below Poverty Among Single-Parent Households in Ripley
According to the poverty data in Ripley, 24.6% or 30 single-father households and 71.1% or 145 single-mother households are living below the poverty line. Among single-father households, those with 3 or 4 children have the highest poverty rate, with 7 households (100.0%) experiencing poverty. Likewise, among single-mother households, those with 3 or 4 children have the highest poverty rate, with 24 households (100.0%) falling below the poverty line.
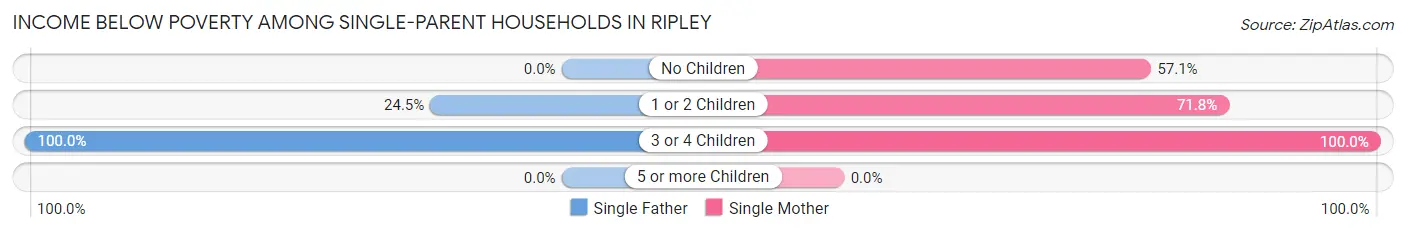
| Children | Single Father | Single Mother |
| No Children | 0 (0.0%) | 32 (57.1%) |
| 1 or 2 Children | 23 (24.5%) | 89 (71.8%) |
| 3 or 4 Children | 7 (100.0%) | 24 (100.0%) |
| 5 or more Children | 0 (0.0%) | 0 (0.0%) |
| Total | 30 (24.6%) | 145 (71.1%) |
Income Below Poverty Among Married-Couple vs Single-Parent Households in Ripley
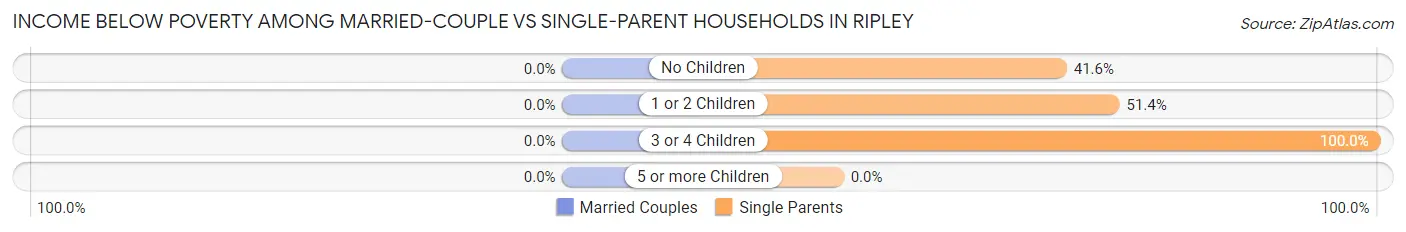
| Children | Married-Couple Families | Single-Parent Households |
| No Children | 0 (0.0%) | 32 (41.6%) |
| 1 or 2 Children | 0 (0.0%) | 112 (51.4%) |
| 3 or 4 Children | 0 (0.0%) | 31 (100.0%) |
| 5 or more Children | 0 (0.0%) | 0 (0.0%) |
| Total | 0 (0.0%) | 175 (53.7%) |
Race in Ripley
The most populous races in Ripley are White / Caucasian (3,237 | 59.5%), Black / African American (1,053 | 19.4%), and Two or more Races (698 | 12.8%).
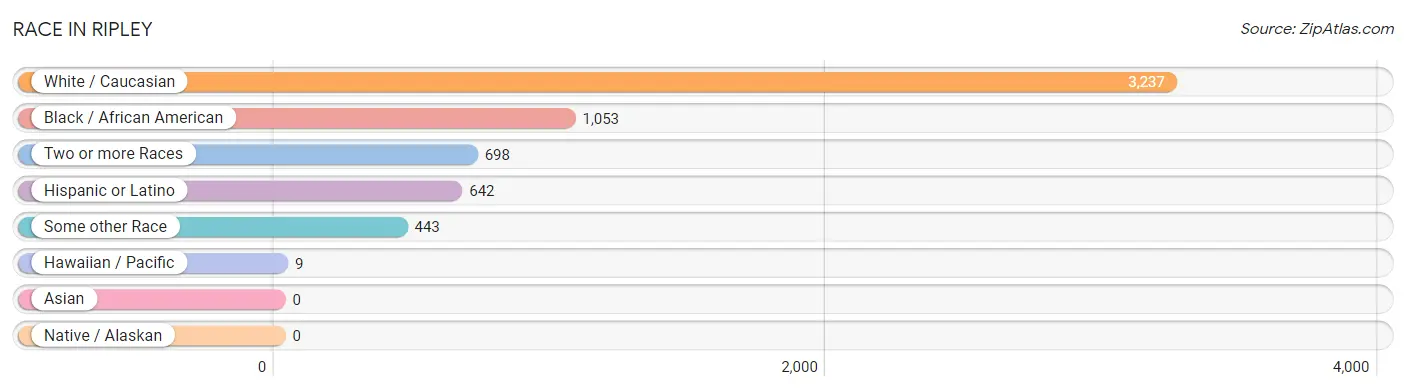
| Race | # Population | % Population |
| Asian | 0 | 0.0% |
| Black / African American | 1,053 | 19.4% |
| Hawaiian / Pacific | 9 | 0.2% |
| Hispanic or Latino | 642 | 11.8% |
| Native / Alaskan | 0 | 0.0% |
| White / Caucasian | 3,237 | 59.5% |
| Two or more Races | 698 | 12.8% |
| Some other Race | 443 | 8.1% |
| Total | 5,440 | 100.0% |
Ancestry in Ripley
The most populous ancestries reported in Ripley are English (623 | 11.5%), Mexican (357 | 6.6%), American (299 | 5.5%), Irish (297 | 5.5%), and Central American (248 | 4.6%), together accounting for 33.5% of all Ripley residents.
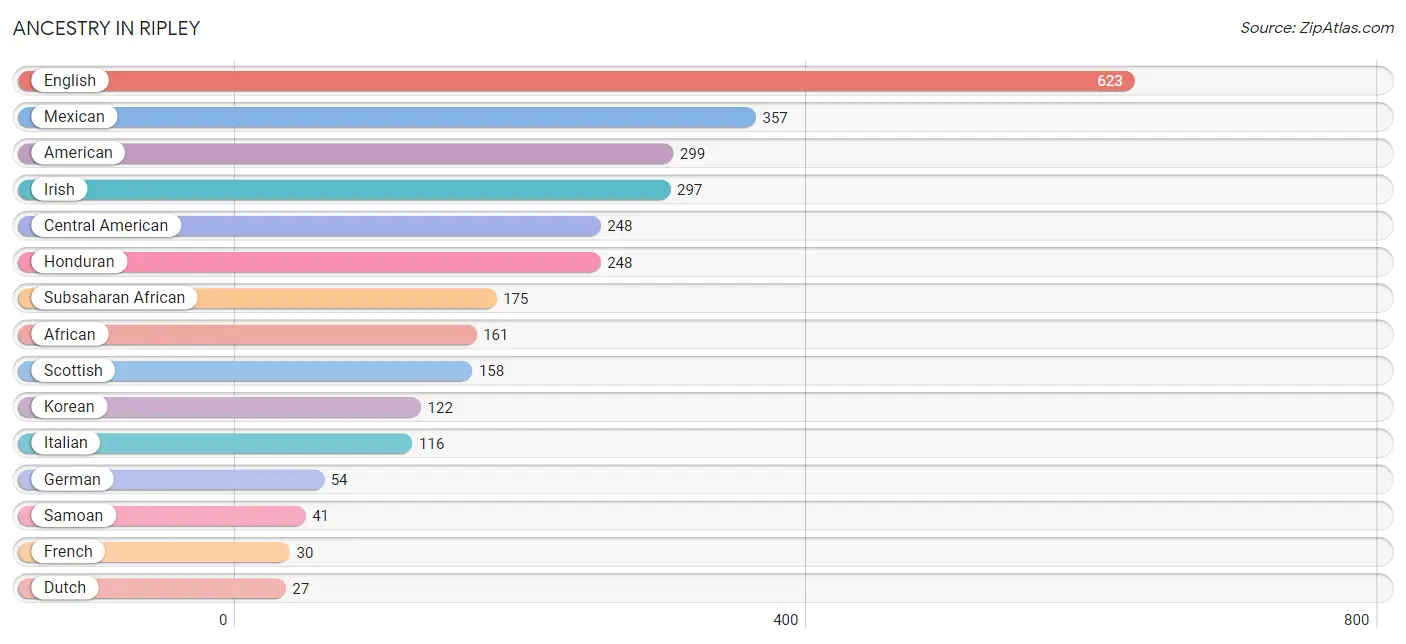
| Ancestry | # Population | % Population |
| African | 161 | 3.0% |
| American | 299 | 5.5% |
| Central American | 248 | 4.6% |
| Choctaw | 24 | 0.4% |
| Dutch | 27 | 0.5% |
| English | 623 | 11.5% |
| European | 6 | 0.1% |
| French | 30 | 0.5% |
| German | 54 | 1.0% |
| Honduran | 248 | 4.6% |
| Irish | 297 | 5.5% |
| Italian | 116 | 2.1% |
| Korean | 122 | 2.2% |
| Latvian | 10 | 0.2% |
| Mexican | 357 | 6.6% |
| Nigerian | 14 | 0.3% |
| Puerto Rican | 13 | 0.2% |
| Samoan | 41 | 0.7% |
| Scotch-Irish | 19 | 0.4% |
| Scottish | 158 | 2.9% |
| Subsaharan African | 175 | 3.2% | View All 21 Rows |
Immigrants in Ripley
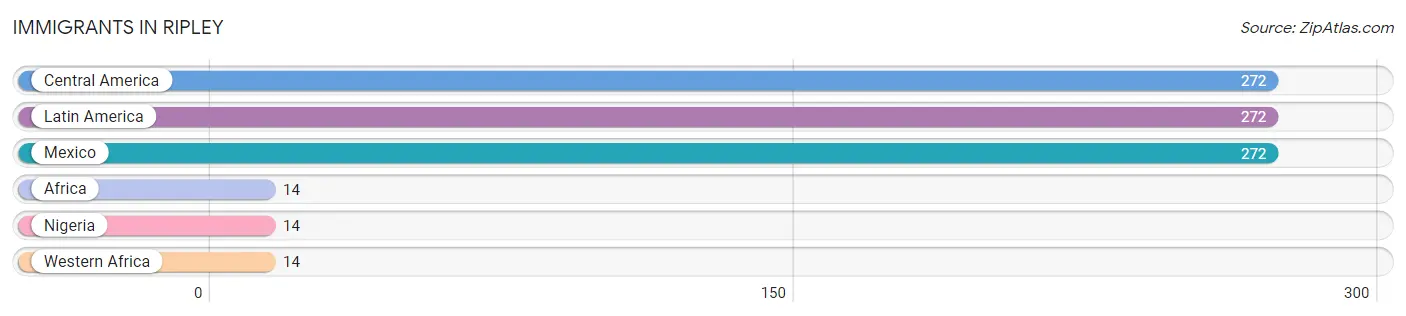
The most numerous immigrant groups reported in Ripley came from Central America (272 | 5.0%), Latin America (272 | 5.0%), Mexico (272 | 5.0%), Africa (14 | 0.3%), and Nigeria (14 | 0.3%), together accounting for 15.5% of all Ripley residents.
| Immigration Origin | # Population | % Population |
| Africa | 14 | 0.3% |
| Central America | 272 | 5.0% |
| Latin America | 272 | 5.0% |
| Mexico | 272 | 5.0% |
| Nigeria | 14 | 0.3% |
| Western Africa | 14 | 0.3% | View All 6 Rows |
Sex and Age in Ripley
Sex and Age in Ripley
The most populous age groups in Ripley are 10 to 14 Years (361 | 13.3%) for men and 40 to 44 Years (329 | 12.0%) for women.
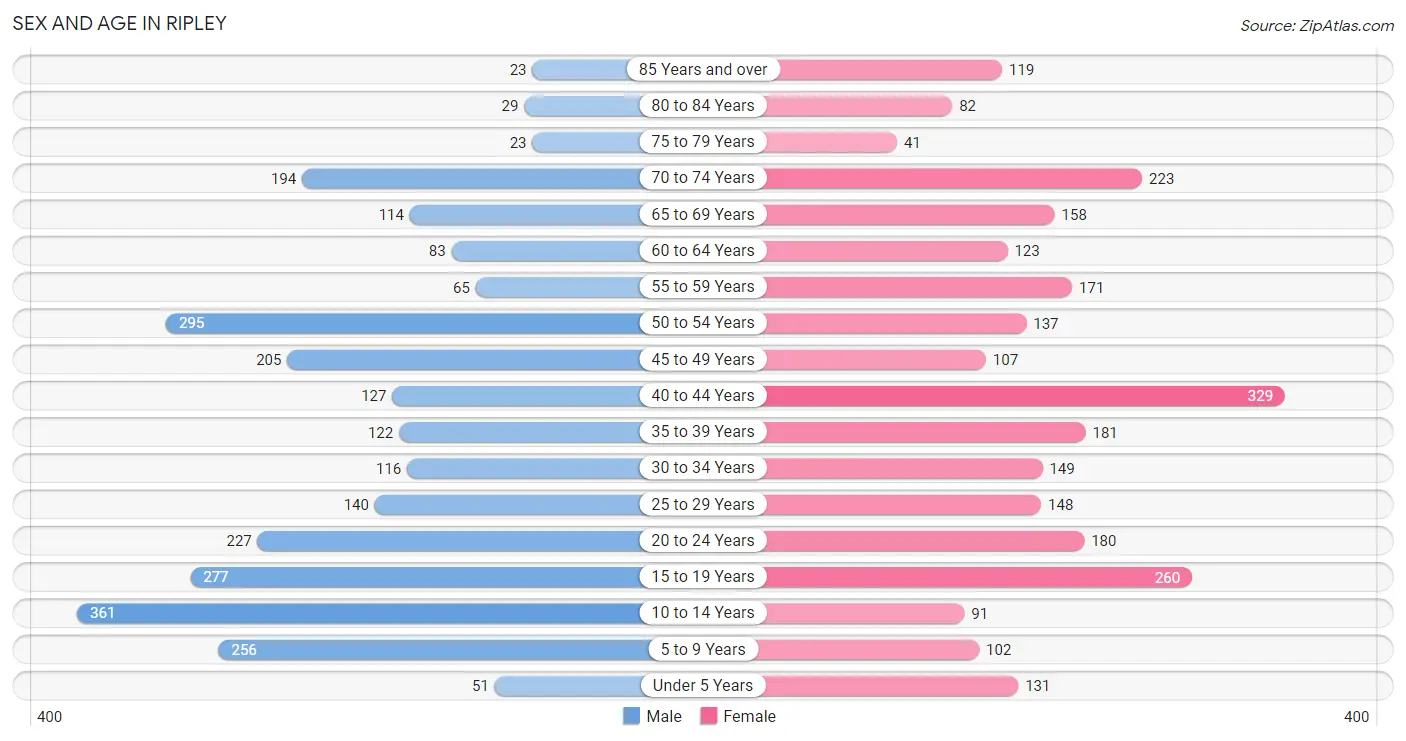
| Age Bracket | Male | Female |
| Under 5 Years | 51 (1.9%) | 131 (4.8%) |
| 5 to 9 Years | 256 (9.5%) | 102 (3.7%) |
| 10 to 14 Years | 361 (13.3%) | 91 (3.3%) |
| 15 to 19 Years | 277 (10.2%) | 260 (9.5%) |
| 20 to 24 Years | 227 (8.4%) | 180 (6.6%) |
| 25 to 29 Years | 140 (5.2%) | 148 (5.4%) |
| 30 to 34 Years | 116 (4.3%) | 149 (5.4%) |
| 35 to 39 Years | 122 (4.5%) | 181 (6.6%) |
| 40 to 44 Years | 127 (4.7%) | 329 (12.0%) |
| 45 to 49 Years | 205 (7.6%) | 107 (3.9%) |
| 50 to 54 Years | 295 (10.9%) | 137 (5.0%) |
| 55 to 59 Years | 65 (2.4%) | 171 (6.3%) |
| 60 to 64 Years | 83 (3.1%) | 123 (4.5%) |
| 65 to 69 Years | 114 (4.2%) | 158 (5.8%) |
| 70 to 74 Years | 194 (7.2%) | 223 (8.2%) |
| 75 to 79 Years | 23 (0.9%) | 41 (1.5%) |
| 80 to 84 Years | 29 (1.1%) | 82 (3.0%) |
| 85 Years and over | 23 (0.9%) | 119 (4.4%) |
| Total | 2,708 (100.0%) | 2,732 (100.0%) |
Families and Households in Ripley
Median Family Size in Ripley
The median family size in Ripley is 3.26 persons per family, with single female/mother families (204 | 16.0%) accounting for the largest median family size of 3.4 persons per family. On the other hand, single male/father families (122 | 9.6%) represent the smallest median family size with 2.95 persons per family.
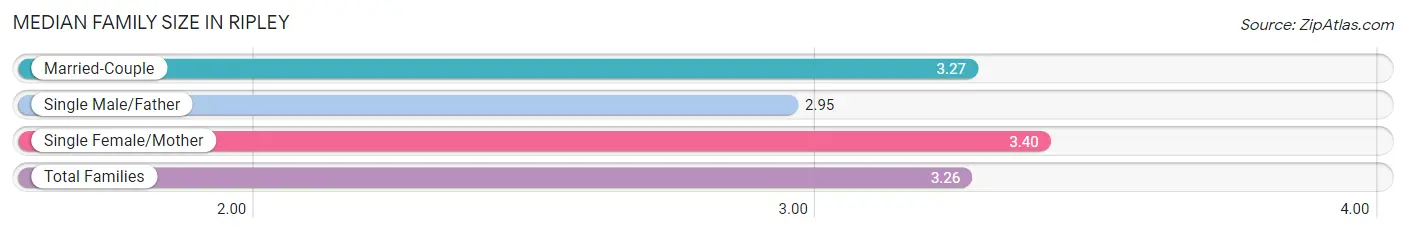
| Family Type | # Families | Family Size |
| Married-Couple | 950 (74.5%) | 3.27 |
| Single Male/Father | 122 (9.6%) | 2.95 |
| Single Female/Mother | 204 (16.0%) | 3.40 |
| Total Families | 1,276 (100.0%) | 3.26 |
Median Household Size in Ripley
The median household size in Ripley is 2.56 persons per household, with single male/father households (122 | 5.9%) accounting for the largest median household size of 3.83 persons per household. non-family households (782 | 38.0%) represent the smallest median household size with 1.11 persons per household.
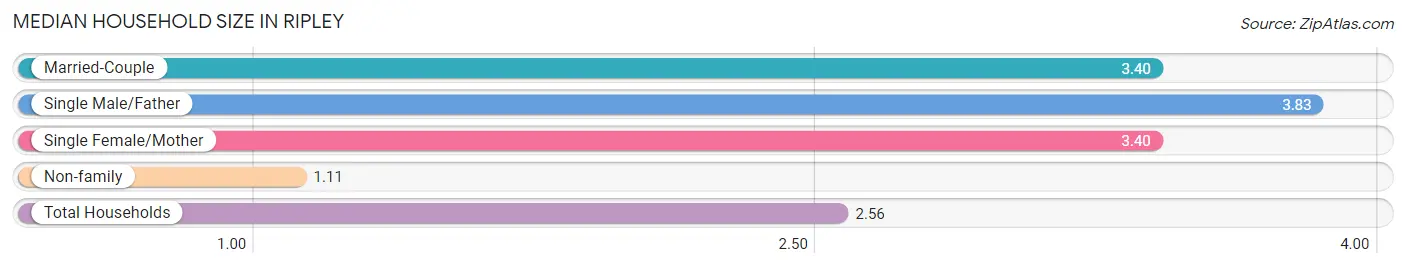
| Household Type | # Households | Household Size |
| Married-Couple | 950 (46.2%) | 3.40 |
| Single Male/Father | 122 (5.9%) | 3.83 |
| Single Female/Mother | 204 (9.9%) | 3.40 |
| Non-family | 782 (38.0%) | 1.11 |
| Total Households | 2,058 (100.0%) | 2.56 |
Household Size by Marriage Status in Ripley
Out of a total of 2,058 households in Ripley, 1,276 (62.0%) are family households, while 782 (38.0%) are nonfamily households. The most numerous type of family households are 2-person households, comprising 654, and the most common type of nonfamily households are 1-person households, comprising 710.
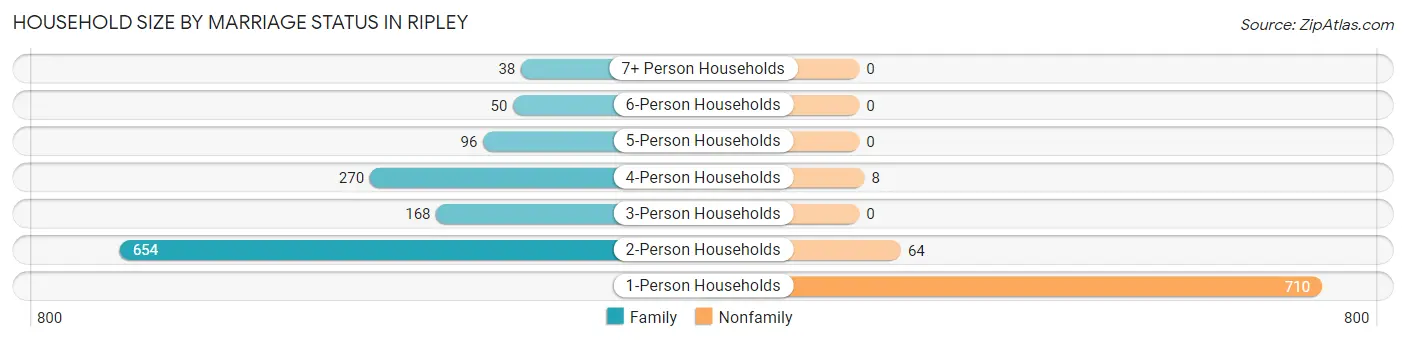
| Household Size | Family Households | Nonfamily Households |
| 1-Person Households | - | 710 (34.5%) |
| 2-Person Households | 654 (31.8%) | 64 (3.1%) |
| 3-Person Households | 168 (8.2%) | 0 (0.0%) |
| 4-Person Households | 270 (13.1%) | 8 (0.4%) |
| 5-Person Households | 96 (4.7%) | 0 (0.0%) |
| 6-Person Households | 50 (2.4%) | 0 (0.0%) |
| 7+ Person Households | 38 (1.8%) | 0 (0.0%) |
| Total | 1,276 (62.0%) | 782 (38.0%) |
Female Fertility in Ripley
Fertility by Age in Ripley
| Age Bracket | Women with Births | Births / 1,000 Women |
| 15 to 19 years | 0 (0.0%) | 0.0 |
| 20 to 34 years | 0 (0.0%) | 0.0 |
| 35 to 50 years | 0 (0.0%) | 0.0 |
| Total | 0 (0.0%) | 0.0 |
Fertility by Age by Marriage Status in Ripley
| Age Bracket | Married | Unmarried |
| 15 to 19 years | 0 (0.0%) | 0 (0.0%) |
| 20 to 34 years | 0 (0.0%) | 0 (0.0%) |
| 35 to 50 years | 0 (0.0%) | 0 (0.0%) |
| Total | 0 (0.0%) | 0 (0.0%) |
Fertility by Education in Ripley
| Educational Attainment | Women with Births | Births / 1,000 Women |
| Less than High School | 0 (0.0%) | 0.0 |
| High School Diploma | 0 (0.0%) | 0.0 |
| College or Associate's Degree | 0 (0.0%) | 0.0 |
| Bachelor's Degree | 0 (0.0%) | 0.0 |
| Graduate Degree | 0 (0.0%) | 0.0 |
| Total | 0 (0.0%) | 0.0 |
Fertility by Education by Marriage Status in Ripley
| Educational Attainment | Married | Unmarried |
| Less than High School | 0 (0.0%) | 0 (0.0%) |
| High School Diploma | 0 (0.0%) | 0 (0.0%) |
| College or Associate's Degree | 0 (0.0%) | 0 (0.0%) |
| Bachelor's Degree | 0 (0.0%) | 0 (0.0%) |
| Graduate Degree | 0 (0.0%) | 0 (0.0%) |
| Total | 0 (0.0%) | 0 (0.0%) |
Employment Characteristics in Ripley
Employment by Class of Employer in Ripley
Among the 2,618 employed individuals in Ripley, private company employees (1,842 | 70.4%), state government employees (205 | 7.8%), and self-employed (not incorporated) (200 | 7.6%) make up the most common classes of employment.
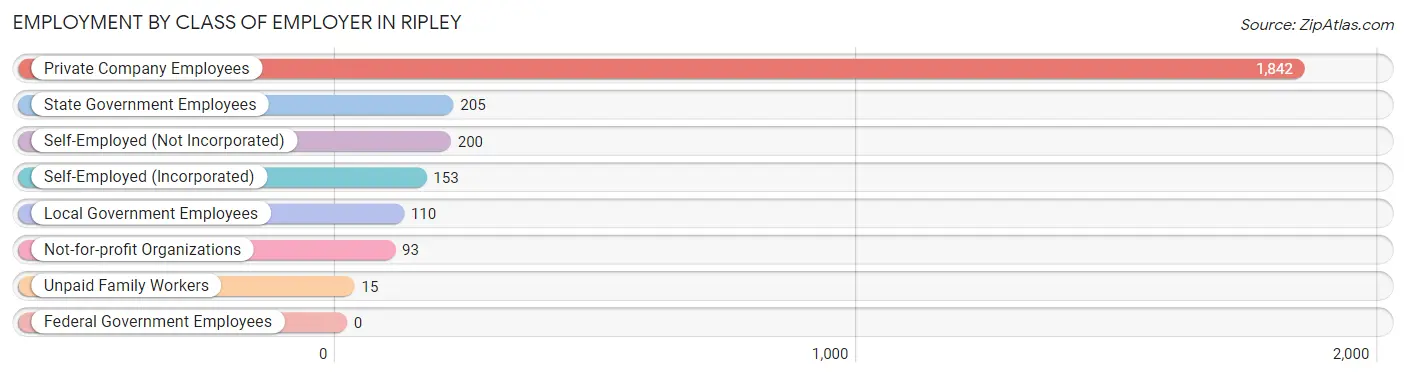
| Employer Class | # Employees | % Employees |
| Private Company Employees | 1,842 | 70.4% |
| Self-Employed (Incorporated) | 153 | 5.8% |
| Self-Employed (Not Incorporated) | 200 | 7.6% |
| Not-for-profit Organizations | 93 | 3.5% |
| Local Government Employees | 110 | 4.2% |
| State Government Employees | 205 | 7.8% |
| Federal Government Employees | 0 | 0.0% |
| Unpaid Family Workers | 15 | 0.6% |
| Total | 2,618 | 100.0% |
Employment Status by Age in Ripley
According to the labor force statistics for Ripley, out of the total population over 16 years of age (4,301), 67.6% or 2,907 individuals are in the labor force, with 9.6% or 279 of them unemployed. The age group with the highest labor force participation rate is 25 to 29 years, with 94.4% or 272 individuals in the labor force. Within the labor force, the 16 to 19 years age range has the highest percentage of unemployed individuals, with 29.7% or 22 of them being unemployed.
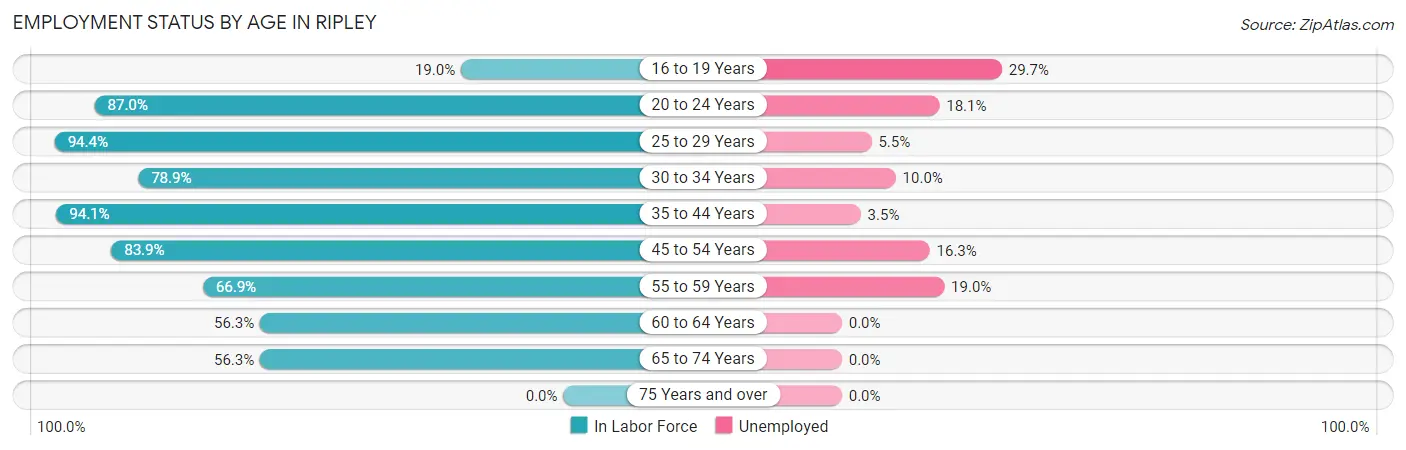
| Age Bracket | In Labor Force | Unemployed |
| 16 to 19 Years | 74 (19.0%) | 22 (29.7%) |
| 20 to 24 Years | 354 (87.0%) | 64 (18.1%) |
| 25 to 29 Years | 272 (94.4%) | 15 (5.5%) |
| 30 to 34 Years | 209 (78.9%) | 21 (10.0%) |
| 35 to 44 Years | 714 (94.1%) | 25 (3.5%) |
| 45 to 54 Years | 624 (83.9%) | 102 (16.3%) |
| 55 to 59 Years | 158 (66.9%) | 30 (19.0%) |
| 60 to 64 Years | 116 (56.3%) | 0 (0.0%) |
| 65 to 74 Years | 388 (56.3%) | 0 (0.0%) |
| 75 Years and over | 0 (0.0%) | 0 (0.0%) |
| Total | 2,907 (67.6%) | 279 (9.6%) |
Employment Status by Educational Attainment in Ripley
According to labor force statistics for Ripley, 83.8% of individuals (2,093) out of the total population between 25 and 64 years of age (2,498) are in the labor force, with 9.2% or 193 of them being unemployed. The group with the highest labor force participation rate are those with the educational attainment of less than high school, with 94.1% or 639 individuals in the labor force. Within the labor force, individuals with less than high school education have the highest percentage of unemployment, with 17.1% or 109 of them being unemployed.
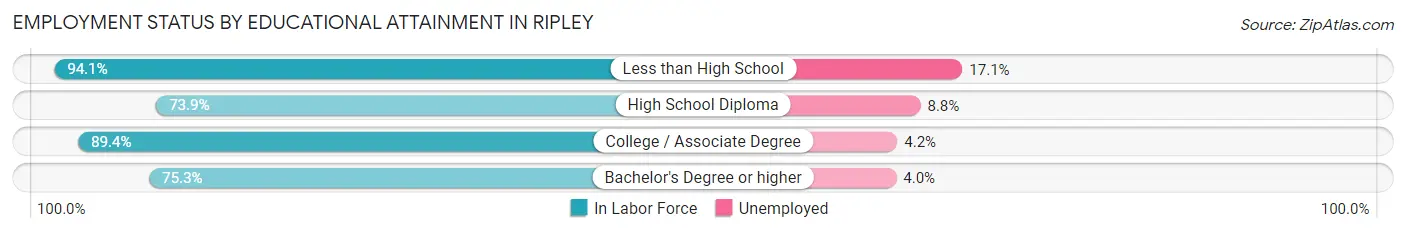
| Educational Attainment | In Labor Force | Unemployed |
| Less than High School | 639 (94.1%) | 116 (17.1%) |
| High School Diploma | 510 (73.9%) | 61 (8.8%) |
| College / Associate Degree | 597 (89.4%) | 28 (4.2%) |
| Bachelor's Degree or higher | 347 (75.3%) | 18 (4.0%) |
| Total | 2,093 (83.8%) | 230 (9.2%) |
Employment Occupations by Sex in Ripley
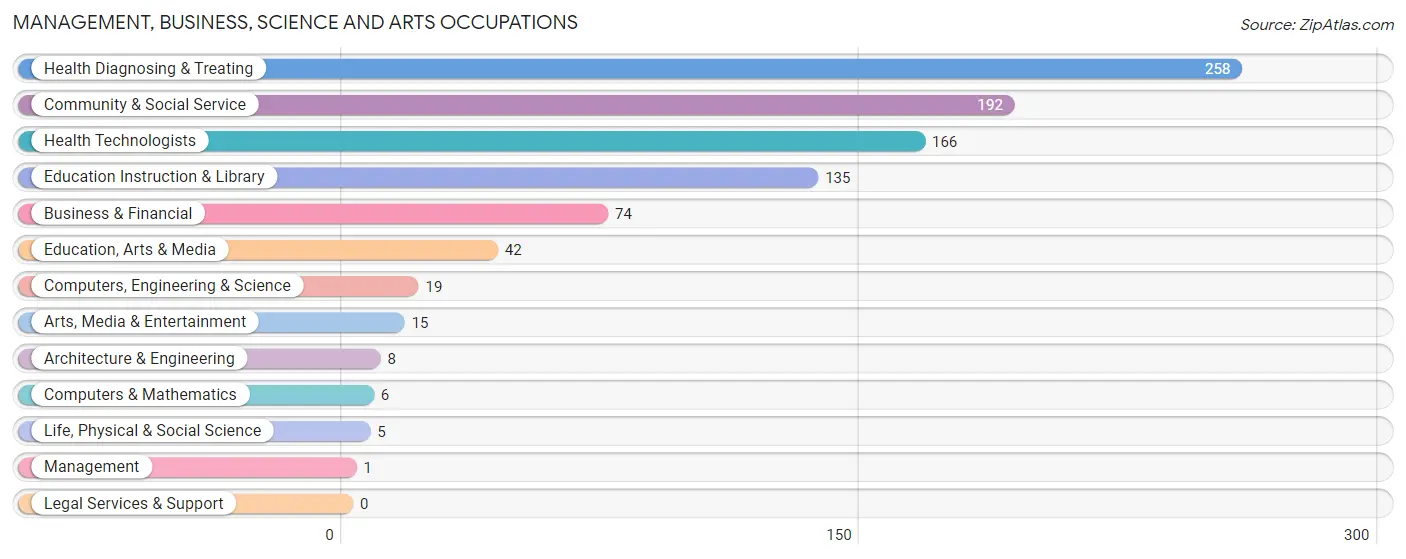
Management, Business, Science and Arts Occupations
The most common Management, Business, Science and Arts occupations in Ripley are Health Diagnosing & Treating (258 | 9.8%), Community & Social Service (192 | 7.3%), Health Technologists (166 | 6.3%), Education Instruction & Library (135 | 5.1%), and Business & Financial (74 | 2.8%).
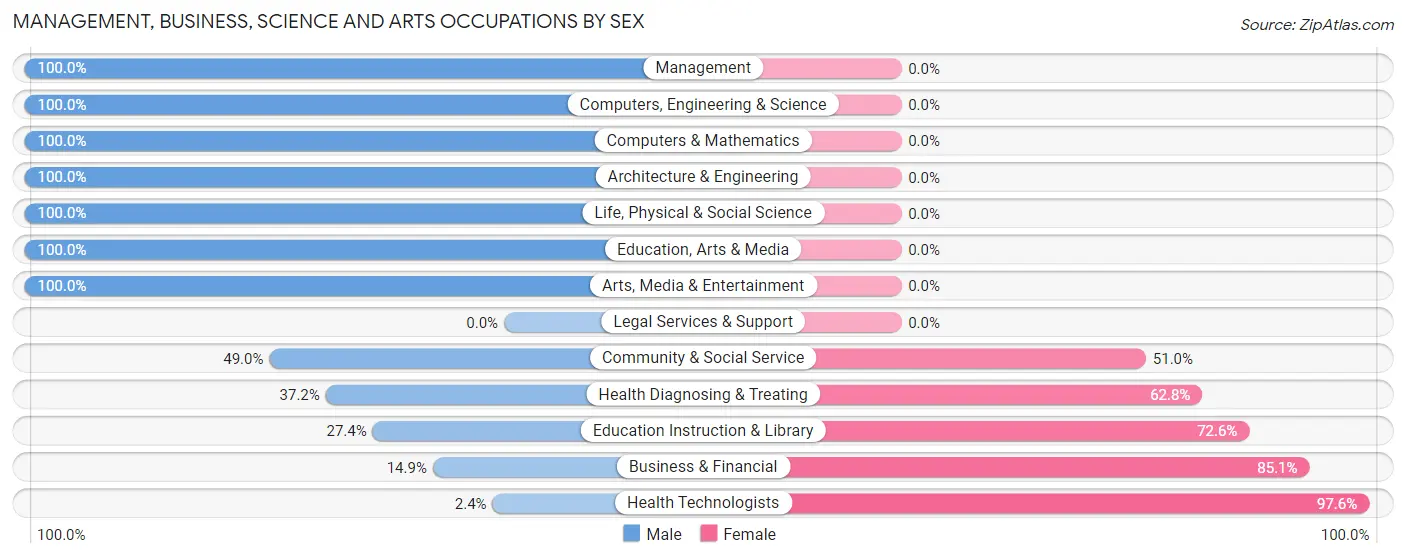
Management, Business, Science and Arts Occupations by Sex
Within the Management, Business, Science and Arts occupations in Ripley, the most male-oriented occupations are Management (100.0%), Computers, Engineering & Science (100.0%), and Computers & Mathematics (100.0%), while the most female-oriented occupations are Health Technologists (97.6%), Business & Financial (85.1%), and Education Instruction & Library (72.6%).
| Occupation | Male | Female |
| Management | 1 (100.0%) | 0 (0.0%) |
| Business & Financial | 11 (14.9%) | 63 (85.1%) |
| Computers, Engineering & Science | 19 (100.0%) | 0 (0.0%) |
| Computers & Mathematics | 6 (100.0%) | 0 (0.0%) |
| Architecture & Engineering | 8 (100.0%) | 0 (0.0%) |
| Life, Physical & Social Science | 5 (100.0%) | 0 (0.0%) |
| Community & Social Service | 94 (49.0%) | 98 (51.0%) |
| Education, Arts & Media | 42 (100.0%) | 0 (0.0%) |
| Legal Services & Support | 0 (0.0%) | 0 (0.0%) |
| Education Instruction & Library | 37 (27.4%) | 98 (72.6%) |
| Arts, Media & Entertainment | 15 (100.0%) | 0 (0.0%) |
| Health Diagnosing & Treating | 96 (37.2%) | 162 (62.8%) |
| Health Technologists | 4 (2.4%) | 162 (97.6%) |
| Total (Category) | 221 (40.6%) | 323 (59.4%) |
| Total (Overall) | 1,376 (52.3%) | 1,254 (47.7%) |
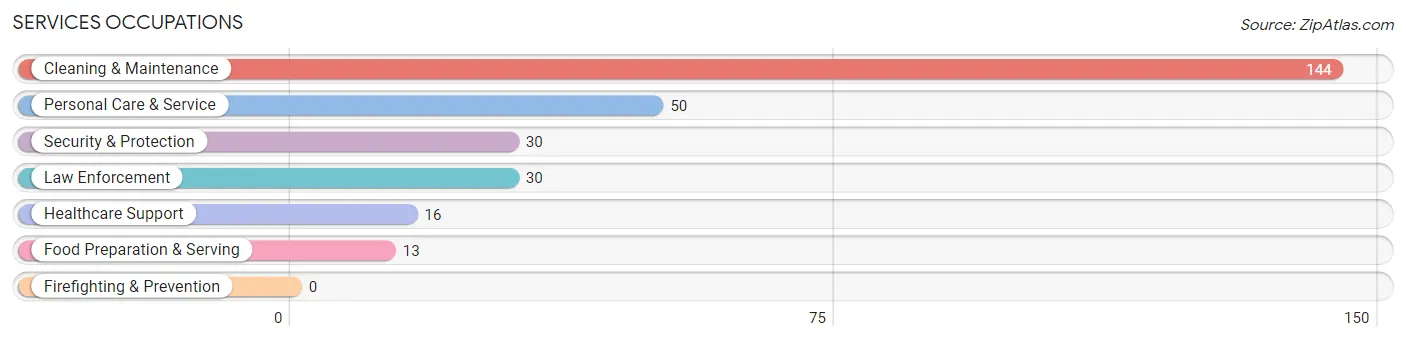
Services Occupations
The most common Services occupations in Ripley are Cleaning & Maintenance (144 | 5.5%), Personal Care & Service (50 | 1.9%), Security & Protection (30 | 1.1%), Law Enforcement (30 | 1.1%), and Healthcare Support (16 | 0.6%).
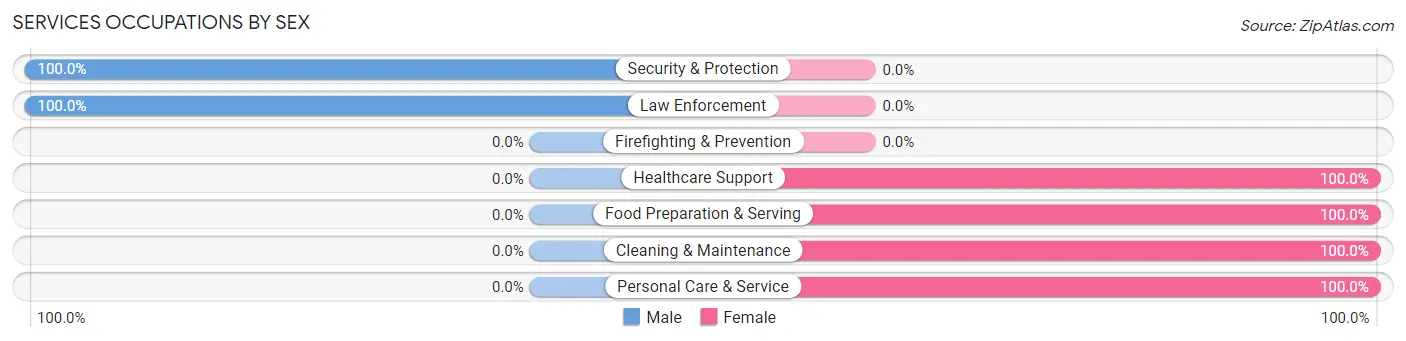
Services Occupations by Sex
Within the Services occupations in Ripley, the most male-oriented occupations are Security & Protection (100.0%), and Law Enforcement (100.0%), while the most female-oriented occupations are Healthcare Support (100.0%), Food Preparation & Serving (100.0%), and Cleaning & Maintenance (100.0%).
| Occupation | Male | Female |
| Healthcare Support | 0 (0.0%) | 16 (100.0%) |
| Security & Protection | 30 (100.0%) | 0 (0.0%) |
| Firefighting & Prevention | 0 (0.0%) | 0 (0.0%) |
| Law Enforcement | 30 (100.0%) | 0 (0.0%) |
| Food Preparation & Serving | 0 (0.0%) | 13 (100.0%) |
| Cleaning & Maintenance | 0 (0.0%) | 144 (100.0%) |
| Personal Care & Service | 0 (0.0%) | 50 (100.0%) |
| Total (Category) | 30 (11.9%) | 223 (88.1%) |
| Total (Overall) | 1,376 (52.3%) | 1,254 (47.7%) |
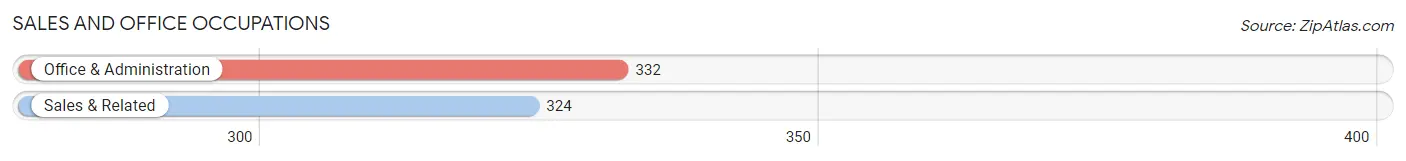
Sales and Office Occupations
The most common Sales and Office occupations in Ripley are Office & Administration (332 | 12.6%), and Sales & Related (324 | 12.3%).
Sales and Office Occupations by Sex
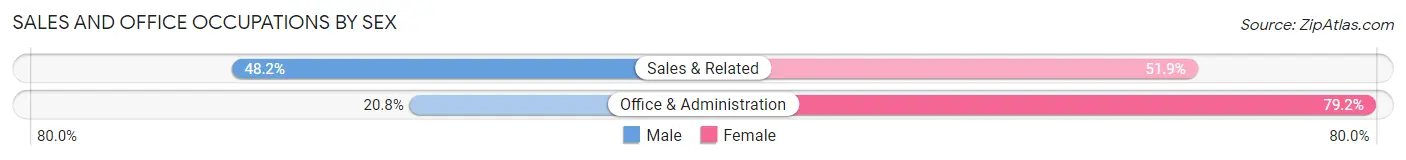
| Occupation | Male | Female |
| Sales & Related | 156 (48.1%) | 168 (51.8%) |
| Office & Administration | 69 (20.8%) | 263 (79.2%) |
| Total (Category) | 225 (34.3%) | 431 (65.7%) |
| Total (Overall) | 1,376 (52.3%) | 1,254 (47.7%) |
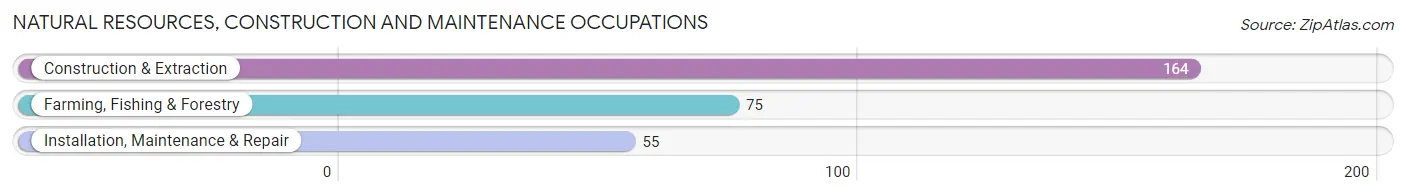
Natural Resources, Construction and Maintenance Occupations
The most common Natural Resources, Construction and Maintenance occupations in Ripley are Construction & Extraction (164 | 6.2%), Farming, Fishing & Forestry (75 | 2.9%), and Installation, Maintenance & Repair (55 | 2.1%).
Natural Resources, Construction and Maintenance Occupations by Sex
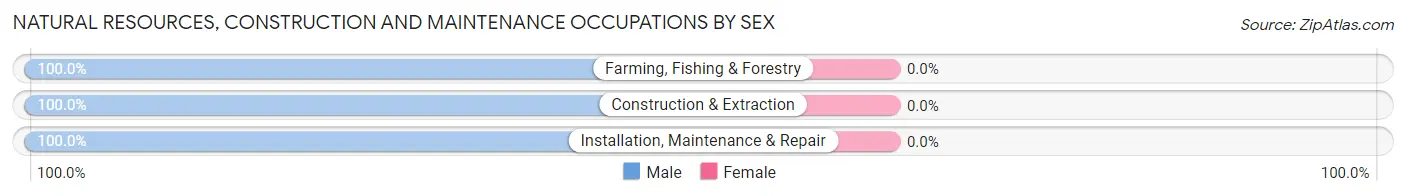
| Occupation | Male | Female |
| Farming, Fishing & Forestry | 75 (100.0%) | 0 (0.0%) |
| Construction & Extraction | 164 (100.0%) | 0 (0.0%) |
| Installation, Maintenance & Repair | 55 (100.0%) | 0 (0.0%) |
| Total (Category) | 294 (100.0%) | 0 (0.0%) |
| Total (Overall) | 1,376 (52.3%) | 1,254 (47.7%) |
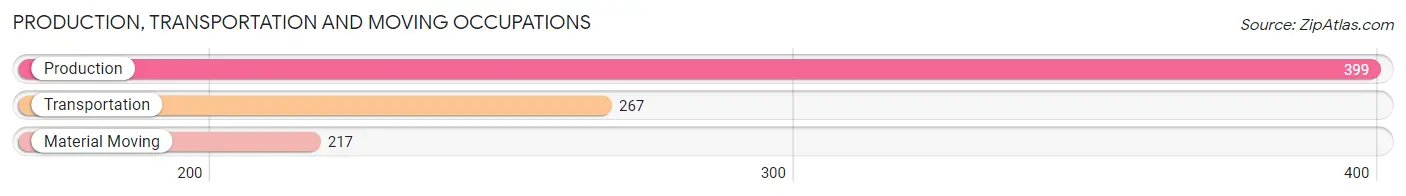
Production, Transportation and Moving Occupations
The most common Production, Transportation and Moving occupations in Ripley are Production (399 | 15.2%), Transportation (267 | 10.2%), and Material Moving (217 | 8.3%).
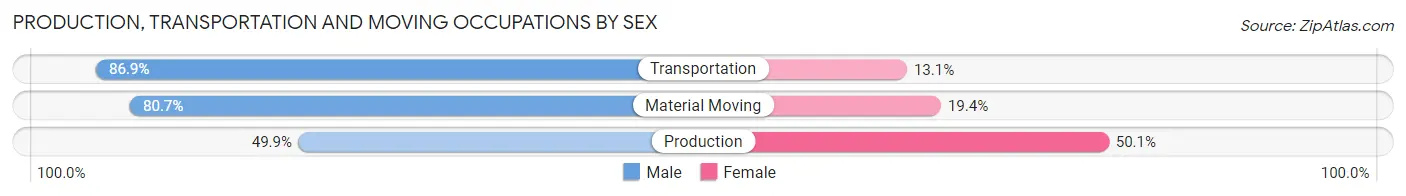
Production, Transportation and Moving Occupations by Sex
| Occupation | Male | Female |
| Production | 199 (49.9%) | 200 (50.1%) |
| Transportation | 232 (86.9%) | 35 (13.1%) |
| Material Moving | 175 (80.6%) | 42 (19.4%) |
| Total (Category) | 606 (68.6%) | 277 (31.4%) |
| Total (Overall) | 1,376 (52.3%) | 1,254 (47.7%) |
Employment Industries by Sex in Ripley
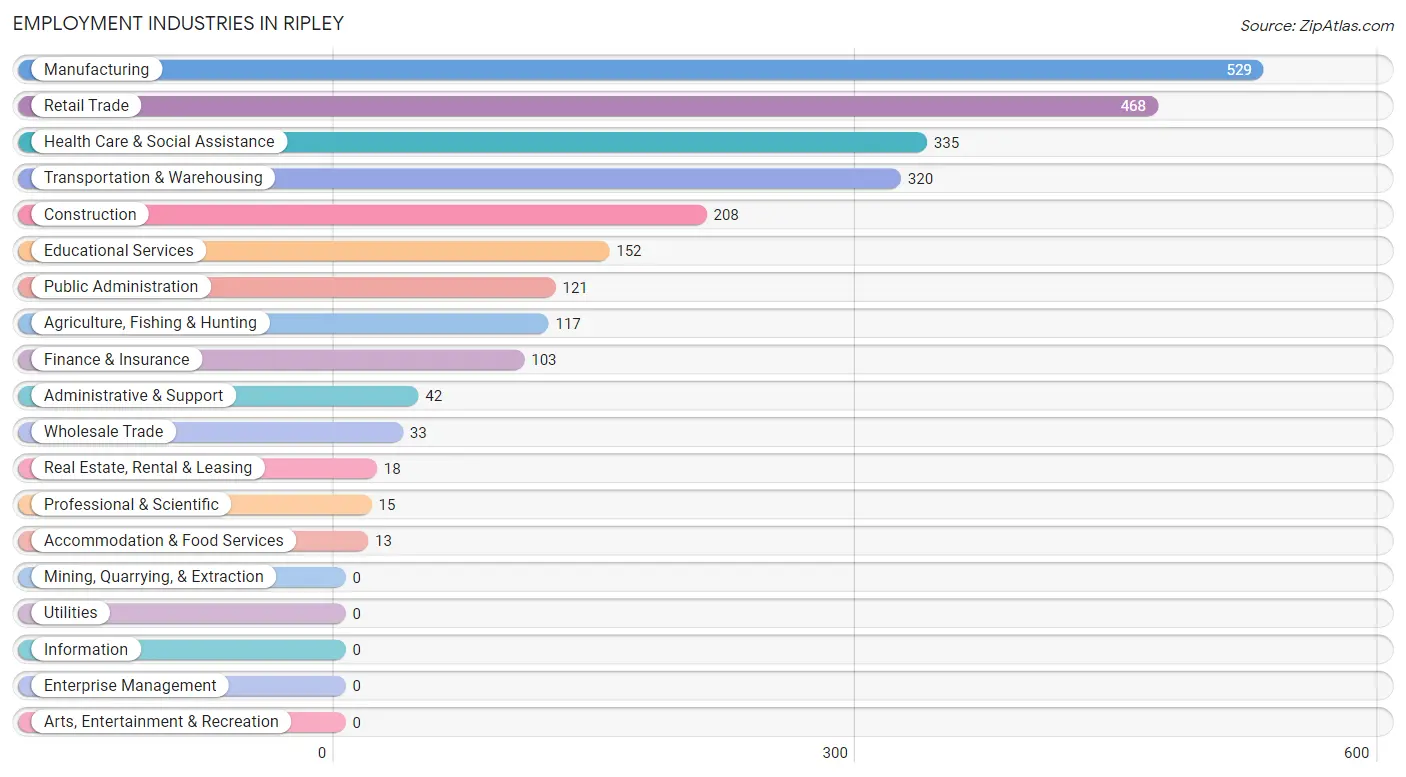
Employment Industries in Ripley
The major employment industries in Ripley include Manufacturing (529 | 20.1%), Retail Trade (468 | 17.8%), Health Care & Social Assistance (335 | 12.7%), Transportation & Warehousing (320 | 12.2%), and Construction (208 | 7.9%).
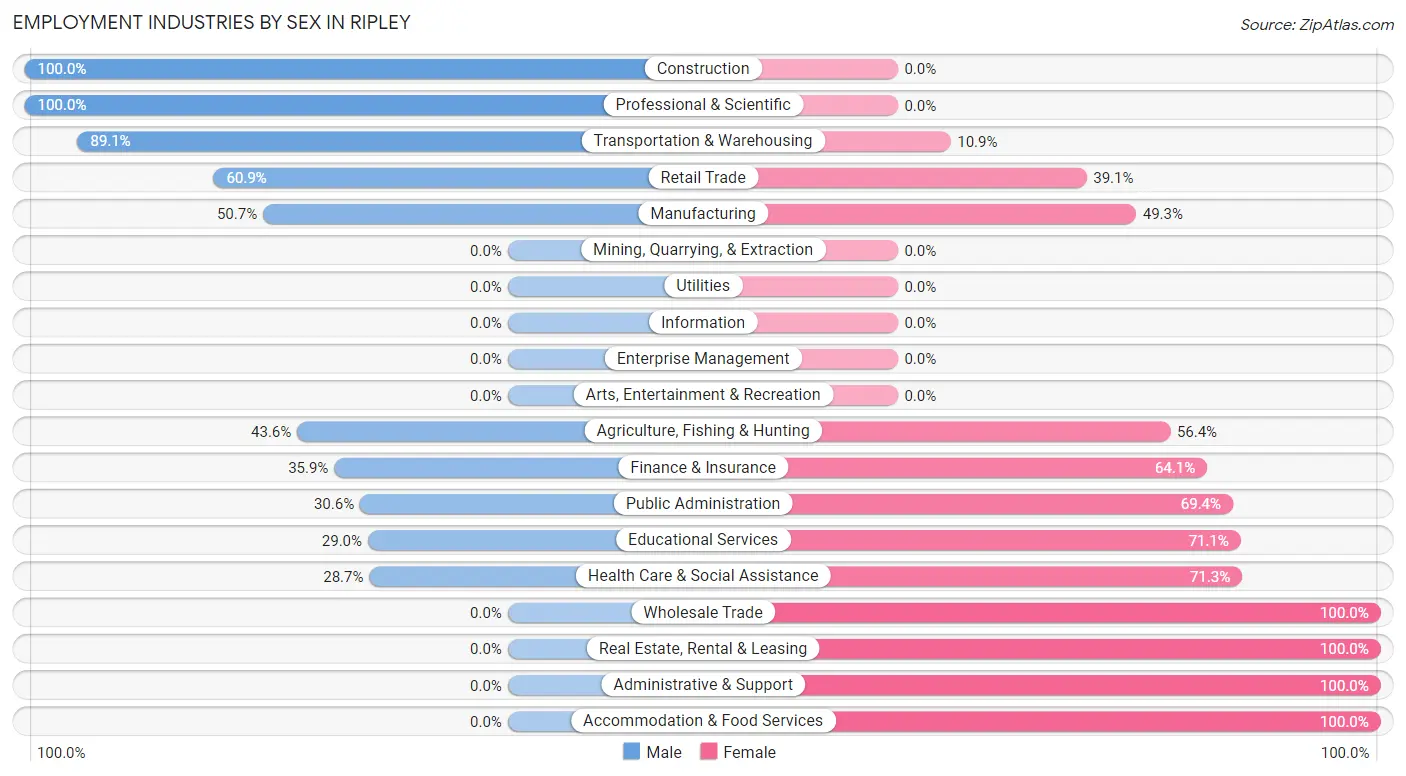
Employment Industries by Sex in Ripley
The Ripley industries that see more men than women are Construction (100.0%), Professional & Scientific (100.0%), and Transportation & Warehousing (89.1%), whereas the industries that tend to have a higher number of women are Wholesale Trade (100.0%), Real Estate, Rental & Leasing (100.0%), and Administrative & Support (100.0%).
| Industry | Male | Female |
| Agriculture, Fishing & Hunting | 51 (43.6%) | 66 (56.4%) |
| Mining, Quarrying, & Extraction | 0 (0.0%) | 0 (0.0%) |
| Construction | 208 (100.0%) | 0 (0.0%) |
| Manufacturing | 268 (50.7%) | 261 (49.3%) |
| Wholesale Trade | 0 (0.0%) | 33 (100.0%) |
| Retail Trade | 285 (60.9%) | 183 (39.1%) |
| Transportation & Warehousing | 285 (89.1%) | 35 (10.9%) |
| Utilities | 0 (0.0%) | 0 (0.0%) |
| Information | 0 (0.0%) | 0 (0.0%) |
| Finance & Insurance | 37 (35.9%) | 66 (64.1%) |
| Real Estate, Rental & Leasing | 0 (0.0%) | 18 (100.0%) |
| Professional & Scientific | 15 (100.0%) | 0 (0.0%) |
| Enterprise Management | 0 (0.0%) | 0 (0.0%) |
| Administrative & Support | 0 (0.0%) | 42 (100.0%) |
| Educational Services | 44 (28.9%) | 108 (71.1%) |
| Health Care & Social Assistance | 96 (28.7%) | 239 (71.3%) |
| Arts, Entertainment & Recreation | 0 (0.0%) | 0 (0.0%) |
| Accommodation & Food Services | 0 (0.0%) | 13 (100.0%) |
| Public Administration | 37 (30.6%) | 84 (69.4%) |
| Total | 1,376 (52.3%) | 1,254 (47.7%) |
Education in Ripley
School Enrollment in Ripley
The most common levels of schooling among the 1,342 students in Ripley are high school (445 | 33.2%), middle school (374 | 27.9%), and kindergarten (183 | 13.6%).
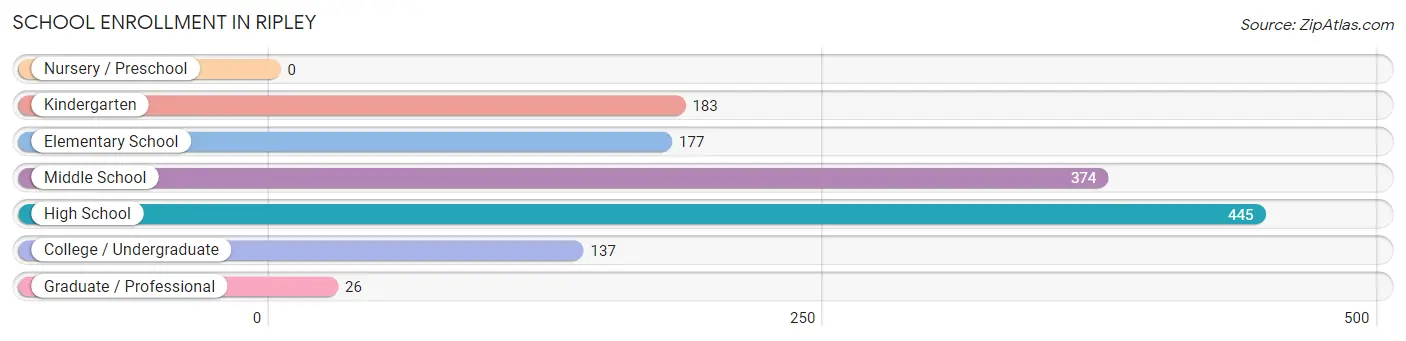
| School Level | # Students | % Students |
| Nursery / Preschool | 0 | 0.0% |
| Kindergarten | 183 | 13.6% |
| Elementary School | 177 | 13.2% |
| Middle School | 374 | 27.9% |
| High School | 445 | 33.2% |
| College / Undergraduate | 137 | 10.2% |
| Graduate / Professional | 26 | 1.9% |
| Total | 1,342 | 100.0% |
School Enrollment by Age by Funding Source in Ripley
Out of a total of 1,342 students who are enrolled in schools in Ripley, 228 (17.0%) attend a private institution, while the remaining 1,114 (83.0%) are enrolled in public schools. The age group of 25 to 34 year olds has the highest likelihood of being enrolled in private schools, with 10 (23.8% in the age bracket) enrolled. Conversely, the age group of 3 to 4 year olds has the lowest likelihood of being enrolled in a private school, with 17 (100.0% in the age bracket) attending a public institution.
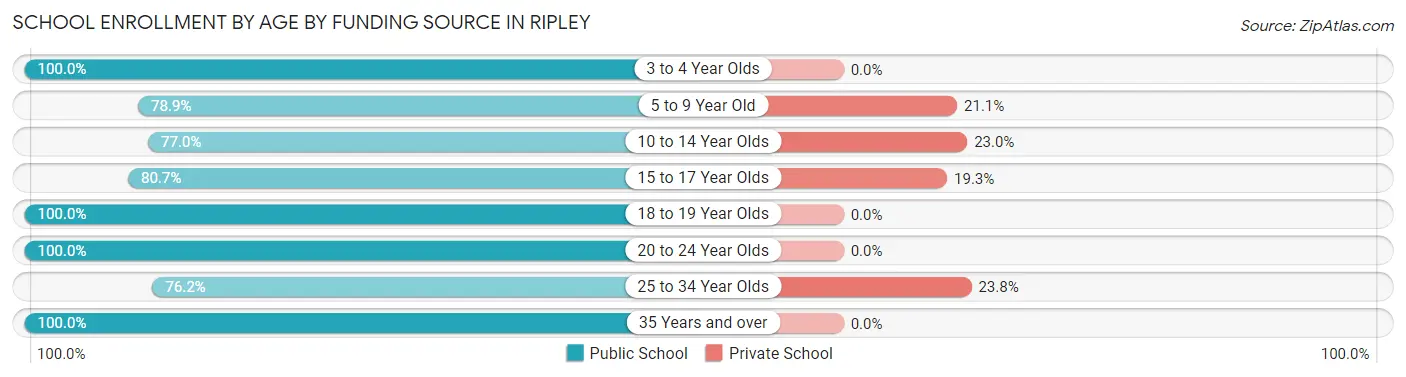
| Age Bracket | Public School | Private School |
| 3 to 4 Year Olds | 17 (100.0%) | 0 (0.0%) |
| 5 to 9 Year Old | 209 (78.9%) | 56 (21.1%) |
| 10 to 14 Year Olds | 348 (77.0%) | 104 (23.0%) |
| 15 to 17 Year Olds | 243 (80.7%) | 58 (19.3%) |
| 18 to 19 Year Olds | 129 (100.0%) | 0 (0.0%) |
| 20 to 24 Year Olds | 47 (100.0%) | 0 (0.0%) |
| 25 to 34 Year Olds | 32 (76.2%) | 10 (23.8%) |
| 35 Years and over | 89 (100.0%) | 0 (0.0%) |
| Total | 1,114 (83.0%) | 228 (17.0%) |
Educational Attainment by Field of Study in Ripley
Education (295 | 43.2%), science & technology (137 | 20.1%), psychology (74 | 10.8%), liberal arts & history (49 | 7.2%), and business (44 | 6.4%) are the most common fields of study among 683 individuals in Ripley who have obtained a bachelor's degree or higher.
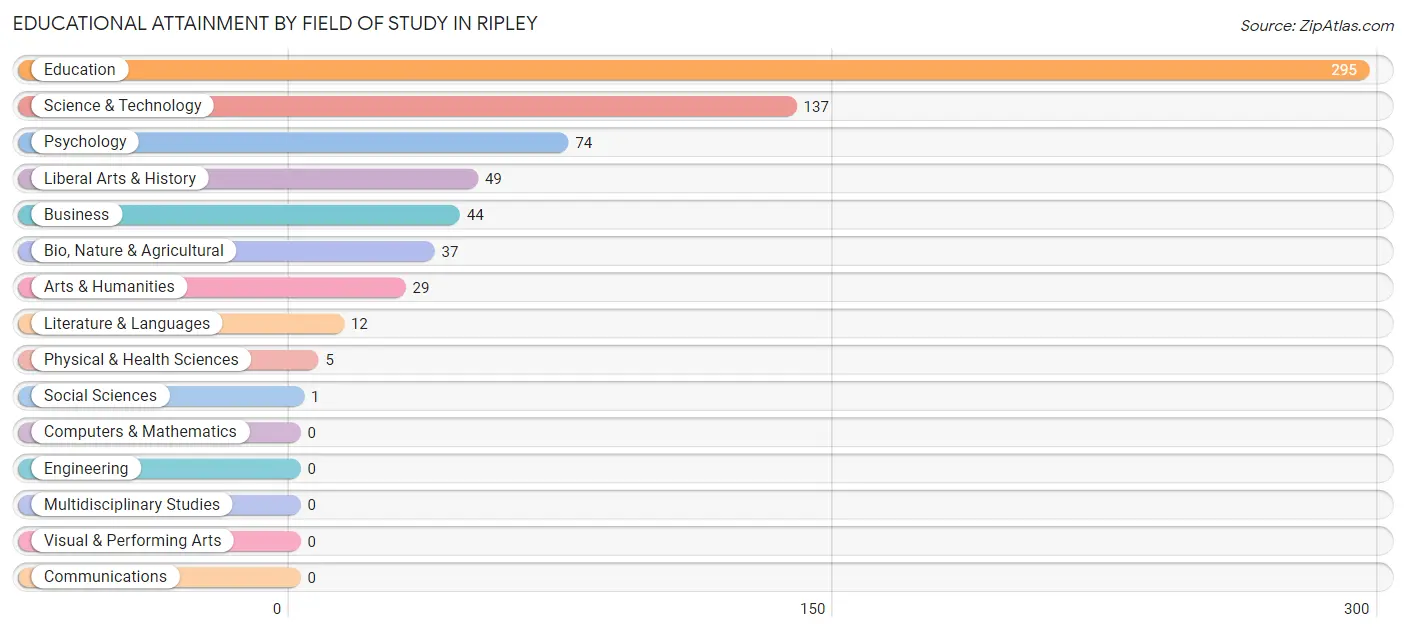
| Field of Study | # Graduates | % Graduates |
| Computers & Mathematics | 0 | 0.0% |
| Bio, Nature & Agricultural | 37 | 5.4% |
| Physical & Health Sciences | 5 | 0.7% |
| Psychology | 74 | 10.8% |
| Social Sciences | 1 | 0.2% |
| Engineering | 0 | 0.0% |
| Multidisciplinary Studies | 0 | 0.0% |
| Science & Technology | 137 | 20.1% |
| Business | 44 | 6.4% |
| Education | 295 | 43.2% |
| Literature & Languages | 12 | 1.8% |
| Liberal Arts & History | 49 | 7.2% |
| Visual & Performing Arts | 0 | 0.0% |
| Communications | 0 | 0.0% |
| Arts & Humanities | 29 | 4.3% |
| Total | 683 | 100.0% |
Transportation & Commute in Ripley
Vehicle Availability by Sex in Ripley
The most prevalent vehicle ownership categories in Ripley are males with 2 vehicles (516, accounting for 37.5%) and females with 2 vehicles (464, making up 41.5%).
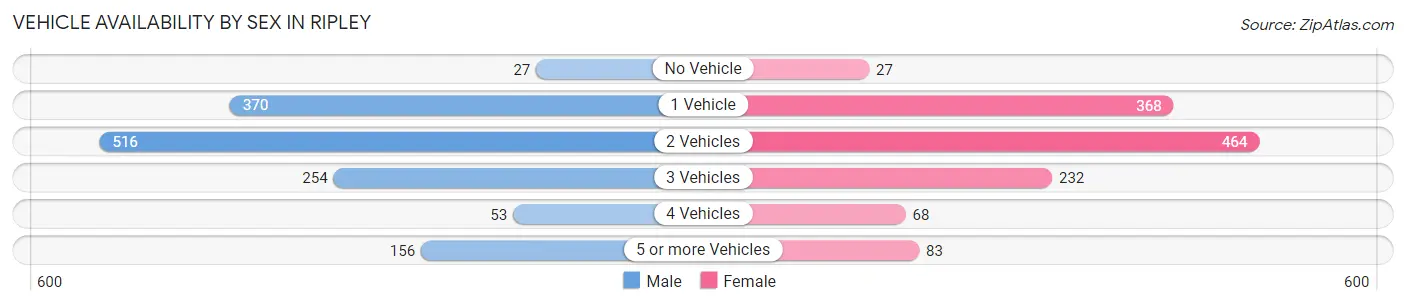
| Vehicles Available | Male | Female |
| No Vehicle | 27 (2.0%) | 27 (2.2%) |
| 1 Vehicle | 370 (26.9%) | 368 (29.6%) |
| 2 Vehicles | 516 (37.5%) | 464 (37.4%) |
| 3 Vehicles | 254 (18.5%) | 232 (18.7%) |
| 4 Vehicles | 53 (3.8%) | 68 (5.5%) |
| 5 or more Vehicles | 156 (11.3%) | 83 (6.7%) |
| Total | 1,376 (100.0%) | 1,242 (100.0%) |
Commute Time in Ripley
The most frequently occuring commute durations in Ripley are 10 to 14 minutes (588 commuters, 22.9%), 5 to 9 minutes (465 commuters, 18.1%), and 30 to 34 minutes (442 commuters, 17.2%).
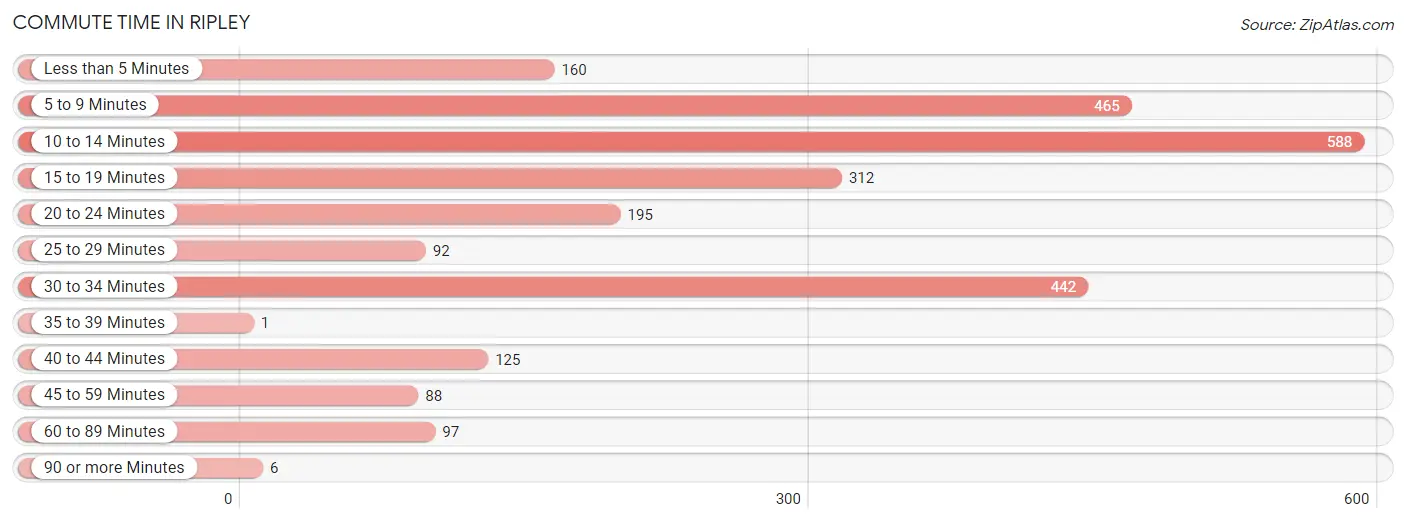
| Commute Time | # Commuters | % Commuters |
| Less than 5 Minutes | 160 | 6.2% |
| 5 to 9 Minutes | 465 | 18.1% |
| 10 to 14 Minutes | 588 | 22.9% |
| 15 to 19 Minutes | 312 | 12.1% |
| 20 to 24 Minutes | 195 | 7.6% |
| 25 to 29 Minutes | 92 | 3.6% |
| 30 to 34 Minutes | 442 | 17.2% |
| 35 to 39 Minutes | 1 | 0.0% |
| 40 to 44 Minutes | 125 | 4.9% |
| 45 to 59 Minutes | 88 | 3.4% |
| 60 to 89 Minutes | 97 | 3.8% |
| 90 or more Minutes | 6 | 0.2% |
Commute Time by Sex in Ripley
The most common commute times in Ripley are 10 to 14 minutes (303 commuters, 22.1%) for males and 10 to 14 minutes (285 commuters, 23.8%) for females.
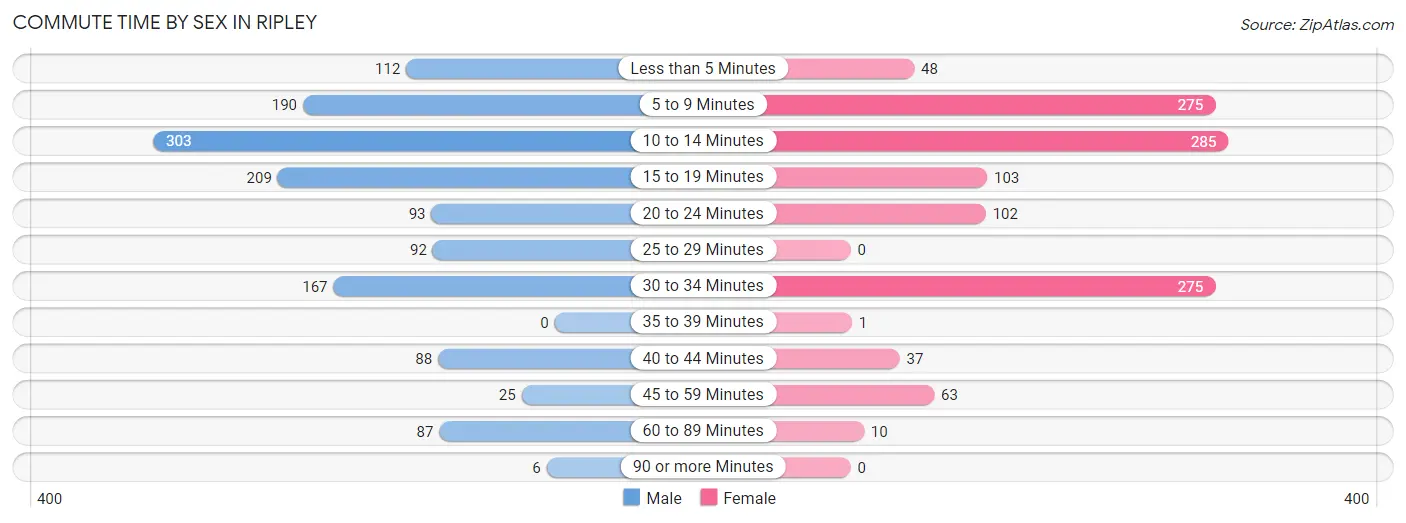
| Commute Time | Male | Female |
| Less than 5 Minutes | 112 (8.2%) | 48 (4.0%) |
| 5 to 9 Minutes | 190 (13.9%) | 275 (22.9%) |
| 10 to 14 Minutes | 303 (22.1%) | 285 (23.8%) |
| 15 to 19 Minutes | 209 (15.2%) | 103 (8.6%) |
| 20 to 24 Minutes | 93 (6.8%) | 102 (8.5%) |
| 25 to 29 Minutes | 92 (6.7%) | 0 (0.0%) |
| 30 to 34 Minutes | 167 (12.2%) | 275 (22.9%) |
| 35 to 39 Minutes | 0 (0.0%) | 1 (0.1%) |
| 40 to 44 Minutes | 88 (6.4%) | 37 (3.1%) |
| 45 to 59 Minutes | 25 (1.8%) | 63 (5.2%) |
| 60 to 89 Minutes | 87 (6.3%) | 10 (0.8%) |
| 90 or more Minutes | 6 (0.4%) | 0 (0.0%) |
Time of Departure to Work by Sex in Ripley
The most frequent times of departure to work in Ripley are 6:00 AM to 6:29 AM (269, 19.6%) for males and 7:00 AM to 7:29 AM (337, 28.1%) for females.
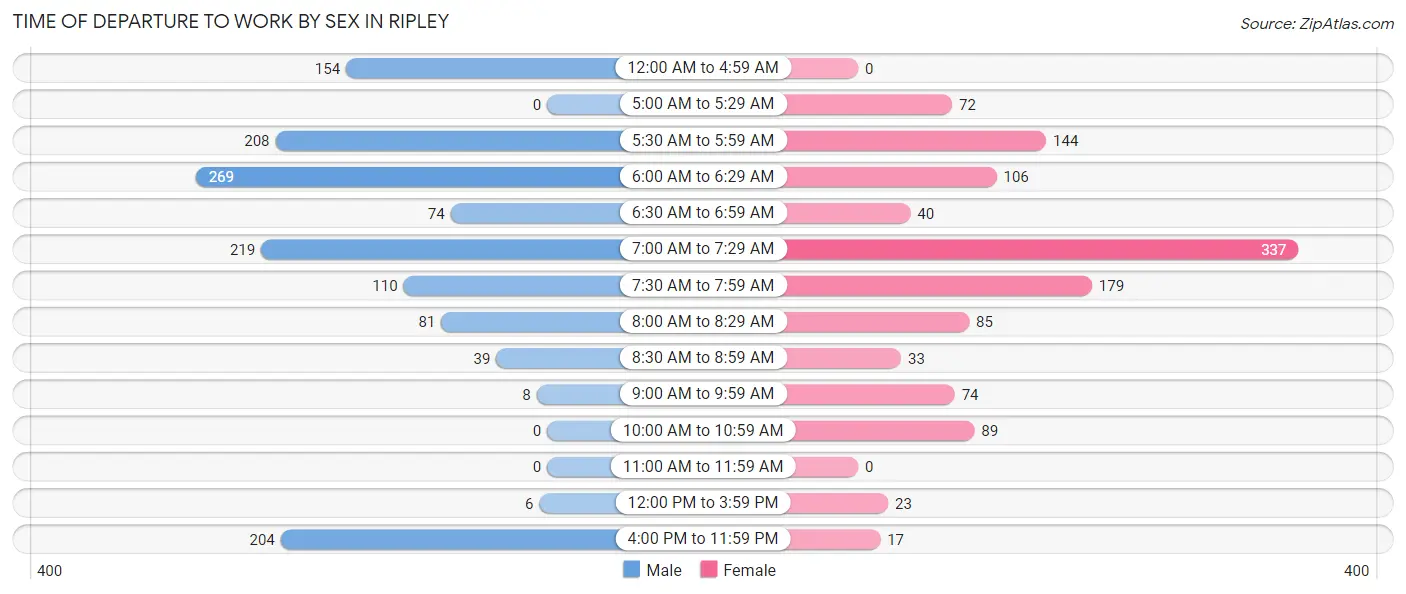
| Time of Departure | Male | Female |
| 12:00 AM to 4:59 AM | 154 (11.2%) | 0 (0.0%) |
| 5:00 AM to 5:29 AM | 0 (0.0%) | 72 (6.0%) |
| 5:30 AM to 5:59 AM | 208 (15.2%) | 144 (12.0%) |
| 6:00 AM to 6:29 AM | 269 (19.6%) | 106 (8.8%) |
| 6:30 AM to 6:59 AM | 74 (5.4%) | 40 (3.3%) |
| 7:00 AM to 7:29 AM | 219 (16.0%) | 337 (28.1%) |
| 7:30 AM to 7:59 AM | 110 (8.0%) | 179 (14.9%) |
| 8:00 AM to 8:29 AM | 81 (5.9%) | 85 (7.1%) |
| 8:30 AM to 8:59 AM | 39 (2.8%) | 33 (2.8%) |
| 9:00 AM to 9:59 AM | 8 (0.6%) | 74 (6.2%) |
| 10:00 AM to 10:59 AM | 0 (0.0%) | 89 (7.4%) |
| 11:00 AM to 11:59 AM | 0 (0.0%) | 0 (0.0%) |
| 12:00 PM to 3:59 PM | 6 (0.4%) | 23 (1.9%) |
| 4:00 PM to 11:59 PM | 204 (14.9%) | 17 (1.4%) |
| Total | 1,372 (100.0%) | 1,199 (100.0%) |
Housing Occupancy in Ripley
Occupancy by Ownership in Ripley
Of the total 2,058 dwellings in Ripley, owner-occupied units account for 1,414 (68.7%), while renter-occupied units make up 644 (31.3%).
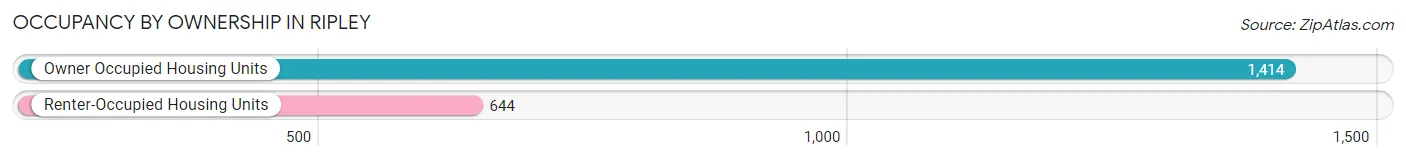
| Occupancy | # Housing Units | % Housing Units |
| Owner Occupied Housing Units | 1,414 | 68.7% |
| Renter-Occupied Housing Units | 644 | 31.3% |
| Total Occupied Housing Units | 2,058 | 100.0% |
Occupancy by Household Size in Ripley
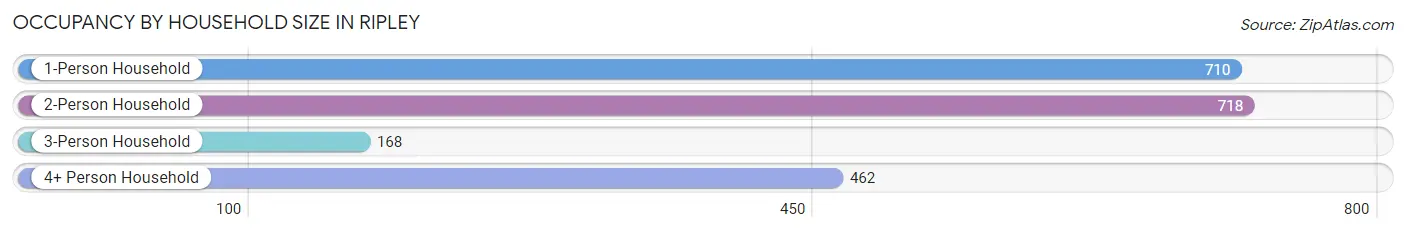
| Household Size | # Housing Units | % Housing Units |
| 1-Person Household | 710 | 34.5% |
| 2-Person Household | 718 | 34.9% |
| 3-Person Household | 168 | 8.2% |
| 4+ Person Household | 462 | 22.5% |
| Total Housing Units | 2,058 | 100.0% |
Occupancy by Ownership by Household Size in Ripley
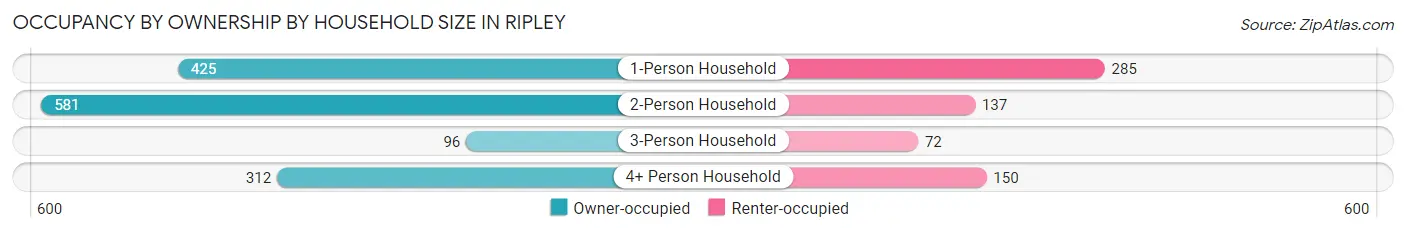
| Household Size | Owner-occupied | Renter-occupied |
| 1-Person Household | 425 (59.9%) | 285 (40.1%) |
| 2-Person Household | 581 (80.9%) | 137 (19.1%) |
| 3-Person Household | 96 (57.1%) | 72 (42.9%) |
| 4+ Person Household | 312 (67.5%) | 150 (32.5%) |
| Total Housing Units | 1,414 (68.7%) | 644 (31.3%) |
Occupancy by Educational Attainment in Ripley
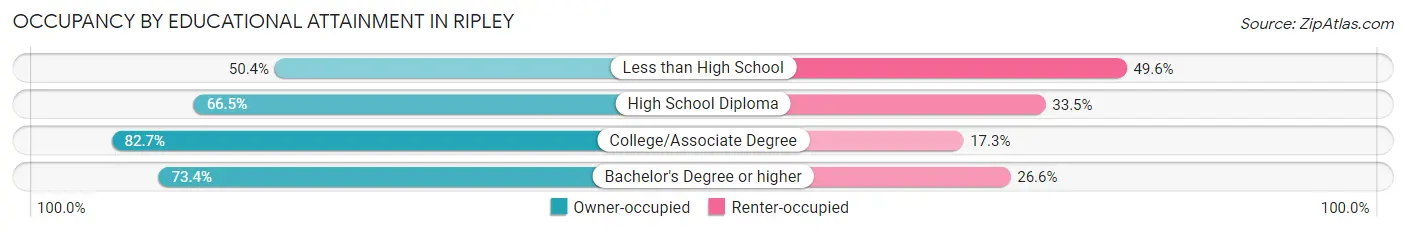
| Household Size | Owner-occupied | Renter-occupied |
| Less than High School | 264 (50.4%) | 260 (49.6%) |
| High School Diploma | 325 (66.5%) | 164 (33.5%) |
| College/Associate Degree | 513 (82.7%) | 107 (17.3%) |
| Bachelor's Degree or higher | 312 (73.4%) | 113 (26.6%) |
Occupancy by Age of Householder in Ripley
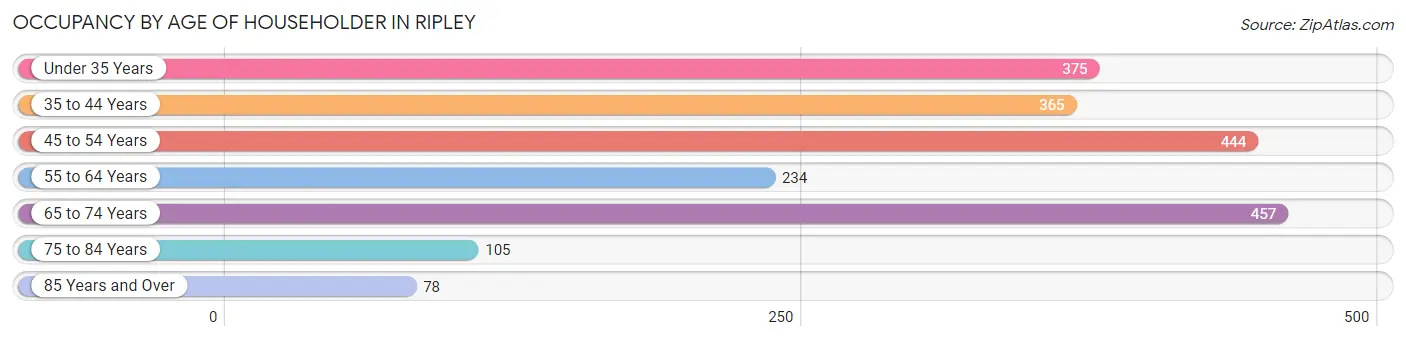
| Age Bracket | # Households | % Households |
| Under 35 Years | 375 | 18.2% |
| 35 to 44 Years | 365 | 17.7% |
| 45 to 54 Years | 444 | 21.6% |
| 55 to 64 Years | 234 | 11.4% |
| 65 to 74 Years | 457 | 22.2% |
| 75 to 84 Years | 105 | 5.1% |
| 85 Years and Over | 78 | 3.8% |
| Total | 2,058 | 100.0% |
Housing Finances in Ripley
Median Income by Occupancy in Ripley
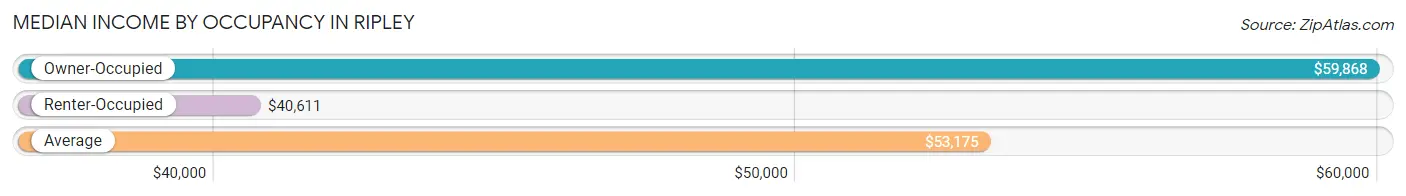
| Occupancy Type | # Households | Median Income |
| Owner-Occupied | 1,414 (68.7%) | $59,868 |
| Renter-Occupied | 644 (31.3%) | $40,611 |
| Average | 2,058 (100.0%) | $53,175 |
Occupancy by Householder Income Bracket in Ripley
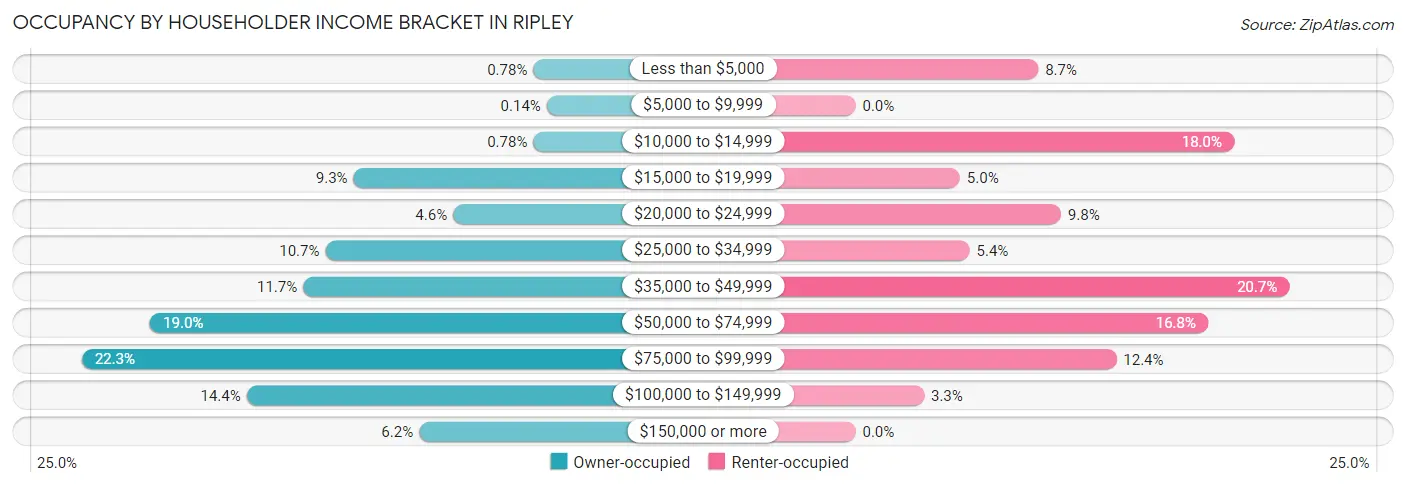
| Income Bracket | Owner-occupied | Renter-occupied |
| Less than $5,000 | 11 (0.8%) | 56 (8.7%) |
| $5,000 to $9,999 | 2 (0.1%) | 0 (0.0%) |
| $10,000 to $14,999 | 11 (0.8%) | 116 (18.0%) |
| $15,000 to $19,999 | 132 (9.3%) | 32 (5.0%) |
| $20,000 to $24,999 | 65 (4.6%) | 63 (9.8%) |
| $25,000 to $34,999 | 151 (10.7%) | 35 (5.4%) |
| $35,000 to $49,999 | 166 (11.7%) | 133 (20.6%) |
| $50,000 to $74,999 | 269 (19.0%) | 108 (16.8%) |
| $75,000 to $99,999 | 315 (22.3%) | 80 (12.4%) |
| $100,000 to $149,999 | 204 (14.4%) | 21 (3.3%) |
| $150,000 or more | 88 (6.2%) | 0 (0.0%) |
| Total | 1,414 (100.0%) | 644 (100.0%) |
Monthly Housing Cost Tiers in Ripley
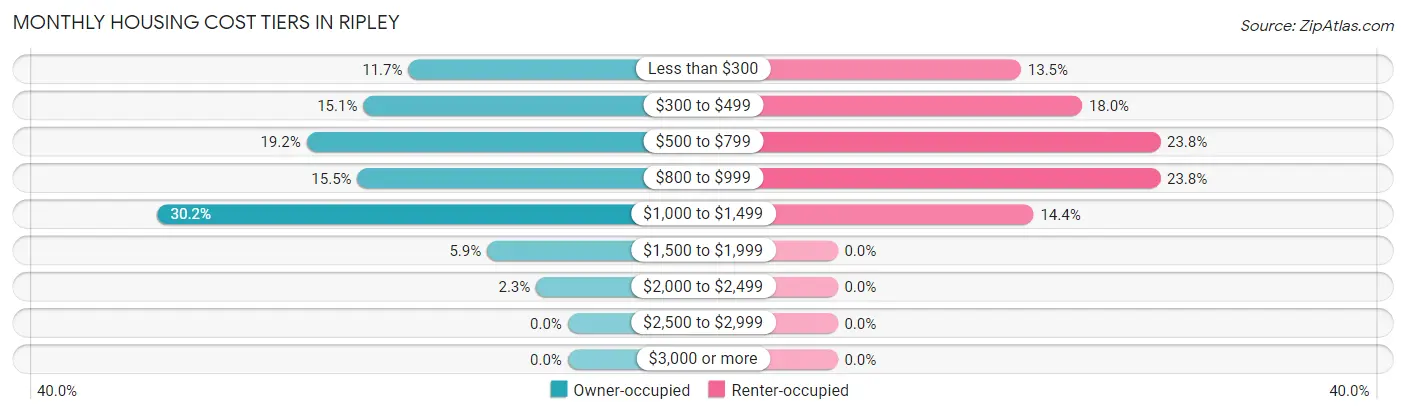
| Monthly Cost | Owner-occupied | Renter-occupied |
| Less than $300 | 166 (11.7%) | 87 (13.5%) |
| $300 to $499 | 213 (15.1%) | 116 (18.0%) |
| $500 to $799 | 272 (19.2%) | 153 (23.8%) |
| $800 to $999 | 219 (15.5%) | 153 (23.8%) |
| $1,000 to $1,499 | 427 (30.2%) | 93 (14.4%) |
| $1,500 to $1,999 | 84 (5.9%) | 0 (0.0%) |
| $2,000 to $2,499 | 33 (2.3%) | 0 (0.0%) |
| $2,500 to $2,999 | 0 (0.0%) | 0 (0.0%) |
| $3,000 or more | 0 (0.0%) | 0 (0.0%) |
| Total | 1,414 (100.0%) | 644 (100.0%) |
Physical Housing Characteristics in Ripley
Housing Structures in Ripley
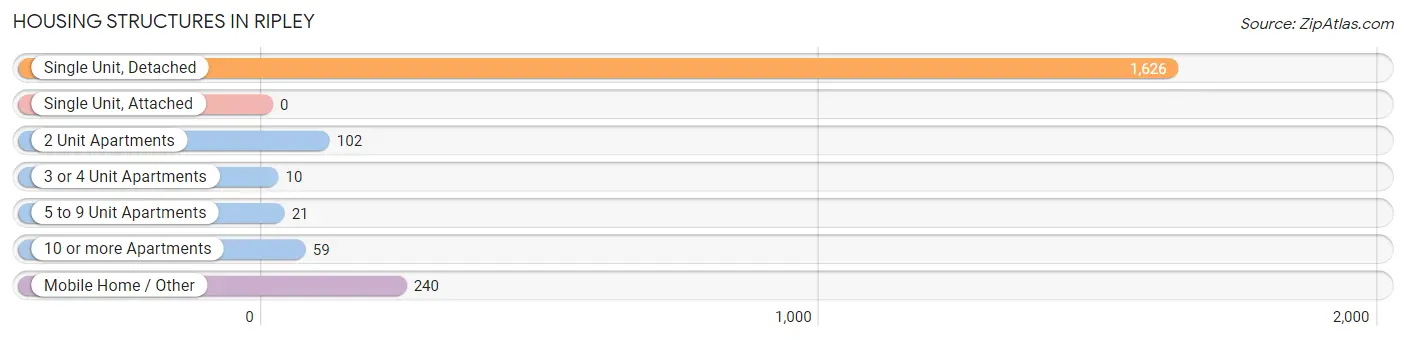
| Structure Type | # Housing Units | % Housing Units |
| Single Unit, Detached | 1,626 | 79.0% |
| Single Unit, Attached | 0 | 0.0% |
| 2 Unit Apartments | 102 | 5.0% |
| 3 or 4 Unit Apartments | 10 | 0.5% |
| 5 to 9 Unit Apartments | 21 | 1.0% |
| 10 or more Apartments | 59 | 2.9% |
| Mobile Home / Other | 240 | 11.7% |
| Total | 2,058 | 100.0% |
Housing Structures by Occupancy in Ripley
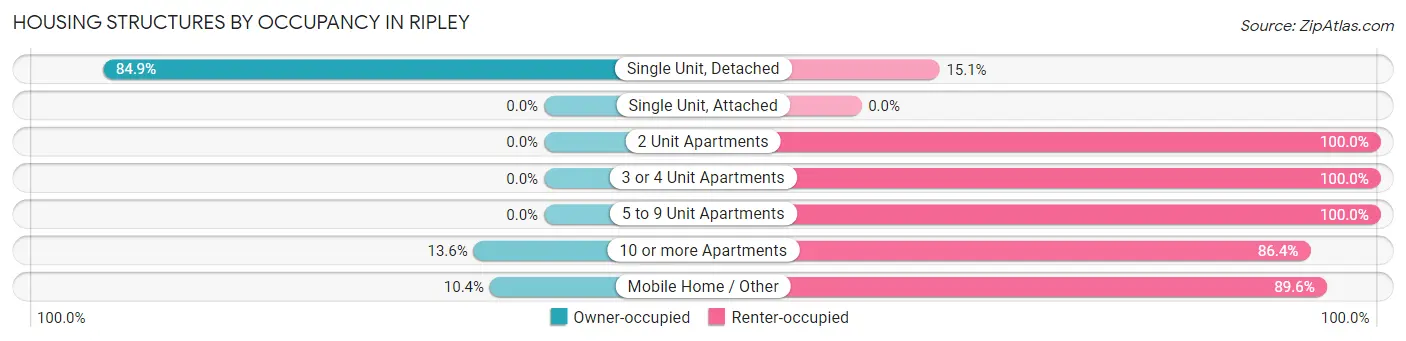
| Structure Type | Owner-occupied | Renter-occupied |
| Single Unit, Detached | 1,381 (84.9%) | 245 (15.1%) |
| Single Unit, Attached | 0 (0.0%) | 0 (0.0%) |
| 2 Unit Apartments | 0 (0.0%) | 102 (100.0%) |
| 3 or 4 Unit Apartments | 0 (0.0%) | 10 (100.0%) |
| 5 to 9 Unit Apartments | 0 (0.0%) | 21 (100.0%) |
| 10 or more Apartments | 8 (13.6%) | 51 (86.4%) |
| Mobile Home / Other | 25 (10.4%) | 215 (89.6%) |
| Total | 1,414 (68.7%) | 644 (31.3%) |
Housing Structures by Number of Rooms in Ripley
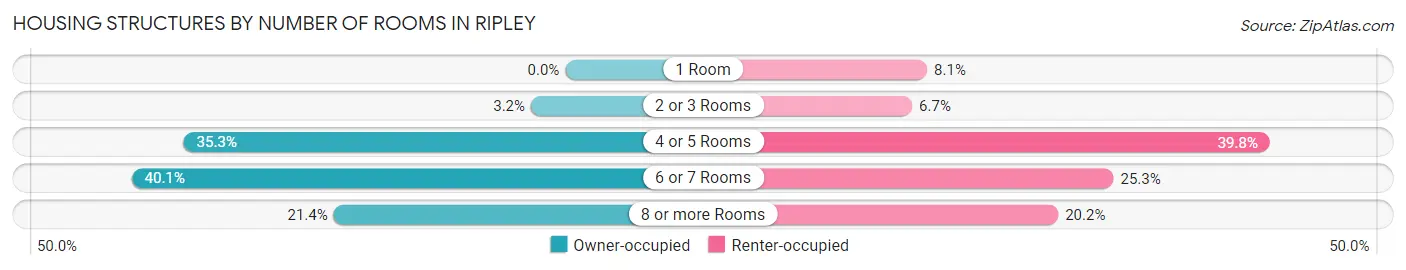
| Number of Rooms | Owner-occupied | Renter-occupied |
| 1 Room | 0 (0.0%) | 52 (8.1%) |
| 2 or 3 Rooms | 45 (3.2%) | 43 (6.7%) |
| 4 or 5 Rooms | 499 (35.3%) | 256 (39.8%) |
| 6 or 7 Rooms | 567 (40.1%) | 163 (25.3%) |
| 8 or more Rooms | 303 (21.4%) | 130 (20.2%) |
| Total | 1,414 (100.0%) | 644 (100.0%) |
Housing Structure by Heating Type in Ripley
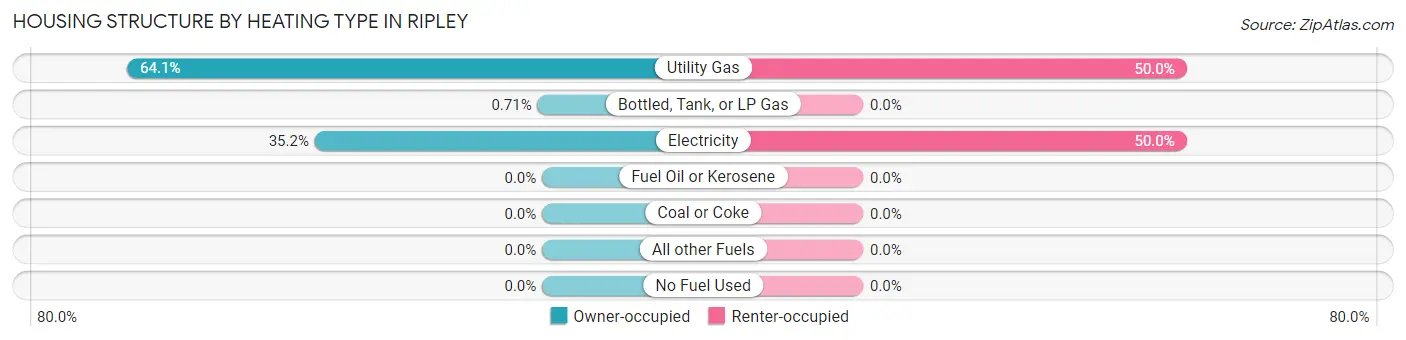
| Heating Type | Owner-occupied | Renter-occupied |
| Utility Gas | 907 (64.1%) | 322 (50.0%) |
| Bottled, Tank, or LP Gas | 10 (0.7%) | 0 (0.0%) |
| Electricity | 497 (35.1%) | 322 (50.0%) |
| Fuel Oil or Kerosene | 0 (0.0%) | 0 (0.0%) |
| Coal or Coke | 0 (0.0%) | 0 (0.0%) |
| All other Fuels | 0 (0.0%) | 0 (0.0%) |
| No Fuel Used | 0 (0.0%) | 0 (0.0%) |
| Total | 1,414 (100.0%) | 644 (100.0%) |
Household Vehicle Usage in Ripley
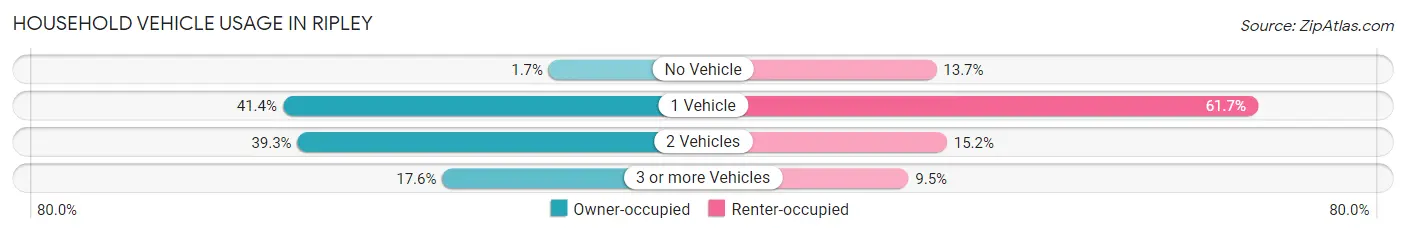
| Vehicles per Household | Owner-occupied | Renter-occupied |
| No Vehicle | 24 (1.7%) | 88 (13.7%) |
| 1 Vehicle | 586 (41.4%) | 397 (61.7%) |
| 2 Vehicles | 555 (39.3%) | 98 (15.2%) |
| 3 or more Vehicles | 249 (17.6%) | 61 (9.5%) |
| Total | 1,414 (100.0%) | 644 (100.0%) |
Real Estate & Mortgages in Ripley
Real Estate and Mortgage Overview in Ripley
| Characteristic | Without Mortgage | With Mortgage |
| Housing Units | 653 | 761 |
| Median Property Value | $117,400 | $147,500 |
| Median Household Income | $53,071 | $46 |
| Monthly Housing Costs | $479 | $0 |
| Real Estate Taxes | $1,087 | $83 |
Property Value by Mortgage Status in Ripley
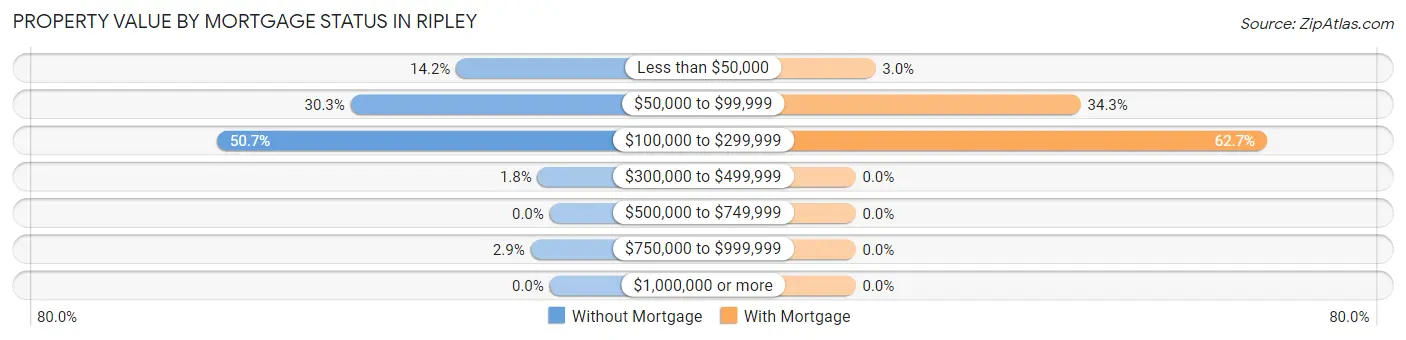
| Property Value | Without Mortgage | With Mortgage |
| Less than $50,000 | 93 (14.2%) | 23 (3.0%) |
| $50,000 to $99,999 | 198 (30.3%) | 261 (34.3%) |
| $100,000 to $299,999 | 331 (50.7%) | 477 (62.7%) |
| $300,000 to $499,999 | 12 (1.8%) | 0 (0.0%) |
| $500,000 to $749,999 | 0 (0.0%) | 0 (0.0%) |
| $750,000 to $999,999 | 19 (2.9%) | 0 (0.0%) |
| $1,000,000 or more | 0 (0.0%) | 0 (0.0%) |
| Total | 653 (100.0%) | 761 (100.0%) |
Household Income by Mortgage Status in Ripley
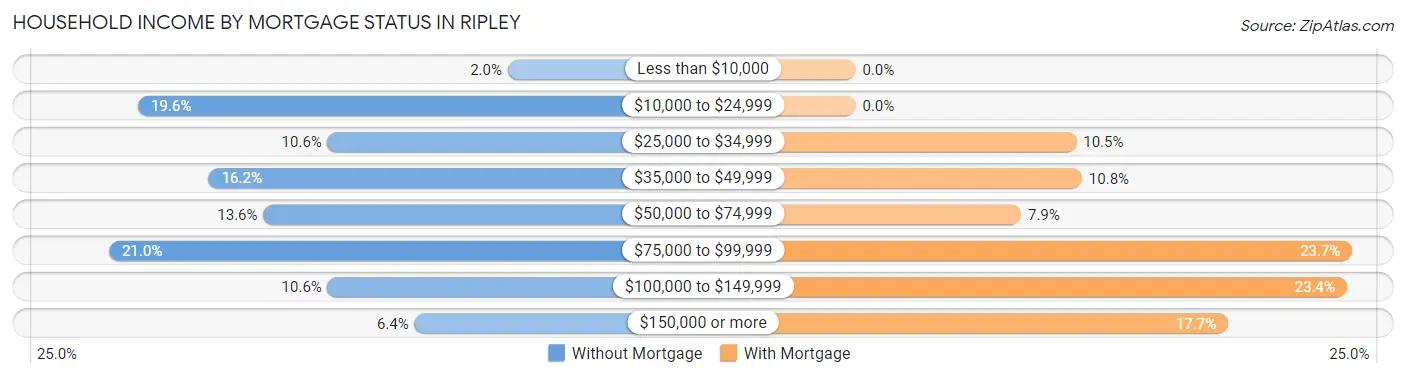
| Household Income | Without Mortgage | With Mortgage |
| Less than $10,000 | 13 (2.0%) | 0 (0.0%) |
| $10,000 to $24,999 | 128 (19.6%) | 0 (0.0%) |
| $25,000 to $34,999 | 69 (10.6%) | 80 (10.5%) |
| $35,000 to $49,999 | 106 (16.2%) | 82 (10.8%) |
| $50,000 to $74,999 | 89 (13.6%) | 60 (7.9%) |
| $75,000 to $99,999 | 137 (21.0%) | 180 (23.6%) |
| $100,000 to $149,999 | 69 (10.6%) | 178 (23.4%) |
| $150,000 or more | 42 (6.4%) | 135 (17.7%) |
| Total | 653 (100.0%) | 761 (100.0%) |
Property Value to Household Income Ratio in Ripley
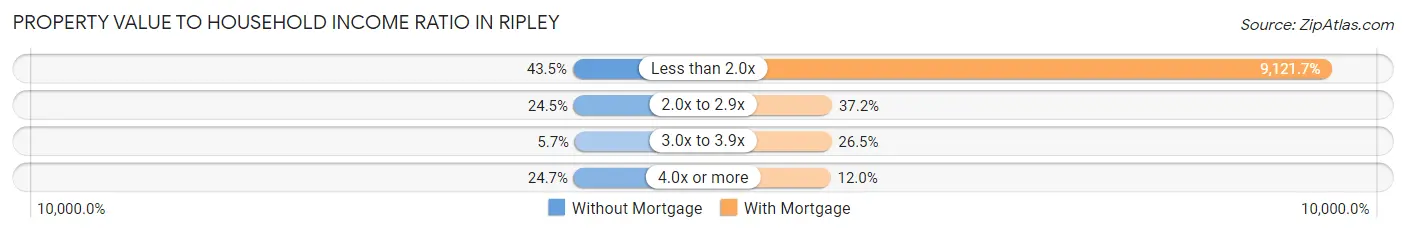
| Value-to-Income Ratio | Without Mortgage | With Mortgage |
| Less than 2.0x | 284 (43.5%) | 69,416 (9,121.7%) |
| 2.0x to 2.9x | 160 (24.5%) | 283 (37.2%) |
| 3.0x to 3.9x | 37 (5.7%) | 202 (26.5%) |
| 4.0x or more | 161 (24.7%) | 91 (12.0%) |
| Total | 653 (100.0%) | 761 (100.0%) |
Real Estate Taxes by Mortgage Status in Ripley
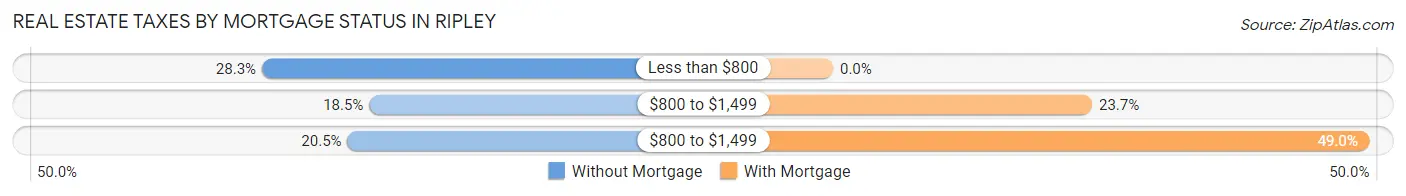
| Property Taxes | Without Mortgage | With Mortgage |
| Less than $800 | 185 (28.3%) | 0 (0.0%) |
| $800 to $1,499 | 121 (18.5%) | 180 (23.6%) |
| $800 to $1,499 | 134 (20.5%) | 373 (49.0%) |
| Total | 653 (100.0%) | 761 (100.0%) |
Health & Disability in Ripley
Health Insurance Coverage by Age in Ripley
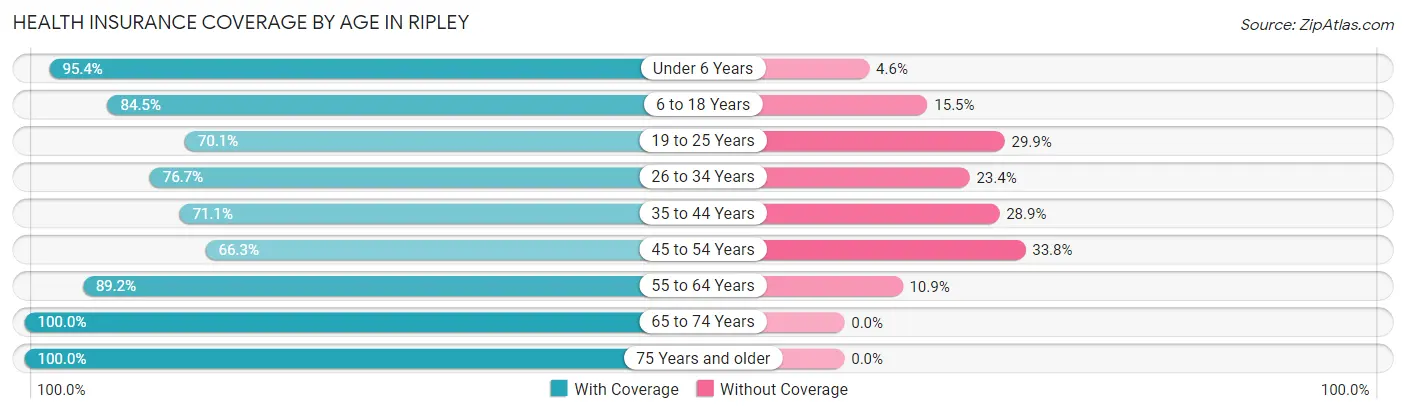
| Age Bracket | With Coverage | Without Coverage |
| Under 6 Years | 370 (95.4%) | 18 (4.6%) |
| 6 to 18 Years | 911 (84.5%) | 167 (15.5%) |
| 19 to 25 Years | 366 (70.1%) | 156 (29.9%) |
| 26 to 34 Years | 384 (76.6%) | 117 (23.4%) |
| 35 to 44 Years | 534 (71.1%) | 217 (28.9%) |
| 45 to 54 Years | 473 (66.2%) | 241 (33.8%) |
| 55 to 64 Years | 378 (89.1%) | 46 (10.8%) |
| 65 to 74 Years | 676 (100.0%) | 0 (0.0%) |
| 75 Years and older | 208 (100.0%) | 0 (0.0%) |
| Total | 4,300 (81.7%) | 962 (18.3%) |
Health Insurance Coverage by Citizenship Status in Ripley
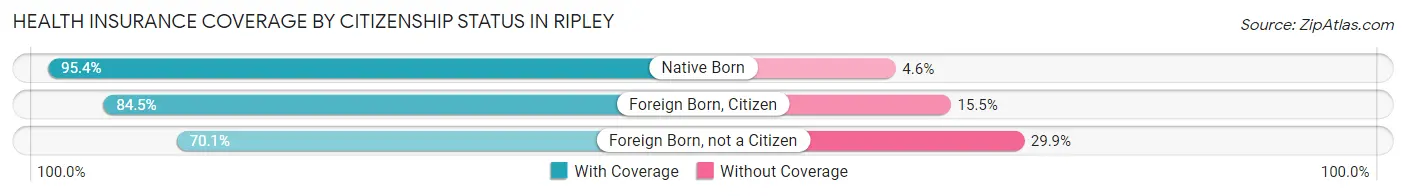
| Citizenship Status | With Coverage | Without Coverage |
| Native Born | 370 (95.4%) | 18 (4.6%) |
| Foreign Born, Citizen | 911 (84.5%) | 167 (15.5%) |
| Foreign Born, not a Citizen | 366 (70.1%) | 156 (29.9%) |
Health Insurance Coverage by Household Income in Ripley
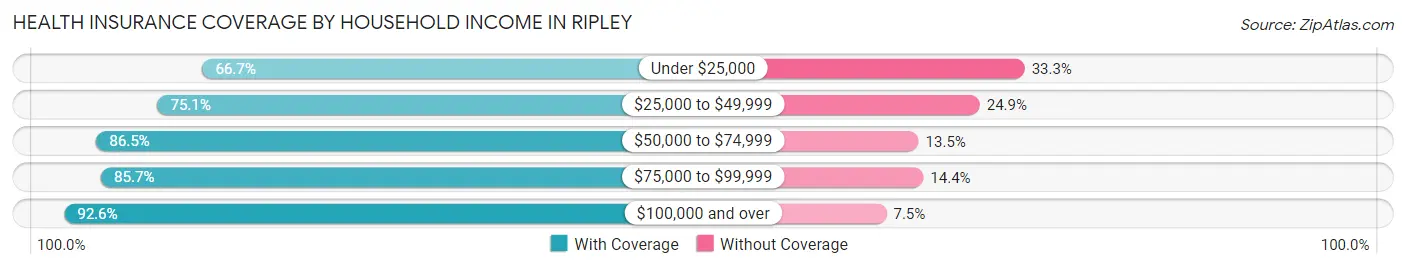
| Household Income | With Coverage | Without Coverage |
| Under $25,000 | 568 (66.7%) | 284 (33.3%) |
| $25,000 to $49,999 | 955 (75.1%) | 317 (24.9%) |
| $50,000 to $74,999 | 656 (86.5%) | 102 (13.5%) |
| $75,000 to $99,999 | 1,015 (85.7%) | 170 (14.3%) |
| $100,000 and over | 1,106 (92.5%) | 89 (7.4%) |
Public vs Private Health Insurance Coverage by Age in Ripley
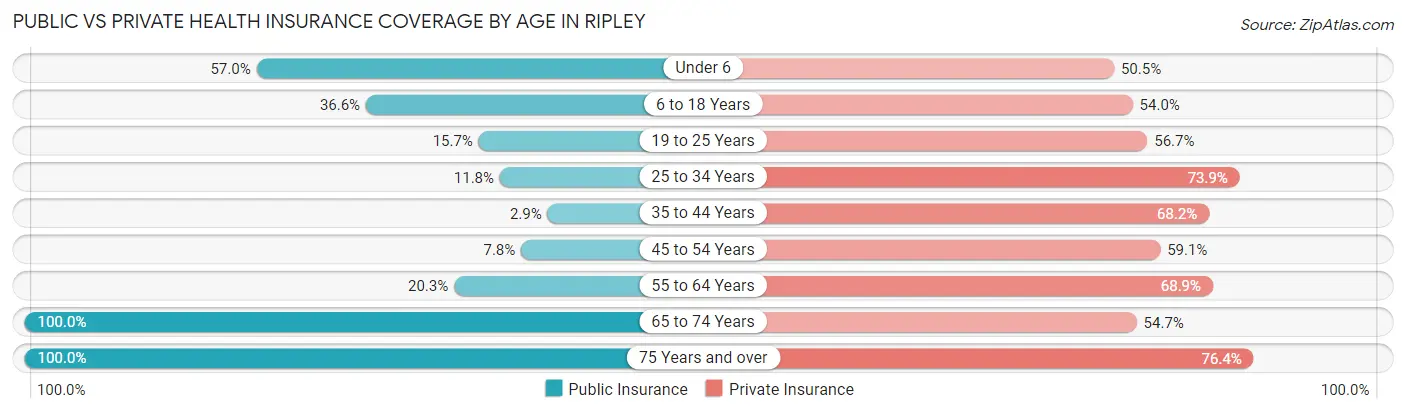
| Age Bracket | Public Insurance | Private Insurance |
| Under 6 | 221 (57.0%) | 196 (50.5%) |
| 6 to 18 Years | 395 (36.6%) | 582 (54.0%) |
| 19 to 25 Years | 82 (15.7%) | 296 (56.7%) |
| 25 to 34 Years | 59 (11.8%) | 370 (73.9%) |
| 35 to 44 Years | 22 (2.9%) | 512 (68.2%) |
| 45 to 54 Years | 56 (7.8%) | 422 (59.1%) |
| 55 to 64 Years | 86 (20.3%) | 292 (68.9%) |
| 65 to 74 Years | 676 (100.0%) | 370 (54.7%) |
| 75 Years and over | 208 (100.0%) | 159 (76.4%) |
| Total | 1,805 (34.3%) | 3,199 (60.8%) |
Disability Status by Sex by Age in Ripley
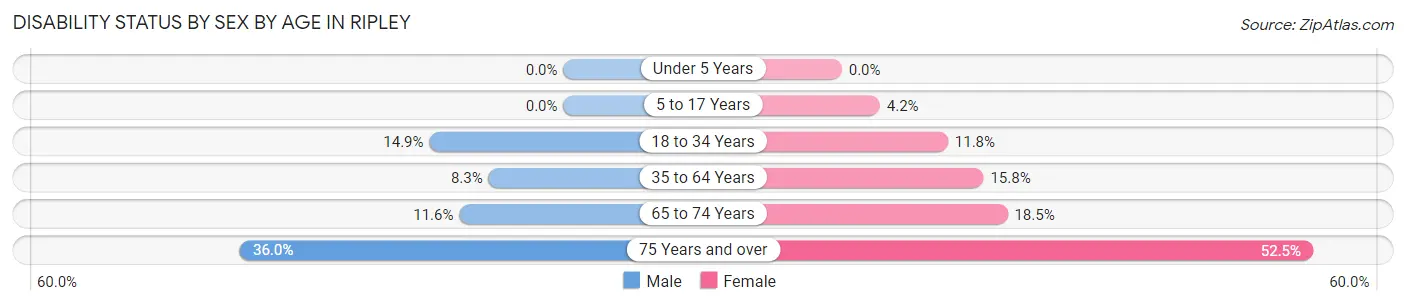
| Age Bracket | Male | Female |
| Under 5 Years | 0 (0.0%) | 0 (0.0%) |
| 5 to 17 Years | 0 (0.0%) | 15 (4.2%) |
| 18 to 34 Years | 88 (14.9%) | 68 (11.8%) |
| 35 to 64 Years | 74 (8.3%) | 158 (15.8%) |
| 65 to 74 Years | 35 (11.6%) | 69 (18.4%) |
| 75 Years and over | 9 (36.0%) | 96 (52.5%) |
Disability Class by Sex by Age in Ripley
Disability Class: Hearing Difficulty
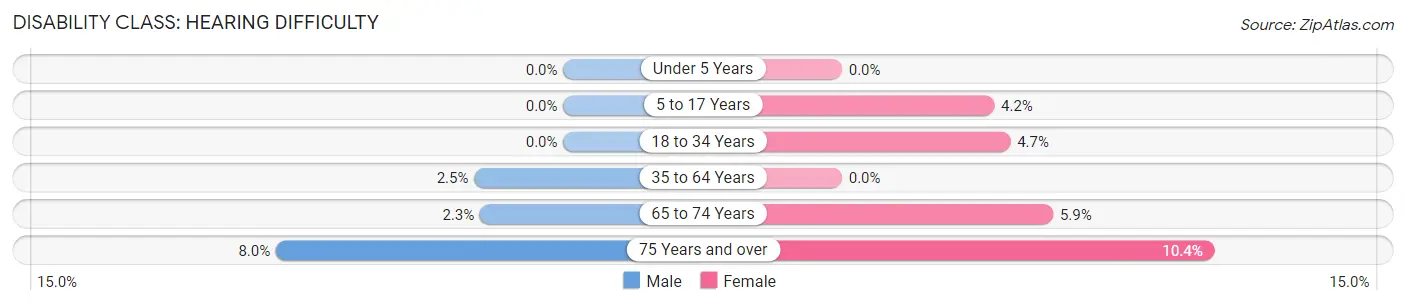
| Age Bracket | Male | Female |
| Under 5 Years | 0 (0.0%) | 0 (0.0%) |
| 5 to 17 Years | 0 (0.0%) | 15 (4.2%) |
| 18 to 34 Years | 0 (0.0%) | 27 (4.7%) |
| 35 to 64 Years | 22 (2.5%) | 0 (0.0%) |
| 65 to 74 Years | 7 (2.3%) | 22 (5.9%) |
| 75 Years and over | 2 (8.0%) | 19 (10.4%) |
Disability Class: Vision Difficulty
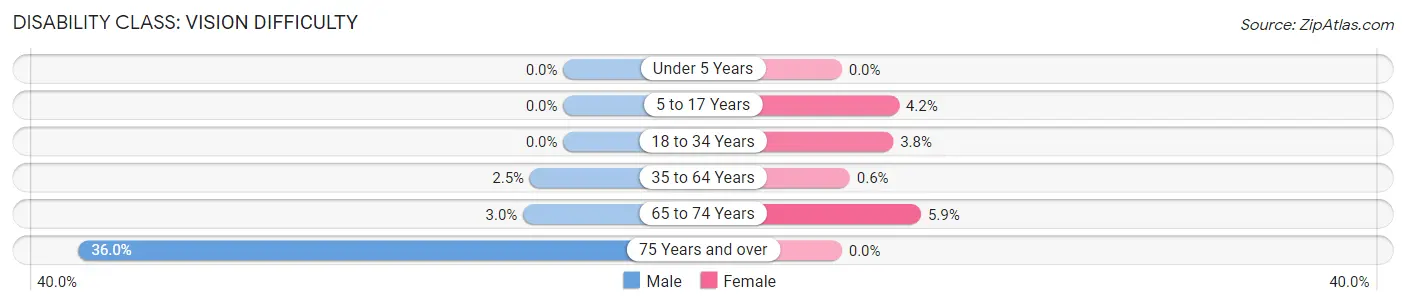
| Age Bracket | Male | Female |
| Under 5 Years | 0 (0.0%) | 0 (0.0%) |
| 5 to 17 Years | 0 (0.0%) | 15 (4.2%) |
| 18 to 34 Years | 0 (0.0%) | 22 (3.8%) |
| 35 to 64 Years | 22 (2.5%) | 6 (0.6%) |
| 65 to 74 Years | 9 (3.0%) | 22 (5.9%) |
| 75 Years and over | 9 (36.0%) | 0 (0.0%) |
Disability Class: Cognitive Difficulty
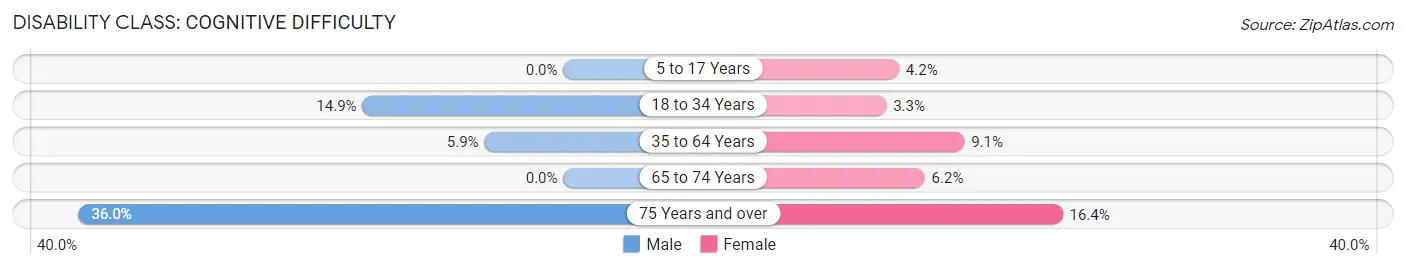
| Age Bracket | Male | Female |
| 5 to 17 Years | 0 (0.0%) | 15 (4.2%) |
| 18 to 34 Years | 88 (14.9%) | 19 (3.3%) |
| 35 to 64 Years | 52 (5.9%) | 91 (9.1%) |
| 65 to 74 Years | 0 (0.0%) | 23 (6.1%) |
| 75 Years and over | 9 (36.0%) | 30 (16.4%) |
Disability Class: Ambulatory Difficulty
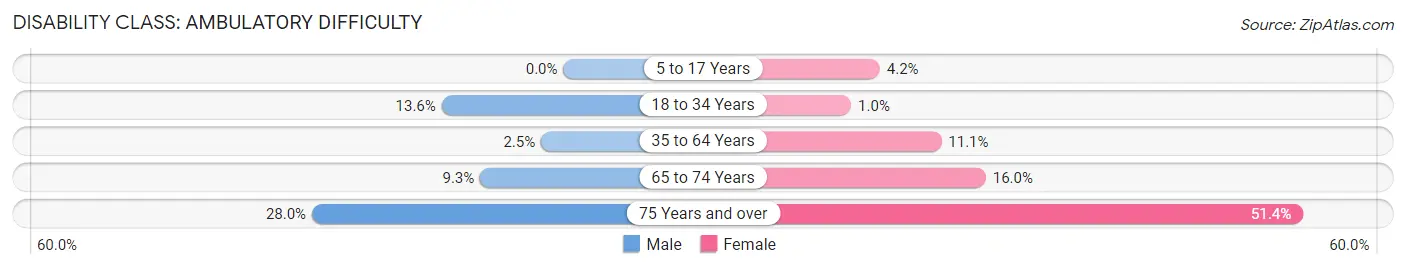
| Age Bracket | Male | Female |
| 5 to 17 Years | 0 (0.0%) | 15 (4.2%) |
| 18 to 34 Years | 80 (13.6%) | 6 (1.0%) |
| 35 to 64 Years | 22 (2.5%) | 111 (11.1%) |
| 65 to 74 Years | 28 (9.3%) | 60 (16.0%) |
| 75 Years and over | 7 (28.0%) | 94 (51.4%) |
Disability Class: Self-Care Difficulty
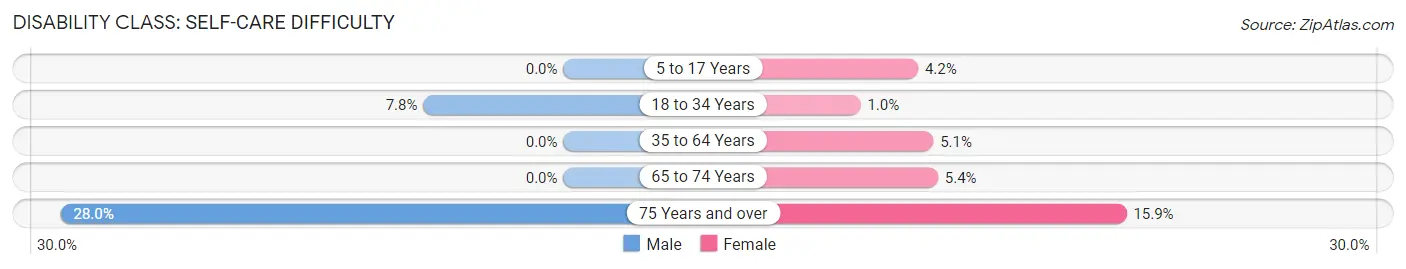
| Age Bracket | Male | Female |
| 5 to 17 Years | 0 (0.0%) | 15 (4.2%) |
| 18 to 34 Years | 46 (7.8%) | 6 (1.0%) |
| 35 to 64 Years | 0 (0.0%) | 51 (5.1%) |
| 65 to 74 Years | 0 (0.0%) | 20 (5.3%) |
| 75 Years and over | 7 (28.0%) | 29 (15.9%) |
Technology Access in Ripley
Computing Device Access in Ripley
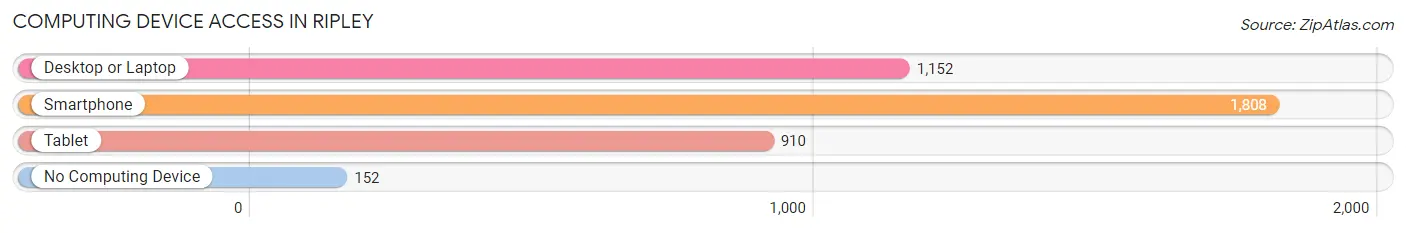
| Device Type | # Households | % Households |
| Desktop or Laptop | 1,152 | 56.0% |
| Smartphone | 1,808 | 87.8% |
| Tablet | 910 | 44.2% |
| No Computing Device | 152 | 7.4% |
| Total | 2,058 | 100.0% |
Internet Access in Ripley
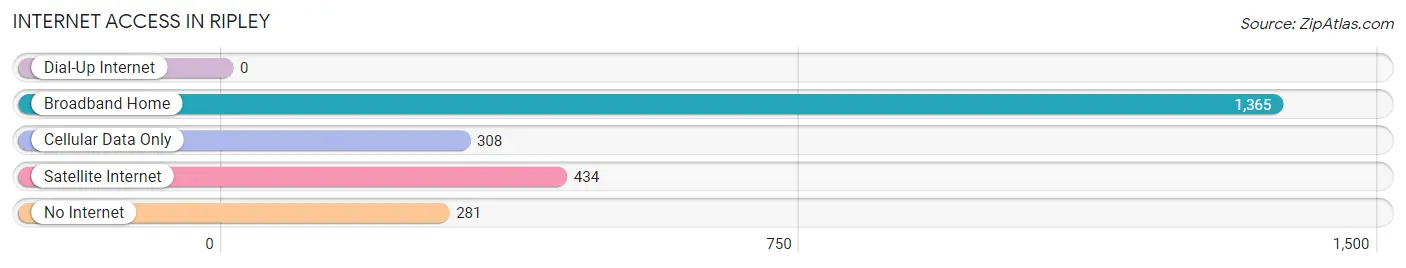
| Internet Type | # Households | % Households |
| Dial-Up Internet | 0 | 0.0% |
| Broadband Home | 1,365 | 66.3% |
| Cellular Data Only | 308 | 15.0% |
| Satellite Internet | 434 | 21.1% |
| No Internet | 281 | 13.7% |
| Total | 2,058 | 100.0% |
Ripley Summary
Ripley, Mississippi is a small city located in Tippah County, Mississippi. It is the county seat of Tippah County and is located in the northeast corner of the state. The city has a population of approximately 5,000 people and is part of the larger Tupelo metropolitan area.
History
Ripley was founded in 1837 and was named after the famous American naval hero, Commodore Matthew C. Perry. The city was originally known as Perryville, but the name was changed to Ripley in 1839. The city was incorporated in 1841 and was the first county seat of Tippah County.
Ripley was an important railroad hub during the Civil War. The city was the site of a major battle in 1863, when Confederate forces under General Nathan Bedford Forrest defeated Union forces under General William Sooy Smith. The battle was a major victory for the Confederacy and helped to secure the region for the South.
Ripley was also an important center of industry during the late 19th and early 20th centuries. The city was home to several cotton mills, lumber mills, and other manufacturing businesses. The city was also home to several banks and other financial institutions.
Geography
Ripley is located in the northeast corner of Mississippi, in Tippah County. The city is situated on the banks of the Tippah River, which flows through the city. The city is located about 50 miles south of Memphis, Tennessee and about 100 miles north of Jackson, Mississippi.
The city has a total area of 4.2 square miles, all of which is land. The city is located in a hilly region of the state, with elevations ranging from about 500 to 800 feet above sea level. The climate in Ripley is humid subtropical, with hot, humid summers and mild winters.
Economy
Ripley’s economy is largely based on agriculture and manufacturing. The city is home to several large farms, which produce cotton, soybeans, corn, and other crops. The city is also home to several manufacturing businesses, including furniture factories, textile mills, and other industrial businesses.
The city is also home to several banks and other financial institutions. The city is served by the Tippah County School District, which operates several elementary, middle, and high schools in the area.
Demographics
As of the 2010 census, the population of Ripley was 5,478. The racial makeup of the city was 79.2% White, 18.3% African American, 0.3% Native American, 0.3% Asian, 0.1% Pacific Islander, 0.7% from other races, and 1.3% from two or more races. Hispanic or Latino of any race were 1.7% of the population.
The median income for a household in the city was $30,938, and the median income for a family was $37,917. The per capita income for the city was $17,845. About 19.2% of families and 22.2% of the population were below the poverty line, including 33.3% of those under age 18 and 16.2% of those age 65 or over.
Ripley is a small city with a rich history and a diverse economy. The city is home to several large farms and manufacturing businesses, as well as several banks and other financial institutions. The city is served by the Tippah County School District, which operates several elementary, middle, and high schools in the area. The city has a population of approximately 5,000 people and is part of the larger Tupelo metropolitan area.
Common Questions
What is Per Capita Income in Ripley?
Per Capita income in Ripley is $26,000.
What is the Median Family Income in Ripley?
Median Family Income in Ripley is $68,136.
What is the Median Household income in Ripley?
Median Household Income in Ripley is $53,175.
What is Income or Wage Gap in Ripley?
Income or Wage Gap in Ripley is 42.3%.
Women in Ripley earn 57.7 cents for every dollar earned by a man.
What is Inequality or Gini Index in Ripley?
Inequality or Gini Index in Ripley is 0.39.
What is the Total Population of Ripley?
Total Population of Ripley is 5,440.
What is the Total Male Population of Ripley?
Total Male Population of Ripley is 2,708.
What is the Total Female Population of Ripley?
Total Female Population of Ripley is 2,732.
What is the Ratio of Males per 100 Females in Ripley?
There are 99.12 Males per 100 Females in Ripley.
What is the Ratio of Females per 100 Males in Ripley?
There are 100.89 Females per 100 Males in Ripley.
What is the Median Population Age in Ripley?
Median Population Age in Ripley is 39.0 Years.
What is the Average Family Size in Ripley
Average Family Size in Ripley is 3.3 People.
What is the Average Household Size in Ripley
Average Household Size in Ripley is 2.6 People.
How Large is the Labor Force in Ripley?
There are 2,907 People in the Labor Forcein in Ripley.
What is the Percentage of People in the Labor Force in Ripley?
67.6% of People are in the Labor Force in Ripley.
What is the Unemployment Rate in Ripley?
Unemployment Rate in Ripley is 9.6%.