Rienzi, MS Map & Demographics
Rienzi Map
Rienzi Overview
$23,583
PER CAPITA INCOME
$55,750
AVG FAMILY INCOME
$44,250
AVG HOUSEHOLD INCOME
2.4%
WAGE / INCOME GAP [ % ]
97.6¢/ $1
WAGE / INCOME GAP [ $ ]
0.46
INEQUALITY / GINI INDEX
302
TOTAL POPULATION
135
MALE POPULATION
167
FEMALE POPULATION
80.84
MALES / 100 FEMALES
123.70
FEMALES / 100 MALES
50.3
MEDIAN AGE
3.1
AVG FAMILY SIZE
2.4
AVG HOUSEHOLD SIZE
94
LABOR FORCE [ PEOPLE ]
39.5%
PERCENT IN LABOR FORCE
2.1%
UNEMPLOYMENT RATE
Rienzi Zip Codes
Rienzi Area Codes
Income in Rienzi
Income Overview in Rienzi
Per Capita Income in Rienzi is $23,583, while median incomes of families and households are $55,750 and $44,250 respectively.
| Characteristic | Number | Measure |
| Per Capita Income | 302 | $23,583 |
| Median Family Income | 79 | $55,750 |
| Mean Family Income | 79 | $78,624 |
| Median Household Income | 127 | $44,250 |
| Mean Household Income | 127 | $58,924 |
| Income Deficit | 79 | $0 |
| Wage / Income Gap (%) | 302 | 2.42% |
| Wage / Income Gap ($) | 302 | 97.58¢ per $1 |
| Gini / Inequality Index | 302 | 0.46 |
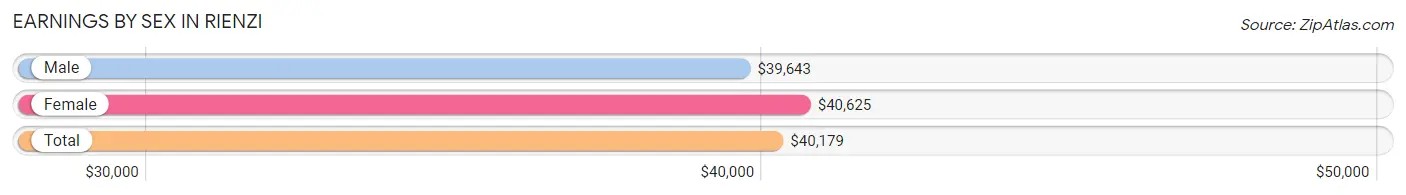
Earnings by Sex in Rienzi
Average Earnings in Rienzi are $40,179, $39,643 for men and $40,625 for women, a difference of 2.4%.
| Sex | Number | Average Earnings |
| Male | 42 (43.3%) | $39,643 |
| Female | 55 (56.7%) | $40,625 |
| Total | 97 (100.0%) | $40,179 |
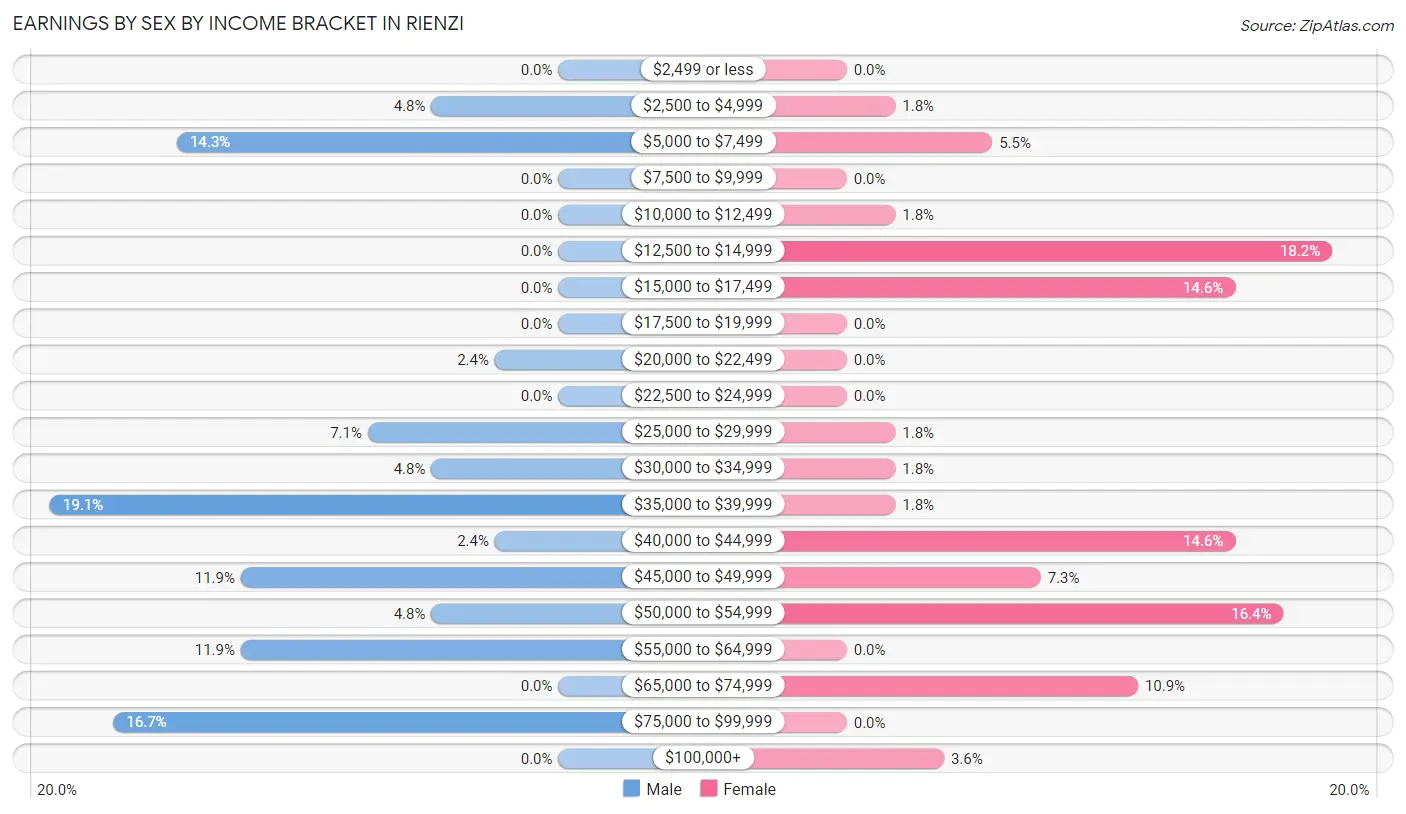
Earnings by Sex by Income Bracket in Rienzi
The most common earnings brackets in Rienzi are $35,000 to $39,999 for men (8 | 19.1%) and $12,500 to $14,999 for women (10 | 18.2%).
| Income | Male | Female |
| $2,499 or less | 0 (0.0%) | 0 (0.0%) |
| $2,500 to $4,999 | 2 (4.8%) | 1 (1.8%) |
| $5,000 to $7,499 | 6 (14.3%) | 3 (5.4%) |
| $7,500 to $9,999 | 0 (0.0%) | 0 (0.0%) |
| $10,000 to $12,499 | 0 (0.0%) | 1 (1.8%) |
| $12,500 to $14,999 | 0 (0.0%) | 10 (18.2%) |
| $15,000 to $17,499 | 0 (0.0%) | 8 (14.5%) |
| $17,500 to $19,999 | 0 (0.0%) | 0 (0.0%) |
| $20,000 to $22,499 | 1 (2.4%) | 0 (0.0%) |
| $22,500 to $24,999 | 0 (0.0%) | 0 (0.0%) |
| $25,000 to $29,999 | 3 (7.1%) | 1 (1.8%) |
| $30,000 to $34,999 | 2 (4.8%) | 1 (1.8%) |
| $35,000 to $39,999 | 8 (19.1%) | 1 (1.8%) |
| $40,000 to $44,999 | 1 (2.4%) | 8 (14.5%) |
| $45,000 to $49,999 | 5 (11.9%) | 4 (7.3%) |
| $50,000 to $54,999 | 2 (4.8%) | 9 (16.4%) |
| $55,000 to $64,999 | 5 (11.9%) | 0 (0.0%) |
| $65,000 to $74,999 | 0 (0.0%) | 6 (10.9%) |
| $75,000 to $99,999 | 7 (16.7%) | 0 (0.0%) |
| $100,000+ | 0 (0.0%) | 2 (3.6%) |
| Total | 42 (100.0%) | 55 (100.0%) |
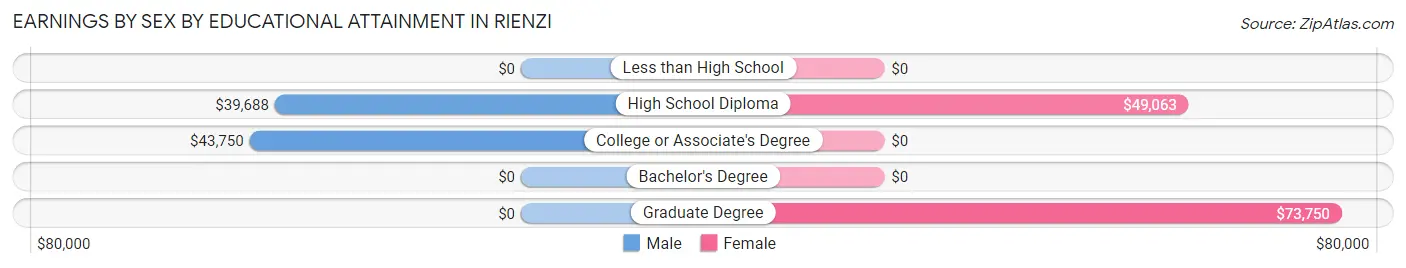
Earnings by Sex by Educational Attainment in Rienzi
Average earnings in Rienzi are $43,750 for men and $42,500 for women, a difference of 2.9%. Men with an educational attainment of college or associate's degree enjoy the highest average annual earnings of $43,750, while those with high school diploma education earn the least with $39,688. Women with an educational attainment of graduate degree earn the most with the average annual earnings of $73,750, while those with high school diploma education have the smallest earnings of $49,063.
| Educational Attainment | Male Income | Female Income |
| Less than High School | - | - |
| High School Diploma | $39,688 | $49,063 |
| College or Associate's Degree | $43,750 | $0 |
| Bachelor's Degree | - | - |
| Graduate Degree | - | - |
| Total | $43,750 | $42,500 |
Family Income in Rienzi
Family Income Brackets in Rienzi
According to the Rienzi family income data, there are 17 families falling into the $50,000 to $74,999 income range, which is the most common income bracket and makes up 21.5% of all families.
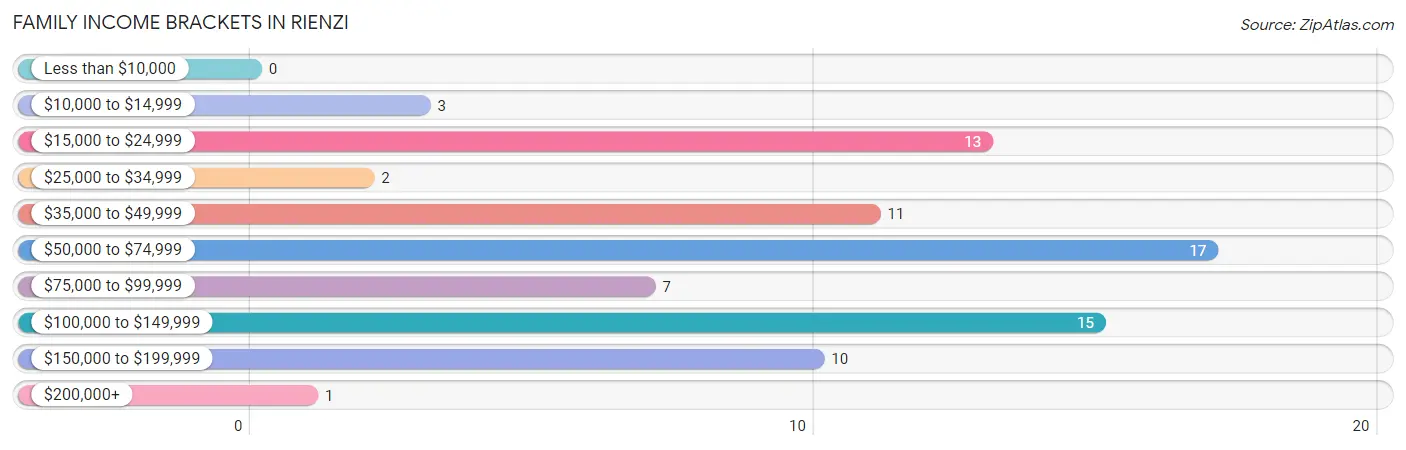
| Income Bracket | # Families | % Families |
| Less than $10,000 | 0 | 0.0% |
| $10,000 to $14,999 | 3 | 3.8% |
| $15,000 to $24,999 | 13 | 16.5% |
| $25,000 to $34,999 | 2 | 2.5% |
| $35,000 to $49,999 | 11 | 13.9% |
| $50,000 to $74,999 | 17 | 21.5% |
| $75,000 to $99,999 | 7 | 8.9% |
| $100,000 to $149,999 | 15 | 19.0% |
| $150,000 to $199,999 | 10 | 12.7% |
| $200,000+ | 1 | 1.3% |
Family Income by Famaliy Size in Rienzi
4-person families (15 | 19.0%) account for the highest median family income in Rienzi with $155,156 per family, while 4-person families (15 | 19.0%) have the highest median income of $38,789 per family member.
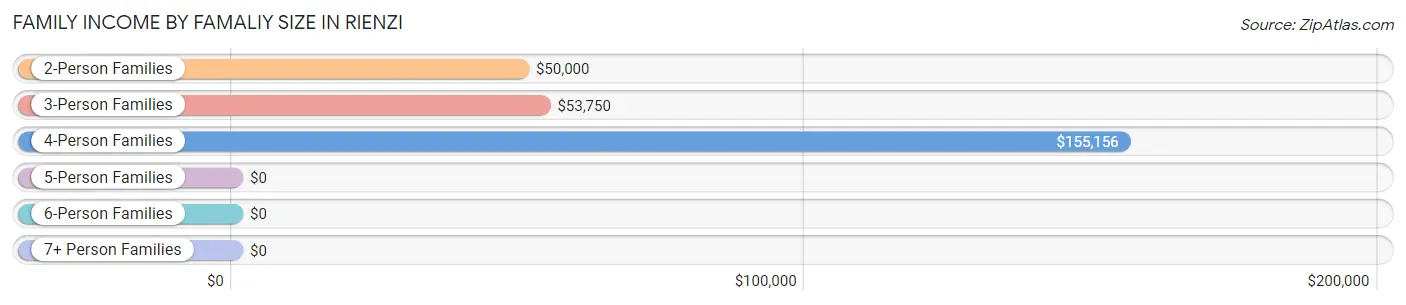
| Income Bracket | # Families | Median Income |
| 2-Person Families | 44 (55.7%) | $50,000 |
| 3-Person Families | 14 (17.7%) | $53,750 |
| 4-Person Families | 15 (19.0%) | $155,156 |
| 5-Person Families | 6 (7.6%) | $0 |
| 6-Person Families | 0 (0.0%) | $0 |
| 7+ Person Families | 0 (0.0%) | $0 |
| Total | 79 (100.0%) | $55,750 |
Family Income by Number of Earners in Rienzi
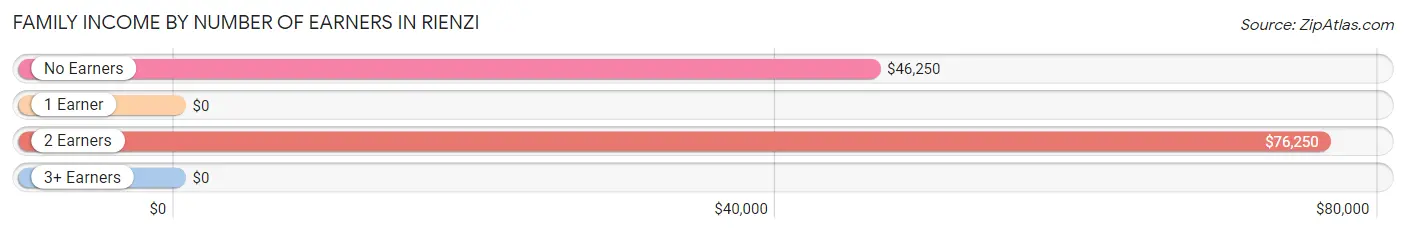
| Number of Earners | # Families | Median Income |
| No Earners | 28 (35.4%) | $46,250 |
| 1 Earner | 19 (24.0%) | $0 |
| 2 Earners | 29 (36.7%) | $76,250 |
| 3+ Earners | 3 (3.8%) | $0 |
| Total | 79 (100.0%) | $55,750 |
Household Income in Rienzi
Household Income Brackets in Rienzi
With 33 households falling in the category, the $15,000 to $24,999 income range is the most frequent in Rienzi, accounting for 26.0% of all households. In contrast, only 1 households (0.8%) fall into the $200,000+ income bracket, making it the least populous group.
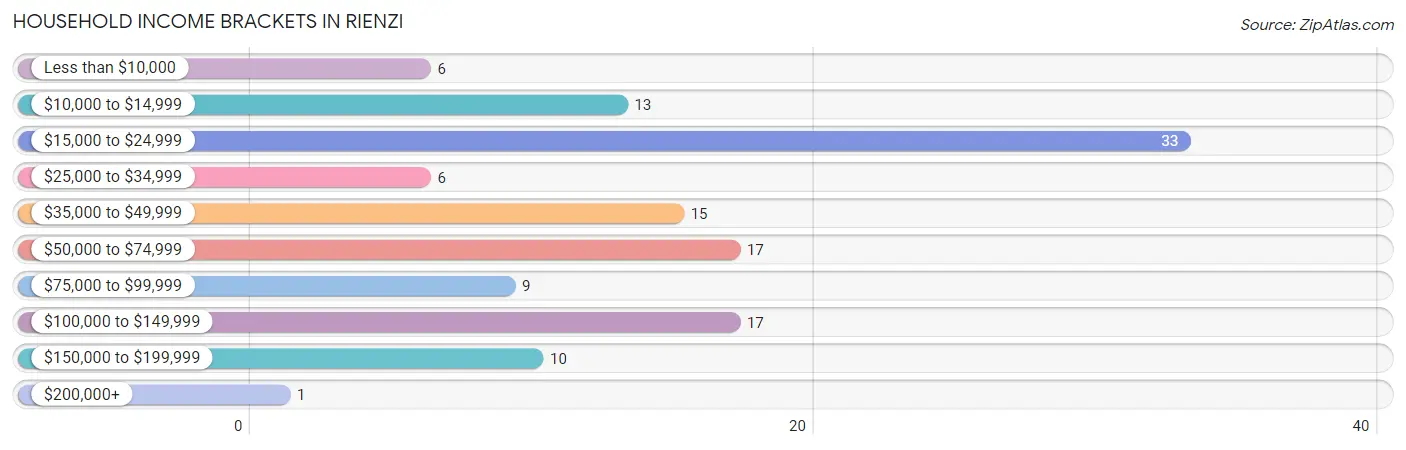
| Income Bracket | # Households | % Households |
| Less than $10,000 | 6 | 4.7% |
| $10,000 to $14,999 | 13 | 10.2% |
| $15,000 to $24,999 | 33 | 26.0% |
| $25,000 to $34,999 | 6 | 4.7% |
| $35,000 to $49,999 | 15 | 11.8% |
| $50,000 to $74,999 | 17 | 13.4% |
| $75,000 to $99,999 | 9 | 7.1% |
| $100,000 to $149,999 | 17 | 13.4% |
| $150,000 to $199,999 | 10 | 7.9% |
| $200,000+ | 1 | 0.8% |
Household Income by Householder Age in Rienzi
| Income Bracket | # Households | Median Income |
| 15 to 24 Years | 0 (0.0%) | $0 |
| 25 to 44 Years | 33 (26.0%) | $0 |
| 45 to 64 Years | 39 (30.7%) | $0 |
| 65+ Years | 55 (43.3%) | $0 |
| Total | 127 (100.0%) | $44,250 |
Poverty in Rienzi
Income Below Poverty by Sex and Age in Rienzi
With 2.2% poverty level for males and 24.5% for females among the residents of Rienzi, 65 to 74 year old males and 55 to 64 year old females are the most vulnerable to poverty, with 3 males (14.3%) and 22 females (81.5%) in their respective age groups living below the poverty level.
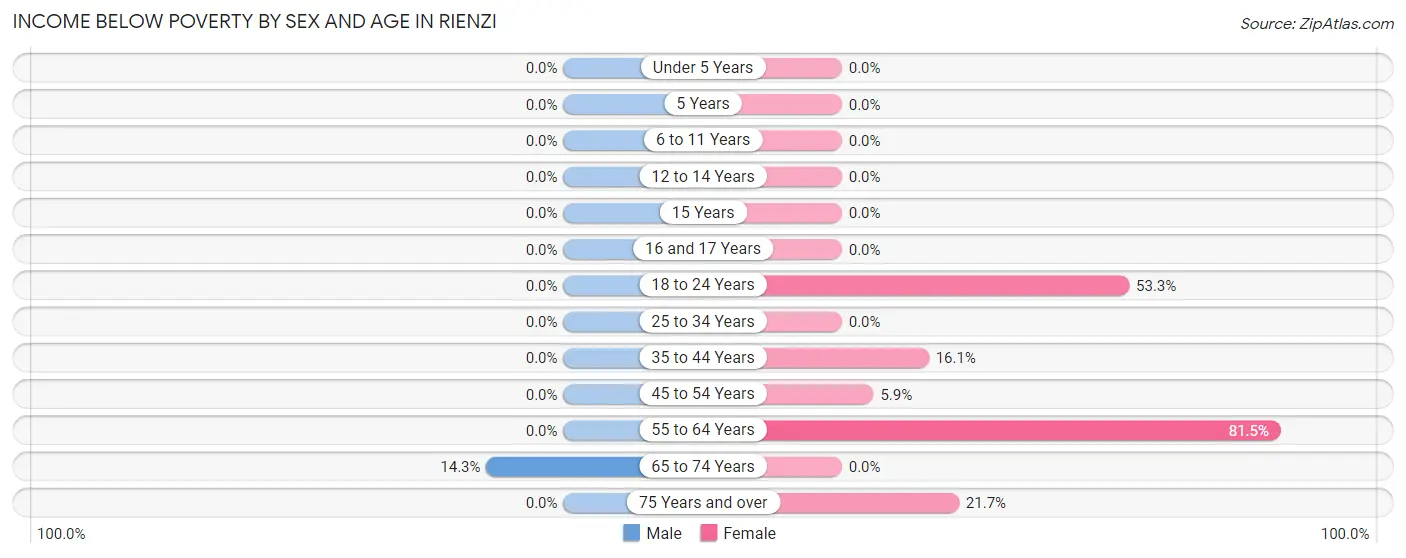
| Age Bracket | Male | Female |
| Under 5 Years | 0 (0.0%) | 0 (0.0%) |
| 5 Years | 0 (0.0%) | 0 (0.0%) |
| 6 to 11 Years | 0 (0.0%) | 0 (0.0%) |
| 12 to 14 Years | 0 (0.0%) | 0 (0.0%) |
| 15 Years | 0 (0.0%) | 0 (0.0%) |
| 16 and 17 Years | 0 (0.0%) | 0 (0.0%) |
| 18 to 24 Years | 0 (0.0%) | 8 (53.3%) |
| 25 to 34 Years | 0 (0.0%) | 0 (0.0%) |
| 35 to 44 Years | 0 (0.0%) | 5 (16.1%) |
| 45 to 54 Years | 0 (0.0%) | 1 (5.9%) |
| 55 to 64 Years | 0 (0.0%) | 22 (81.5%) |
| 65 to 74 Years | 3 (14.3%) | 0 (0.0%) |
| 75 Years and over | 0 (0.0%) | 5 (21.7%) |
| Total | 3 (2.2%) | 41 (24.5%) |
Income Above Poverty by Sex and Age in Rienzi
According to the poverty statistics in Rienzi, males aged under 5 years and females aged 12 to 14 years are the age groups that are most secure financially, with 100.0% of males and 100.0% of females in these age groups living above the poverty line.
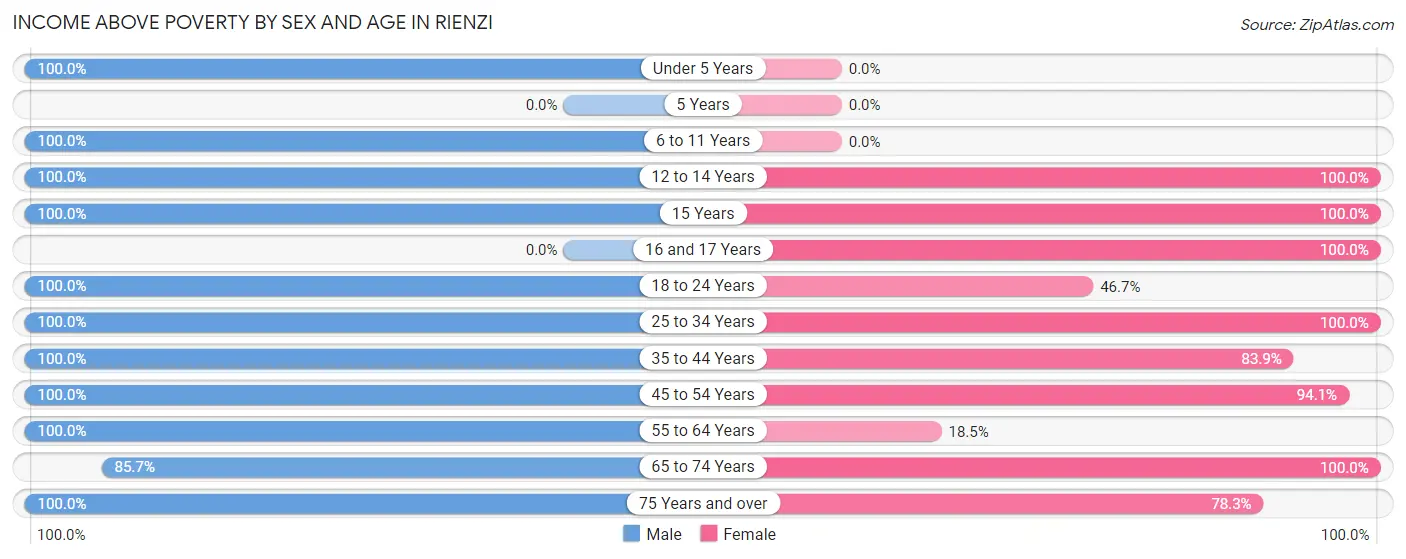
| Age Bracket | Male | Female |
| Under 5 Years | 13 (100.0%) | 0 (0.0%) |
| 5 Years | 0 (0.0%) | 0 (0.0%) |
| 6 to 11 Years | 16 (100.0%) | 0 (0.0%) |
| 12 to 14 Years | 7 (100.0%) | 19 (100.0%) |
| 15 Years | 4 (100.0%) | 5 (100.0%) |
| 16 and 17 Years | 0 (0.0%) | 6 (100.0%) |
| 18 to 24 Years | 6 (100.0%) | 7 (46.7%) |
| 25 to 34 Years | 2 (100.0%) | 4 (100.0%) |
| 35 to 44 Years | 14 (100.0%) | 26 (83.9%) |
| 45 to 54 Years | 15 (100.0%) | 16 (94.1%) |
| 55 to 64 Years | 19 (100.0%) | 5 (18.5%) |
| 65 to 74 Years | 18 (85.7%) | 20 (100.0%) |
| 75 Years and over | 18 (100.0%) | 18 (78.3%) |
| Total | 132 (97.8%) | 126 (75.4%) |
Income Below Poverty Among Married-Couple Families in Rienzi
The poverty statistics for married-couple families in Rienzi show that 5.6% or 3 of the total 54 families live below the poverty line. Families with no children have the highest poverty rate of 9.4%, comprising of 3 families. On the other hand, families with 1 or 2 children have the lowest poverty rate of 0.0%, which includes 0 families.
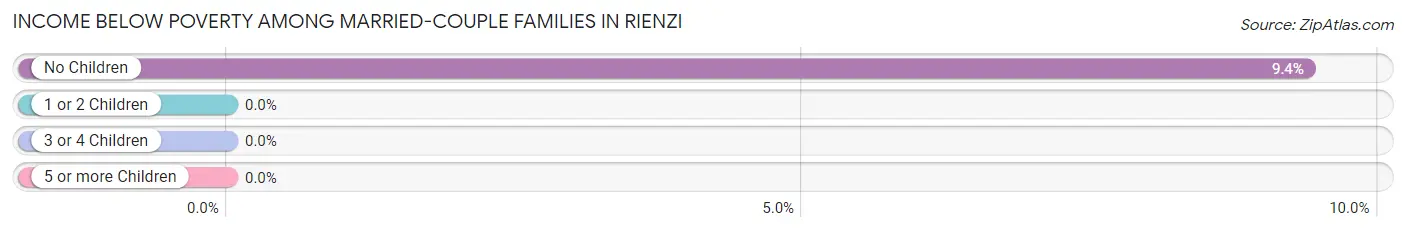
| Children | Above Poverty | Below Poverty |
| No Children | 29 (90.6%) | 3 (9.4%) |
| 1 or 2 Children | 18 (100.0%) | 0 (0.0%) |
| 3 or 4 Children | 4 (100.0%) | 0 (0.0%) |
| 5 or more Children | 0 (0.0%) | 0 (0.0%) |
| Total | 51 (94.4%) | 3 (5.6%) |
Income Below Poverty Among Single-Parent Households in Rienzi
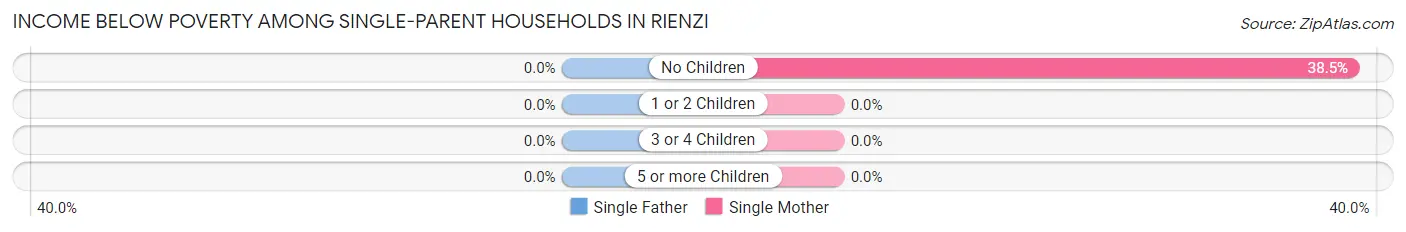
| Children | Single Father | Single Mother |
| No Children | 0 (0.0%) | 5 (38.5%) |
| 1 or 2 Children | 0 (0.0%) | 0 (0.0%) |
| 3 or 4 Children | 0 (0.0%) | 0 (0.0%) |
| 5 or more Children | 0 (0.0%) | 0 (0.0%) |
| Total | 0 (0.0%) | 5 (25.0%) |
Income Below Poverty Among Married-Couple vs Single-Parent Households in Rienzi
The poverty data for Rienzi shows that 3 of the married-couple family households (5.6%) and 5 of the single-parent households (20.0%) are living below the poverty level. Within the married-couple family households, those with no children have the highest poverty rate, with 3 households (9.4%) falling below the poverty line. Among the single-parent households, those with no children have the highest poverty rate, with 5 household (27.8%) living below poverty.
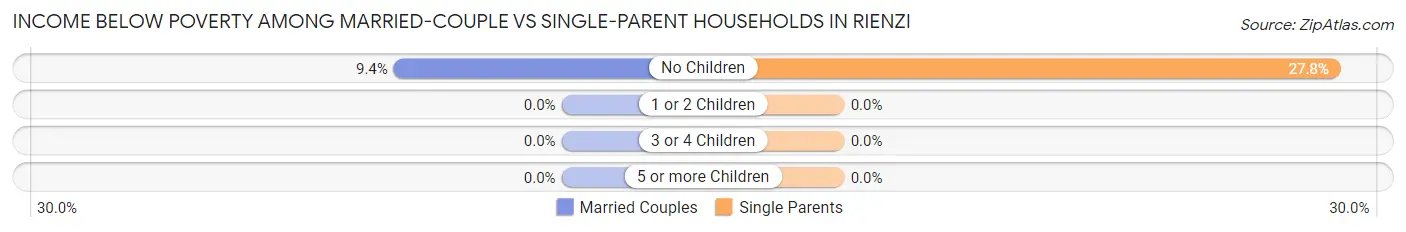
| Children | Married-Couple Families | Single-Parent Households |
| No Children | 3 (9.4%) | 5 (27.8%) |
| 1 or 2 Children | 0 (0.0%) | 0 (0.0%) |
| 3 or 4 Children | 0 (0.0%) | 0 (0.0%) |
| 5 or more Children | 0 (0.0%) | 0 (0.0%) |
| Total | 3 (5.6%) | 5 (20.0%) |
Race in Rienzi
The most populous races in Rienzi are White / Caucasian (199 | 65.9%), Black / African American (87 | 28.8%), and Two or more Races (16 | 5.3%).
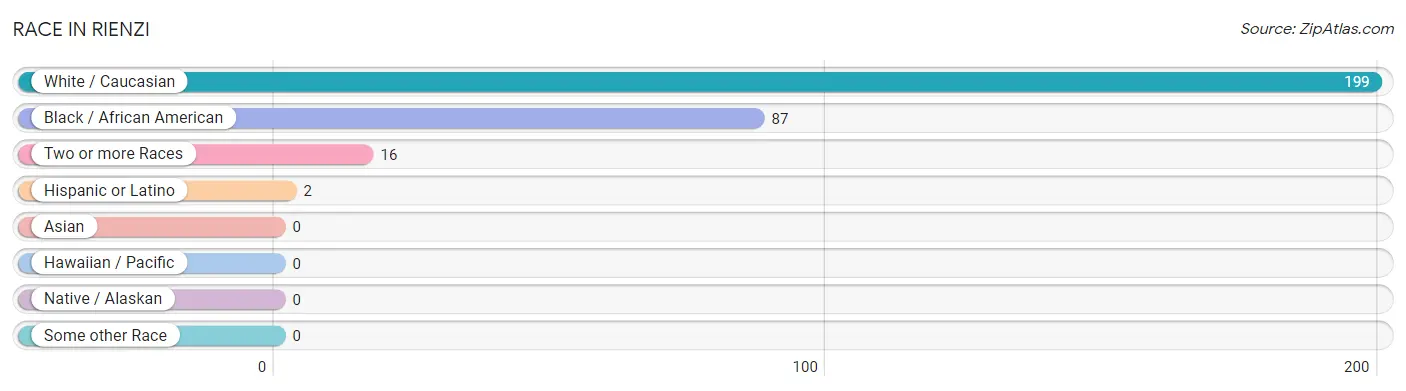
| Race | # Population | % Population |
| Asian | 0 | 0.0% |
| Black / African American | 87 | 28.8% |
| Hawaiian / Pacific | 0 | 0.0% |
| Hispanic or Latino | 2 | 0.7% |
| Native / Alaskan | 0 | 0.0% |
| White / Caucasian | 199 | 65.9% |
| Two or more Races | 16 | 5.3% |
| Some other Race | 0 | 0.0% |
| Total | 302 | 100.0% |
Ancestry in Rienzi
The most populous ancestries reported in Rienzi are American (65 | 21.5%), English (45 | 14.9%), Polish (23 | 7.6%), Irish (17 | 5.6%), and German (11 | 3.6%), together accounting for 53.3% of all Rienzi residents.
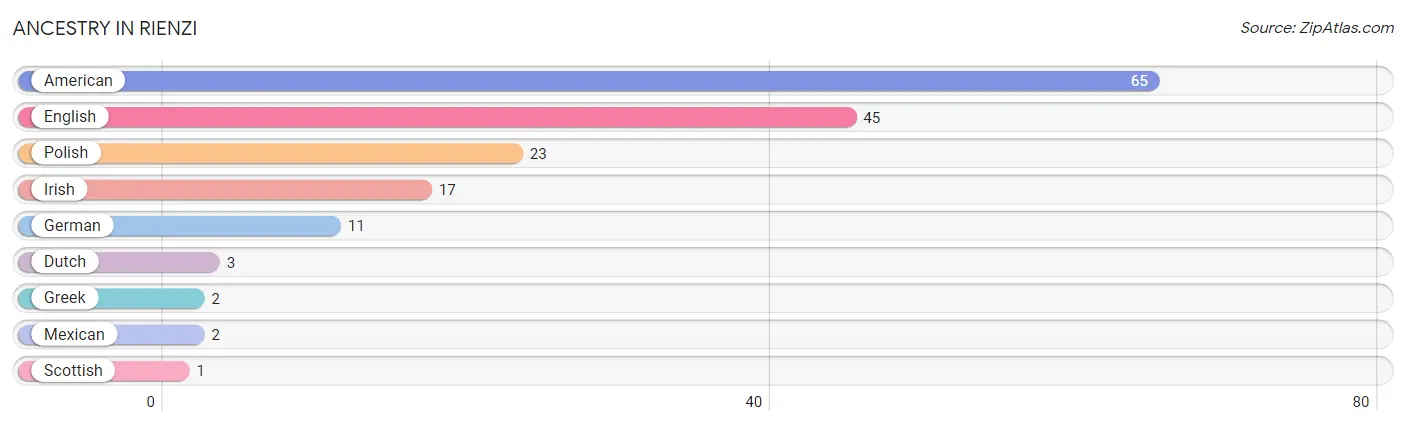
| Ancestry | # Population | % Population |
| American | 65 | 21.5% |
| Dutch | 3 | 1.0% |
| English | 45 | 14.9% |
| German | 11 | 3.6% |
| Greek | 2 | 0.7% |
| Irish | 17 | 5.6% |
| Mexican | 2 | 0.7% |
| Polish | 23 | 7.6% |
| Scottish | 1 | 0.3% | View All 9 Rows |
Immigrants in Rienzi

| Immigration Origin | # Population | % Population | View All 0 Rows |
Sex and Age in Rienzi
Sex and Age in Rienzi
The most populous age groups in Rienzi are 5 to 9 Years (16 | 11.8%) for men and 60 to 64 Years (24 | 14.4%) for women.
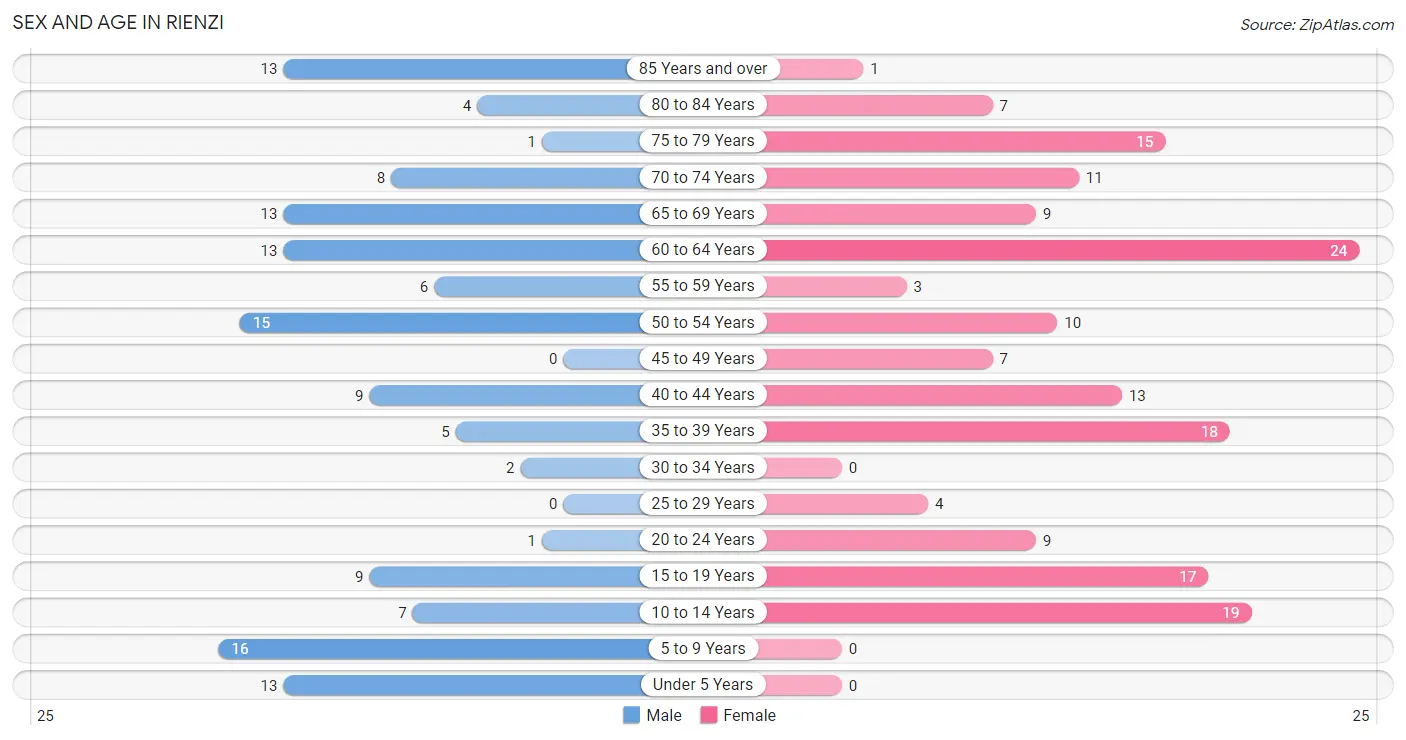
| Age Bracket | Male | Female |
| Under 5 Years | 13 (9.6%) | 0 (0.0%) |
| 5 to 9 Years | 16 (11.8%) | 0 (0.0%) |
| 10 to 14 Years | 7 (5.2%) | 19 (11.4%) |
| 15 to 19 Years | 9 (6.7%) | 17 (10.2%) |
| 20 to 24 Years | 1 (0.7%) | 9 (5.4%) |
| 25 to 29 Years | 0 (0.0%) | 4 (2.4%) |
| 30 to 34 Years | 2 (1.5%) | 0 (0.0%) |
| 35 to 39 Years | 5 (3.7%) | 18 (10.8%) |
| 40 to 44 Years | 9 (6.7%) | 13 (7.8%) |
| 45 to 49 Years | 0 (0.0%) | 7 (4.2%) |
| 50 to 54 Years | 15 (11.1%) | 10 (6.0%) |
| 55 to 59 Years | 6 (4.4%) | 3 (1.8%) |
| 60 to 64 Years | 13 (9.6%) | 24 (14.4%) |
| 65 to 69 Years | 13 (9.6%) | 9 (5.4%) |
| 70 to 74 Years | 8 (5.9%) | 11 (6.6%) |
| 75 to 79 Years | 1 (0.7%) | 15 (9.0%) |
| 80 to 84 Years | 4 (3.0%) | 7 (4.2%) |
| 85 Years and over | 13 (9.6%) | 1 (0.6%) |
| Total | 135 (100.0%) | 167 (100.0%) |
Families and Households in Rienzi
Median Family Size in Rienzi
The median family size in Rienzi is 3.09 persons per family, with married-couple families (54 | 68.3%) accounting for the largest median family size of 3.52 persons per family. On the other hand, single male/father families (5 | 6.3%) represent the smallest median family size with 2.00 persons per family.
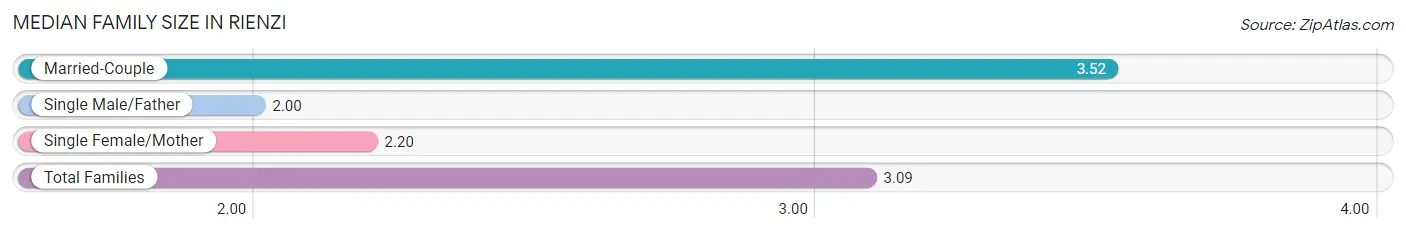
| Family Type | # Families | Family Size |
| Married-Couple | 54 (68.3%) | 3.52 |
| Single Male/Father | 5 (6.3%) | 2.00 |
| Single Female/Mother | 20 (25.3%) | 2.20 |
| Total Families | 79 (100.0%) | 3.09 |
Median Household Size in Rienzi
The median household size in Rienzi is 2.38 persons per household, with married-couple households (54 | 42.5%) accounting for the largest median household size of 3.57 persons per household. non-family households (48 | 37.8%) represent the smallest median household size with 1.15 persons per household.
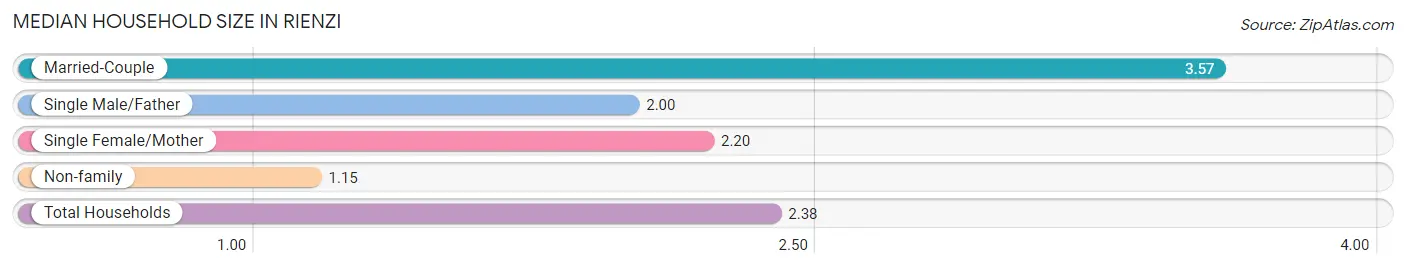
| Household Type | # Households | Household Size |
| Married-Couple | 54 (42.5%) | 3.57 |
| Single Male/Father | 5 (3.9%) | 2.00 |
| Single Female/Mother | 20 (15.8%) | 2.20 |
| Non-family | 48 (37.8%) | 1.15 |
| Total Households | 127 (100.0%) | 2.38 |
Household Size by Marriage Status in Rienzi
Out of a total of 127 households in Rienzi, 79 (62.2%) are family households, while 48 (37.8%) are nonfamily households. The most numerous type of family households are 2-person households, comprising 44, and the most common type of nonfamily households are 1-person households, comprising 42.
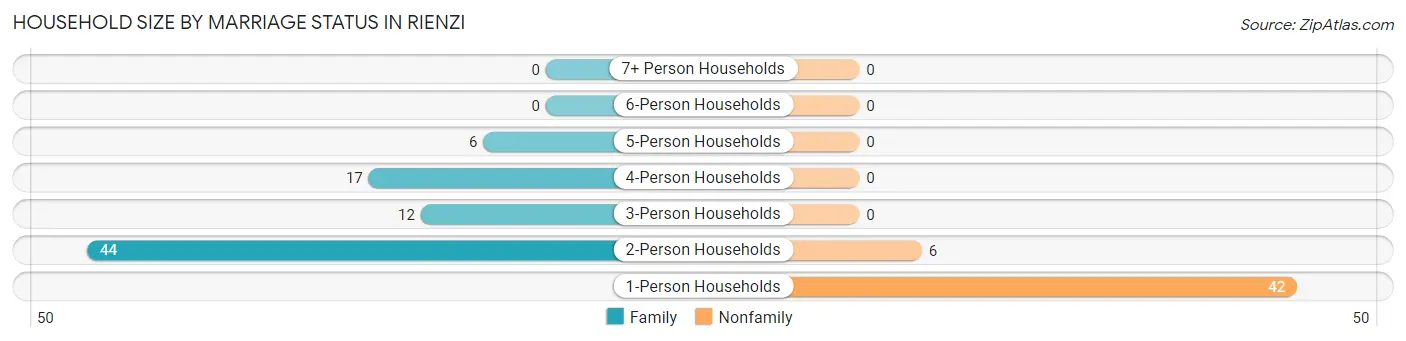
| Household Size | Family Households | Nonfamily Households |
| 1-Person Households | - | 42 (33.1%) |
| 2-Person Households | 44 (34.6%) | 6 (4.7%) |
| 3-Person Households | 12 (9.5%) | 0 (0.0%) |
| 4-Person Households | 17 (13.4%) | 0 (0.0%) |
| 5-Person Households | 6 (4.7%) | 0 (0.0%) |
| 6-Person Households | 0 (0.0%) | 0 (0.0%) |
| 7+ Person Households | 0 (0.0%) | 0 (0.0%) |
| Total | 79 (62.2%) | 48 (37.8%) |
Female Fertility in Rienzi
Fertility by Age in Rienzi
| Age Bracket | Women with Births | Births / 1,000 Women |
| 15 to 19 years | 0 (0.0%) | 0.0 |
| 20 to 34 years | 0 (0.0%) | 0.0 |
| 35 to 50 years | 0 (0.0%) | 0.0 |
| Total | 0 (0.0%) | 0.0 |
Fertility by Age by Marriage Status in Rienzi
| Age Bracket | Married | Unmarried |
| 15 to 19 years | 0 (0.0%) | 0 (0.0%) |
| 20 to 34 years | 0 (0.0%) | 0 (0.0%) |
| 35 to 50 years | 0 (0.0%) | 0 (0.0%) |
| Total | 0 (0.0%) | 0 (0.0%) |
Fertility by Education in Rienzi
| Educational Attainment | Women with Births | Births / 1,000 Women |
| Less than High School | 0 (0.0%) | 0.0 |
| High School Diploma | 0 (0.0%) | 0.0 |
| College or Associate's Degree | 0 (0.0%) | 0.0 |
| Bachelor's Degree | 0 (0.0%) | 0.0 |
| Graduate Degree | 0 (0.0%) | 0.0 |
| Total | 0 (0.0%) | 0.0 |
Fertility by Education by Marriage Status in Rienzi
| Educational Attainment | Married | Unmarried |
| Less than High School | 0 (0.0%) | 0 (0.0%) |
| High School Diploma | 0 (0.0%) | 0 (0.0%) |
| College or Associate's Degree | 0 (0.0%) | 0 (0.0%) |
| Bachelor's Degree | 0 (0.0%) | 0 (0.0%) |
| Graduate Degree | 0 (0.0%) | 0 (0.0%) |
| Total | 0 (0.0%) | 0 (0.0%) |
Employment Characteristics in Rienzi
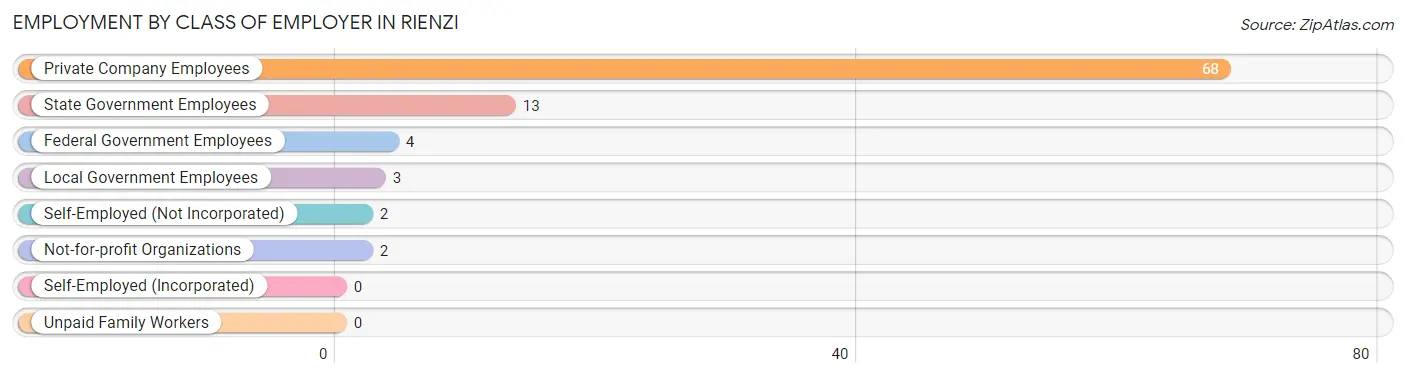
Employment by Class of Employer in Rienzi
Among the 92 employed individuals in Rienzi, private company employees (68 | 73.9%), state government employees (13 | 14.1%), and federal government employees (4 | 4.3%) make up the most common classes of employment.
| Employer Class | # Employees | % Employees |
| Private Company Employees | 68 | 73.9% |
| Self-Employed (Incorporated) | 0 | 0.0% |
| Self-Employed (Not Incorporated) | 2 | 2.2% |
| Not-for-profit Organizations | 2 | 2.2% |
| Local Government Employees | 3 | 3.3% |
| State Government Employees | 13 | 14.1% |
| Federal Government Employees | 4 | 4.3% |
| Unpaid Family Workers | 0 | 0.0% |
| Total | 92 | 100.0% |
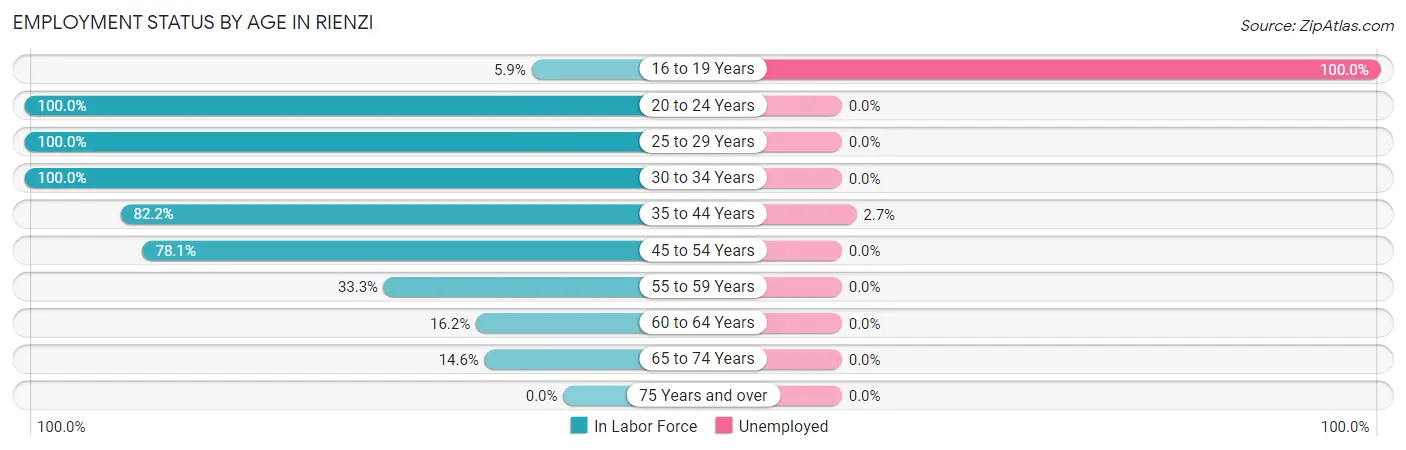
Employment Status by Age in Rienzi
According to the labor force statistics for Rienzi, out of the total population over 16 years of age (238), 39.5% or 94 individuals are in the labor force, with 2.1% or 2 of them unemployed. The age group with the highest labor force participation rate is 20 to 24 years, with 100.0% or 10 individuals in the labor force. Within the labor force, the 16 to 19 years age range has the highest percentage of unemployed individuals, with 100.0% or 1 of them being unemployed.
| Age Bracket | In Labor Force | Unemployed |
| 16 to 19 Years | 1 (5.9%) | 1 (100.0%) |
| 20 to 24 Years | 10 (100.0%) | 0 (0.0%) |
| 25 to 29 Years | 4 (100.0%) | 0 (0.0%) |
| 30 to 34 Years | 2 (100.0%) | 0 (0.0%) |
| 35 to 44 Years | 37 (82.2%) | 1 (2.7%) |
| 45 to 54 Years | 25 (78.1%) | 0 (0.0%) |
| 55 to 59 Years | 3 (33.3%) | 0 (0.0%) |
| 60 to 64 Years | 6 (16.2%) | 0 (0.0%) |
| 65 to 74 Years | 6 (14.6%) | 0 (0.0%) |
| 75 Years and over | 0 (0.0%) | 0 (0.0%) |
| Total | 94 (39.5%) | 2 (2.1%) |
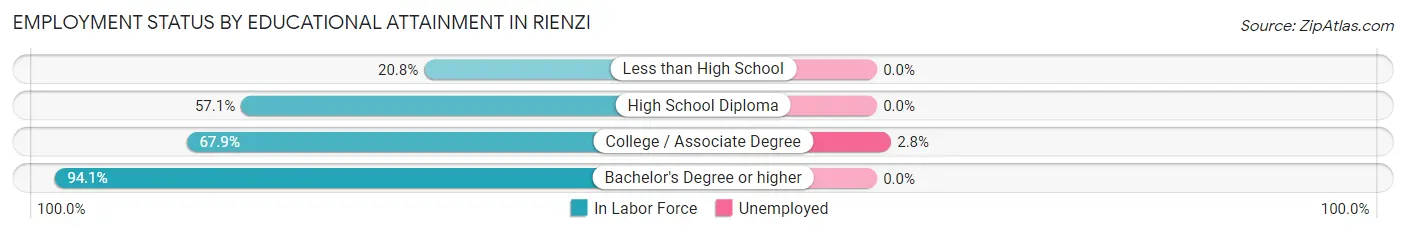
Employment Status by Educational Attainment in Rienzi
According to labor force statistics for Rienzi, 59.7% of individuals (77) out of the total population between 25 and 64 years of age (129) are in the labor force, with 1.3% or 1 of them being unemployed. The group with the highest labor force participation rate are those with the educational attainment of bachelor's degree or higher, with 94.1% or 16 individuals in the labor force. Within the labor force, individuals with college / associate degree education have the highest percentage of unemployment, with 2.8% or 1 of them being unemployed.
| Educational Attainment | In Labor Force | Unemployed |
| Less than High School | 5 (20.8%) | 0 (0.0%) |
| High School Diploma | 20 (57.1%) | 0 (0.0%) |
| College / Associate Degree | 36 (67.9%) | 1 (2.8%) |
| Bachelor's Degree or higher | 16 (94.1%) | 0 (0.0%) |
| Total | 77 (59.7%) | 2 (1.3%) |
Employment Occupations by Sex in Rienzi
Management, Business, Science and Arts Occupations
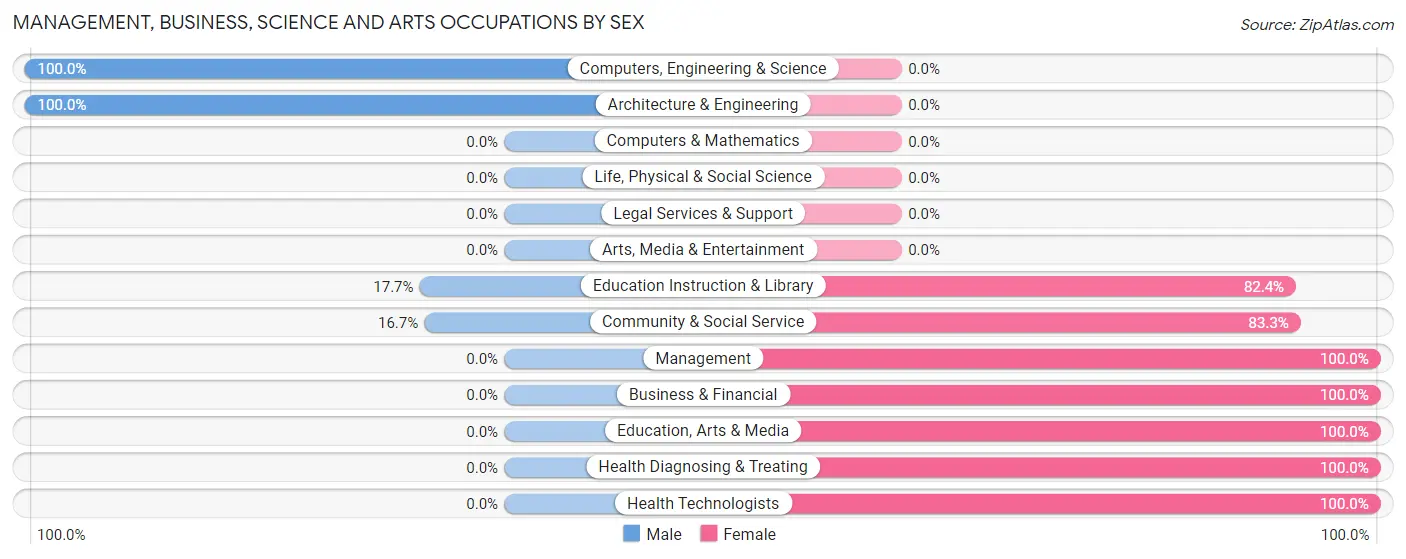
The most common Management, Business, Science and Arts occupations in Rienzi are Community & Social Service (18 | 19.6%), Education Instruction & Library (17 | 18.5%), Management (4 | 4.3%), Health Diagnosing & Treating (2 | 2.2%), and Health Technologists (2 | 2.2%).
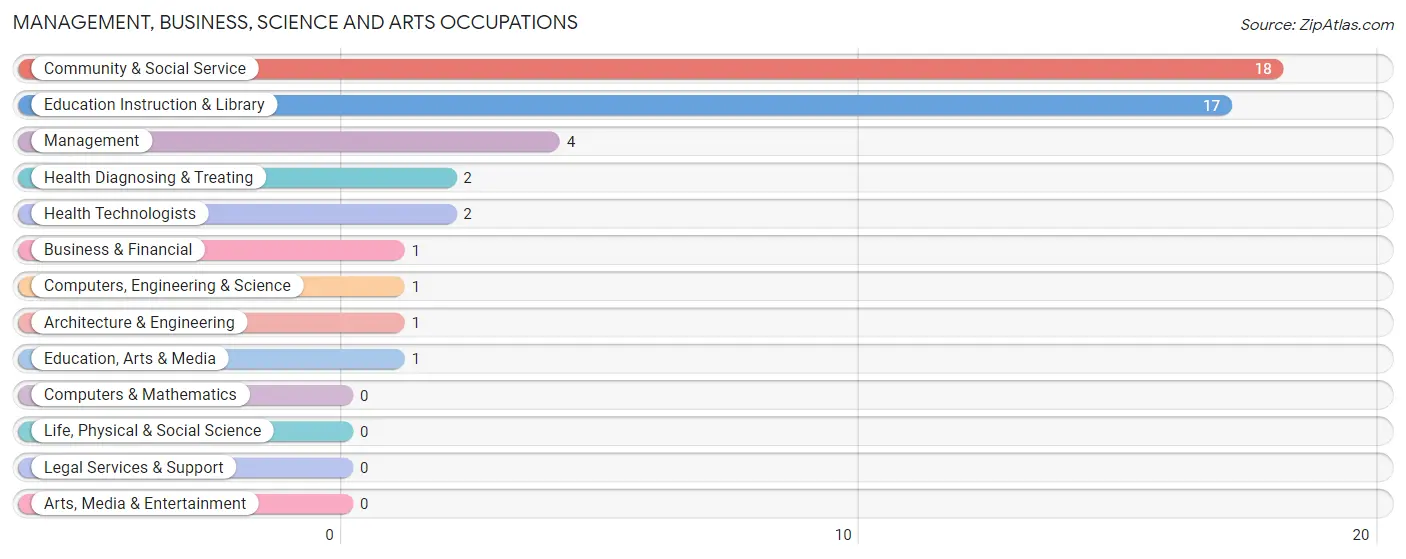
Management, Business, Science and Arts Occupations by Sex
Within the Management, Business, Science and Arts occupations in Rienzi, the most male-oriented occupations are Computers, Engineering & Science (100.0%), Architecture & Engineering (100.0%), and Education Instruction & Library (17.6%), while the most female-oriented occupations are Management (100.0%), Business & Financial (100.0%), and Education, Arts & Media (100.0%).
| Occupation | Male | Female |
| Management | 0 (0.0%) | 4 (100.0%) |
| Business & Financial | 0 (0.0%) | 1 (100.0%) |
| Computers, Engineering & Science | 1 (100.0%) | 0 (0.0%) |
| Computers & Mathematics | 0 (0.0%) | 0 (0.0%) |
| Architecture & Engineering | 1 (100.0%) | 0 (0.0%) |
| Life, Physical & Social Science | 0 (0.0%) | 0 (0.0%) |
| Community & Social Service | 3 (16.7%) | 15 (83.3%) |
| Education, Arts & Media | 0 (0.0%) | 1 (100.0%) |
| Legal Services & Support | 0 (0.0%) | 0 (0.0%) |
| Education Instruction & Library | 3 (17.6%) | 14 (82.4%) |
| Arts, Media & Entertainment | 0 (0.0%) | 0 (0.0%) |
| Health Diagnosing & Treating | 0 (0.0%) | 2 (100.0%) |
| Health Technologists | 0 (0.0%) | 2 (100.0%) |
| Total (Category) | 4 (15.4%) | 22 (84.6%) |
| Total (Overall) | 37 (40.2%) | 55 (59.8%) |
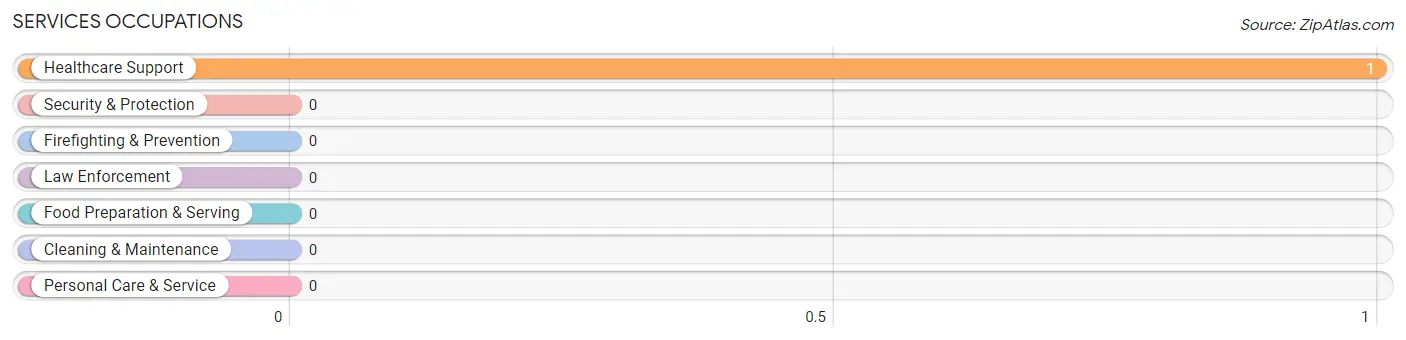
Services Occupations
The most common Services occupations in Rienzi are , and Healthcare Support (1 | 1.1%).
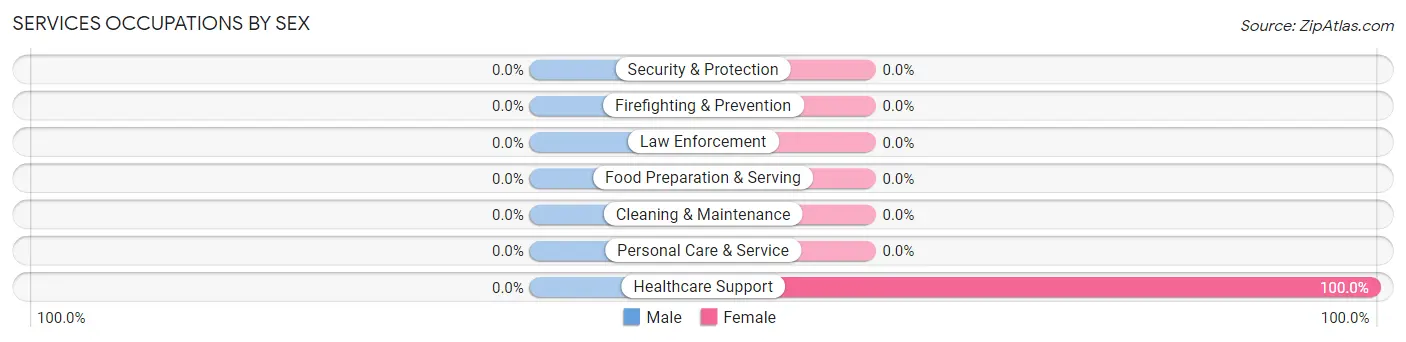
Services Occupations by Sex
| Occupation | Male | Female |
| Healthcare Support | 0 (0.0%) | 1 (100.0%) |
| Security & Protection | 0 (0.0%) | 0 (0.0%) |
| Firefighting & Prevention | 0 (0.0%) | 0 (0.0%) |
| Law Enforcement | 0 (0.0%) | 0 (0.0%) |
| Food Preparation & Serving | 0 (0.0%) | 0 (0.0%) |
| Cleaning & Maintenance | 0 (0.0%) | 0 (0.0%) |
| Personal Care & Service | 0 (0.0%) | 0 (0.0%) |
| Total (Category) | 0 (0.0%) | 1 (100.0%) |
| Total (Overall) | 37 (40.2%) | 55 (59.8%) |
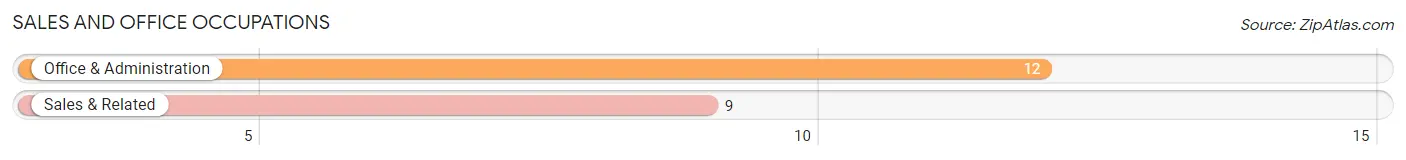
Sales and Office Occupations
The most common Sales and Office occupations in Rienzi are Office & Administration (12 | 13.0%), and Sales & Related (9 | 9.8%).
Sales and Office Occupations by Sex
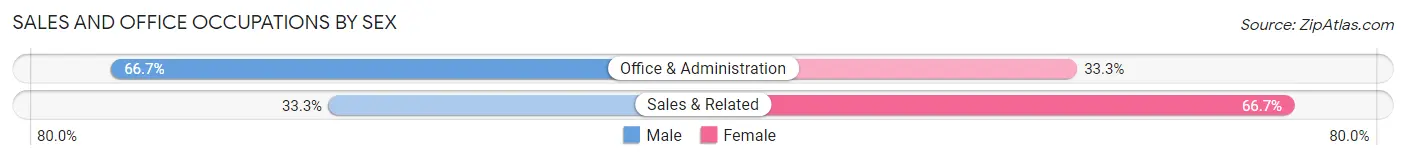
| Occupation | Male | Female |
| Sales & Related | 3 (33.3%) | 6 (66.7%) |
| Office & Administration | 8 (66.7%) | 4 (33.3%) |
| Total (Category) | 11 (52.4%) | 10 (47.6%) |
| Total (Overall) | 37 (40.2%) | 55 (59.8%) |
Natural Resources, Construction and Maintenance Occupations
Natural Resources, Construction and Maintenance Occupations by Sex
| Occupation | Male | Female |
| Farming, Fishing & Forestry | 0 (0.0%) | 0 (0.0%) |
| Construction & Extraction | 0 (0.0%) | 0 (0.0%) |
| Installation, Maintenance & Repair | 0 (0.0%) | 0 (0.0%) |
| Total (Category) | 0 (0.0%) | 0 (0.0%) |
| Total (Overall) | 37 (40.2%) | 55 (59.8%) |
Production, Transportation and Moving Occupations
The most common Production, Transportation and Moving occupations in Rienzi are Material Moving (23 | 25.0%), Production (19 | 20.6%), and Transportation (2 | 2.2%).
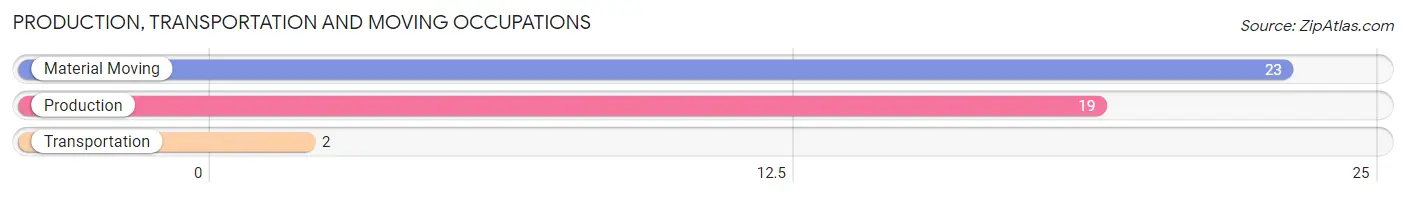
Production, Transportation and Moving Occupations by Sex
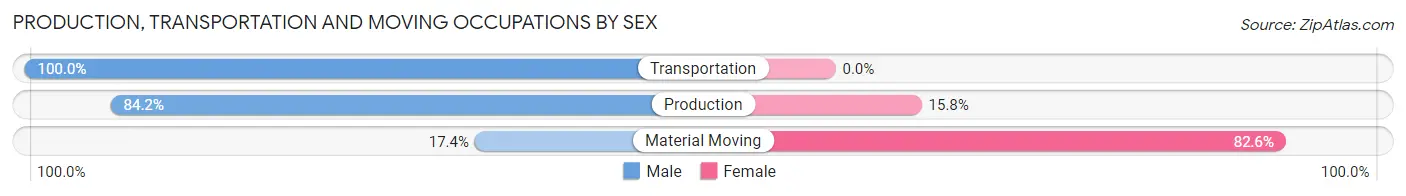
| Occupation | Male | Female |
| Production | 16 (84.2%) | 3 (15.8%) |
| Transportation | 2 (100.0%) | 0 (0.0%) |
| Material Moving | 4 (17.4%) | 19 (82.6%) |
| Total (Category) | 22 (50.0%) | 22 (50.0%) |
| Total (Overall) | 37 (40.2%) | 55 (59.8%) |
Employment Industries by Sex in Rienzi
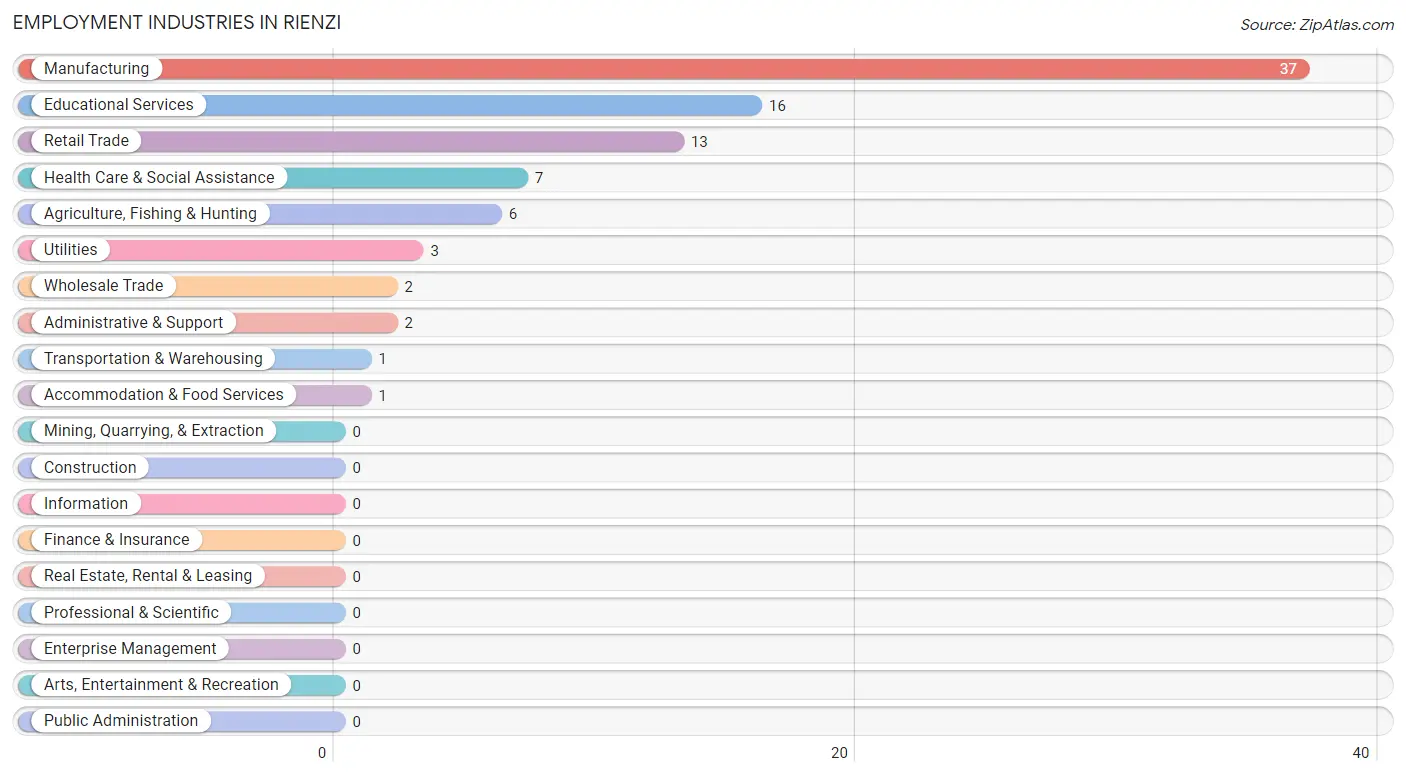
Employment Industries in Rienzi
The major employment industries in Rienzi include Manufacturing (37 | 40.2%), Educational Services (16 | 17.4%), Retail Trade (13 | 14.1%), Health Care & Social Assistance (7 | 7.6%), and Agriculture, Fishing & Hunting (6 | 6.5%).
Employment Industries by Sex in Rienzi
The Rienzi industries that see more men than women are Wholesale Trade (100.0%), Transportation & Warehousing (100.0%), and Administrative & Support (100.0%), whereas the industries that tend to have a higher number of women are Agriculture, Fishing & Hunting (100.0%), Health Care & Social Assistance (100.0%), and Accommodation & Food Services (100.0%).
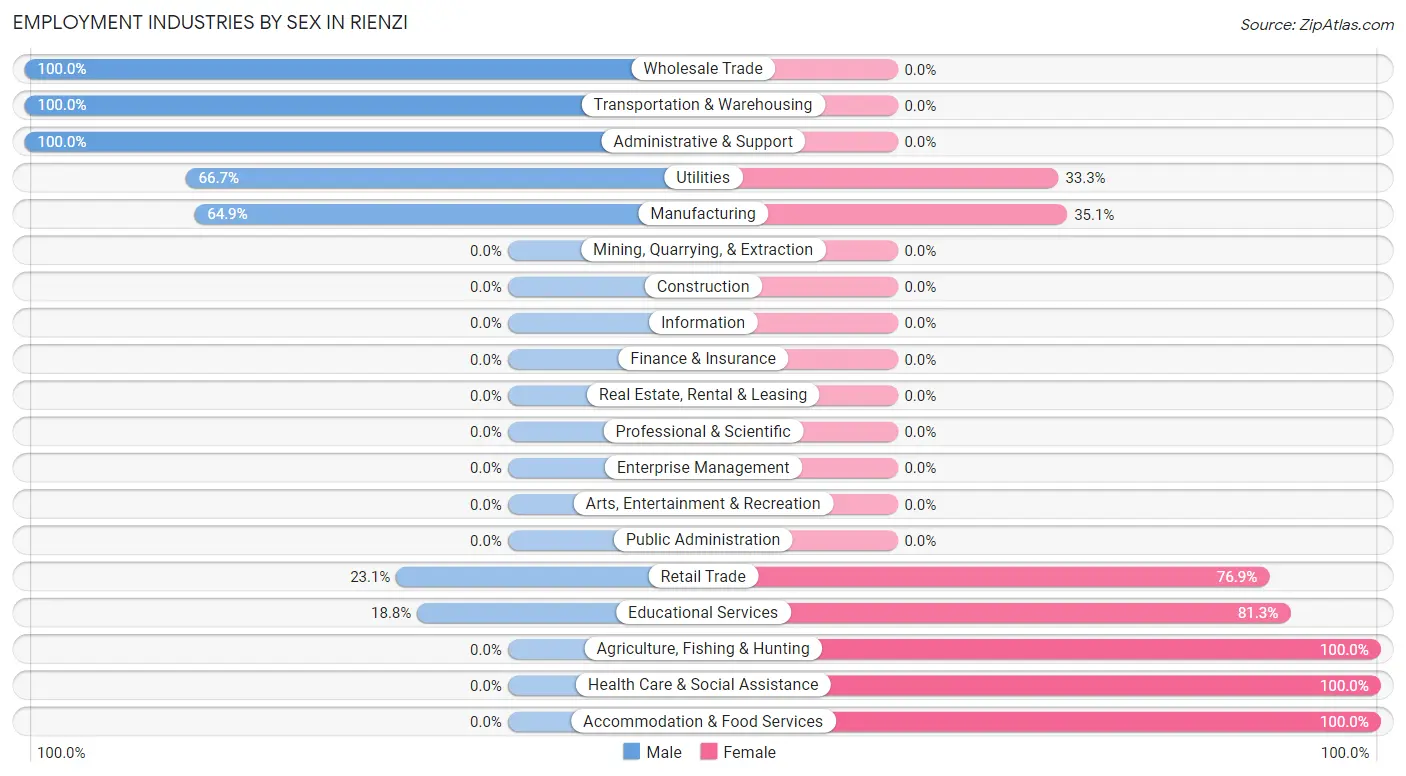
| Industry | Male | Female |
| Agriculture, Fishing & Hunting | 0 (0.0%) | 6 (100.0%) |
| Mining, Quarrying, & Extraction | 0 (0.0%) | 0 (0.0%) |
| Construction | 0 (0.0%) | 0 (0.0%) |
| Manufacturing | 24 (64.9%) | 13 (35.1%) |
| Wholesale Trade | 2 (100.0%) | 0 (0.0%) |
| Retail Trade | 3 (23.1%) | 10 (76.9%) |
| Transportation & Warehousing | 1 (100.0%) | 0 (0.0%) |
| Utilities | 2 (66.7%) | 1 (33.3%) |
| Information | 0 (0.0%) | 0 (0.0%) |
| Finance & Insurance | 0 (0.0%) | 0 (0.0%) |
| Real Estate, Rental & Leasing | 0 (0.0%) | 0 (0.0%) |
| Professional & Scientific | 0 (0.0%) | 0 (0.0%) |
| Enterprise Management | 0 (0.0%) | 0 (0.0%) |
| Administrative & Support | 2 (100.0%) | 0 (0.0%) |
| Educational Services | 3 (18.8%) | 13 (81.2%) |
| Health Care & Social Assistance | 0 (0.0%) | 7 (100.0%) |
| Arts, Entertainment & Recreation | 0 (0.0%) | 0 (0.0%) |
| Accommodation & Food Services | 0 (0.0%) | 1 (100.0%) |
| Public Administration | 0 (0.0%) | 0 (0.0%) |
| Total | 37 (40.2%) | 55 (59.8%) |
Education in Rienzi
School Enrollment in Rienzi
The most common levels of schooling among the 73 students in Rienzi are high school (23 | 31.5%), middle school (19 | 26.0%), and elementary school (16 | 21.9%).
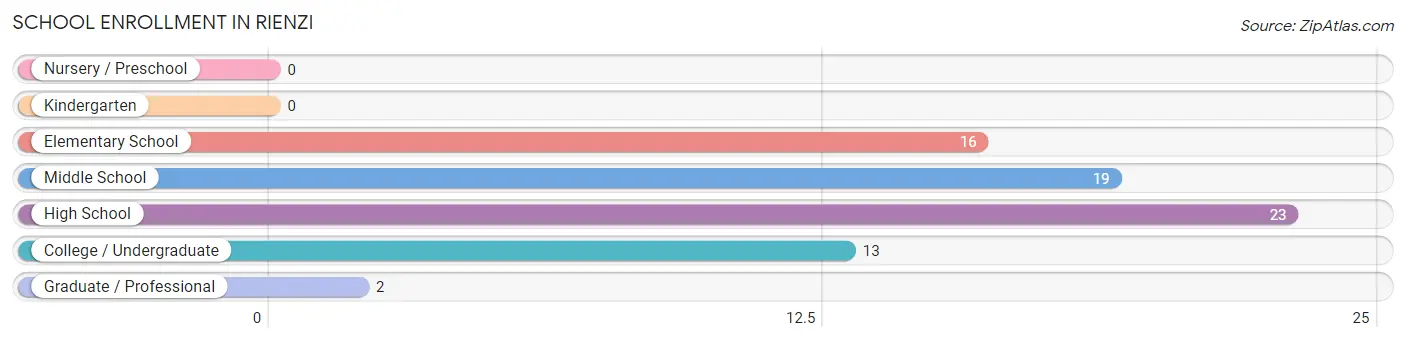
| School Level | # Students | % Students |
| Nursery / Preschool | 0 | 0.0% |
| Kindergarten | 0 | 0.0% |
| Elementary School | 16 | 21.9% |
| Middle School | 19 | 26.0% |
| High School | 23 | 31.5% |
| College / Undergraduate | 13 | 17.8% |
| Graduate / Professional | 2 | 2.7% |
| Total | 73 | 100.0% |
School Enrollment by Age by Funding Source in Rienzi
Out of a total of 73 students who are enrolled in schools in Rienzi, 12 (16.4%) attend a private institution, while the remaining 61 (83.6%) are enrolled in public schools. The age group of 20 to 24 year olds has the highest likelihood of being enrolled in private schools, with 3 (60.0% in the age bracket) enrolled. Conversely, the age group of 10 to 14 year olds has the lowest likelihood of being enrolled in a private school, with 26 (100.0% in the age bracket) attending a public institution.
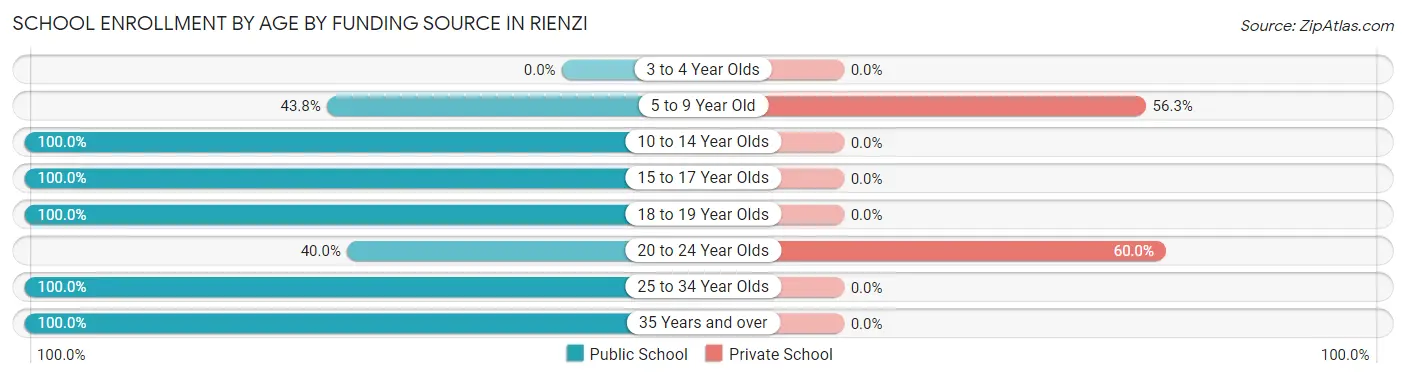
| Age Bracket | Public School | Private School |
| 3 to 4 Year Olds | 0 (0.0%) | 0 (0.0%) |
| 5 to 9 Year Old | 7 (43.8%) | 9 (56.2%) |
| 10 to 14 Year Olds | 26 (100.0%) | 0 (0.0%) |
| 15 to 17 Year Olds | 15 (100.0%) | 0 (0.0%) |
| 18 to 19 Year Olds | 8 (100.0%) | 0 (0.0%) |
| 20 to 24 Year Olds | 2 (40.0%) | 3 (60.0%) |
| 25 to 34 Year Olds | 2 (100.0%) | 0 (0.0%) |
| 35 Years and over | 1 (100.0%) | 0 (0.0%) |
| Total | 61 (83.6%) | 12 (16.4%) |
Educational Attainment by Field of Study in Rienzi
Education (8 | 33.3%), science & technology (7 | 29.2%), arts & humanities (3 | 12.5%), computers & mathematics (2 | 8.3%), and bio, nature & agricultural (2 | 8.3%) are the most common fields of study among 24 individuals in Rienzi who have obtained a bachelor's degree or higher.
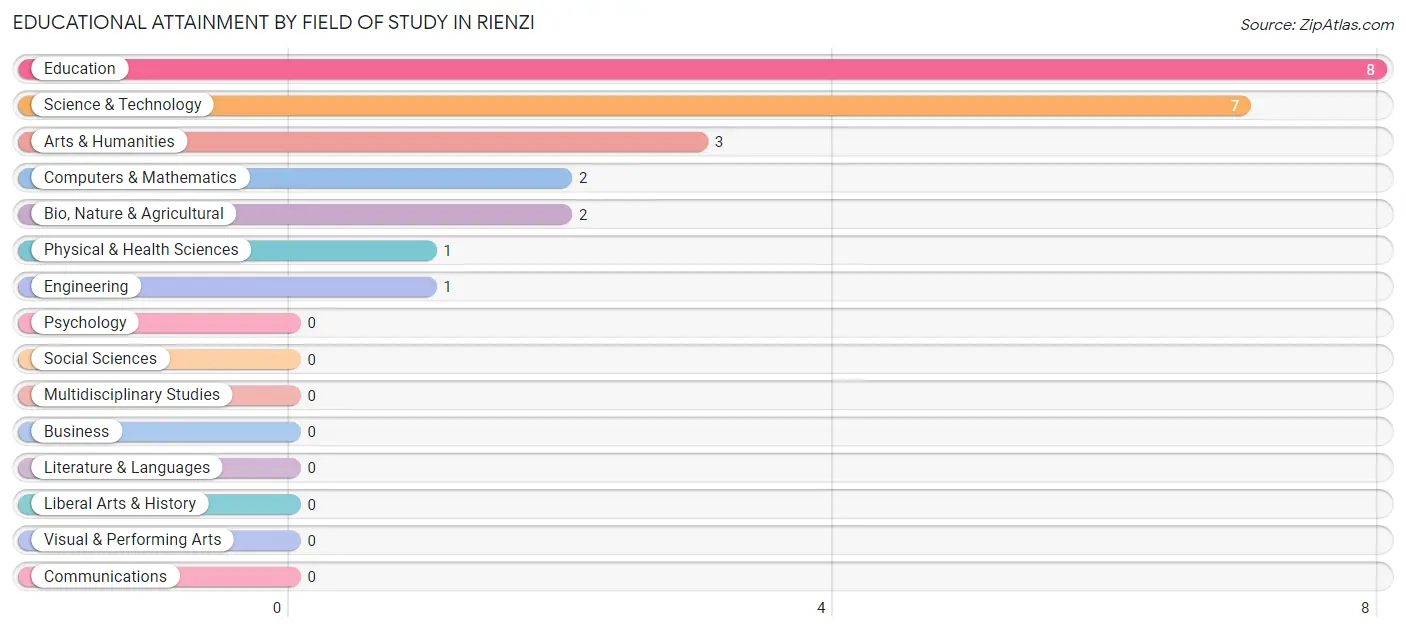
| Field of Study | # Graduates | % Graduates |
| Computers & Mathematics | 2 | 8.3% |
| Bio, Nature & Agricultural | 2 | 8.3% |
| Physical & Health Sciences | 1 | 4.2% |
| Psychology | 0 | 0.0% |
| Social Sciences | 0 | 0.0% |
| Engineering | 1 | 4.2% |
| Multidisciplinary Studies | 0 | 0.0% |
| Science & Technology | 7 | 29.2% |
| Business | 0 | 0.0% |
| Education | 8 | 33.3% |
| Literature & Languages | 0 | 0.0% |
| Liberal Arts & History | 0 | 0.0% |
| Visual & Performing Arts | 0 | 0.0% |
| Communications | 0 | 0.0% |
| Arts & Humanities | 3 | 12.5% |
| Total | 24 | 100.0% |
Transportation & Commute in Rienzi
Vehicle Availability by Sex in Rienzi
The most prevalent vehicle ownership categories in Rienzi are males with 2 vehicles (15, accounting for 40.5%) and females with 2 vehicles (18, making up 27.3%).
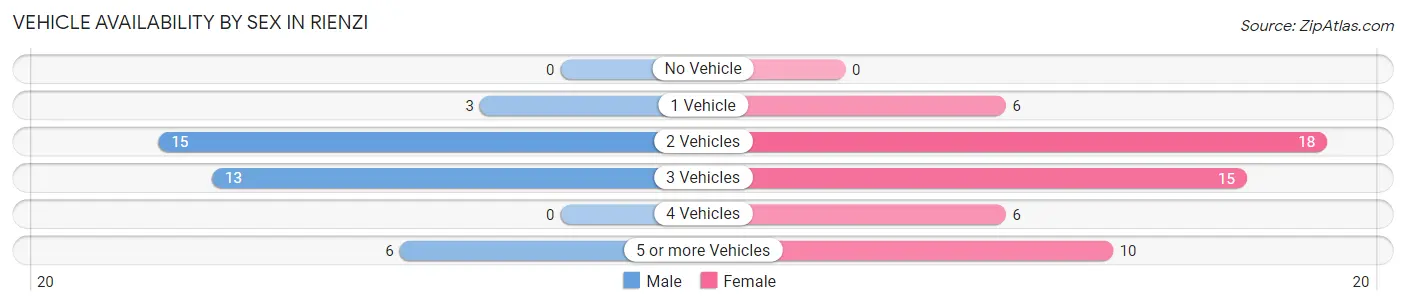
| Vehicles Available | Male | Female |
| No Vehicle | 0 (0.0%) | 0 (0.0%) |
| 1 Vehicle | 3 (8.1%) | 6 (10.9%) |
| 2 Vehicles | 15 (40.5%) | 18 (32.7%) |
| 3 Vehicles | 13 (35.1%) | 15 (27.3%) |
| 4 Vehicles | 0 (0.0%) | 6 (10.9%) |
| 5 or more Vehicles | 6 (16.2%) | 10 (18.2%) |
| Total | 37 (100.0%) | 55 (100.0%) |
Commute Time in Rienzi
The most frequently occuring commute durations in Rienzi are 20 to 24 minutes (28 commuters, 30.4%), 10 to 14 minutes (22 commuters, 23.9%), and 15 to 19 minutes (19 commuters, 20.6%).
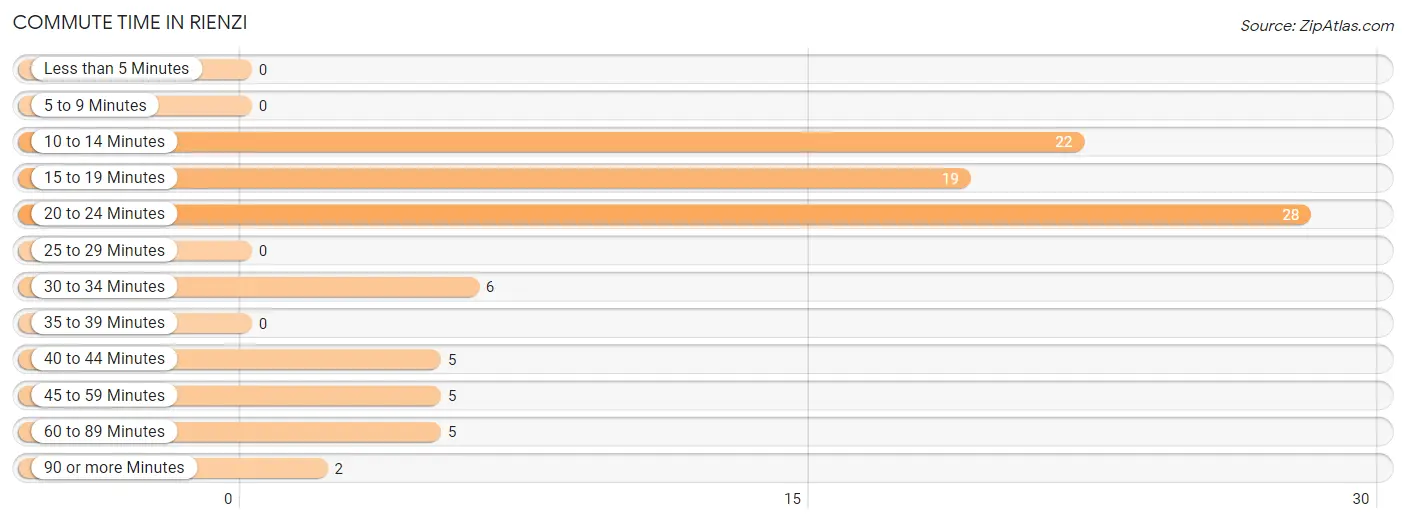
| Commute Time | # Commuters | % Commuters |
| Less than 5 Minutes | 0 | 0.0% |
| 5 to 9 Minutes | 0 | 0.0% |
| 10 to 14 Minutes | 22 | 23.9% |
| 15 to 19 Minutes | 19 | 20.6% |
| 20 to 24 Minutes | 28 | 30.4% |
| 25 to 29 Minutes | 0 | 0.0% |
| 30 to 34 Minutes | 6 | 6.5% |
| 35 to 39 Minutes | 0 | 0.0% |
| 40 to 44 Minutes | 5 | 5.4% |
| 45 to 59 Minutes | 5 | 5.4% |
| 60 to 89 Minutes | 5 | 5.4% |
| 90 or more Minutes | 2 | 2.2% |
Commute Time by Sex in Rienzi
The most common commute times in Rienzi are 15 to 19 minutes (18 commuters, 48.6%) for males and 10 to 14 minutes (19 commuters, 34.5%) for females.
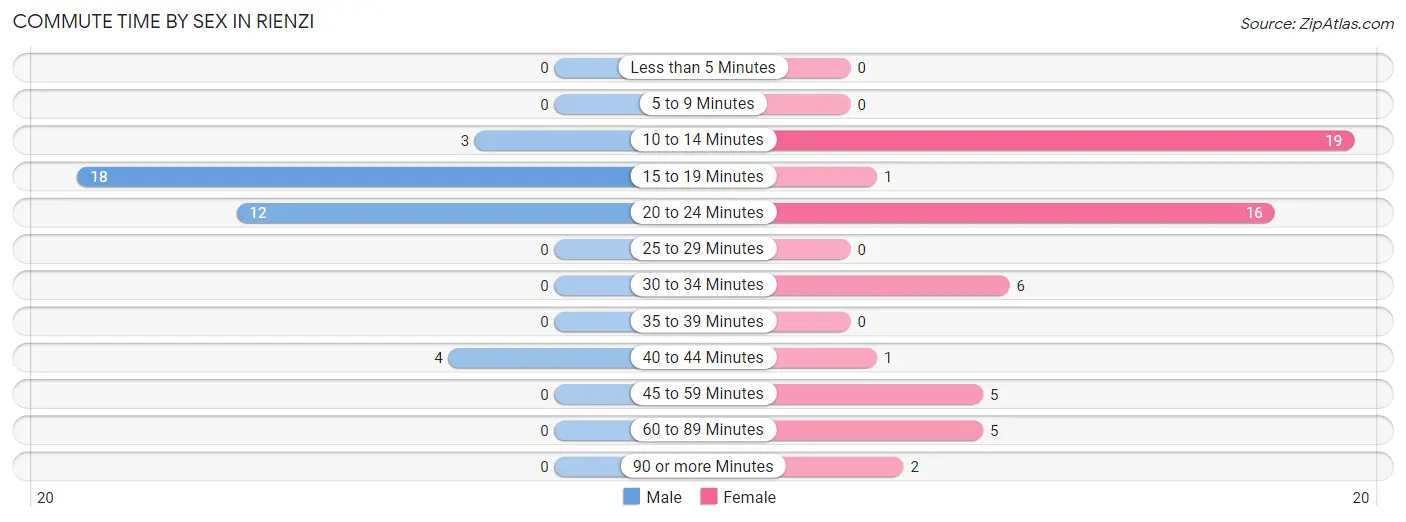
| Commute Time | Male | Female |
| Less than 5 Minutes | 0 (0.0%) | 0 (0.0%) |
| 5 to 9 Minutes | 0 (0.0%) | 0 (0.0%) |
| 10 to 14 Minutes | 3 (8.1%) | 19 (34.5%) |
| 15 to 19 Minutes | 18 (48.6%) | 1 (1.8%) |
| 20 to 24 Minutes | 12 (32.4%) | 16 (29.1%) |
| 25 to 29 Minutes | 0 (0.0%) | 0 (0.0%) |
| 30 to 34 Minutes | 0 (0.0%) | 6 (10.9%) |
| 35 to 39 Minutes | 0 (0.0%) | 0 (0.0%) |
| 40 to 44 Minutes | 4 (10.8%) | 1 (1.8%) |
| 45 to 59 Minutes | 0 (0.0%) | 5 (9.1%) |
| 60 to 89 Minutes | 0 (0.0%) | 5 (9.1%) |
| 90 or more Minutes | 0 (0.0%) | 2 (3.6%) |
Time of Departure to Work by Sex in Rienzi
The most frequent times of departure to work in Rienzi are 7:00 AM to 7:29 AM (8, 21.6%) for males and 12:00 AM to 4:59 AM (9, 16.4%) for females.
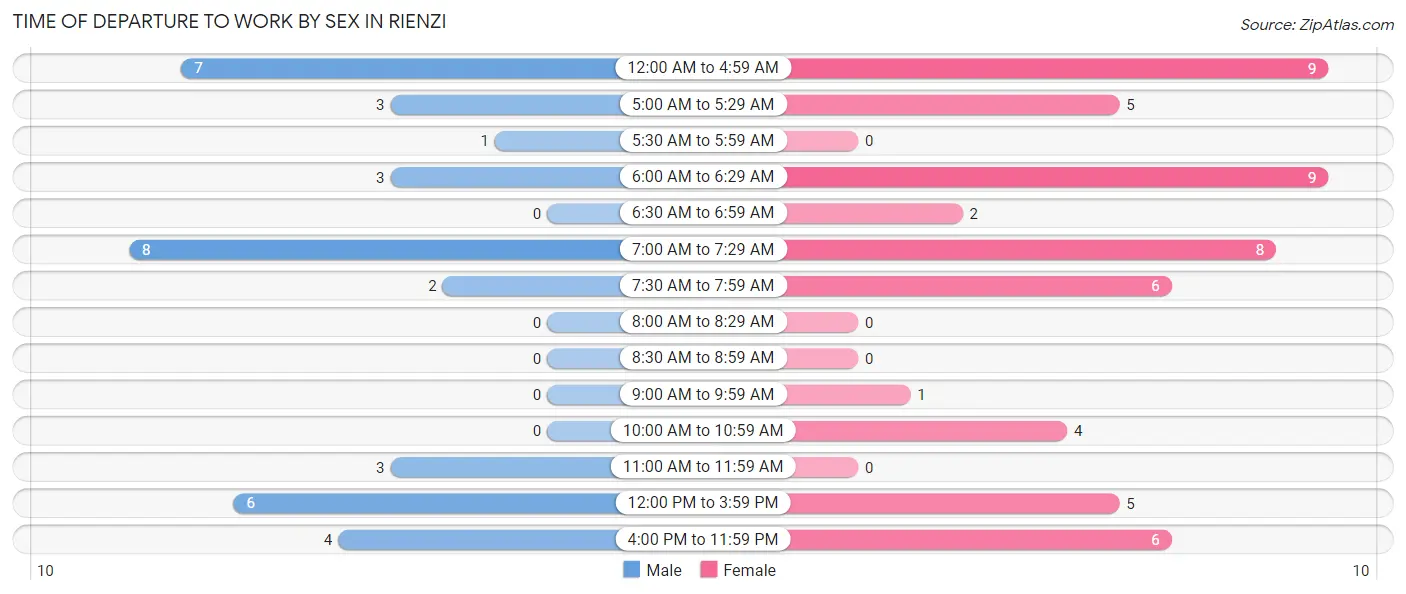
| Time of Departure | Male | Female |
| 12:00 AM to 4:59 AM | 7 (18.9%) | 9 (16.4%) |
| 5:00 AM to 5:29 AM | 3 (8.1%) | 5 (9.1%) |
| 5:30 AM to 5:59 AM | 1 (2.7%) | 0 (0.0%) |
| 6:00 AM to 6:29 AM | 3 (8.1%) | 9 (16.4%) |
| 6:30 AM to 6:59 AM | 0 (0.0%) | 2 (3.6%) |
| 7:00 AM to 7:29 AM | 8 (21.6%) | 8 (14.5%) |
| 7:30 AM to 7:59 AM | 2 (5.4%) | 6 (10.9%) |
| 8:00 AM to 8:29 AM | 0 (0.0%) | 0 (0.0%) |
| 8:30 AM to 8:59 AM | 0 (0.0%) | 0 (0.0%) |
| 9:00 AM to 9:59 AM | 0 (0.0%) | 1 (1.8%) |
| 10:00 AM to 10:59 AM | 0 (0.0%) | 4 (7.3%) |
| 11:00 AM to 11:59 AM | 3 (8.1%) | 0 (0.0%) |
| 12:00 PM to 3:59 PM | 6 (16.2%) | 5 (9.1%) |
| 4:00 PM to 11:59 PM | 4 (10.8%) | 6 (10.9%) |
| Total | 37 (100.0%) | 55 (100.0%) |
Housing Occupancy in Rienzi
Occupancy by Ownership in Rienzi
Of the total 127 dwellings in Rienzi, owner-occupied units account for 95 (74.8%), while renter-occupied units make up 32 (25.2%).
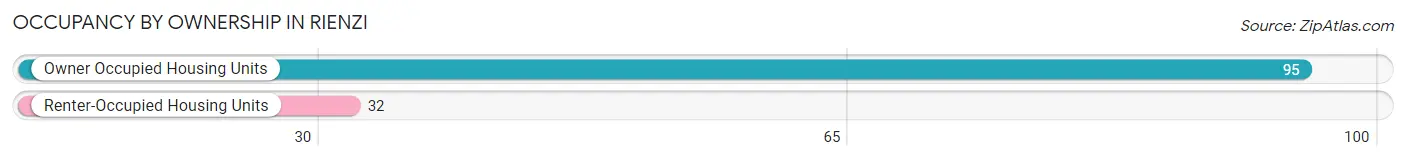
| Occupancy | # Housing Units | % Housing Units |
| Owner Occupied Housing Units | 95 | 74.8% |
| Renter-Occupied Housing Units | 32 | 25.2% |
| Total Occupied Housing Units | 127 | 100.0% |
Occupancy by Household Size in Rienzi
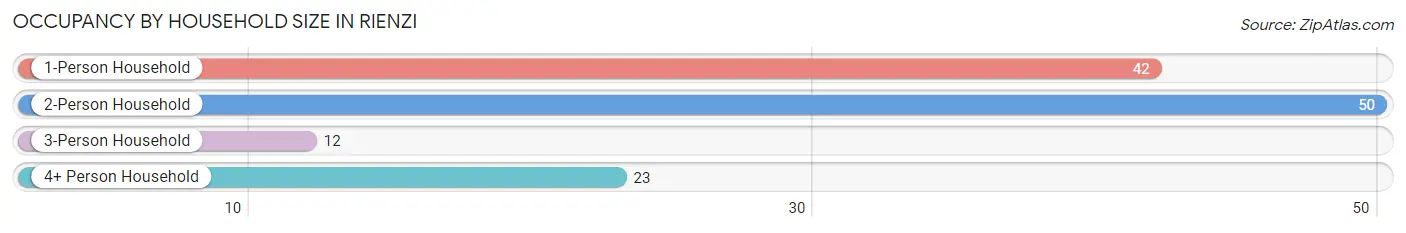
| Household Size | # Housing Units | % Housing Units |
| 1-Person Household | 42 | 33.1% |
| 2-Person Household | 50 | 39.4% |
| 3-Person Household | 12 | 9.5% |
| 4+ Person Household | 23 | 18.1% |
| Total Housing Units | 127 | 100.0% |
Occupancy by Ownership by Household Size in Rienzi
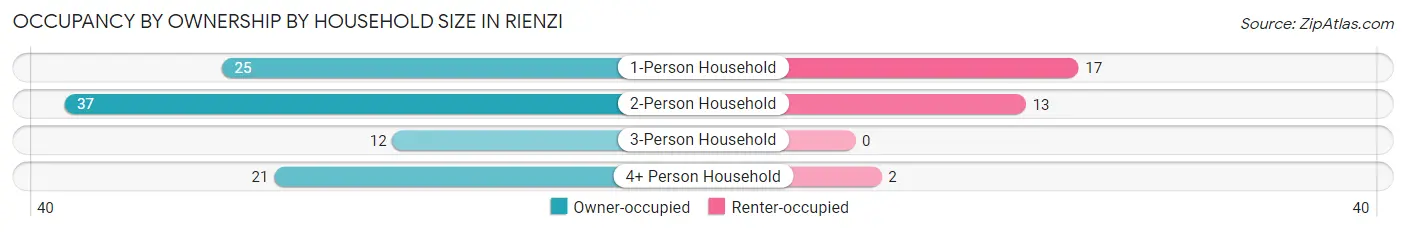
| Household Size | Owner-occupied | Renter-occupied |
| 1-Person Household | 25 (59.5%) | 17 (40.5%) |
| 2-Person Household | 37 (74.0%) | 13 (26.0%) |
| 3-Person Household | 12 (100.0%) | 0 (0.0%) |
| 4+ Person Household | 21 (91.3%) | 2 (8.7%) |
| Total Housing Units | 95 (74.8%) | 32 (25.2%) |
Occupancy by Educational Attainment in Rienzi
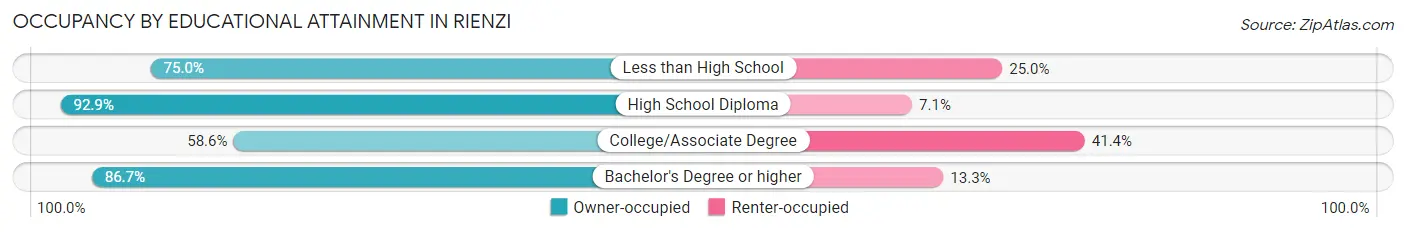
| Household Size | Owner-occupied | Renter-occupied |
| Less than High School | 9 (75.0%) | 3 (25.0%) |
| High School Diploma | 39 (92.9%) | 3 (7.1%) |
| College/Associate Degree | 34 (58.6%) | 24 (41.4%) |
| Bachelor's Degree or higher | 13 (86.7%) | 2 (13.3%) |
Occupancy by Age of Householder in Rienzi
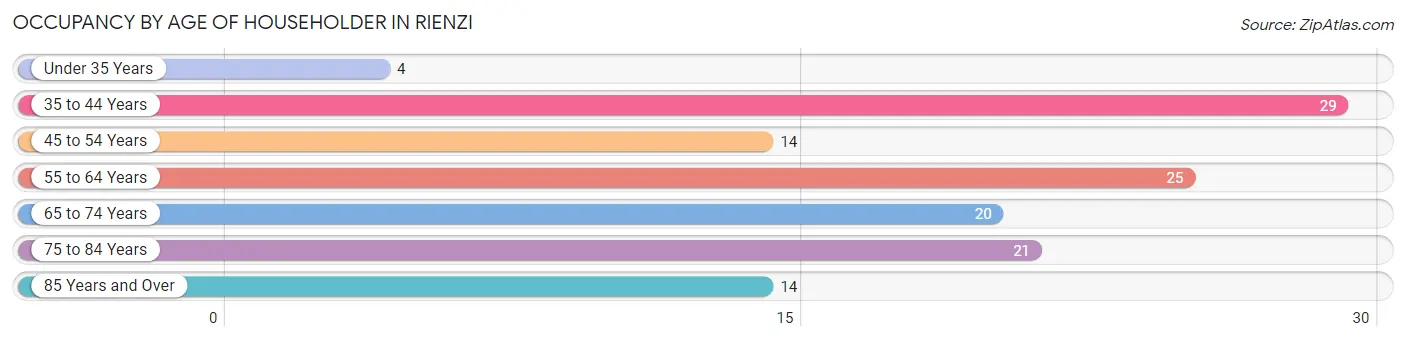
| Age Bracket | # Households | % Households |
| Under 35 Years | 4 | 3.2% |
| 35 to 44 Years | 29 | 22.8% |
| 45 to 54 Years | 14 | 11.0% |
| 55 to 64 Years | 25 | 19.7% |
| 65 to 74 Years | 20 | 15.8% |
| 75 to 84 Years | 21 | 16.5% |
| 85 Years and Over | 14 | 11.0% |
| Total | 127 | 100.0% |
Housing Finances in Rienzi
Median Income by Occupancy in Rienzi
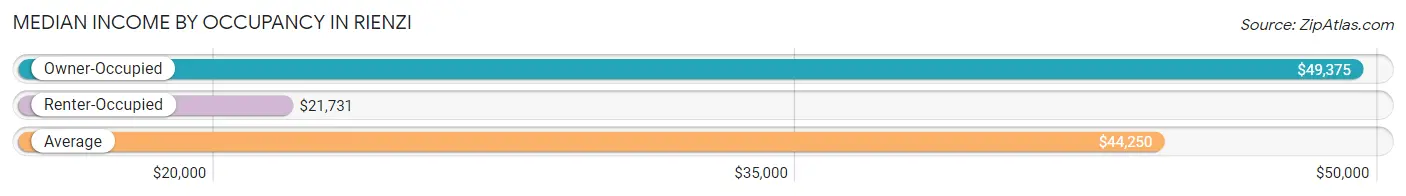
| Occupancy Type | # Households | Median Income |
| Owner-Occupied | 95 (74.8%) | $49,375 |
| Renter-Occupied | 32 (25.2%) | $21,731 |
| Average | 127 (100.0%) | $44,250 |
Occupancy by Householder Income Bracket in Rienzi
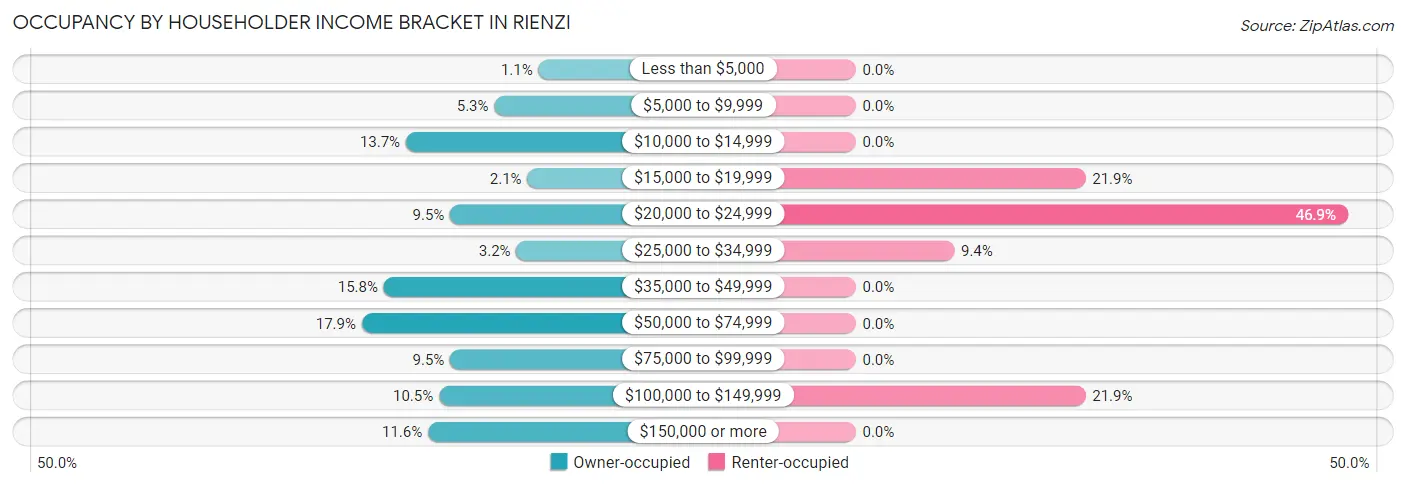
| Income Bracket | Owner-occupied | Renter-occupied |
| Less than $5,000 | 1 (1.1%) | 0 (0.0%) |
| $5,000 to $9,999 | 5 (5.3%) | 0 (0.0%) |
| $10,000 to $14,999 | 13 (13.7%) | 0 (0.0%) |
| $15,000 to $19,999 | 2 (2.1%) | 7 (21.9%) |
| $20,000 to $24,999 | 9 (9.5%) | 15 (46.9%) |
| $25,000 to $34,999 | 3 (3.2%) | 3 (9.4%) |
| $35,000 to $49,999 | 15 (15.8%) | 0 (0.0%) |
| $50,000 to $74,999 | 17 (17.9%) | 0 (0.0%) |
| $75,000 to $99,999 | 9 (9.5%) | 0 (0.0%) |
| $100,000 to $149,999 | 10 (10.5%) | 7 (21.9%) |
| $150,000 or more | 11 (11.6%) | 0 (0.0%) |
| Total | 95 (100.0%) | 32 (100.0%) |
Monthly Housing Cost Tiers in Rienzi
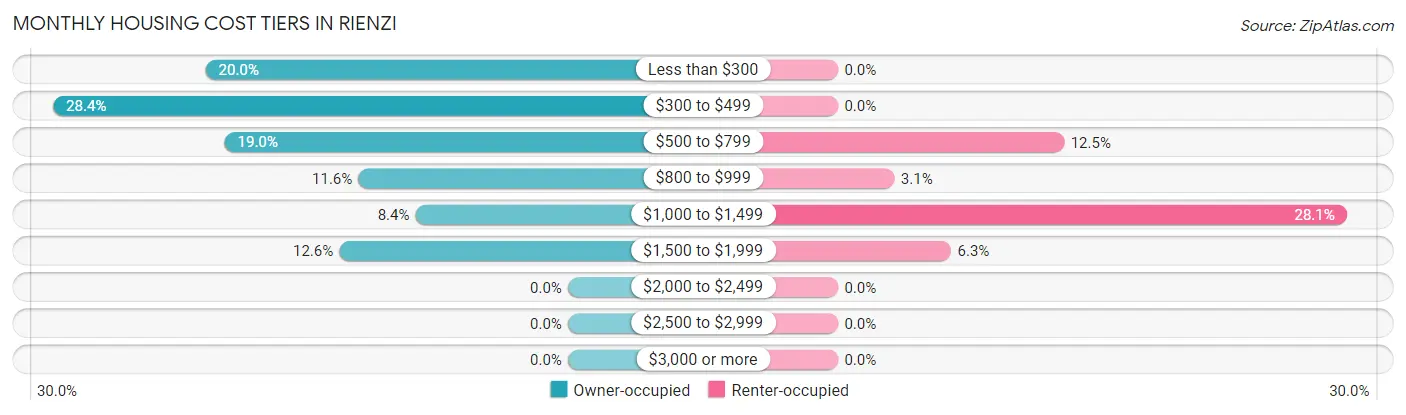
| Monthly Cost | Owner-occupied | Renter-occupied |
| Less than $300 | 19 (20.0%) | 0 (0.0%) |
| $300 to $499 | 27 (28.4%) | 0 (0.0%) |
| $500 to $799 | 18 (19.0%) | 4 (12.5%) |
| $800 to $999 | 11 (11.6%) | 1 (3.1%) |
| $1,000 to $1,499 | 8 (8.4%) | 9 (28.1%) |
| $1,500 to $1,999 | 12 (12.6%) | 2 (6.2%) |
| $2,000 to $2,499 | 0 (0.0%) | 0 (0.0%) |
| $2,500 to $2,999 | 0 (0.0%) | 0 (0.0%) |
| $3,000 or more | 0 (0.0%) | 0 (0.0%) |
| Total | 95 (100.0%) | 32 (100.0%) |
Physical Housing Characteristics in Rienzi
Housing Structures in Rienzi
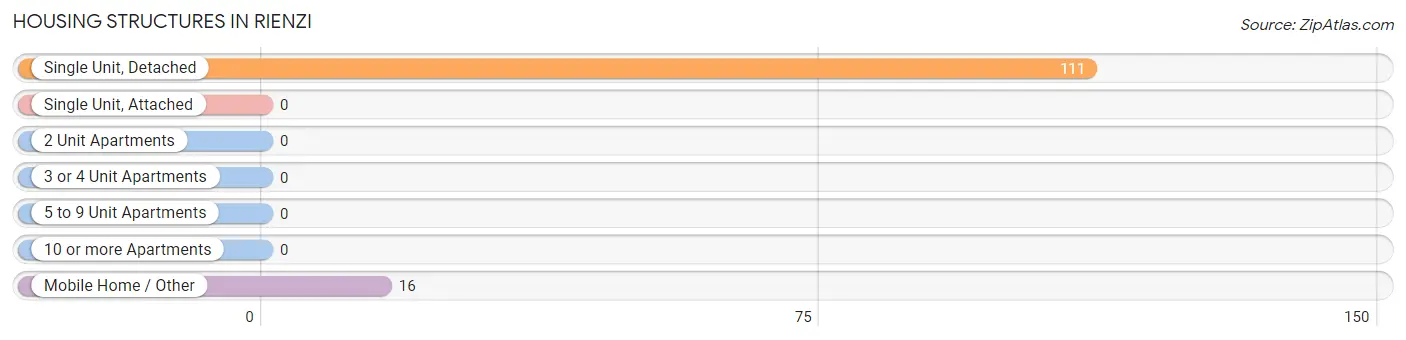
| Structure Type | # Housing Units | % Housing Units |
| Single Unit, Detached | 111 | 87.4% |
| Single Unit, Attached | 0 | 0.0% |
| 2 Unit Apartments | 0 | 0.0% |
| 3 or 4 Unit Apartments | 0 | 0.0% |
| 5 to 9 Unit Apartments | 0 | 0.0% |
| 10 or more Apartments | 0 | 0.0% |
| Mobile Home / Other | 16 | 12.6% |
| Total | 127 | 100.0% |
Housing Structures by Occupancy in Rienzi
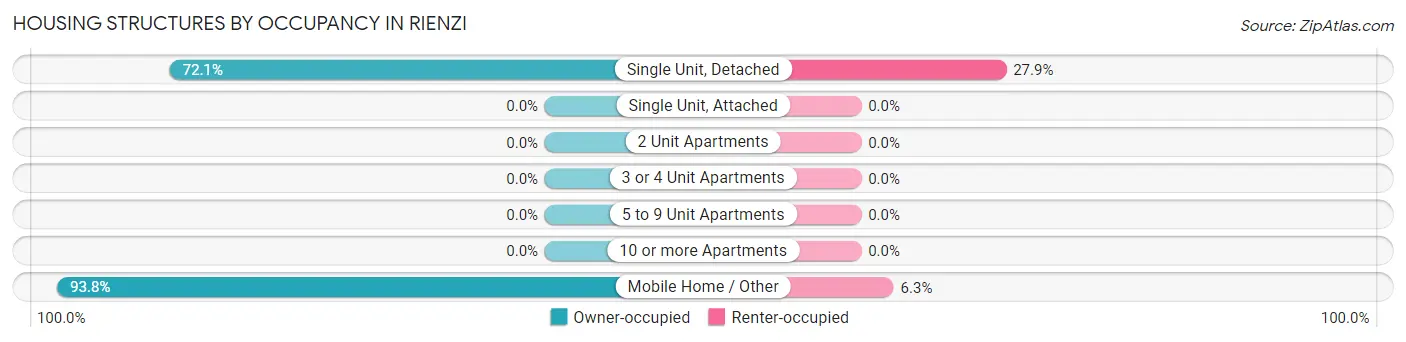
| Structure Type | Owner-occupied | Renter-occupied |
| Single Unit, Detached | 80 (72.1%) | 31 (27.9%) |
| Single Unit, Attached | 0 (0.0%) | 0 (0.0%) |
| 2 Unit Apartments | 0 (0.0%) | 0 (0.0%) |
| 3 or 4 Unit Apartments | 0 (0.0%) | 0 (0.0%) |
| 5 to 9 Unit Apartments | 0 (0.0%) | 0 (0.0%) |
| 10 or more Apartments | 0 (0.0%) | 0 (0.0%) |
| Mobile Home / Other | 15 (93.8%) | 1 (6.2%) |
| Total | 95 (74.8%) | 32 (25.2%) |
Housing Structures by Number of Rooms in Rienzi
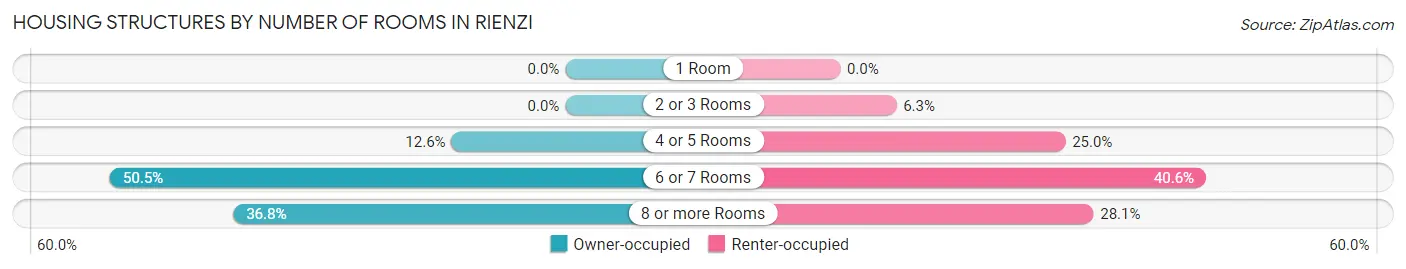
| Number of Rooms | Owner-occupied | Renter-occupied |
| 1 Room | 0 (0.0%) | 0 (0.0%) |
| 2 or 3 Rooms | 0 (0.0%) | 2 (6.2%) |
| 4 or 5 Rooms | 12 (12.6%) | 8 (25.0%) |
| 6 or 7 Rooms | 48 (50.5%) | 13 (40.6%) |
| 8 or more Rooms | 35 (36.8%) | 9 (28.1%) |
| Total | 95 (100.0%) | 32 (100.0%) |
Housing Structure by Heating Type in Rienzi
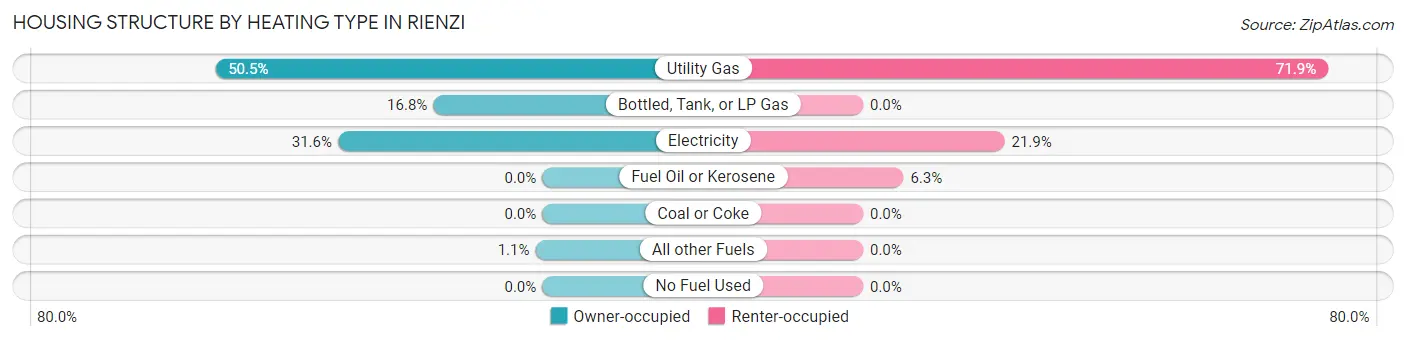
| Heating Type | Owner-occupied | Renter-occupied |
| Utility Gas | 48 (50.5%) | 23 (71.9%) |
| Bottled, Tank, or LP Gas | 16 (16.8%) | 0 (0.0%) |
| Electricity | 30 (31.6%) | 7 (21.9%) |
| Fuel Oil or Kerosene | 0 (0.0%) | 2 (6.2%) |
| Coal or Coke | 0 (0.0%) | 0 (0.0%) |
| All other Fuels | 1 (1.1%) | 0 (0.0%) |
| No Fuel Used | 0 (0.0%) | 0 (0.0%) |
| Total | 95 (100.0%) | 32 (100.0%) |
Household Vehicle Usage in Rienzi
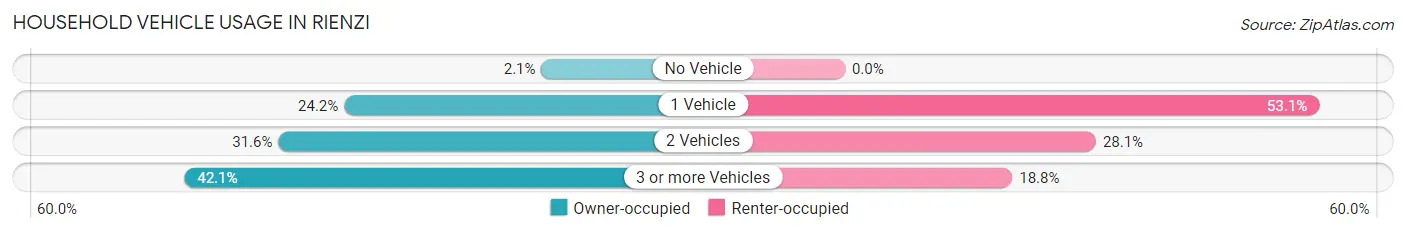
| Vehicles per Household | Owner-occupied | Renter-occupied |
| No Vehicle | 2 (2.1%) | 0 (0.0%) |
| 1 Vehicle | 23 (24.2%) | 17 (53.1%) |
| 2 Vehicles | 30 (31.6%) | 9 (28.1%) |
| 3 or more Vehicles | 40 (42.1%) | 6 (18.8%) |
| Total | 95 (100.0%) | 32 (100.0%) |
Real Estate & Mortgages in Rienzi
Real Estate and Mortgage Overview in Rienzi
| Characteristic | Without Mortgage | With Mortgage |
| Housing Units | 59 | 36 |
| Median Property Value | $142,500 | $69,100 |
| Median Household Income | $48,125 | $8 |
| Monthly Housing Costs | $370 | $0 |
| Real Estate Taxes | $767 | $12 |
Property Value by Mortgage Status in Rienzi
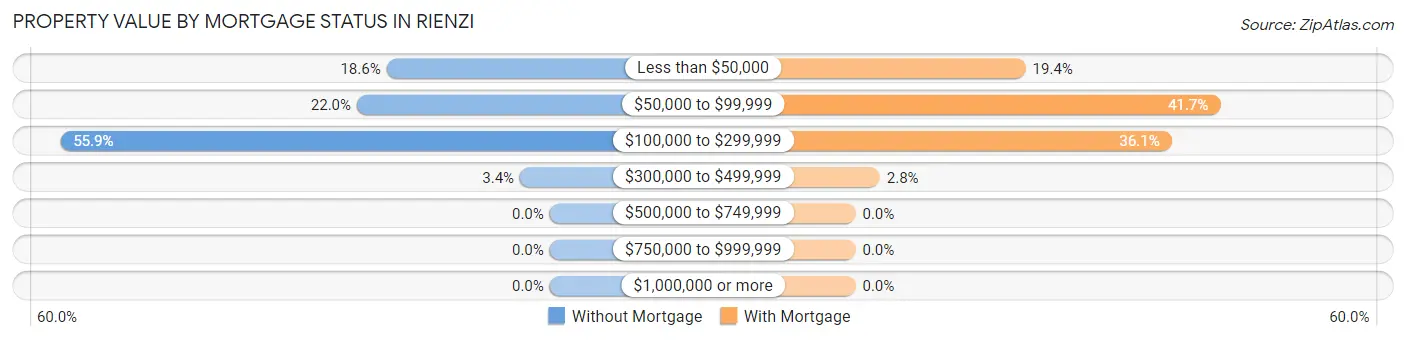
| Property Value | Without Mortgage | With Mortgage |
| Less than $50,000 | 11 (18.6%) | 7 (19.4%) |
| $50,000 to $99,999 | 13 (22.0%) | 15 (41.7%) |
| $100,000 to $299,999 | 33 (55.9%) | 13 (36.1%) |
| $300,000 to $499,999 | 2 (3.4%) | 1 (2.8%) |
| $500,000 to $749,999 | 0 (0.0%) | 0 (0.0%) |
| $750,000 to $999,999 | 0 (0.0%) | 0 (0.0%) |
| $1,000,000 or more | 0 (0.0%) | 0 (0.0%) |
| Total | 59 (100.0%) | 36 (100.0%) |
Household Income by Mortgage Status in Rienzi
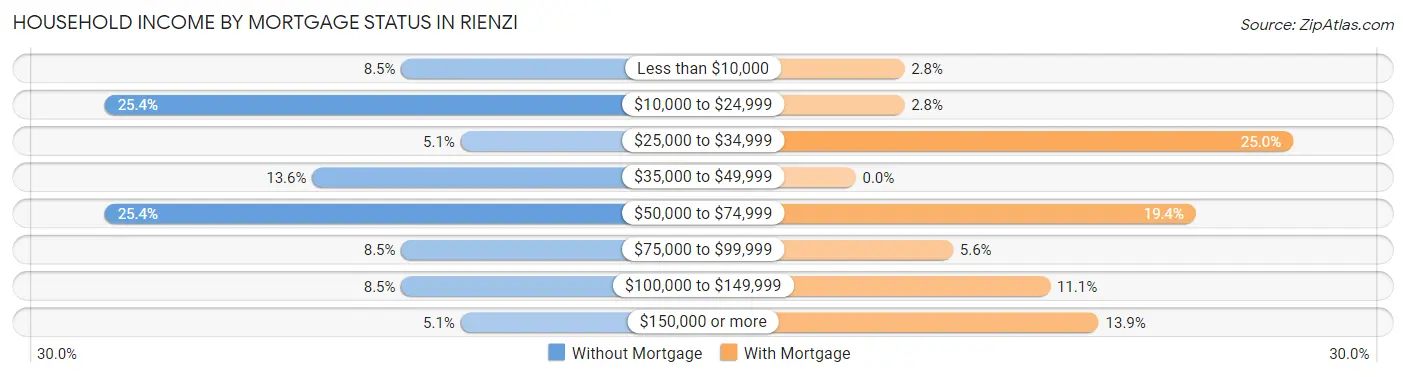
| Household Income | Without Mortgage | With Mortgage |
| Less than $10,000 | 5 (8.5%) | 1 (2.8%) |
| $10,000 to $24,999 | 15 (25.4%) | 1 (2.8%) |
| $25,000 to $34,999 | 3 (5.1%) | 9 (25.0%) |
| $35,000 to $49,999 | 8 (13.6%) | 0 (0.0%) |
| $50,000 to $74,999 | 15 (25.4%) | 7 (19.4%) |
| $75,000 to $99,999 | 5 (8.5%) | 2 (5.6%) |
| $100,000 to $149,999 | 5 (8.5%) | 4 (11.1%) |
| $150,000 or more | 3 (5.1%) | 5 (13.9%) |
| Total | 59 (100.0%) | 36 (100.0%) |
Property Value to Household Income Ratio in Rienzi
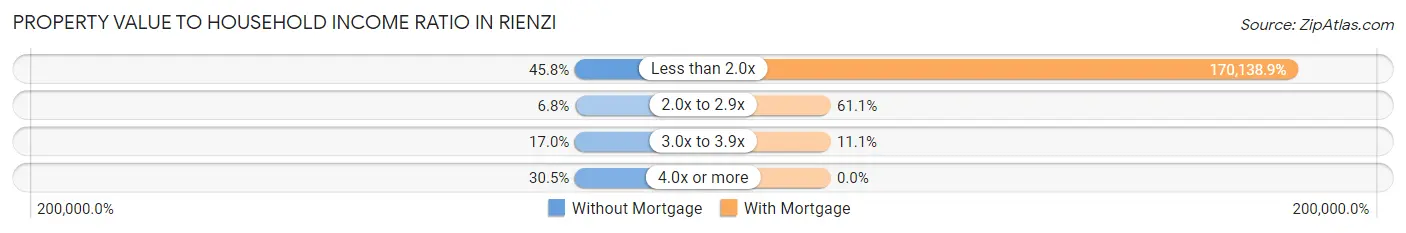
| Value-to-Income Ratio | Without Mortgage | With Mortgage |
| Less than 2.0x | 27 (45.8%) | 61,250 (170,138.9%) |
| 2.0x to 2.9x | 4 (6.8%) | 22 (61.1%) |
| 3.0x to 3.9x | 10 (17.0%) | 4 (11.1%) |
| 4.0x or more | 18 (30.5%) | 0 (0.0%) |
| Total | 59 (100.0%) | 36 (100.0%) |
Real Estate Taxes by Mortgage Status in Rienzi
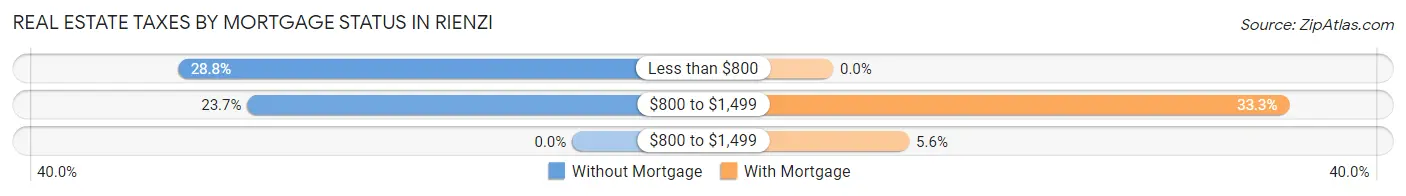
| Property Taxes | Without Mortgage | With Mortgage |
| Less than $800 | 17 (28.8%) | 0 (0.0%) |
| $800 to $1,499 | 14 (23.7%) | 12 (33.3%) |
| $800 to $1,499 | 0 (0.0%) | 2 (5.6%) |
| Total | 59 (100.0%) | 36 (100.0%) |
Health & Disability in Rienzi
Health Insurance Coverage by Age in Rienzi
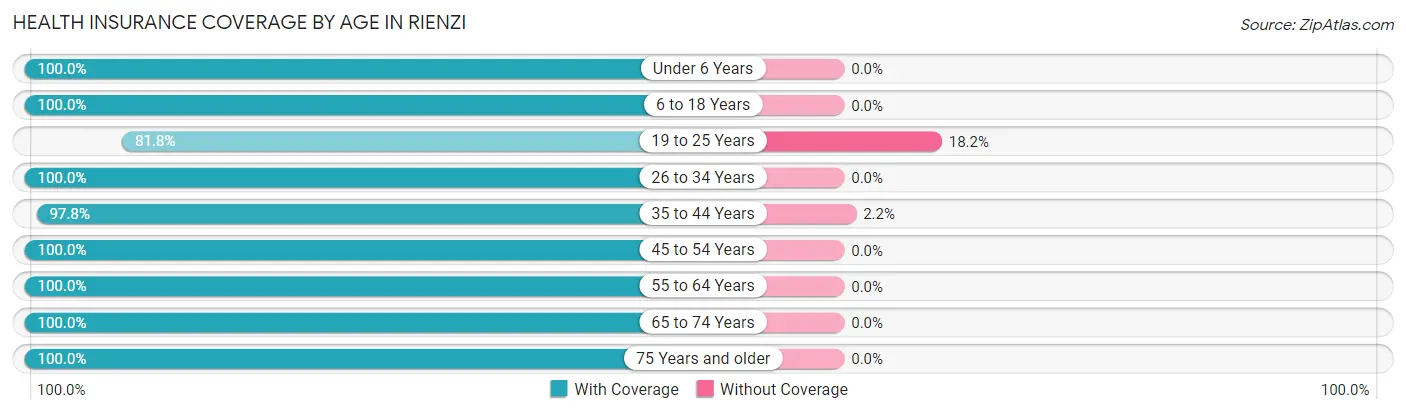
| Age Bracket | With Coverage | Without Coverage |
| Under 6 Years | 13 (100.0%) | 0 (0.0%) |
| 6 to 18 Years | 58 (100.0%) | 0 (0.0%) |
| 19 to 25 Years | 18 (81.8%) | 4 (18.2%) |
| 26 to 34 Years | 4 (100.0%) | 0 (0.0%) |
| 35 to 44 Years | 44 (97.8%) | 1 (2.2%) |
| 45 to 54 Years | 32 (100.0%) | 0 (0.0%) |
| 55 to 64 Years | 46 (100.0%) | 0 (0.0%) |
| 65 to 74 Years | 41 (100.0%) | 0 (0.0%) |
| 75 Years and older | 41 (100.0%) | 0 (0.0%) |
| Total | 297 (98.3%) | 5 (1.7%) |
Health Insurance Coverage by Citizenship Status in Rienzi
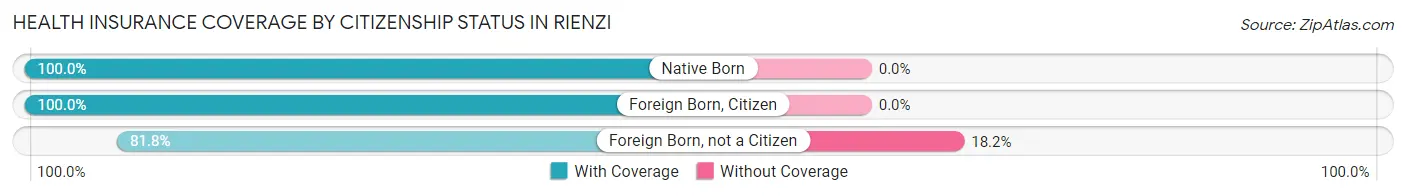
| Citizenship Status | With Coverage | Without Coverage |
| Native Born | 13 (100.0%) | 0 (0.0%) |
| Foreign Born, Citizen | 58 (100.0%) | 0 (0.0%) |
| Foreign Born, not a Citizen | 18 (81.8%) | 4 (18.2%) |
Health Insurance Coverage by Household Income in Rienzi
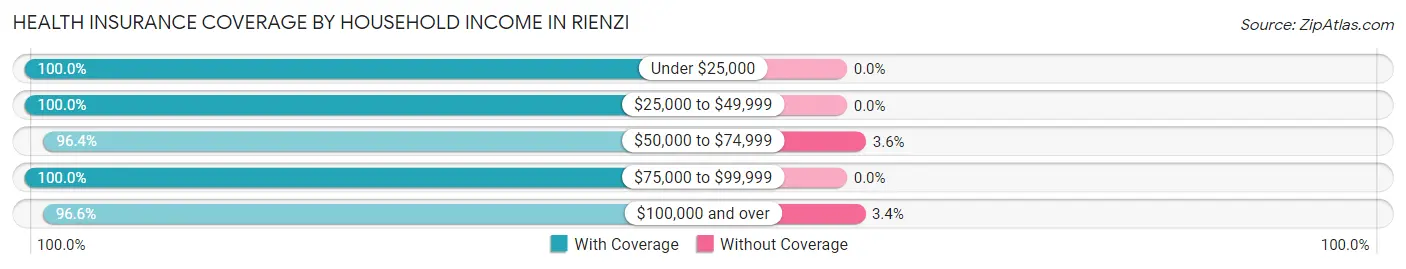
| Household Income | With Coverage | Without Coverage |
| Under $25,000 | 73 (100.0%) | 0 (0.0%) |
| $25,000 to $49,999 | 43 (100.0%) | 0 (0.0%) |
| $50,000 to $74,999 | 54 (96.4%) | 2 (3.6%) |
| $75,000 to $99,999 | 42 (100.0%) | 0 (0.0%) |
| $100,000 and over | 85 (96.6%) | 3 (3.4%) |
Public vs Private Health Insurance Coverage by Age in Rienzi
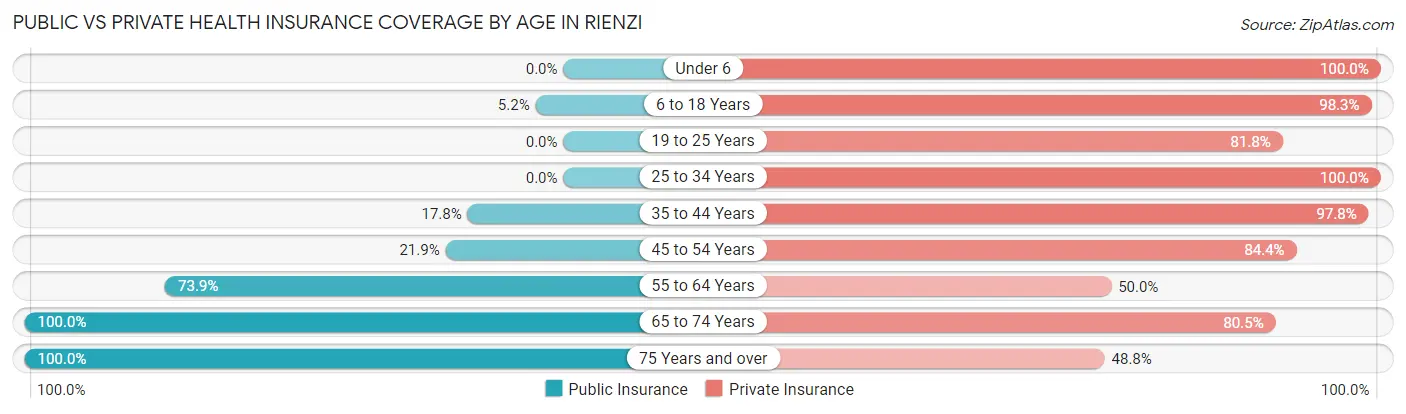
| Age Bracket | Public Insurance | Private Insurance |
| Under 6 | 0 (0.0%) | 13 (100.0%) |
| 6 to 18 Years | 3 (5.2%) | 57 (98.3%) |
| 19 to 25 Years | 0 (0.0%) | 18 (81.8%) |
| 25 to 34 Years | 0 (0.0%) | 4 (100.0%) |
| 35 to 44 Years | 8 (17.8%) | 44 (97.8%) |
| 45 to 54 Years | 7 (21.9%) | 27 (84.4%) |
| 55 to 64 Years | 34 (73.9%) | 23 (50.0%) |
| 65 to 74 Years | 41 (100.0%) | 33 (80.5%) |
| 75 Years and over | 41 (100.0%) | 20 (48.8%) |
| Total | 134 (44.4%) | 239 (79.1%) |
Disability Status by Sex by Age in Rienzi
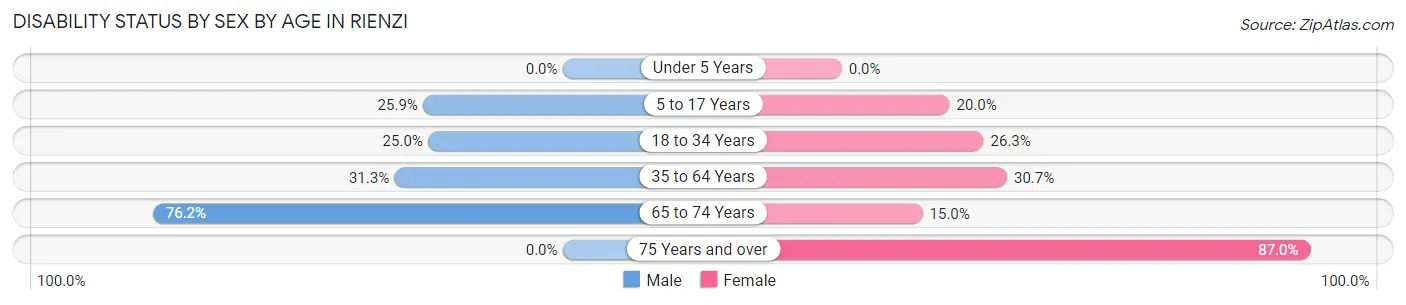
| Age Bracket | Male | Female |
| Under 5 Years | 0 (0.0%) | 0 (0.0%) |
| 5 to 17 Years | 7 (25.9%) | 6 (20.0%) |
| 18 to 34 Years | 2 (25.0%) | 5 (26.3%) |
| 35 to 64 Years | 15 (31.2%) | 23 (30.7%) |
| 65 to 74 Years | 16 (76.2%) | 3 (15.0%) |
| 75 Years and over | 0 (0.0%) | 20 (87.0%) |
Disability Class by Sex by Age in Rienzi
Disability Class: Hearing Difficulty
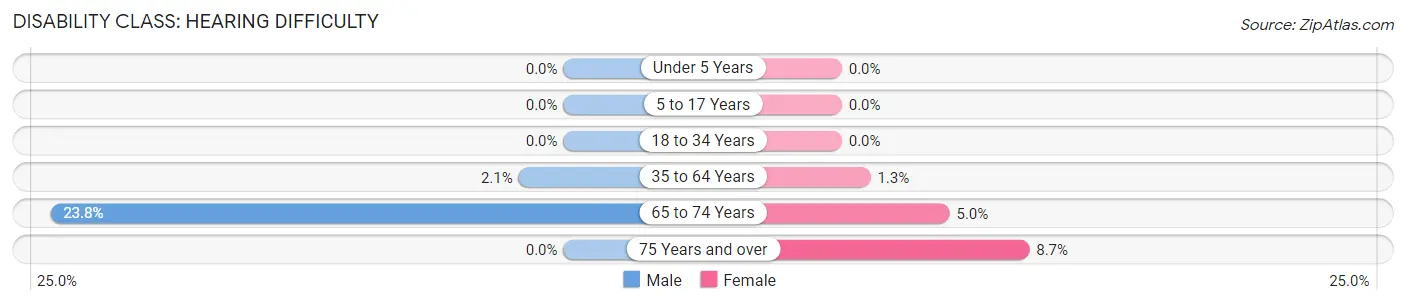
| Age Bracket | Male | Female |
| Under 5 Years | 0 (0.0%) | 0 (0.0%) |
| 5 to 17 Years | 0 (0.0%) | 0 (0.0%) |
| 18 to 34 Years | 0 (0.0%) | 0 (0.0%) |
| 35 to 64 Years | 1 (2.1%) | 1 (1.3%) |
| 65 to 74 Years | 5 (23.8%) | 1 (5.0%) |
| 75 Years and over | 0 (0.0%) | 2 (8.7%) |
Disability Class: Vision Difficulty
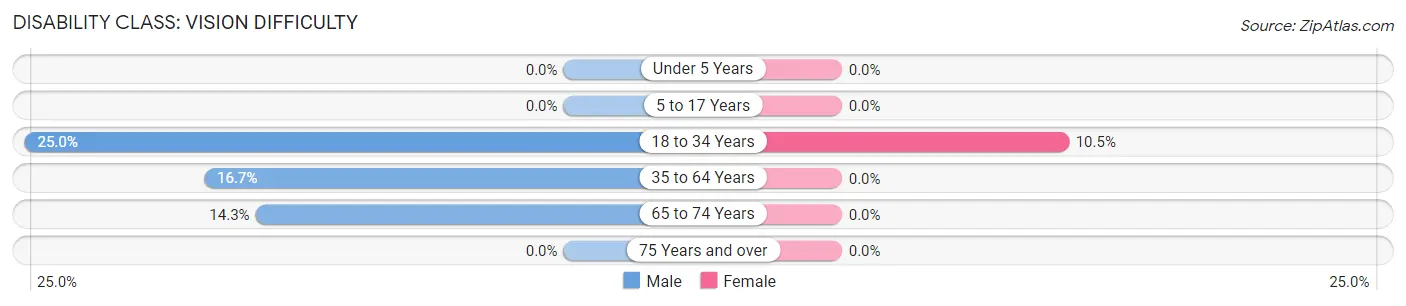
| Age Bracket | Male | Female |
| Under 5 Years | 0 (0.0%) | 0 (0.0%) |
| 5 to 17 Years | 0 (0.0%) | 0 (0.0%) |
| 18 to 34 Years | 2 (25.0%) | 2 (10.5%) |
| 35 to 64 Years | 8 (16.7%) | 0 (0.0%) |
| 65 to 74 Years | 3 (14.3%) | 0 (0.0%) |
| 75 Years and over | 0 (0.0%) | 0 (0.0%) |
Disability Class: Cognitive Difficulty
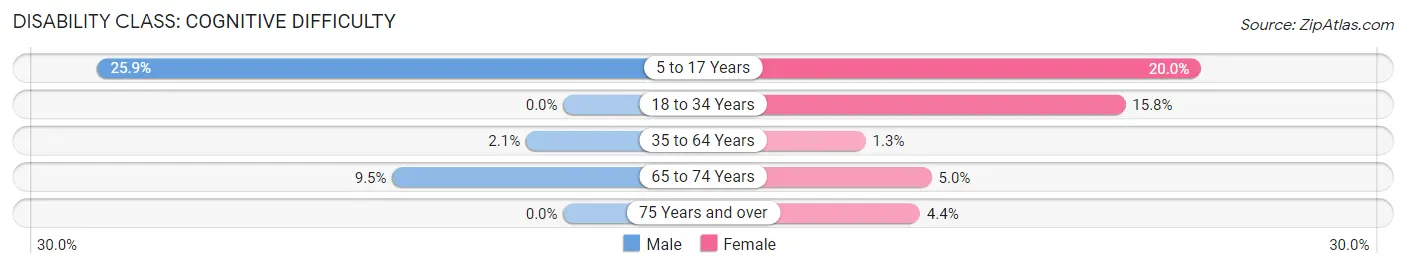
| Age Bracket | Male | Female |
| 5 to 17 Years | 7 (25.9%) | 6 (20.0%) |
| 18 to 34 Years | 0 (0.0%) | 3 (15.8%) |
| 35 to 64 Years | 1 (2.1%) | 1 (1.3%) |
| 65 to 74 Years | 2 (9.5%) | 1 (5.0%) |
| 75 Years and over | 0 (0.0%) | 1 (4.3%) |
Disability Class: Ambulatory Difficulty
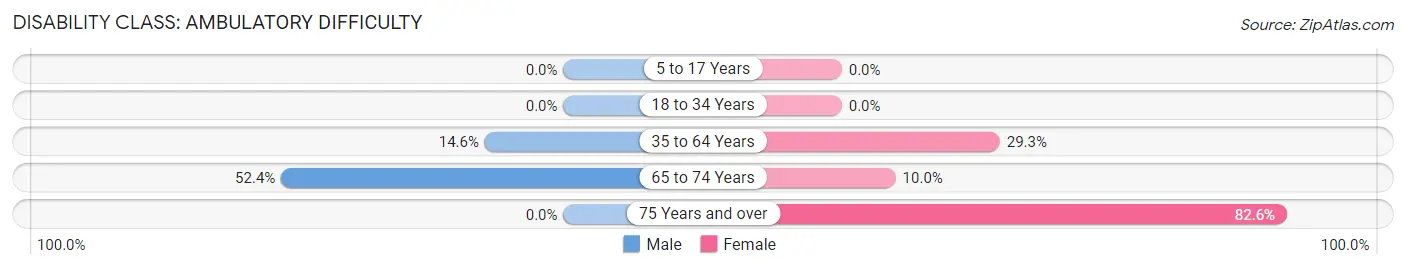
| Age Bracket | Male | Female |
| 5 to 17 Years | 0 (0.0%) | 0 (0.0%) |
| 18 to 34 Years | 0 (0.0%) | 0 (0.0%) |
| 35 to 64 Years | 7 (14.6%) | 22 (29.3%) |
| 65 to 74 Years | 11 (52.4%) | 2 (10.0%) |
| 75 Years and over | 0 (0.0%) | 19 (82.6%) |
Disability Class: Self-Care Difficulty
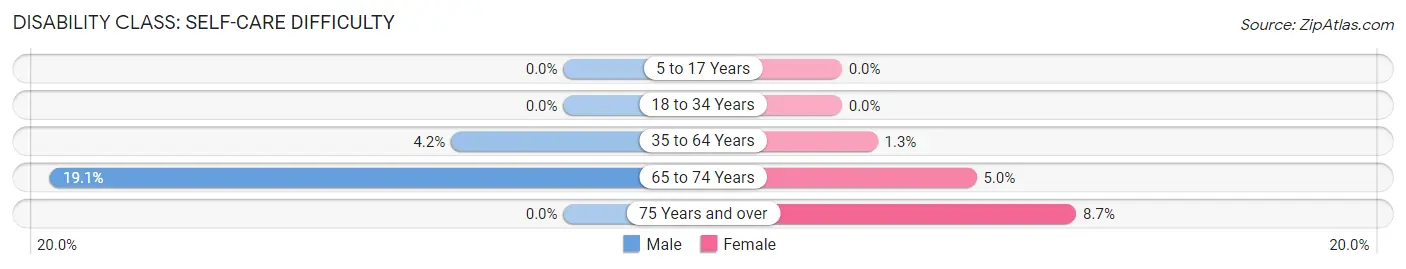
| Age Bracket | Male | Female |
| 5 to 17 Years | 0 (0.0%) | 0 (0.0%) |
| 18 to 34 Years | 0 (0.0%) | 0 (0.0%) |
| 35 to 64 Years | 2 (4.2%) | 1 (1.3%) |
| 65 to 74 Years | 4 (19.1%) | 1 (5.0%) |
| 75 Years and over | 0 (0.0%) | 2 (8.7%) |
Technology Access in Rienzi
Computing Device Access in Rienzi
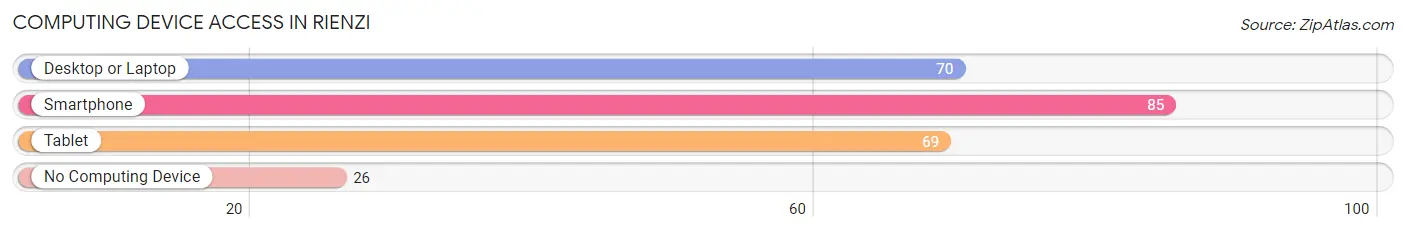
| Device Type | # Households | % Households |
| Desktop or Laptop | 70 | 55.1% |
| Smartphone | 85 | 66.9% |
| Tablet | 69 | 54.3% |
| No Computing Device | 26 | 20.5% |
| Total | 127 | 100.0% |
Internet Access in Rienzi
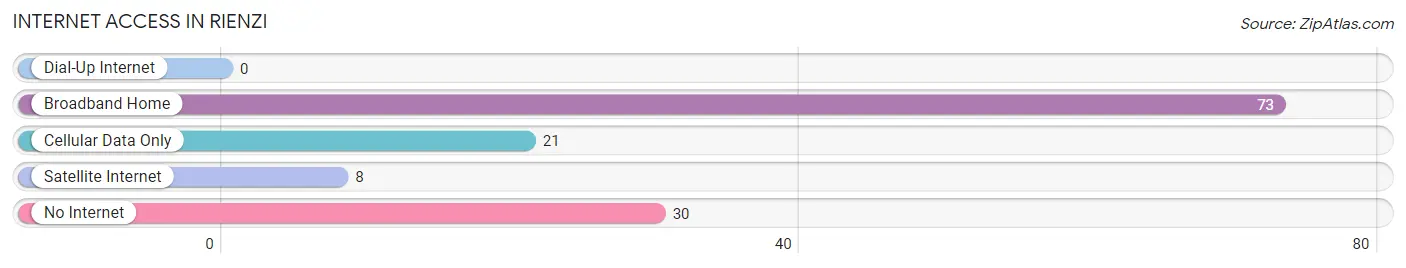
| Internet Type | # Households | % Households |
| Dial-Up Internet | 0 | 0.0% |
| Broadband Home | 73 | 57.5% |
| Cellular Data Only | 21 | 16.5% |
| Satellite Internet | 8 | 6.3% |
| No Internet | 30 | 23.6% |
| Total | 127 | 100.0% |
Rienzi Summary
Rienzi, Mississippi is a small town located in Alcorn County in the northeastern part of the state. It is situated along the banks of the Tuscumbia River, about 20 miles south of Corinth. The town was founded in 1837 and named after the Italian patriot Cola di Rienzi. The population of Rienzi was estimated to be 1,072 in 2019.
Geography
Rienzi is located in the foothills of the Appalachian Mountains, and is part of the Appalachian Plateau. The town is situated on the banks of the Tuscumbia River, which flows through the town and provides a source of recreation for the locals. The town is surrounded by rolling hills and forests, and is home to a variety of wildlife. The climate in Rienzi is humid subtropical, with hot summers and mild winters.
Economy
Rienzi’s economy is largely based on agriculture. The town is home to several farms, which produce a variety of crops, including corn, soybeans, cotton, and wheat. The town also has a small manufacturing sector, which produces furniture, textiles, and other goods. The town is also home to several small businesses, including restaurants, stores, and other services.
Demographics
Rienzi is a predominantly white town, with a population that is 97.2% white and 2.8% African American. The median household income in Rienzi is $37,917, and the median home value is $90,000. The town has a poverty rate of 22.3%, which is higher than the state average of 19.7%.
Education
Rienzi is served by the Alcorn County School District, which operates two elementary schools, one middle school, and one high school. The town is also home to a branch of the Northeast Mississippi Community College, which offers a variety of courses and programs.
Conclusion
Rienzi, Mississippi is a small town located in Alcorn County in the northeastern part of the state. It is situated along the banks of the Tuscumbia River, and is home to a population of 1,072. The town’s economy is largely based on agriculture, and it is also home to several small businesses. The town is predominantly white, with a median household income of $37,917 and a poverty rate of 22.3%. Rienzi is served by the Alcorn County School District, and is also home to a branch of the Northeast Mississippi Community College.
Common Questions
What is Per Capita Income in Rienzi?
Per Capita income in Rienzi is $23,583.
What is the Median Family Income in Rienzi?
Median Family Income in Rienzi is $55,750.
What is the Median Household income in Rienzi?
Median Household Income in Rienzi is $44,250.
What is Income or Wage Gap in Rienzi?
Income or Wage Gap in Rienzi is 2.4%.
Women in Rienzi earn 97.6 cents for every dollar earned by a man.
What is Inequality or Gini Index in Rienzi?
Inequality or Gini Index in Rienzi is 0.46.
What is the Total Population of Rienzi?
Total Population of Rienzi is 302.
What is the Total Male Population of Rienzi?
Total Male Population of Rienzi is 135.
What is the Total Female Population of Rienzi?
Total Female Population of Rienzi is 167.
What is the Ratio of Males per 100 Females in Rienzi?
There are 80.84 Males per 100 Females in Rienzi.
What is the Ratio of Females per 100 Males in Rienzi?
There are 123.70 Females per 100 Males in Rienzi.
What is the Median Population Age in Rienzi?
Median Population Age in Rienzi is 50.3 Years.
What is the Average Family Size in Rienzi
Average Family Size in Rienzi is 3.1 People.
What is the Average Household Size in Rienzi
Average Household Size in Rienzi is 2.4 People.
How Large is the Labor Force in Rienzi?
There are 94 People in the Labor Forcein in Rienzi.
What is the Percentage of People in the Labor Force in Rienzi?
39.5% of People are in the Labor Force in Rienzi.
What is the Unemployment Rate in Rienzi?
Unemployment Rate in Rienzi is 2.1%.