Picayune, MS Map & Demographics
Picayune Map
Picayune Overview
$22,123
PER CAPITA INCOME
$40,838
AVG FAMILY INCOME
$35,649
AVG HOUSEHOLD INCOME
44.5%
WAGE / INCOME GAP [ % ]
55.5¢/ $1
WAGE / INCOME GAP [ $ ]
0.49
INEQUALITY / GINI INDEX
11,804
TOTAL POPULATION
5,346
MALE POPULATION
6,458
FEMALE POPULATION
82.78
MALES / 100 FEMALES
120.80
FEMALES / 100 MALES
38.3
MEDIAN AGE
3.4
AVG FAMILY SIZE
2.6
AVG HOUSEHOLD SIZE
4,994
LABOR FORCE [ PEOPLE ]
55.9%
PERCENT IN LABOR FORCE
5.7%
UNEMPLOYMENT RATE
Picayune Zip Codes
Income in Picayune
Income Overview in Picayune
Per Capita Income in Picayune is $22,123, while median incomes of families and households are $40,838 and $35,649 respectively.
| Characteristic | Number | Measure |
| Per Capita Income | 11,804 | $22,123 |
| Median Family Income | 2,769 | $40,838 |
| Mean Family Income | 2,769 | $61,990 |
| Median Household Income | 4,403 | $35,649 |
| Mean Household Income | 4,403 | $52,831 |
| Income Deficit | 2,769 | $0 |
| Wage / Income Gap (%) | 11,804 | 44.46% |
| Wage / Income Gap ($) | 11,804 | 55.54¢ per $1 |
| Gini / Inequality Index | 11,804 | 0.49 |
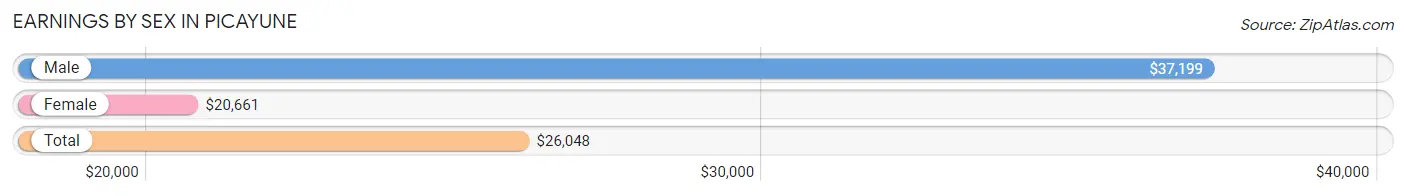
Earnings by Sex in Picayune
Average Earnings in Picayune are $26,048, $37,199 for men and $20,661 for women, a difference of 44.5%.
| Sex | Number | Average Earnings |
| Male | 2,405 (47.9%) | $37,199 |
| Female | 2,615 (52.1%) | $20,661 |
| Total | 5,020 (100.0%) | $26,048 |
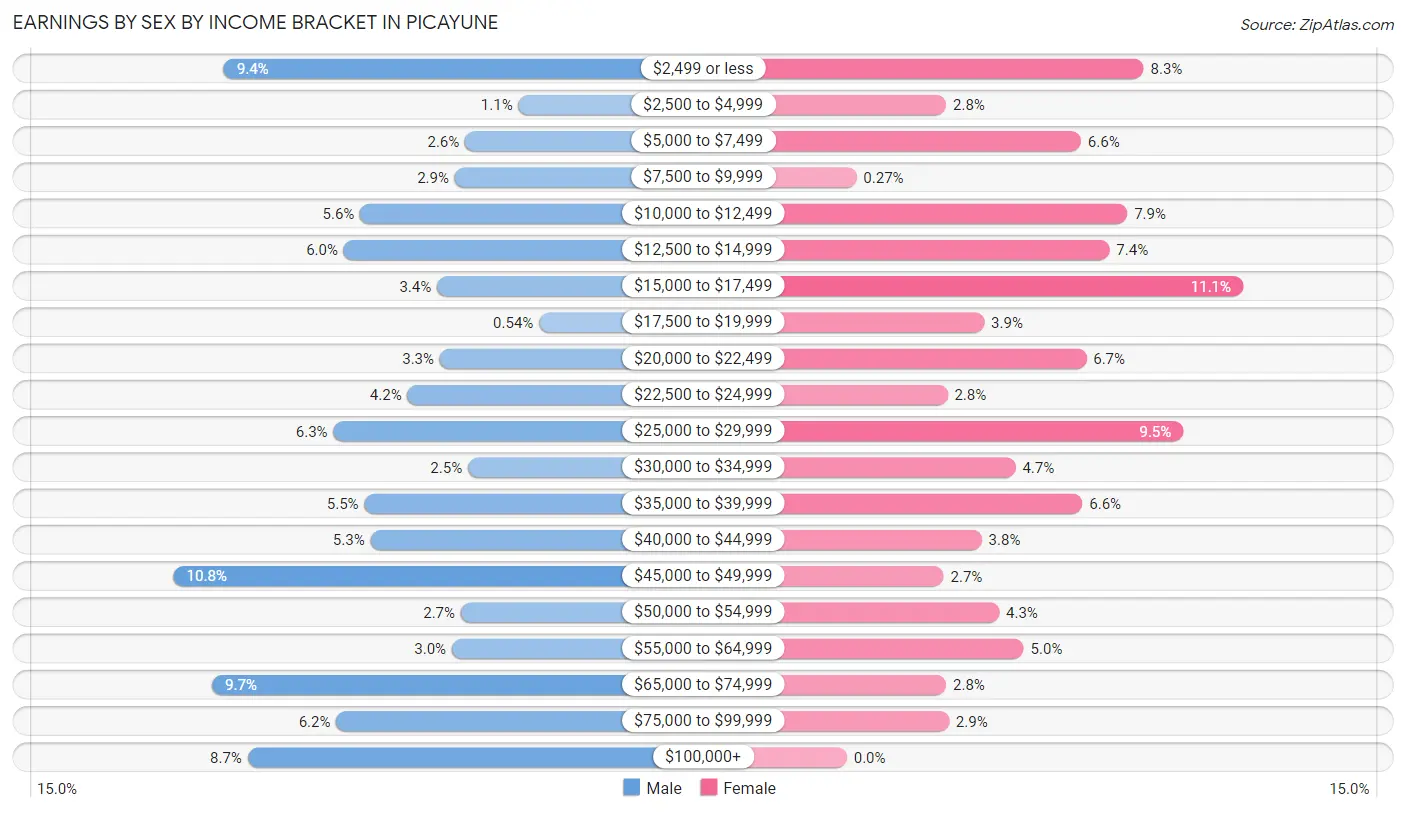
Earnings by Sex by Income Bracket in Picayune
The most common earnings brackets in Picayune are $45,000 to $49,999 for men (260 | 10.8%) and $15,000 to $17,499 for women (291 | 11.1%).
| Income | Male | Female |
| $2,499 or less | 226 (9.4%) | 218 (8.3%) |
| $2,500 to $4,999 | 27 (1.1%) | 73 (2.8%) |
| $5,000 to $7,499 | 63 (2.6%) | 172 (6.6%) |
| $7,500 to $9,999 | 70 (2.9%) | 7 (0.3%) |
| $10,000 to $12,499 | 134 (5.6%) | 206 (7.9%) |
| $12,500 to $14,999 | 145 (6.0%) | 193 (7.4%) |
| $15,000 to $17,499 | 82 (3.4%) | 291 (11.1%) |
| $17,500 to $19,999 | 13 (0.5%) | 101 (3.9%) |
| $20,000 to $22,499 | 80 (3.3%) | 176 (6.7%) |
| $22,500 to $24,999 | 102 (4.2%) | 74 (2.8%) |
| $25,000 to $29,999 | 152 (6.3%) | 247 (9.5%) |
| $30,000 to $34,999 | 61 (2.5%) | 124 (4.7%) |
| $35,000 to $39,999 | 131 (5.4%) | 173 (6.6%) |
| $40,000 to $44,999 | 127 (5.3%) | 99 (3.8%) |
| $45,000 to $49,999 | 260 (10.8%) | 71 (2.7%) |
| $50,000 to $54,999 | 66 (2.7%) | 112 (4.3%) |
| $55,000 to $64,999 | 72 (3.0%) | 130 (5.0%) |
| $65,000 to $74,999 | 234 (9.7%) | 73 (2.8%) |
| $75,000 to $99,999 | 150 (6.2%) | 75 (2.9%) |
| $100,000+ | 210 (8.7%) | 0 (0.0%) |
| Total | 2,405 (100.0%) | 2,615 (100.0%) |
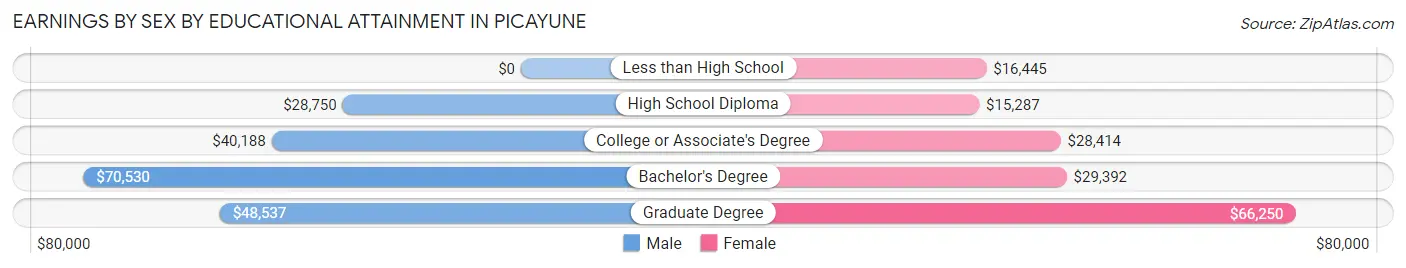
Earnings by Sex by Educational Attainment in Picayune
Average earnings in Picayune are $41,006 for men and $24,341 for women, a difference of 40.6%. Men with an educational attainment of bachelor's degree enjoy the highest average annual earnings of $70,530, while those with high school diploma education earn the least with $28,750. Women with an educational attainment of graduate degree earn the most with the average annual earnings of $66,250, while those with high school diploma education have the smallest earnings of $15,287.
| Educational Attainment | Male Income | Female Income |
| Less than High School | - | - |
| High School Diploma | $28,750 | $15,287 |
| College or Associate's Degree | $40,188 | $28,414 |
| Bachelor's Degree | $70,530 | $29,392 |
| Graduate Degree | $48,537 | $66,250 |
| Total | $41,006 | $24,341 |
Family Income in Picayune
Family Income Brackets in Picayune
According to the Picayune family income data, there are 479 families falling into the $15,000 to $24,999 income range, which is the most common income bracket and makes up 17.3% of all families. Conversely, the $150,000 to $199,999 income bracket is the least frequent group with only 61 families (2.2%) belonging to this category.
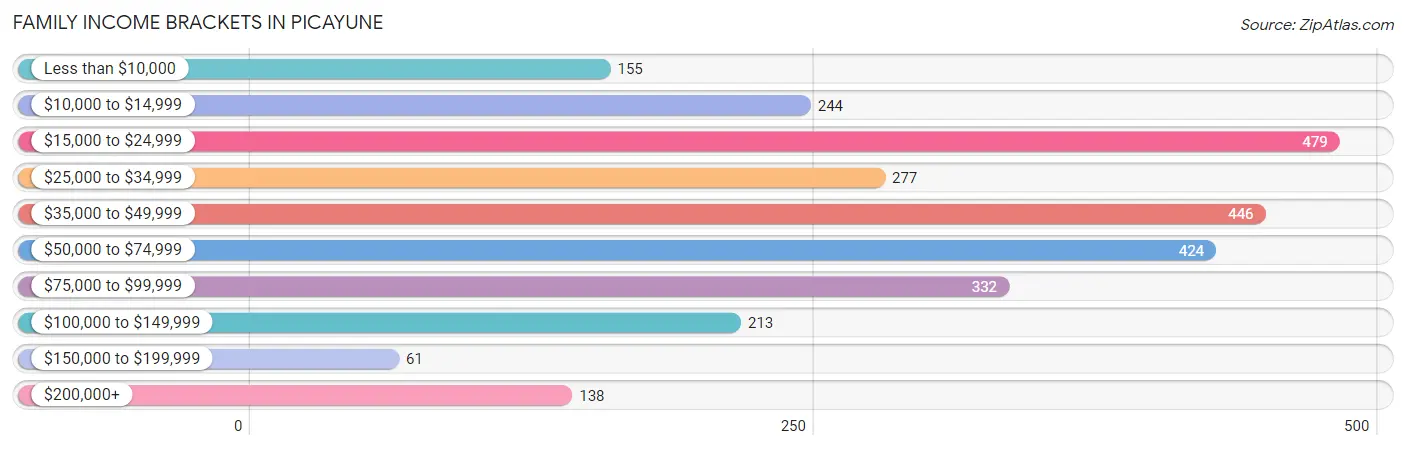
| Income Bracket | # Families | % Families |
| Less than $10,000 | 155 | 5.6% |
| $10,000 to $14,999 | 244 | 8.8% |
| $15,000 to $24,999 | 479 | 17.3% |
| $25,000 to $34,999 | 277 | 10.0% |
| $35,000 to $49,999 | 446 | 16.1% |
| $50,000 to $74,999 | 424 | 15.3% |
| $75,000 to $99,999 | 332 | 12.0% |
| $100,000 to $149,999 | 213 | 7.7% |
| $150,000 to $199,999 | 61 | 2.2% |
| $200,000+ | 138 | 5.0% |
Family Income by Famaliy Size in Picayune
6-person families (48 | 1.7%) account for the highest median family income in Picayune with $92,167 per family, while 2-person families (1,407 | 50.8%) have the highest median income of $17,910 per family member.
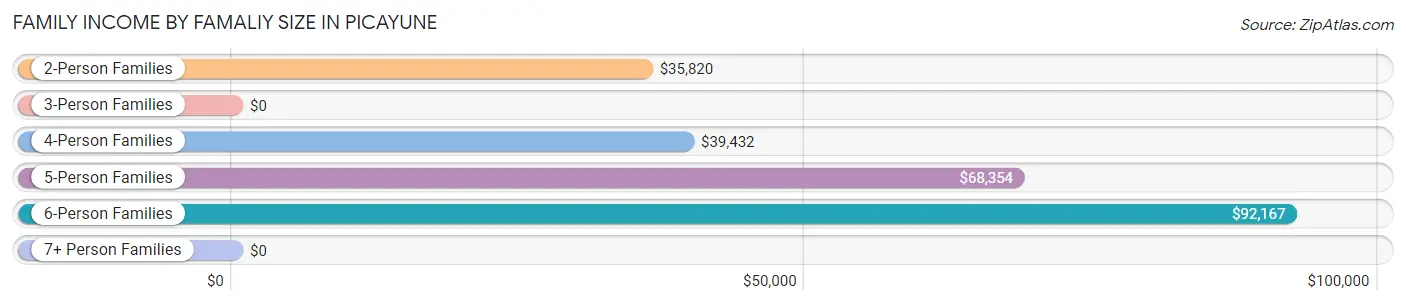
| Income Bracket | # Families | Median Income |
| 2-Person Families | 1,407 (50.8%) | $35,820 |
| 3-Person Families | 555 (20.0%) | $0 |
| 4-Person Families | 315 (11.4%) | $39,432 |
| 5-Person Families | 427 (15.4%) | $68,354 |
| 6-Person Families | 48 (1.7%) | $92,167 |
| 7+ Person Families | 17 (0.6%) | $0 |
| Total | 2,769 (100.0%) | $40,838 |
Family Income by Number of Earners in Picayune
The median family income in Picayune is $40,838, with families comprising 3+ earners (275) having the highest median family income of $80,809, while families with 1 earner (1,480) have the lowest median family income of $28,828, accounting for 9.9% and 53.4% of families, respectively.
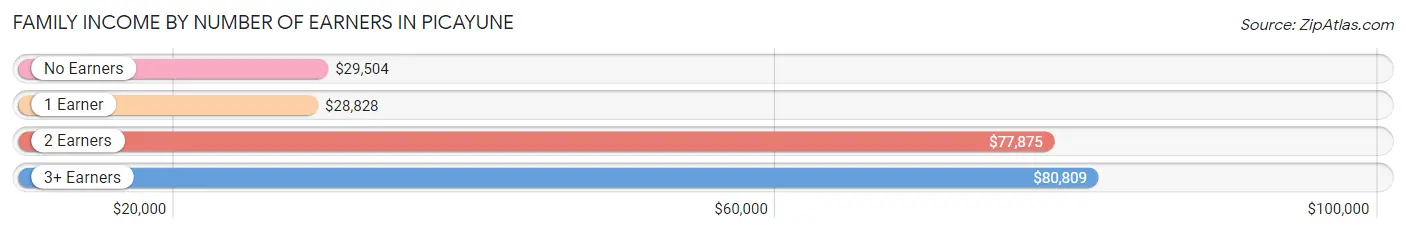
| Number of Earners | # Families | Median Income |
| No Earners | 483 (17.4%) | $29,504 |
| 1 Earner | 1,480 (53.4%) | $28,828 |
| 2 Earners | 531 (19.2%) | $77,875 |
| 3+ Earners | 275 (9.9%) | $80,809 |
| Total | 2,769 (100.0%) | $40,838 |
Household Income in Picayune
Household Income Brackets in Picayune
With 793 households falling in the category, the $15,000 to $24,999 income range is the most frequent in Picayune, accounting for 18.0% of all households. In contrast, only 66 households (1.5%) fall into the $150,000 to $199,999 income bracket, making it the least populous group.
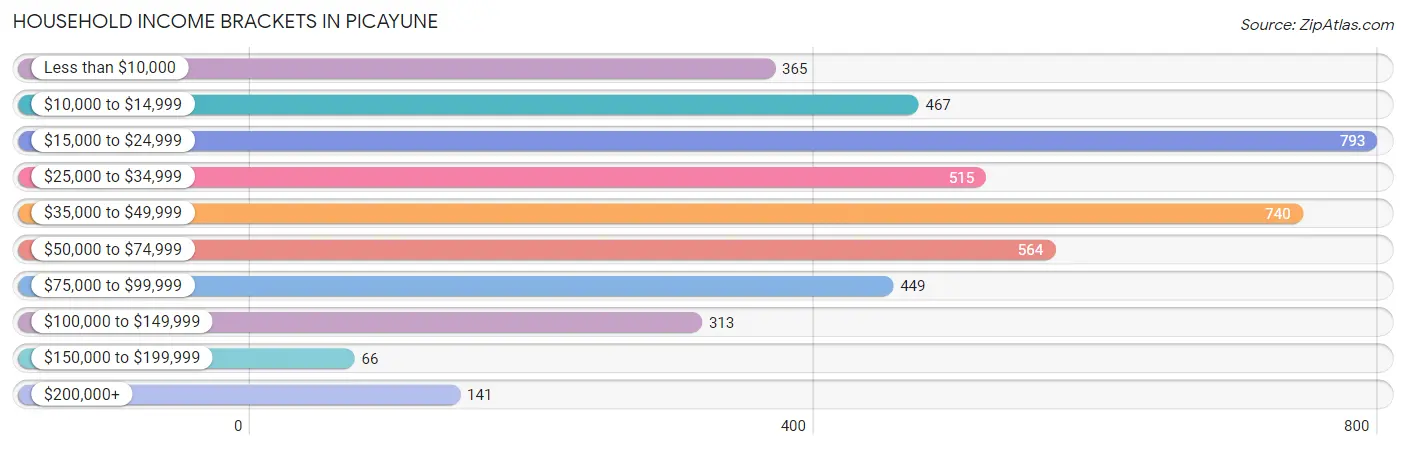
| Income Bracket | # Households | % Households |
| Less than $10,000 | 365 | 8.3% |
| $10,000 to $14,999 | 467 | 10.6% |
| $15,000 to $24,999 | 793 | 18.0% |
| $25,000 to $34,999 | 515 | 11.7% |
| $35,000 to $49,999 | 740 | 16.8% |
| $50,000 to $74,999 | 564 | 12.8% |
| $75,000 to $99,999 | 449 | 10.2% |
| $100,000 to $149,999 | 313 | 7.1% |
| $150,000 to $199,999 | 66 | 1.5% |
| $200,000+ | 141 | 3.2% |
Household Income by Householder Age in Picayune
The median household income in Picayune is $35,649, with the highest median household income of $36,961 found in the 45 to 64 years age bracket for the primary householder. A total of 1,468 households (33.3%) fall into this category. Meanwhile, the 15 to 24 years age bracket for the primary householder has the lowest median household income of $17,292, with 132 households (3.0%) in this group.
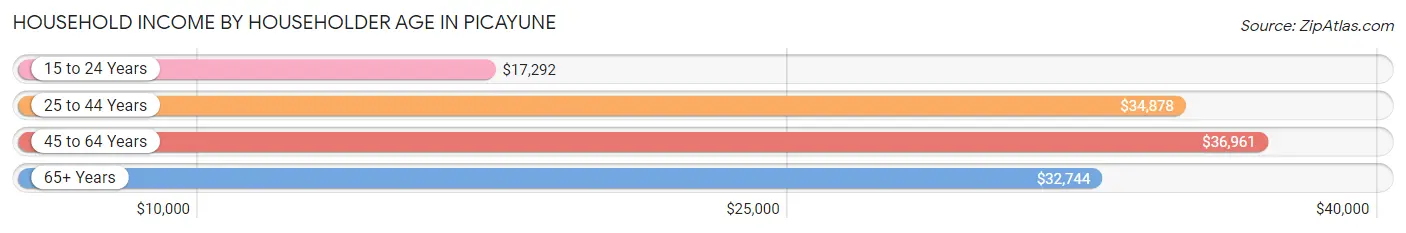
| Income Bracket | # Households | Median Income |
| 15 to 24 Years | 132 (3.0%) | $17,292 |
| 25 to 44 Years | 1,545 (35.1%) | $34,878 |
| 45 to 64 Years | 1,468 (33.3%) | $36,961 |
| 65+ Years | 1,258 (28.6%) | $32,744 |
| Total | 4,403 (100.0%) | $35,649 |
Poverty in Picayune
Income Below Poverty by Sex and Age in Picayune
With 21.8% poverty level for males and 31.8% for females among the residents of Picayune, 5 year old males and 6 to 11 year old females are the most vulnerable to poverty, with 13 males (100.0%) and 433 females (54.3%) in their respective age groups living below the poverty level.
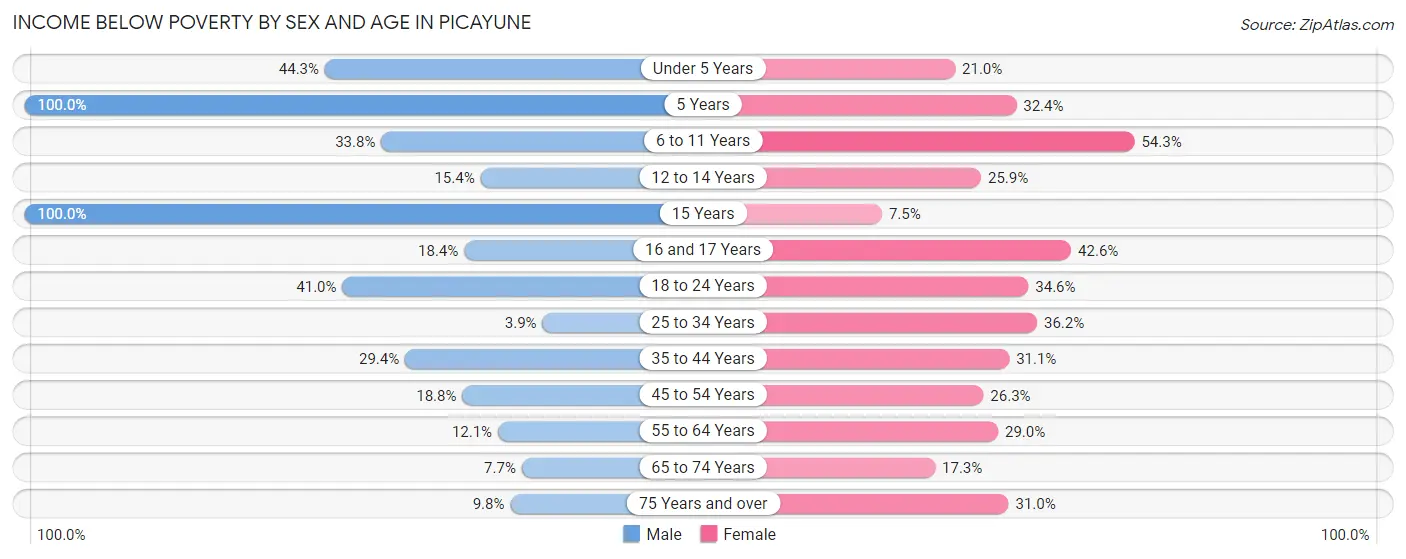
| Age Bracket | Male | Female |
| Under 5 Years | 220 (44.3%) | 49 (21.0%) |
| 5 Years | 13 (100.0%) | 23 (32.4%) |
| 6 to 11 Years | 170 (33.8%) | 433 (54.3%) |
| 12 to 14 Years | 52 (15.4%) | 53 (25.9%) |
| 15 Years | 10 (100.0%) | 10 (7.5%) |
| 16 and 17 Years | 21 (18.4%) | 43 (42.6%) |
| 18 to 24 Years | 185 (41.0%) | 151 (34.6%) |
| 25 to 34 Years | 25 (3.9%) | 295 (36.2%) |
| 35 to 44 Years | 206 (29.4%) | 293 (31.1%) |
| 45 to 54 Years | 114 (18.8%) | 174 (26.3%) |
| 55 to 64 Years | 71 (12.1%) | 230 (29.0%) |
| 65 to 74 Years | 38 (7.7%) | 124 (17.3%) |
| 75 Years and over | 36 (9.8%) | 108 (30.9%) |
| Total | 1,161 (21.8%) | 1,986 (31.8%) |
Income Above Poverty by Sex and Age in Picayune
According to the poverty statistics in Picayune, males aged 25 to 34 years and females aged 15 years are the age groups that are most secure financially, with 96.1% of males and 92.5% of females in these age groups living above the poverty line.
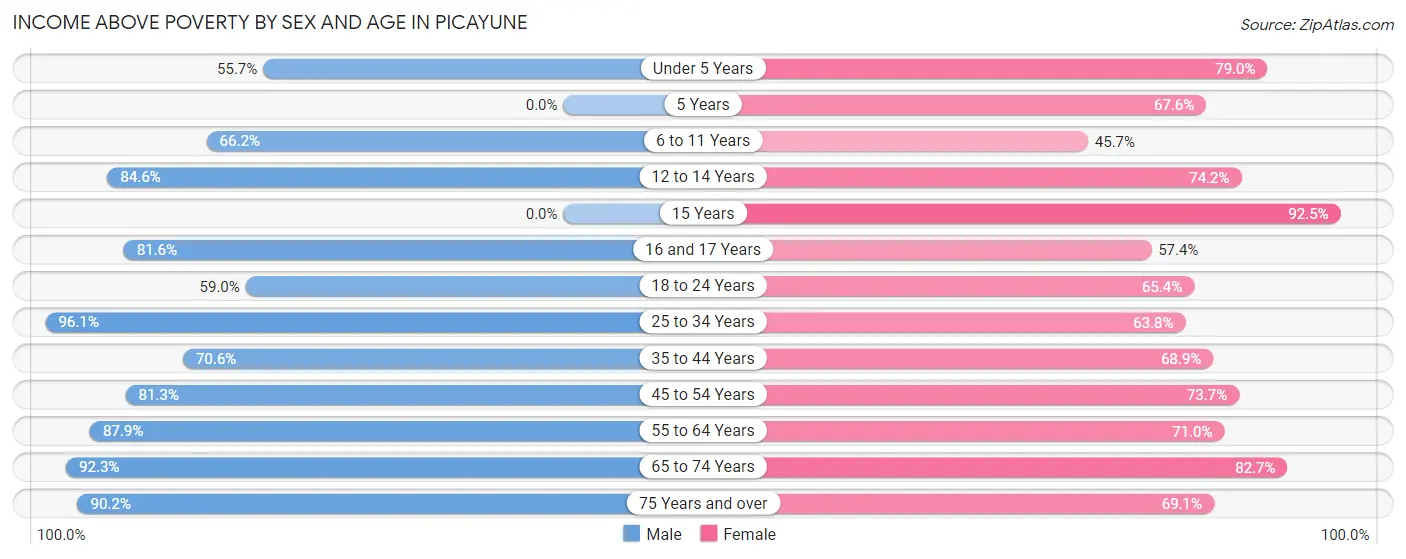
| Age Bracket | Male | Female |
| Under 5 Years | 277 (55.7%) | 184 (79.0%) |
| 5 Years | 0 (0.0%) | 48 (67.6%) |
| 6 to 11 Years | 333 (66.2%) | 364 (45.7%) |
| 12 to 14 Years | 286 (84.6%) | 152 (74.2%) |
| 15 Years | 0 (0.0%) | 124 (92.5%) |
| 16 and 17 Years | 93 (81.6%) | 58 (57.4%) |
| 18 to 24 Years | 266 (59.0%) | 285 (65.4%) |
| 25 to 34 Years | 620 (96.1%) | 519 (63.8%) |
| 35 to 44 Years | 495 (70.6%) | 650 (68.9%) |
| 45 to 54 Years | 494 (81.2%) | 488 (73.7%) |
| 55 to 64 Years | 514 (87.9%) | 563 (71.0%) |
| 65 to 74 Years | 454 (92.3%) | 592 (82.7%) |
| 75 Years and over | 330 (90.2%) | 241 (69.1%) |
| Total | 4,162 (78.2%) | 4,268 (68.2%) |
Income Below Poverty Among Married-Couple Families in Picayune
The poverty statistics for married-couple families in Picayune show that 11.0% or 143 of the total 1,300 families live below the poverty line. Families with 1 or 2 children have the highest poverty rate of 12.3%, comprising of 30 families. On the other hand, families with 3 or 4 children have the lowest poverty rate of 5.2%, which includes 11 families.
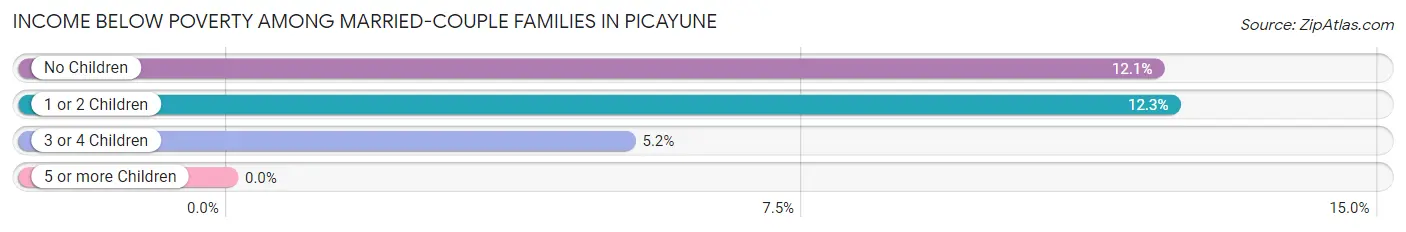
| Children | Above Poverty | Below Poverty |
| No Children | 742 (87.9%) | 102 (12.1%) |
| 1 or 2 Children | 214 (87.7%) | 30 (12.3%) |
| 3 or 4 Children | 201 (94.8%) | 11 (5.2%) |
| 5 or more Children | 0 (0.0%) | 0 (0.0%) |
| Total | 1,157 (89.0%) | 143 (11.0%) |
Income Below Poverty Among Single-Parent Households in Picayune
According to the poverty data in Picayune, 32.9% or 71 single-father households and 43.9% or 550 single-mother households are living below the poverty line. Among single-father households, those with 1 or 2 children have the highest poverty rate, with 71 households (37.6%) experiencing poverty. Likewise, among single-mother households, those with 1 or 2 children have the highest poverty rate, with 452 households (57.3%) falling below the poverty line.
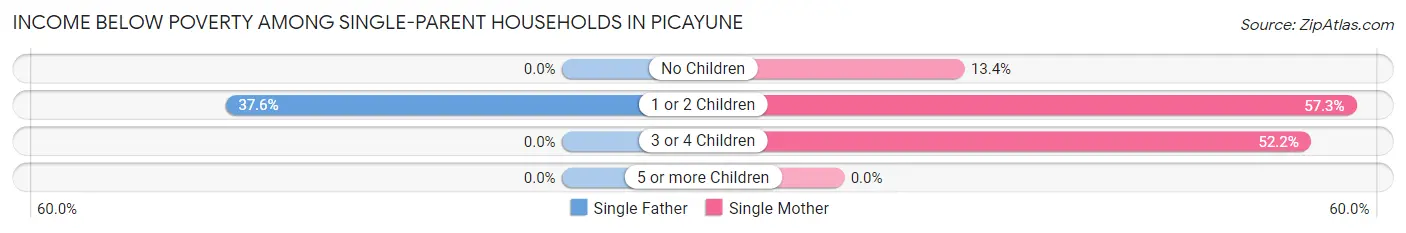
| Children | Single Father | Single Mother |
| No Children | 0 (0.0%) | 50 (13.4%) |
| 1 or 2 Children | 71 (37.6%) | 452 (57.3%) |
| 3 or 4 Children | 0 (0.0%) | 48 (52.2%) |
| 5 or more Children | 0 (0.0%) | 0 (0.0%) |
| Total | 71 (32.9%) | 550 (43.9%) |
Income Below Poverty Among Married-Couple vs Single-Parent Households in Picayune
The poverty data for Picayune shows that 143 of the married-couple family households (11.0%) and 621 of the single-parent households (42.3%) are living below the poverty level. Within the married-couple family households, those with 1 or 2 children have the highest poverty rate, with 30 households (12.3%) falling below the poverty line. Among the single-parent households, those with 1 or 2 children have the highest poverty rate, with 523 household (53.5%) living below poverty.
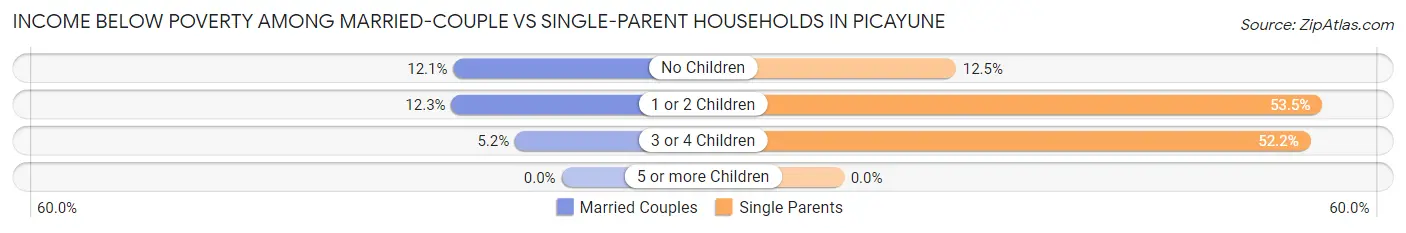
| Children | Married-Couple Families | Single-Parent Households |
| No Children | 102 (12.1%) | 50 (12.5%) |
| 1 or 2 Children | 30 (12.3%) | 523 (53.5%) |
| 3 or 4 Children | 11 (5.2%) | 48 (52.2%) |
| 5 or more Children | 0 (0.0%) | 0 (0.0%) |
| Total | 143 (11.0%) | 621 (42.3%) |
Race in Picayune
The most populous races in Picayune are White / Caucasian (6,663 | 56.5%), Black / African American (4,444 | 37.7%), and Two or more Races (619 | 5.2%).
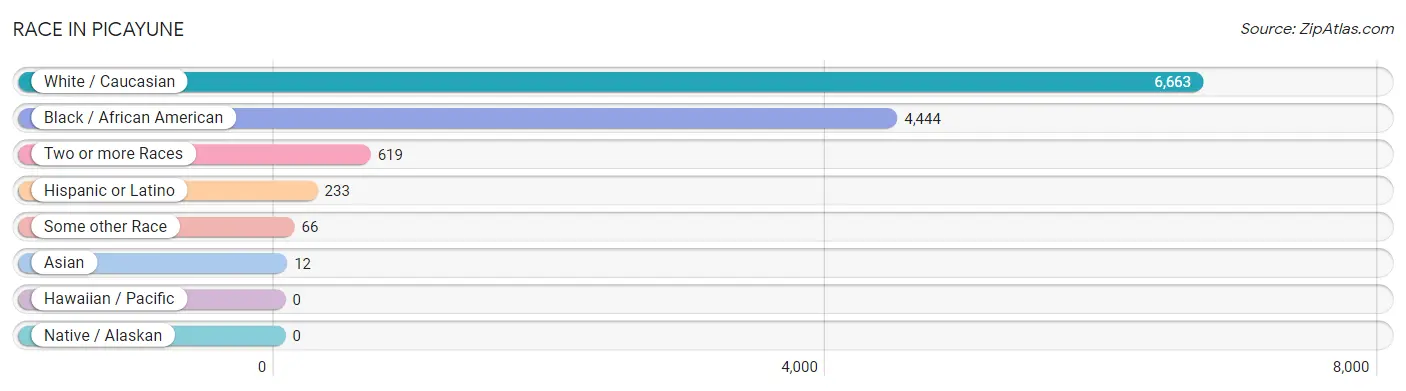
| Race | # Population | % Population |
| Asian | 12 | 0.1% |
| Black / African American | 4,444 | 37.7% |
| Hawaiian / Pacific | 0 | 0.0% |
| Hispanic or Latino | 233 | 2.0% |
| Native / Alaskan | 0 | 0.0% |
| White / Caucasian | 6,663 | 56.5% |
| Two or more Races | 619 | 5.2% |
| Some other Race | 66 | 0.6% |
| Total | 11,804 | 100.0% |
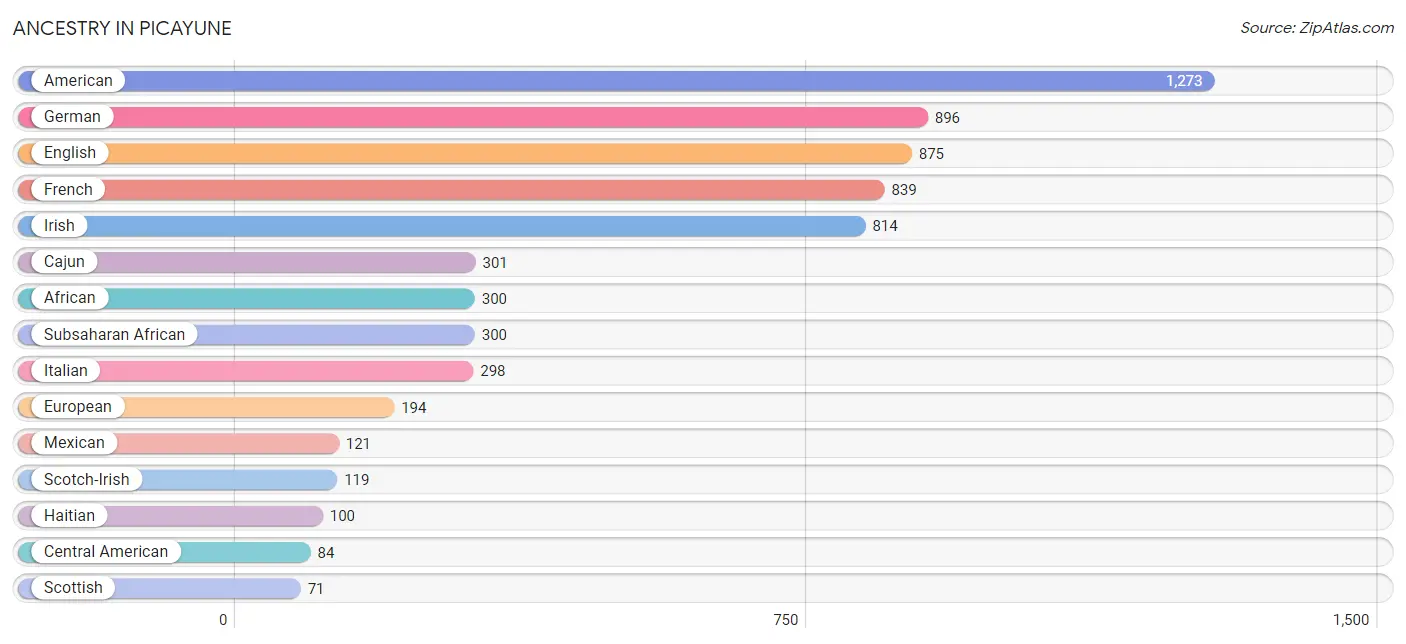
Ancestry in Picayune
The most populous ancestries reported in Picayune are American (1,273 | 10.8%), German (896 | 7.6%), English (875 | 7.4%), French (839 | 7.1%), and Irish (814 | 6.9%), together accounting for 39.8% of all Picayune residents.
| Ancestry | # Population | % Population |
| African | 300 | 2.5% |
| American | 1,273 | 10.8% |
| Arab | 7 | 0.1% |
| Basque | 45 | 0.4% |
| British | 31 | 0.3% |
| Cajun | 301 | 2.5% |
| Central American | 84 | 0.7% |
| Cherokee | 5 | 0.0% |
| Chickasaw | 15 | 0.1% |
| Choctaw | 51 | 0.4% |
| Comanche | 5 | 0.0% |
| Czech | 13 | 0.1% |
| Dutch | 15 | 0.1% |
| English | 875 | 7.4% |
| European | 194 | 1.6% |
| French | 839 | 7.1% |
| German | 896 | 7.6% |
| Greek | 59 | 0.5% |
| Haitian | 100 | 0.9% |
| Honduran | 8 | 0.1% |
| Indian (Asian) | 12 | 0.1% |
| Irish | 814 | 6.9% |
| Italian | 298 | 2.5% |
| Korean | 8 | 0.1% |
| Lebanese | 7 | 0.1% |
| Mexican | 121 | 1.0% |
| Norwegian | 49 | 0.4% |
| Panamanian | 70 | 0.6% |
| Pennsylvania German | 6 | 0.1% |
| Polish | 26 | 0.2% |
| Portuguese | 6 | 0.1% |
| Puerto Rican | 10 | 0.1% |
| Salvadoran | 6 | 0.1% |
| Scotch-Irish | 119 | 1.0% |
| Scottish | 71 | 0.6% |
| Sioux | 11 | 0.1% |
| Slavic | 19 | 0.2% |
| Subsaharan African | 300 | 2.5% |
| Swedish | 59 | 0.5% |
| Swiss | 8 | 0.1% |
| Welsh | 45 | 0.4% | View All 41 Rows |
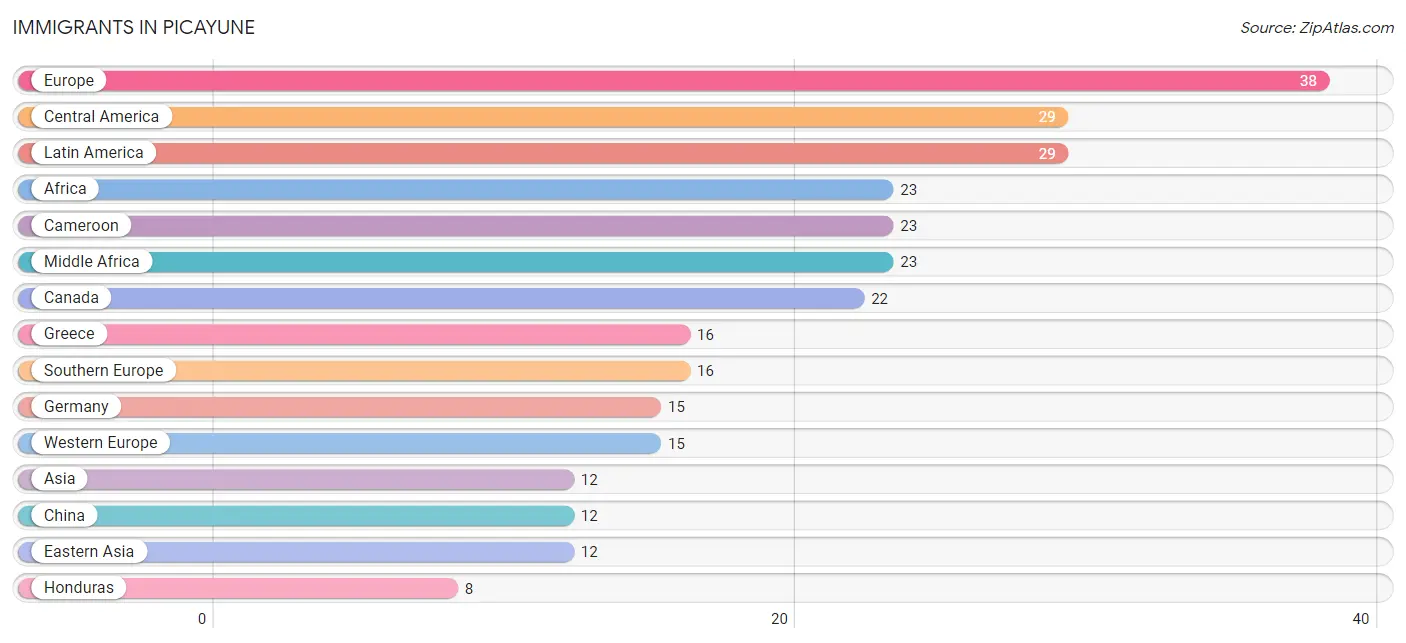
Immigrants in Picayune
The most numerous immigrant groups reported in Picayune came from Europe (38 | 0.3%), Central America (29 | 0.3%), Latin America (29 | 0.3%), Africa (23 | 0.2%), and Cameroon (23 | 0.2%), together accounting for 1.2% of all Picayune residents.
| Immigration Origin | # Population | % Population |
| Africa | 23 | 0.2% |
| Asia | 12 | 0.1% |
| Cameroon | 23 | 0.2% |
| Canada | 22 | 0.2% |
| Central America | 29 | 0.3% |
| China | 12 | 0.1% |
| Eastern Asia | 12 | 0.1% |
| El Salvador | 6 | 0.1% |
| Europe | 38 | 0.3% |
| Germany | 15 | 0.1% |
| Greece | 16 | 0.1% |
| Honduras | 8 | 0.1% |
| Latin America | 29 | 0.3% |
| Middle Africa | 23 | 0.2% |
| Nicaragua | 7 | 0.1% |
| Northern Europe | 7 | 0.1% |
| Panama | 8 | 0.1% |
| Southern Europe | 16 | 0.1% |
| Western Europe | 15 | 0.1% | View All 19 Rows |
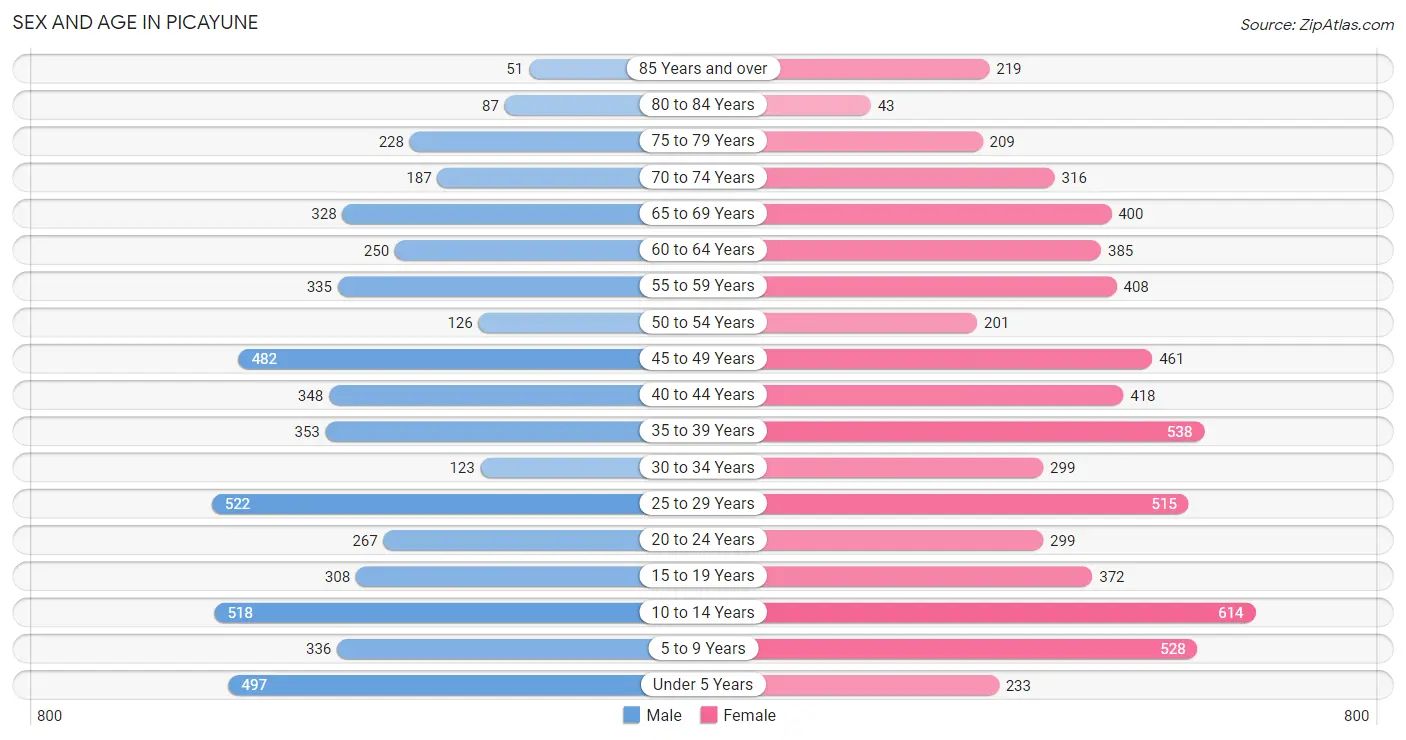
Sex and Age in Picayune
Sex and Age in Picayune
The most populous age groups in Picayune are 25 to 29 Years (522 | 9.8%) for men and 10 to 14 Years (614 | 9.5%) for women.
| Age Bracket | Male | Female |
| Under 5 Years | 497 (9.3%) | 233 (3.6%) |
| 5 to 9 Years | 336 (6.3%) | 528 (8.2%) |
| 10 to 14 Years | 518 (9.7%) | 614 (9.5%) |
| 15 to 19 Years | 308 (5.8%) | 372 (5.8%) |
| 20 to 24 Years | 267 (5.0%) | 299 (4.6%) |
| 25 to 29 Years | 522 (9.8%) | 515 (8.0%) |
| 30 to 34 Years | 123 (2.3%) | 299 (4.6%) |
| 35 to 39 Years | 353 (6.6%) | 538 (8.3%) |
| 40 to 44 Years | 348 (6.5%) | 418 (6.5%) |
| 45 to 49 Years | 482 (9.0%) | 461 (7.1%) |
| 50 to 54 Years | 126 (2.4%) | 201 (3.1%) |
| 55 to 59 Years | 335 (6.3%) | 408 (6.3%) |
| 60 to 64 Years | 250 (4.7%) | 385 (6.0%) |
| 65 to 69 Years | 328 (6.1%) | 400 (6.2%) |
| 70 to 74 Years | 187 (3.5%) | 316 (4.9%) |
| 75 to 79 Years | 228 (4.3%) | 209 (3.2%) |
| 80 to 84 Years | 87 (1.6%) | 43 (0.7%) |
| 85 Years and over | 51 (0.9%) | 219 (3.4%) |
| Total | 5,346 (100.0%) | 6,458 (100.0%) |
Families and Households in Picayune
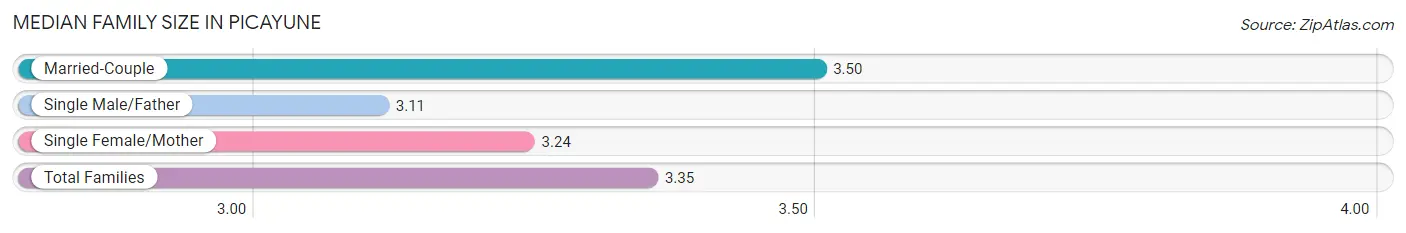
Median Family Size in Picayune
The median family size in Picayune is 3.35 persons per family, with married-couple families (1,300 | 46.9%) accounting for the largest median family size of 3.5 persons per family. On the other hand, single male/father families (216 | 7.8%) represent the smallest median family size with 3.11 persons per family.
| Family Type | # Families | Family Size |
| Married-Couple | 1,300 (46.9%) | 3.50 |
| Single Male/Father | 216 (7.8%) | 3.11 |
| Single Female/Mother | 1,253 (45.3%) | 3.24 |
| Total Families | 2,769 (100.0%) | 3.35 |
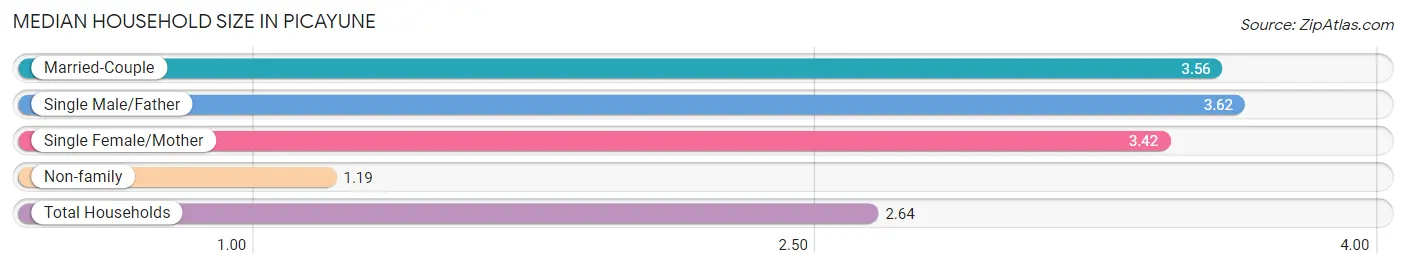
Median Household Size in Picayune
The median household size in Picayune is 2.64 persons per household, with single male/father households (216 | 4.9%) accounting for the largest median household size of 3.62 persons per household. non-family households (1,634 | 37.1%) represent the smallest median household size with 1.19 persons per household.
| Household Type | # Households | Household Size |
| Married-Couple | 1,300 (29.5%) | 3.56 |
| Single Male/Father | 216 (4.9%) | 3.62 |
| Single Female/Mother | 1,253 (28.5%) | 3.42 |
| Non-family | 1,634 (37.1%) | 1.19 |
| Total Households | 4,403 (100.0%) | 2.64 |
Household Size by Marriage Status in Picayune
Out of a total of 4,403 households in Picayune, 2,769 (62.9%) are family households, while 1,634 (37.1%) are nonfamily households. The most numerous type of family households are 2-person households, comprising 1,264, and the most common type of nonfamily households are 1-person households, comprising 1,348.
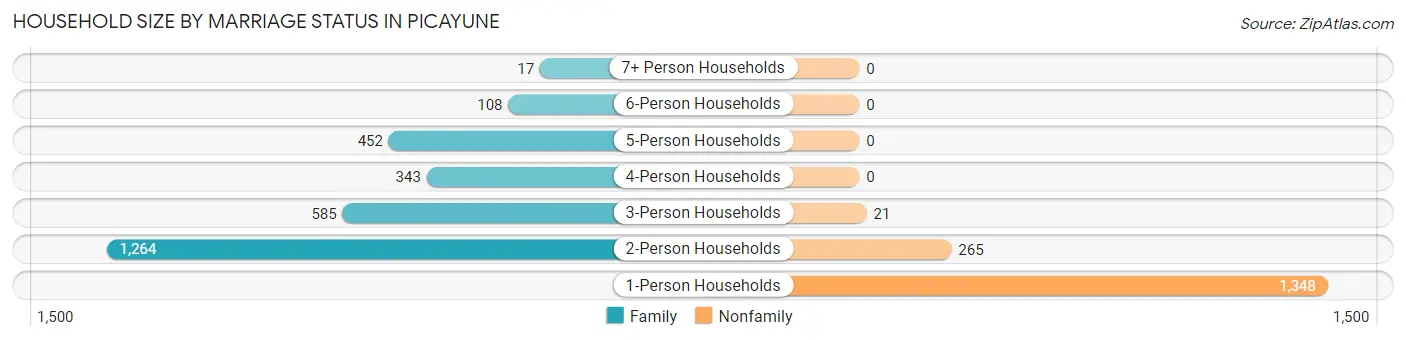
| Household Size | Family Households | Nonfamily Households |
| 1-Person Households | - | 1,348 (30.6%) |
| 2-Person Households | 1,264 (28.7%) | 265 (6.0%) |
| 3-Person Households | 585 (13.3%) | 21 (0.5%) |
| 4-Person Households | 343 (7.8%) | 0 (0.0%) |
| 5-Person Households | 452 (10.3%) | 0 (0.0%) |
| 6-Person Households | 108 (2.5%) | 0 (0.0%) |
| 7+ Person Households | 17 (0.4%) | 0 (0.0%) |
| Total | 2,769 (62.9%) | 1,634 (37.1%) |
Female Fertility in Picayune
Fertility by Age in Picayune
Average fertility rate in Picayune is 47.0 births per 1,000 women. Women in the age bracket of 20 to 34 years have the highest fertility rate with 122.0 births per 1,000 women. Women in the age bracket of 20 to 34 years acount for 98.6% of all women with births.
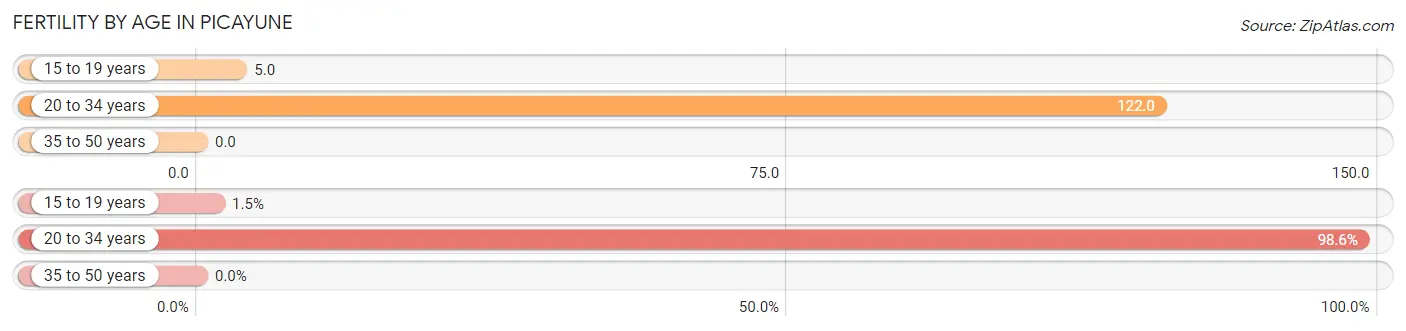
| Age Bracket | Women with Births | Births / 1,000 Women |
| 15 to 19 years | 2 (1.5%) | 5.0 |
| 20 to 34 years | 136 (98.6%) | 122.0 |
| 35 to 50 years | 0 (0.0%) | 0.0 |
| Total | 138 (100.0%) | 47.0 |
Fertility by Age by Marriage Status in Picayune
23.9% of women with births (138) in Picayune are married. The highest percentage of unmarried women with births falls into 15 to 19 years age bracket with 100.0% of them unmarried at the time of birth, while the lowest percentage of unmarried women with births belong to 20 to 34 years age bracket with 75.7% of them unmarried.
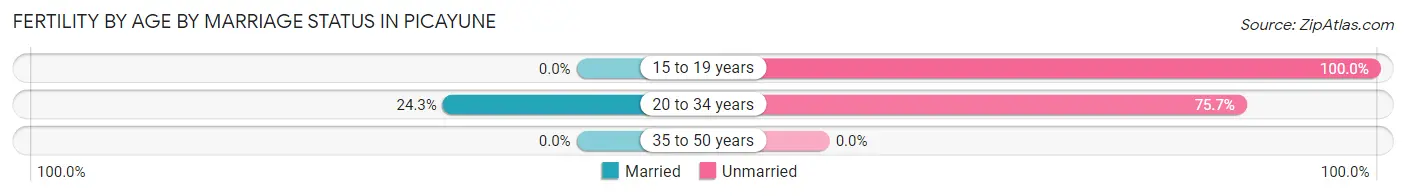
| Age Bracket | Married | Unmarried |
| 15 to 19 years | 0 (0.0%) | 2 (100.0%) |
| 20 to 34 years | 33 (24.3%) | 103 (75.7%) |
| 35 to 50 years | 0 (0.0%) | 0 (0.0%) |
| Total | 33 (23.9%) | 105 (76.1%) |
Fertility by Education in Picayune
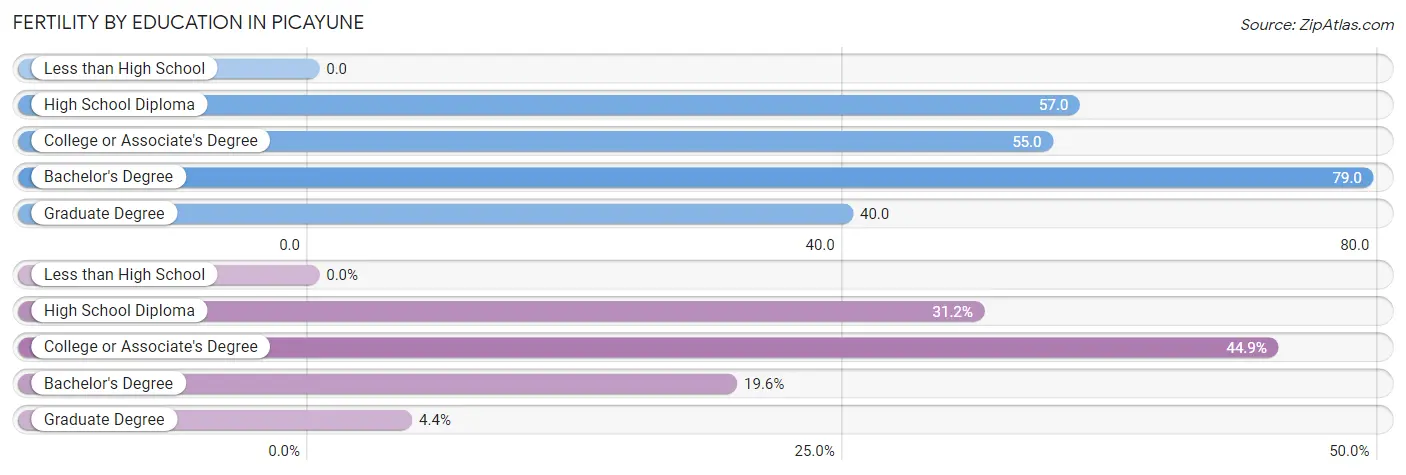
| Educational Attainment | Women with Births | Births / 1,000 Women |
| Less than High School | 0 (0.0%) | 0.0 |
| High School Diploma | 43 (31.2%) | 57.0 |
| College or Associate's Degree | 62 (44.9%) | 55.0 |
| Bachelor's Degree | 27 (19.6%) | 79.0 |
| Graduate Degree | 6 (4.3%) | 40.0 |
| Total | 138 (100.0%) | 47.0 |
Fertility by Education by Marriage Status in Picayune
76.1% of women with births in Picayune are unmarried. Women with the educational attainment of bachelor's degree are most likely to be married with 100.0% of them married at childbirth, while women with the educational attainment of high school diploma are least likely to be married with 100.0% of them unmarried at childbirth.
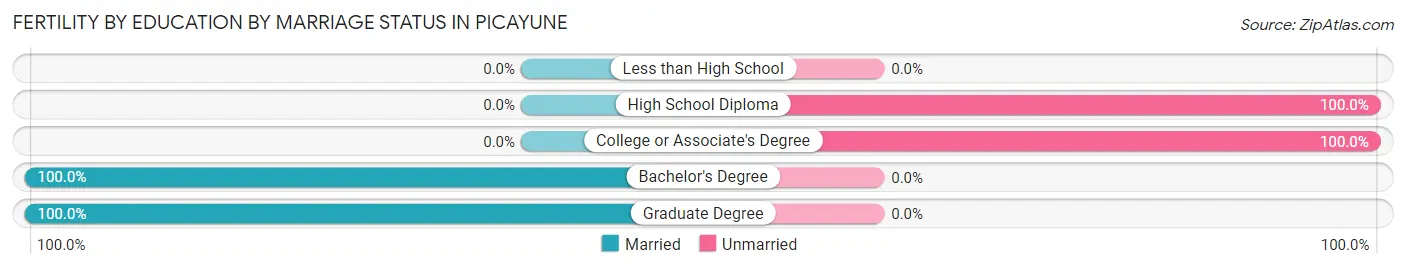
| Educational Attainment | Married | Unmarried |
| Less than High School | 0 (0.0%) | 0 (0.0%) |
| High School Diploma | 0 (0.0%) | 43 (100.0%) |
| College or Associate's Degree | 0 (0.0%) | 62 (100.0%) |
| Bachelor's Degree | 27 (100.0%) | 0 (0.0%) |
| Graduate Degree | 6 (100.0%) | 0 (0.0%) |
| Total | 33 (23.9%) | 105 (76.1%) |
Employment Characteristics in Picayune
Employment by Class of Employer in Picayune
Among the 4,520 employed individuals in Picayune, private company employees (3,384 | 74.9%), self-employed (not incorporated) (261 | 5.8%), and state government employees (215 | 4.8%) make up the most common classes of employment.
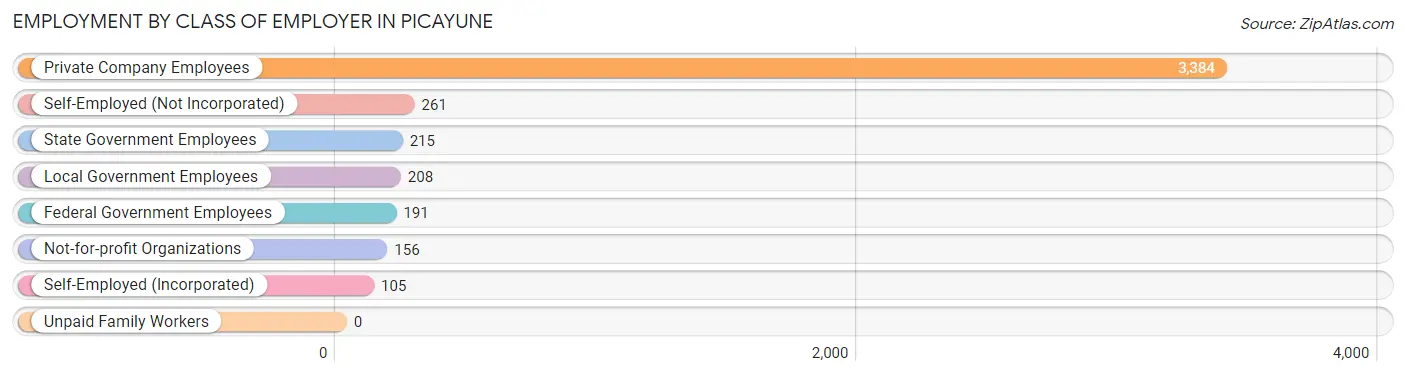
| Employer Class | # Employees | % Employees |
| Private Company Employees | 3,384 | 74.9% |
| Self-Employed (Incorporated) | 105 | 2.3% |
| Self-Employed (Not Incorporated) | 261 | 5.8% |
| Not-for-profit Organizations | 156 | 3.5% |
| Local Government Employees | 208 | 4.6% |
| State Government Employees | 215 | 4.8% |
| Federal Government Employees | 191 | 4.2% |
| Unpaid Family Workers | 0 | 0.0% |
| Total | 4,520 | 100.0% |
Employment Status by Age in Picayune
According to the labor force statistics for Picayune, out of the total population over 16 years of age (8,934), 55.9% or 4,994 individuals are in the labor force, with 5.7% or 285 of them unemployed. The age group with the highest labor force participation rate is 30 to 34 years, with 96.4% or 407 individuals in the labor force. Within the labor force, the 75 years and over age range has the highest percentage of unemployed individuals, with 53.1% or 17 of them being unemployed.
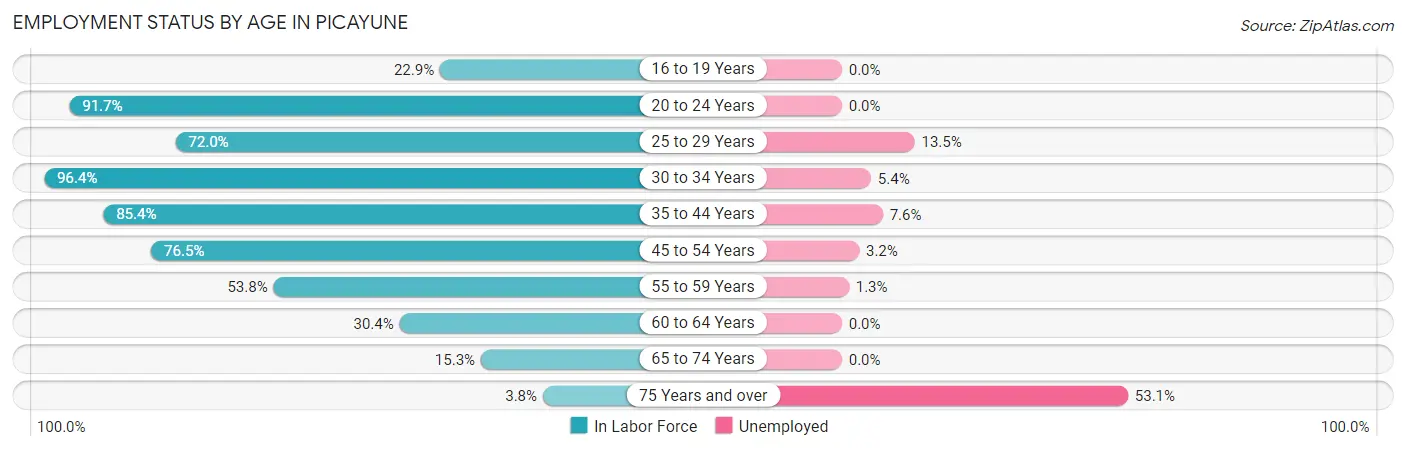
| Age Bracket | In Labor Force | Unemployed |
| 16 to 19 Years | 123 (22.9%) | 0 (0.0%) |
| 20 to 24 Years | 519 (91.7%) | 0 (0.0%) |
| 25 to 29 Years | 747 (72.0%) | 101 (13.5%) |
| 30 to 34 Years | 407 (96.4%) | 22 (5.4%) |
| 35 to 44 Years | 1,415 (85.4%) | 108 (7.6%) |
| 45 to 54 Years | 972 (76.5%) | 31 (3.2%) |
| 55 to 59 Years | 400 (53.8%) | 5 (1.3%) |
| 60 to 64 Years | 193 (30.4%) | 0 (0.0%) |
| 65 to 74 Years | 188 (15.3%) | 0 (0.0%) |
| 75 Years and over | 32 (3.8%) | 17 (53.1%) |
| Total | 4,994 (55.9%) | 285 (5.7%) |
Employment Status by Educational Attainment in Picayune
According to labor force statistics for Picayune, 71.7% of individuals (4,133) out of the total population between 25 and 64 years of age (5,764) are in the labor force, with 6.5% or 269 of them being unemployed. The group with the highest labor force participation rate are those with the educational attainment of bachelor's degree or higher, with 91.7% or 815 individuals in the labor force. Within the labor force, individuals with less than high school education have the highest percentage of unemployment, with 23.2% or 69 of them being unemployed.
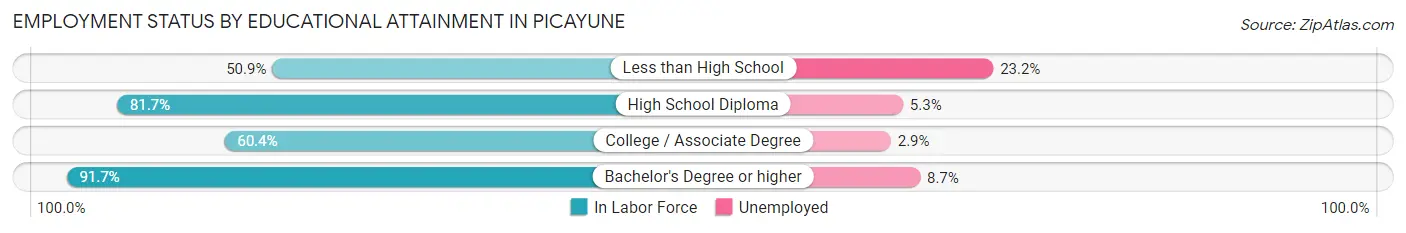
| Educational Attainment | In Labor Force | Unemployed |
| Less than High School | 298 (50.9%) | 136 (23.2%) |
| High School Diploma | 1,652 (81.7%) | 107 (5.3%) |
| College / Associate Degree | 1,370 (60.4%) | 66 (2.9%) |
| Bachelor's Degree or higher | 815 (91.7%) | 77 (8.7%) |
| Total | 4,133 (71.7%) | 375 (6.5%) |
Employment Occupations by Sex in Picayune
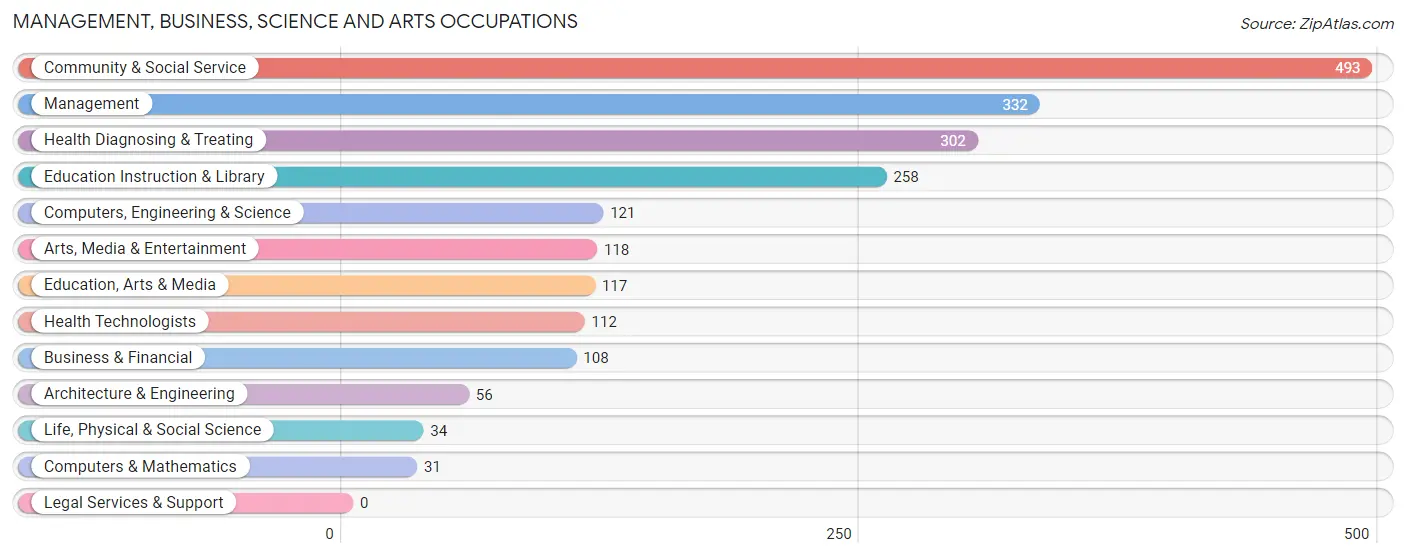
Management, Business, Science and Arts Occupations
The most common Management, Business, Science and Arts occupations in Picayune are Community & Social Service (493 | 10.5%), Management (332 | 7.0%), Health Diagnosing & Treating (302 | 6.4%), Education Instruction & Library (258 | 5.5%), and Computers, Engineering & Science (121 | 2.6%).
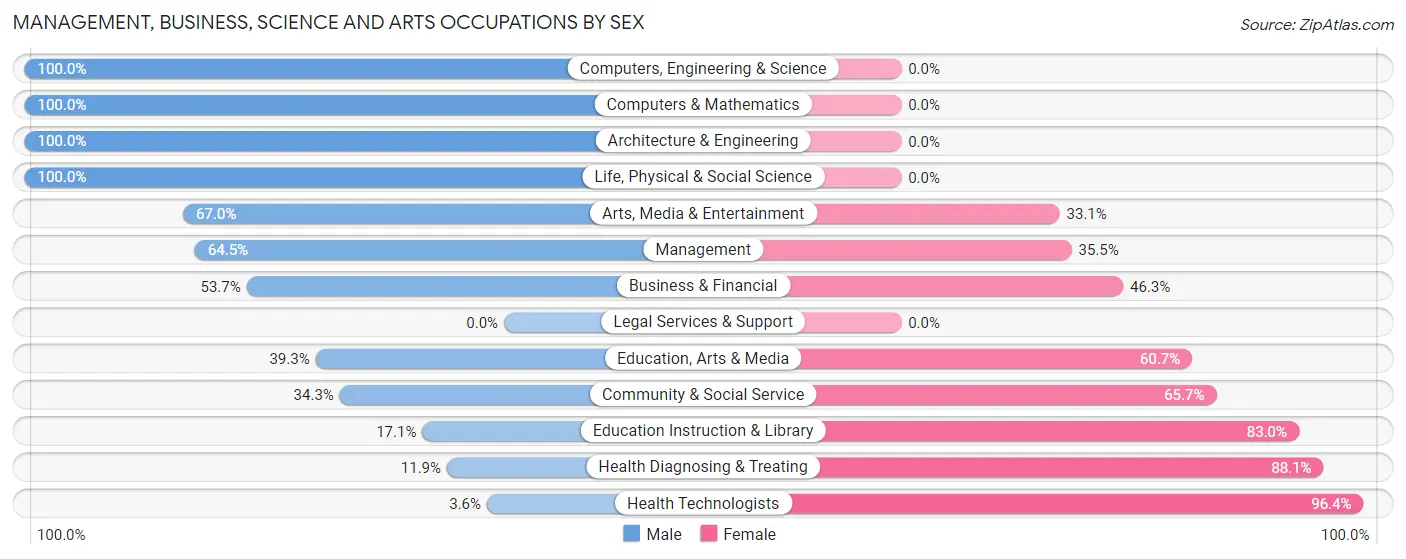
Management, Business, Science and Arts Occupations by Sex
Within the Management, Business, Science and Arts occupations in Picayune, the most male-oriented occupations are Computers, Engineering & Science (100.0%), Computers & Mathematics (100.0%), and Architecture & Engineering (100.0%), while the most female-oriented occupations are Health Technologists (96.4%), Health Diagnosing & Treating (88.1%), and Education Instruction & Library (83.0%).
| Occupation | Male | Female |
| Management | 214 (64.5%) | 118 (35.5%) |
| Business & Financial | 58 (53.7%) | 50 (46.3%) |
| Computers, Engineering & Science | 121 (100.0%) | 0 (0.0%) |
| Computers & Mathematics | 31 (100.0%) | 0 (0.0%) |
| Architecture & Engineering | 56 (100.0%) | 0 (0.0%) |
| Life, Physical & Social Science | 34 (100.0%) | 0 (0.0%) |
| Community & Social Service | 169 (34.3%) | 324 (65.7%) |
| Education, Arts & Media | 46 (39.3%) | 71 (60.7%) |
| Legal Services & Support | 0 (0.0%) | 0 (0.0%) |
| Education Instruction & Library | 44 (17.1%) | 214 (83.0%) |
| Arts, Media & Entertainment | 79 (66.9%) | 39 (33.1%) |
| Health Diagnosing & Treating | 36 (11.9%) | 266 (88.1%) |
| Health Technologists | 4 (3.6%) | 108 (96.4%) |
| Total (Category) | 598 (44.1%) | 758 (55.9%) |
| Total (Overall) | 2,314 (49.1%) | 2,398 (50.9%) |
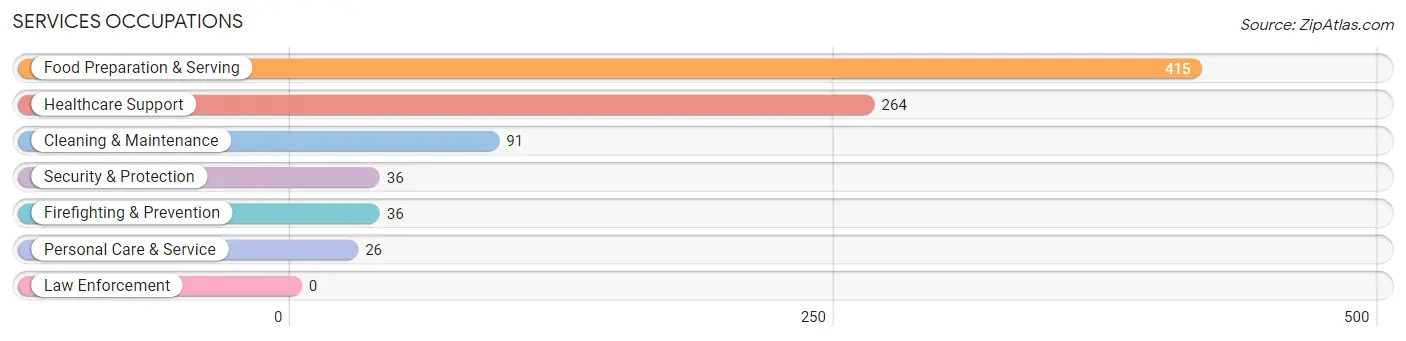
Services Occupations
The most common Services occupations in Picayune are Food Preparation & Serving (415 | 8.8%), Healthcare Support (264 | 5.6%), Cleaning & Maintenance (91 | 1.9%), Security & Protection (36 | 0.8%), and Firefighting & Prevention (36 | 0.8%).
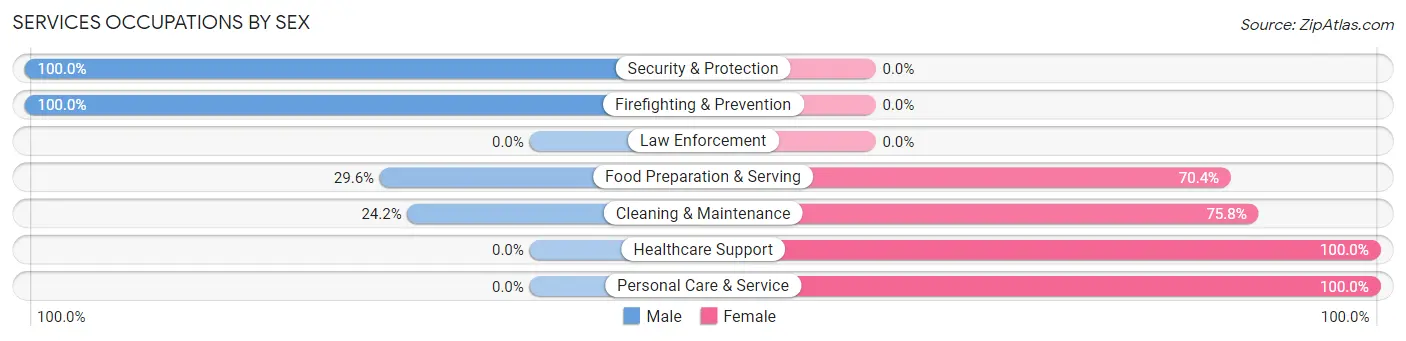
Services Occupations by Sex
Within the Services occupations in Picayune, the most male-oriented occupations are Security & Protection (100.0%), Firefighting & Prevention (100.0%), and Food Preparation & Serving (29.6%), while the most female-oriented occupations are Healthcare Support (100.0%), Personal Care & Service (100.0%), and Cleaning & Maintenance (75.8%).
| Occupation | Male | Female |
| Healthcare Support | 0 (0.0%) | 264 (100.0%) |
| Security & Protection | 36 (100.0%) | 0 (0.0%) |
| Firefighting & Prevention | 36 (100.0%) | 0 (0.0%) |
| Law Enforcement | 0 (0.0%) | 0 (0.0%) |
| Food Preparation & Serving | 123 (29.6%) | 292 (70.4%) |
| Cleaning & Maintenance | 22 (24.2%) | 69 (75.8%) |
| Personal Care & Service | 0 (0.0%) | 26 (100.0%) |
| Total (Category) | 181 (21.7%) | 651 (78.2%) |
| Total (Overall) | 2,314 (49.1%) | 2,398 (50.9%) |
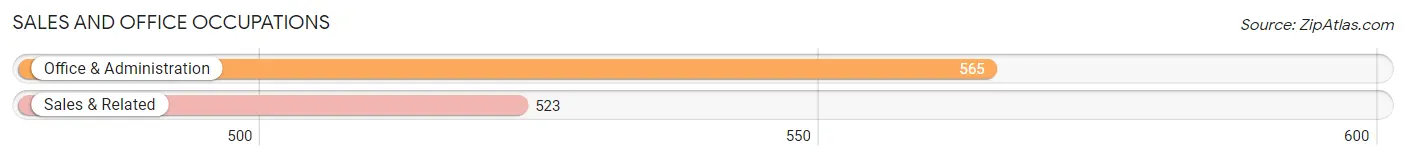
Sales and Office Occupations
The most common Sales and Office occupations in Picayune are Office & Administration (565 | 12.0%), and Sales & Related (523 | 11.1%).
Sales and Office Occupations by Sex
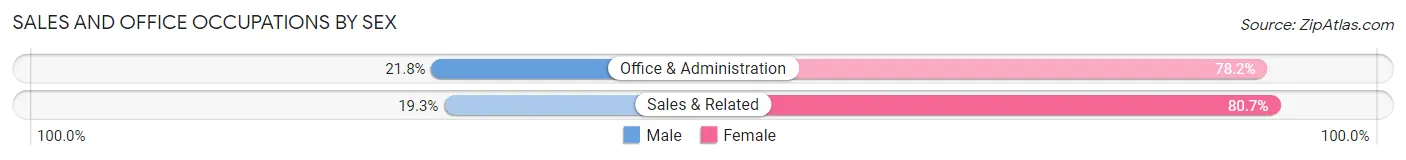
| Occupation | Male | Female |
| Sales & Related | 101 (19.3%) | 422 (80.7%) |
| Office & Administration | 123 (21.8%) | 442 (78.2%) |
| Total (Category) | 224 (20.6%) | 864 (79.4%) |
| Total (Overall) | 2,314 (49.1%) | 2,398 (50.9%) |
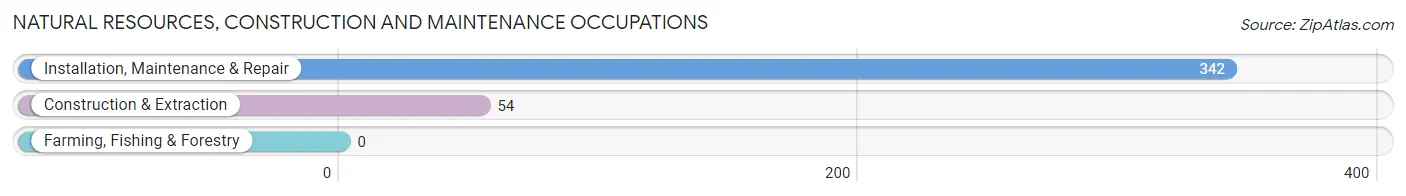
Natural Resources, Construction and Maintenance Occupations
The most common Natural Resources, Construction and Maintenance occupations in Picayune are Installation, Maintenance & Repair (342 | 7.3%), and Construction & Extraction (54 | 1.1%).
Natural Resources, Construction and Maintenance Occupations by Sex
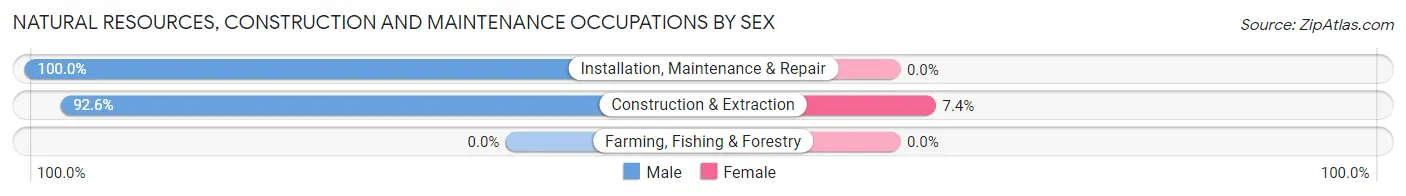
| Occupation | Male | Female |
| Farming, Fishing & Forestry | 0 (0.0%) | 0 (0.0%) |
| Construction & Extraction | 50 (92.6%) | 4 (7.4%) |
| Installation, Maintenance & Repair | 342 (100.0%) | 0 (0.0%) |
| Total (Category) | 392 (99.0%) | 4 (1.0%) |
| Total (Overall) | 2,314 (49.1%) | 2,398 (50.9%) |
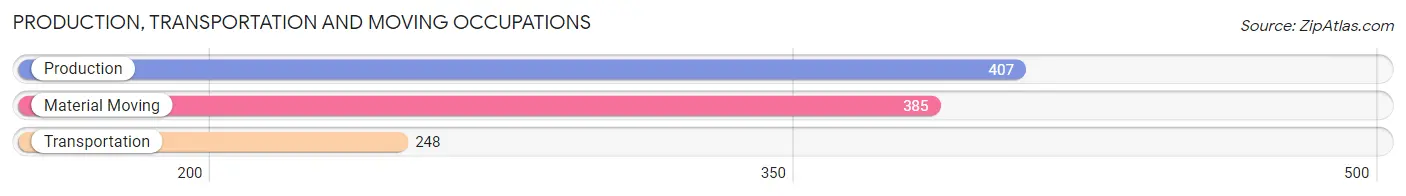
Production, Transportation and Moving Occupations
The most common Production, Transportation and Moving occupations in Picayune are Production (407 | 8.6%), Material Moving (385 | 8.2%), and Transportation (248 | 5.3%).
Production, Transportation and Moving Occupations by Sex
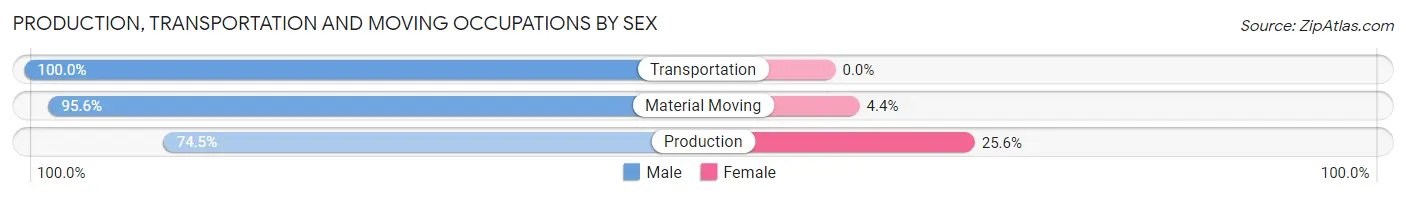
| Occupation | Male | Female |
| Production | 303 (74.5%) | 104 (25.6%) |
| Transportation | 248 (100.0%) | 0 (0.0%) |
| Material Moving | 368 (95.6%) | 17 (4.4%) |
| Total (Category) | 919 (88.4%) | 121 (11.6%) |
| Total (Overall) | 2,314 (49.1%) | 2,398 (50.9%) |
Employment Industries by Sex in Picayune
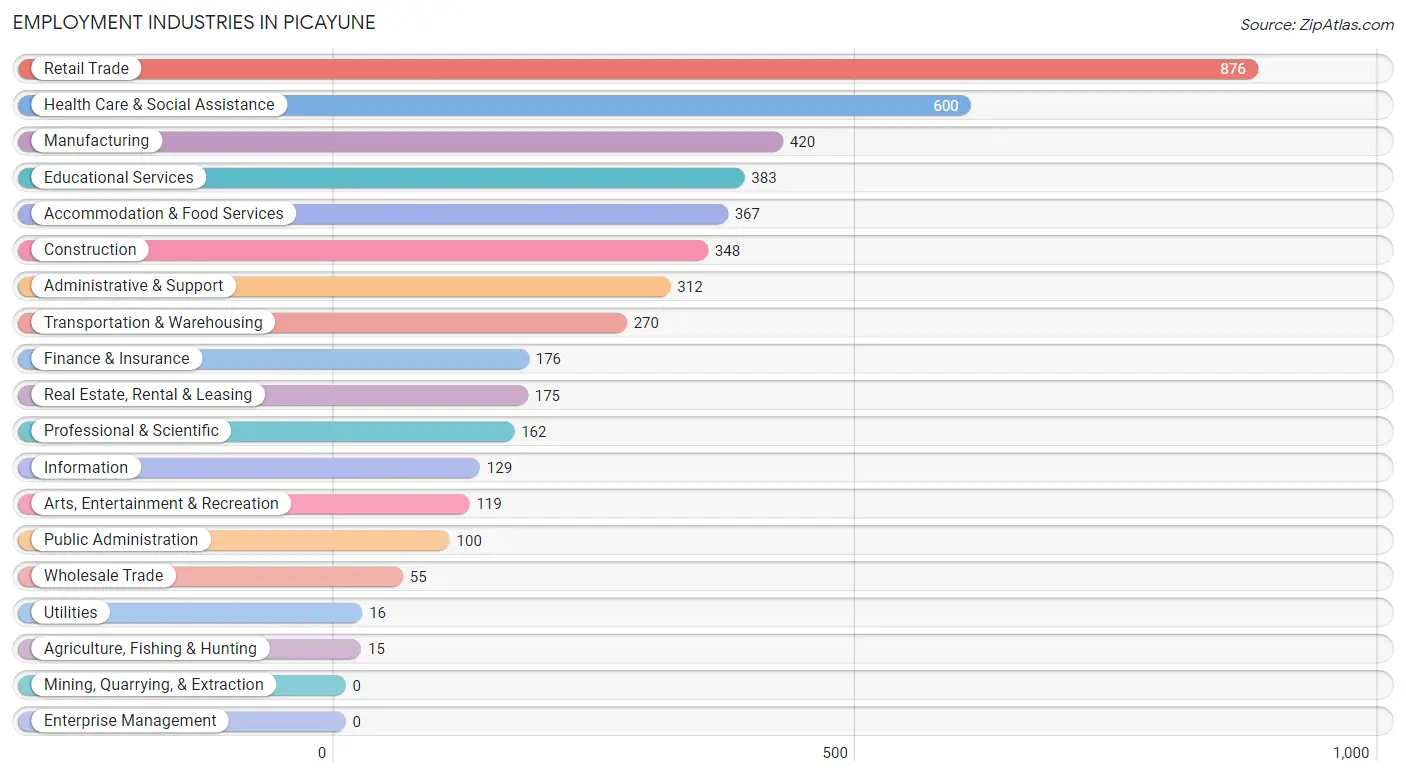
Employment Industries in Picayune
The major employment industries in Picayune include Retail Trade (876 | 18.6%), Health Care & Social Assistance (600 | 12.7%), Manufacturing (420 | 8.9%), Educational Services (383 | 8.1%), and Accommodation & Food Services (367 | 7.8%).
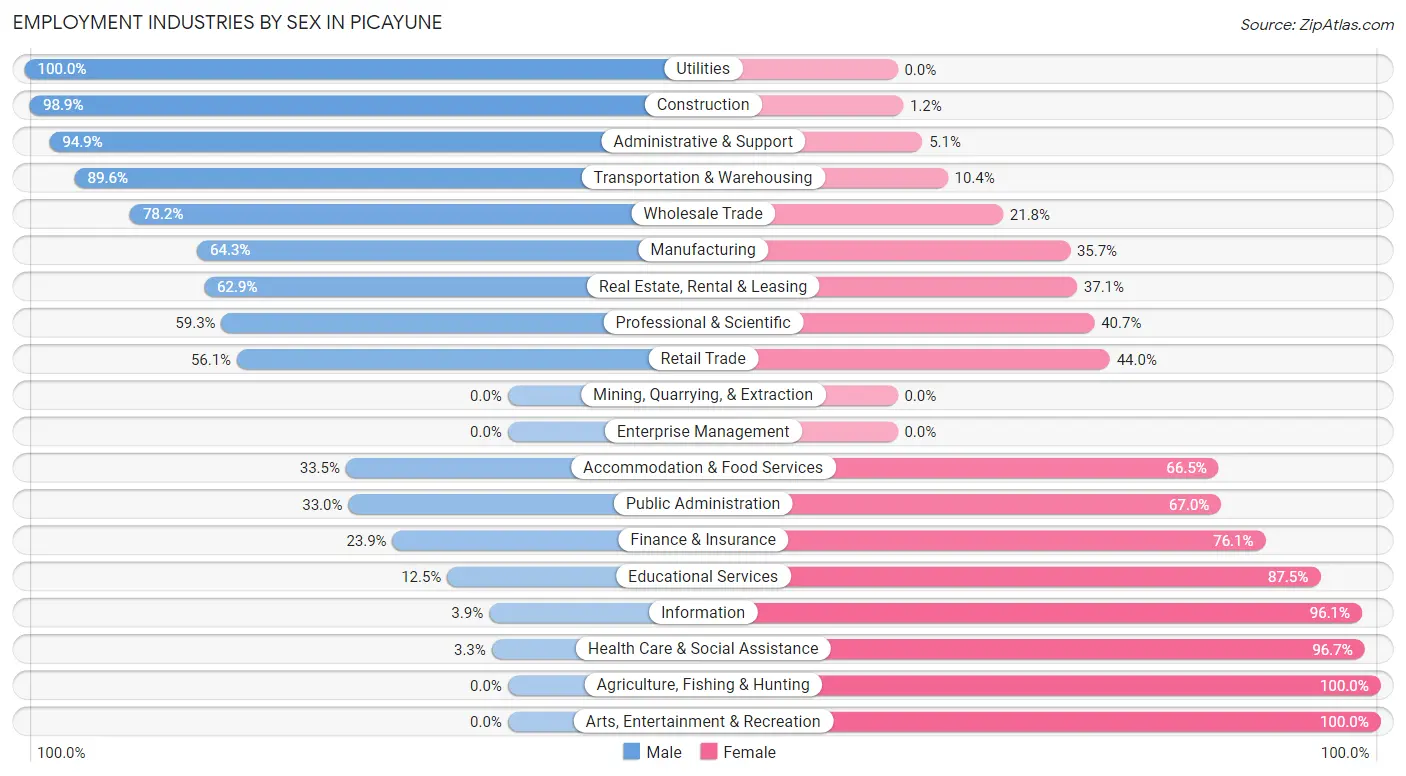
Employment Industries by Sex in Picayune
The Picayune industries that see more men than women are Utilities (100.0%), Construction (98.9%), and Administrative & Support (94.9%), whereas the industries that tend to have a higher number of women are Agriculture, Fishing & Hunting (100.0%), Arts, Entertainment & Recreation (100.0%), and Health Care & Social Assistance (96.7%).
| Industry | Male | Female |
| Agriculture, Fishing & Hunting | 0 (0.0%) | 15 (100.0%) |
| Mining, Quarrying, & Extraction | 0 (0.0%) | 0 (0.0%) |
| Construction | 344 (98.9%) | 4 (1.1%) |
| Manufacturing | 270 (64.3%) | 150 (35.7%) |
| Wholesale Trade | 43 (78.2%) | 12 (21.8%) |
| Retail Trade | 491 (56.0%) | 385 (44.0%) |
| Transportation & Warehousing | 242 (89.6%) | 28 (10.4%) |
| Utilities | 16 (100.0%) | 0 (0.0%) |
| Information | 5 (3.9%) | 124 (96.1%) |
| Finance & Insurance | 42 (23.9%) | 134 (76.1%) |
| Real Estate, Rental & Leasing | 110 (62.9%) | 65 (37.1%) |
| Professional & Scientific | 96 (59.3%) | 66 (40.7%) |
| Enterprise Management | 0 (0.0%) | 0 (0.0%) |
| Administrative & Support | 296 (94.9%) | 16 (5.1%) |
| Educational Services | 48 (12.5%) | 335 (87.5%) |
| Health Care & Social Assistance | 20 (3.3%) | 580 (96.7%) |
| Arts, Entertainment & Recreation | 0 (0.0%) | 119 (100.0%) |
| Accommodation & Food Services | 123 (33.5%) | 244 (66.5%) |
| Public Administration | 33 (33.0%) | 67 (67.0%) |
| Total | 2,314 (49.1%) | 2,398 (50.9%) |
Education in Picayune
School Enrollment in Picayune
The most common levels of schooling among the 3,127 students in Picayune are middle school (924 | 29.5%), elementary school (737 | 23.6%), and high school (697 | 22.3%).
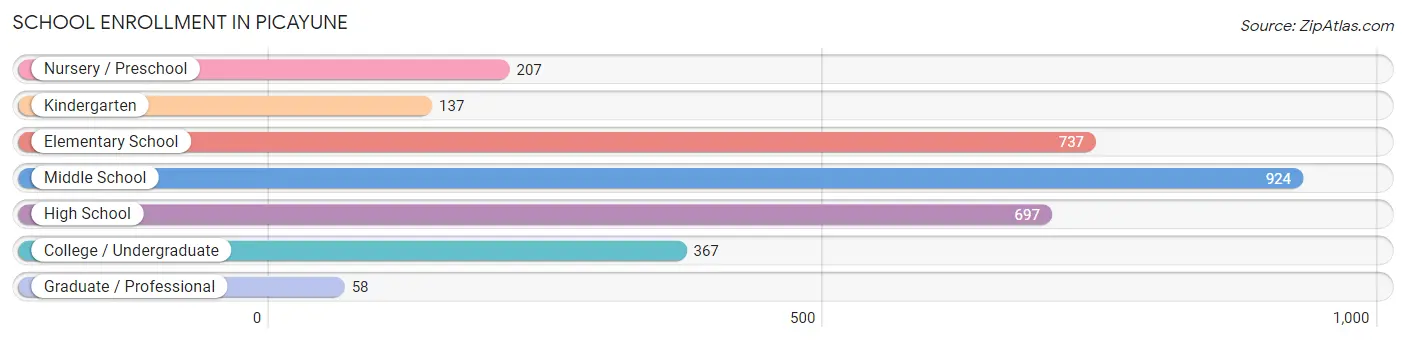
| School Level | # Students | % Students |
| Nursery / Preschool | 207 | 6.6% |
| Kindergarten | 137 | 4.4% |
| Elementary School | 737 | 23.6% |
| Middle School | 924 | 29.5% |
| High School | 697 | 22.3% |
| College / Undergraduate | 367 | 11.7% |
| Graduate / Professional | 58 | 1.8% |
| Total | 3,127 | 100.0% |
School Enrollment by Age by Funding Source in Picayune
Out of a total of 3,127 students who are enrolled in schools in Picayune, 594 (19.0%) attend a private institution, while the remaining 2,533 (81.0%) are enrolled in public schools. The age group of 3 to 4 year olds has the highest likelihood of being enrolled in private schools, with 108 (66.7% in the age bracket) enrolled. Conversely, the age group of 18 to 19 year olds has the lowest likelihood of being enrolled in a private school, with 214 (100.0% in the age bracket) attending a public institution.
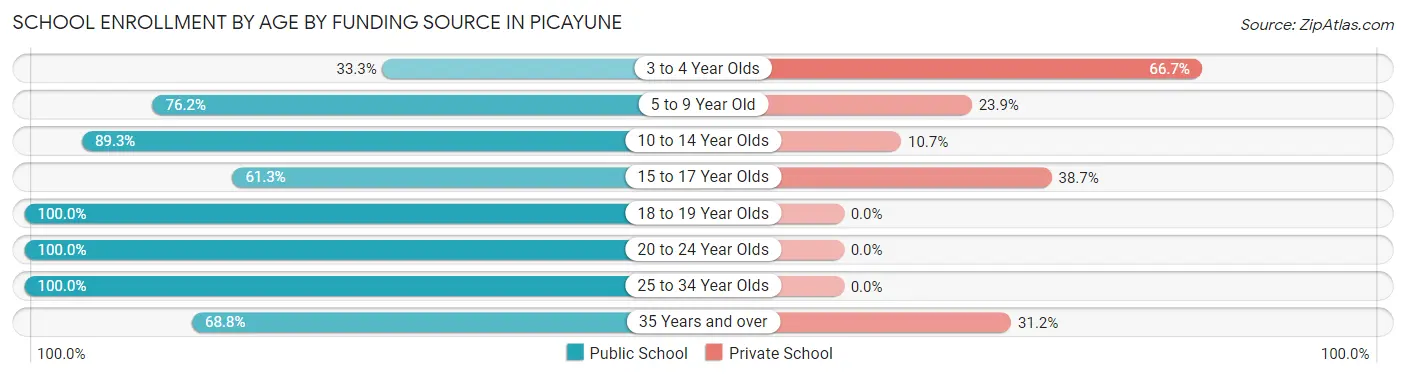
| Age Bracket | Public School | Private School |
| 3 to 4 Year Olds | 54 (33.3%) | 108 (66.7%) |
| 5 to 9 Year Old | 610 (76.1%) | 191 (23.8%) |
| 10 to 14 Year Olds | 1,011 (89.3%) | 121 (10.7%) |
| 15 to 17 Year Olds | 220 (61.3%) | 139 (38.7%) |
| 18 to 19 Year Olds | 214 (100.0%) | 0 (0.0%) |
| 20 to 24 Year Olds | 224 (100.0%) | 0 (0.0%) |
| 25 to 34 Year Olds | 126 (100.0%) | 0 (0.0%) |
| 35 Years and over | 75 (68.8%) | 34 (31.2%) |
| Total | 2,533 (81.0%) | 594 (19.0%) |
Educational Attainment by Field of Study in Picayune
Education (339 | 26.7%), business (172 | 13.6%), social sciences (138 | 10.9%), science & technology (135 | 10.6%), and psychology (75 | 5.9%) are the most common fields of study among 1,268 individuals in Picayune who have obtained a bachelor's degree or higher.
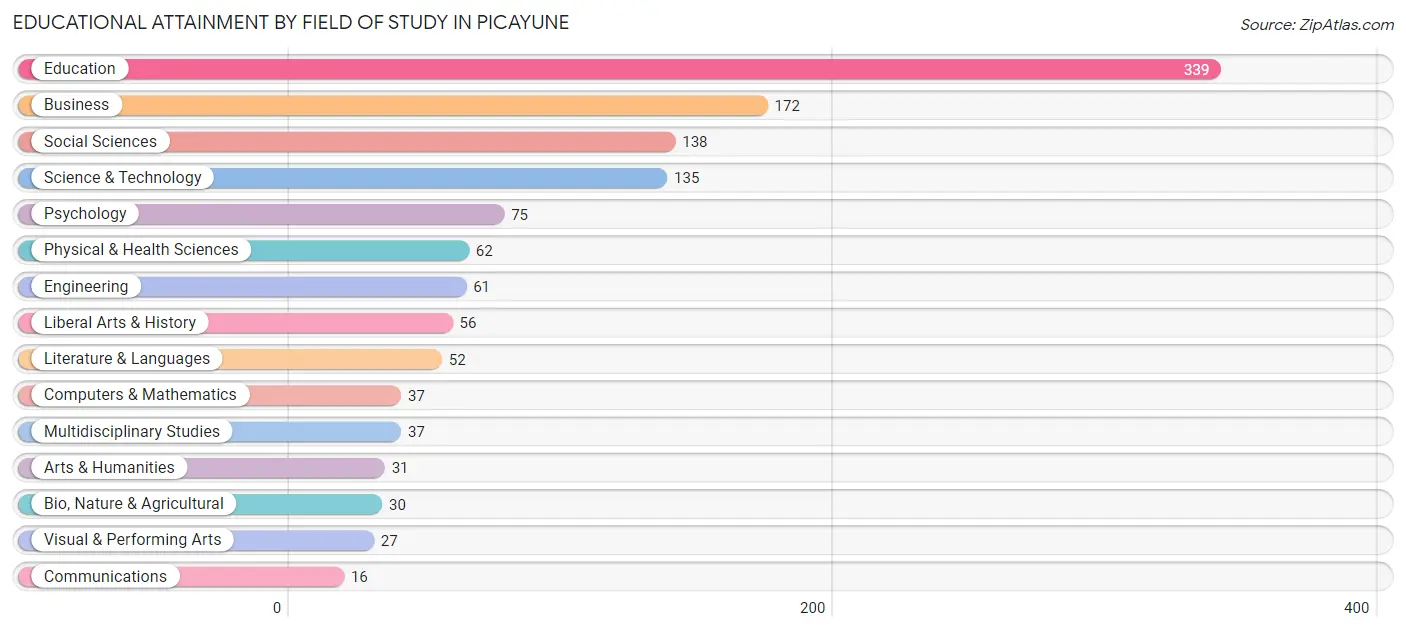
| Field of Study | # Graduates | % Graduates |
| Computers & Mathematics | 37 | 2.9% |
| Bio, Nature & Agricultural | 30 | 2.4% |
| Physical & Health Sciences | 62 | 4.9% |
| Psychology | 75 | 5.9% |
| Social Sciences | 138 | 10.9% |
| Engineering | 61 | 4.8% |
| Multidisciplinary Studies | 37 | 2.9% |
| Science & Technology | 135 | 10.6% |
| Business | 172 | 13.6% |
| Education | 339 | 26.7% |
| Literature & Languages | 52 | 4.1% |
| Liberal Arts & History | 56 | 4.4% |
| Visual & Performing Arts | 27 | 2.1% |
| Communications | 16 | 1.3% |
| Arts & Humanities | 31 | 2.4% |
| Total | 1,268 | 100.0% |
Transportation & Commute in Picayune
Vehicle Availability by Sex in Picayune
The most prevalent vehicle ownership categories in Picayune are males with 2 vehicles (914, accounting for 41.7%) and females with 2 vehicles (930, making up 39.3%).
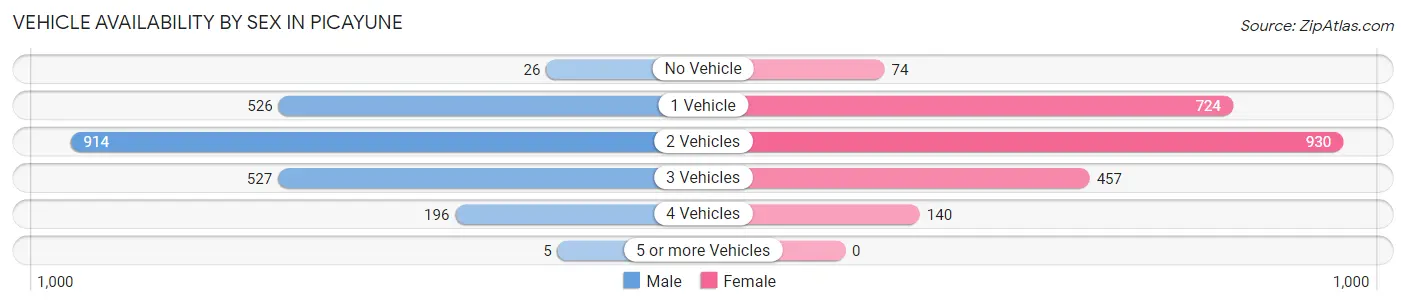
| Vehicles Available | Male | Female |
| No Vehicle | 26 (1.2%) | 74 (3.2%) |
| 1 Vehicle | 526 (24.0%) | 724 (31.1%) |
| 2 Vehicles | 914 (41.7%) | 930 (40.0%) |
| 3 Vehicles | 527 (24.0%) | 457 (19.7%) |
| 4 Vehicles | 196 (8.9%) | 140 (6.0%) |
| 5 or more Vehicles | 5 (0.2%) | 0 (0.0%) |
| Total | 2,194 (100.0%) | 2,325 (100.0%) |
Commute Time in Picayune
The most frequently occuring commute durations in Picayune are 5 to 9 minutes (745 commuters, 17.1%), 60 to 89 minutes (699 commuters, 16.0%), and 10 to 14 minutes (595 commuters, 13.6%).
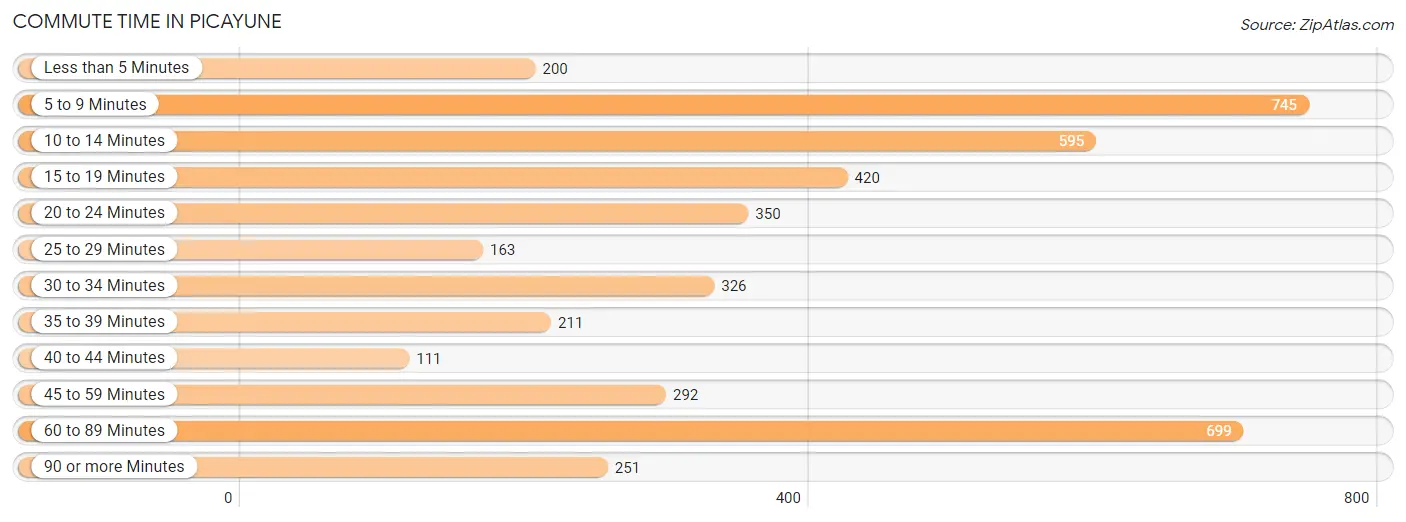
| Commute Time | # Commuters | % Commuters |
| Less than 5 Minutes | 200 | 4.6% |
| 5 to 9 Minutes | 745 | 17.1% |
| 10 to 14 Minutes | 595 | 13.6% |
| 15 to 19 Minutes | 420 | 9.6% |
| 20 to 24 Minutes | 350 | 8.0% |
| 25 to 29 Minutes | 163 | 3.7% |
| 30 to 34 Minutes | 326 | 7.5% |
| 35 to 39 Minutes | 211 | 4.8% |
| 40 to 44 Minutes | 111 | 2.5% |
| 45 to 59 Minutes | 292 | 6.7% |
| 60 to 89 Minutes | 699 | 16.0% |
| 90 or more Minutes | 251 | 5.8% |
Commute Time by Sex in Picayune
The most common commute times in Picayune are 60 to 89 minutes (461 commuters, 21.4%) for males and 5 to 9 minutes (503 commuters, 22.8%) for females.
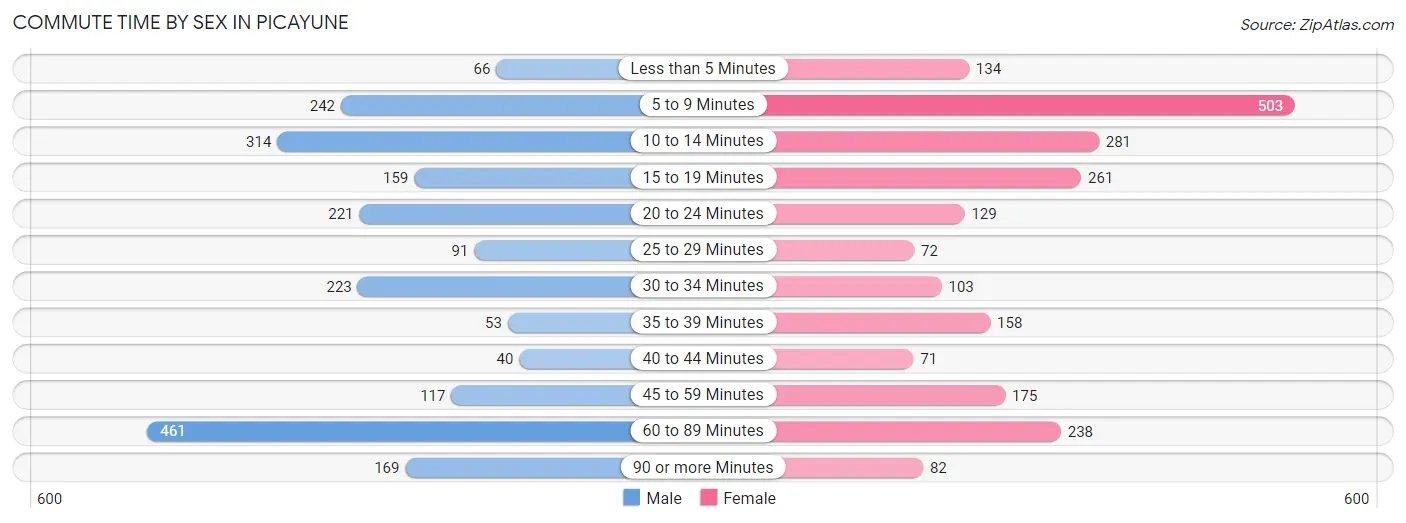
| Commute Time | Male | Female |
| Less than 5 Minutes | 66 (3.1%) | 134 (6.1%) |
| 5 to 9 Minutes | 242 (11.2%) | 503 (22.8%) |
| 10 to 14 Minutes | 314 (14.6%) | 281 (12.7%) |
| 15 to 19 Minutes | 159 (7.4%) | 261 (11.8%) |
| 20 to 24 Minutes | 221 (10.2%) | 129 (5.9%) |
| 25 to 29 Minutes | 91 (4.2%) | 72 (3.3%) |
| 30 to 34 Minutes | 223 (10.3%) | 103 (4.7%) |
| 35 to 39 Minutes | 53 (2.5%) | 158 (7.2%) |
| 40 to 44 Minutes | 40 (1.9%) | 71 (3.2%) |
| 45 to 59 Minutes | 117 (5.4%) | 175 (7.9%) |
| 60 to 89 Minutes | 461 (21.4%) | 238 (10.8%) |
| 90 or more Minutes | 169 (7.8%) | 82 (3.7%) |
Time of Departure to Work by Sex in Picayune
The most frequent times of departure to work in Picayune are 12:00 AM to 4:59 AM (429, 19.9%) for males and 8:00 AM to 8:29 AM (360, 16.3%) for females.
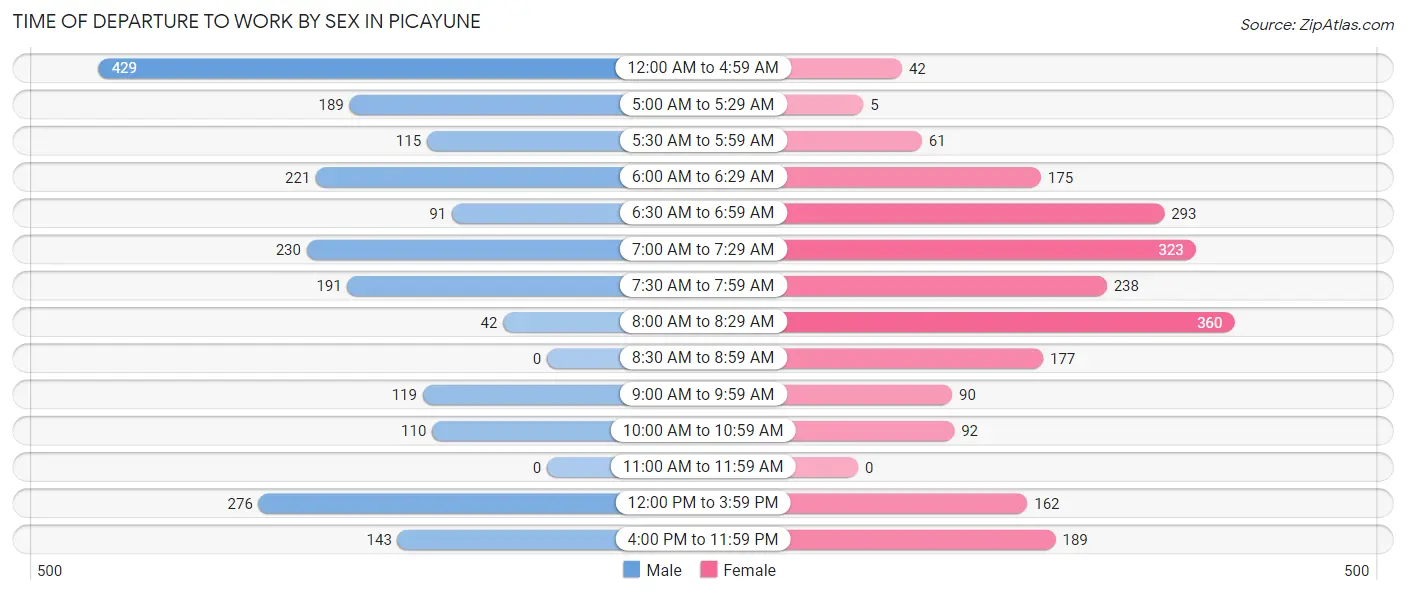
| Time of Departure | Male | Female |
| 12:00 AM to 4:59 AM | 429 (19.9%) | 42 (1.9%) |
| 5:00 AM to 5:29 AM | 189 (8.8%) | 5 (0.2%) |
| 5:30 AM to 5:59 AM | 115 (5.3%) | 61 (2.8%) |
| 6:00 AM to 6:29 AM | 221 (10.2%) | 175 (7.9%) |
| 6:30 AM to 6:59 AM | 91 (4.2%) | 293 (13.3%) |
| 7:00 AM to 7:29 AM | 230 (10.7%) | 323 (14.6%) |
| 7:30 AM to 7:59 AM | 191 (8.9%) | 238 (10.8%) |
| 8:00 AM to 8:29 AM | 42 (1.9%) | 360 (16.3%) |
| 8:30 AM to 8:59 AM | 0 (0.0%) | 177 (8.0%) |
| 9:00 AM to 9:59 AM | 119 (5.5%) | 90 (4.1%) |
| 10:00 AM to 10:59 AM | 110 (5.1%) | 92 (4.2%) |
| 11:00 AM to 11:59 AM | 0 (0.0%) | 0 (0.0%) |
| 12:00 PM to 3:59 PM | 276 (12.8%) | 162 (7.3%) |
| 4:00 PM to 11:59 PM | 143 (6.6%) | 189 (8.6%) |
| Total | 2,156 (100.0%) | 2,207 (100.0%) |
Housing Occupancy in Picayune
Occupancy by Ownership in Picayune
Of the total 4,403 dwellings in Picayune, owner-occupied units account for 2,495 (56.7%), while renter-occupied units make up 1,908 (43.3%).
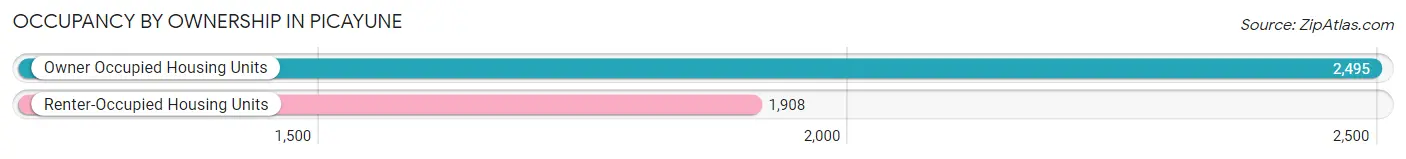
| Occupancy | # Housing Units | % Housing Units |
| Owner Occupied Housing Units | 2,495 | 56.7% |
| Renter-Occupied Housing Units | 1,908 | 43.3% |
| Total Occupied Housing Units | 4,403 | 100.0% |
Occupancy by Household Size in Picayune
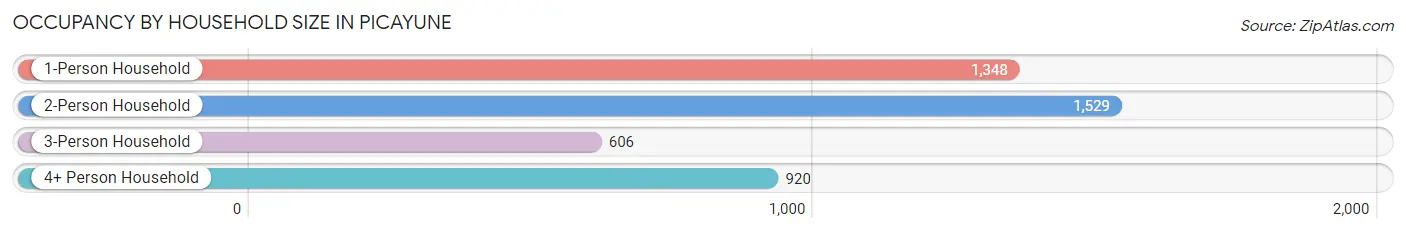
| Household Size | # Housing Units | % Housing Units |
| 1-Person Household | 1,348 | 30.6% |
| 2-Person Household | 1,529 | 34.7% |
| 3-Person Household | 606 | 13.8% |
| 4+ Person Household | 920 | 20.9% |
| Total Housing Units | 4,403 | 100.0% |
Occupancy by Ownership by Household Size in Picayune
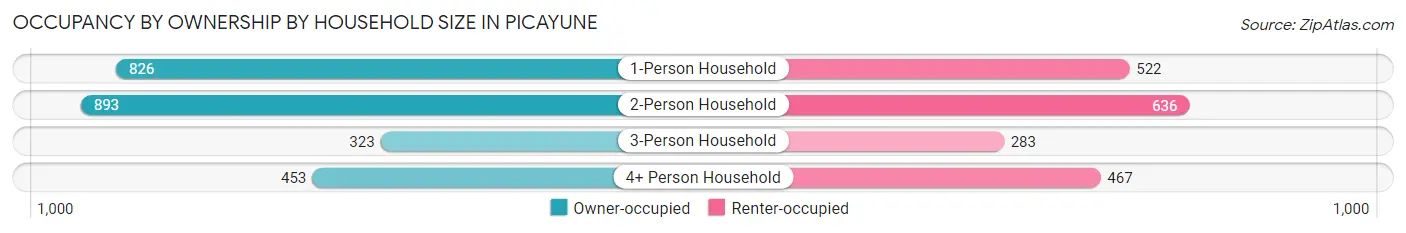
| Household Size | Owner-occupied | Renter-occupied |
| 1-Person Household | 826 (61.3%) | 522 (38.7%) |
| 2-Person Household | 893 (58.4%) | 636 (41.6%) |
| 3-Person Household | 323 (53.3%) | 283 (46.7%) |
| 4+ Person Household | 453 (49.2%) | 467 (50.8%) |
| Total Housing Units | 2,495 (56.7%) | 1,908 (43.3%) |
Occupancy by Educational Attainment in Picayune
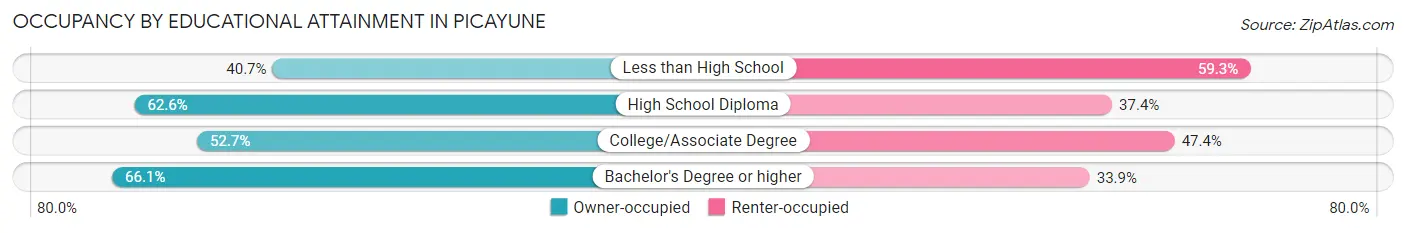
| Household Size | Owner-occupied | Renter-occupied |
| Less than High School | 256 (40.7%) | 373 (59.3%) |
| High School Diploma | 931 (62.6%) | 557 (37.4%) |
| College/Associate Degree | 795 (52.6%) | 715 (47.3%) |
| Bachelor's Degree or higher | 513 (66.1%) | 263 (33.9%) |
Occupancy by Age of Householder in Picayune
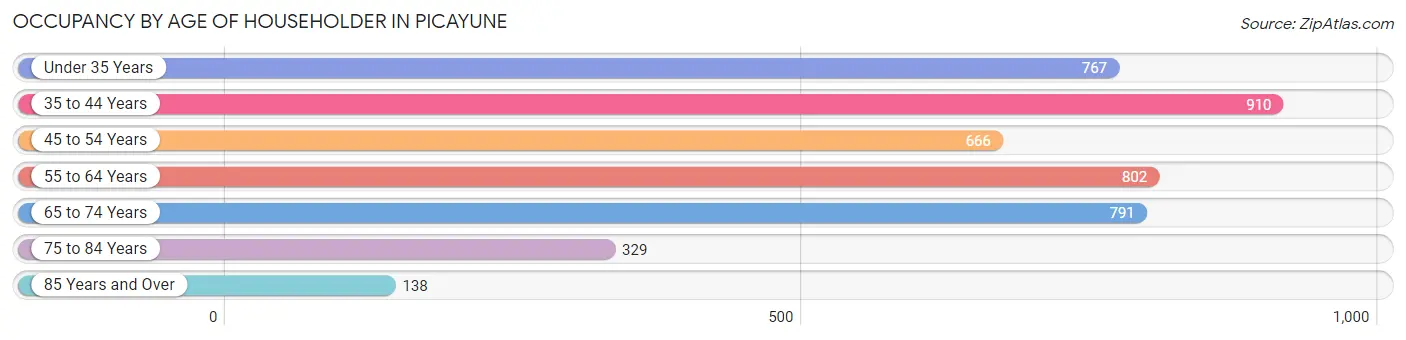
| Age Bracket | # Households | % Households |
| Under 35 Years | 767 | 17.4% |
| 35 to 44 Years | 910 | 20.7% |
| 45 to 54 Years | 666 | 15.1% |
| 55 to 64 Years | 802 | 18.2% |
| 65 to 74 Years | 791 | 18.0% |
| 75 to 84 Years | 329 | 7.5% |
| 85 Years and Over | 138 | 3.1% |
| Total | 4,403 | 100.0% |
Housing Finances in Picayune
Median Income by Occupancy in Picayune
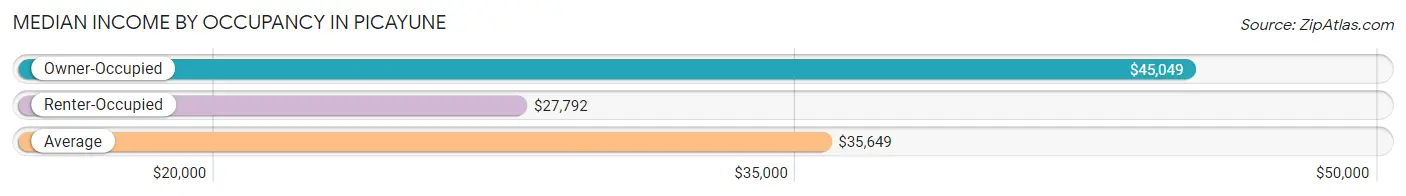
| Occupancy Type | # Households | Median Income |
| Owner-Occupied | 2,495 (56.7%) | $45,049 |
| Renter-Occupied | 1,908 (43.3%) | $27,792 |
| Average | 4,403 (100.0%) | $35,649 |
Occupancy by Householder Income Bracket in Picayune
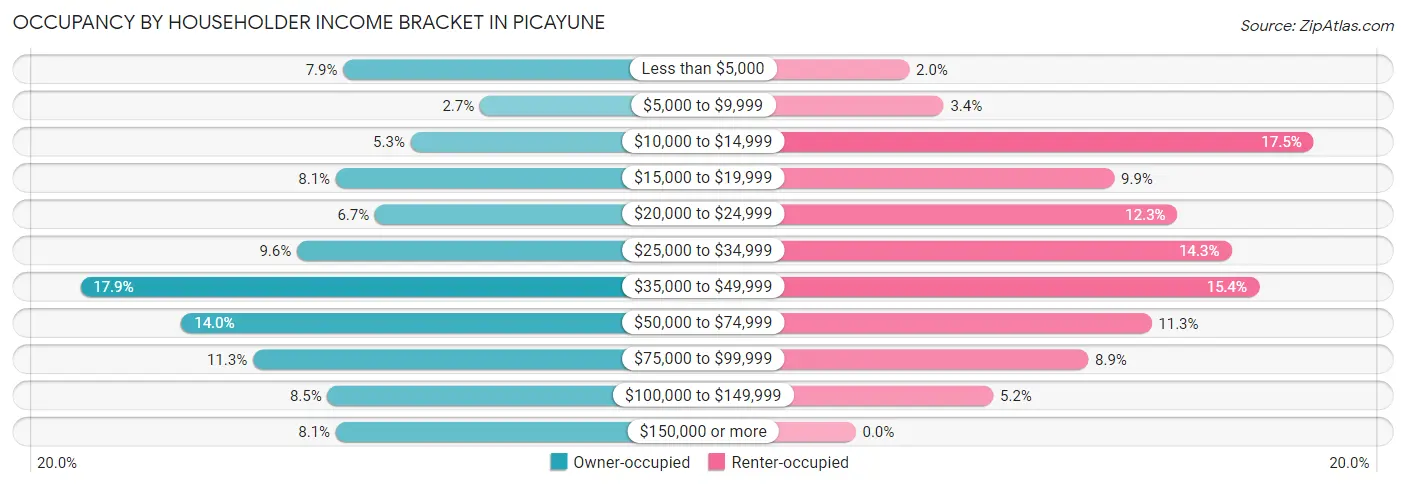
| Income Bracket | Owner-occupied | Renter-occupied |
| Less than $5,000 | 196 (7.9%) | 39 (2.0%) |
| $5,000 to $9,999 | 66 (2.6%) | 64 (3.4%) |
| $10,000 to $14,999 | 132 (5.3%) | 333 (17.4%) |
| $15,000 to $19,999 | 203 (8.1%) | 188 (9.9%) |
| $20,000 to $24,999 | 166 (6.7%) | 234 (12.3%) |
| $25,000 to $34,999 | 240 (9.6%) | 273 (14.3%) |
| $35,000 to $49,999 | 446 (17.9%) | 293 (15.4%) |
| $50,000 to $74,999 | 350 (14.0%) | 215 (11.3%) |
| $75,000 to $99,999 | 282 (11.3%) | 169 (8.9%) |
| $100,000 to $149,999 | 211 (8.5%) | 100 (5.2%) |
| $150,000 or more | 203 (8.1%) | 0 (0.0%) |
| Total | 2,495 (100.0%) | 1,908 (100.0%) |
Monthly Housing Cost Tiers in Picayune
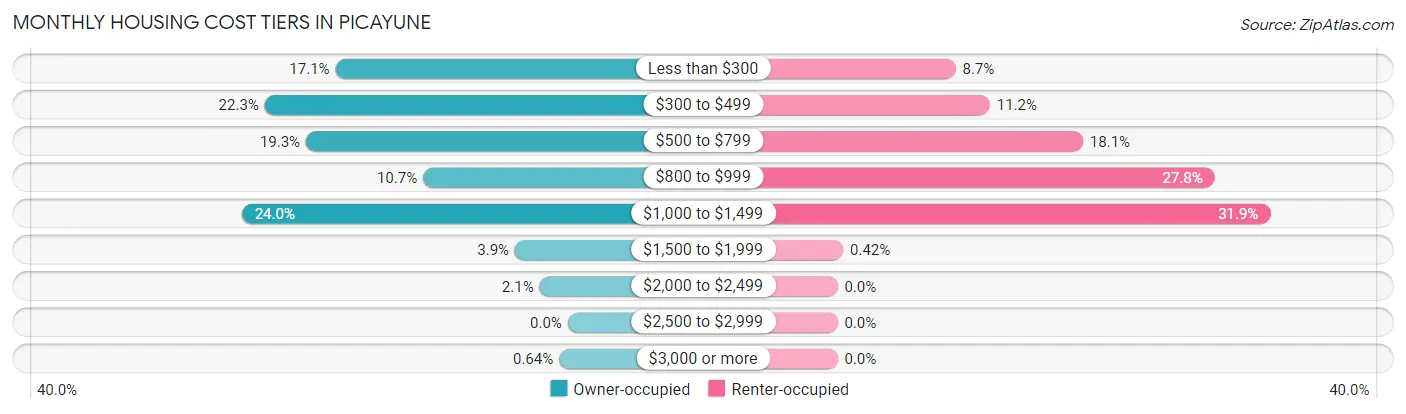
| Monthly Cost | Owner-occupied | Renter-occupied |
| Less than $300 | 427 (17.1%) | 166 (8.7%) |
| $300 to $499 | 557 (22.3%) | 214 (11.2%) |
| $500 to $799 | 481 (19.3%) | 345 (18.1%) |
| $800 to $999 | 266 (10.7%) | 530 (27.8%) |
| $1,000 to $1,499 | 599 (24.0%) | 608 (31.9%) |
| $1,500 to $1,999 | 97 (3.9%) | 8 (0.4%) |
| $2,000 to $2,499 | 52 (2.1%) | 0 (0.0%) |
| $2,500 to $2,999 | 0 (0.0%) | 0 (0.0%) |
| $3,000 or more | 16 (0.6%) | 0 (0.0%) |
| Total | 2,495 (100.0%) | 1,908 (100.0%) |
Physical Housing Characteristics in Picayune
Housing Structures in Picayune
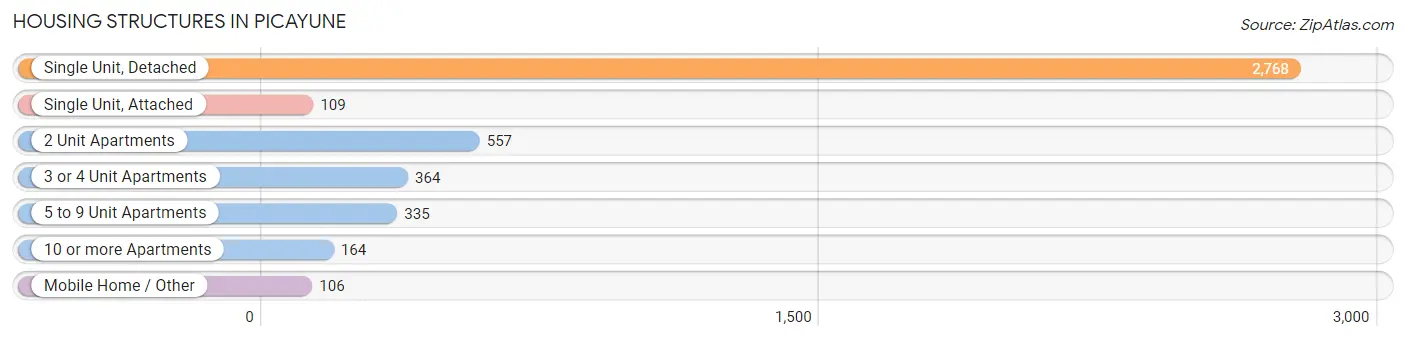
| Structure Type | # Housing Units | % Housing Units |
| Single Unit, Detached | 2,768 | 62.9% |
| Single Unit, Attached | 109 | 2.5% |
| 2 Unit Apartments | 557 | 12.7% |
| 3 or 4 Unit Apartments | 364 | 8.3% |
| 5 to 9 Unit Apartments | 335 | 7.6% |
| 10 or more Apartments | 164 | 3.7% |
| Mobile Home / Other | 106 | 2.4% |
| Total | 4,403 | 100.0% |
Housing Structures by Occupancy in Picayune
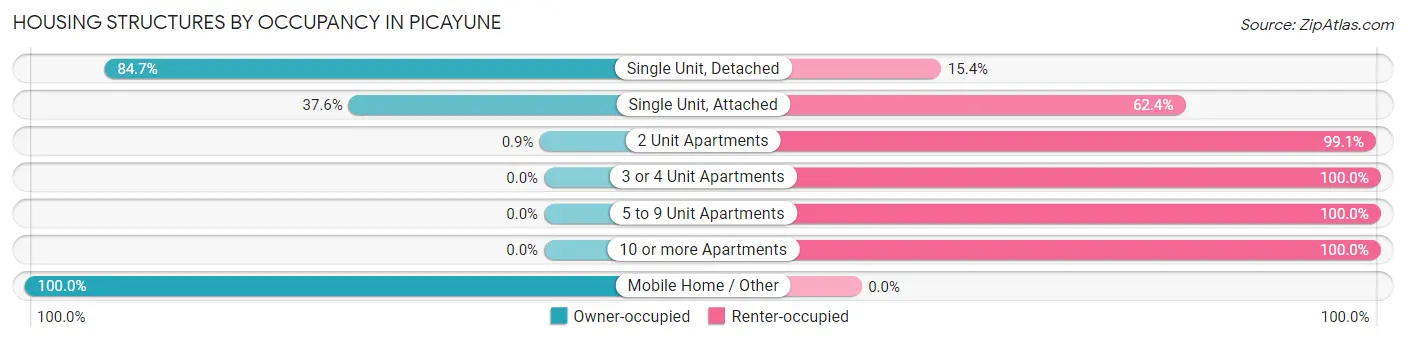
| Structure Type | Owner-occupied | Renter-occupied |
| Single Unit, Detached | 2,343 (84.7%) | 425 (15.3%) |
| Single Unit, Attached | 41 (37.6%) | 68 (62.4%) |
| 2 Unit Apartments | 5 (0.9%) | 552 (99.1%) |
| 3 or 4 Unit Apartments | 0 (0.0%) | 364 (100.0%) |
| 5 to 9 Unit Apartments | 0 (0.0%) | 335 (100.0%) |
| 10 or more Apartments | 0 (0.0%) | 164 (100.0%) |
| Mobile Home / Other | 106 (100.0%) | 0 (0.0%) |
| Total | 2,495 (56.7%) | 1,908 (43.3%) |
Housing Structures by Number of Rooms in Picayune
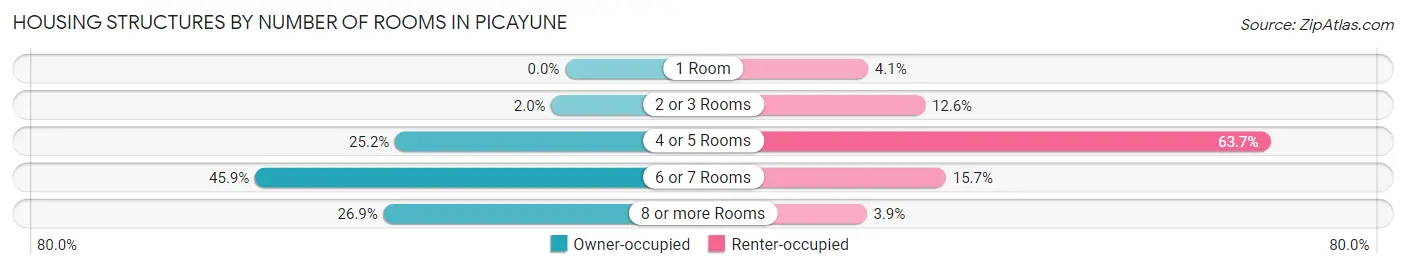
| Number of Rooms | Owner-occupied | Renter-occupied |
| 1 Room | 0 (0.0%) | 79 (4.1%) |
| 2 or 3 Rooms | 51 (2.0%) | 240 (12.6%) |
| 4 or 5 Rooms | 628 (25.2%) | 1,215 (63.7%) |
| 6 or 7 Rooms | 1,145 (45.9%) | 299 (15.7%) |
| 8 or more Rooms | 671 (26.9%) | 75 (3.9%) |
| Total | 2,495 (100.0%) | 1,908 (100.0%) |
Housing Structure by Heating Type in Picayune
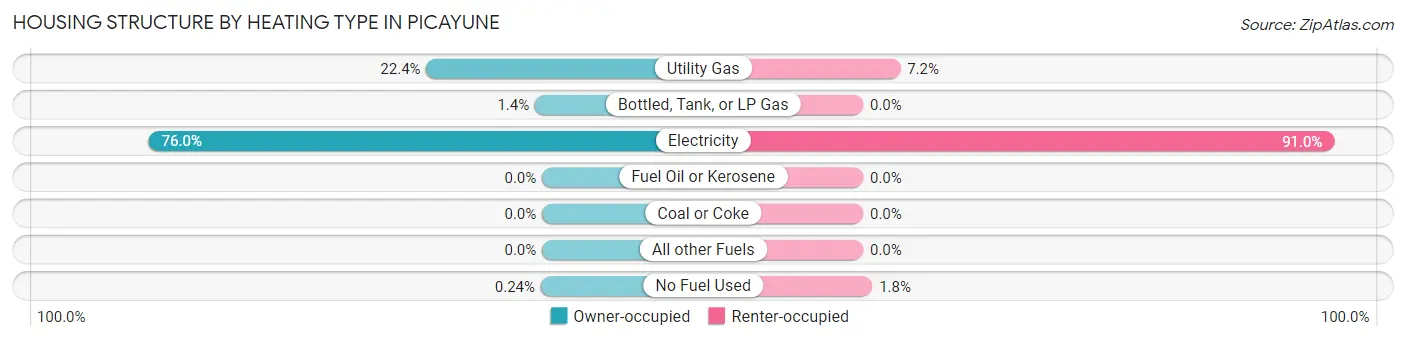
| Heating Type | Owner-occupied | Renter-occupied |
| Utility Gas | 558 (22.4%) | 137 (7.2%) |
| Bottled, Tank, or LP Gas | 34 (1.4%) | 0 (0.0%) |
| Electricity | 1,897 (76.0%) | 1,737 (91.0%) |
| Fuel Oil or Kerosene | 0 (0.0%) | 0 (0.0%) |
| Coal or Coke | 0 (0.0%) | 0 (0.0%) |
| All other Fuels | 0 (0.0%) | 0 (0.0%) |
| No Fuel Used | 6 (0.2%) | 34 (1.8%) |
| Total | 2,495 (100.0%) | 1,908 (100.0%) |
Household Vehicle Usage in Picayune
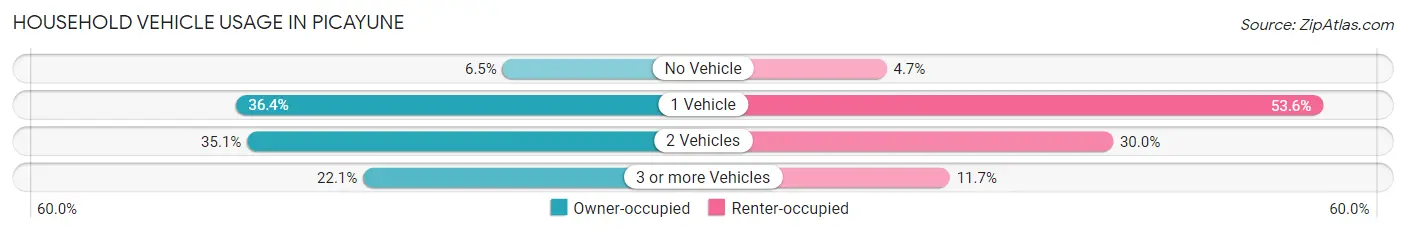
| Vehicles per Household | Owner-occupied | Renter-occupied |
| No Vehicle | 161 (6.5%) | 89 (4.7%) |
| 1 Vehicle | 908 (36.4%) | 1,022 (53.6%) |
| 2 Vehicles | 875 (35.1%) | 573 (30.0%) |
| 3 or more Vehicles | 551 (22.1%) | 224 (11.7%) |
| Total | 2,495 (100.0%) | 1,908 (100.0%) |
Real Estate & Mortgages in Picayune
Real Estate and Mortgage Overview in Picayune
| Characteristic | Without Mortgage | With Mortgage |
| Housing Units | 1,438 | 1,057 |
| Median Property Value | $125,600 | $144,000 |
| Median Household Income | $32,455 | $106 |
| Monthly Housing Costs | $373 | $16 |
| Real Estate Taxes | $938 | $160 |
Property Value by Mortgage Status in Picayune
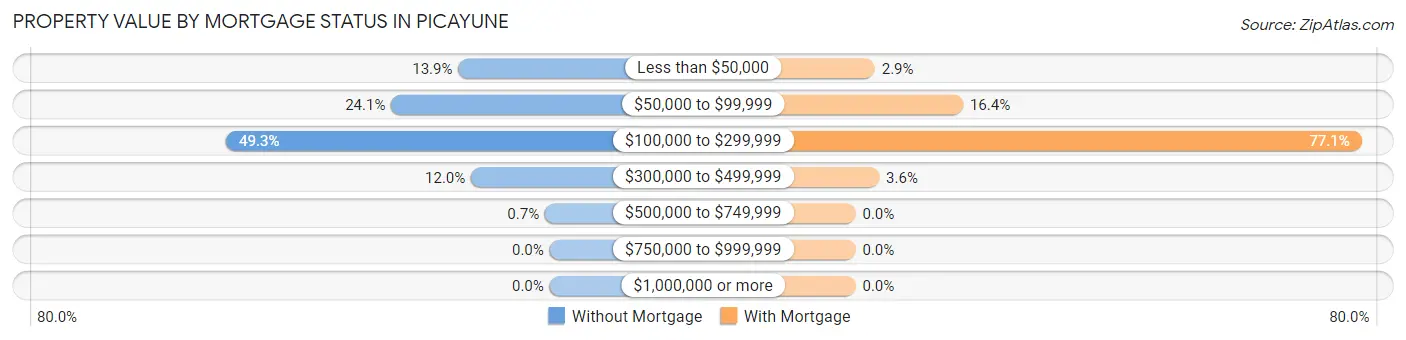
| Property Value | Without Mortgage | With Mortgage |
| Less than $50,000 | 200 (13.9%) | 31 (2.9%) |
| $50,000 to $99,999 | 347 (24.1%) | 173 (16.4%) |
| $100,000 to $299,999 | 709 (49.3%) | 815 (77.1%) |
| $300,000 to $499,999 | 172 (12.0%) | 38 (3.6%) |
| $500,000 to $749,999 | 10 (0.7%) | 0 (0.0%) |
| $750,000 to $999,999 | 0 (0.0%) | 0 (0.0%) |
| $1,000,000 or more | 0 (0.0%) | 0 (0.0%) |
| Total | 1,438 (100.0%) | 1,057 (100.0%) |
Household Income by Mortgage Status in Picayune
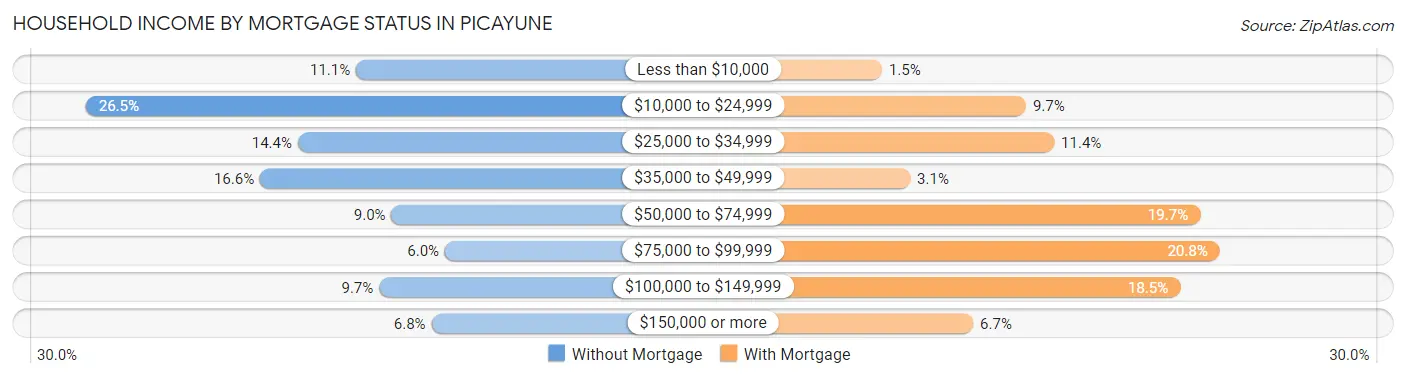
| Household Income | Without Mortgage | With Mortgage |
| Less than $10,000 | 159 (11.1%) | 16 (1.5%) |
| $10,000 to $24,999 | 381 (26.5%) | 103 (9.7%) |
| $25,000 to $34,999 | 207 (14.4%) | 120 (11.4%) |
| $35,000 to $49,999 | 238 (16.6%) | 33 (3.1%) |
| $50,000 to $74,999 | 130 (9.0%) | 208 (19.7%) |
| $75,000 to $99,999 | 86 (6.0%) | 220 (20.8%) |
| $100,000 to $149,999 | 140 (9.7%) | 196 (18.5%) |
| $150,000 or more | 97 (6.8%) | 71 (6.7%) |
| Total | 1,438 (100.0%) | 1,057 (100.0%) |
Property Value to Household Income Ratio in Picayune
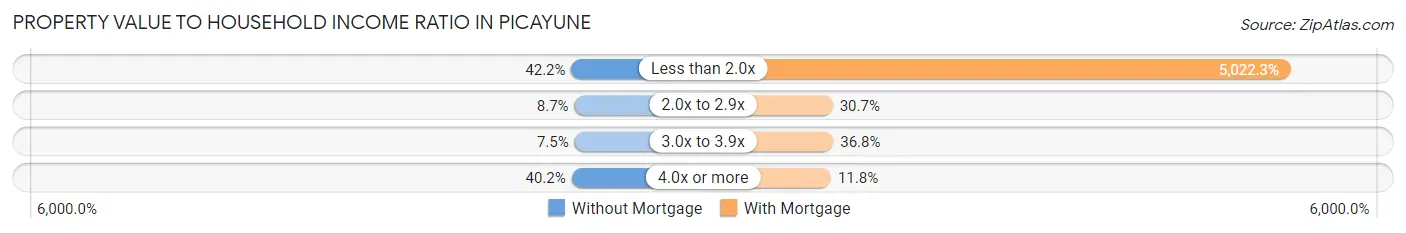
| Value-to-Income Ratio | Without Mortgage | With Mortgage |
| Less than 2.0x | 607 (42.2%) | 53,086 (5,022.3%) |
| 2.0x to 2.9x | 125 (8.7%) | 324 (30.6%) |
| 3.0x to 3.9x | 108 (7.5%) | 389 (36.8%) |
| 4.0x or more | 578 (40.2%) | 125 (11.8%) |
| Total | 1,438 (100.0%) | 1,057 (100.0%) |
Real Estate Taxes by Mortgage Status in Picayune
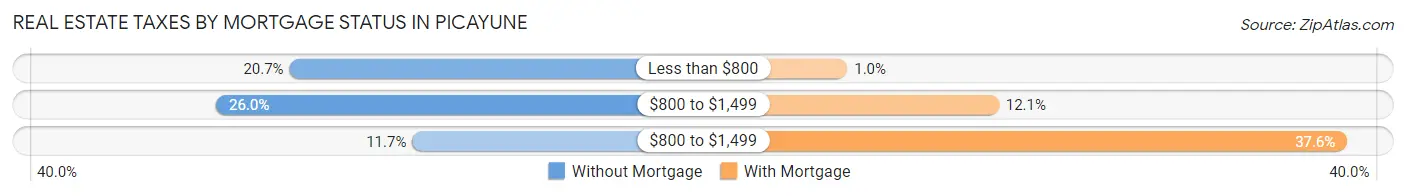
| Property Taxes | Without Mortgage | With Mortgage |
| Less than $800 | 297 (20.6%) | 11 (1.0%) |
| $800 to $1,499 | 374 (26.0%) | 128 (12.1%) |
| $800 to $1,499 | 168 (11.7%) | 397 (37.6%) |
| Total | 1,438 (100.0%) | 1,057 (100.0%) |
Health & Disability in Picayune
Health Insurance Coverage by Age in Picayune
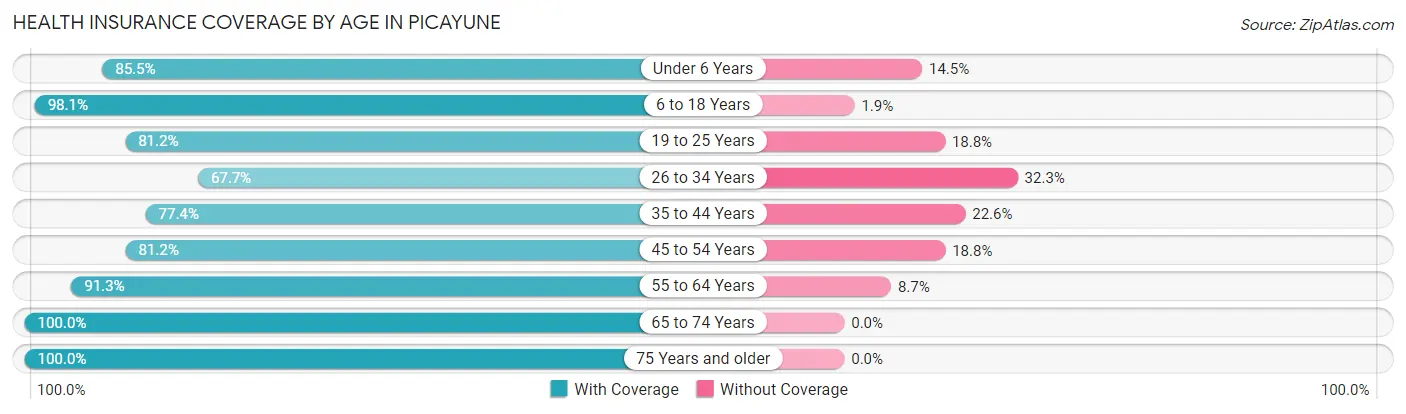
| Age Bracket | With Coverage | Without Coverage |
| Under 6 Years | 696 (85.5%) | 118 (14.5%) |
| 6 to 18 Years | 2,425 (98.1%) | 47 (1.9%) |
| 19 to 25 Years | 740 (81.2%) | 171 (18.8%) |
| 26 to 34 Years | 835 (67.7%) | 399 (32.3%) |
| 35 to 44 Years | 1,273 (77.4%) | 371 (22.6%) |
| 45 to 54 Years | 1,031 (81.2%) | 239 (18.8%) |
| 55 to 64 Years | 1,258 (91.3%) | 120 (8.7%) |
| 65 to 74 Years | 1,208 (100.0%) | 0 (0.0%) |
| 75 Years and older | 715 (100.0%) | 0 (0.0%) |
| Total | 10,181 (87.4%) | 1,465 (12.6%) |
Health Insurance Coverage by Citizenship Status in Picayune
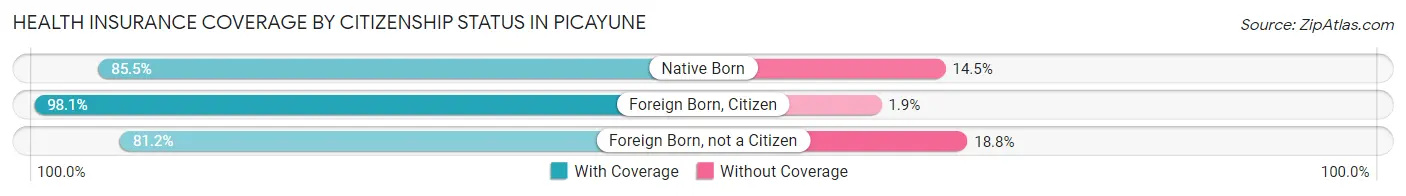
| Citizenship Status | With Coverage | Without Coverage |
| Native Born | 696 (85.5%) | 118 (14.5%) |
| Foreign Born, Citizen | 2,425 (98.1%) | 47 (1.9%) |
| Foreign Born, not a Citizen | 740 (81.2%) | 171 (18.8%) |
Health Insurance Coverage by Household Income in Picayune
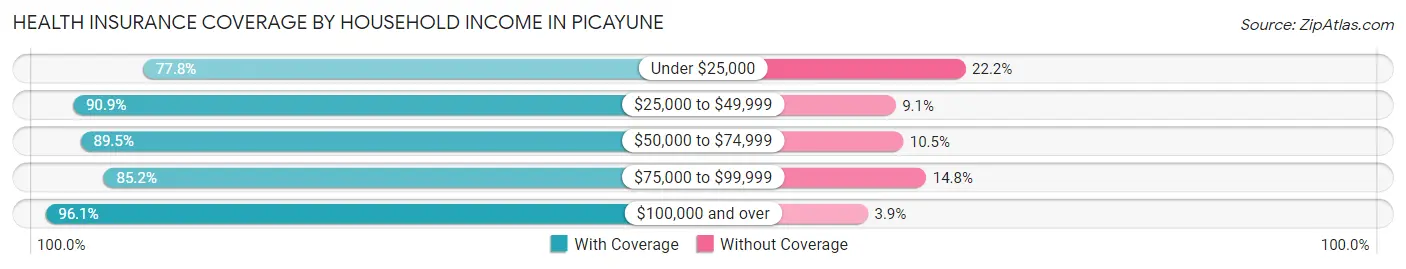
| Household Income | With Coverage | Without Coverage |
| Under $25,000 | 2,391 (77.8%) | 681 (22.2%) |
| $25,000 to $49,999 | 2,757 (90.9%) | 275 (9.1%) |
| $50,000 to $74,999 | 1,809 (89.5%) | 212 (10.5%) |
| $75,000 to $99,999 | 1,255 (85.2%) | 218 (14.8%) |
| $100,000 and over | 1,957 (96.1%) | 79 (3.9%) |
Public vs Private Health Insurance Coverage by Age in Picayune
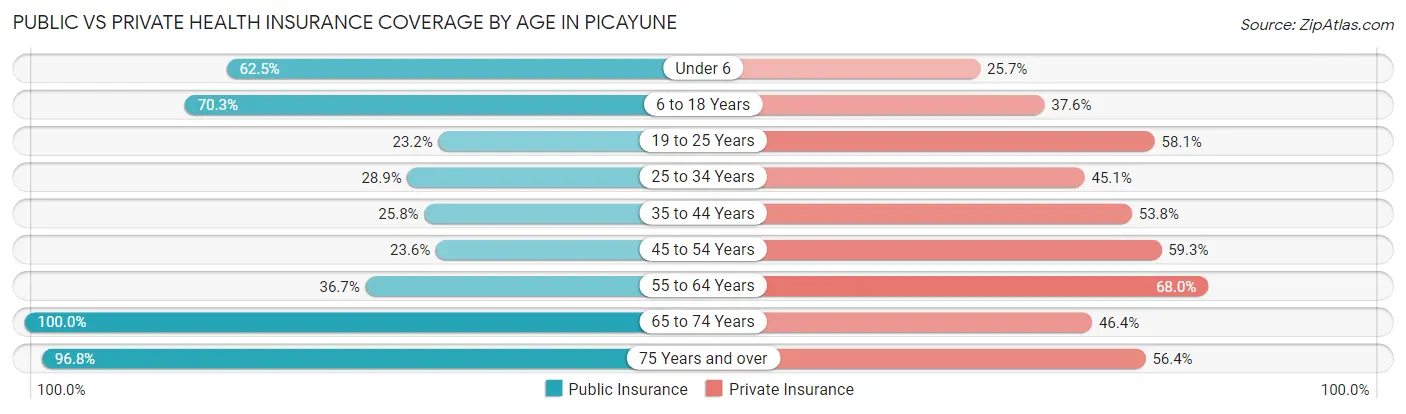
| Age Bracket | Public Insurance | Private Insurance |
| Under 6 | 509 (62.5%) | 209 (25.7%) |
| 6 to 18 Years | 1,737 (70.3%) | 929 (37.6%) |
| 19 to 25 Years | 211 (23.2%) | 529 (58.1%) |
| 25 to 34 Years | 357 (28.9%) | 556 (45.1%) |
| 35 to 44 Years | 424 (25.8%) | 885 (53.8%) |
| 45 to 54 Years | 300 (23.6%) | 753 (59.3%) |
| 55 to 64 Years | 506 (36.7%) | 937 (68.0%) |
| 65 to 74 Years | 1,208 (100.0%) | 561 (46.4%) |
| 75 Years and over | 692 (96.8%) | 403 (56.4%) |
| Total | 5,944 (51.0%) | 5,762 (49.5%) |
Disability Status by Sex by Age in Picayune
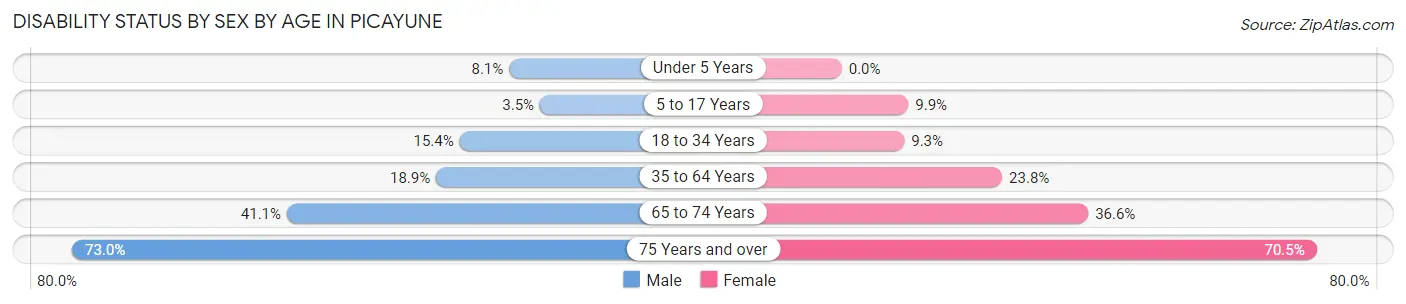
| Age Bracket | Male | Female |
| Under 5 Years | 40 (8.1%) | 0 (0.0%) |
| 5 to 17 Years | 34 (3.5%) | 136 (9.9%) |
| 18 to 34 Years | 169 (15.4%) | 116 (9.3%) |
| 35 to 64 Years | 358 (18.9%) | 571 (23.8%) |
| 65 to 74 Years | 202 (41.1%) | 262 (36.6%) |
| 75 Years and over | 267 (73.0%) | 246 (70.5%) |
Disability Class by Sex by Age in Picayune
Disability Class: Hearing Difficulty
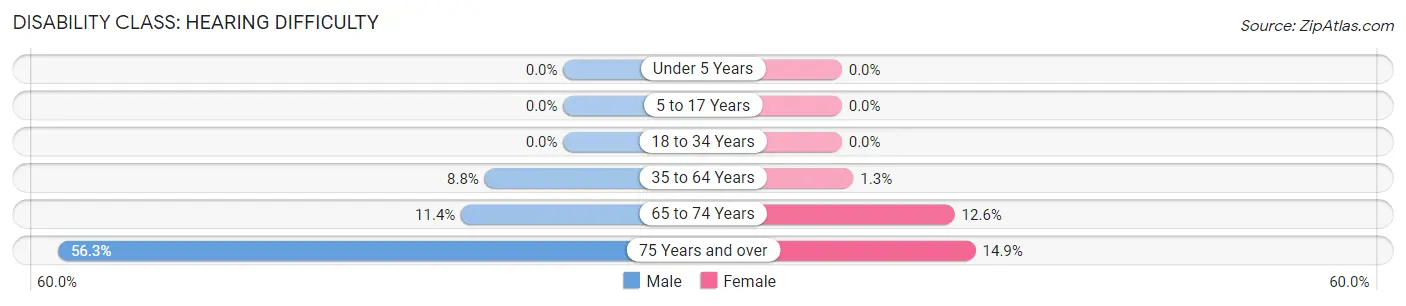
| Age Bracket | Male | Female |
| Under 5 Years | 0 (0.0%) | 0 (0.0%) |
| 5 to 17 Years | 0 (0.0%) | 0 (0.0%) |
| 18 to 34 Years | 0 (0.0%) | 0 (0.0%) |
| 35 to 64 Years | 166 (8.8%) | 31 (1.3%) |
| 65 to 74 Years | 56 (11.4%) | 90 (12.6%) |
| 75 Years and over | 206 (56.3%) | 52 (14.9%) |
Disability Class: Vision Difficulty
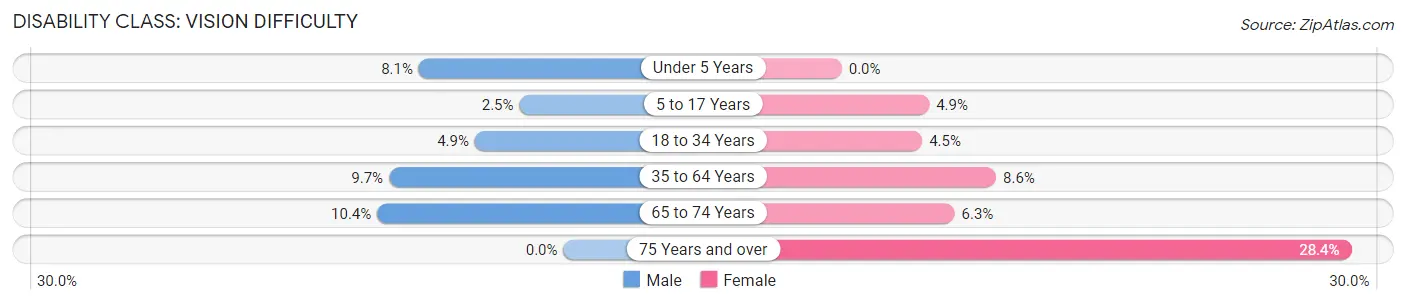
| Age Bracket | Male | Female |
| Under 5 Years | 40 (8.1%) | 0 (0.0%) |
| 5 to 17 Years | 24 (2.5%) | 67 (4.9%) |
| 18 to 34 Years | 54 (4.9%) | 56 (4.5%) |
| 35 to 64 Years | 184 (9.7%) | 206 (8.6%) |
| 65 to 74 Years | 51 (10.4%) | 45 (6.3%) |
| 75 Years and over | 0 (0.0%) | 99 (28.4%) |
Disability Class: Cognitive Difficulty
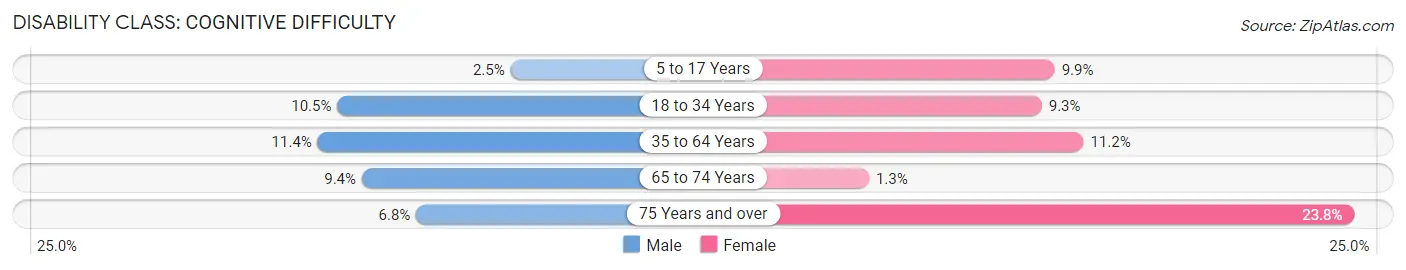
| Age Bracket | Male | Female |
| 5 to 17 Years | 24 (2.5%) | 136 (9.9%) |
| 18 to 34 Years | 115 (10.5%) | 116 (9.3%) |
| 35 to 64 Years | 216 (11.4%) | 269 (11.2%) |
| 65 to 74 Years | 46 (9.3%) | 9 (1.3%) |
| 75 Years and over | 25 (6.8%) | 83 (23.8%) |
Disability Class: Ambulatory Difficulty
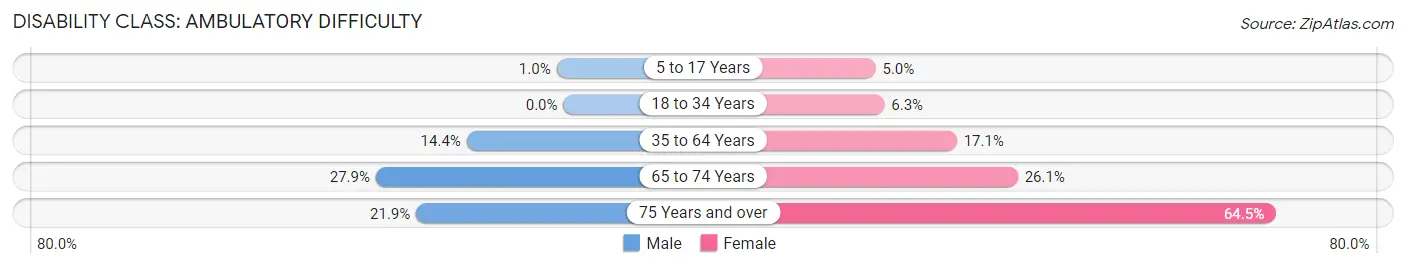
| Age Bracket | Male | Female |
| 5 to 17 Years | 10 (1.0%) | 69 (5.0%) |
| 18 to 34 Years | 0 (0.0%) | 79 (6.3%) |
| 35 to 64 Years | 272 (14.4%) | 409 (17.1%) |
| 65 to 74 Years | 137 (27.9%) | 187 (26.1%) |
| 75 Years and over | 80 (21.9%) | 225 (64.5%) |
Disability Class: Self-Care Difficulty
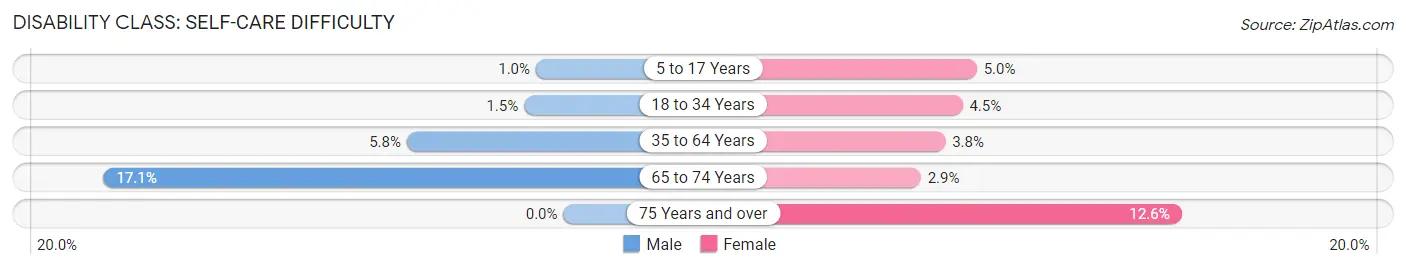
| Age Bracket | Male | Female |
| 5 to 17 Years | 10 (1.0%) | 69 (5.0%) |
| 18 to 34 Years | 16 (1.5%) | 56 (4.5%) |
| 35 to 64 Years | 110 (5.8%) | 92 (3.8%) |
| 65 to 74 Years | 84 (17.1%) | 21 (2.9%) |
| 75 Years and over | 0 (0.0%) | 44 (12.6%) |
Technology Access in Picayune
Computing Device Access in Picayune
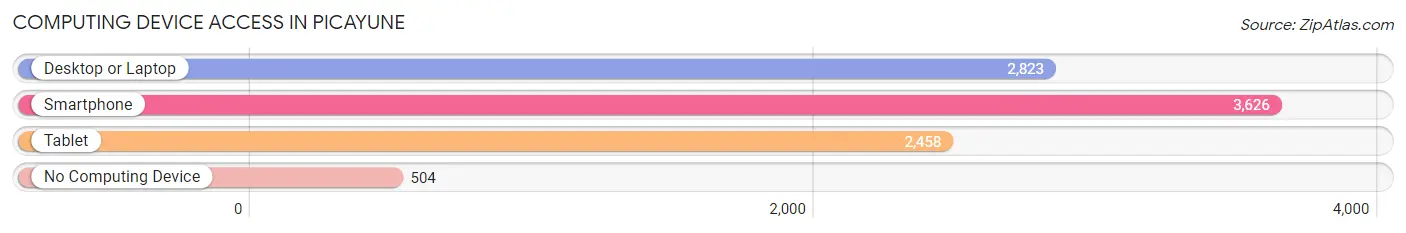
| Device Type | # Households | % Households |
| Desktop or Laptop | 2,823 | 64.1% |
| Smartphone | 3,626 | 82.4% |
| Tablet | 2,458 | 55.8% |
| No Computing Device | 504 | 11.5% |
| Total | 4,403 | 100.0% |
Internet Access in Picayune
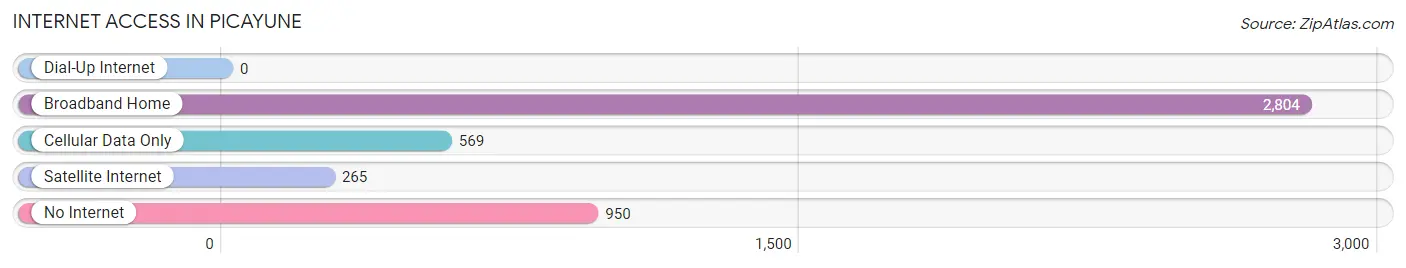
| Internet Type | # Households | % Households |
| Dial-Up Internet | 0 | 0.0% |
| Broadband Home | 2,804 | 63.7% |
| Cellular Data Only | 569 | 12.9% |
| Satellite Internet | 265 | 6.0% |
| No Internet | 950 | 21.6% |
| Total | 4,403 | 100.0% |
Picayune Summary
Picayune, Mississippi is a small city located in Pearl River County, Mississippi. It is situated about 40 miles northeast of New Orleans, Louisiana and about 25 miles south of Hattiesburg, Mississippi. The city is part of the larger Picayune Micropolitan Statistical Area, which includes Pearl River, Hancock, and Stone counties. As of the 2010 census, the population of Picayune was 10,878.
History
Picayune was founded in 1904 by the Picayune Land and Lumber Company. The company was formed by a group of investors from New Orleans, Louisiana, who purchased a large tract of land in Pearl River County. The town was named after the Spanish word for “small coin”, as the investors had paid a small amount of money for the land.
Picayune quickly grew into a thriving lumber town, with the Picayune Lumber Company operating a large sawmill in the city. The lumber industry was the primary source of employment for the city’s residents until the mid-20th century.
In the 1950s, the city began to diversify its economy, with the opening of a paper mill and a chemical plant. The paper mill was eventually closed in the late 1990s, but the chemical plant remains in operation today.
Geography
Picayune is located in the southeastern corner of Pearl River County, at the intersection of U.S. Highway 11 and Mississippi Highway 43. The city is situated on the banks of the Pearl River, which forms the border between Mississippi and Louisiana.
The city has a total area of 8.3 square miles, of which 8.2 square miles is land and 0.1 square miles is water. The terrain is mostly flat, with some rolling hills in the northern part of the city.
Economy
Picayune’s economy is largely based on manufacturing and retail. The city is home to several manufacturing plants, including a chemical plant, a plastics plant, and a paper mill. The city also has a large retail sector, with several shopping centers and a variety of restaurants and stores.
The city’s largest employer is the Picayune School District, which employs over 1,000 people. Other major employers include the Picayune Memorial Hospital, the Picayune Police Department, and the Picayune Fire Department.
Demographics
As of the 2010 census, the population of Picayune was 10,878. The racial makeup of the city was 79.3% White, 17.2% African American, 0.7% Native American, 0.7% Asian, 0.2% Pacific Islander, 0.7% from other races, and 1.4% from two or more races. Hispanic or Latino of any race were 2.2% of the population.
The median household income in Picayune was $37,945, and the median family income was $45,945. The per capita income for the city was $19,945. About 17.2% of families and 20.2% of the population were below the poverty line, including 28.2% of those under age 18 and 14.2% of those age 65 or over.
Picayune is served by the Picayune School District, which consists of five elementary schools, two middle schools, and one high school. The city is also home to Pearl River Community College, which offers a variety of associate’s degree and certificate programs.
Common Questions
What is Per Capita Income in Picayune?
Per Capita income in Picayune is $22,123.
What is the Median Family Income in Picayune?
Median Family Income in Picayune is $40,838.
What is the Median Household income in Picayune?
Median Household Income in Picayune is $35,649.
What is Income or Wage Gap in Picayune?
Income or Wage Gap in Picayune is 44.5%.
Women in Picayune earn 55.5 cents for every dollar earned by a man.
What is Inequality or Gini Index in Picayune?
Inequality or Gini Index in Picayune is 0.49.
What is the Total Population of Picayune?
Total Population of Picayune is 11,804.
What is the Total Male Population of Picayune?
Total Male Population of Picayune is 5,346.
What is the Total Female Population of Picayune?
Total Female Population of Picayune is 6,458.
What is the Ratio of Males per 100 Females in Picayune?
There are 82.78 Males per 100 Females in Picayune.
What is the Ratio of Females per 100 Males in Picayune?
There are 120.80 Females per 100 Males in Picayune.
What is the Median Population Age in Picayune?
Median Population Age in Picayune is 38.3 Years.
What is the Average Family Size in Picayune
Average Family Size in Picayune is 3.4 People.
What is the Average Household Size in Picayune
Average Household Size in Picayune is 2.6 People.
How Large is the Labor Force in Picayune?
There are 4,994 People in the Labor Forcein in Picayune.
What is the Percentage of People in the Labor Force in Picayune?
55.9% of People are in the Labor Force in Picayune.
What is the Unemployment Rate in Picayune?
Unemployment Rate in Picayune is 5.7%.