Natchez, MS Map & Demographics
Natchez Map
Natchez Overview
$22,364
PER CAPITA INCOME
$42,336
AVG FAMILY INCOME
$31,800
AVG HOUSEHOLD INCOME
2.2%
WAGE / INCOME GAP [ % ]
97.8¢/ $1
WAGE / INCOME GAP [ $ ]
$13,478
FAMILY INCOME DEFICIT
0.52
INEQUALITY / GINI INDEX
14,380
TOTAL POPULATION
5,966
MALE POPULATION
8,414
FEMALE POPULATION
70.91
MALES / 100 FEMALES
141.03
FEMALES / 100 MALES
39.6
MEDIAN AGE
3.3
AVG FAMILY SIZE
2.4
AVG HOUSEHOLD SIZE
5,379
LABOR FORCE [ PEOPLE ]
49.1%
PERCENT IN LABOR FORCE
8.3%
UNEMPLOYMENT RATE
Natchez Zip Codes
Income in Natchez
Income Overview in Natchez
Per Capita Income in Natchez is $22,364, while median incomes of families and households are $42,336 and $31,800 respectively.
| Characteristic | Number | Measure |
| Per Capita Income | 14,380 | $22,364 |
| Median Family Income | 3,239 | $42,336 |
| Mean Family Income | 3,239 | $60,213 |
| Median Household Income | 5,855 | $31,800 |
| Mean Household Income | 5,855 | $50,165 |
| Income Deficit | 3,239 | $13,478 |
| Wage / Income Gap (%) | 14,380 | 2.17% |
| Wage / Income Gap ($) | 14,380 | 97.83¢ per $1 |
| Gini / Inequality Index | 14,380 | 0.52 |
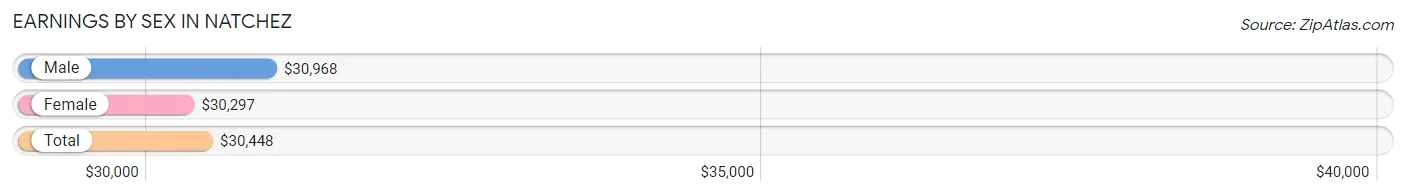
Earnings by Sex in Natchez
Average Earnings in Natchez are $30,448, $30,968 for men and $30,297 for women, a difference of 2.2%.
| Sex | Number | Average Earnings |
| Male | 2,387 (41.9%) | $30,968 |
| Female | 3,309 (58.1%) | $30,297 |
| Total | 5,696 (100.0%) | $30,448 |
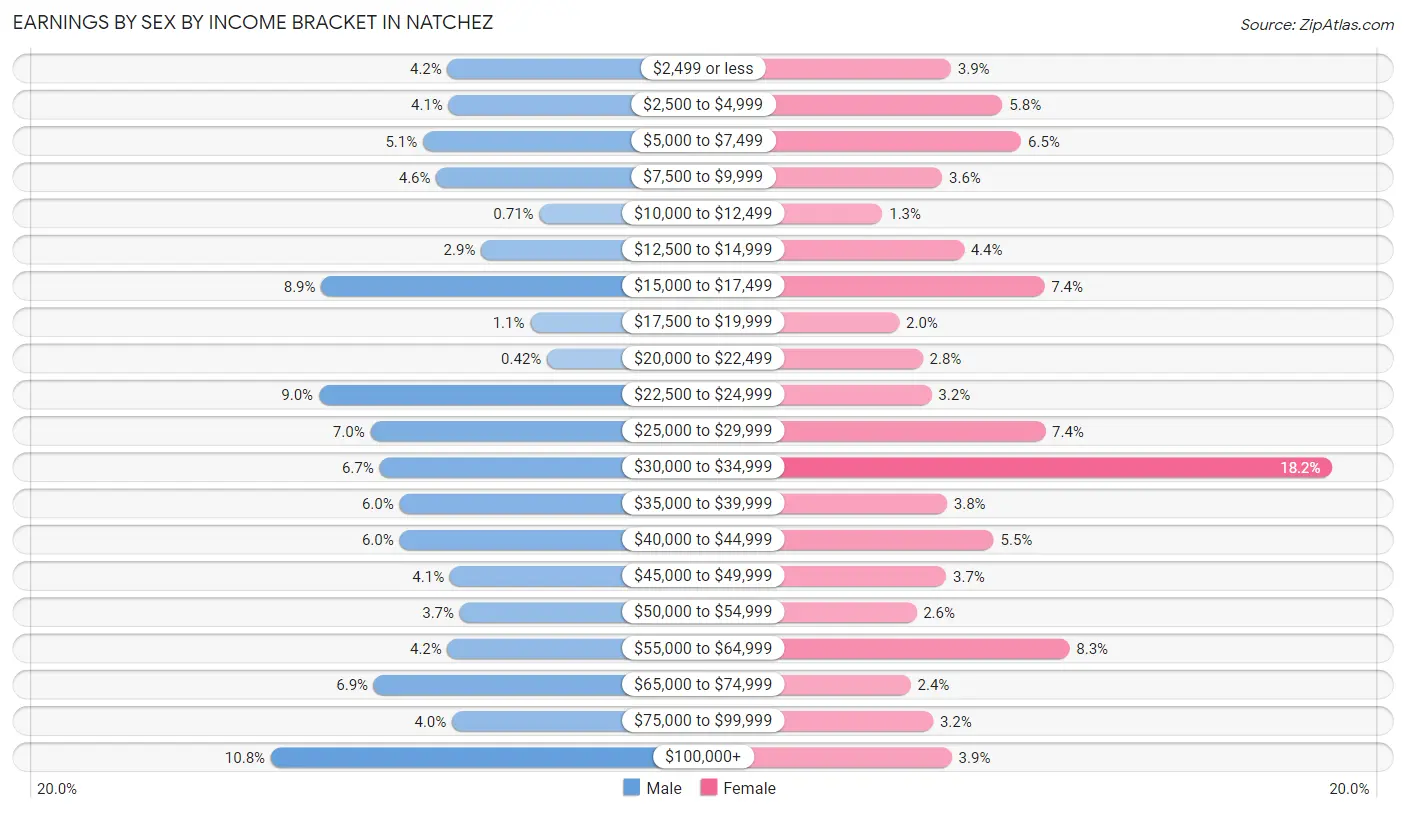
Earnings by Sex by Income Bracket in Natchez
The most common earnings brackets in Natchez are $100,000+ for men (257 | 10.8%) and $30,000 to $34,999 for women (602 | 18.2%).
| Income | Male | Female |
| $2,499 or less | 99 (4.2%) | 129 (3.9%) |
| $2,500 to $4,999 | 98 (4.1%) | 193 (5.8%) |
| $5,000 to $7,499 | 121 (5.1%) | 216 (6.5%) |
| $7,500 to $9,999 | 109 (4.6%) | 118 (3.6%) |
| $10,000 to $12,499 | 17 (0.7%) | 44 (1.3%) |
| $12,500 to $14,999 | 69 (2.9%) | 145 (4.4%) |
| $15,000 to $17,499 | 212 (8.9%) | 245 (7.4%) |
| $17,500 to $19,999 | 25 (1.1%) | 65 (2.0%) |
| $20,000 to $22,499 | 10 (0.4%) | 94 (2.8%) |
| $22,500 to $24,999 | 214 (9.0%) | 105 (3.2%) |
| $25,000 to $29,999 | 168 (7.0%) | 246 (7.4%) |
| $30,000 to $34,999 | 160 (6.7%) | 602 (18.2%) |
| $35,000 to $39,999 | 142 (5.9%) | 124 (3.7%) |
| $40,000 to $44,999 | 142 (5.9%) | 182 (5.5%) |
| $45,000 to $49,999 | 97 (4.1%) | 123 (3.7%) |
| $50,000 to $54,999 | 88 (3.7%) | 86 (2.6%) |
| $55,000 to $64,999 | 99 (4.2%) | 276 (8.3%) |
| $65,000 to $74,999 | 165 (6.9%) | 79 (2.4%) |
| $75,000 to $99,999 | 95 (4.0%) | 107 (3.2%) |
| $100,000+ | 257 (10.8%) | 130 (3.9%) |
| Total | 2,387 (100.0%) | 3,309 (100.0%) |
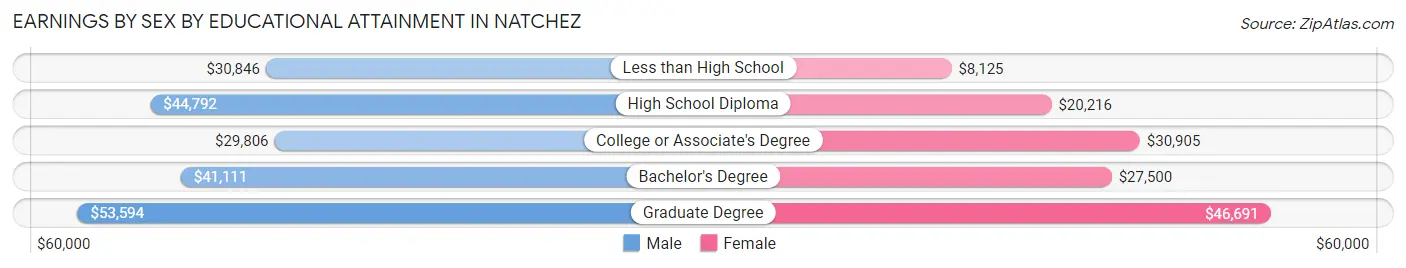
Earnings by Sex by Educational Attainment in Natchez
Average earnings in Natchez are $38,375 for men and $30,389 for women, a difference of 20.8%. Men with an educational attainment of graduate degree enjoy the highest average annual earnings of $53,594, while those with college or associate's degree education earn the least with $29,806. Women with an educational attainment of graduate degree earn the most with the average annual earnings of $46,691, while those with less than high school education have the smallest earnings of $8,125.
| Educational Attainment | Male Income | Female Income |
| Less than High School | $30,846 | $8,125 |
| High School Diploma | $44,792 | $20,216 |
| College or Associate's Degree | $29,806 | $30,905 |
| Bachelor's Degree | $41,111 | $27,500 |
| Graduate Degree | $53,594 | $46,691 |
| Total | $38,375 | $30,389 |
Family Income in Natchez
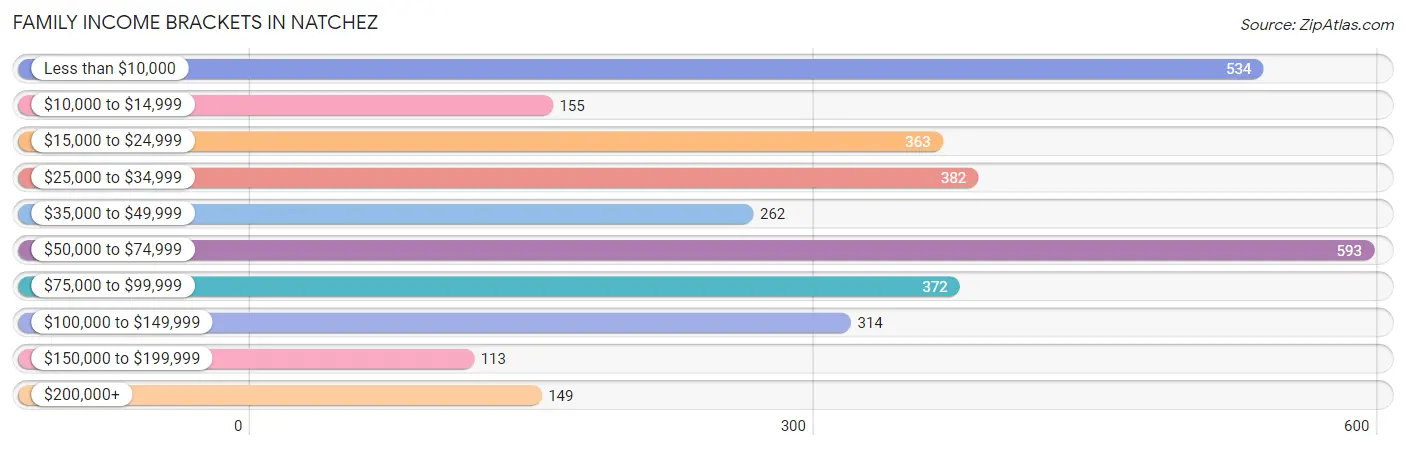
Family Income Brackets in Natchez
According to the Natchez family income data, there are 593 families falling into the $50,000 to $74,999 income range, which is the most common income bracket and makes up 18.3% of all families. Conversely, the $150,000 to $199,999 income bracket is the least frequent group with only 113 families (3.5%) belonging to this category.
| Income Bracket | # Families | % Families |
| Less than $10,000 | 534 | 16.5% |
| $10,000 to $14,999 | 155 | 4.8% |
| $15,000 to $24,999 | 363 | 11.2% |
| $25,000 to $34,999 | 382 | 11.8% |
| $35,000 to $49,999 | 262 | 8.1% |
| $50,000 to $74,999 | 593 | 18.3% |
| $75,000 to $99,999 | 372 | 11.5% |
| $100,000 to $149,999 | 314 | 9.7% |
| $150,000 to $199,999 | 113 | 3.5% |
| $200,000+ | 149 | 4.6% |
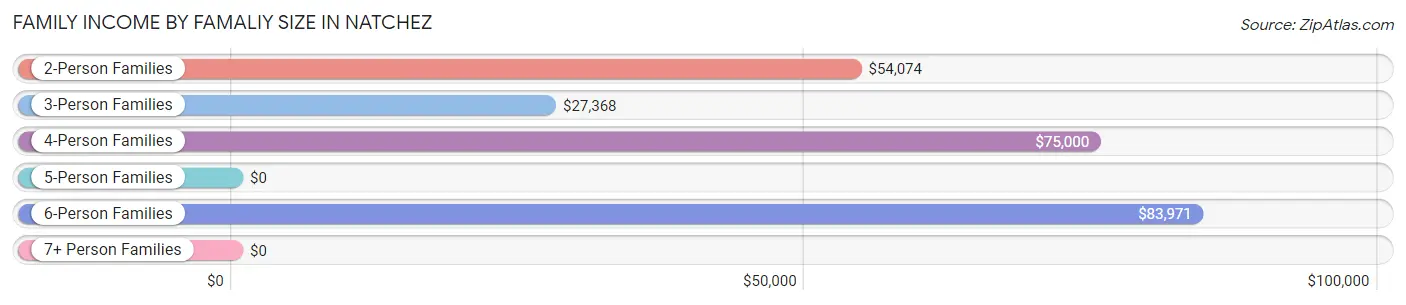
Family Income by Famaliy Size in Natchez
6-person families (50 | 1.5%) account for the highest median family income in Natchez with $83,971 per family, while 2-person families (1,548 | 47.8%) have the highest median income of $27,037 per family member.
| Income Bracket | # Families | Median Income |
| 2-Person Families | 1,548 (47.8%) | $54,074 |
| 3-Person Families | 1,016 (31.4%) | $27,368 |
| 4-Person Families | 426 (13.2%) | $75,000 |
| 5-Person Families | 167 (5.2%) | $0 |
| 6-Person Families | 50 (1.5%) | $83,971 |
| 7+ Person Families | 32 (1.0%) | $0 |
| Total | 3,239 (100.0%) | $42,336 |
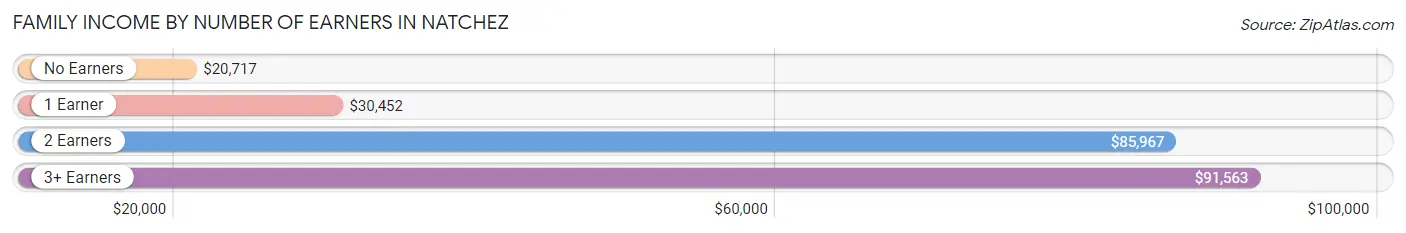
Family Income by Number of Earners in Natchez
The median family income in Natchez is $42,336, with families comprising 3+ earners (49) having the highest median family income of $91,563, while families with no earners (915) have the lowest median family income of $20,717, accounting for 1.5% and 28.2% of families, respectively.
| Number of Earners | # Families | Median Income |
| No Earners | 915 (28.2%) | $20,717 |
| 1 Earner | 1,286 (39.7%) | $30,452 |
| 2 Earners | 989 (30.5%) | $85,967 |
| 3+ Earners | 49 (1.5%) | $91,563 |
| Total | 3,239 (100.0%) | $42,336 |
Household Income in Natchez
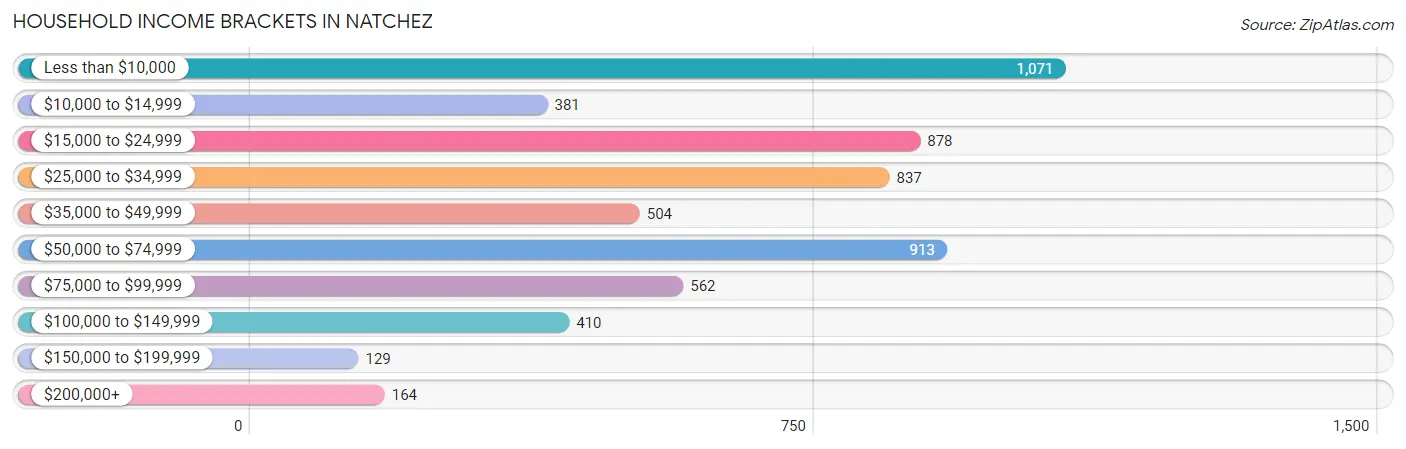
Household Income Brackets in Natchez
With 1,071 households falling in the category, the less than $10,000 income range is the most frequent in Natchez, accounting for 18.3% of all households. In contrast, only 129 households (2.2%) fall into the $150,000 to $199,999 income bracket, making it the least populous group.
| Income Bracket | # Households | % Households |
| Less than $10,000 | 1,071 | 18.3% |
| $10,000 to $14,999 | 381 | 6.5% |
| $15,000 to $24,999 | 878 | 15.0% |
| $25,000 to $34,999 | 837 | 14.3% |
| $35,000 to $49,999 | 504 | 8.6% |
| $50,000 to $74,999 | 913 | 15.6% |
| $75,000 to $99,999 | 562 | 9.6% |
| $100,000 to $149,999 | 410 | 7.0% |
| $150,000 to $199,999 | 129 | 2.2% |
| $200,000+ | 164 | 2.8% |
Household Income by Householder Age in Natchez
The median household income in Natchez is $31,800, with the highest median household income of $34,487 found in the 45 to 64 years age bracket for the primary householder. A total of 1,861 households (31.8%) fall into this category. Meanwhile, the 15 to 24 years age bracket for the primary householder has the lowest median household income of $2,499, with 182 households (3.1%) in this group.
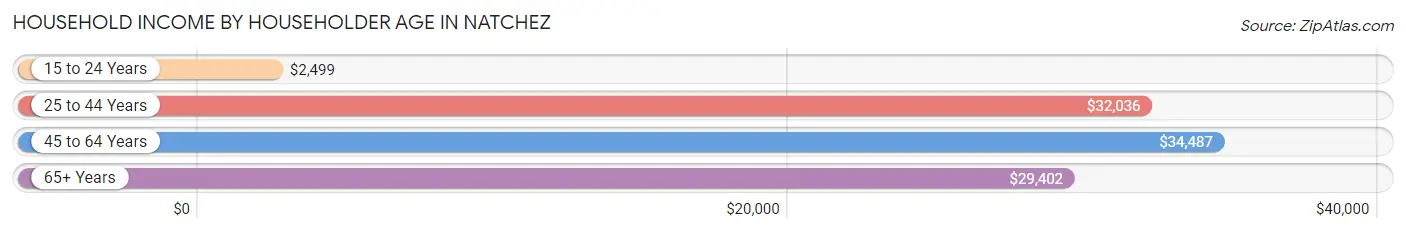
| Income Bracket | # Households | Median Income |
| 15 to 24 Years | 182 (3.1%) | $2,499 |
| 25 to 44 Years | 1,723 (29.4%) | $32,036 |
| 45 to 64 Years | 1,861 (31.8%) | $34,487 |
| 65+ Years | 2,089 (35.7%) | $29,402 |
| Total | 5,855 (100.0%) | $31,800 |
Poverty in Natchez
Income Below Poverty by Sex and Age in Natchez
With 29.8% poverty level for males and 34.6% for females among the residents of Natchez, 15 year old males and 15 year old females are the most vulnerable to poverty, with 118 males (84.9%) and 94 females (73.4%) in their respective age groups living below the poverty level.
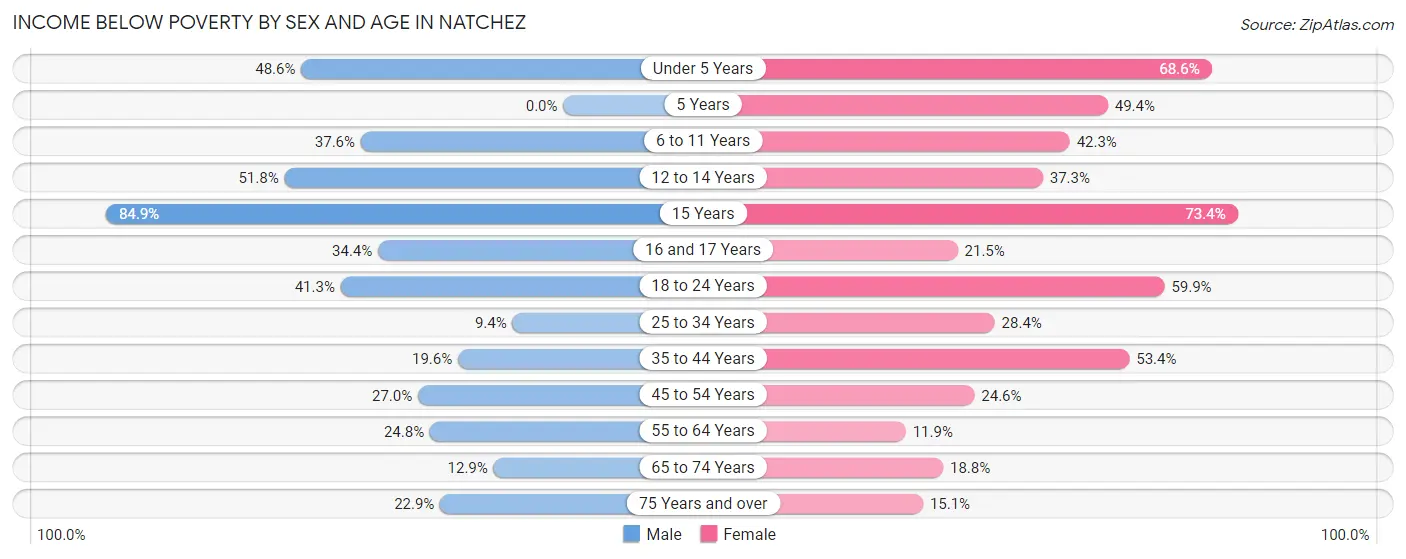
| Age Bracket | Male | Female |
| Under 5 Years | 214 (48.6%) | 448 (68.6%) |
| 5 Years | 0 (0.0%) | 40 (49.4%) |
| 6 to 11 Years | 230 (37.6%) | 305 (42.3%) |
| 12 to 14 Years | 191 (51.8%) | 100 (37.3%) |
| 15 Years | 118 (84.9%) | 94 (73.4%) |
| 16 and 17 Years | 55 (34.4%) | 43 (21.5%) |
| 18 to 24 Years | 207 (41.3%) | 448 (59.9%) |
| 25 to 34 Years | 45 (9.4%) | 265 (28.4%) |
| 35 to 44 Years | 105 (19.6%) | 468 (53.4%) |
| 45 to 54 Years | 192 (27.0%) | 220 (24.6%) |
| 55 to 64 Years | 172 (24.7%) | 111 (11.9%) |
| 65 to 74 Years | 81 (12.9%) | 185 (18.8%) |
| 75 Years and over | 120 (22.9%) | 120 (15.1%) |
| Total | 1,730 (29.8%) | 2,847 (34.6%) |
Income Above Poverty by Sex and Age in Natchez
According to the poverty statistics in Natchez, males aged 5 years and females aged 55 to 64 years are the age groups that are most secure financially, with 100.0% of males and 88.1% of females in these age groups living above the poverty line.
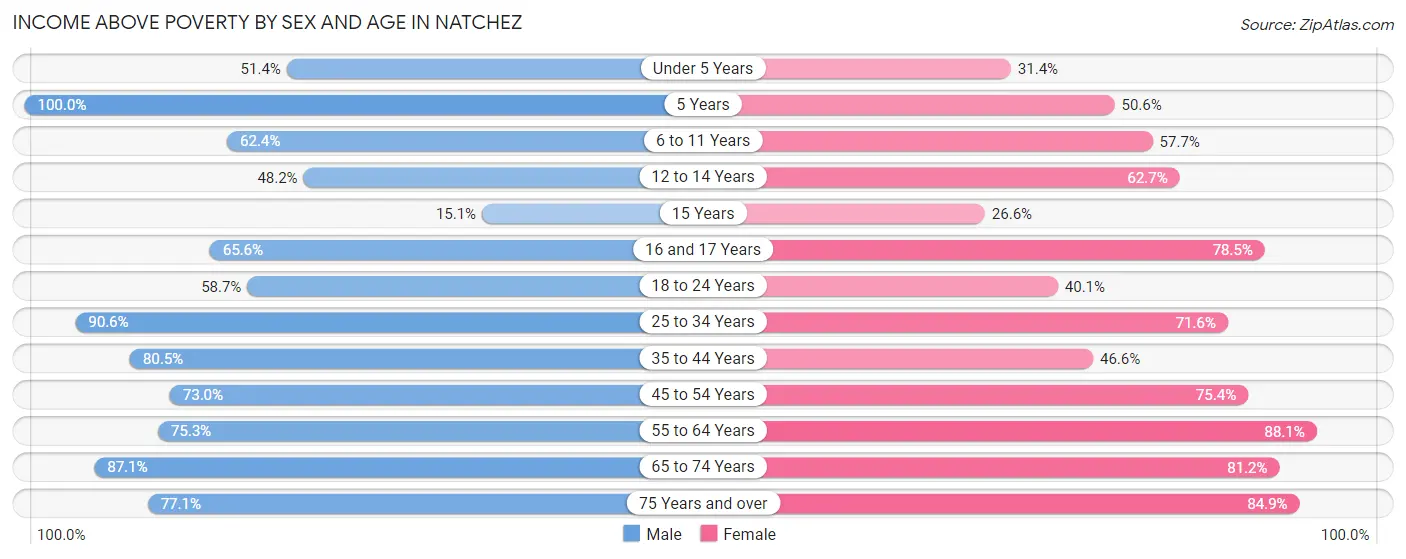
| Age Bracket | Male | Female |
| Under 5 Years | 226 (51.4%) | 205 (31.4%) |
| 5 Years | 6 (100.0%) | 41 (50.6%) |
| 6 to 11 Years | 382 (62.4%) | 416 (57.7%) |
| 12 to 14 Years | 178 (48.2%) | 168 (62.7%) |
| 15 Years | 21 (15.1%) | 34 (26.6%) |
| 16 and 17 Years | 105 (65.6%) | 157 (78.5%) |
| 18 to 24 Years | 294 (58.7%) | 300 (40.1%) |
| 25 to 34 Years | 432 (90.6%) | 669 (71.6%) |
| 35 to 44 Years | 432 (80.4%) | 409 (46.6%) |
| 45 to 54 Years | 520 (73.0%) | 674 (75.4%) |
| 55 to 64 Years | 523 (75.2%) | 824 (88.1%) |
| 65 to 74 Years | 545 (87.1%) | 799 (81.2%) |
| 75 Years and over | 405 (77.1%) | 677 (84.9%) |
| Total | 4,069 (70.2%) | 5,373 (65.4%) |
Income Below Poverty Among Married-Couple Families in Natchez
The poverty statistics for married-couple families in Natchez show that 5.5% or 82 of the total 1,497 families live below the poverty line. Families with 1 or 2 children have the highest poverty rate of 10.3%, comprising of 38 families. On the other hand, families with 3 or 4 children have the lowest poverty rate of 0.0%, which includes 0 families.
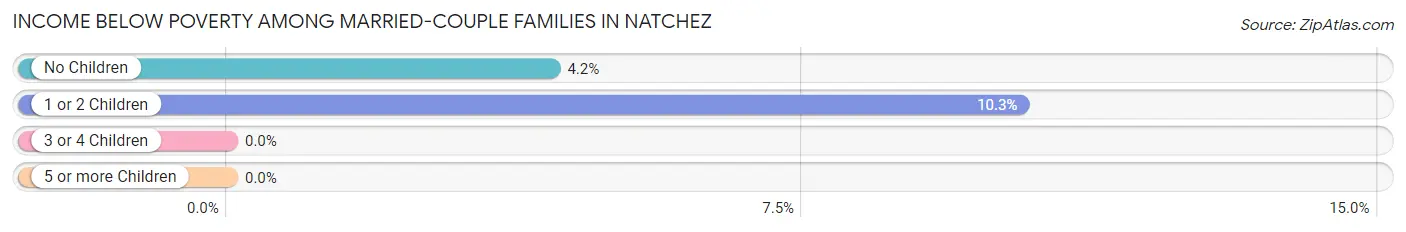
| Children | Above Poverty | Below Poverty |
| No Children | 1,002 (95.8%) | 44 (4.2%) |
| 1 or 2 Children | 330 (89.7%) | 38 (10.3%) |
| 3 or 4 Children | 51 (100.0%) | 0 (0.0%) |
| 5 or more Children | 32 (100.0%) | 0 (0.0%) |
| Total | 1,415 (94.5%) | 82 (5.5%) |
Income Below Poverty Among Single-Parent Households in Natchez
According to the poverty data in Natchez, 44.9% or 75 single-father households and 52.6% or 828 single-mother households are living below the poverty line. Among single-father households, those with 3 or 4 children have the highest poverty rate, with 39 households (100.0%) experiencing poverty. Likewise, among single-mother households, those with 3 or 4 children have the highest poverty rate, with 143 households (63.6%) falling below the poverty line.
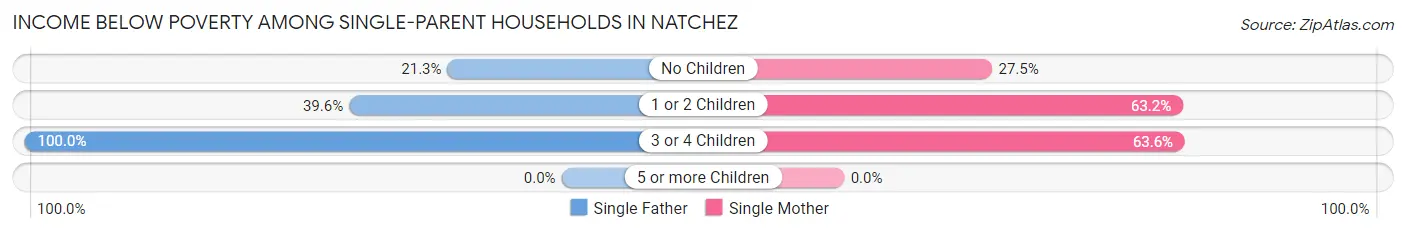
| Children | Single Father | Single Mother |
| No Children | 17 (21.2%) | 130 (27.5%) |
| 1 or 2 Children | 19 (39.6%) | 555 (63.2%) |
| 3 or 4 Children | 39 (100.0%) | 143 (63.6%) |
| 5 or more Children | 0 (0.0%) | 0 (0.0%) |
| Total | 75 (44.9%) | 828 (52.6%) |
Income Below Poverty Among Married-Couple vs Single-Parent Households in Natchez
The poverty data for Natchez shows that 82 of the married-couple family households (5.5%) and 903 of the single-parent households (51.8%) are living below the poverty level. Within the married-couple family households, those with 1 or 2 children have the highest poverty rate, with 38 households (10.3%) falling below the poverty line. Among the single-parent households, those with 3 or 4 children have the highest poverty rate, with 182 household (68.9%) living below poverty.
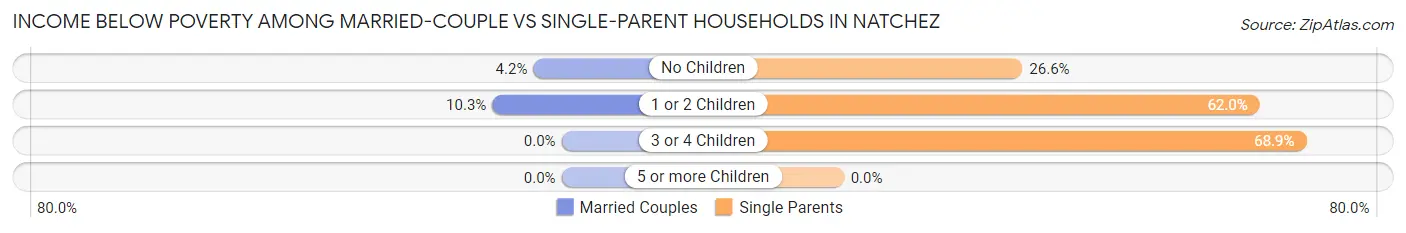
| Children | Married-Couple Families | Single-Parent Households |
| No Children | 44 (4.2%) | 147 (26.6%) |
| 1 or 2 Children | 38 (10.3%) | 574 (62.0%) |
| 3 or 4 Children | 0 (0.0%) | 182 (68.9%) |
| 5 or more Children | 0 (0.0%) | 0 (0.0%) |
| Total | 82 (5.5%) | 903 (51.8%) |
Race in Natchez
The most populous races in Natchez are Black / African American (8,950 | 62.2%), White / Caucasian (4,856 | 33.8%), and Hispanic or Latino (578 | 4.0%).
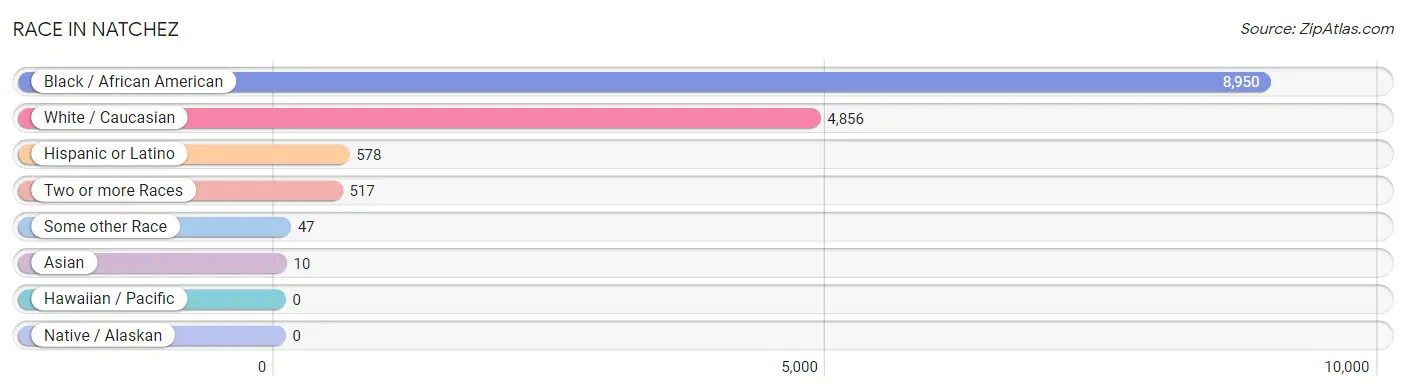
| Race | # Population | % Population |
| Asian | 10 | 0.1% |
| Black / African American | 8,950 | 62.2% |
| Hawaiian / Pacific | 0 | 0.0% |
| Hispanic or Latino | 578 | 4.0% |
| Native / Alaskan | 0 | 0.0% |
| White / Caucasian | 4,856 | 33.8% |
| Two or more Races | 517 | 3.6% |
| Some other Race | 47 | 0.3% |
| Total | 14,380 | 100.0% |
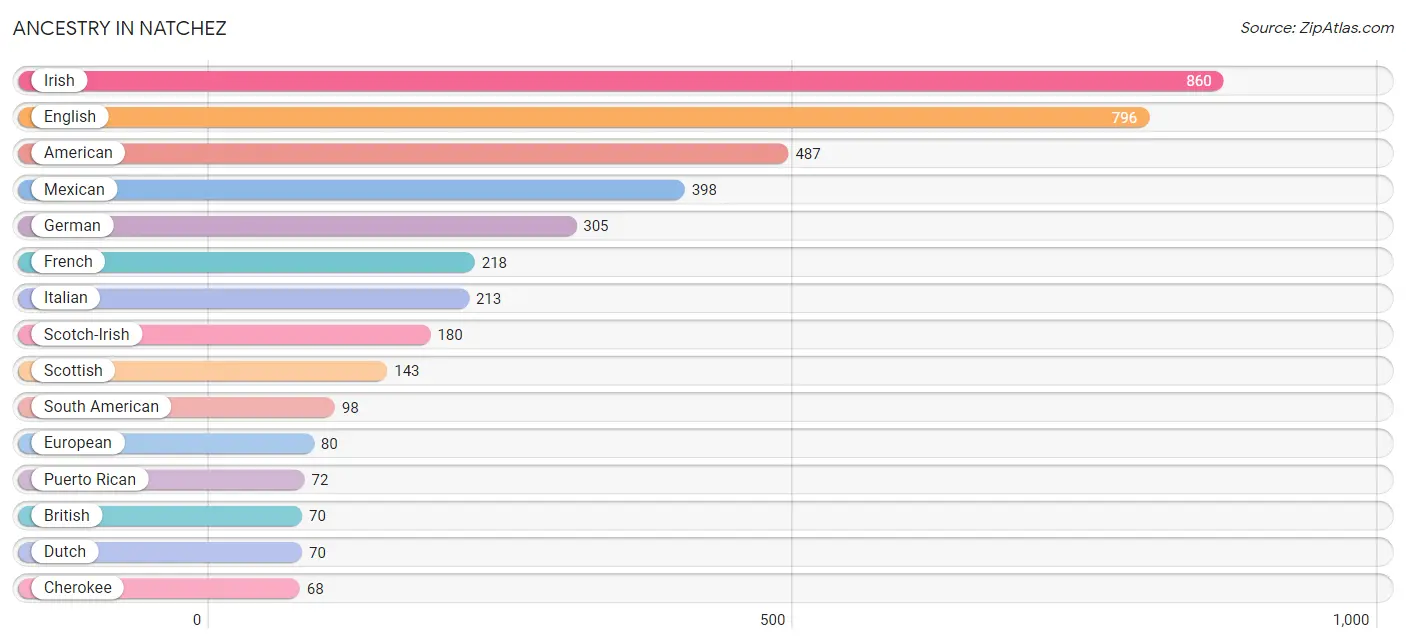
Ancestry in Natchez
The most populous ancestries reported in Natchez are Irish (860 | 6.0%), English (796 | 5.5%), American (487 | 3.4%), Mexican (398 | 2.8%), and German (305 | 2.1%), together accounting for 19.8% of all Natchez residents.
| Ancestry | # Population | % Population |
| African | 60 | 0.4% |
| American | 487 | 3.4% |
| Arab | 14 | 0.1% |
| Argentinean | 63 | 0.4% |
| Blackfeet | 48 | 0.3% |
| British | 70 | 0.5% |
| Central American | 10 | 0.1% |
| Cherokee | 68 | 0.5% |
| Cheyenne | 10 | 0.1% |
| Choctaw | 10 | 0.1% |
| Colombian | 35 | 0.2% |
| Crow | 10 | 0.1% |
| Czech | 10 | 0.1% |
| Danish | 11 | 0.1% |
| Dutch | 70 | 0.5% |
| English | 796 | 5.5% |
| European | 80 | 0.6% |
| Finnish | 10 | 0.1% |
| French | 218 | 1.5% |
| French Canadian | 30 | 0.2% |
| German | 305 | 2.1% |
| Indian (Asian) | 10 | 0.1% |
| Irish | 860 | 6.0% |
| Italian | 213 | 1.5% |
| Jamaican | 10 | 0.1% |
| Korean | 9 | 0.1% |
| Lebanese | 5 | 0.0% |
| Mexican | 398 | 2.8% |
| Norwegian | 35 | 0.2% |
| Palestinian | 9 | 0.1% |
| Polish | 10 | 0.1% |
| Puerto Rican | 72 | 0.5% |
| Salvadoran | 10 | 0.1% |
| Scotch-Irish | 180 | 1.3% |
| Scottish | 143 | 1.0% |
| Slavic | 16 | 0.1% |
| South American | 98 | 0.7% |
| Subsaharan African | 60 | 0.4% |
| Swedish | 3 | 0.0% |
| Welsh | 54 | 0.4% | View All 40 Rows |
Immigrants in Natchez
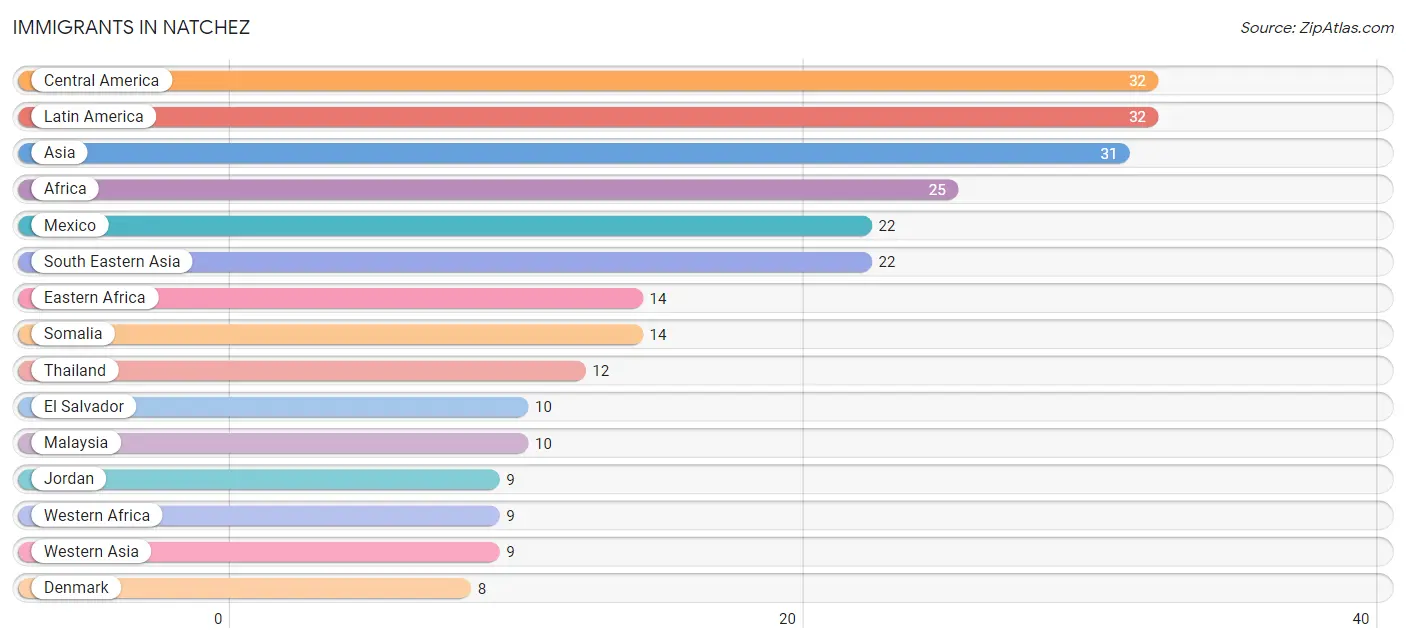
The most numerous immigrant groups reported in Natchez came from Central America (32 | 0.2%), Latin America (32 | 0.2%), Asia (31 | 0.2%), Africa (25 | 0.2%), and Mexico (22 | 0.2%), together accounting for 1.0% of all Natchez residents.
| Immigration Origin | # Population | % Population |
| Africa | 25 | 0.2% |
| Asia | 31 | 0.2% |
| Cameroon | 2 | 0.0% |
| Central America | 32 | 0.2% |
| Denmark | 8 | 0.1% |
| Eastern Africa | 14 | 0.1% |
| El Salvador | 10 | 0.1% |
| Europe | 8 | 0.1% |
| Jordan | 9 | 0.1% |
| Latin America | 32 | 0.2% |
| Malaysia | 10 | 0.1% |
| Mexico | 22 | 0.2% |
| Middle Africa | 2 | 0.0% |
| Northern Europe | 8 | 0.1% |
| Somalia | 14 | 0.1% |
| South Eastern Asia | 22 | 0.2% |
| Thailand | 12 | 0.1% |
| Western Africa | 9 | 0.1% |
| Western Asia | 9 | 0.1% | View All 19 Rows |
Sex and Age in Natchez
Sex and Age in Natchez
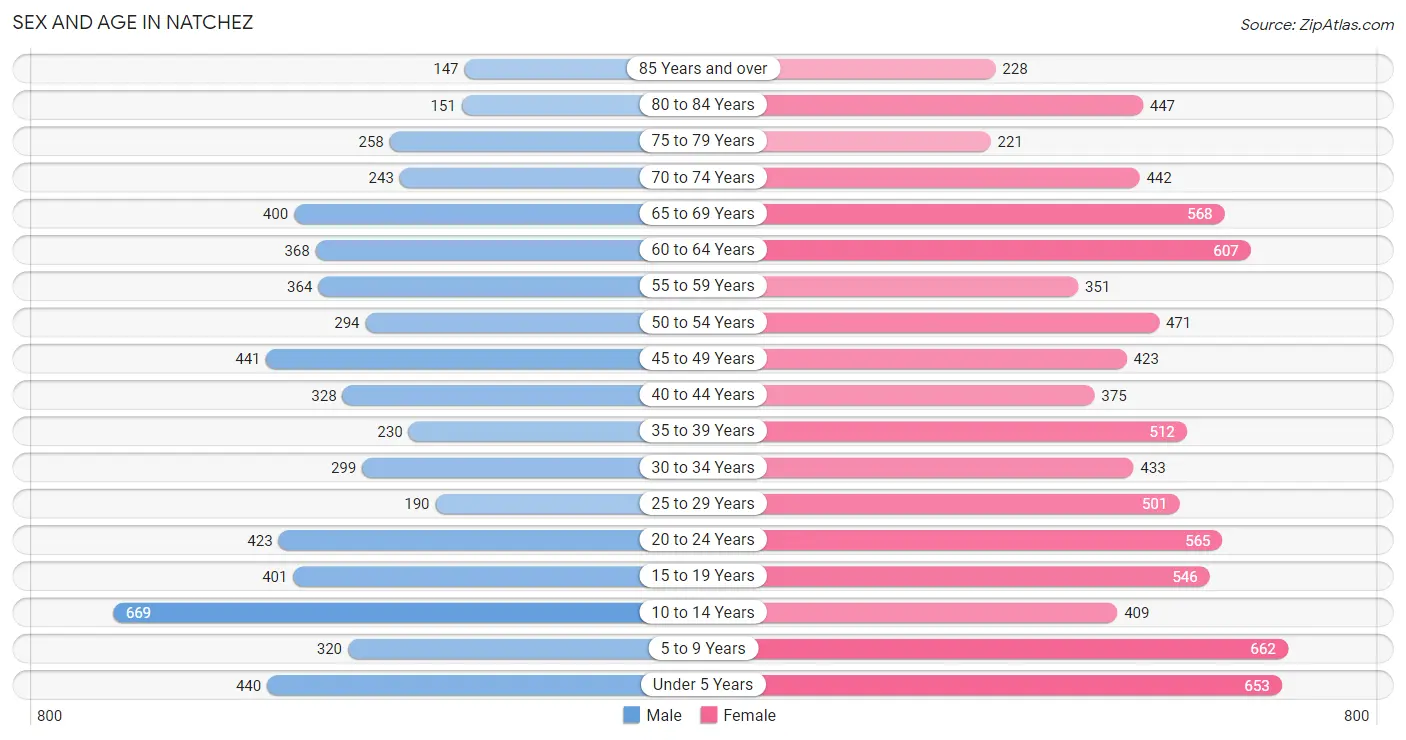
The most populous age groups in Natchez are 10 to 14 Years (669 | 11.2%) for men and 5 to 9 Years (662 | 7.9%) for women.
| Age Bracket | Male | Female |
| Under 5 Years | 440 (7.4%) | 653 (7.8%) |
| 5 to 9 Years | 320 (5.4%) | 662 (7.9%) |
| 10 to 14 Years | 669 (11.2%) | 409 (4.9%) |
| 15 to 19 Years | 401 (6.7%) | 546 (6.5%) |
| 20 to 24 Years | 423 (7.1%) | 565 (6.7%) |
| 25 to 29 Years | 190 (3.2%) | 501 (5.9%) |
| 30 to 34 Years | 299 (5.0%) | 433 (5.1%) |
| 35 to 39 Years | 230 (3.9%) | 512 (6.1%) |
| 40 to 44 Years | 328 (5.5%) | 375 (4.5%) |
| 45 to 49 Years | 441 (7.4%) | 423 (5.0%) |
| 50 to 54 Years | 294 (4.9%) | 471 (5.6%) |
| 55 to 59 Years | 364 (6.1%) | 351 (4.2%) |
| 60 to 64 Years | 368 (6.2%) | 607 (7.2%) |
| 65 to 69 Years | 400 (6.7%) | 568 (6.8%) |
| 70 to 74 Years | 243 (4.1%) | 442 (5.2%) |
| 75 to 79 Years | 258 (4.3%) | 221 (2.6%) |
| 80 to 84 Years | 151 (2.5%) | 447 (5.3%) |
| 85 Years and over | 147 (2.5%) | 228 (2.7%) |
| Total | 5,966 (100.0%) | 8,414 (100.0%) |
Families and Households in Natchez
Median Family Size in Natchez
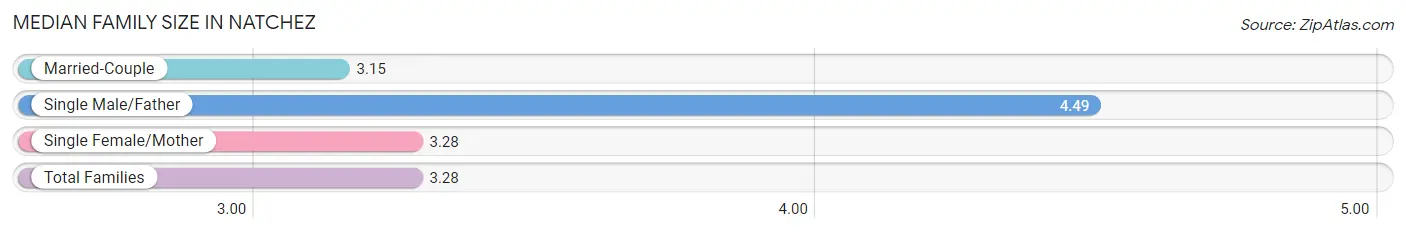
The median family size in Natchez is 3.28 persons per family, with single male/father families (167 | 5.2%) accounting for the largest median family size of 4.49 persons per family. On the other hand, married-couple families (1,497 | 46.2%) represent the smallest median family size with 3.15 persons per family.
| Family Type | # Families | Family Size |
| Married-Couple | 1,497 (46.2%) | 3.15 |
| Single Male/Father | 167 (5.2%) | 4.49 |
| Single Female/Mother | 1,575 (48.6%) | 3.28 |
| Total Families | 3,239 (100.0%) | 3.28 |
Median Household Size in Natchez
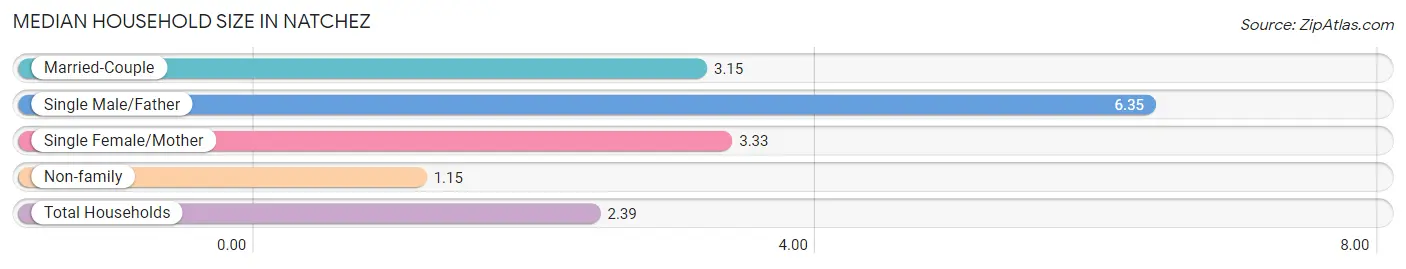
The median household size in Natchez is 2.39 persons per household, with single male/father households (167 | 2.9%) accounting for the largest median household size of 6.35 persons per household. non-family households (2,616 | 44.7%) represent the smallest median household size with 1.15 persons per household.
| Household Type | # Households | Household Size |
| Married-Couple | 1,497 (25.6%) | 3.15 |
| Single Male/Father | 167 (2.9%) | 6.35 |
| Single Female/Mother | 1,575 (26.9%) | 3.33 |
| Non-family | 2,616 (44.7%) | 1.15 |
| Total Households | 5,855 (100.0%) | 2.39 |
Household Size by Marriage Status in Natchez
Out of a total of 5,855 households in Natchez, 3,239 (55.3%) are family households, while 2,616 (44.7%) are nonfamily households. The most numerous type of family households are 2-person households, comprising 1,504, and the most common type of nonfamily households are 1-person households, comprising 2,318.
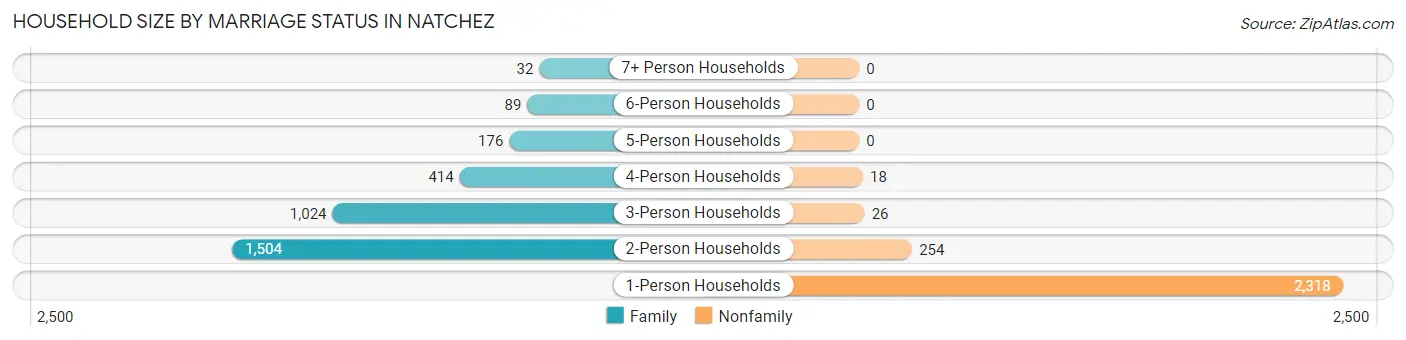
| Household Size | Family Households | Nonfamily Households |
| 1-Person Households | - | 2,318 (39.6%) |
| 2-Person Households | 1,504 (25.7%) | 254 (4.3%) |
| 3-Person Households | 1,024 (17.5%) | 26 (0.4%) |
| 4-Person Households | 414 (7.1%) | 18 (0.3%) |
| 5-Person Households | 176 (3.0%) | 0 (0.0%) |
| 6-Person Households | 89 (1.5%) | 0 (0.0%) |
| 7+ Person Households | 32 (0.5%) | 0 (0.0%) |
| Total | 3,239 (55.3%) | 2,616 (44.7%) |
Female Fertility in Natchez
Fertility by Age in Natchez
Average fertility rate in Natchez is 62.0 births per 1,000 women. Women in the age bracket of 20 to 34 years have the highest fertility rate with 102.0 births per 1,000 women. Women in the age bracket of 20 to 34 years acount for 72.5% of all women with births.
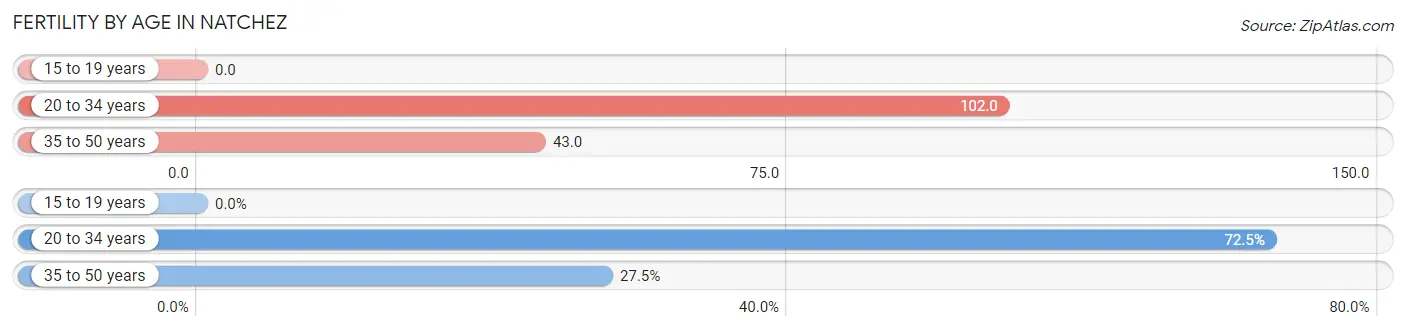
| Age Bracket | Women with Births | Births / 1,000 Women |
| 15 to 19 years | 0 (0.0%) | 0.0 |
| 20 to 34 years | 153 (72.5%) | 102.0 |
| 35 to 50 years | 58 (27.5%) | 43.0 |
| Total | 211 (100.0%) | 62.0 |
Fertility by Age by Marriage Status in Natchez
0.5% of women with births (211) in Natchez are married. The highest percentage of unmarried women with births falls into 20 to 34 years age bracket with 100.0% of them unmarried at the time of birth, while the lowest percentage of unmarried women with births belong to 35 to 50 years age bracket with 98.3% of them unmarried.
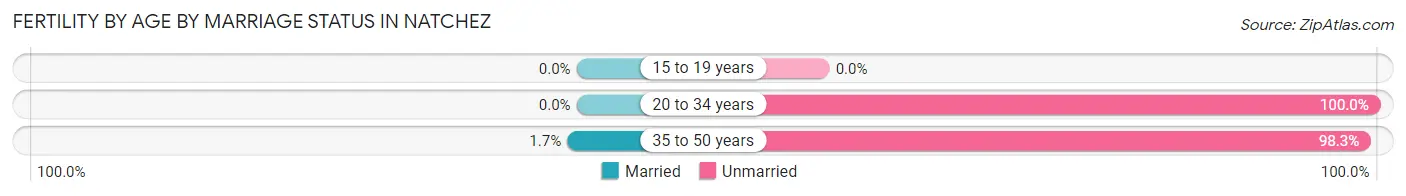
| Age Bracket | Married | Unmarried |
| 15 to 19 years | 0 (0.0%) | 0 (0.0%) |
| 20 to 34 years | 0 (0.0%) | 153 (100.0%) |
| 35 to 50 years | 1 (1.7%) | 57 (98.3%) |
| Total | 1 (0.5%) | 210 (99.5%) |
Fertility by Education in Natchez
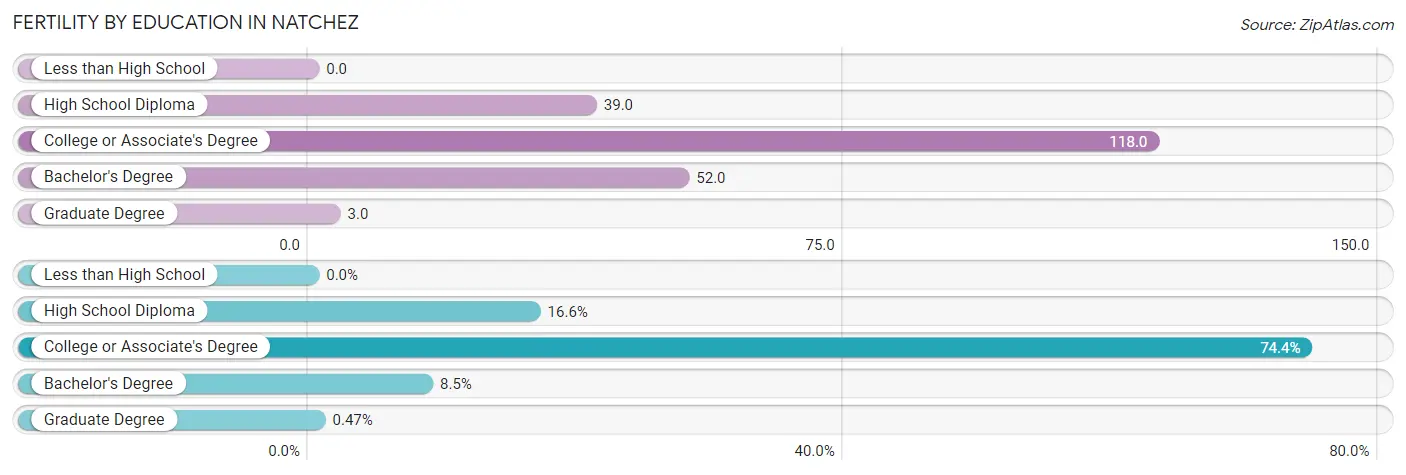
| Educational Attainment | Women with Births | Births / 1,000 Women |
| Less than High School | 0 (0.0%) | 0.0 |
| High School Diploma | 35 (16.6%) | 39.0 |
| College or Associate's Degree | 157 (74.4%) | 118.0 |
| Bachelor's Degree | 18 (8.5%) | 52.0 |
| Graduate Degree | 1 (0.5%) | 3.0 |
| Total | 211 (100.0%) | 62.0 |
Fertility by Education by Marriage Status in Natchez
99.5% of women with births in Natchez are unmarried. Women with the educational attainment of graduate degree are most likely to be married with 100.0% of them married at childbirth, while women with the educational attainment of high school diploma are least likely to be married with 100.0% of them unmarried at childbirth.
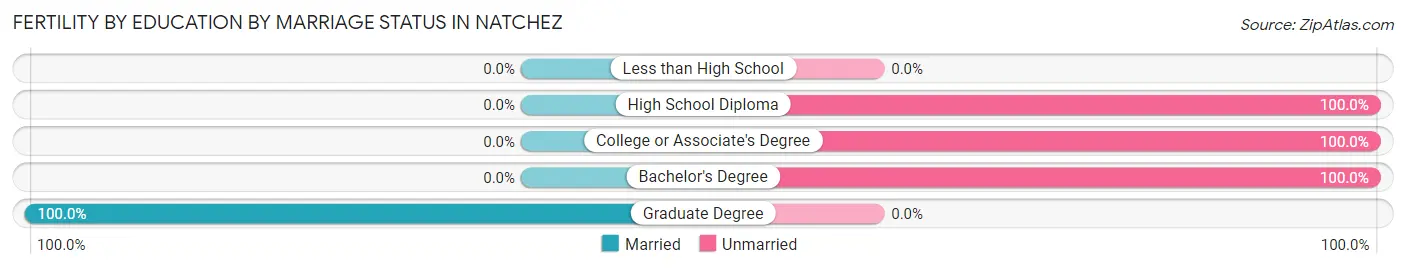
| Educational Attainment | Married | Unmarried |
| Less than High School | 0 (0.0%) | 0 (0.0%) |
| High School Diploma | 0 (0.0%) | 35 (100.0%) |
| College or Associate's Degree | 0 (0.0%) | 157 (100.0%) |
| Bachelor's Degree | 0 (0.0%) | 18 (100.0%) |
| Graduate Degree | 1 (100.0%) | 0 (0.0%) |
| Total | 1 (0.5%) | 210 (99.5%) |
Employment Characteristics in Natchez
Employment by Class of Employer in Natchez
Among the 4,730 employed individuals in Natchez, private company employees (3,139 | 66.4%), state government employees (465 | 9.8%), and local government employees (450 | 9.5%) make up the most common classes of employment.
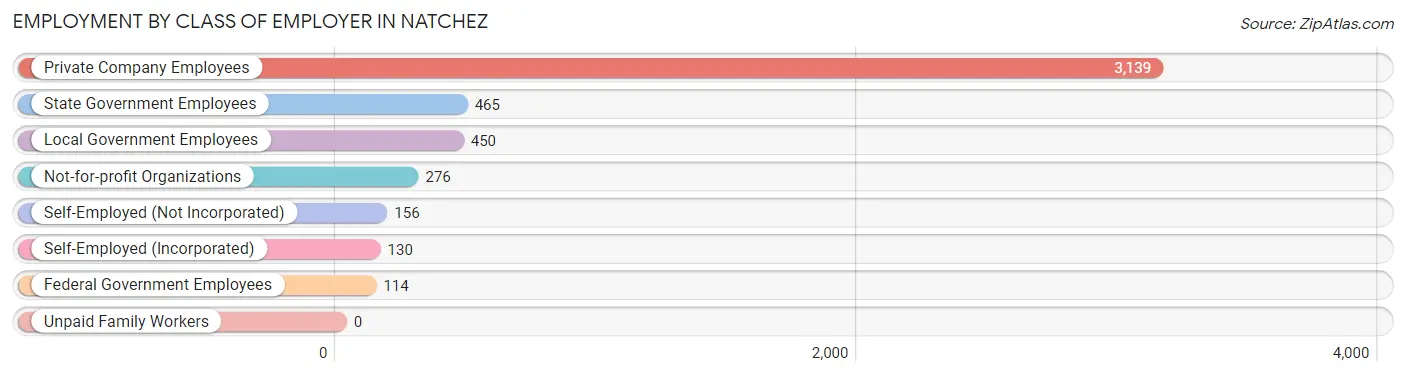
| Employer Class | # Employees | % Employees |
| Private Company Employees | 3,139 | 66.4% |
| Self-Employed (Incorporated) | 130 | 2.8% |
| Self-Employed (Not Incorporated) | 156 | 3.3% |
| Not-for-profit Organizations | 276 | 5.8% |
| Local Government Employees | 450 | 9.5% |
| State Government Employees | 465 | 9.8% |
| Federal Government Employees | 114 | 2.4% |
| Unpaid Family Workers | 0 | 0.0% |
| Total | 4,730 | 100.0% |
Employment Status by Age in Natchez
According to the labor force statistics for Natchez, out of the total population over 16 years of age (10,955), 49.1% or 5,379 individuals are in the labor force, with 8.3% or 446 of them unemployed. The age group with the highest labor force participation rate is 25 to 29 years, with 78.3% or 541 individuals in the labor force. Within the labor force, the 20 to 24 years age range has the highest percentage of unemployed individuals, with 25.7% or 115 of them being unemployed.
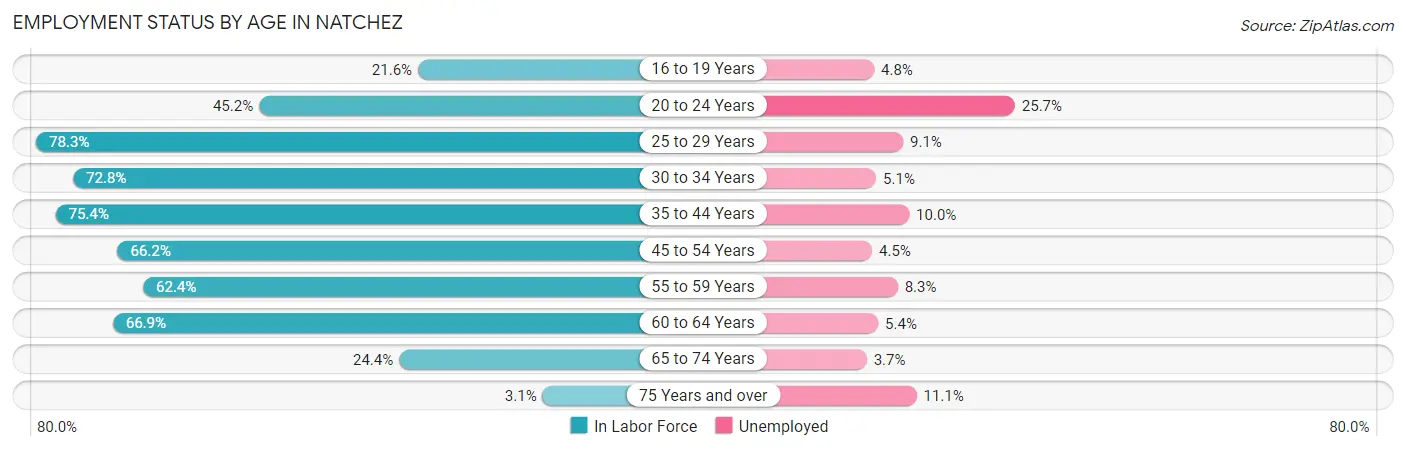
| Age Bracket | In Labor Force | Unemployed |
| 16 to 19 Years | 146 (21.6%) | 7 (4.8%) |
| 20 to 24 Years | 447 (45.2%) | 115 (25.7%) |
| 25 to 29 Years | 541 (78.3%) | 49 (9.1%) |
| 30 to 34 Years | 533 (72.8%) | 27 (5.1%) |
| 35 to 44 Years | 1,090 (75.4%) | 109 (10.0%) |
| 45 to 54 Years | 1,078 (66.2%) | 49 (4.5%) |
| 55 to 59 Years | 446 (62.4%) | 37 (8.3%) |
| 60 to 64 Years | 652 (66.9%) | 35 (5.4%) |
| 65 to 74 Years | 403 (24.4%) | 15 (3.7%) |
| 75 Years and over | 45 (3.1%) | 5 (11.1%) |
| Total | 5,379 (49.1%) | 446 (8.3%) |
Employment Status by Educational Attainment in Natchez
According to labor force statistics for Natchez, 70.2% of individuals (4,343) out of the total population between 25 and 64 years of age (6,187) are in the labor force, with 7.1% or 308 of them being unemployed. The group with the highest labor force participation rate are those with the educational attainment of bachelor's degree or higher, with 86.3% or 1,477 individuals in the labor force. Within the labor force, individuals with less than high school education have the highest percentage of unemployment, with 21.0% or 70 of them being unemployed.
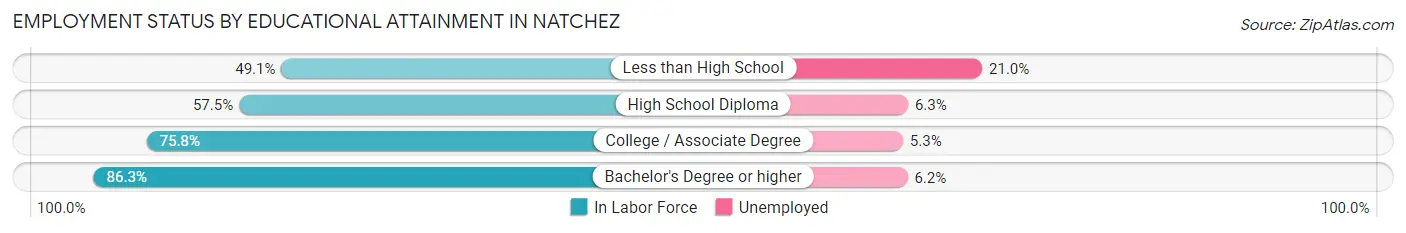
| Educational Attainment | In Labor Force | Unemployed |
| Less than High School | 334 (49.1%) | 143 (21.0%) |
| High School Diploma | 1,090 (57.5%) | 119 (6.3%) |
| College / Associate Degree | 1,439 (75.8%) | 101 (5.3%) |
| Bachelor's Degree or higher | 1,477 (86.3%) | 106 (6.2%) |
| Total | 4,343 (70.2%) | 439 (7.1%) |
Employment Occupations by Sex in Natchez
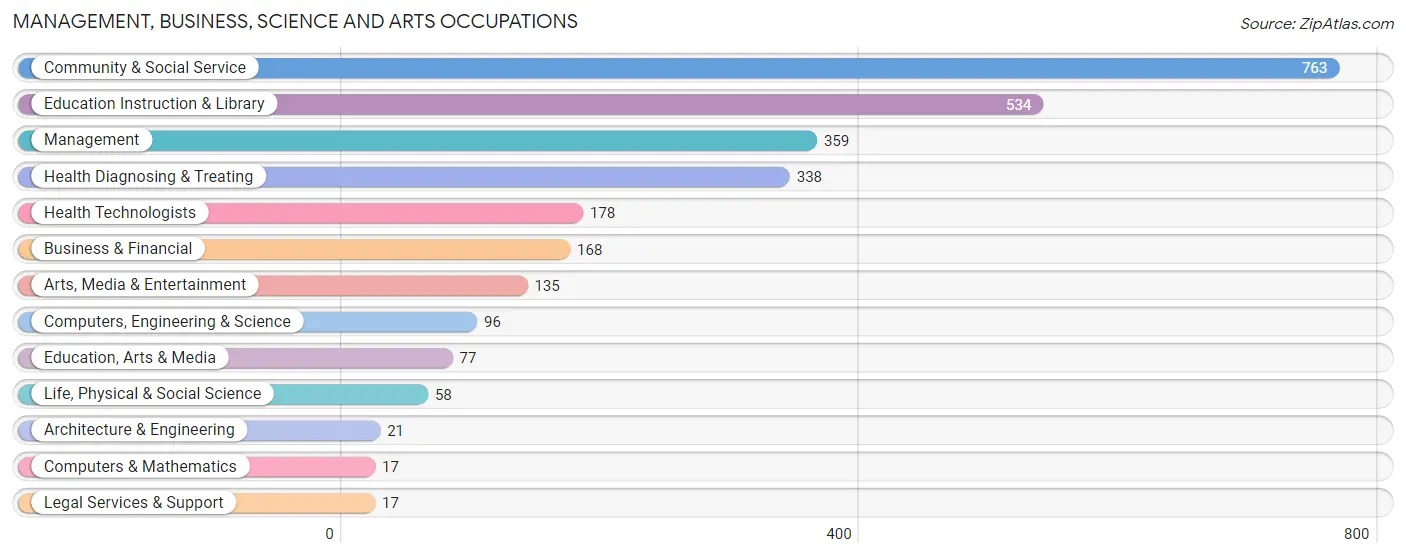
Management, Business, Science and Arts Occupations
The most common Management, Business, Science and Arts occupations in Natchez are Community & Social Service (763 | 15.5%), Education Instruction & Library (534 | 10.8%), Management (359 | 7.3%), Health Diagnosing & Treating (338 | 6.9%), and Health Technologists (178 | 3.6%).
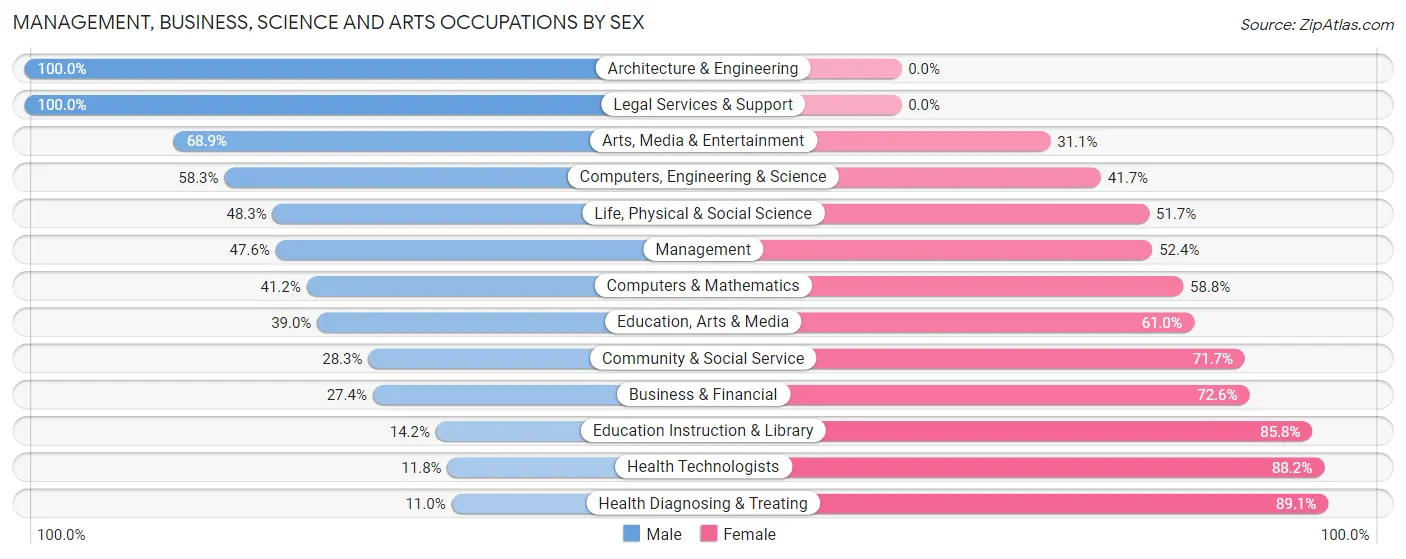
Management, Business, Science and Arts Occupations by Sex
Within the Management, Business, Science and Arts occupations in Natchez, the most male-oriented occupations are Architecture & Engineering (100.0%), Legal Services & Support (100.0%), and Arts, Media & Entertainment (68.9%), while the most female-oriented occupations are Health Diagnosing & Treating (89.0%), Health Technologists (88.2%), and Education Instruction & Library (85.8%).
| Occupation | Male | Female |
| Management | 171 (47.6%) | 188 (52.4%) |
| Business & Financial | 46 (27.4%) | 122 (72.6%) |
| Computers, Engineering & Science | 56 (58.3%) | 40 (41.7%) |
| Computers & Mathematics | 7 (41.2%) | 10 (58.8%) |
| Architecture & Engineering | 21 (100.0%) | 0 (0.0%) |
| Life, Physical & Social Science | 28 (48.3%) | 30 (51.7%) |
| Community & Social Service | 216 (28.3%) | 547 (71.7%) |
| Education, Arts & Media | 30 (39.0%) | 47 (61.0%) |
| Legal Services & Support | 17 (100.0%) | 0 (0.0%) |
| Education Instruction & Library | 76 (14.2%) | 458 (85.8%) |
| Arts, Media & Entertainment | 93 (68.9%) | 42 (31.1%) |
| Health Diagnosing & Treating | 37 (11.0%) | 301 (89.0%) |
| Health Technologists | 21 (11.8%) | 157 (88.2%) |
| Total (Category) | 526 (30.5%) | 1,198 (69.5%) |
| Total (Overall) | 1,984 (40.3%) | 2,936 (59.7%) |
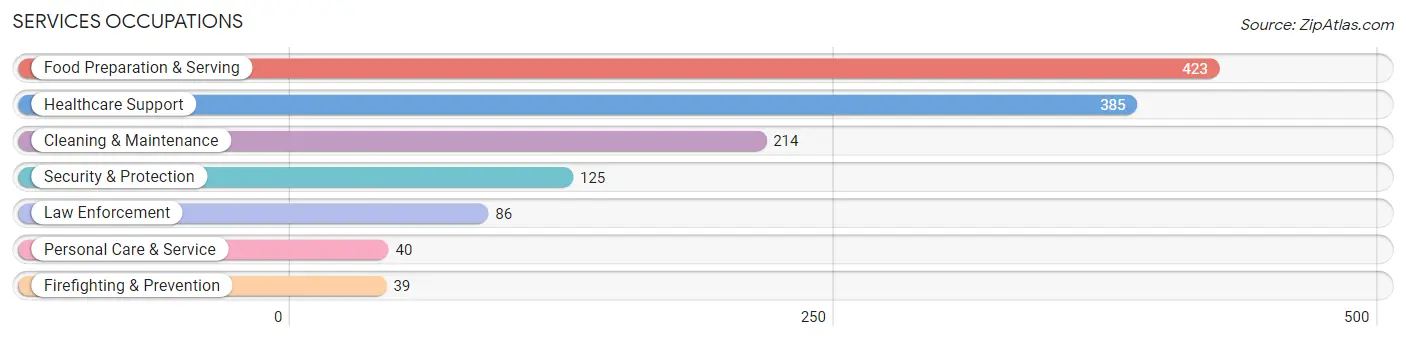
Services Occupations
The most common Services occupations in Natchez are Food Preparation & Serving (423 | 8.6%), Healthcare Support (385 | 7.8%), Cleaning & Maintenance (214 | 4.3%), Security & Protection (125 | 2.5%), and Law Enforcement (86 | 1.8%).
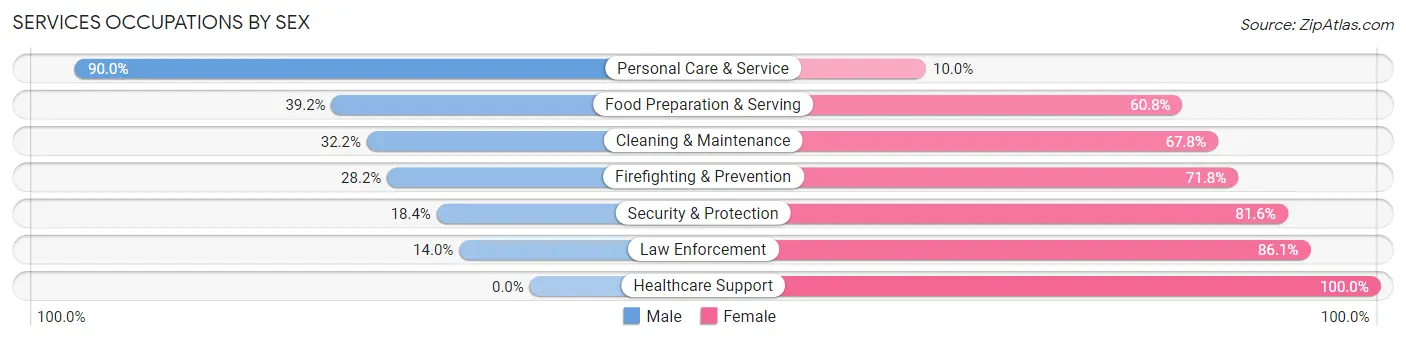
Services Occupations by Sex
Within the Services occupations in Natchez, the most male-oriented occupations are Personal Care & Service (90.0%), Food Preparation & Serving (39.2%), and Cleaning & Maintenance (32.2%), while the most female-oriented occupations are Healthcare Support (100.0%), Law Enforcement (86.1%), and Security & Protection (81.6%).
| Occupation | Male | Female |
| Healthcare Support | 0 (0.0%) | 385 (100.0%) |
| Security & Protection | 23 (18.4%) | 102 (81.6%) |
| Firefighting & Prevention | 11 (28.2%) | 28 (71.8%) |
| Law Enforcement | 12 (14.0%) | 74 (86.1%) |
| Food Preparation & Serving | 166 (39.2%) | 257 (60.8%) |
| Cleaning & Maintenance | 69 (32.2%) | 145 (67.8%) |
| Personal Care & Service | 36 (90.0%) | 4 (10.0%) |
| Total (Category) | 294 (24.8%) | 893 (75.2%) |
| Total (Overall) | 1,984 (40.3%) | 2,936 (59.7%) |
Sales and Office Occupations
The most common Sales and Office occupations in Natchez are Office & Administration (614 | 12.5%), and Sales & Related (359 | 7.3%).
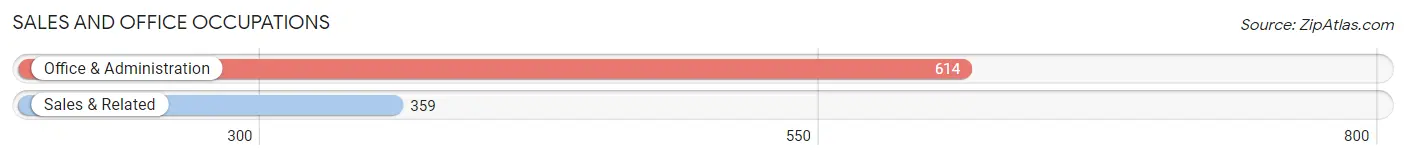
Sales and Office Occupations by Sex
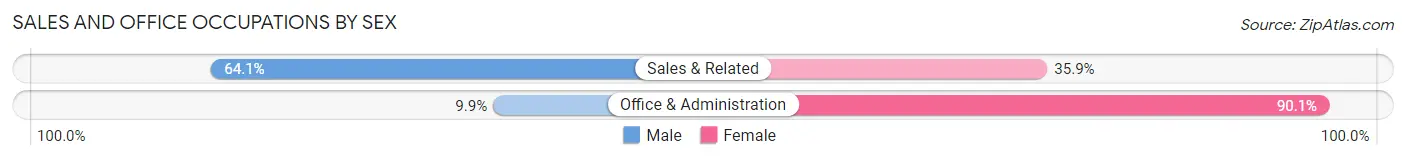
| Occupation | Male | Female |
| Sales & Related | 230 (64.1%) | 129 (35.9%) |
| Office & Administration | 61 (9.9%) | 553 (90.1%) |
| Total (Category) | 291 (29.9%) | 682 (70.1%) |
| Total (Overall) | 1,984 (40.3%) | 2,936 (59.7%) |
Natural Resources, Construction and Maintenance Occupations
The most common Natural Resources, Construction and Maintenance occupations in Natchez are Construction & Extraction (287 | 5.8%), Installation, Maintenance & Repair (56 | 1.1%), and Farming, Fishing & Forestry (22 | 0.4%).
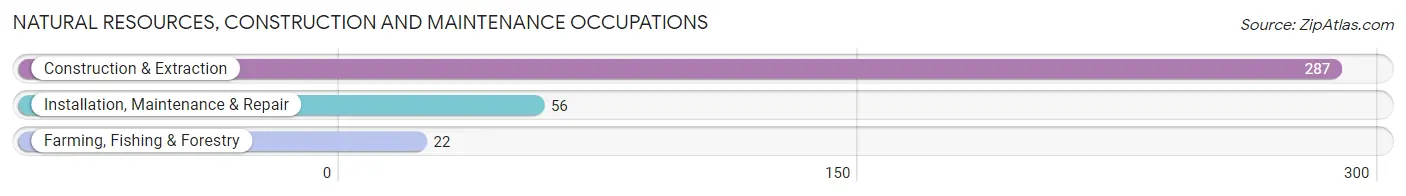
Natural Resources, Construction and Maintenance Occupations by Sex
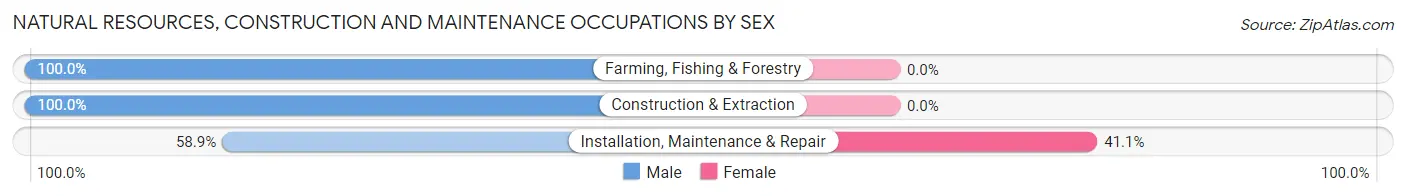
| Occupation | Male | Female |
| Farming, Fishing & Forestry | 22 (100.0%) | 0 (0.0%) |
| Construction & Extraction | 287 (100.0%) | 0 (0.0%) |
| Installation, Maintenance & Repair | 33 (58.9%) | 23 (41.1%) |
| Total (Category) | 342 (93.7%) | 23 (6.3%) |
| Total (Overall) | 1,984 (40.3%) | 2,936 (59.7%) |
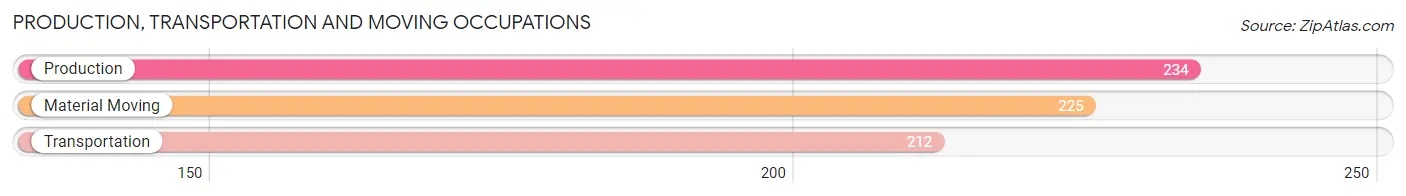
Production, Transportation and Moving Occupations
The most common Production, Transportation and Moving occupations in Natchez are Production (234 | 4.8%), Material Moving (225 | 4.6%), and Transportation (212 | 4.3%).
Production, Transportation and Moving Occupations by Sex
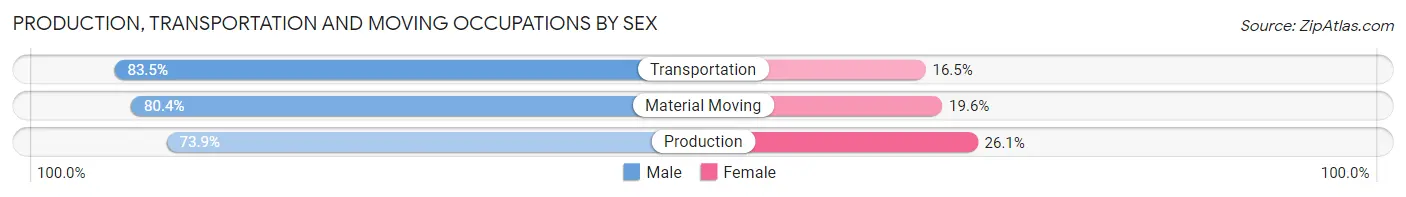
| Occupation | Male | Female |
| Production | 173 (73.9%) | 61 (26.1%) |
| Transportation | 177 (83.5%) | 35 (16.5%) |
| Material Moving | 181 (80.4%) | 44 (19.6%) |
| Total (Category) | 531 (79.1%) | 140 (20.9%) |
| Total (Overall) | 1,984 (40.3%) | 2,936 (59.7%) |
Employment Industries by Sex in Natchez
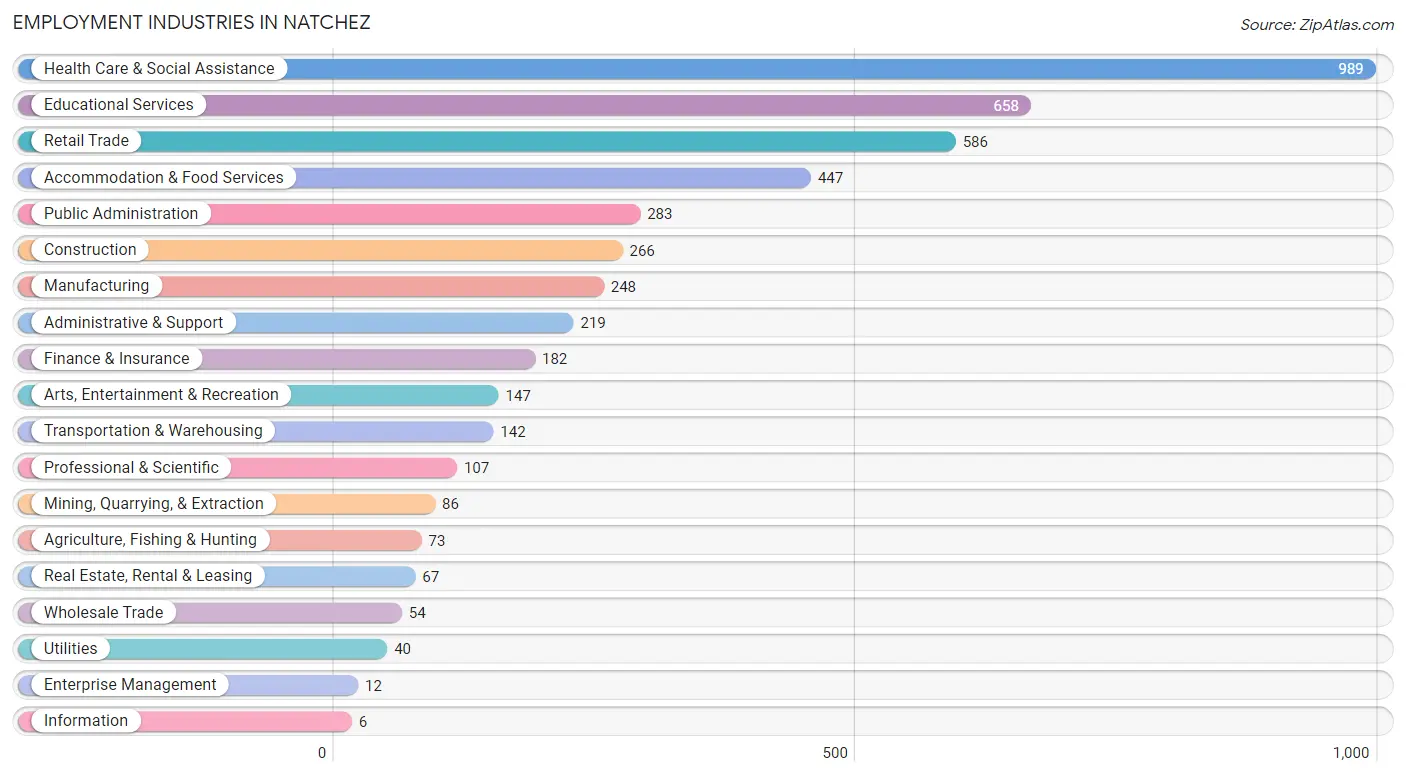
Employment Industries in Natchez
The major employment industries in Natchez include Health Care & Social Assistance (989 | 20.1%), Educational Services (658 | 13.4%), Retail Trade (586 | 11.9%), Accommodation & Food Services (447 | 9.1%), and Public Administration (283 | 5.8%).
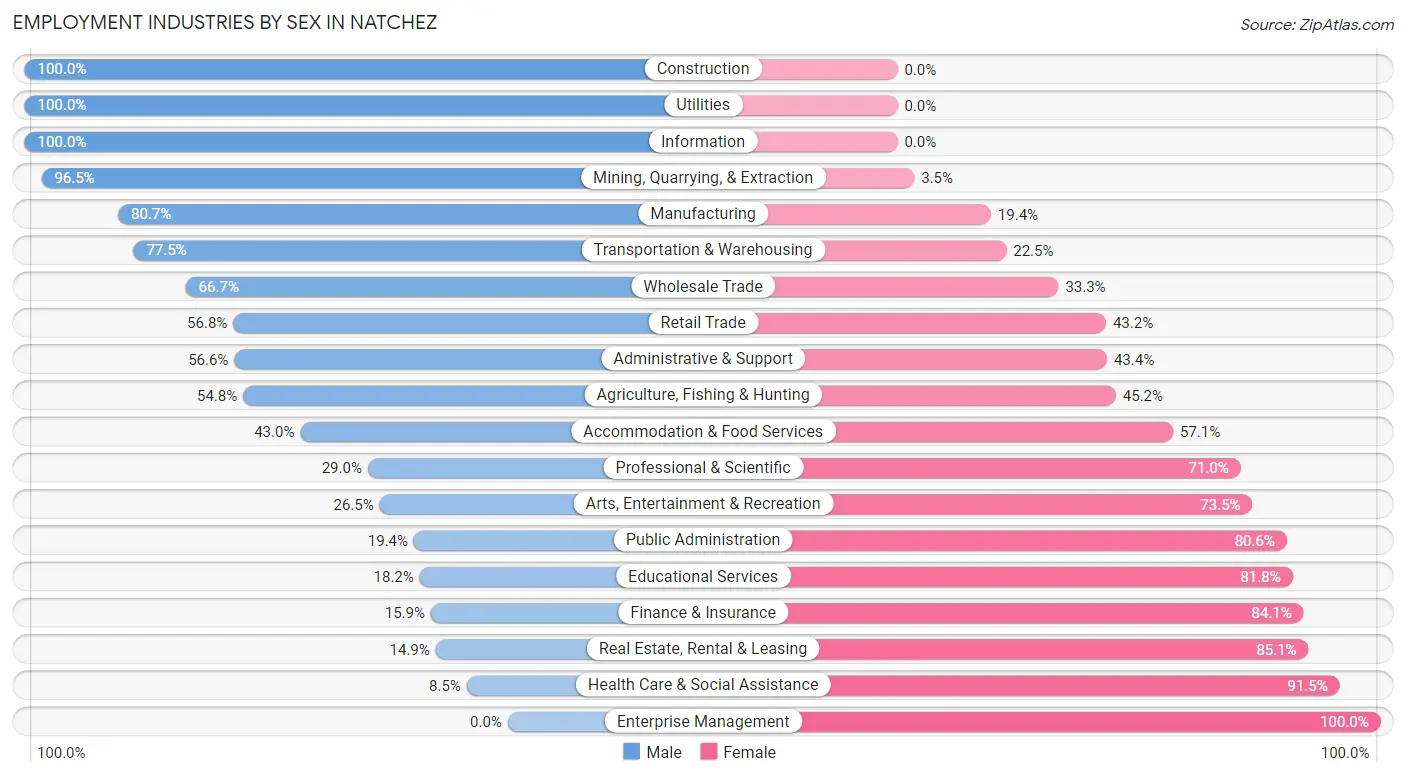
Employment Industries by Sex in Natchez
The Natchez industries that see more men than women are Construction (100.0%), Utilities (100.0%), and Information (100.0%), whereas the industries that tend to have a higher number of women are Enterprise Management (100.0%), Health Care & Social Assistance (91.5%), and Real Estate, Rental & Leasing (85.1%).
| Industry | Male | Female |
| Agriculture, Fishing & Hunting | 40 (54.8%) | 33 (45.2%) |
| Mining, Quarrying, & Extraction | 83 (96.5%) | 3 (3.5%) |
| Construction | 266 (100.0%) | 0 (0.0%) |
| Manufacturing | 200 (80.6%) | 48 (19.4%) |
| Wholesale Trade | 36 (66.7%) | 18 (33.3%) |
| Retail Trade | 333 (56.8%) | 253 (43.2%) |
| Transportation & Warehousing | 110 (77.5%) | 32 (22.5%) |
| Utilities | 40 (100.0%) | 0 (0.0%) |
| Information | 6 (100.0%) | 0 (0.0%) |
| Finance & Insurance | 29 (15.9%) | 153 (84.1%) |
| Real Estate, Rental & Leasing | 10 (14.9%) | 57 (85.1%) |
| Professional & Scientific | 31 (29.0%) | 76 (71.0%) |
| Enterprise Management | 0 (0.0%) | 12 (100.0%) |
| Administrative & Support | 124 (56.6%) | 95 (43.4%) |
| Educational Services | 120 (18.2%) | 538 (81.8%) |
| Health Care & Social Assistance | 84 (8.5%) | 905 (91.5%) |
| Arts, Entertainment & Recreation | 39 (26.5%) | 108 (73.5%) |
| Accommodation & Food Services | 192 (42.9%) | 255 (57.1%) |
| Public Administration | 55 (19.4%) | 228 (80.6%) |
| Total | 1,984 (40.3%) | 2,936 (59.7%) |
Education in Natchez
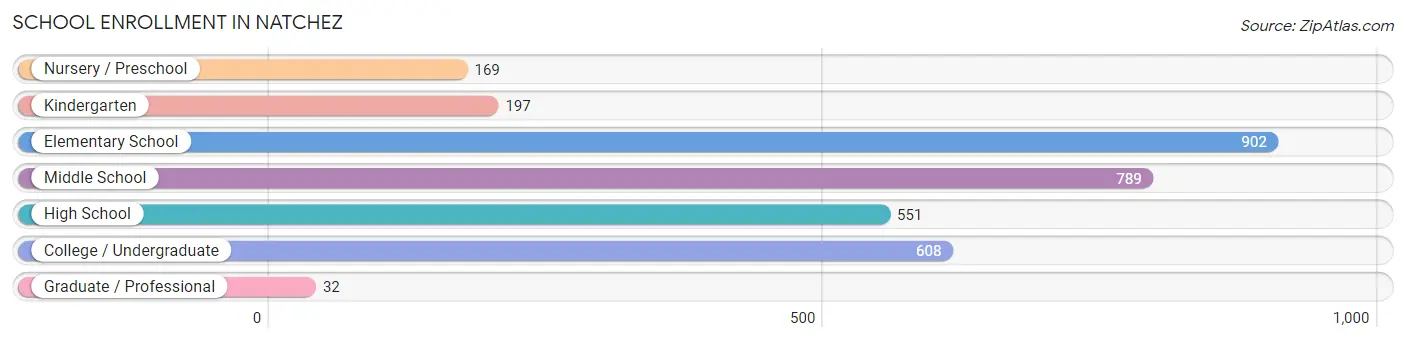
School Enrollment in Natchez
The most common levels of schooling among the 3,248 students in Natchez are elementary school (902 | 27.8%), middle school (789 | 24.3%), and college / undergraduate (608 | 18.7%).
| School Level | # Students | % Students |
| Nursery / Preschool | 169 | 5.2% |
| Kindergarten | 197 | 6.1% |
| Elementary School | 902 | 27.8% |
| Middle School | 789 | 24.3% |
| High School | 551 | 17.0% |
| College / Undergraduate | 608 | 18.7% |
| Graduate / Professional | 32 | 1.0% |
| Total | 3,248 | 100.0% |
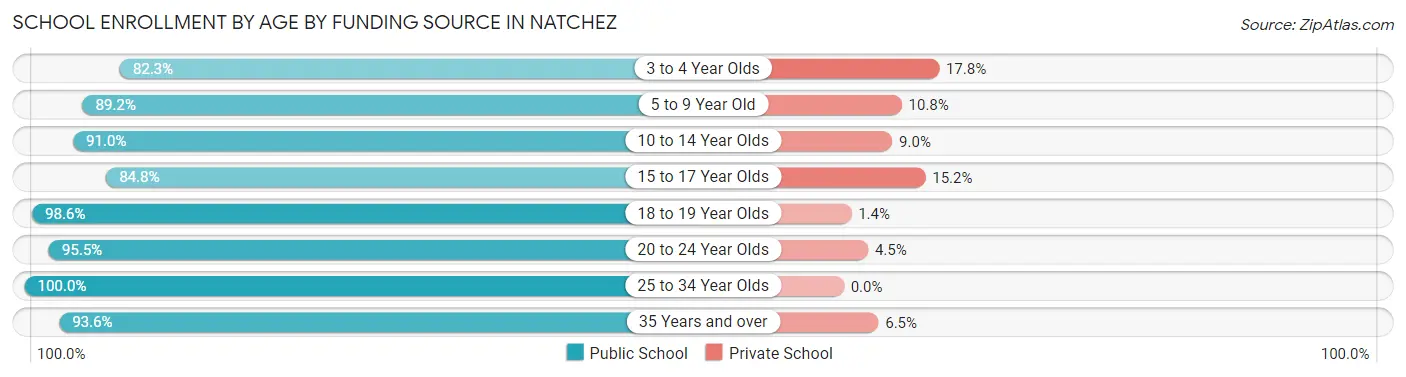
School Enrollment by Age by Funding Source in Natchez
Out of a total of 3,248 students who are enrolled in schools in Natchez, 322 (9.9%) attend a private institution, while the remaining 2,926 (90.1%) are enrolled in public schools. The age group of 3 to 4 year olds has the highest likelihood of being enrolled in private schools, with 30 (17.7% in the age bracket) enrolled. Conversely, the age group of 25 to 34 year olds has the lowest likelihood of being enrolled in a private school, with 33 (100.0% in the age bracket) attending a public institution.
| Age Bracket | Public School | Private School |
| 3 to 4 Year Olds | 139 (82.3%) | 30 (17.7%) |
| 5 to 9 Year Old | 852 (89.2%) | 103 (10.8%) |
| 10 to 14 Year Olds | 856 (91.0%) | 85 (9.0%) |
| 15 to 17 Year Olds | 446 (84.8%) | 80 (15.2%) |
| 18 to 19 Year Olds | 210 (98.6%) | 3 (1.4%) |
| 20 to 24 Year Olds | 274 (95.5%) | 13 (4.5%) |
| 25 to 34 Year Olds | 33 (100.0%) | 0 (0.0%) |
| 35 Years and over | 116 (93.5%) | 8 (6.5%) |
| Total | 2,926 (90.1%) | 322 (9.9%) |
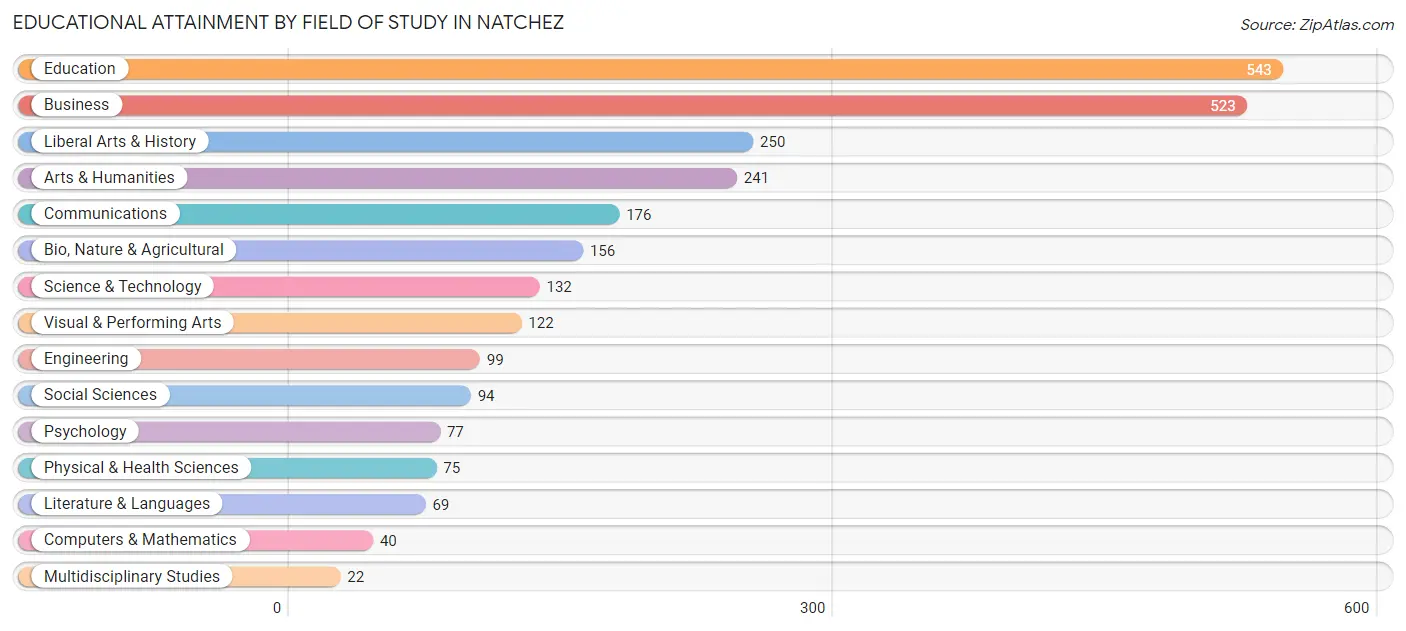
Educational Attainment by Field of Study in Natchez
Education (543 | 20.7%), business (523 | 20.0%), liberal arts & history (250 | 9.6%), arts & humanities (241 | 9.2%), and communications (176 | 6.7%) are the most common fields of study among 2,619 individuals in Natchez who have obtained a bachelor's degree or higher.
| Field of Study | # Graduates | % Graduates |
| Computers & Mathematics | 40 | 1.5% |
| Bio, Nature & Agricultural | 156 | 6.0% |
| Physical & Health Sciences | 75 | 2.9% |
| Psychology | 77 | 2.9% |
| Social Sciences | 94 | 3.6% |
| Engineering | 99 | 3.8% |
| Multidisciplinary Studies | 22 | 0.8% |
| Science & Technology | 132 | 5.0% |
| Business | 523 | 20.0% |
| Education | 543 | 20.7% |
| Literature & Languages | 69 | 2.6% |
| Liberal Arts & History | 250 | 9.6% |
| Visual & Performing Arts | 122 | 4.7% |
| Communications | 176 | 6.7% |
| Arts & Humanities | 241 | 9.2% |
| Total | 2,619 | 100.0% |
Transportation & Commute in Natchez
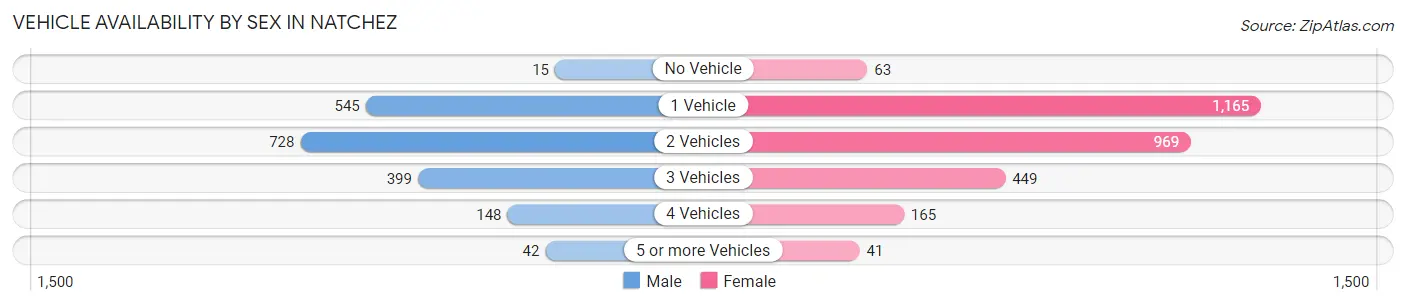
Vehicle Availability by Sex in Natchez
The most prevalent vehicle ownership categories in Natchez are males with 2 vehicles (728, accounting for 38.8%) and females with 2 vehicles (969, making up 25.5%).
| Vehicles Available | Male | Female |
| No Vehicle | 15 (0.8%) | 63 (2.2%) |
| 1 Vehicle | 545 (29.0%) | 1,165 (40.8%) |
| 2 Vehicles | 728 (38.8%) | 969 (34.0%) |
| 3 Vehicles | 399 (21.3%) | 449 (15.7%) |
| 4 Vehicles | 148 (7.9%) | 165 (5.8%) |
| 5 or more Vehicles | 42 (2.2%) | 41 (1.4%) |
| Total | 1,877 (100.0%) | 2,852 (100.0%) |
Commute Time in Natchez
The most frequently occuring commute durations in Natchez are 10 to 14 minutes (1,566 commuters, 34.3%), 5 to 9 minutes (1,132 commuters, 24.8%), and 15 to 19 minutes (617 commuters, 13.5%).
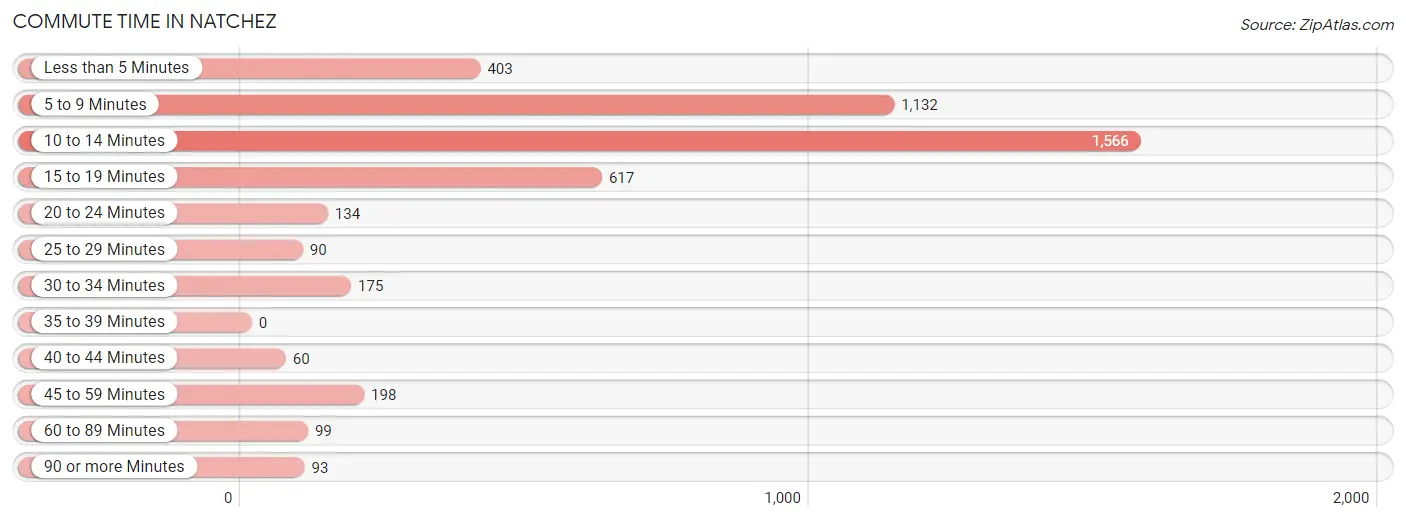
| Commute Time | # Commuters | % Commuters |
| Less than 5 Minutes | 403 | 8.8% |
| 5 to 9 Minutes | 1,132 | 24.8% |
| 10 to 14 Minutes | 1,566 | 34.3% |
| 15 to 19 Minutes | 617 | 13.5% |
| 20 to 24 Minutes | 134 | 2.9% |
| 25 to 29 Minutes | 90 | 2.0% |
| 30 to 34 Minutes | 175 | 3.8% |
| 35 to 39 Minutes | 0 | 0.0% |
| 40 to 44 Minutes | 60 | 1.3% |
| 45 to 59 Minutes | 198 | 4.3% |
| 60 to 89 Minutes | 99 | 2.2% |
| 90 or more Minutes | 93 | 2.0% |
Commute Time by Sex in Natchez
The most common commute times in Natchez are 10 to 14 minutes (727 commuters, 39.4%) for males and 10 to 14 minutes (839 commuters, 30.8%) for females.
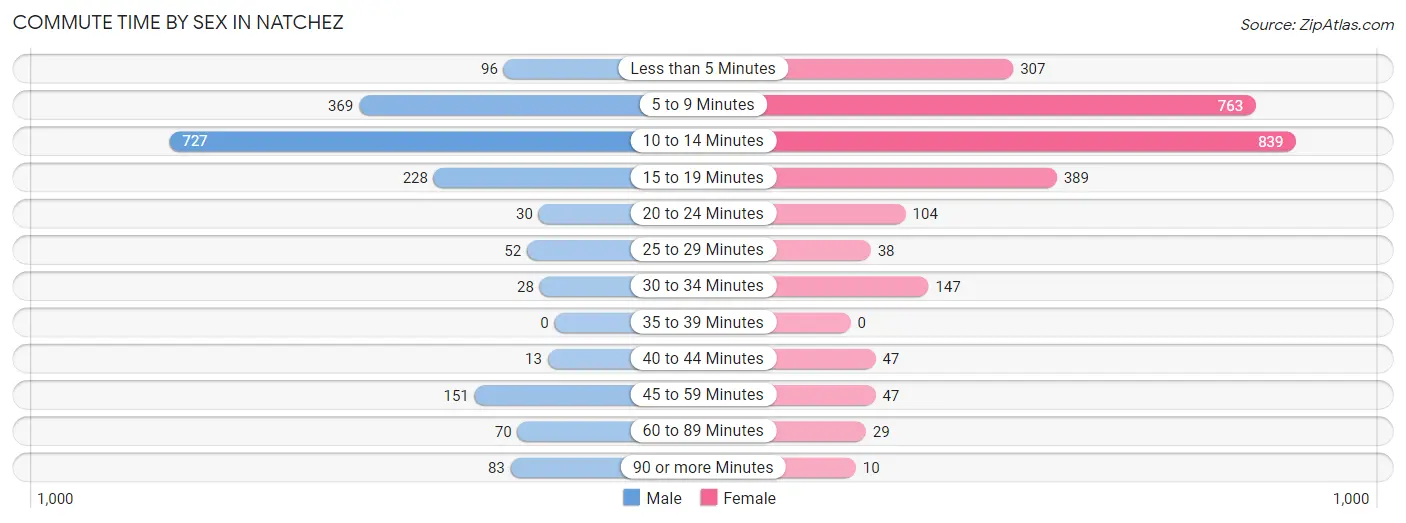
| Commute Time | Male | Female |
| Less than 5 Minutes | 96 (5.2%) | 307 (11.3%) |
| 5 to 9 Minutes | 369 (20.0%) | 763 (28.1%) |
| 10 to 14 Minutes | 727 (39.4%) | 839 (30.8%) |
| 15 to 19 Minutes | 228 (12.3%) | 389 (14.3%) |
| 20 to 24 Minutes | 30 (1.6%) | 104 (3.8%) |
| 25 to 29 Minutes | 52 (2.8%) | 38 (1.4%) |
| 30 to 34 Minutes | 28 (1.5%) | 147 (5.4%) |
| 35 to 39 Minutes | 0 (0.0%) | 0 (0.0%) |
| 40 to 44 Minutes | 13 (0.7%) | 47 (1.7%) |
| 45 to 59 Minutes | 151 (8.2%) | 47 (1.7%) |
| 60 to 89 Minutes | 70 (3.8%) | 29 (1.1%) |
| 90 or more Minutes | 83 (4.5%) | 10 (0.4%) |
Time of Departure to Work by Sex in Natchez
The most frequent times of departure to work in Natchez are 7:30 AM to 7:59 AM (596, 32.3%) for males and 7:30 AM to 7:59 AM (762, 28.0%) for females.
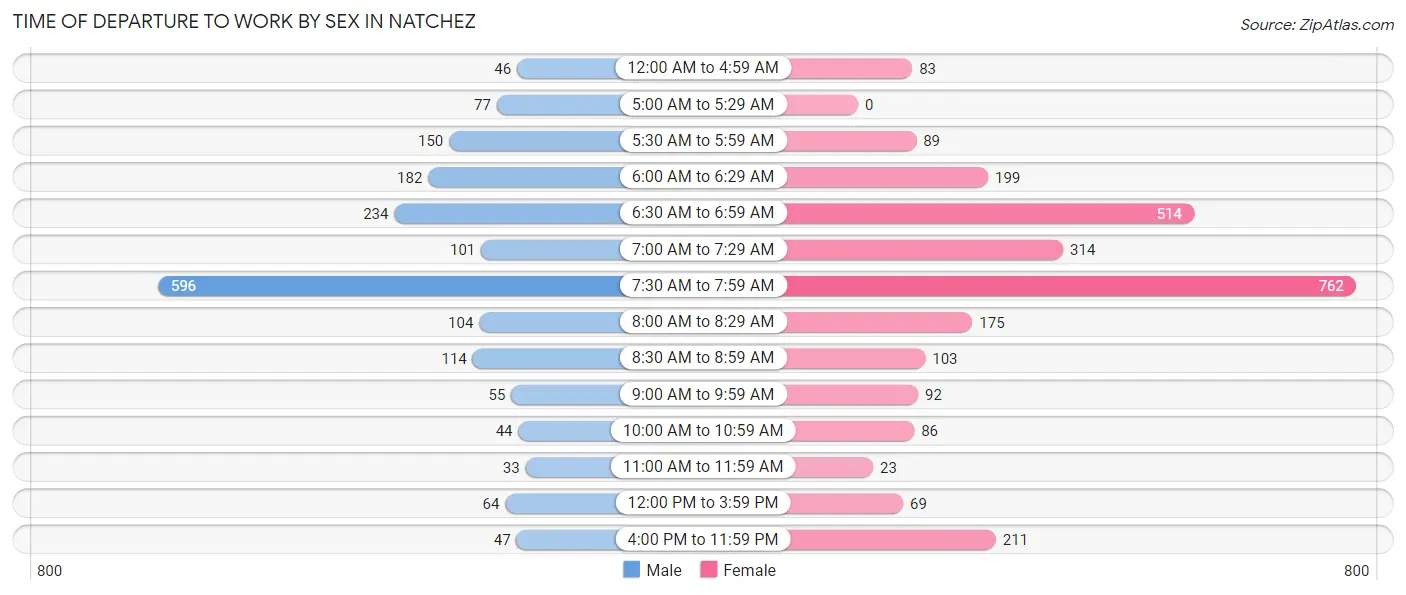
| Time of Departure | Male | Female |
| 12:00 AM to 4:59 AM | 46 (2.5%) | 83 (3.0%) |
| 5:00 AM to 5:29 AM | 77 (4.2%) | 0 (0.0%) |
| 5:30 AM to 5:59 AM | 150 (8.1%) | 89 (3.3%) |
| 6:00 AM to 6:29 AM | 182 (9.9%) | 199 (7.3%) |
| 6:30 AM to 6:59 AM | 234 (12.7%) | 514 (18.9%) |
| 7:00 AM to 7:29 AM | 101 (5.5%) | 314 (11.5%) |
| 7:30 AM to 7:59 AM | 596 (32.3%) | 762 (28.0%) |
| 8:00 AM to 8:29 AM | 104 (5.6%) | 175 (6.4%) |
| 8:30 AM to 8:59 AM | 114 (6.2%) | 103 (3.8%) |
| 9:00 AM to 9:59 AM | 55 (3.0%) | 92 (3.4%) |
| 10:00 AM to 10:59 AM | 44 (2.4%) | 86 (3.2%) |
| 11:00 AM to 11:59 AM | 33 (1.8%) | 23 (0.9%) |
| 12:00 PM to 3:59 PM | 64 (3.5%) | 69 (2.5%) |
| 4:00 PM to 11:59 PM | 47 (2.5%) | 211 (7.8%) |
| Total | 1,847 (100.0%) | 2,720 (100.0%) |
Housing Occupancy in Natchez
Occupancy by Ownership in Natchez
Of the total 5,855 dwellings in Natchez, owner-occupied units account for 3,277 (56.0%), while renter-occupied units make up 2,578 (44.0%).
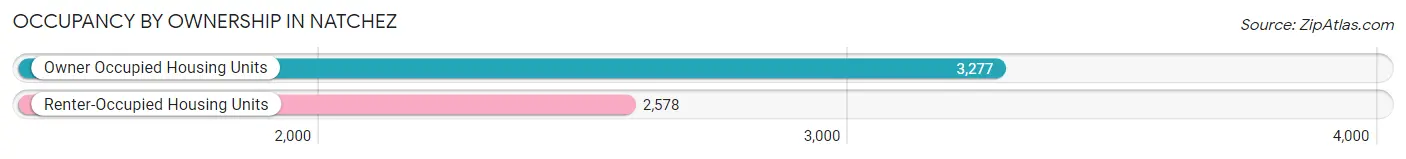
| Occupancy | # Housing Units | % Housing Units |
| Owner Occupied Housing Units | 3,277 | 56.0% |
| Renter-Occupied Housing Units | 2,578 | 44.0% |
| Total Occupied Housing Units | 5,855 | 100.0% |
Occupancy by Household Size in Natchez
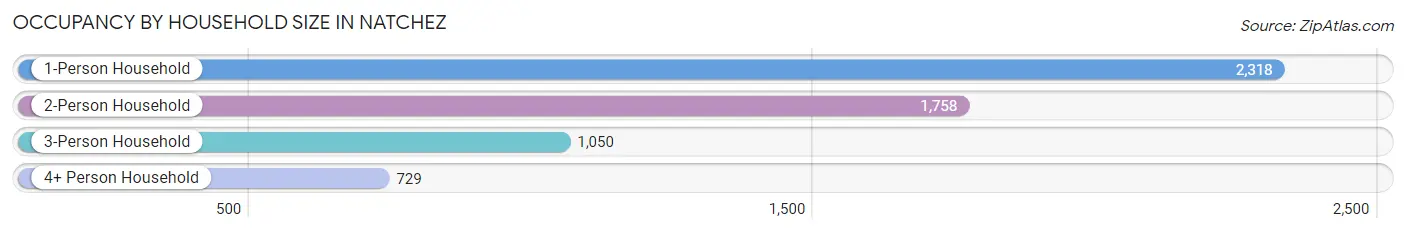
| Household Size | # Housing Units | % Housing Units |
| 1-Person Household | 2,318 | 39.6% |
| 2-Person Household | 1,758 | 30.0% |
| 3-Person Household | 1,050 | 17.9% |
| 4+ Person Household | 729 | 12.4% |
| Total Housing Units | 5,855 | 100.0% |
Occupancy by Ownership by Household Size in Natchez
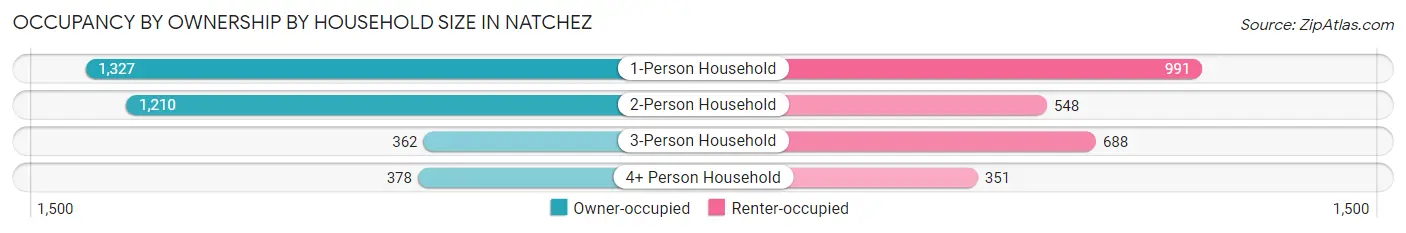
| Household Size | Owner-occupied | Renter-occupied |
| 1-Person Household | 1,327 (57.3%) | 991 (42.7%) |
| 2-Person Household | 1,210 (68.8%) | 548 (31.2%) |
| 3-Person Household | 362 (34.5%) | 688 (65.5%) |
| 4+ Person Household | 378 (51.8%) | 351 (48.1%) |
| Total Housing Units | 3,277 (56.0%) | 2,578 (44.0%) |
Occupancy by Educational Attainment in Natchez
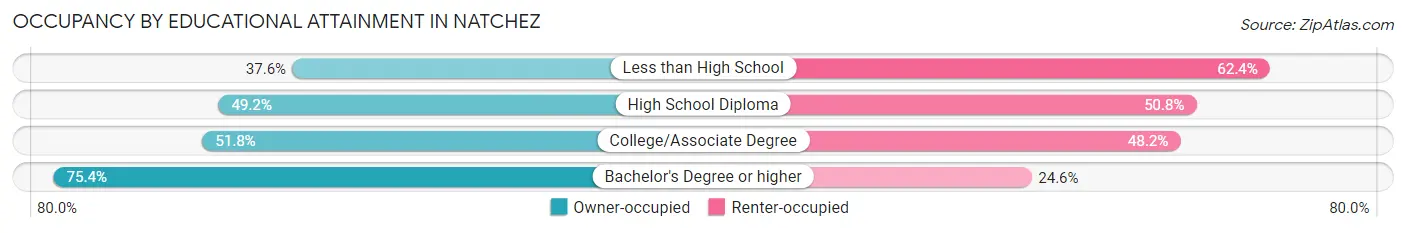
| Household Size | Owner-occupied | Renter-occupied |
| Less than High School | 282 (37.6%) | 468 (62.4%) |
| High School Diploma | 812 (49.2%) | 837 (50.8%) |
| College/Associate Degree | 927 (51.8%) | 863 (48.2%) |
| Bachelor's Degree or higher | 1,256 (75.4%) | 410 (24.6%) |
Occupancy by Age of Householder in Natchez
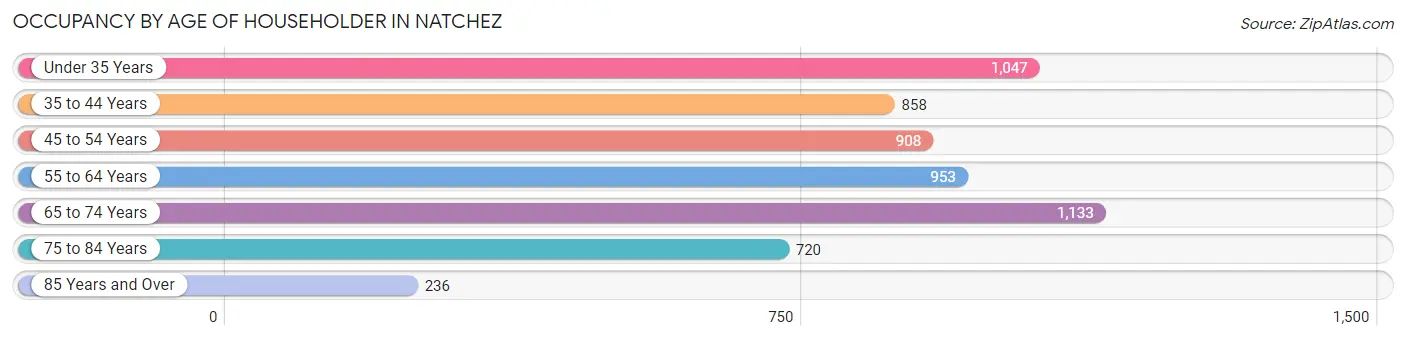
| Age Bracket | # Households | % Households |
| Under 35 Years | 1,047 | 17.9% |
| 35 to 44 Years | 858 | 14.6% |
| 45 to 54 Years | 908 | 15.5% |
| 55 to 64 Years | 953 | 16.3% |
| 65 to 74 Years | 1,133 | 19.4% |
| 75 to 84 Years | 720 | 12.3% |
| 85 Years and Over | 236 | 4.0% |
| Total | 5,855 | 100.0% |
Housing Finances in Natchez
Median Income by Occupancy in Natchez
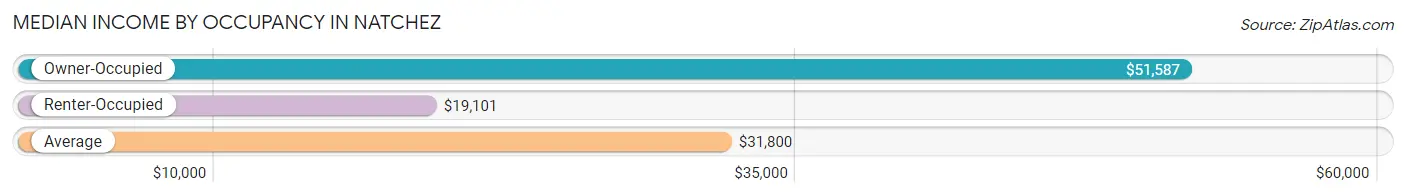
| Occupancy Type | # Households | Median Income |
| Owner-Occupied | 3,277 (56.0%) | $51,587 |
| Renter-Occupied | 2,578 (44.0%) | $19,101 |
| Average | 5,855 (100.0%) | $31,800 |
Occupancy by Householder Income Bracket in Natchez
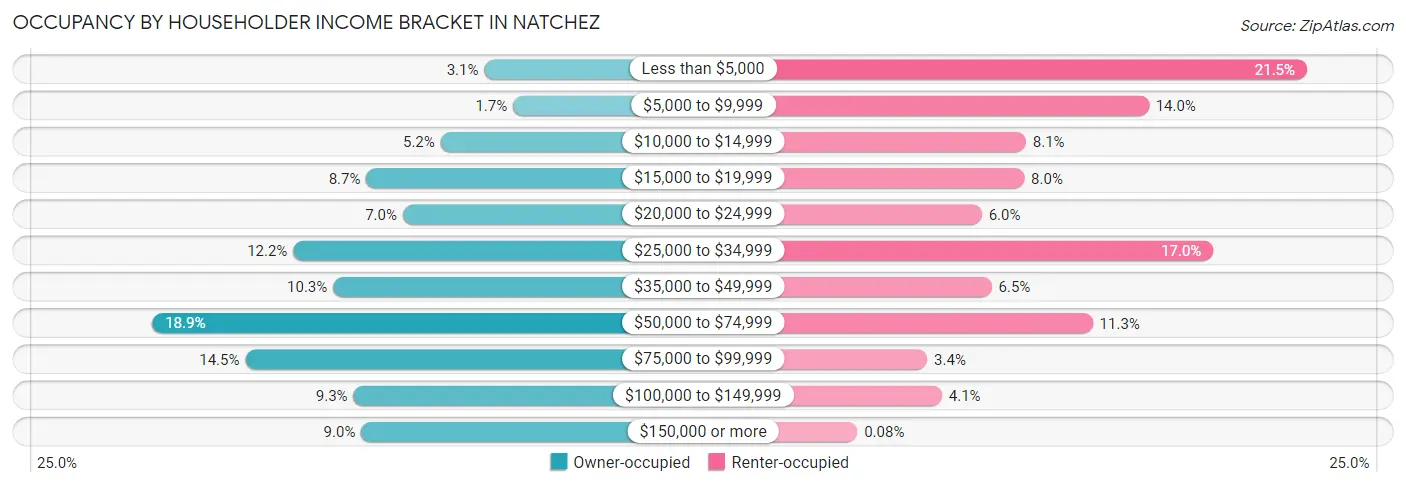
| Income Bracket | Owner-occupied | Renter-occupied |
| Less than $5,000 | 102 (3.1%) | 554 (21.5%) |
| $5,000 to $9,999 | 57 (1.7%) | 360 (14.0%) |
| $10,000 to $14,999 | 170 (5.2%) | 209 (8.1%) |
| $15,000 to $19,999 | 286 (8.7%) | 207 (8.0%) |
| $20,000 to $24,999 | 229 (7.0%) | 155 (6.0%) |
| $25,000 to $34,999 | 400 (12.2%) | 439 (17.0%) |
| $35,000 to $49,999 | 338 (10.3%) | 167 (6.5%) |
| $50,000 to $74,999 | 620 (18.9%) | 291 (11.3%) |
| $75,000 to $99,999 | 475 (14.5%) | 88 (3.4%) |
| $100,000 to $149,999 | 306 (9.3%) | 106 (4.1%) |
| $150,000 or more | 294 (9.0%) | 2 (0.1%) |
| Total | 3,277 (100.0%) | 2,578 (100.0%) |
Monthly Housing Cost Tiers in Natchez
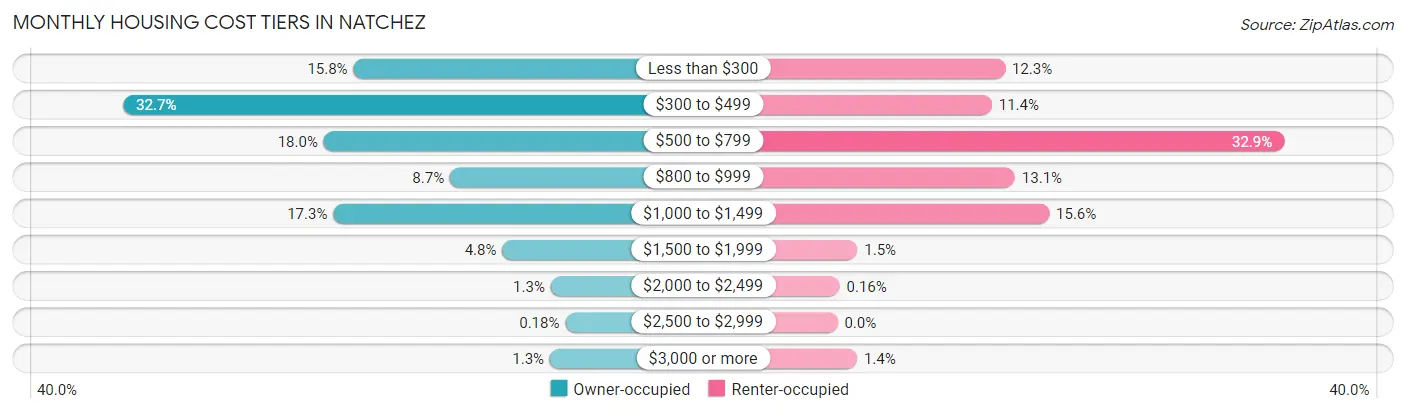
| Monthly Cost | Owner-occupied | Renter-occupied |
| Less than $300 | 517 (15.8%) | 318 (12.3%) |
| $300 to $499 | 1,073 (32.7%) | 293 (11.4%) |
| $500 to $799 | 589 (18.0%) | 848 (32.9%) |
| $800 to $999 | 284 (8.7%) | 337 (13.1%) |
| $1,000 to $1,499 | 566 (17.3%) | 402 (15.6%) |
| $1,500 to $1,999 | 158 (4.8%) | 38 (1.5%) |
| $2,000 to $2,499 | 41 (1.3%) | 4 (0.2%) |
| $2,500 to $2,999 | 6 (0.2%) | 0 (0.0%) |
| $3,000 or more | 43 (1.3%) | 37 (1.4%) |
| Total | 3,277 (100.0%) | 2,578 (100.0%) |
Physical Housing Characteristics in Natchez
Housing Structures in Natchez
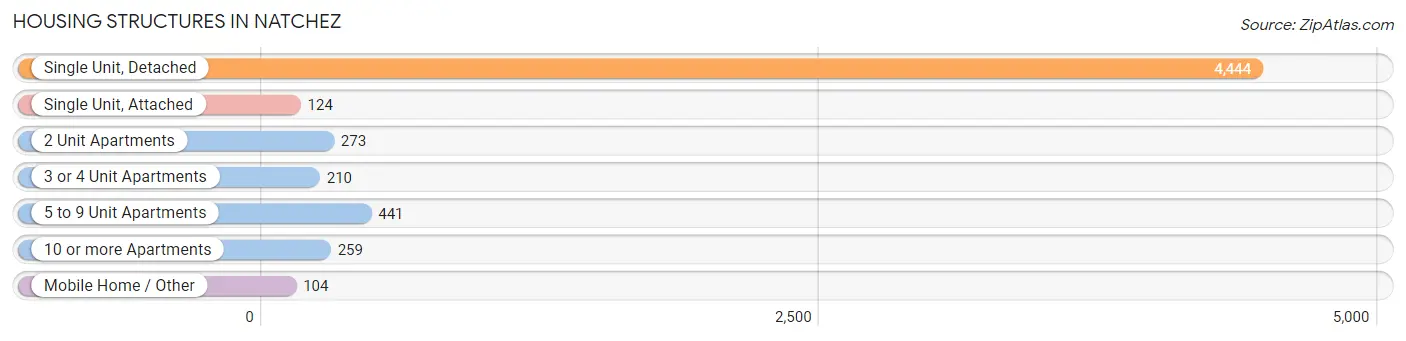
| Structure Type | # Housing Units | % Housing Units |
| Single Unit, Detached | 4,444 | 75.9% |
| Single Unit, Attached | 124 | 2.1% |
| 2 Unit Apartments | 273 | 4.7% |
| 3 or 4 Unit Apartments | 210 | 3.6% |
| 5 to 9 Unit Apartments | 441 | 7.5% |
| 10 or more Apartments | 259 | 4.4% |
| Mobile Home / Other | 104 | 1.8% |
| Total | 5,855 | 100.0% |
Housing Structures by Occupancy in Natchez
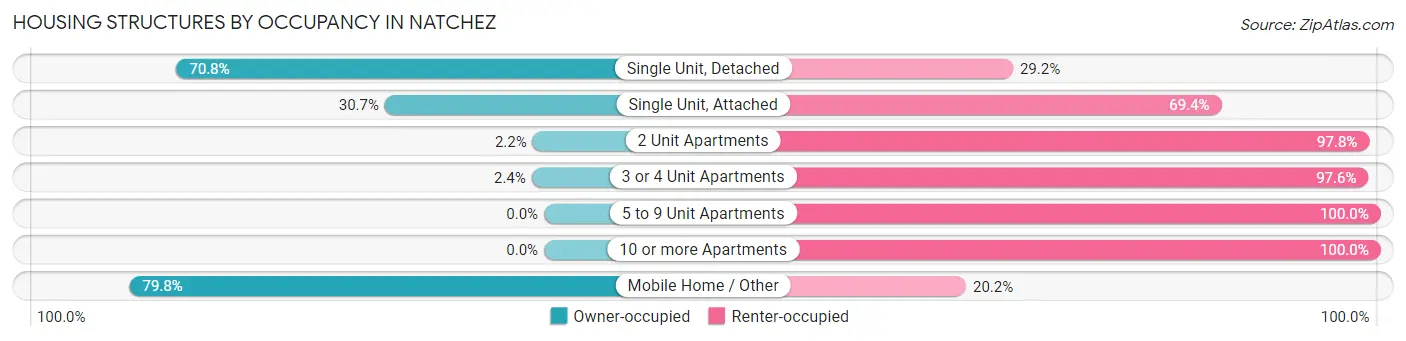
| Structure Type | Owner-occupied | Renter-occupied |
| Single Unit, Detached | 3,145 (70.8%) | 1,299 (29.2%) |
| Single Unit, Attached | 38 (30.6%) | 86 (69.4%) |
| 2 Unit Apartments | 6 (2.2%) | 267 (97.8%) |
| 3 or 4 Unit Apartments | 5 (2.4%) | 205 (97.6%) |
| 5 to 9 Unit Apartments | 0 (0.0%) | 441 (100.0%) |
| 10 or more Apartments | 0 (0.0%) | 259 (100.0%) |
| Mobile Home / Other | 83 (79.8%) | 21 (20.2%) |
| Total | 3,277 (56.0%) | 2,578 (44.0%) |
Housing Structures by Number of Rooms in Natchez
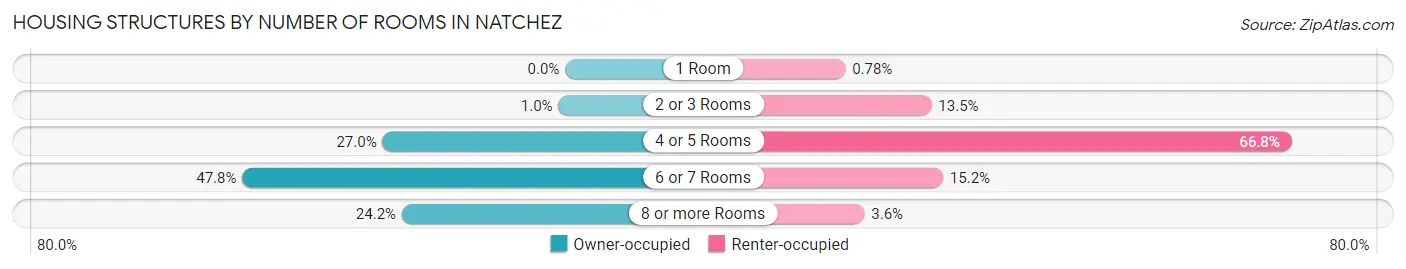
| Number of Rooms | Owner-occupied | Renter-occupied |
| 1 Room | 0 (0.0%) | 20 (0.8%) |
| 2 or 3 Rooms | 33 (1.0%) | 349 (13.5%) |
| 4 or 5 Rooms | 886 (27.0%) | 1,723 (66.8%) |
| 6 or 7 Rooms | 1,566 (47.8%) | 393 (15.2%) |
| 8 or more Rooms | 792 (24.2%) | 93 (3.6%) |
| Total | 3,277 (100.0%) | 2,578 (100.0%) |
Housing Structure by Heating Type in Natchez
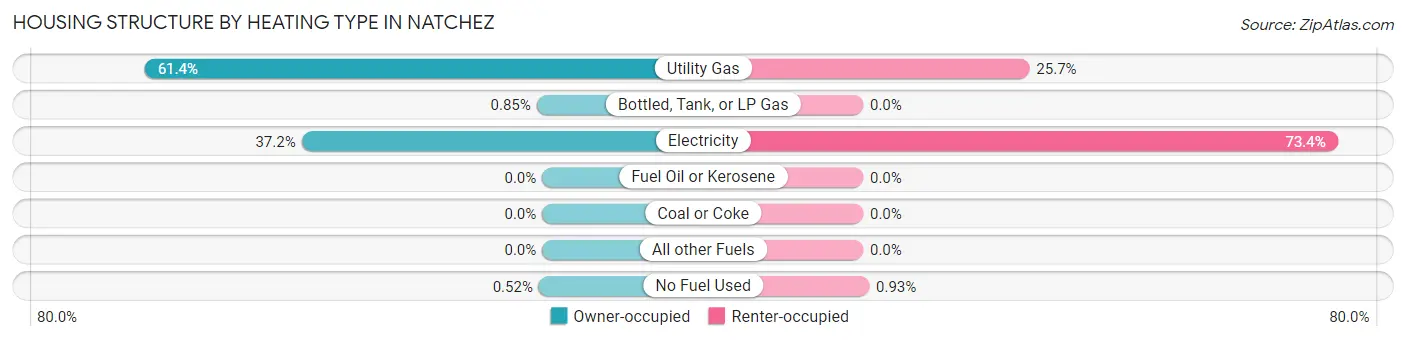
| Heating Type | Owner-occupied | Renter-occupied |
| Utility Gas | 2,013 (61.4%) | 663 (25.7%) |
| Bottled, Tank, or LP Gas | 28 (0.9%) | 0 (0.0%) |
| Electricity | 1,219 (37.2%) | 1,891 (73.4%) |
| Fuel Oil or Kerosene | 0 (0.0%) | 0 (0.0%) |
| Coal or Coke | 0 (0.0%) | 0 (0.0%) |
| All other Fuels | 0 (0.0%) | 0 (0.0%) |
| No Fuel Used | 17 (0.5%) | 24 (0.9%) |
| Total | 3,277 (100.0%) | 2,578 (100.0%) |
Household Vehicle Usage in Natchez
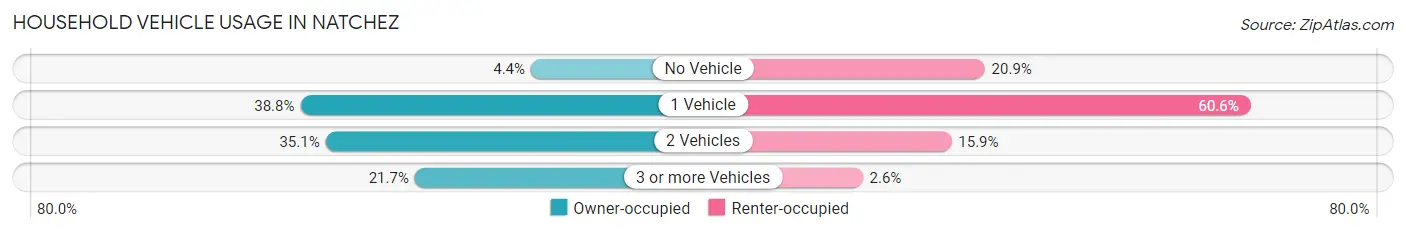
| Vehicles per Household | Owner-occupied | Renter-occupied |
| No Vehicle | 144 (4.4%) | 538 (20.9%) |
| 1 Vehicle | 1,272 (38.8%) | 1,562 (60.6%) |
| 2 Vehicles | 1,149 (35.1%) | 410 (15.9%) |
| 3 or more Vehicles | 712 (21.7%) | 68 (2.6%) |
| Total | 3,277 (100.0%) | 2,578 (100.0%) |
Real Estate & Mortgages in Natchez
Real Estate and Mortgage Overview in Natchez
| Characteristic | Without Mortgage | With Mortgage |
| Housing Units | 2,124 | 1,153 |
| Median Property Value | $98,300 | $142,100 |
| Median Household Income | $42,096 | $124 |
| Monthly Housing Costs | $413 | $25 |
| Real Estate Taxes | $890 | $138 |
Property Value by Mortgage Status in Natchez
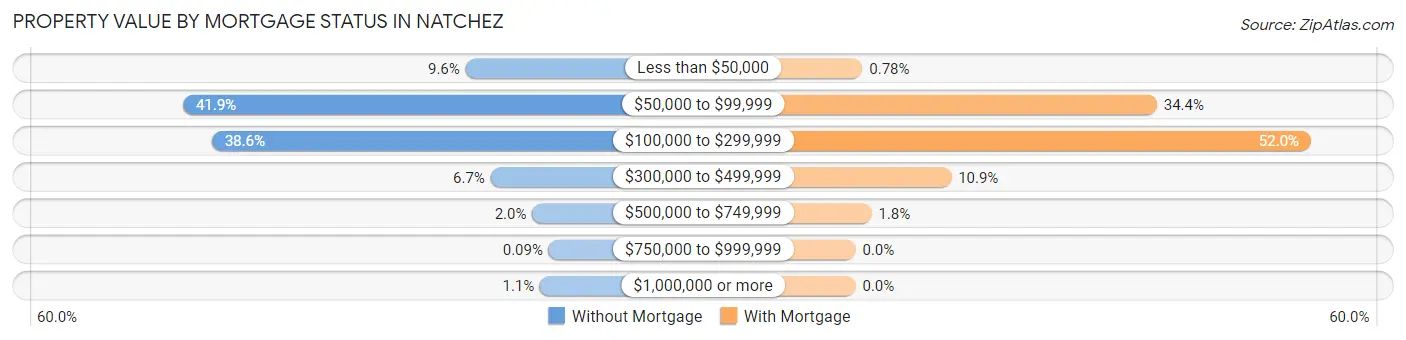
| Property Value | Without Mortgage | With Mortgage |
| Less than $50,000 | 204 (9.6%) | 9 (0.8%) |
| $50,000 to $99,999 | 890 (41.9%) | 397 (34.4%) |
| $100,000 to $299,999 | 820 (38.6%) | 600 (52.0%) |
| $300,000 to $499,999 | 143 (6.7%) | 126 (10.9%) |
| $500,000 to $749,999 | 42 (2.0%) | 21 (1.8%) |
| $750,000 to $999,999 | 2 (0.1%) | 0 (0.0%) |
| $1,000,000 or more | 23 (1.1%) | 0 (0.0%) |
| Total | 2,124 (100.0%) | 1,153 (100.0%) |
Household Income by Mortgage Status in Natchez
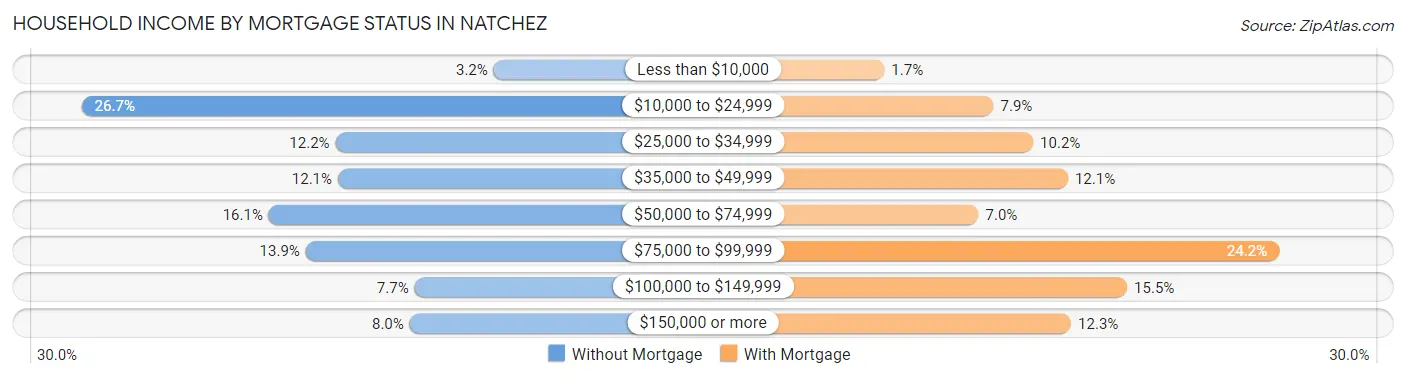
| Household Income | Without Mortgage | With Mortgage |
| Less than $10,000 | 68 (3.2%) | 19 (1.7%) |
| $10,000 to $24,999 | 568 (26.7%) | 91 (7.9%) |
| $25,000 to $34,999 | 260 (12.2%) | 117 (10.2%) |
| $35,000 to $49,999 | 257 (12.1%) | 140 (12.1%) |
| $50,000 to $74,999 | 341 (16.1%) | 81 (7.0%) |
| $75,000 to $99,999 | 296 (13.9%) | 279 (24.2%) |
| $100,000 to $149,999 | 164 (7.7%) | 179 (15.5%) |
| $150,000 or more | 170 (8.0%) | 142 (12.3%) |
| Total | 2,124 (100.0%) | 1,153 (100.0%) |
Property Value to Household Income Ratio in Natchez
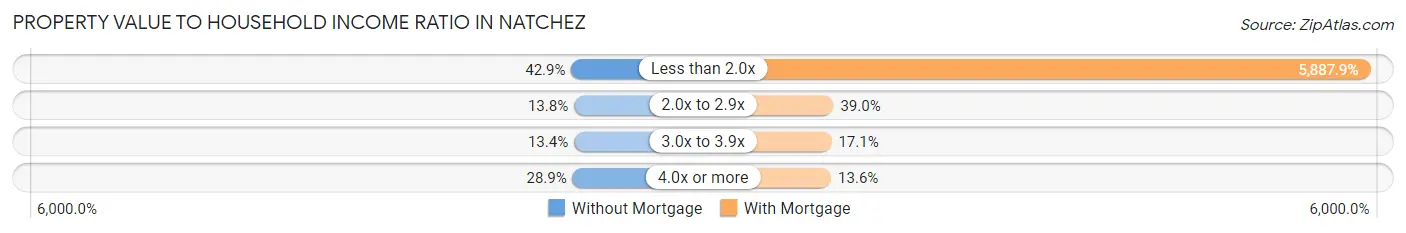
| Value-to-Income Ratio | Without Mortgage | With Mortgage |
| Less than 2.0x | 911 (42.9%) | 67,887 (5,887.9%) |
| 2.0x to 2.9x | 292 (13.8%) | 450 (39.0%) |
| 3.0x to 3.9x | 285 (13.4%) | 197 (17.1%) |
| 4.0x or more | 614 (28.9%) | 157 (13.6%) |
| Total | 2,124 (100.0%) | 1,153 (100.0%) |
Real Estate Taxes by Mortgage Status in Natchez
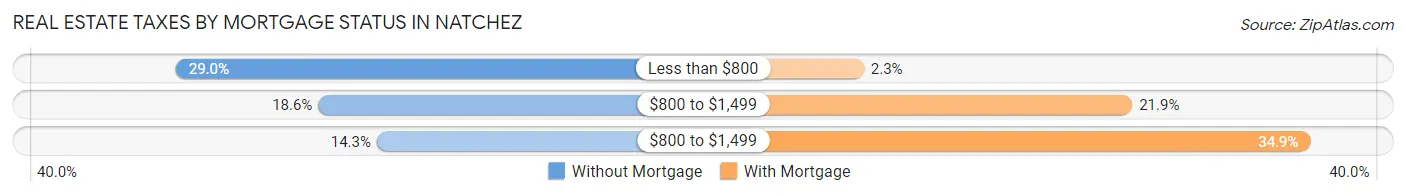
| Property Taxes | Without Mortgage | With Mortgage |
| Less than $800 | 615 (28.9%) | 26 (2.2%) |
| $800 to $1,499 | 394 (18.5%) | 252 (21.9%) |
| $800 to $1,499 | 303 (14.3%) | 402 (34.9%) |
| Total | 2,124 (100.0%) | 1,153 (100.0%) |
Health & Disability in Natchez
Health Insurance Coverage by Age in Natchez
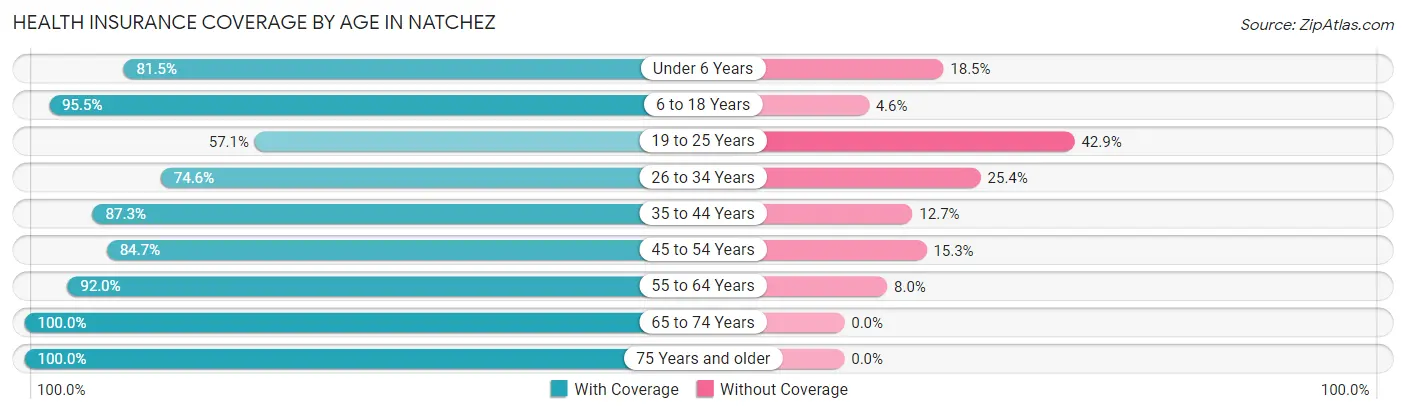
| Age Bracket | With Coverage | Without Coverage |
| Under 6 Years | 962 (81.5%) | 218 (18.5%) |
| 6 to 18 Years | 2,664 (95.5%) | 127 (4.5%) |
| 19 to 25 Years | 674 (57.1%) | 507 (42.9%) |
| 26 to 34 Years | 974 (74.6%) | 332 (25.4%) |
| 35 to 44 Years | 1,231 (87.3%) | 179 (12.7%) |
| 45 to 54 Years | 1,360 (84.7%) | 246 (15.3%) |
| 55 to 64 Years | 1,500 (92.0%) | 130 (8.0%) |
| 65 to 74 Years | 1,610 (100.0%) | 0 (0.0%) |
| 75 Years and older | 1,322 (100.0%) | 0 (0.0%) |
| Total | 12,297 (87.6%) | 1,739 (12.4%) |
Health Insurance Coverage by Citizenship Status in Natchez
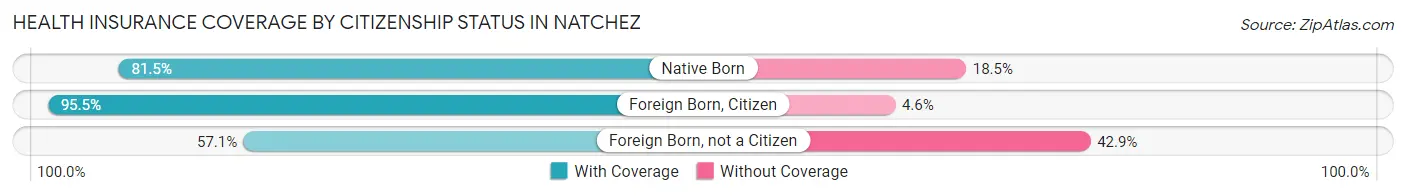
| Citizenship Status | With Coverage | Without Coverage |
| Native Born | 962 (81.5%) | 218 (18.5%) |
| Foreign Born, Citizen | 2,664 (95.5%) | 127 (4.5%) |
| Foreign Born, not a Citizen | 674 (57.1%) | 507 (42.9%) |
Health Insurance Coverage by Household Income in Natchez
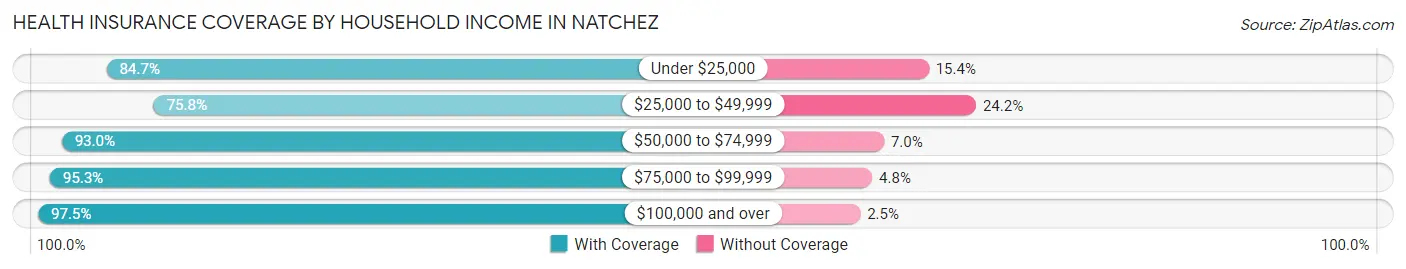
| Household Income | With Coverage | Without Coverage |
| Under $25,000 | 3,833 (84.7%) | 695 (15.3%) |
| $25,000 to $49,999 | 2,296 (75.8%) | 733 (24.2%) |
| $50,000 to $74,999 | 2,408 (93.0%) | 180 (7.0%) |
| $75,000 to $99,999 | 1,445 (95.3%) | 72 (4.8%) |
| $100,000 and over | 2,283 (97.5%) | 59 (2.5%) |
Public vs Private Health Insurance Coverage by Age in Natchez
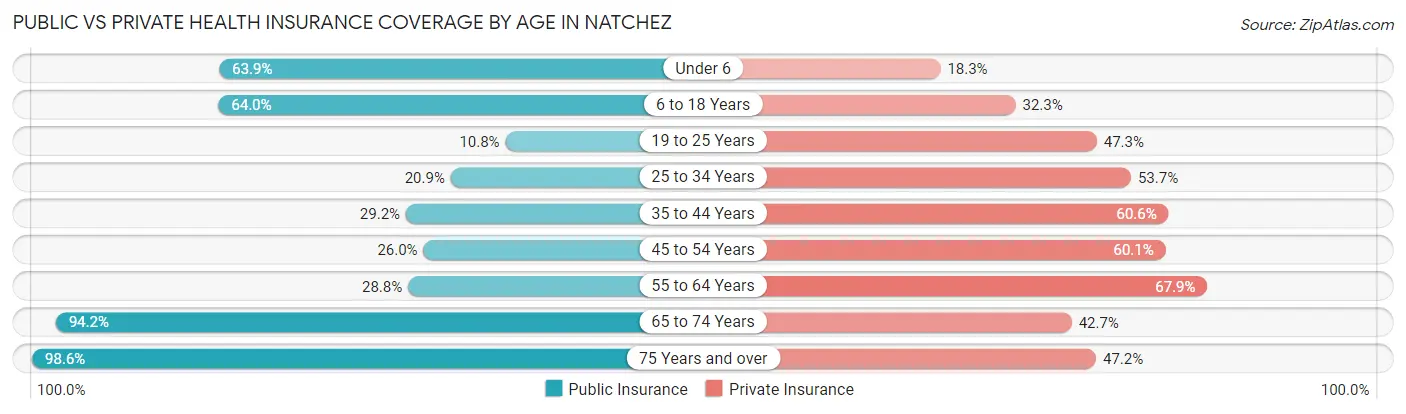
| Age Bracket | Public Insurance | Private Insurance |
| Under 6 | 754 (63.9%) | 216 (18.3%) |
| 6 to 18 Years | 1,787 (64.0%) | 900 (32.3%) |
| 19 to 25 Years | 127 (10.7%) | 559 (47.3%) |
| 25 to 34 Years | 273 (20.9%) | 701 (53.7%) |
| 35 to 44 Years | 412 (29.2%) | 855 (60.6%) |
| 45 to 54 Years | 417 (26.0%) | 965 (60.1%) |
| 55 to 64 Years | 470 (28.8%) | 1,106 (67.8%) |
| 65 to 74 Years | 1,517 (94.2%) | 687 (42.7%) |
| 75 Years and over | 1,304 (98.6%) | 624 (47.2%) |
| Total | 7,061 (50.3%) | 6,613 (47.1%) |
Disability Status by Sex by Age in Natchez
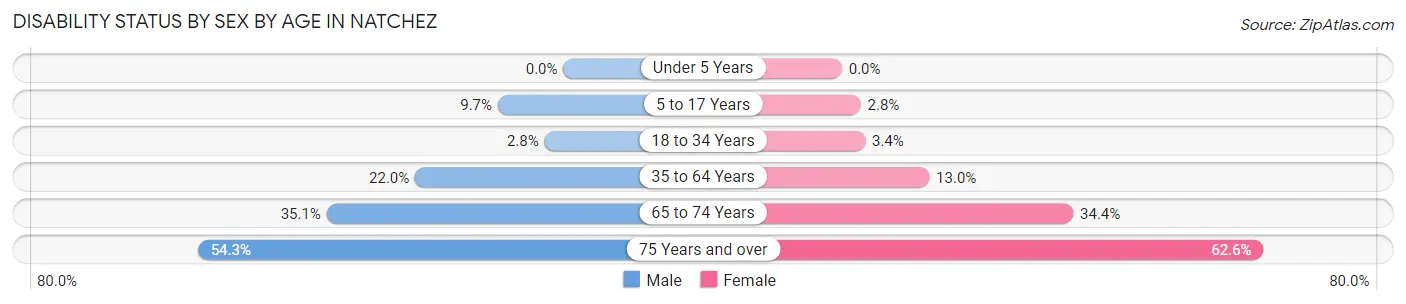
| Age Bracket | Male | Female |
| Under 5 Years | 0 (0.0%) | 0 (0.0%) |
| 5 to 17 Years | 125 (9.7%) | 39 (2.8%) |
| 18 to 34 Years | 27 (2.8%) | 59 (3.4%) |
| 35 to 64 Years | 427 (22.0%) | 351 (13.0%) |
| 65 to 74 Years | 220 (35.1%) | 338 (34.4%) |
| 75 Years and over | 285 (54.3%) | 499 (62.6%) |
Disability Class by Sex by Age in Natchez
Disability Class: Hearing Difficulty
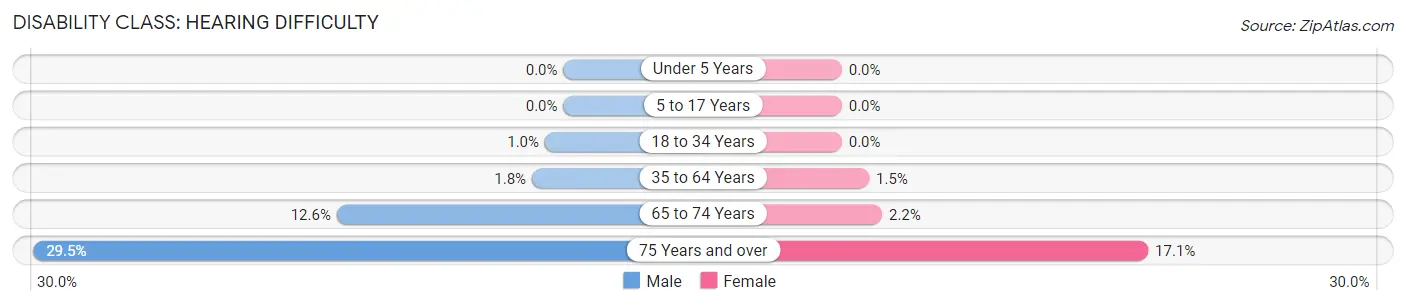
| Age Bracket | Male | Female |
| Under 5 Years | 0 (0.0%) | 0 (0.0%) |
| 5 to 17 Years | 0 (0.0%) | 0 (0.0%) |
| 18 to 34 Years | 10 (1.0%) | 0 (0.0%) |
| 35 to 64 Years | 34 (1.8%) | 41 (1.5%) |
| 65 to 74 Years | 79 (12.6%) | 22 (2.2%) |
| 75 Years and over | 155 (29.5%) | 136 (17.1%) |
Disability Class: Vision Difficulty
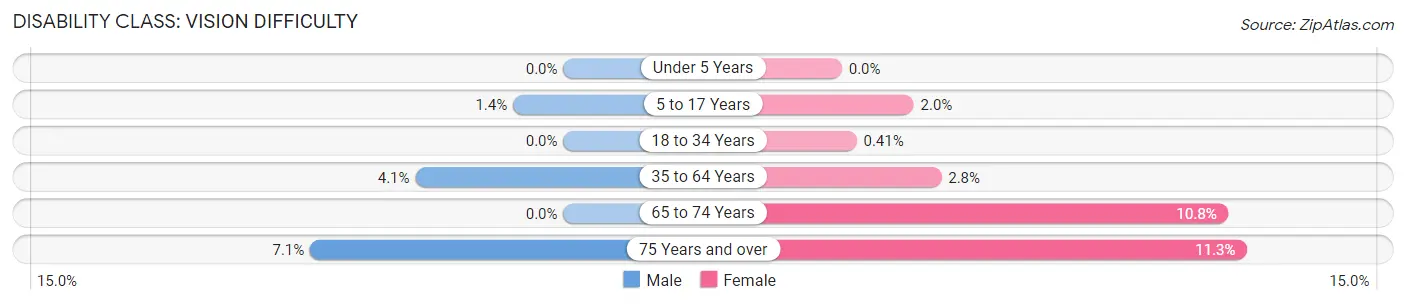
| Age Bracket | Male | Female |
| Under 5 Years | 0 (0.0%) | 0 (0.0%) |
| 5 to 17 Years | 18 (1.4%) | 28 (2.0%) |
| 18 to 34 Years | 0 (0.0%) | 7 (0.4%) |
| 35 to 64 Years | 80 (4.1%) | 75 (2.8%) |
| 65 to 74 Years | 0 (0.0%) | 106 (10.8%) |
| 75 Years and over | 37 (7.0%) | 90 (11.3%) |
Disability Class: Cognitive Difficulty
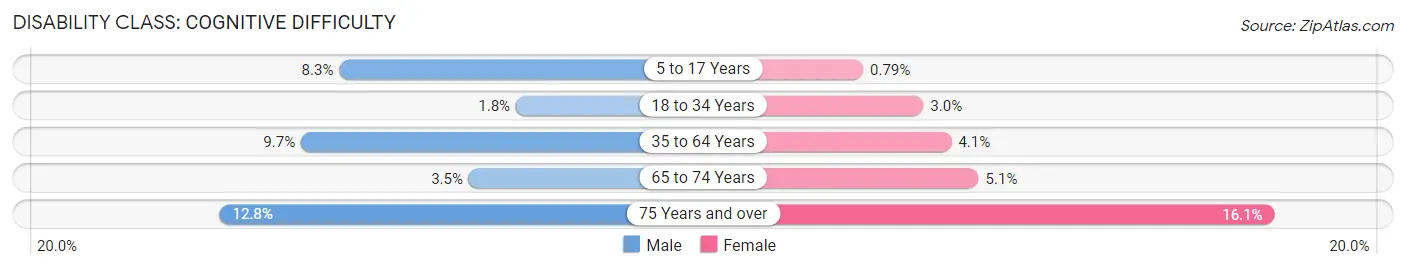
| Age Bracket | Male | Female |
| 5 to 17 Years | 107 (8.3%) | 11 (0.8%) |
| 18 to 34 Years | 17 (1.8%) | 52 (3.0%) |
| 35 to 64 Years | 189 (9.7%) | 110 (4.1%) |
| 65 to 74 Years | 22 (3.5%) | 50 (5.1%) |
| 75 Years and over | 67 (12.8%) | 128 (16.1%) |
Disability Class: Ambulatory Difficulty
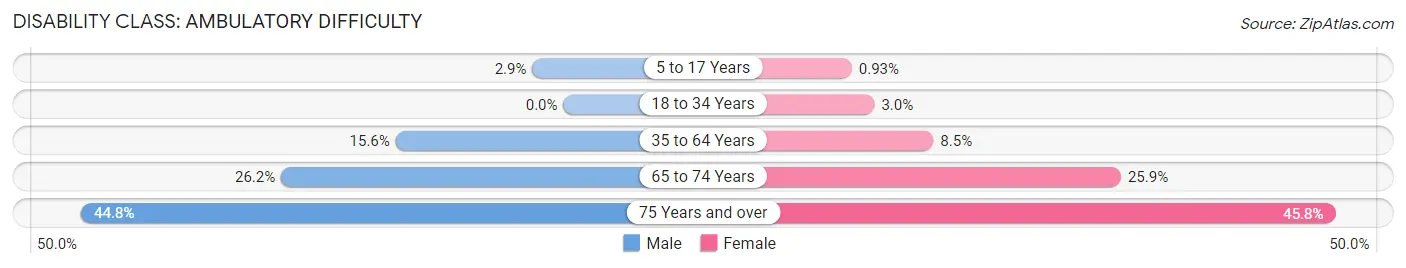
| Age Bracket | Male | Female |
| 5 to 17 Years | 37 (2.9%) | 13 (0.9%) |
| 18 to 34 Years | 0 (0.0%) | 52 (3.0%) |
| 35 to 64 Years | 302 (15.6%) | 230 (8.5%) |
| 65 to 74 Years | 164 (26.2%) | 255 (25.9%) |
| 75 Years and over | 235 (44.8%) | 365 (45.8%) |
Disability Class: Self-Care Difficulty
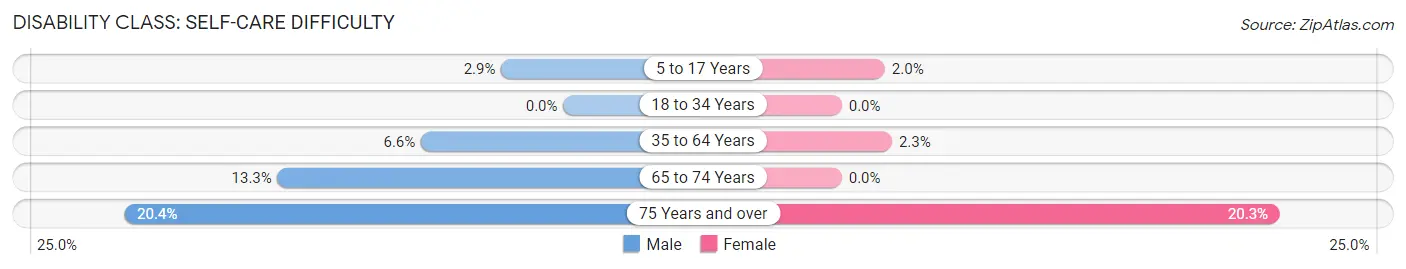
| Age Bracket | Male | Female |
| 5 to 17 Years | 37 (2.9%) | 28 (2.0%) |
| 18 to 34 Years | 0 (0.0%) | 0 (0.0%) |
| 35 to 64 Years | 128 (6.6%) | 63 (2.3%) |
| 65 to 74 Years | 83 (13.3%) | 0 (0.0%) |
| 75 Years and over | 107 (20.4%) | 162 (20.3%) |
Technology Access in Natchez
Computing Device Access in Natchez

| Device Type | # Households | % Households |
| Desktop or Laptop | 3,543 | 60.5% |
| Smartphone | 4,466 | 76.3% |
| Tablet | 2,441 | 41.7% |
| No Computing Device | 995 | 17.0% |
| Total | 5,855 | 100.0% |
Internet Access in Natchez
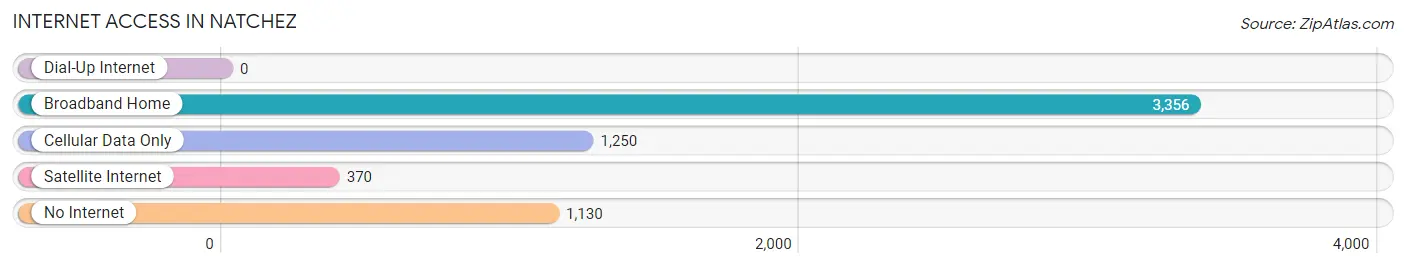
| Internet Type | # Households | % Households |
| Dial-Up Internet | 0 | 0.0% |
| Broadband Home | 3,356 | 57.3% |
| Cellular Data Only | 1,250 | 21.3% |
| Satellite Internet | 370 | 6.3% |
| No Internet | 1,130 | 19.3% |
| Total | 5,855 | 100.0% |
Natchez Summary
Natchez, Mississippi is a city located in Adams County, Mississippi, United States. It is situated on the Mississippi River, across from the state of Louisiana. The city has a population of 15,792 as of the 2010 census, making it the fourth-largest city in the state. Natchez is the county seat of Adams County and is the oldest permanent settlement on the Mississippi River.
History
The area around Natchez was first inhabited by Native American tribes, including the Natchez, Choctaw, and Chickasaw. The first Europeans to explore the area were the French, who established a trading post in 1716. The city was founded in 1716 by French colonists, who named it after the local Natchez tribe. The city was the capital of the Natchez District, which was part of the French colony of Louisiana.
In 1763, the area was ceded to Great Britain in the Treaty of Paris. The British established a fort in Natchez, and the city became a major trading center for the British. In 1798, the city was ceded to the United States in the Treaty of San Lorenzo.
In the early 19th century, Natchez was a major port city and a center of the cotton trade. The city was also a major center of the slave trade, and it was the site of the largest slave market in the United States.
In 1861, Natchez was the first Confederate city to be captured by Union forces during the Civil War. The city was occupied by Union forces until the end of the war in 1865.
Geography
Natchez is located in southwestern Mississippi, on the east bank of the Mississippi River. The city is situated at the confluence of the Mississippi and Homochitto Rivers. The city has a total area of 11.2 square miles, of which 10.9 square miles is land and 0.3 square miles is water.
The city is located in the humid subtropical climate zone, with hot, humid summers and mild winters. The average annual temperature is 64.3°F, and the average annual precipitation is 56.2 inches.
Economy
Natchez has a diversified economy, with a mix of manufacturing, retail, and tourism. The city is home to several manufacturing companies, including a paper mill, a furniture factory, and a chemical plant.
The city is also a major tourist destination, with several historic sites, including the Natchez National Historical Park, the Natchez Trace Parkway, and the Grand Village of the Natchez Indians. The city also hosts several annual festivals, including the Natchez Pilgrimage and the Natchez Music Festival.
Demographics
As of the 2010 census, Natchez had a population of 15,792. The racial makeup of the city was 57.3% African American, 38.3% White, 0.7% Native American, 0.4% Asian, 0.1% Pacific Islander, 1.2% from other races, and 2.0% from two or more races. Hispanic or Latino of any race were 2.7% of the population.
The median income for a household in the city was $30,945, and the median income for a family was $37,945. The per capita income for the city was $17,845. About 22.3% of the population was below the poverty line.
Common Questions
What is Per Capita Income in Natchez?
Per Capita income in Natchez is $22,364.
What is the Median Family Income in Natchez?
Median Family Income in Natchez is $42,336.
What is the Median Household income in Natchez?
Median Household Income in Natchez is $31,800.
What is Income or Wage Gap in Natchez?
Income or Wage Gap in Natchez is 2.2%.
Women in Natchez earn 97.8 cents for every dollar earned by a man.
What is Family Income Deficit in Natchez?
Family Income Deficit in Natchez is $13,478.
Families that are below poverty line in Natchez earn $13,478 less on average than the poverty threshold level.
What is Inequality or Gini Index in Natchez?
Inequality or Gini Index in Natchez is 0.52.
What is the Total Population of Natchez?
Total Population of Natchez is 14,380.
What is the Total Male Population of Natchez?
Total Male Population of Natchez is 5,966.
What is the Total Female Population of Natchez?
Total Female Population of Natchez is 8,414.
What is the Ratio of Males per 100 Females in Natchez?
There are 70.91 Males per 100 Females in Natchez.
What is the Ratio of Females per 100 Males in Natchez?
There are 141.03 Females per 100 Males in Natchez.
What is the Median Population Age in Natchez?
Median Population Age in Natchez is 39.6 Years.
What is the Average Family Size in Natchez
Average Family Size in Natchez is 3.3 People.
What is the Average Household Size in Natchez
Average Household Size in Natchez is 2.4 People.
How Large is the Labor Force in Natchez?
There are 5,379 People in the Labor Forcein in Natchez.
What is the Percentage of People in the Labor Force in Natchez?
49.1% of People are in the Labor Force in Natchez.
What is the Unemployment Rate in Natchez?
Unemployment Rate in Natchez is 8.3%.