Moss Point, MS Map & Demographics
Moss Point Map
Moss Point Overview
$24,109
PER CAPITA INCOME
$55,982
AVG FAMILY INCOME
$44,779
AVG HOUSEHOLD INCOME
27.4%
WAGE / INCOME GAP [ % ]
72.6¢/ $1
WAGE / INCOME GAP [ $ ]
0.47
INEQUALITY / GINI INDEX
12,173
TOTAL POPULATION
5,871
MALE POPULATION
6,302
FEMALE POPULATION
93.16
MALES / 100 FEMALES
107.34
FEMALES / 100 MALES
41.5
MEDIAN AGE
3.3
AVG FAMILY SIZE
2.6
AVG HOUSEHOLD SIZE
5,255
LABOR FORCE [ PEOPLE ]
52.9%
PERCENT IN LABOR FORCE
9.9%
UNEMPLOYMENT RATE
Moss Point Area Codes
Income in Moss Point
Income Overview in Moss Point
Per Capita Income in Moss Point is $24,109, while median incomes of families and households are $55,982 and $44,779 respectively.
| Characteristic | Number | Measure |
| Per Capita Income | 12,173 | $24,109 |
| Median Family Income | 2,937 | $55,982 |
| Mean Family Income | 2,937 | $66,654 |
| Median Household Income | 4,622 | $44,779 |
| Mean Household Income | 4,622 | $59,124 |
| Income Deficit | 2,937 | $0 |
| Wage / Income Gap (%) | 12,173 | 27.40% |
| Wage / Income Gap ($) | 12,173 | 72.60¢ per $1 |
| Gini / Inequality Index | 12,173 | 0.47 |
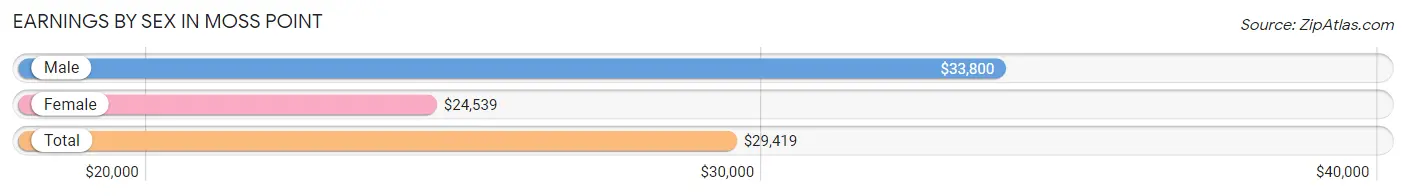
Earnings by Sex in Moss Point
Average Earnings in Moss Point are $29,419, $33,800 for men and $24,539 for women, a difference of 27.4%.
| Sex | Number | Average Earnings |
| Male | 2,419 (46.4%) | $33,800 |
| Female | 2,792 (53.6%) | $24,539 |
| Total | 5,211 (100.0%) | $29,419 |
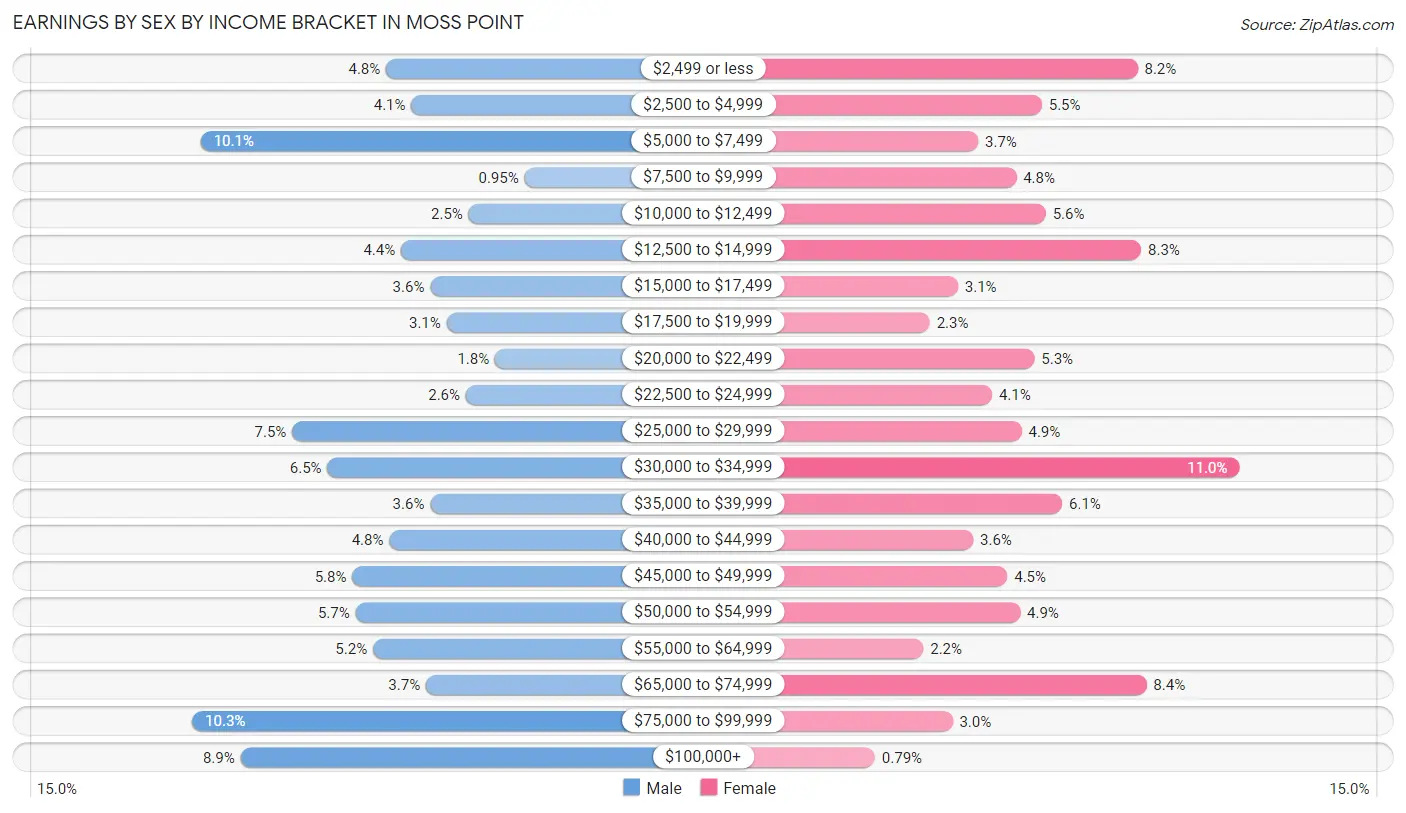
Earnings by Sex by Income Bracket in Moss Point
The most common earnings brackets in Moss Point are $75,000 to $99,999 for men (249 | 10.3%) and $30,000 to $34,999 for women (308 | 11.0%).
| Income | Male | Female |
| $2,499 or less | 117 (4.8%) | 228 (8.2%) |
| $2,500 to $4,999 | 100 (4.1%) | 153 (5.5%) |
| $5,000 to $7,499 | 243 (10.1%) | 103 (3.7%) |
| $7,500 to $9,999 | 23 (0.9%) | 133 (4.8%) |
| $10,000 to $12,499 | 61 (2.5%) | 156 (5.6%) |
| $12,500 to $14,999 | 107 (4.4%) | 231 (8.3%) |
| $15,000 to $17,499 | 87 (3.6%) | 87 (3.1%) |
| $17,500 to $19,999 | 76 (3.1%) | 65 (2.3%) |
| $20,000 to $22,499 | 43 (1.8%) | 147 (5.3%) |
| $22,500 to $24,999 | 63 (2.6%) | 114 (4.1%) |
| $25,000 to $29,999 | 181 (7.5%) | 137 (4.9%) |
| $30,000 to $34,999 | 157 (6.5%) | 308 (11.0%) |
| $35,000 to $39,999 | 87 (3.6%) | 169 (6.0%) |
| $40,000 to $44,999 | 115 (4.8%) | 99 (3.5%) |
| $45,000 to $49,999 | 140 (5.8%) | 126 (4.5%) |
| $50,000 to $54,999 | 138 (5.7%) | 136 (4.9%) |
| $55,000 to $64,999 | 126 (5.2%) | 60 (2.1%) |
| $65,000 to $74,999 | 90 (3.7%) | 235 (8.4%) |
| $75,000 to $99,999 | 249 (10.3%) | 83 (3.0%) |
| $100,000+ | 216 (8.9%) | 22 (0.8%) |
| Total | 2,419 (100.0%) | 2,792 (100.0%) |
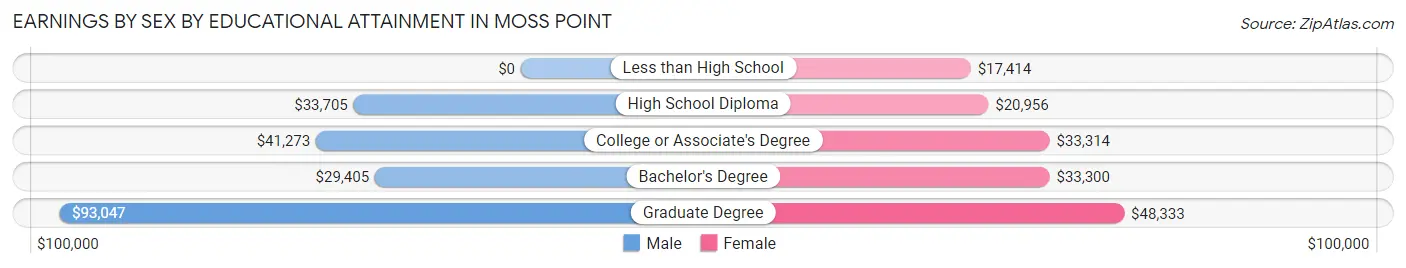
Earnings by Sex by Educational Attainment in Moss Point
Average earnings in Moss Point are $37,188 for men and $31,526 for women, a difference of 15.2%. Men with an educational attainment of graduate degree enjoy the highest average annual earnings of $93,047, while those with bachelor's degree education earn the least with $29,405. Women with an educational attainment of graduate degree earn the most with the average annual earnings of $48,333, while those with less than high school education have the smallest earnings of $17,414.
| Educational Attainment | Male Income | Female Income |
| Less than High School | - | - |
| High School Diploma | $33,705 | $20,956 |
| College or Associate's Degree | $41,273 | $33,314 |
| Bachelor's Degree | $29,405 | $33,300 |
| Graduate Degree | $93,047 | $48,333 |
| Total | $37,188 | $31,526 |
Family Income in Moss Point
Family Income Brackets in Moss Point
According to the Moss Point family income data, there are 605 families falling into the $50,000 to $74,999 income range, which is the most common income bracket and makes up 20.6% of all families. Conversely, the $200,000+ income bracket is the least frequent group with only 41 families (1.4%) belonging to this category.
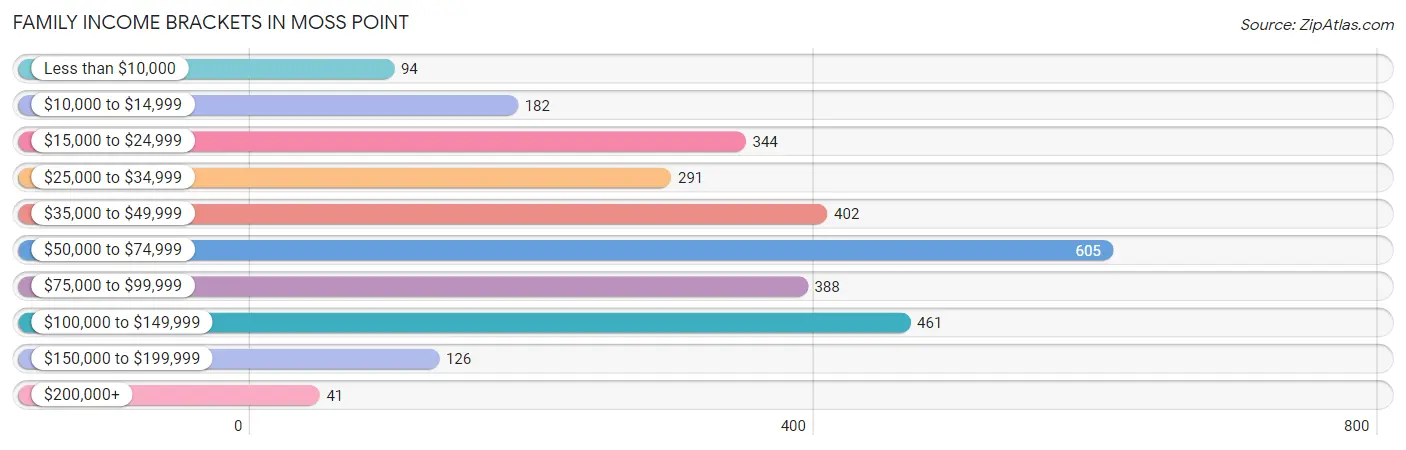
| Income Bracket | # Families | % Families |
| Less than $10,000 | 94 | 3.2% |
| $10,000 to $14,999 | 182 | 6.2% |
| $15,000 to $24,999 | 344 | 11.7% |
| $25,000 to $34,999 | 291 | 9.9% |
| $35,000 to $49,999 | 402 | 13.7% |
| $50,000 to $74,999 | 605 | 20.6% |
| $75,000 to $99,999 | 388 | 13.2% |
| $100,000 to $149,999 | 461 | 15.7% |
| $150,000 to $199,999 | 126 | 4.3% |
| $200,000+ | 41 | 1.4% |
Family Income by Famaliy Size in Moss Point
6-person families (152 | 5.2%) account for the highest median family income in Moss Point with $98,344 per family, while 2-person families (1,655 | 56.4%) have the highest median income of $23,078 per family member.
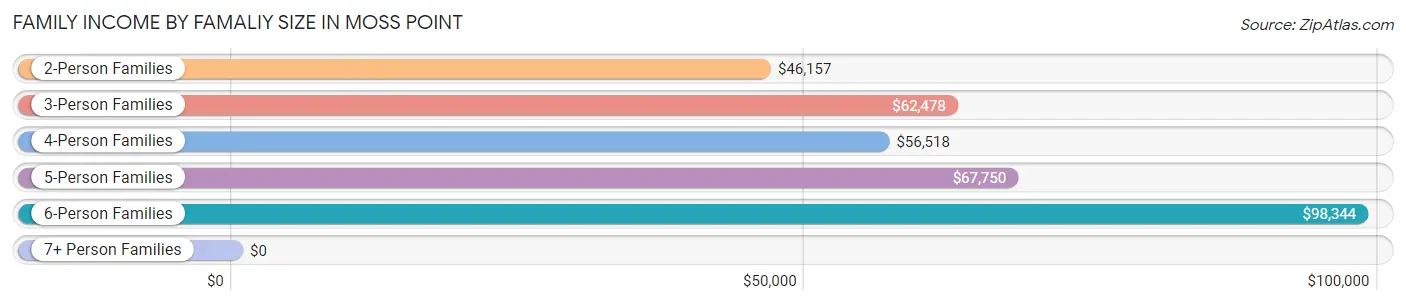
| Income Bracket | # Families | Median Income |
| 2-Person Families | 1,655 (56.4%) | $46,157 |
| 3-Person Families | 523 (17.8%) | $62,478 |
| 4-Person Families | 376 (12.8%) | $56,518 |
| 5-Person Families | 216 (7.3%) | $67,750 |
| 6-Person Families | 152 (5.2%) | $98,344 |
| 7+ Person Families | 15 (0.5%) | $0 |
| Total | 2,937 (100.0%) | $55,982 |
Family Income by Number of Earners in Moss Point
The median family income in Moss Point is $55,982, with families comprising 2 earners (746) having the highest median family income of $97,000, while families with no earners (603) have the lowest median family income of $26,458, accounting for 25.4% and 20.5% of families, respectively.
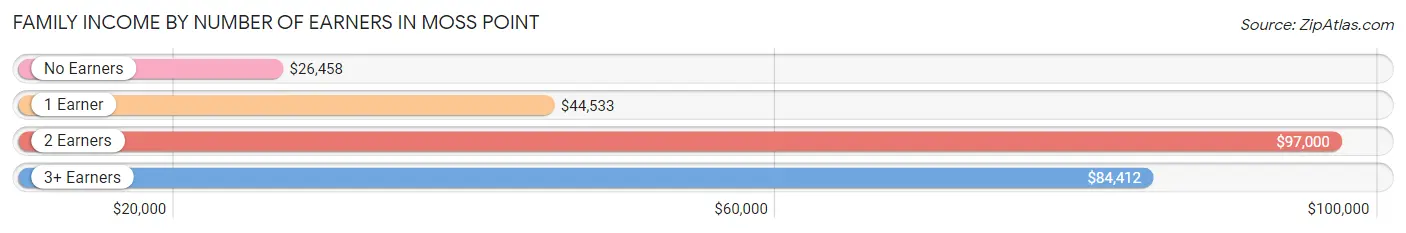
| Number of Earners | # Families | Median Income |
| No Earners | 603 (20.5%) | $26,458 |
| 1 Earner | 1,372 (46.7%) | $44,533 |
| 2 Earners | 746 (25.4%) | $97,000 |
| 3+ Earners | 216 (7.3%) | $84,412 |
| Total | 2,937 (100.0%) | $55,982 |
Household Income in Moss Point
Household Income Brackets in Moss Point
With 943 households falling in the category, the $50,000 to $74,999 income range is the most frequent in Moss Point, accounting for 20.4% of all households. In contrast, only 88 households (1.9%) fall into the $200,000+ income bracket, making it the least populous group.
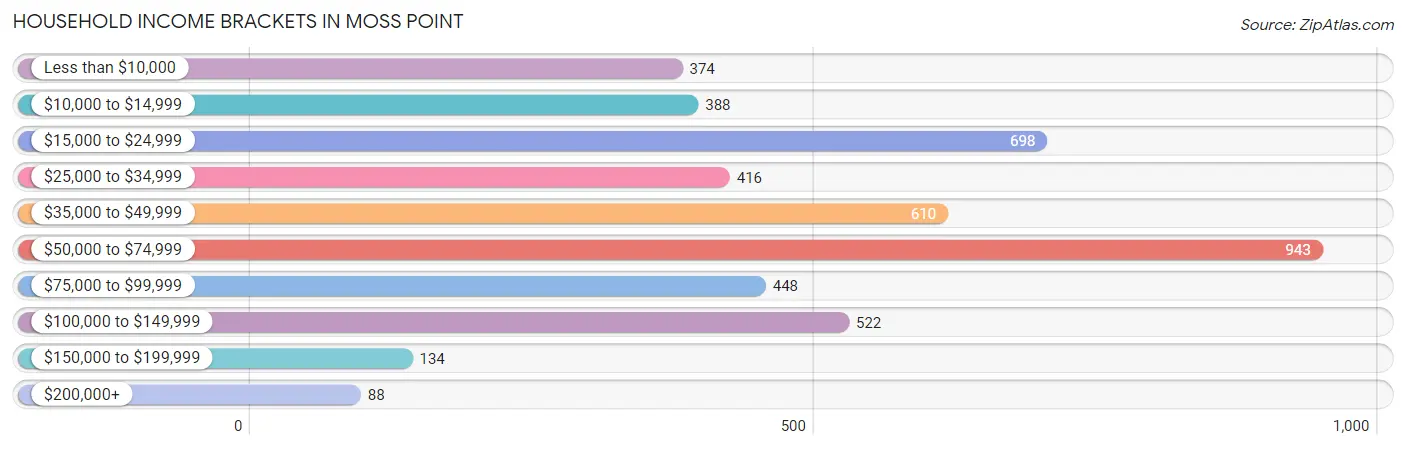
| Income Bracket | # Households | % Households |
| Less than $10,000 | 374 | 8.1% |
| $10,000 to $14,999 | 388 | 8.4% |
| $15,000 to $24,999 | 698 | 15.1% |
| $25,000 to $34,999 | 416 | 9.0% |
| $35,000 to $49,999 | 610 | 13.2% |
| $50,000 to $74,999 | 943 | 20.4% |
| $75,000 to $99,999 | 448 | 9.7% |
| $100,000 to $149,999 | 522 | 11.3% |
| $150,000 to $199,999 | 134 | 2.9% |
| $200,000+ | 88 | 1.9% |
Household Income by Householder Age in Moss Point
The median household income in Moss Point is $44,779, with the highest median household income of $54,330 found in the 45 to 64 years age bracket for the primary householder. A total of 1,679 households (36.3%) fall into this category. Meanwhile, the 65+ years age bracket for the primary householder has the lowest median household income of $40,833, with 1,676 households (36.3%) in this group.
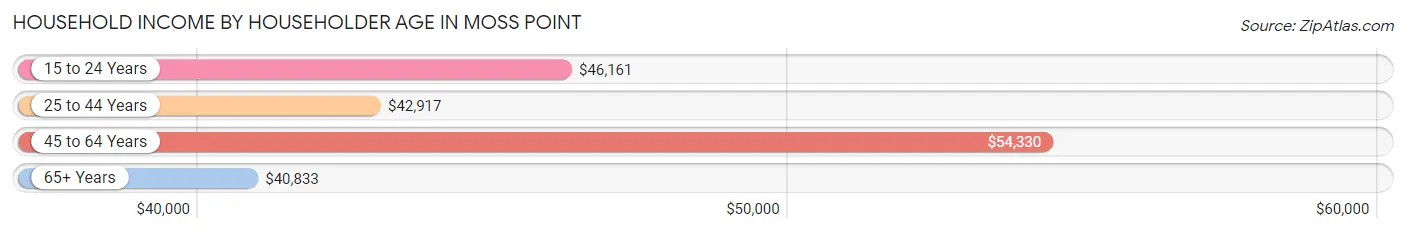
| Income Bracket | # Households | Median Income |
| 15 to 24 Years | 98 (2.1%) | $46,161 |
| 25 to 44 Years | 1,169 (25.3%) | $42,917 |
| 45 to 64 Years | 1,679 (36.3%) | $54,330 |
| 65+ Years | 1,676 (36.3%) | $40,833 |
| Total | 4,622 (100.0%) | $44,779 |
Poverty in Moss Point
Income Below Poverty by Sex and Age in Moss Point
With 17.1% poverty level for males and 21.3% for females among the residents of Moss Point, 18 to 24 year old males and 6 to 11 year old females are the most vulnerable to poverty, with 143 males (29.5%) and 159 females (50.3%) in their respective age groups living below the poverty level.
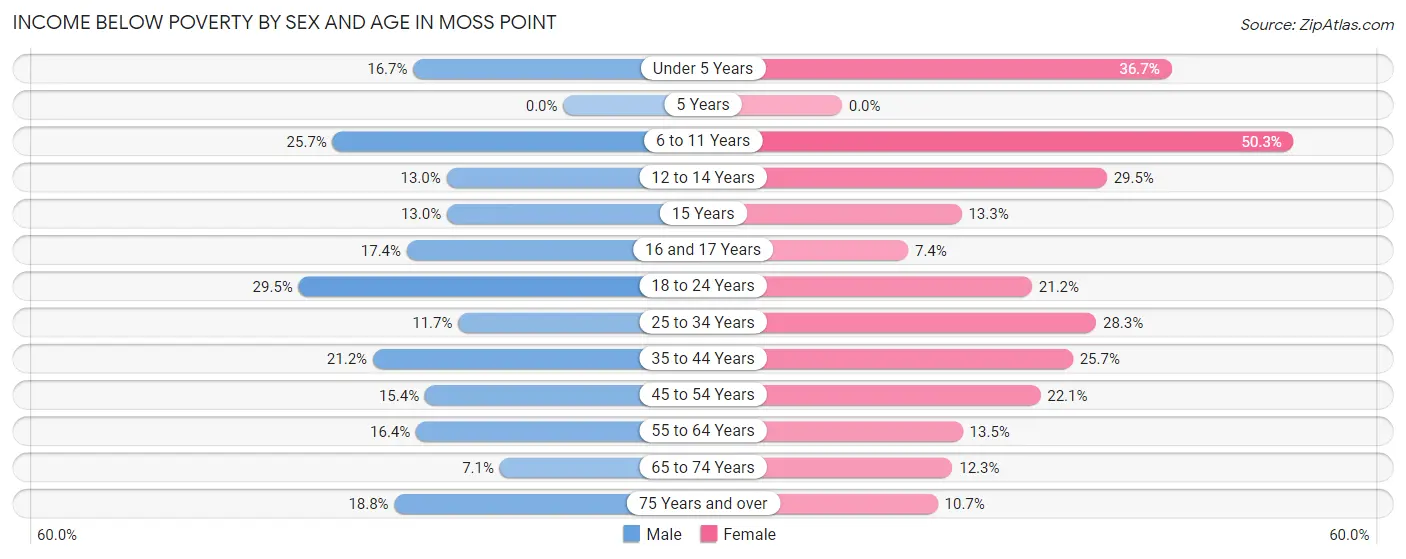
| Age Bracket | Male | Female |
| Under 5 Years | 70 (16.7%) | 130 (36.7%) |
| 5 Years | 0 (0.0%) | 0 (0.0%) |
| 6 to 11 Years | 130 (25.7%) | 159 (50.3%) |
| 12 to 14 Years | 38 (13.0%) | 41 (29.5%) |
| 15 Years | 7 (13.0%) | 18 (13.3%) |
| 16 and 17 Years | 38 (17.4%) | 11 (7.4%) |
| 18 to 24 Years | 143 (29.5%) | 123 (21.2%) |
| 25 to 34 Years | 93 (11.7%) | 160 (28.3%) |
| 35 to 44 Years | 165 (21.2%) | 233 (25.7%) |
| 45 to 54 Years | 104 (15.4%) | 168 (22.1%) |
| 55 to 64 Years | 122 (16.4%) | 109 (13.5%) |
| 65 to 74 Years | 47 (7.1%) | 107 (12.3%) |
| 75 Years and over | 38 (18.8%) | 64 (10.7%) |
| Total | 995 (17.1%) | 1,323 (21.3%) |
Income Above Poverty by Sex and Age in Moss Point
According to the poverty statistics in Moss Point, males aged 5 years and females aged 5 years are the age groups that are most secure financially, with 100.0% of males and 100.0% of females in these age groups living above the poverty line.
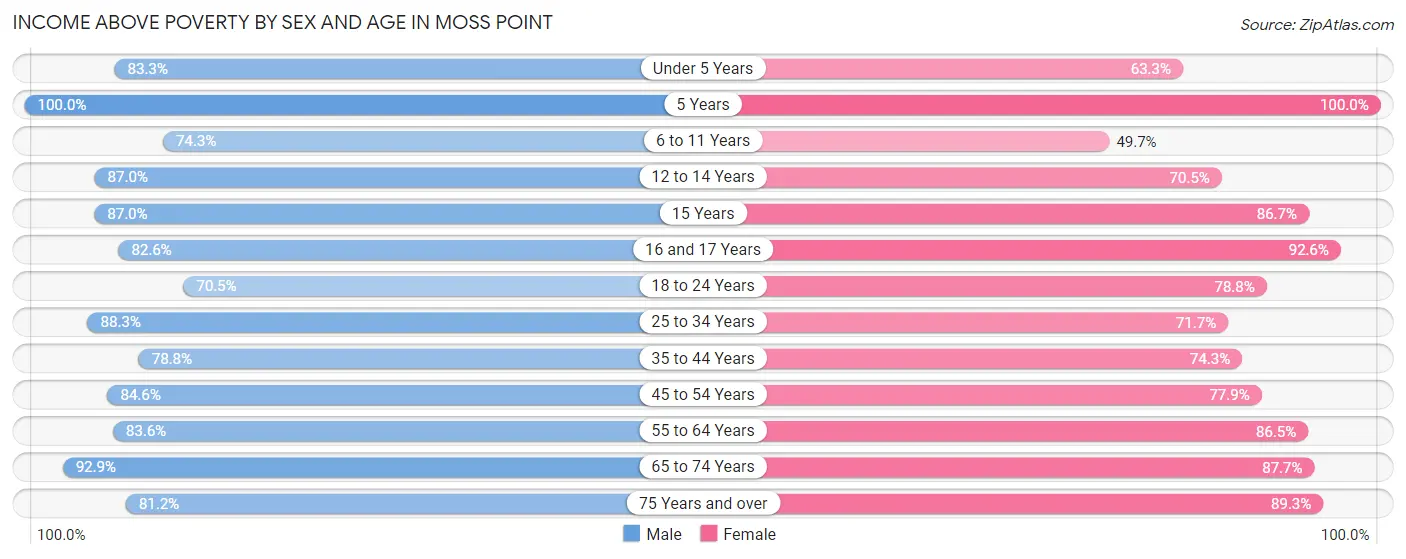
| Age Bracket | Male | Female |
| Under 5 Years | 349 (83.3%) | 224 (63.3%) |
| 5 Years | 3 (100.0%) | 17 (100.0%) |
| 6 to 11 Years | 376 (74.3%) | 157 (49.7%) |
| 12 to 14 Years | 254 (87.0%) | 98 (70.5%) |
| 15 Years | 47 (87.0%) | 117 (86.7%) |
| 16 and 17 Years | 180 (82.6%) | 138 (92.6%) |
| 18 to 24 Years | 342 (70.5%) | 458 (78.8%) |
| 25 to 34 Years | 702 (88.3%) | 405 (71.7%) |
| 35 to 44 Years | 613 (78.8%) | 673 (74.3%) |
| 45 to 54 Years | 571 (84.6%) | 592 (77.9%) |
| 55 to 64 Years | 622 (83.6%) | 701 (86.5%) |
| 65 to 74 Years | 617 (92.9%) | 762 (87.7%) |
| 75 Years and over | 164 (81.2%) | 536 (89.3%) |
| Total | 4,840 (83.0%) | 4,878 (78.7%) |
Income Below Poverty Among Married-Couple Families in Moss Point
The poverty statistics for married-couple families in Moss Point show that 6.7% or 101 of the total 1,519 families live below the poverty line. Families with 3 or 4 children have the highest poverty rate of 30.8%, comprising of 49 families. On the other hand, families with no children have the lowest poverty rate of 3.8%, which includes 39 families.
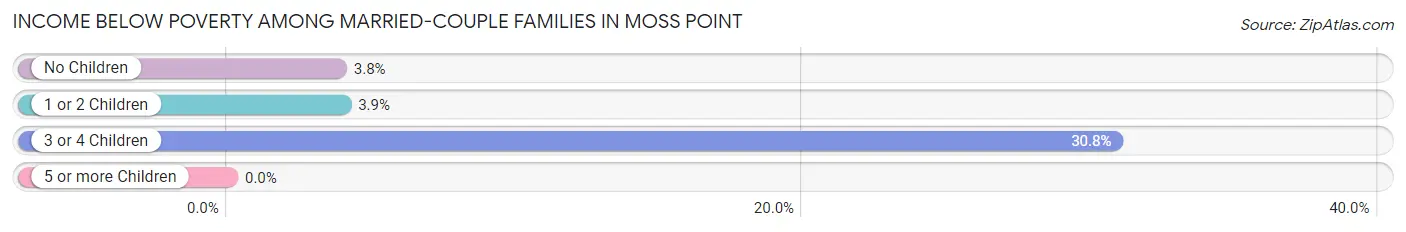
| Children | Above Poverty | Below Poverty |
| No Children | 991 (96.2%) | 39 (3.8%) |
| 1 or 2 Children | 317 (96.1%) | 13 (3.9%) |
| 3 or 4 Children | 110 (69.2%) | 49 (30.8%) |
| 5 or more Children | 0 (0.0%) | 0 (0.0%) |
| Total | 1,418 (93.3%) | 101 (6.7%) |
Income Below Poverty Among Single-Parent Households in Moss Point
According to the poverty data in Moss Point, 5.8% or 24 single-father households and 27.9% or 280 single-mother households are living below the poverty line. Among single-father households, those with 1 or 2 children have the highest poverty rate, with 24 households (8.6%) experiencing poverty. Likewise, among single-mother households, those with 3 or 4 children have the highest poverty rate, with 67 households (81.7%) falling below the poverty line.
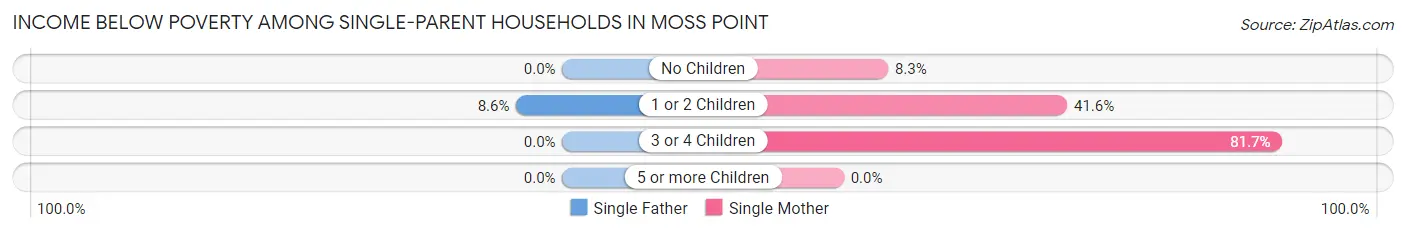
| Children | Single Father | Single Mother |
| No Children | 0 (0.0%) | 42 (8.3%) |
| 1 or 2 Children | 24 (8.6%) | 171 (41.6%) |
| 3 or 4 Children | 0 (0.0%) | 67 (81.7%) |
| 5 or more Children | 0 (0.0%) | 0 (0.0%) |
| Total | 24 (5.8%) | 280 (27.9%) |
Income Below Poverty Among Married-Couple vs Single-Parent Households in Moss Point
The poverty data for Moss Point shows that 101 of the married-couple family households (6.7%) and 304 of the single-parent households (21.4%) are living below the poverty level. Within the married-couple family households, those with 3 or 4 children have the highest poverty rate, with 49 households (30.8%) falling below the poverty line. Among the single-parent households, those with 3 or 4 children have the highest poverty rate, with 67 household (81.7%) living below poverty.
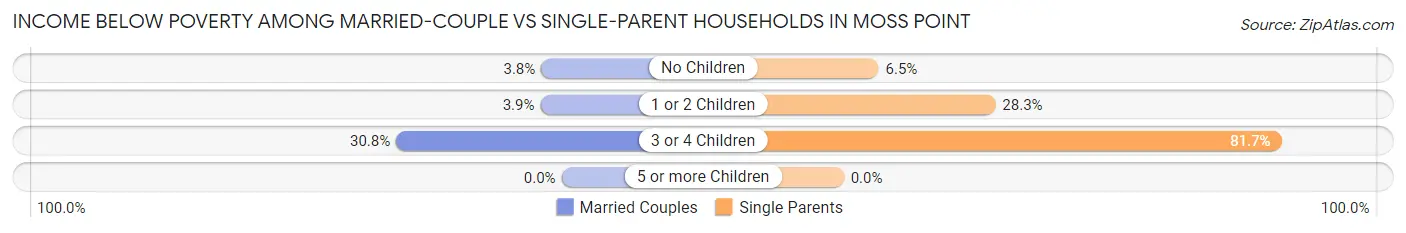
| Children | Married-Couple Families | Single-Parent Households |
| No Children | 39 (3.8%) | 42 (6.5%) |
| 1 or 2 Children | 13 (3.9%) | 195 (28.3%) |
| 3 or 4 Children | 49 (30.8%) | 67 (81.7%) |
| 5 or more Children | 0 (0.0%) | 0 (0.0%) |
| Total | 101 (6.7%) | 304 (21.4%) |
Race in Moss Point
The most populous races in Moss Point are Black / African American (9,066 | 74.5%), White / Caucasian (2,291 | 18.8%), and Some other Race (634 | 5.2%).
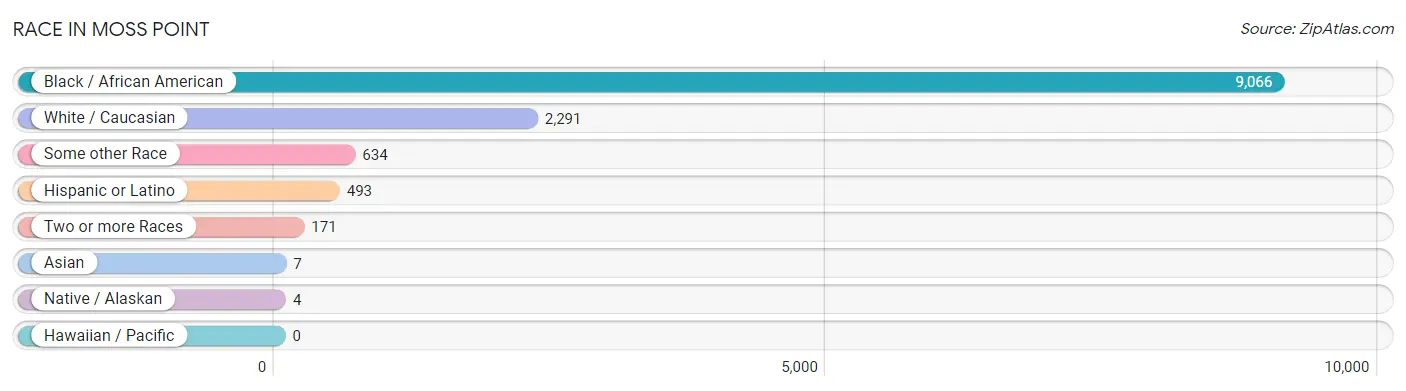
| Race | # Population | % Population |
| Asian | 7 | 0.1% |
| Black / African American | 9,066 | 74.5% |
| Hawaiian / Pacific | 0 | 0.0% |
| Hispanic or Latino | 493 | 4.1% |
| Native / Alaskan | 4 | 0.0% |
| White / Caucasian | 2,291 | 18.8% |
| Two or more Races | 171 | 1.4% |
| Some other Race | 634 | 5.2% |
| Total | 12,173 | 100.0% |
Ancestry in Moss Point
The most populous ancestries reported in Moss Point are American (394 | 3.2%), German (389 | 3.2%), English (340 | 2.8%), Puerto Rican (253 | 2.1%), and Irish (246 | 2.0%), together accounting for 13.3% of all Moss Point residents.
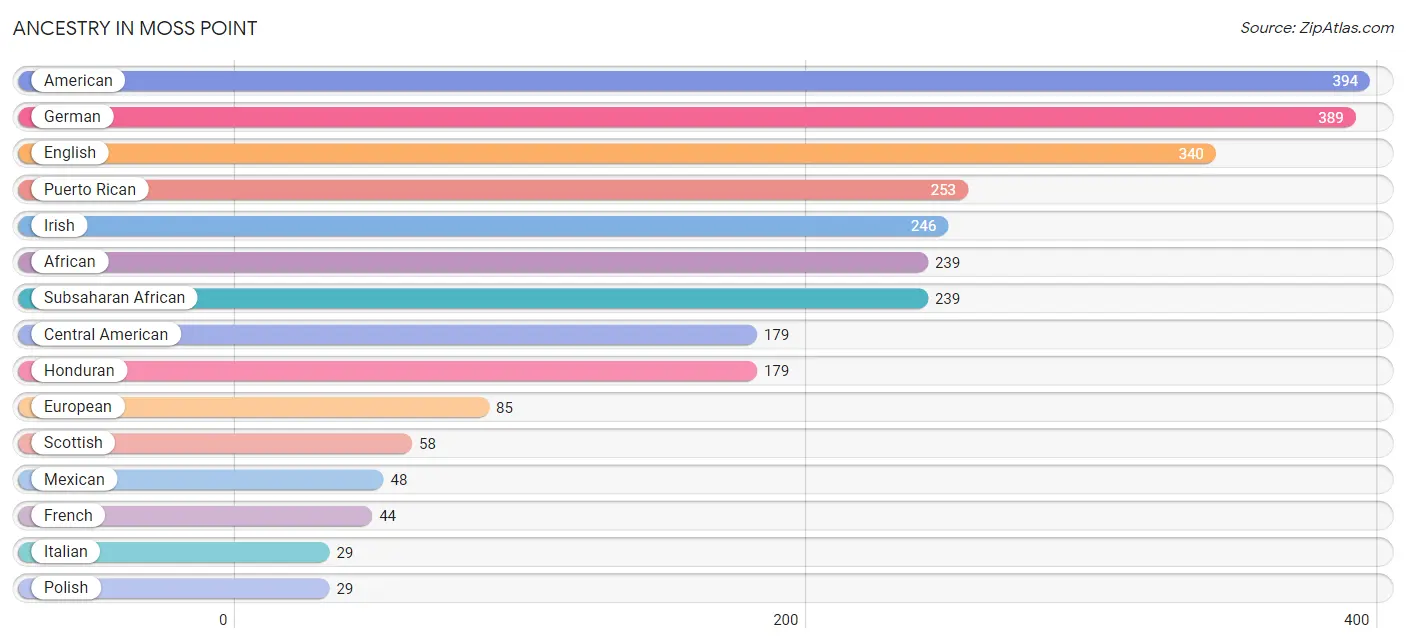
| Ancestry | # Population | % Population |
| African | 239 | 2.0% |
| American | 394 | 3.2% |
| Blackfeet | 9 | 0.1% |
| British West Indian | 2 | 0.0% |
| Canadian | 5 | 0.0% |
| Central American | 179 | 1.5% |
| Cherokee | 19 | 0.2% |
| Choctaw | 7 | 0.1% |
| Danish | 13 | 0.1% |
| Dominican | 4 | 0.0% |
| Dutch | 26 | 0.2% |
| English | 340 | 2.8% |
| European | 85 | 0.7% |
| French | 44 | 0.4% |
| German | 389 | 3.2% |
| Honduran | 179 | 1.5% |
| Hungarian | 12 | 0.1% |
| Irish | 246 | 2.0% |
| Italian | 29 | 0.2% |
| Korean | 15 | 0.1% |
| Mexican | 48 | 0.4% |
| Norwegian | 6 | 0.1% |
| Pennsylvania German | 20 | 0.2% |
| Polish | 29 | 0.2% |
| Puerto Rican | 253 | 2.1% |
| Russian | 28 | 0.2% |
| Scotch-Irish | 10 | 0.1% |
| Scottish | 58 | 0.5% |
| Spaniard | 9 | 0.1% |
| Subsaharan African | 239 | 2.0% |
| Thai | 1 | 0.0% |
| Trinidadian and Tobagonian | 9 | 0.1% | View All 32 Rows |
Immigrants in Moss Point
The most numerous immigrant groups reported in Moss Point came from Latin America (111 | 0.9%), Central America (88 | 0.7%), Honduras (76 | 0.6%), Eastern Europe (28 | 0.2%), and Europe (28 | 0.2%), together accounting for 2.7% of all Moss Point residents.
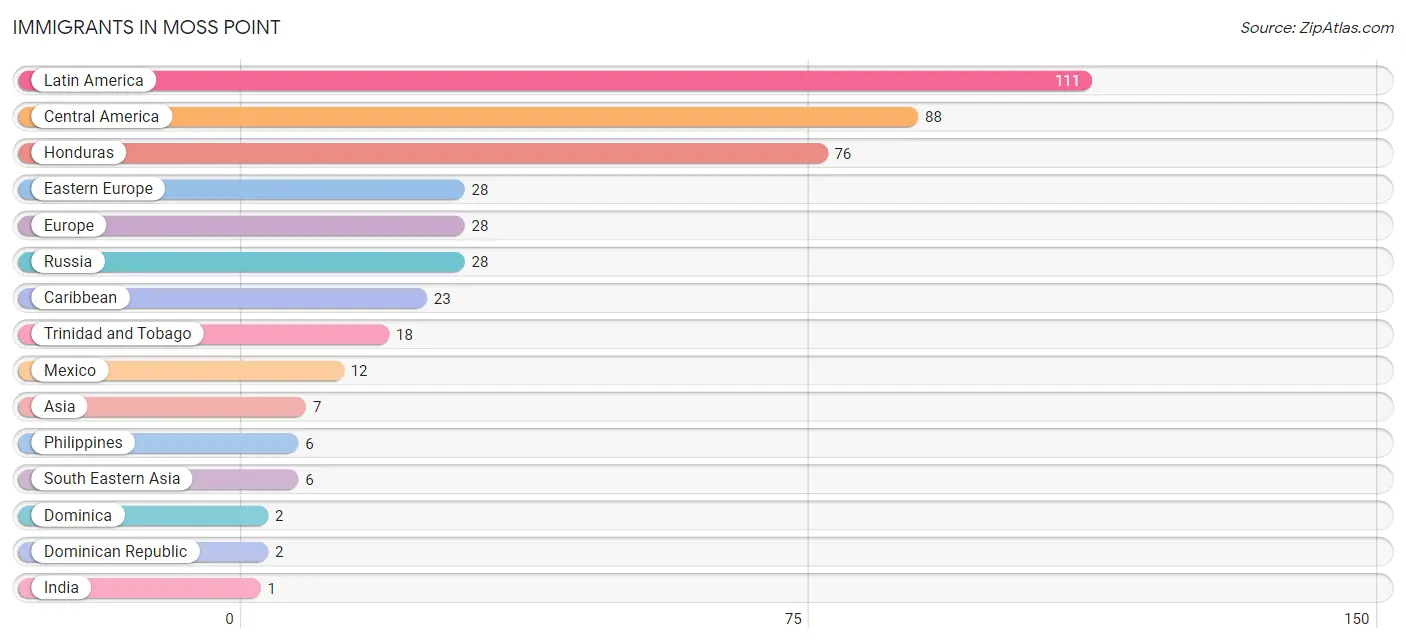
| Immigration Origin | # Population | % Population |
| Asia | 7 | 0.1% |
| Caribbean | 23 | 0.2% |
| Central America | 88 | 0.7% |
| Dominica | 2 | 0.0% |
| Dominican Republic | 2 | 0.0% |
| Eastern Europe | 28 | 0.2% |
| Europe | 28 | 0.2% |
| Honduras | 76 | 0.6% |
| India | 1 | 0.0% |
| Jamaica | 1 | 0.0% |
| Latin America | 111 | 0.9% |
| Mexico | 12 | 0.1% |
| Philippines | 6 | 0.1% |
| Russia | 28 | 0.2% |
| South Central Asia | 1 | 0.0% |
| South Eastern Asia | 6 | 0.1% |
| Trinidad and Tobago | 18 | 0.2% | View All 17 Rows |
Sex and Age in Moss Point
Sex and Age in Moss Point
The most populous age groups in Moss Point are 25 to 29 Years (553 | 9.4%) for men and 60 to 64 Years (642 | 10.2%) for women.
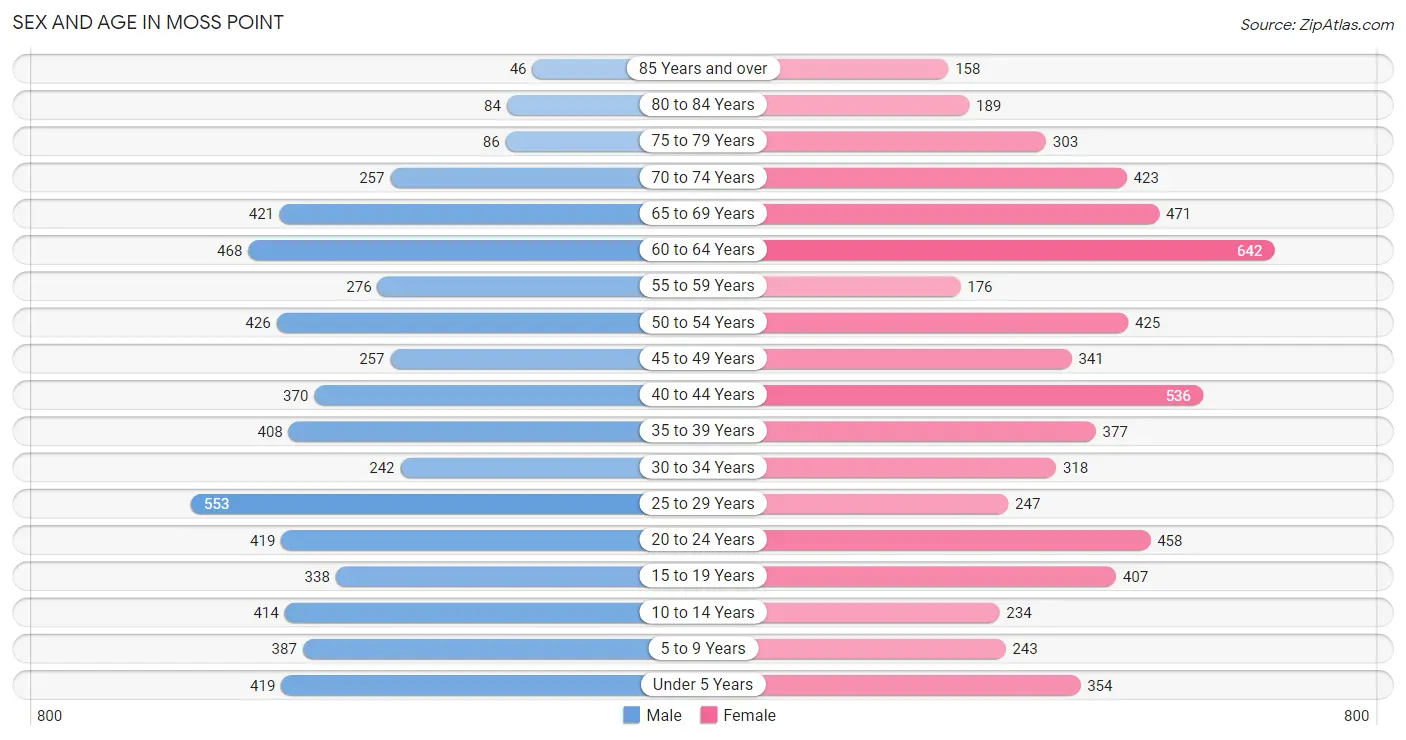
| Age Bracket | Male | Female |
| Under 5 Years | 419 (7.1%) | 354 (5.6%) |
| 5 to 9 Years | 387 (6.6%) | 243 (3.9%) |
| 10 to 14 Years | 414 (7.0%) | 234 (3.7%) |
| 15 to 19 Years | 338 (5.8%) | 407 (6.5%) |
| 20 to 24 Years | 419 (7.1%) | 458 (7.3%) |
| 25 to 29 Years | 553 (9.4%) | 247 (3.9%) |
| 30 to 34 Years | 242 (4.1%) | 318 (5.1%) |
| 35 to 39 Years | 408 (7.0%) | 377 (6.0%) |
| 40 to 44 Years | 370 (6.3%) | 536 (8.5%) |
| 45 to 49 Years | 257 (4.4%) | 341 (5.4%) |
| 50 to 54 Years | 426 (7.3%) | 425 (6.7%) |
| 55 to 59 Years | 276 (4.7%) | 176 (2.8%) |
| 60 to 64 Years | 468 (8.0%) | 642 (10.2%) |
| 65 to 69 Years | 421 (7.2%) | 471 (7.5%) |
| 70 to 74 Years | 257 (4.4%) | 423 (6.7%) |
| 75 to 79 Years | 86 (1.5%) | 303 (4.8%) |
| 80 to 84 Years | 84 (1.4%) | 189 (3.0%) |
| 85 Years and over | 46 (0.8%) | 158 (2.5%) |
| Total | 5,871 (100.0%) | 6,302 (100.0%) |
Families and Households in Moss Point
Median Family Size in Moss Point
The median family size in Moss Point is 3.34 persons per family, with married-couple families (1,519 | 51.7%) accounting for the largest median family size of 3.41 persons per family. On the other hand, single male/father families (416 | 14.2%) represent the smallest median family size with 2.89 persons per family.
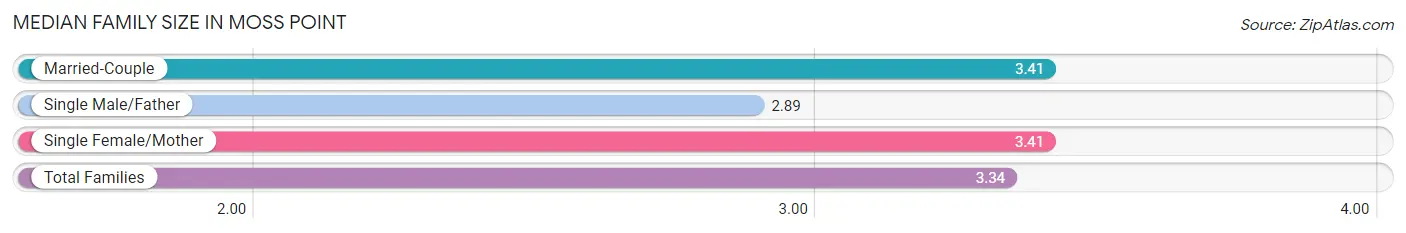
| Family Type | # Families | Family Size |
| Married-Couple | 1,519 (51.7%) | 3.41 |
| Single Male/Father | 416 (14.2%) | 2.89 |
| Single Female/Mother | 1,002 (34.1%) | 3.41 |
| Total Families | 2,937 (100.0%) | 3.34 |
Median Household Size in Moss Point
The median household size in Moss Point is 2.60 persons per household, with married-couple households (1,519 | 32.9%) accounting for the largest median household size of 3.44 persons per household. non-family households (1,685 | 36.5%) represent the smallest median household size with 1.17 persons per household.
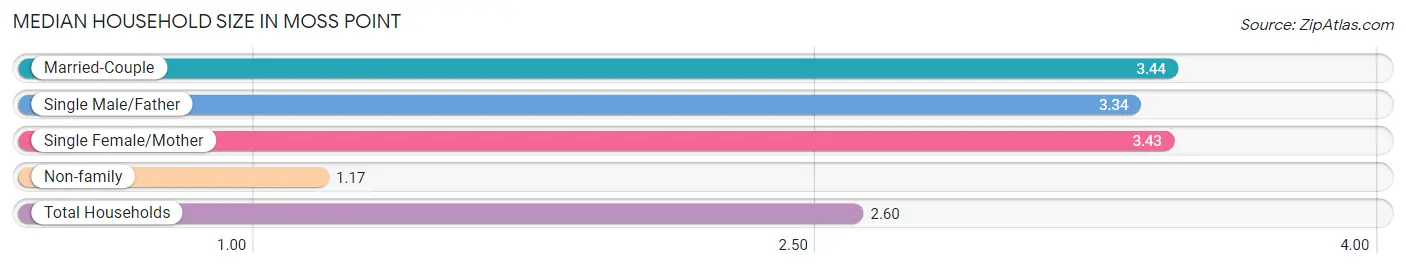
| Household Type | # Households | Household Size |
| Married-Couple | 1,519 (32.9%) | 3.44 |
| Single Male/Father | 416 (9.0%) | 3.34 |
| Single Female/Mother | 1,002 (21.7%) | 3.43 |
| Non-family | 1,685 (36.5%) | 1.17 |
| Total Households | 4,622 (100.0%) | 2.60 |
Household Size by Marriage Status in Moss Point
Out of a total of 4,622 households in Moss Point, 2,937 (63.5%) are family households, while 1,685 (36.5%) are nonfamily households. The most numerous type of family households are 2-person households, comprising 1,508, and the most common type of nonfamily households are 1-person households, comprising 1,428.
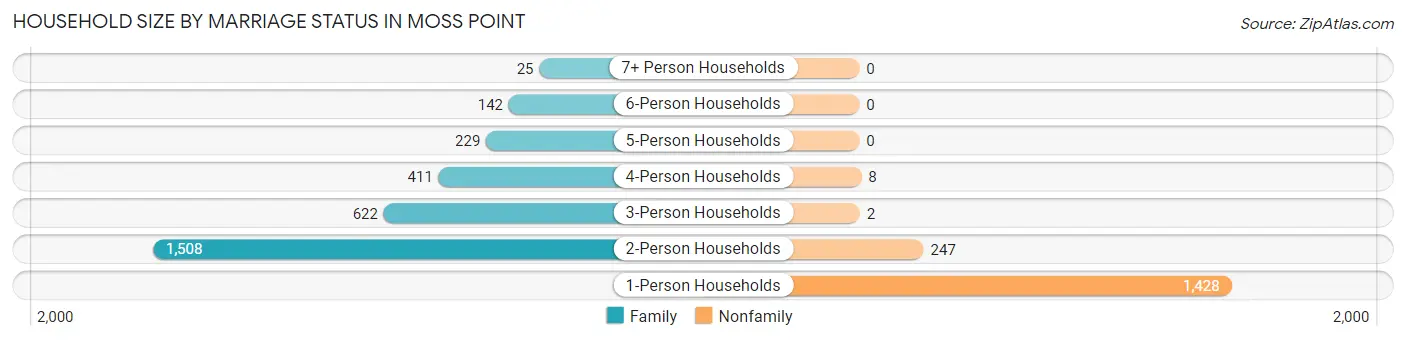
| Household Size | Family Households | Nonfamily Households |
| 1-Person Households | - | 1,428 (30.9%) |
| 2-Person Households | 1,508 (32.6%) | 247 (5.3%) |
| 3-Person Households | 622 (13.5%) | 2 (0.0%) |
| 4-Person Households | 411 (8.9%) | 8 (0.2%) |
| 5-Person Households | 229 (5.0%) | 0 (0.0%) |
| 6-Person Households | 142 (3.1%) | 0 (0.0%) |
| 7+ Person Households | 25 (0.5%) | 0 (0.0%) |
| Total | 2,937 (63.5%) | 1,685 (36.5%) |
Female Fertility in Moss Point
Fertility by Age in Moss Point
Average fertility rate in Moss Point is 67.0 births per 1,000 women. Women in the age bracket of 20 to 34 years have the highest fertility rate with 163.0 births per 1,000 women. Women in the age bracket of 20 to 34 years acount for 90.3% of all women with births.
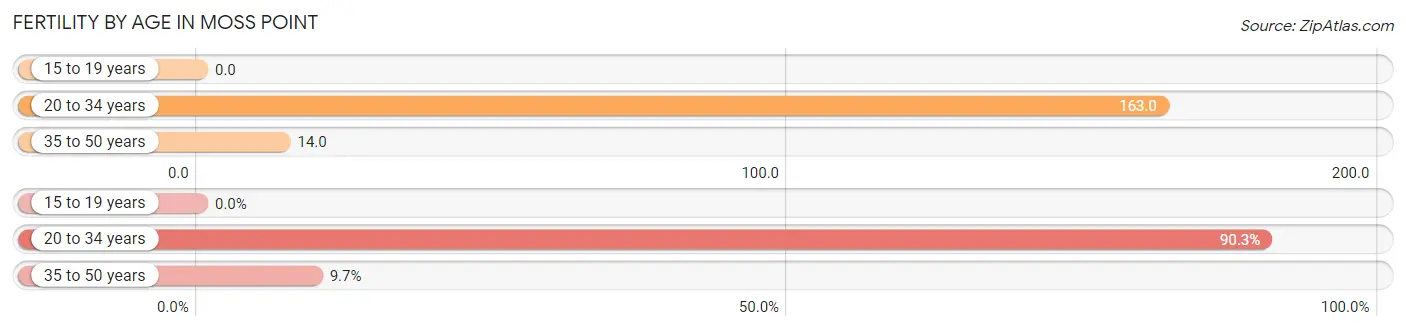
| Age Bracket | Women with Births | Births / 1,000 Women |
| 15 to 19 years | 0 (0.0%) | 0.0 |
| 20 to 34 years | 167 (90.3%) | 163.0 |
| 35 to 50 years | 18 (9.7%) | 14.0 |
| Total | 185 (100.0%) | 67.0 |
Fertility by Age by Marriage Status in Moss Point
9.7% of women with births (185) in Moss Point are married. The highest percentage of unmarried women with births falls into 20 to 34 years age bracket with 95.2% of them unmarried at the time of birth, while the lowest percentage of unmarried women with births belong to 35 to 50 years age bracket with 44.4% of them unmarried.
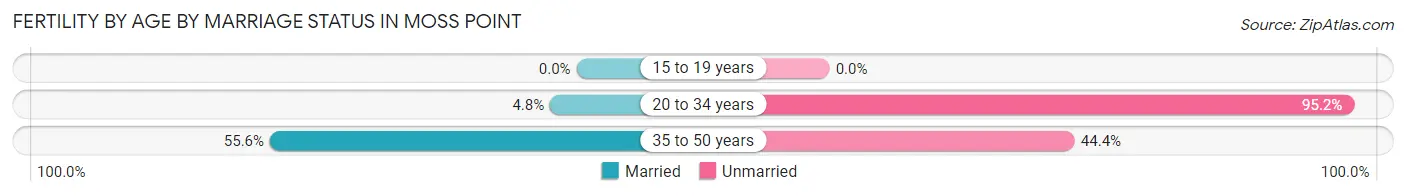
| Age Bracket | Married | Unmarried |
| 15 to 19 years | 0 (0.0%) | 0 (0.0%) |
| 20 to 34 years | 8 (4.8%) | 159 (95.2%) |
| 35 to 50 years | 10 (55.6%) | 8 (44.4%) |
| Total | 18 (9.7%) | 167 (90.3%) |
Fertility by Education in Moss Point
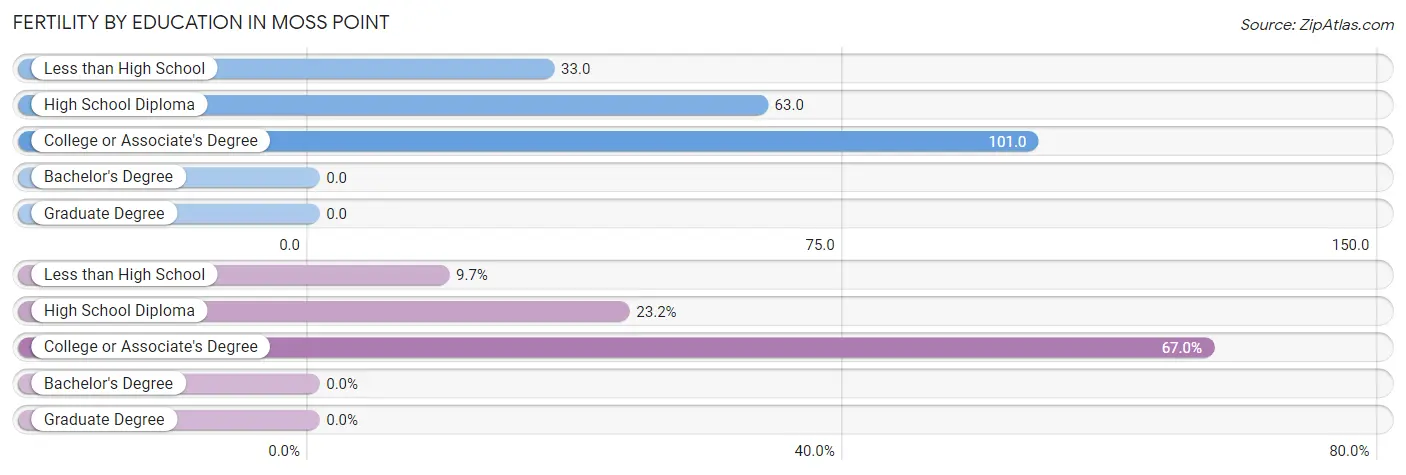
| Educational Attainment | Women with Births | Births / 1,000 Women |
| Less than High School | 18 (9.7%) | 33.0 |
| High School Diploma | 43 (23.2%) | 63.0 |
| College or Associate's Degree | 124 (67.0%) | 101.0 |
| Bachelor's Degree | 0 (0.0%) | 0.0 |
| Graduate Degree | 0 (0.0%) | 0.0 |
| Total | 185 (100.0%) | 67.0 |
Fertility by Education by Marriage Status in Moss Point
90.3% of women with births in Moss Point are unmarried. Women with the educational attainment of college or associate's degree are most likely to be married with 14.5% of them married at childbirth, while women with the educational attainment of less than high school are least likely to be married with 100.0% of them unmarried at childbirth.
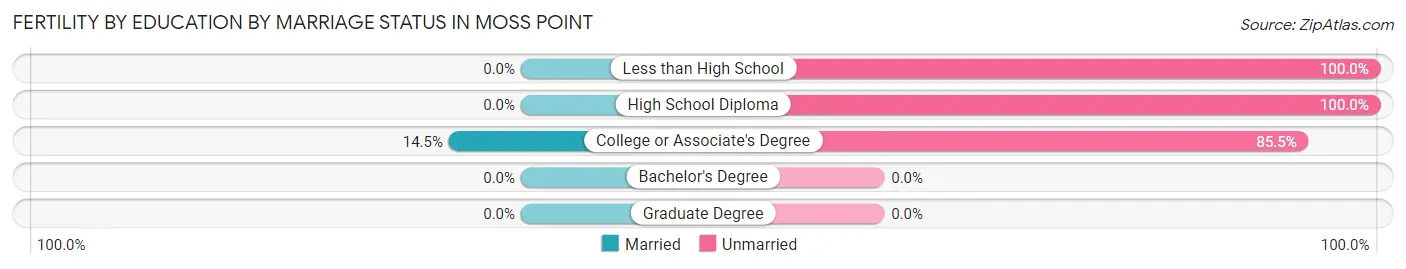
| Educational Attainment | Married | Unmarried |
| Less than High School | 0 (0.0%) | 18 (100.0%) |
| High School Diploma | 0 (0.0%) | 43 (100.0%) |
| College or Associate's Degree | 18 (14.5%) | 106 (85.5%) |
| Bachelor's Degree | 0 (0.0%) | 0 (0.0%) |
| Graduate Degree | 0 (0.0%) | 0 (0.0%) |
| Total | 18 (9.7%) | 167 (90.3%) |
Employment Characteristics in Moss Point
Employment by Class of Employer in Moss Point
Among the 4,680 employed individuals in Moss Point, private company employees (3,313 | 70.8%), local government employees (318 | 6.8%), and federal government employees (241 | 5.1%) make up the most common classes of employment.
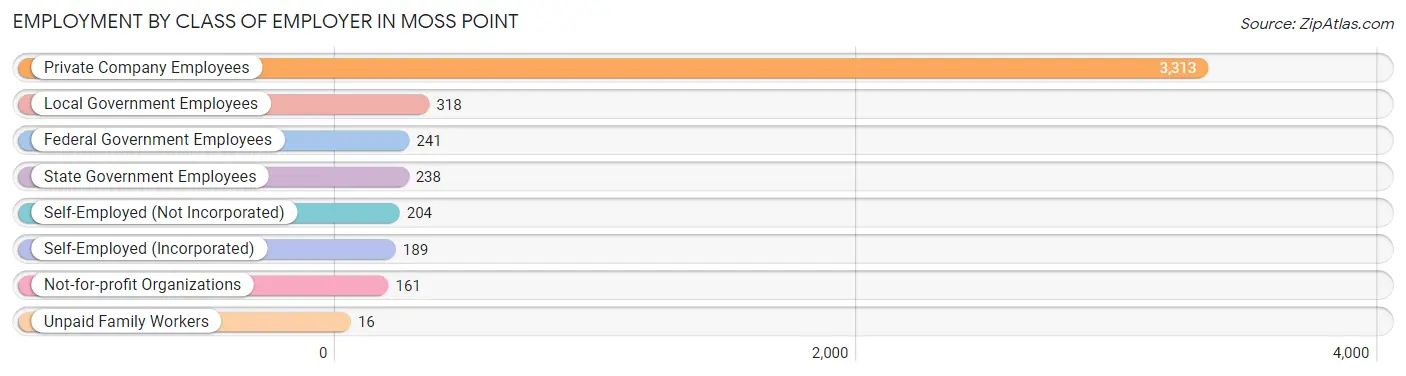
| Employer Class | # Employees | % Employees |
| Private Company Employees | 3,313 | 70.8% |
| Self-Employed (Incorporated) | 189 | 4.0% |
| Self-Employed (Not Incorporated) | 204 | 4.4% |
| Not-for-profit Organizations | 161 | 3.4% |
| Local Government Employees | 318 | 6.8% |
| State Government Employees | 238 | 5.1% |
| Federal Government Employees | 241 | 5.1% |
| Unpaid Family Workers | 16 | 0.3% |
| Total | 4,680 | 100.0% |
Employment Status by Age in Moss Point
According to the labor force statistics for Moss Point, out of the total population over 16 years of age (9,933), 52.9% or 5,255 individuals are in the labor force, with 9.9% or 520 of them unemployed. The age group with the highest labor force participation rate is 30 to 34 years, with 90.4% or 506 individuals in the labor force. Within the labor force, the 75 years and over age range has the highest percentage of unemployed individuals, with 36.4% or 8 of them being unemployed.
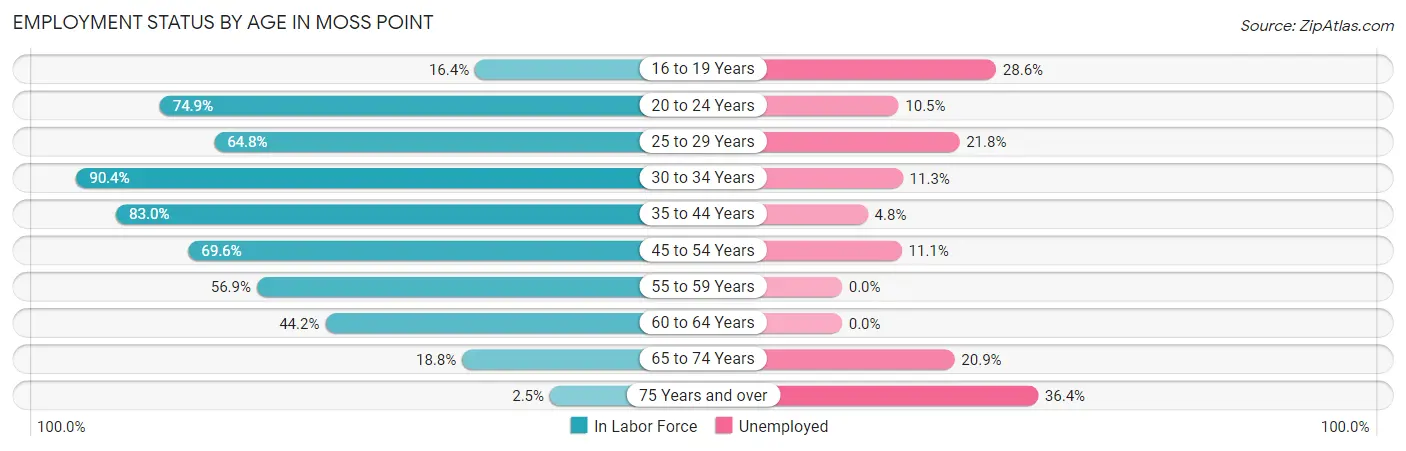
| Age Bracket | In Labor Force | Unemployed |
| 16 to 19 Years | 91 (16.4%) | 26 (28.6%) |
| 20 to 24 Years | 657 (74.9%) | 69 (10.5%) |
| 25 to 29 Years | 518 (64.8%) | 113 (21.8%) |
| 30 to 34 Years | 506 (90.4%) | 57 (11.3%) |
| 35 to 44 Years | 1,404 (83.0%) | 67 (4.8%) |
| 45 to 54 Years | 1,009 (69.6%) | 112 (11.1%) |
| 55 to 59 Years | 257 (56.9%) | 0 (0.0%) |
| 60 to 64 Years | 491 (44.2%) | 0 (0.0%) |
| 65 to 74 Years | 296 (18.8%) | 62 (20.9%) |
| 75 Years and over | 22 (2.5%) | 8 (36.4%) |
| Total | 5,255 (52.9%) | 520 (9.9%) |
Employment Status by Educational Attainment in Moss Point
According to labor force statistics for Moss Point, 69.0% of individuals (4,183) out of the total population between 25 and 64 years of age (6,062) are in the labor force, with 8.4% or 351 of them being unemployed. The group with the highest labor force participation rate are those with the educational attainment of bachelor's degree or higher, with 84.9% or 838 individuals in the labor force. Within the labor force, individuals with less than high school education have the highest percentage of unemployment, with 14.4% or 43 of them being unemployed.
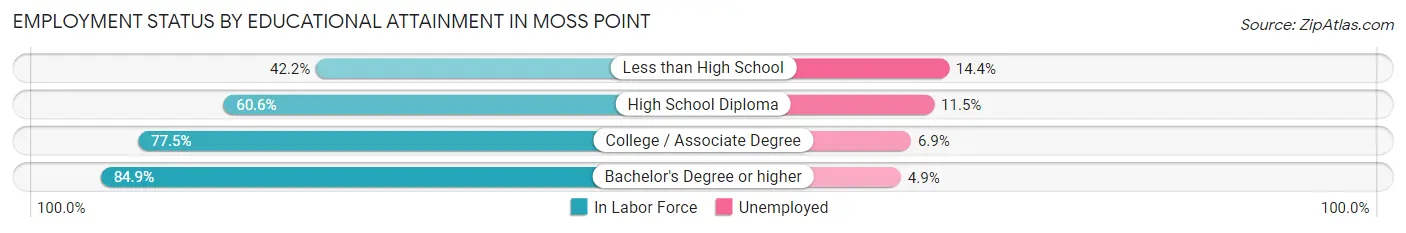
| Educational Attainment | In Labor Force | Unemployed |
| Less than High School | 299 (42.2%) | 102 (14.4%) |
| High School Diploma | 1,213 (60.6%) | 230 (11.5%) |
| College / Associate Degree | 1,833 (77.5%) | 163 (6.9%) |
| Bachelor's Degree or higher | 838 (84.9%) | 48 (4.9%) |
| Total | 4,183 (69.0%) | 509 (8.4%) |
Employment Occupations by Sex in Moss Point
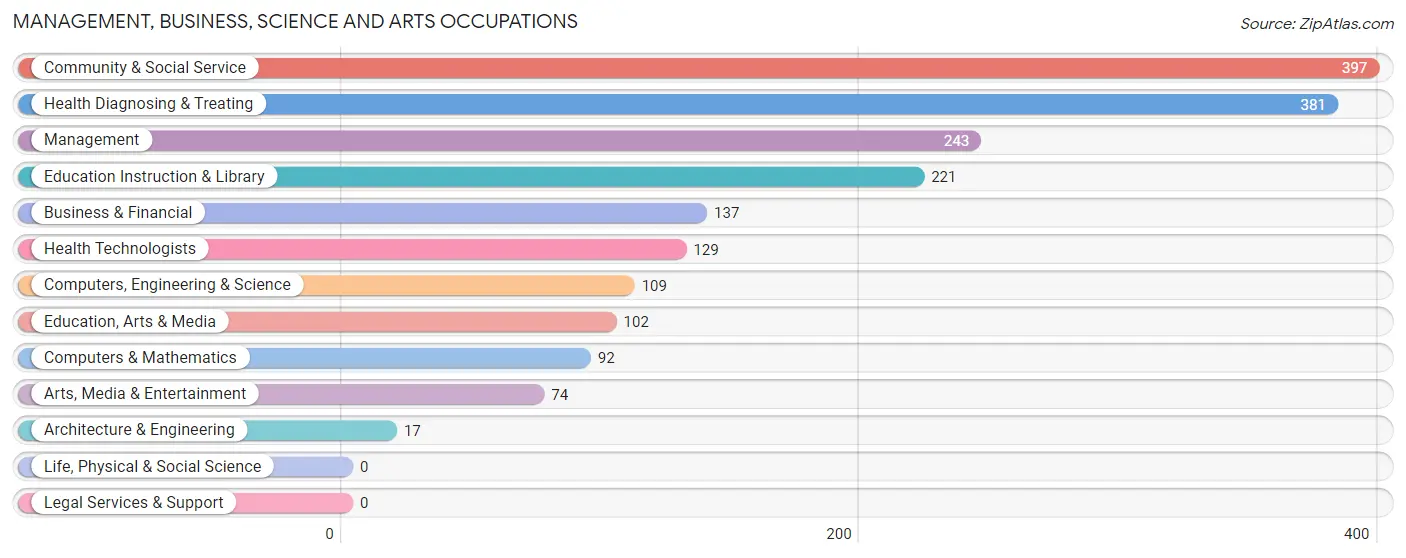
Management, Business, Science and Arts Occupations
The most common Management, Business, Science and Arts occupations in Moss Point are Community & Social Service (397 | 8.5%), Health Diagnosing & Treating (381 | 8.2%), Management (243 | 5.2%), Education Instruction & Library (221 | 4.7%), and Business & Financial (137 | 2.9%).
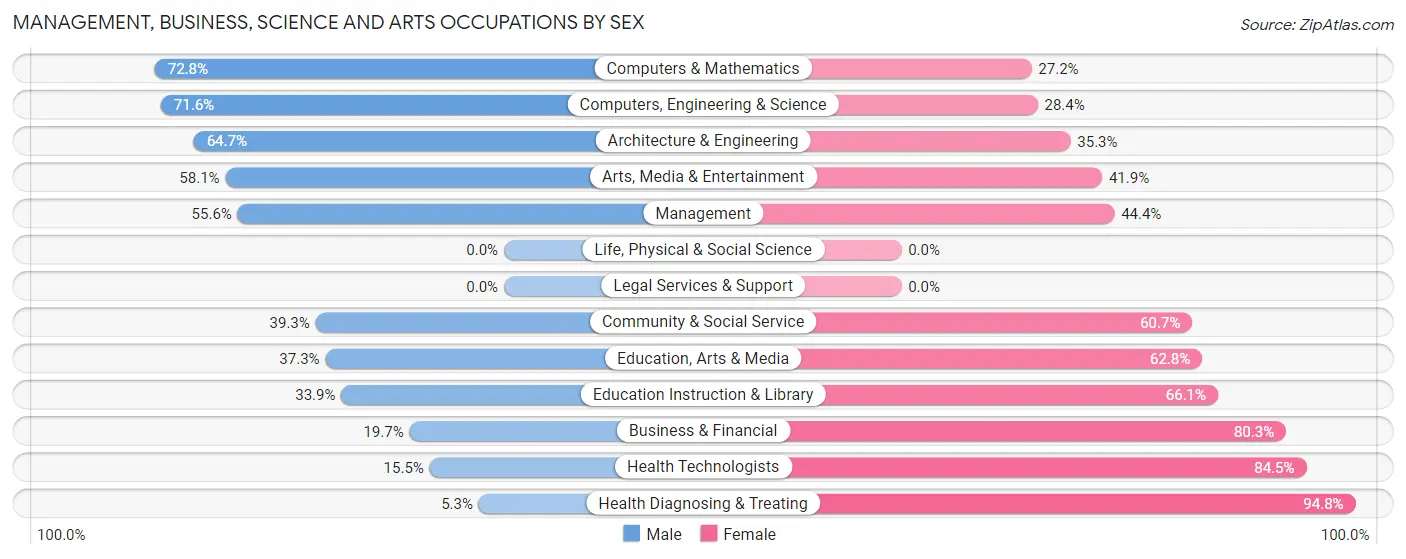
Management, Business, Science and Arts Occupations by Sex
Within the Management, Business, Science and Arts occupations in Moss Point, the most male-oriented occupations are Computers & Mathematics (72.8%), Computers, Engineering & Science (71.6%), and Architecture & Engineering (64.7%), while the most female-oriented occupations are Health Diagnosing & Treating (94.8%), Health Technologists (84.5%), and Business & Financial (80.3%).
| Occupation | Male | Female |
| Management | 135 (55.6%) | 108 (44.4%) |
| Business & Financial | 27 (19.7%) | 110 (80.3%) |
| Computers, Engineering & Science | 78 (71.6%) | 31 (28.4%) |
| Computers & Mathematics | 67 (72.8%) | 25 (27.2%) |
| Architecture & Engineering | 11 (64.7%) | 6 (35.3%) |
| Life, Physical & Social Science | 0 (0.0%) | 0 (0.0%) |
| Community & Social Service | 156 (39.3%) | 241 (60.7%) |
| Education, Arts & Media | 38 (37.2%) | 64 (62.7%) |
| Legal Services & Support | 0 (0.0%) | 0 (0.0%) |
| Education Instruction & Library | 75 (33.9%) | 146 (66.1%) |
| Arts, Media & Entertainment | 43 (58.1%) | 31 (41.9%) |
| Health Diagnosing & Treating | 20 (5.2%) | 361 (94.8%) |
| Health Technologists | 20 (15.5%) | 109 (84.5%) |
| Total (Category) | 416 (32.8%) | 851 (67.2%) |
| Total (Overall) | 2,157 (46.3%) | 2,503 (53.7%) |
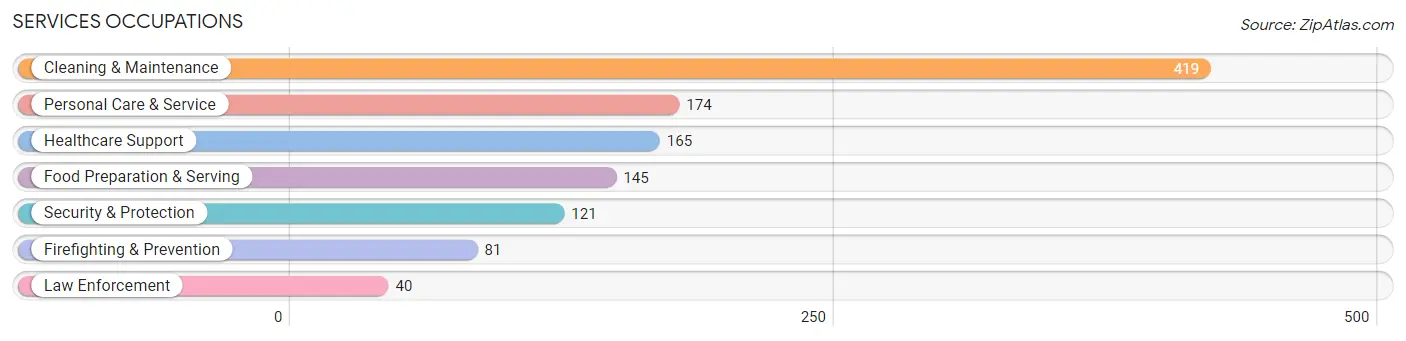
Services Occupations
The most common Services occupations in Moss Point are Cleaning & Maintenance (419 | 9.0%), Personal Care & Service (174 | 3.7%), Healthcare Support (165 | 3.5%), Food Preparation & Serving (145 | 3.1%), and Security & Protection (121 | 2.6%).
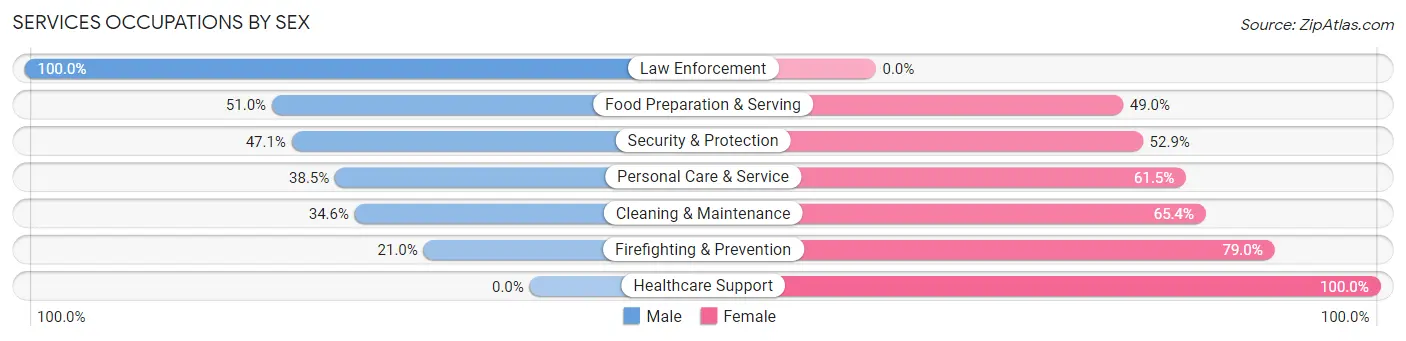
Services Occupations by Sex
Within the Services occupations in Moss Point, the most male-oriented occupations are Law Enforcement (100.0%), Food Preparation & Serving (51.0%), and Security & Protection (47.1%), while the most female-oriented occupations are Healthcare Support (100.0%), Firefighting & Prevention (79.0%), and Cleaning & Maintenance (65.4%).
| Occupation | Male | Female |
| Healthcare Support | 0 (0.0%) | 165 (100.0%) |
| Security & Protection | 57 (47.1%) | 64 (52.9%) |
| Firefighting & Prevention | 17 (21.0%) | 64 (79.0%) |
| Law Enforcement | 40 (100.0%) | 0 (0.0%) |
| Food Preparation & Serving | 74 (51.0%) | 71 (49.0%) |
| Cleaning & Maintenance | 145 (34.6%) | 274 (65.4%) |
| Personal Care & Service | 67 (38.5%) | 107 (61.5%) |
| Total (Category) | 343 (33.5%) | 681 (66.5%) |
| Total (Overall) | 2,157 (46.3%) | 2,503 (53.7%) |
Sales and Office Occupations
The most common Sales and Office occupations in Moss Point are Office & Administration (519 | 11.1%), and Sales & Related (393 | 8.4%).
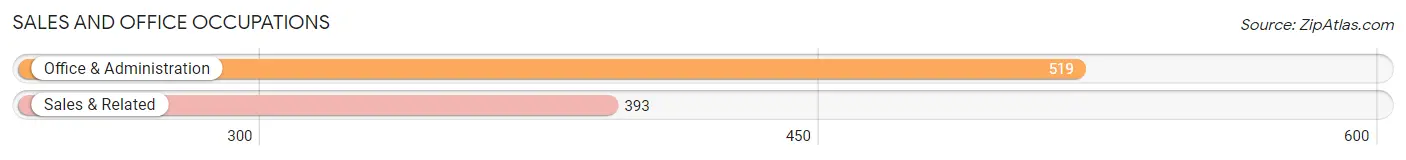
Sales and Office Occupations by Sex
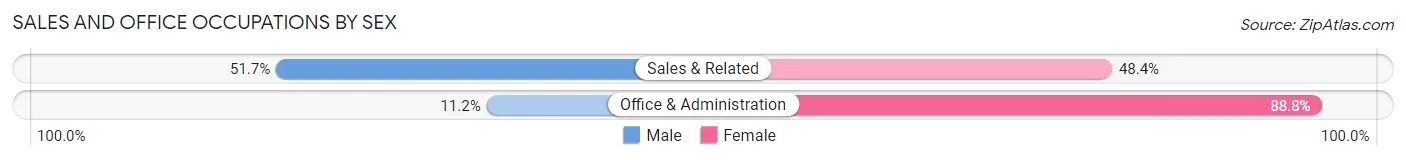
| Occupation | Male | Female |
| Sales & Related | 203 (51.6%) | 190 (48.3%) |
| Office & Administration | 58 (11.2%) | 461 (88.8%) |
| Total (Category) | 261 (28.6%) | 651 (71.4%) |
| Total (Overall) | 2,157 (46.3%) | 2,503 (53.7%) |
Natural Resources, Construction and Maintenance Occupations
The most common Natural Resources, Construction and Maintenance occupations in Moss Point are Construction & Extraction (301 | 6.5%), Installation, Maintenance & Repair (155 | 3.3%), and Farming, Fishing & Forestry (5 | 0.1%).
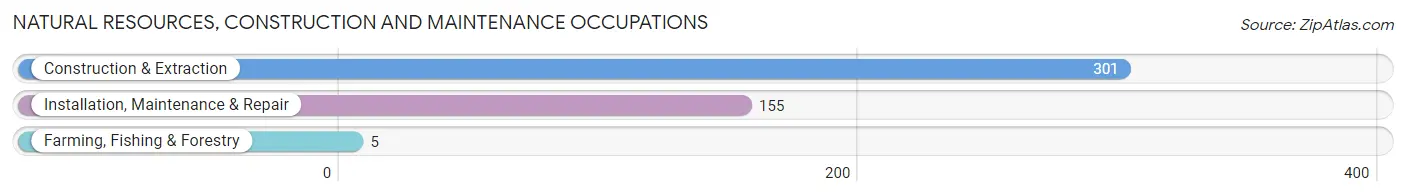
Natural Resources, Construction and Maintenance Occupations by Sex
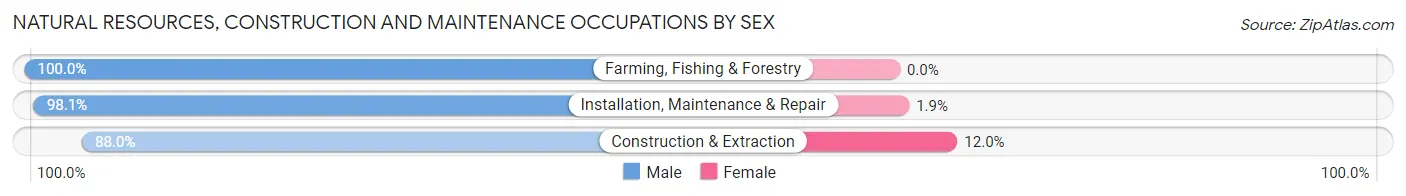
| Occupation | Male | Female |
| Farming, Fishing & Forestry | 5 (100.0%) | 0 (0.0%) |
| Construction & Extraction | 265 (88.0%) | 36 (12.0%) |
| Installation, Maintenance & Repair | 152 (98.1%) | 3 (1.9%) |
| Total (Category) | 422 (91.5%) | 39 (8.5%) |
| Total (Overall) | 2,157 (46.3%) | 2,503 (53.7%) |
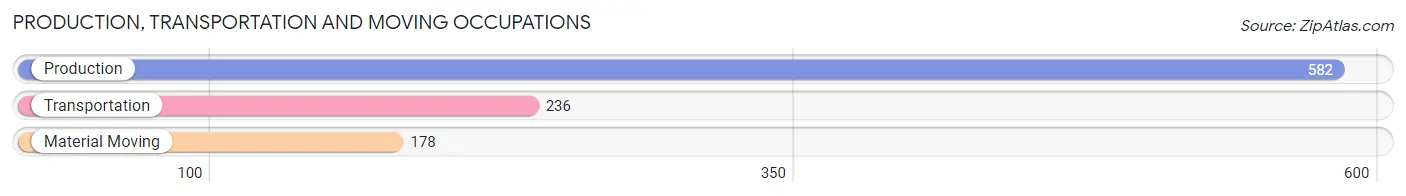
Production, Transportation and Moving Occupations
The most common Production, Transportation and Moving occupations in Moss Point are Production (582 | 12.5%), Transportation (236 | 5.1%), and Material Moving (178 | 3.8%).
Production, Transportation and Moving Occupations by Sex
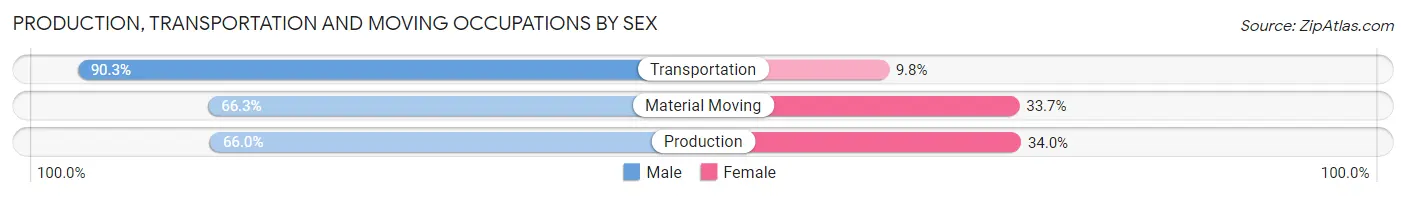
| Occupation | Male | Female |
| Production | 384 (66.0%) | 198 (34.0%) |
| Transportation | 213 (90.2%) | 23 (9.8%) |
| Material Moving | 118 (66.3%) | 60 (33.7%) |
| Total (Category) | 715 (71.8%) | 281 (28.2%) |
| Total (Overall) | 2,157 (46.3%) | 2,503 (53.7%) |
Employment Industries by Sex in Moss Point
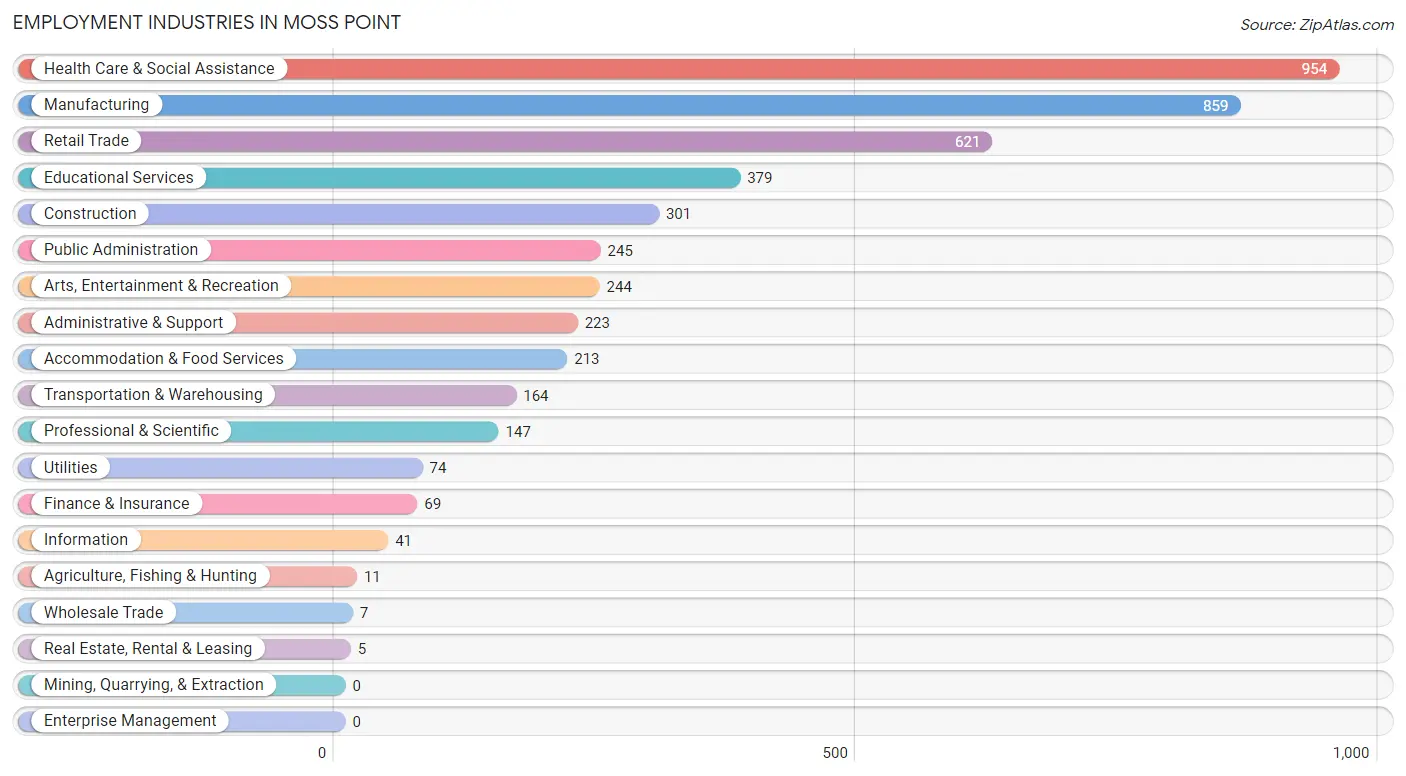
Employment Industries in Moss Point
The major employment industries in Moss Point include Health Care & Social Assistance (954 | 20.5%), Manufacturing (859 | 18.4%), Retail Trade (621 | 13.3%), Educational Services (379 | 8.1%), and Construction (301 | 6.5%).
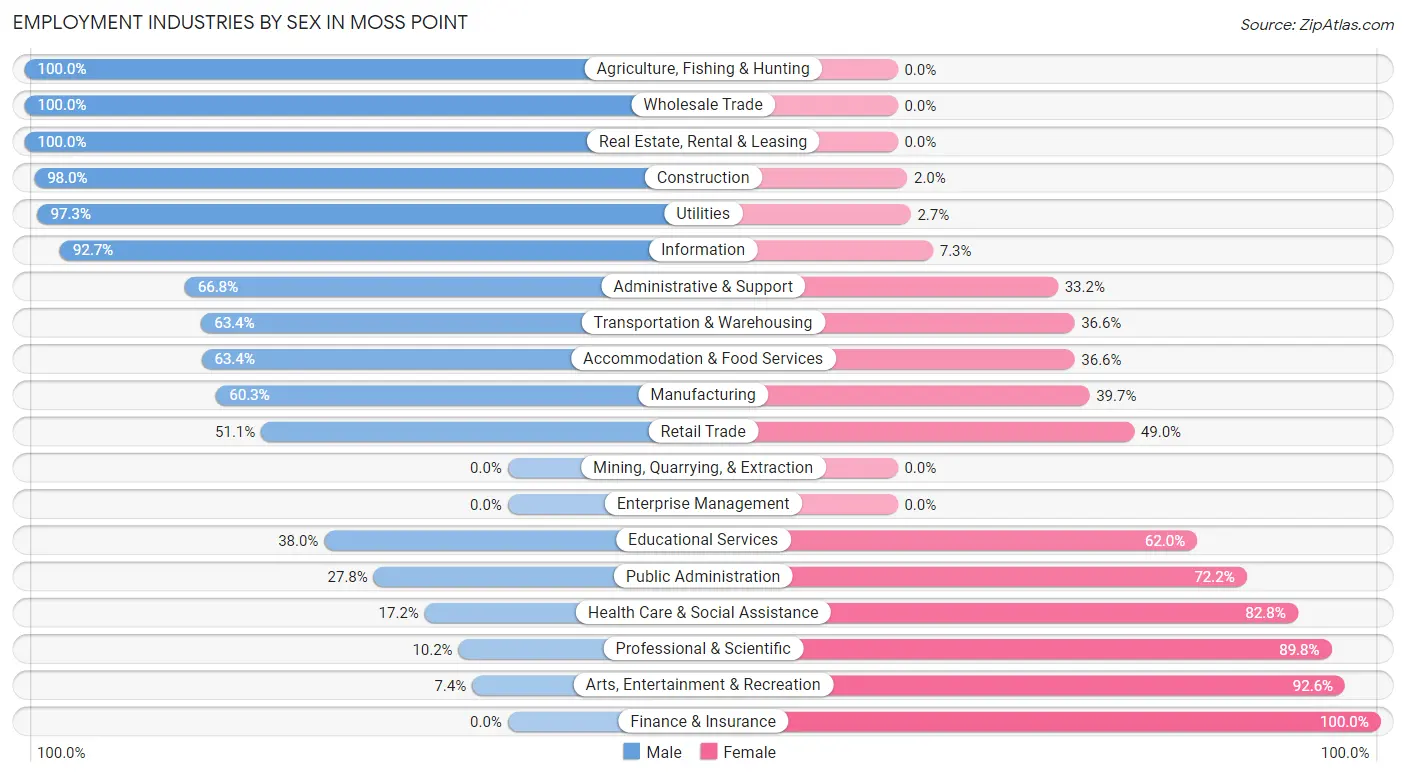
Employment Industries by Sex in Moss Point
The Moss Point industries that see more men than women are Agriculture, Fishing & Hunting (100.0%), Wholesale Trade (100.0%), and Real Estate, Rental & Leasing (100.0%), whereas the industries that tend to have a higher number of women are Finance & Insurance (100.0%), Arts, Entertainment & Recreation (92.6%), and Professional & Scientific (89.8%).
| Industry | Male | Female |
| Agriculture, Fishing & Hunting | 11 (100.0%) | 0 (0.0%) |
| Mining, Quarrying, & Extraction | 0 (0.0%) | 0 (0.0%) |
| Construction | 295 (98.0%) | 6 (2.0%) |
| Manufacturing | 518 (60.3%) | 341 (39.7%) |
| Wholesale Trade | 7 (100.0%) | 0 (0.0%) |
| Retail Trade | 317 (51.0%) | 304 (48.9%) |
| Transportation & Warehousing | 104 (63.4%) | 60 (36.6%) |
| Utilities | 72 (97.3%) | 2 (2.7%) |
| Information | 38 (92.7%) | 3 (7.3%) |
| Finance & Insurance | 0 (0.0%) | 69 (100.0%) |
| Real Estate, Rental & Leasing | 5 (100.0%) | 0 (0.0%) |
| Professional & Scientific | 15 (10.2%) | 132 (89.8%) |
| Enterprise Management | 0 (0.0%) | 0 (0.0%) |
| Administrative & Support | 149 (66.8%) | 74 (33.2%) |
| Educational Services | 144 (38.0%) | 235 (62.0%) |
| Health Care & Social Assistance | 164 (17.2%) | 790 (82.8%) |
| Arts, Entertainment & Recreation | 18 (7.4%) | 226 (92.6%) |
| Accommodation & Food Services | 135 (63.4%) | 78 (36.6%) |
| Public Administration | 68 (27.8%) | 177 (72.2%) |
| Total | 2,157 (46.3%) | 2,503 (53.7%) |
Education in Moss Point
School Enrollment in Moss Point
The most common levels of schooling among the 2,252 students in Moss Point are high school (673 | 29.9%), elementary school (508 | 22.6%), and middle school (453 | 20.1%).
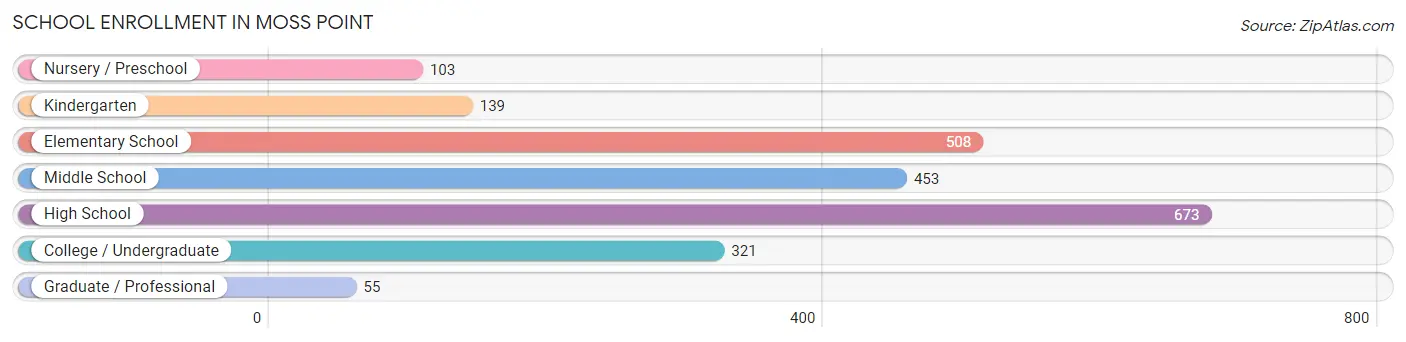
| School Level | # Students | % Students |
| Nursery / Preschool | 103 | 4.6% |
| Kindergarten | 139 | 6.2% |
| Elementary School | 508 | 22.6% |
| Middle School | 453 | 20.1% |
| High School | 673 | 29.9% |
| College / Undergraduate | 321 | 14.2% |
| Graduate / Professional | 55 | 2.4% |
| Total | 2,252 | 100.0% |
School Enrollment by Age by Funding Source in Moss Point
Out of a total of 2,252 students who are enrolled in schools in Moss Point, 187 (8.3%) attend a private institution, while the remaining 2,065 (91.7%) are enrolled in public schools. The age group of 35 years and over has the highest likelihood of being enrolled in private schools, with 22 (29.3% in the age bracket) enrolled. Conversely, the age group of 18 to 19 year olds has the lowest likelihood of being enrolled in a private school, with 127 (100.0% in the age bracket) attending a public institution.
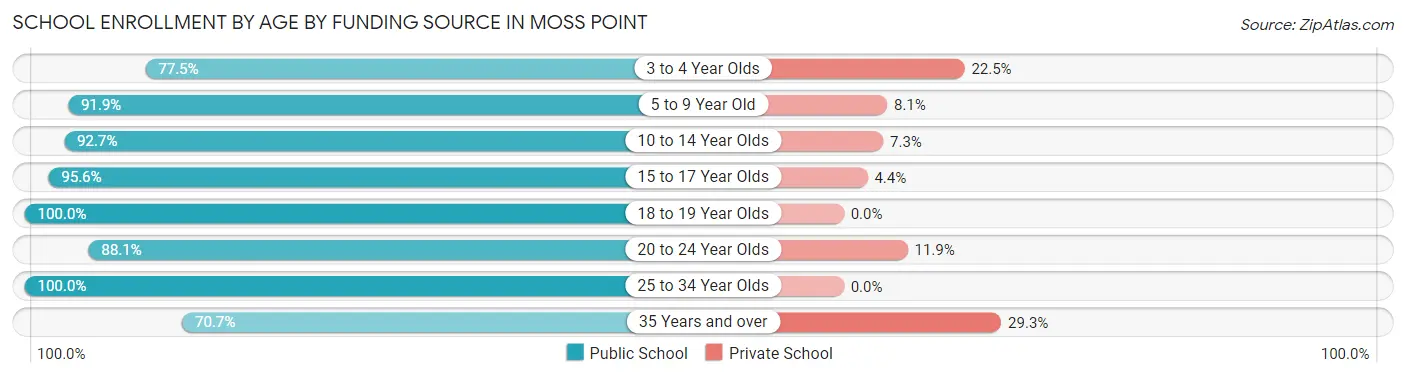
| Age Bracket | Public School | Private School |
| 3 to 4 Year Olds | 93 (77.5%) | 27 (22.5%) |
| 5 to 9 Year Old | 512 (91.9%) | 45 (8.1%) |
| 10 to 14 Year Olds | 568 (92.7%) | 45 (7.3%) |
| 15 to 17 Year Olds | 453 (95.6%) | 21 (4.4%) |
| 18 to 19 Year Olds | 127 (100.0%) | 0 (0.0%) |
| 20 to 24 Year Olds | 200 (88.1%) | 27 (11.9%) |
| 25 to 34 Year Olds | 59 (100.0%) | 0 (0.0%) |
| 35 Years and over | 53 (70.7%) | 22 (29.3%) |
| Total | 2,065 (91.7%) | 187 (8.3%) |
Educational Attainment by Field of Study in Moss Point
Business (252 | 17.9%), education (207 | 14.7%), computers & mathematics (142 | 10.1%), arts & humanities (138 | 9.8%), and science & technology (137 | 9.7%) are the most common fields of study among 1,410 individuals in Moss Point who have obtained a bachelor's degree or higher.
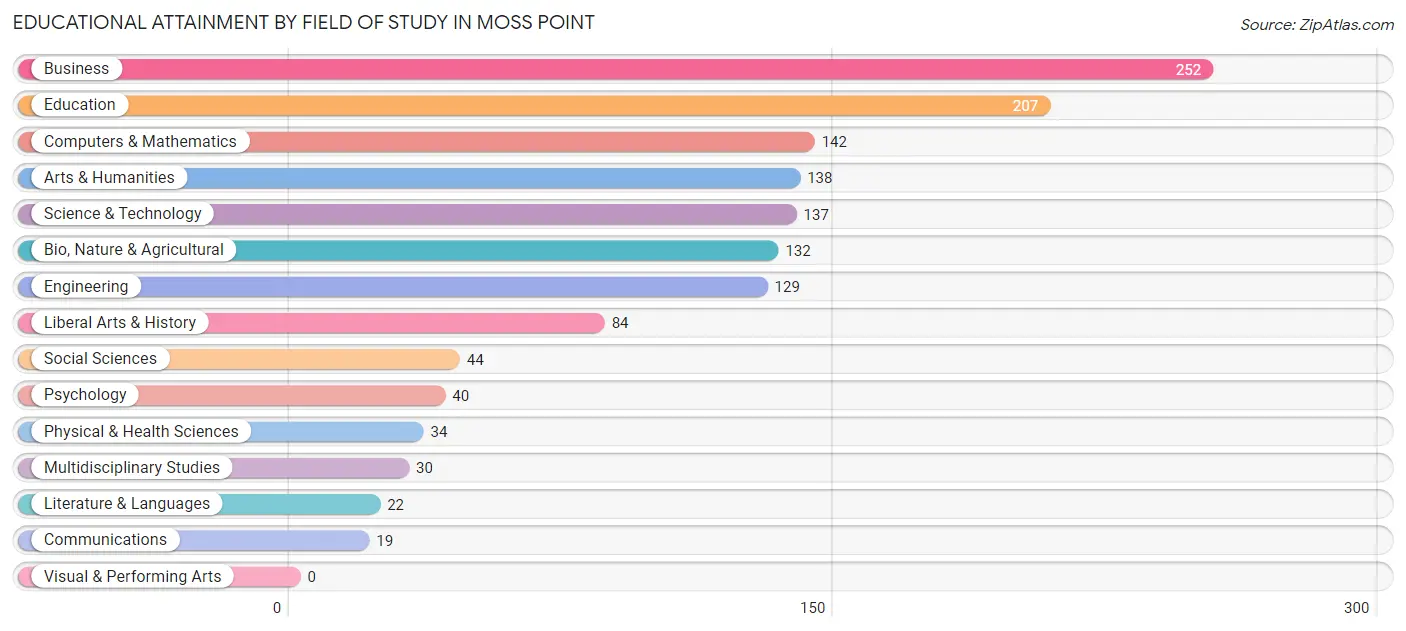
| Field of Study | # Graduates | % Graduates |
| Computers & Mathematics | 142 | 10.1% |
| Bio, Nature & Agricultural | 132 | 9.4% |
| Physical & Health Sciences | 34 | 2.4% |
| Psychology | 40 | 2.8% |
| Social Sciences | 44 | 3.1% |
| Engineering | 129 | 9.1% |
| Multidisciplinary Studies | 30 | 2.1% |
| Science & Technology | 137 | 9.7% |
| Business | 252 | 17.9% |
| Education | 207 | 14.7% |
| Literature & Languages | 22 | 1.6% |
| Liberal Arts & History | 84 | 6.0% |
| Visual & Performing Arts | 0 | 0.0% |
| Communications | 19 | 1.3% |
| Arts & Humanities | 138 | 9.8% |
| Total | 1,410 | 100.0% |
Transportation & Commute in Moss Point
Vehicle Availability by Sex in Moss Point
The most prevalent vehicle ownership categories in Moss Point are males with 2 vehicles (891, accounting for 40.4%) and females with 2 vehicles (948, making up 36.1%).
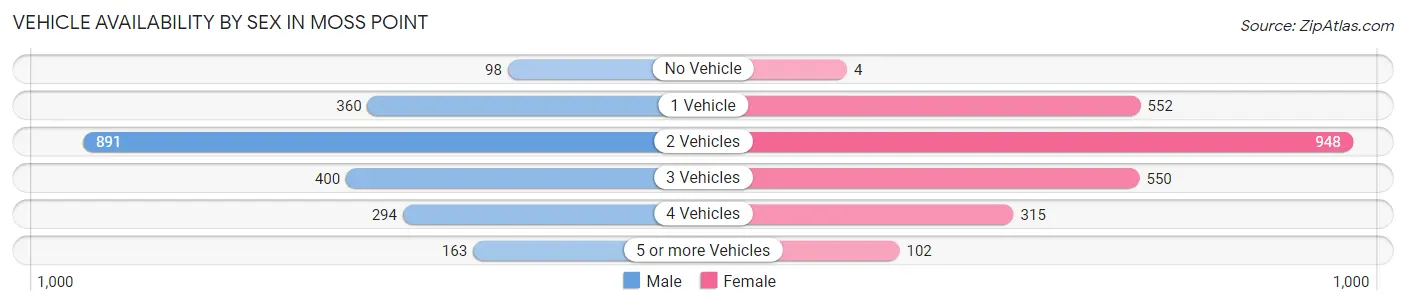
| Vehicles Available | Male | Female |
| No Vehicle | 98 (4.4%) | 4 (0.2%) |
| 1 Vehicle | 360 (16.3%) | 552 (22.3%) |
| 2 Vehicles | 891 (40.4%) | 948 (38.4%) |
| 3 Vehicles | 400 (18.1%) | 550 (22.3%) |
| 4 Vehicles | 294 (13.3%) | 315 (12.8%) |
| 5 or more Vehicles | 163 (7.4%) | 102 (4.1%) |
| Total | 2,206 (100.0%) | 2,471 (100.0%) |
Commute Time in Moss Point
The most frequently occuring commute durations in Moss Point are 10 to 14 minutes (1,038 commuters, 22.4%), 15 to 19 minutes (1,023 commuters, 22.1%), and 20 to 24 minutes (595 commuters, 12.9%).
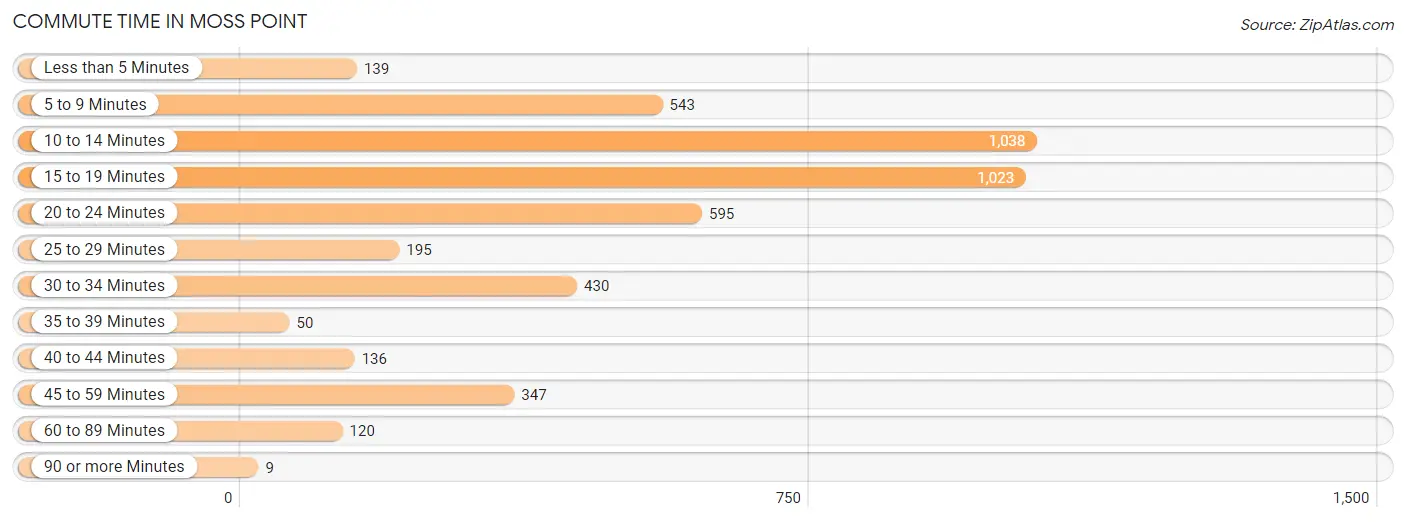
| Commute Time | # Commuters | % Commuters |
| Less than 5 Minutes | 139 | 3.0% |
| 5 to 9 Minutes | 543 | 11.7% |
| 10 to 14 Minutes | 1,038 | 22.4% |
| 15 to 19 Minutes | 1,023 | 22.1% |
| 20 to 24 Minutes | 595 | 12.9% |
| 25 to 29 Minutes | 195 | 4.2% |
| 30 to 34 Minutes | 430 | 9.3% |
| 35 to 39 Minutes | 50 | 1.1% |
| 40 to 44 Minutes | 136 | 2.9% |
| 45 to 59 Minutes | 347 | 7.5% |
| 60 to 89 Minutes | 120 | 2.6% |
| 90 or more Minutes | 9 | 0.2% |
Commute Time by Sex in Moss Point
The most common commute times in Moss Point are 15 to 19 minutes (669 commuters, 30.6%) for males and 10 to 14 minutes (729 commuters, 29.9%) for females.
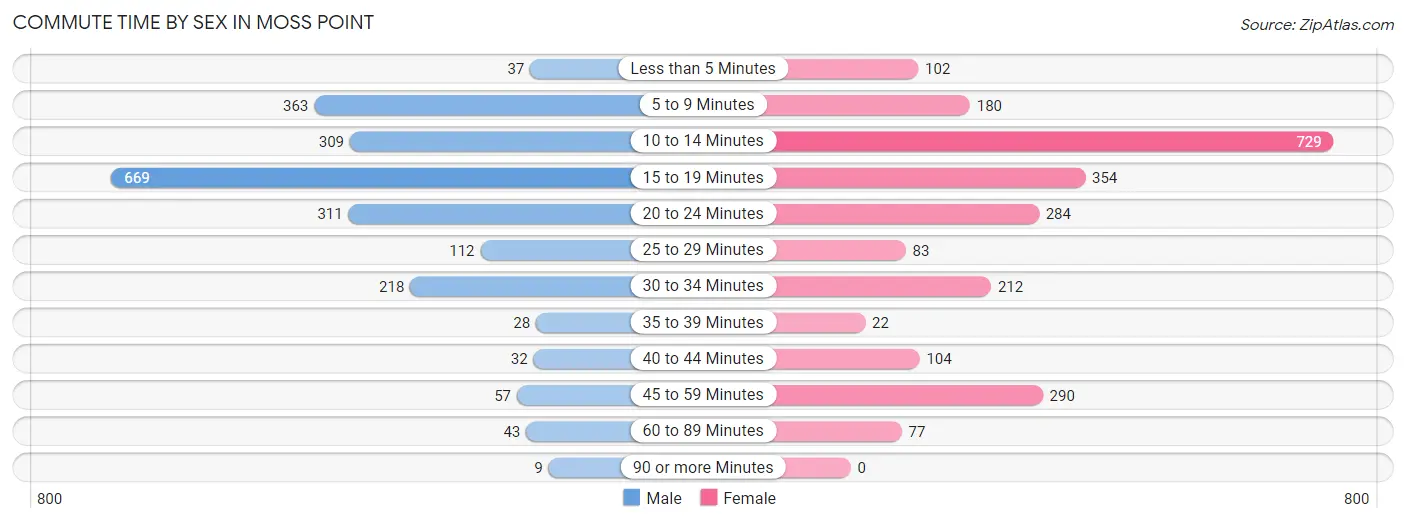
| Commute Time | Male | Female |
| Less than 5 Minutes | 37 (1.7%) | 102 (4.2%) |
| 5 to 9 Minutes | 363 (16.6%) | 180 (7.4%) |
| 10 to 14 Minutes | 309 (14.1%) | 729 (29.9%) |
| 15 to 19 Minutes | 669 (30.6%) | 354 (14.5%) |
| 20 to 24 Minutes | 311 (14.2%) | 284 (11.7%) |
| 25 to 29 Minutes | 112 (5.1%) | 83 (3.4%) |
| 30 to 34 Minutes | 218 (10.0%) | 212 (8.7%) |
| 35 to 39 Minutes | 28 (1.3%) | 22 (0.9%) |
| 40 to 44 Minutes | 32 (1.5%) | 104 (4.3%) |
| 45 to 59 Minutes | 57 (2.6%) | 290 (11.9%) |
| 60 to 89 Minutes | 43 (2.0%) | 77 (3.2%) |
| 90 or more Minutes | 9 (0.4%) | 0 (0.0%) |
Time of Departure to Work by Sex in Moss Point
The most frequent times of departure to work in Moss Point are 12:00 AM to 4:59 AM (385, 17.6%) for males and 7:00 AM to 7:29 AM (332, 13.6%) for females.
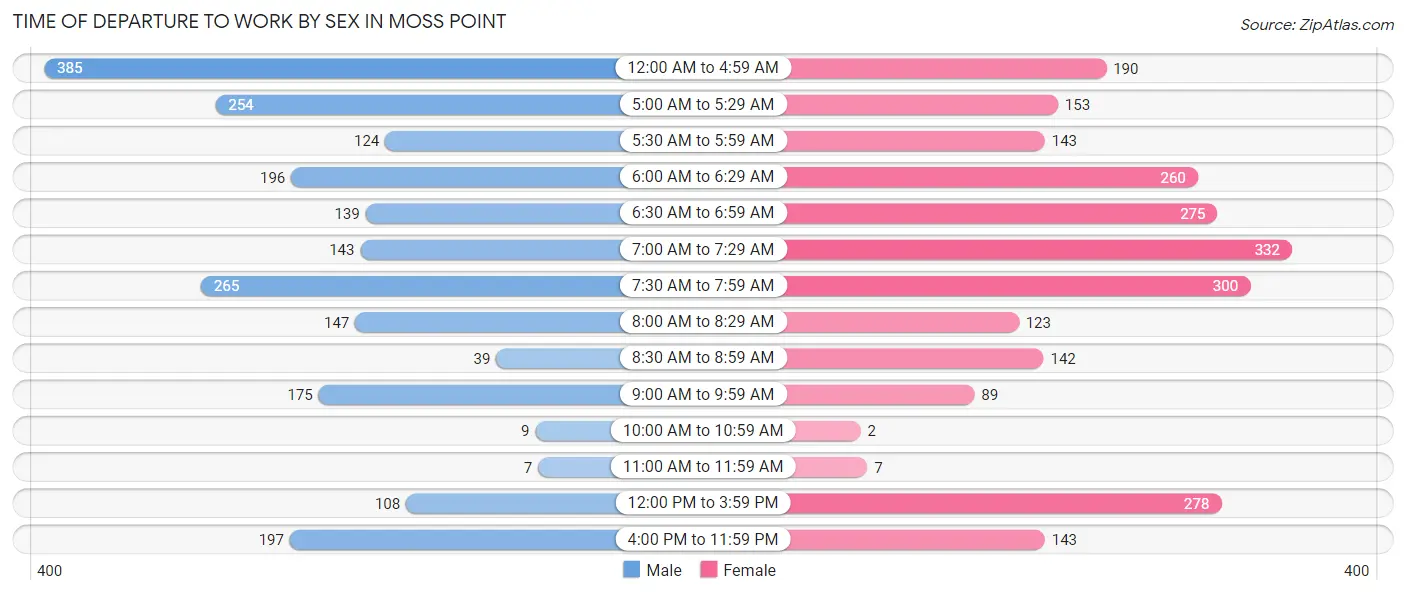
| Time of Departure | Male | Female |
| 12:00 AM to 4:59 AM | 385 (17.6%) | 190 (7.8%) |
| 5:00 AM to 5:29 AM | 254 (11.6%) | 153 (6.3%) |
| 5:30 AM to 5:59 AM | 124 (5.7%) | 143 (5.9%) |
| 6:00 AM to 6:29 AM | 196 (9.0%) | 260 (10.7%) |
| 6:30 AM to 6:59 AM | 139 (6.4%) | 275 (11.3%) |
| 7:00 AM to 7:29 AM | 143 (6.5%) | 332 (13.6%) |
| 7:30 AM to 7:59 AM | 265 (12.1%) | 300 (12.3%) |
| 8:00 AM to 8:29 AM | 147 (6.7%) | 123 (5.1%) |
| 8:30 AM to 8:59 AM | 39 (1.8%) | 142 (5.8%) |
| 9:00 AM to 9:59 AM | 175 (8.0%) | 89 (3.6%) |
| 10:00 AM to 10:59 AM | 9 (0.4%) | 2 (0.1%) |
| 11:00 AM to 11:59 AM | 7 (0.3%) | 7 (0.3%) |
| 12:00 PM to 3:59 PM | 108 (4.9%) | 278 (11.4%) |
| 4:00 PM to 11:59 PM | 197 (9.0%) | 143 (5.9%) |
| Total | 2,188 (100.0%) | 2,437 (100.0%) |
Housing Occupancy in Moss Point
Occupancy by Ownership in Moss Point
Of the total 4,622 dwellings in Moss Point, owner-occupied units account for 3,453 (74.7%), while renter-occupied units make up 1,169 (25.3%).
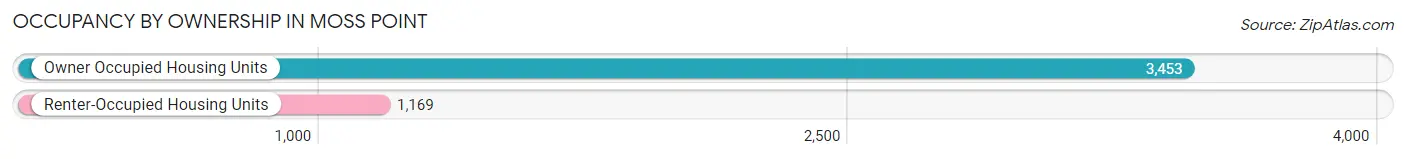
| Occupancy | # Housing Units | % Housing Units |
| Owner Occupied Housing Units | 3,453 | 74.7% |
| Renter-Occupied Housing Units | 1,169 | 25.3% |
| Total Occupied Housing Units | 4,622 | 100.0% |
Occupancy by Household Size in Moss Point
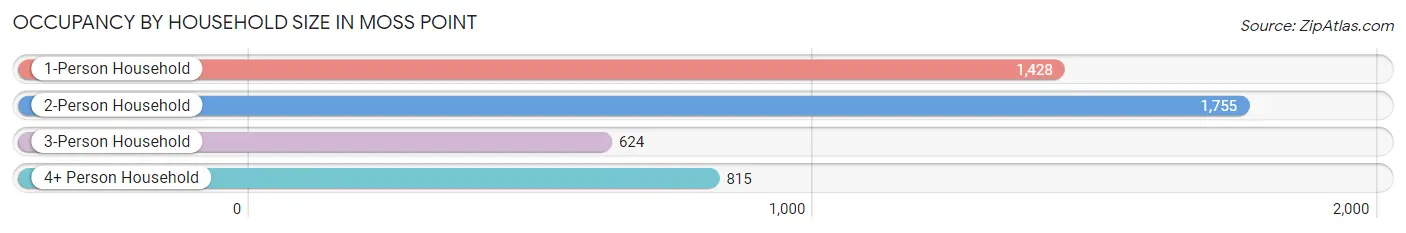
| Household Size | # Housing Units | % Housing Units |
| 1-Person Household | 1,428 | 30.9% |
| 2-Person Household | 1,755 | 38.0% |
| 3-Person Household | 624 | 13.5% |
| 4+ Person Household | 815 | 17.6% |
| Total Housing Units | 4,622 | 100.0% |
Occupancy by Ownership by Household Size in Moss Point
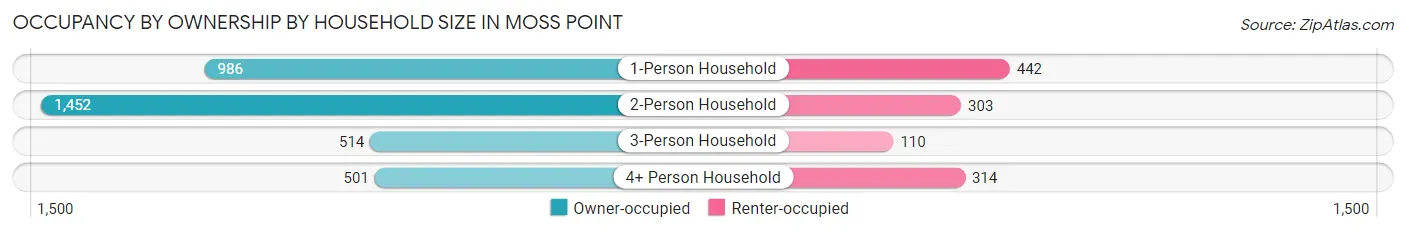
| Household Size | Owner-occupied | Renter-occupied |
| 1-Person Household | 986 (69.1%) | 442 (30.9%) |
| 2-Person Household | 1,452 (82.7%) | 303 (17.3%) |
| 3-Person Household | 514 (82.4%) | 110 (17.6%) |
| 4+ Person Household | 501 (61.5%) | 314 (38.5%) |
| Total Housing Units | 3,453 (74.7%) | 1,169 (25.3%) |
Occupancy by Educational Attainment in Moss Point
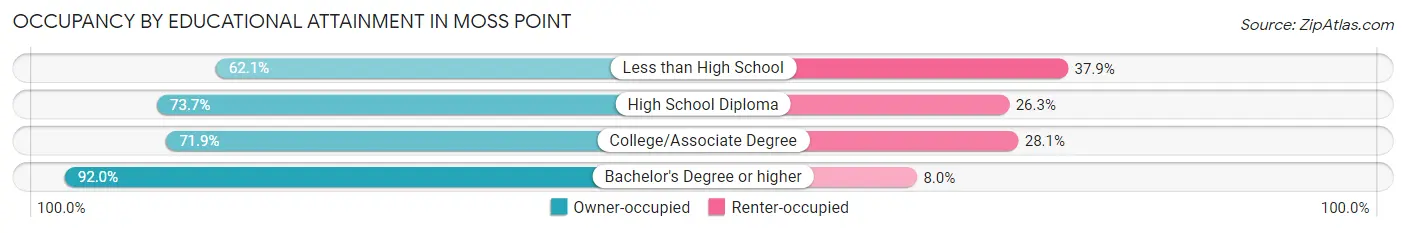
| Household Size | Owner-occupied | Renter-occupied |
| Less than High School | 337 (62.1%) | 206 (37.9%) |
| High School Diploma | 1,083 (73.7%) | 386 (26.3%) |
| College/Associate Degree | 1,319 (71.9%) | 515 (28.1%) |
| Bachelor's Degree or higher | 714 (92.0%) | 62 (8.0%) |
Occupancy by Age of Householder in Moss Point
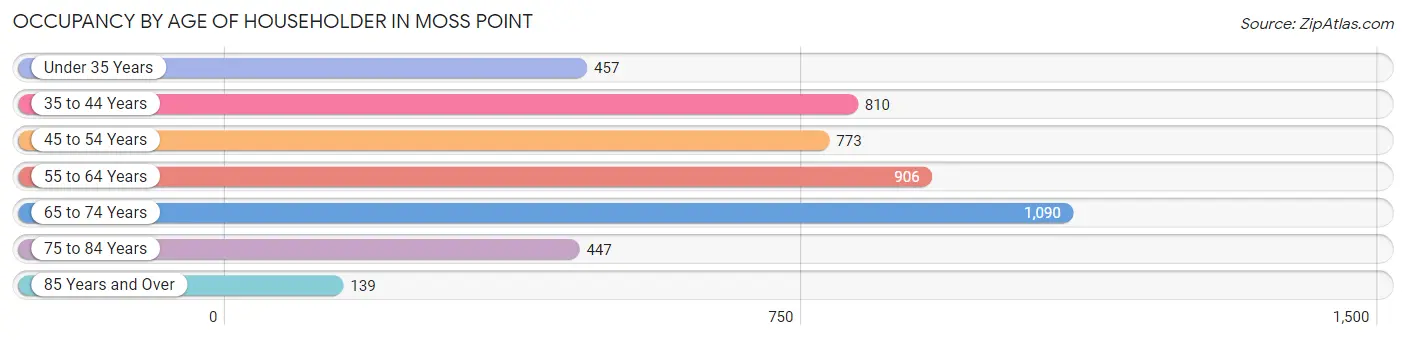
| Age Bracket | # Households | % Households |
| Under 35 Years | 457 | 9.9% |
| 35 to 44 Years | 810 | 17.5% |
| 45 to 54 Years | 773 | 16.7% |
| 55 to 64 Years | 906 | 19.6% |
| 65 to 74 Years | 1,090 | 23.6% |
| 75 to 84 Years | 447 | 9.7% |
| 85 Years and Over | 139 | 3.0% |
| Total | 4,622 | 100.0% |
Housing Finances in Moss Point
Median Income by Occupancy in Moss Point
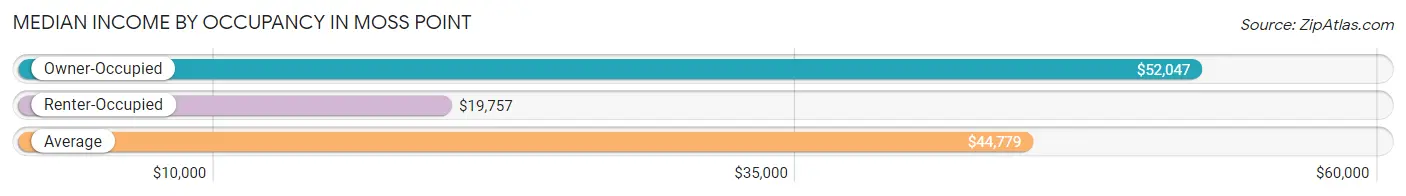
| Occupancy Type | # Households | Median Income |
| Owner-Occupied | 3,453 (74.7%) | $52,047 |
| Renter-Occupied | 1,169 (25.3%) | $19,757 |
| Average | 4,622 (100.0%) | $44,779 |
Occupancy by Householder Income Bracket in Moss Point
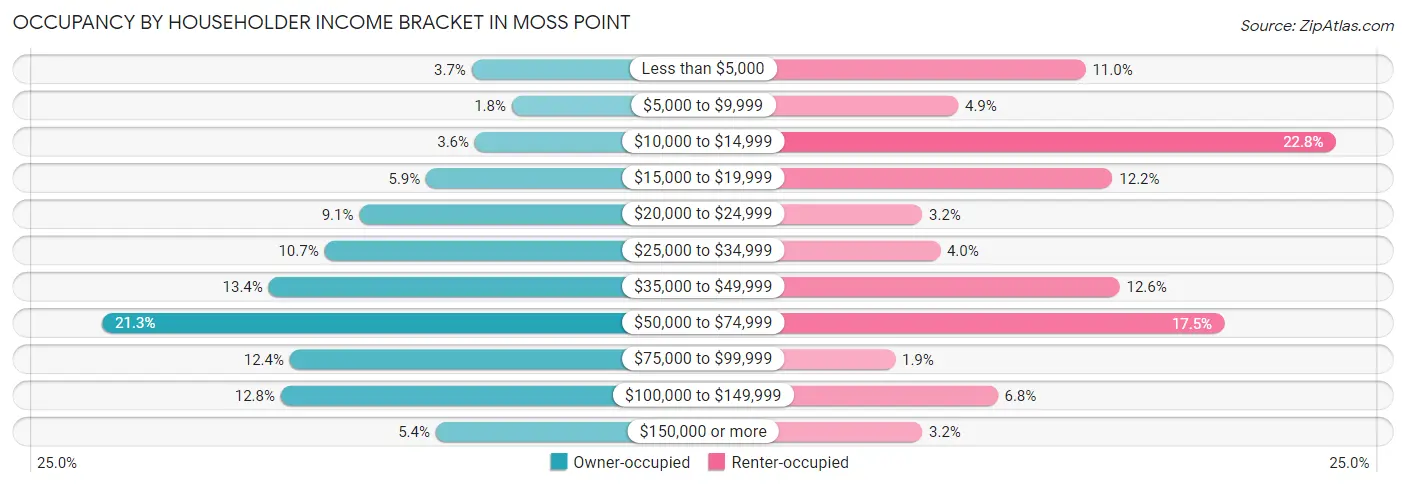
| Income Bracket | Owner-occupied | Renter-occupied |
| Less than $5,000 | 128 (3.7%) | 128 (11.0%) |
| $5,000 to $9,999 | 62 (1.8%) | 57 (4.9%) |
| $10,000 to $14,999 | 123 (3.6%) | 267 (22.8%) |
| $15,000 to $19,999 | 203 (5.9%) | 143 (12.2%) |
| $20,000 to $24,999 | 313 (9.1%) | 37 (3.2%) |
| $25,000 to $34,999 | 370 (10.7%) | 47 (4.0%) |
| $35,000 to $49,999 | 462 (13.4%) | 147 (12.6%) |
| $50,000 to $74,999 | 736 (21.3%) | 205 (17.5%) |
| $75,000 to $99,999 | 427 (12.4%) | 22 (1.9%) |
| $100,000 to $149,999 | 442 (12.8%) | 79 (6.8%) |
| $150,000 or more | 187 (5.4%) | 37 (3.2%) |
| Total | 3,453 (100.0%) | 1,169 (100.0%) |
Monthly Housing Cost Tiers in Moss Point
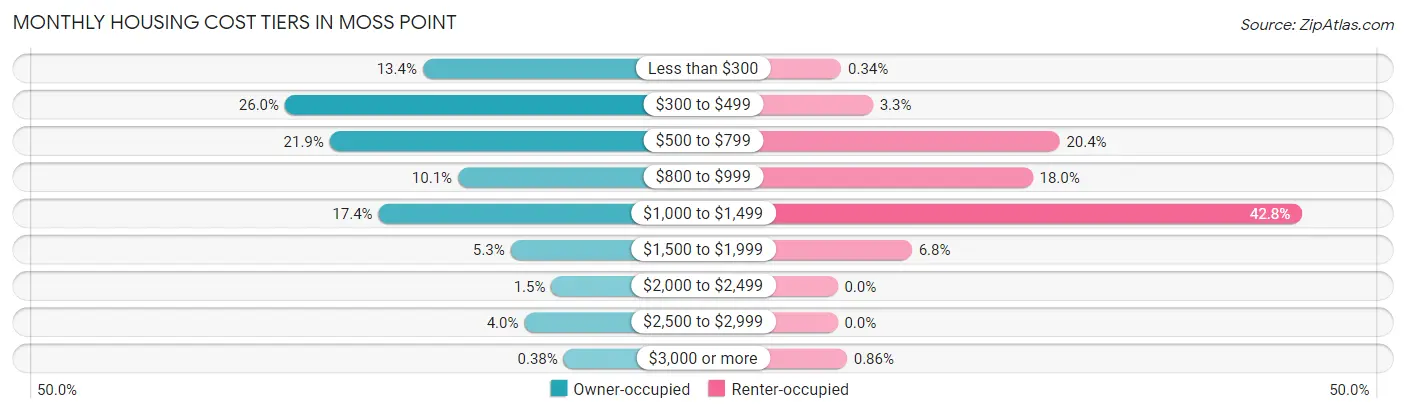
| Monthly Cost | Owner-occupied | Renter-occupied |
| Less than $300 | 461 (13.4%) | 4 (0.3%) |
| $300 to $499 | 899 (26.0%) | 38 (3.3%) |
| $500 to $799 | 757 (21.9%) | 239 (20.4%) |
| $800 to $999 | 349 (10.1%) | 210 (18.0%) |
| $1,000 to $1,499 | 602 (17.4%) | 500 (42.8%) |
| $1,500 to $1,999 | 182 (5.3%) | 80 (6.8%) |
| $2,000 to $2,499 | 52 (1.5%) | 0 (0.0%) |
| $2,500 to $2,999 | 138 (4.0%) | 0 (0.0%) |
| $3,000 or more | 13 (0.4%) | 10 (0.9%) |
| Total | 3,453 (100.0%) | 1,169 (100.0%) |
Physical Housing Characteristics in Moss Point
Housing Structures in Moss Point
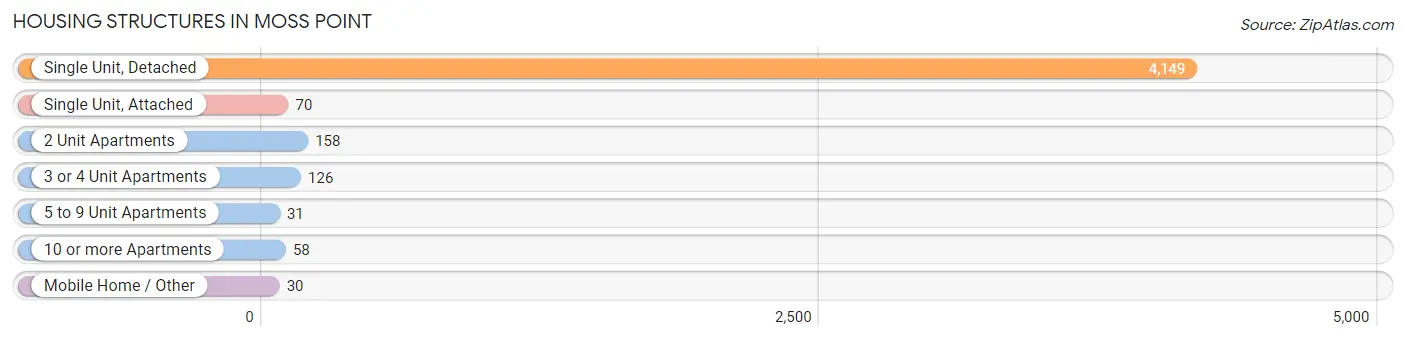
| Structure Type | # Housing Units | % Housing Units |
| Single Unit, Detached | 4,149 | 89.8% |
| Single Unit, Attached | 70 | 1.5% |
| 2 Unit Apartments | 158 | 3.4% |
| 3 or 4 Unit Apartments | 126 | 2.7% |
| 5 to 9 Unit Apartments | 31 | 0.7% |
| 10 or more Apartments | 58 | 1.3% |
| Mobile Home / Other | 30 | 0.6% |
| Total | 4,622 | 100.0% |
Housing Structures by Occupancy in Moss Point
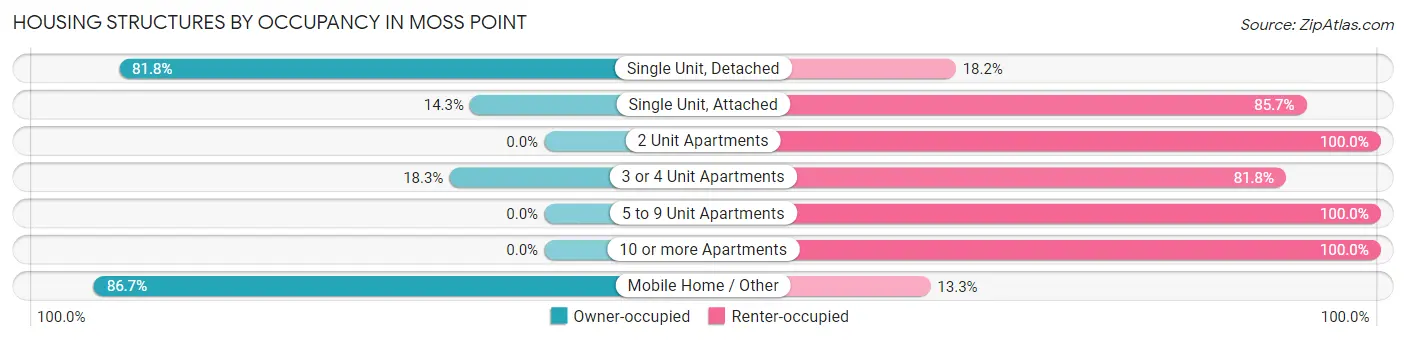
| Structure Type | Owner-occupied | Renter-occupied |
| Single Unit, Detached | 3,394 (81.8%) | 755 (18.2%) |
| Single Unit, Attached | 10 (14.3%) | 60 (85.7%) |
| 2 Unit Apartments | 0 (0.0%) | 158 (100.0%) |
| 3 or 4 Unit Apartments | 23 (18.2%) | 103 (81.8%) |
| 5 to 9 Unit Apartments | 0 (0.0%) | 31 (100.0%) |
| 10 or more Apartments | 0 (0.0%) | 58 (100.0%) |
| Mobile Home / Other | 26 (86.7%) | 4 (13.3%) |
| Total | 3,453 (74.7%) | 1,169 (25.3%) |
Housing Structures by Number of Rooms in Moss Point
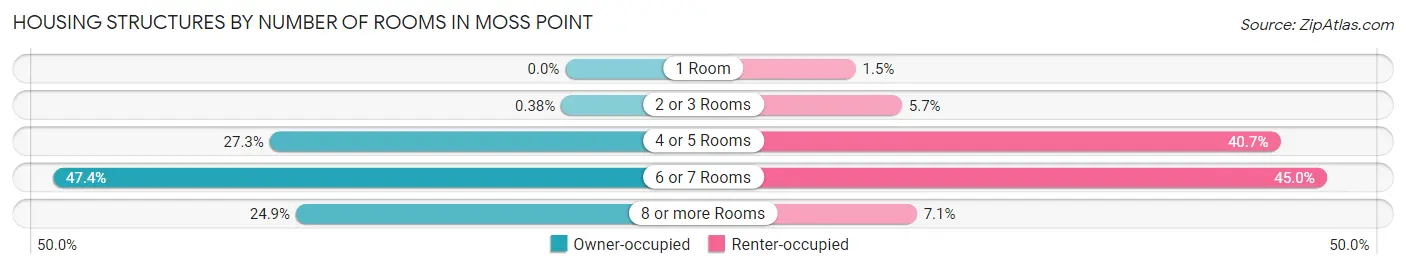
| Number of Rooms | Owner-occupied | Renter-occupied |
| 1 Room | 0 (0.0%) | 17 (1.5%) |
| 2 or 3 Rooms | 13 (0.4%) | 67 (5.7%) |
| 4 or 5 Rooms | 944 (27.3%) | 476 (40.7%) |
| 6 or 7 Rooms | 1,636 (47.4%) | 526 (45.0%) |
| 8 or more Rooms | 860 (24.9%) | 83 (7.1%) |
| Total | 3,453 (100.0%) | 1,169 (100.0%) |
Housing Structure by Heating Type in Moss Point
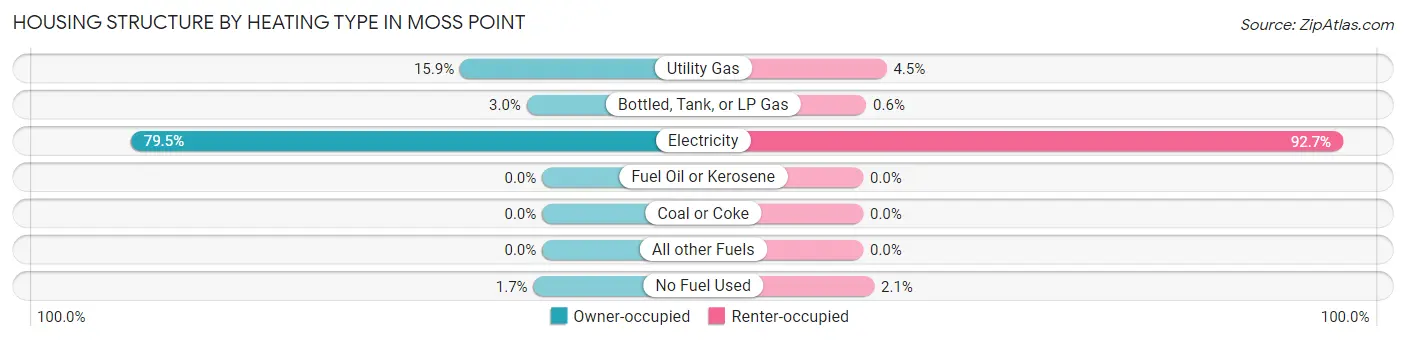
| Heating Type | Owner-occupied | Renter-occupied |
| Utility Gas | 548 (15.9%) | 53 (4.5%) |
| Bottled, Tank, or LP Gas | 103 (3.0%) | 7 (0.6%) |
| Electricity | 2,744 (79.5%) | 1,084 (92.7%) |
| Fuel Oil or Kerosene | 0 (0.0%) | 0 (0.0%) |
| Coal or Coke | 0 (0.0%) | 0 (0.0%) |
| All other Fuels | 0 (0.0%) | 0 (0.0%) |
| No Fuel Used | 58 (1.7%) | 25 (2.1%) |
| Total | 3,453 (100.0%) | 1,169 (100.0%) |
Household Vehicle Usage in Moss Point
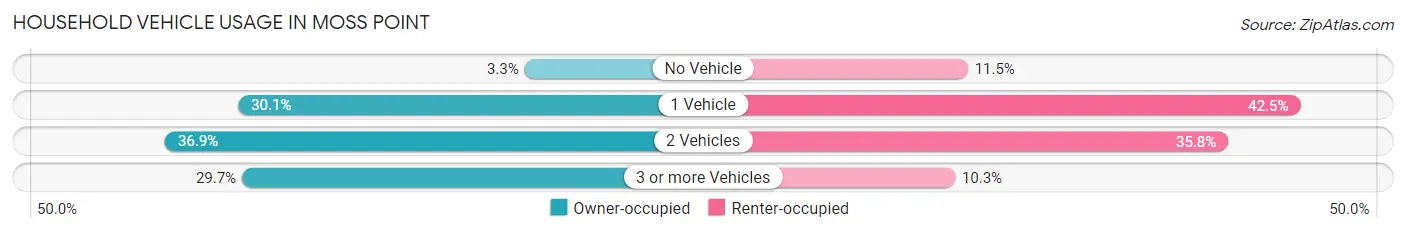
| Vehicles per Household | Owner-occupied | Renter-occupied |
| No Vehicle | 115 (3.3%) | 134 (11.5%) |
| 1 Vehicle | 1,038 (30.1%) | 497 (42.5%) |
| 2 Vehicles | 1,274 (36.9%) | 418 (35.8%) |
| 3 or more Vehicles | 1,026 (29.7%) | 120 (10.3%) |
| Total | 3,453 (100.0%) | 1,169 (100.0%) |
Real Estate & Mortgages in Moss Point
Real Estate and Mortgage Overview in Moss Point
| Characteristic | Without Mortgage | With Mortgage |
| Housing Units | 2,253 | 1,200 |
| Median Property Value | $98,800 | $113,200 |
| Median Household Income | $42,825 | $82 |
| Monthly Housing Costs | $450 | $7 |
| Real Estate Taxes | $1,089 | $307 |
Property Value by Mortgage Status in Moss Point
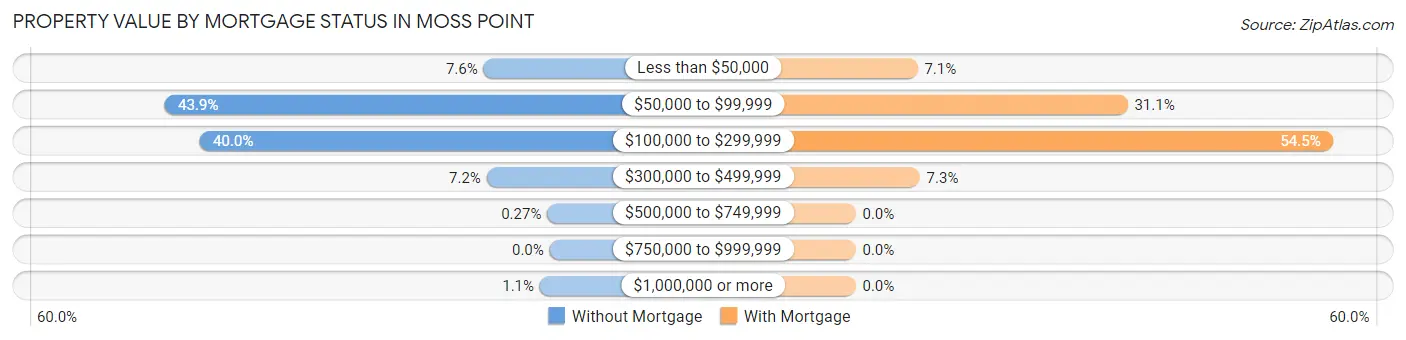
| Property Value | Without Mortgage | With Mortgage |
| Less than $50,000 | 170 (7.5%) | 85 (7.1%) |
| $50,000 to $99,999 | 990 (43.9%) | 373 (31.1%) |
| $100,000 to $299,999 | 900 (40.0%) | 654 (54.5%) |
| $300,000 to $499,999 | 162 (7.2%) | 88 (7.3%) |
| $500,000 to $749,999 | 6 (0.3%) | 0 (0.0%) |
| $750,000 to $999,999 | 0 (0.0%) | 0 (0.0%) |
| $1,000,000 or more | 25 (1.1%) | 0 (0.0%) |
| Total | 2,253 (100.0%) | 1,200 (100.0%) |
Household Income by Mortgage Status in Moss Point
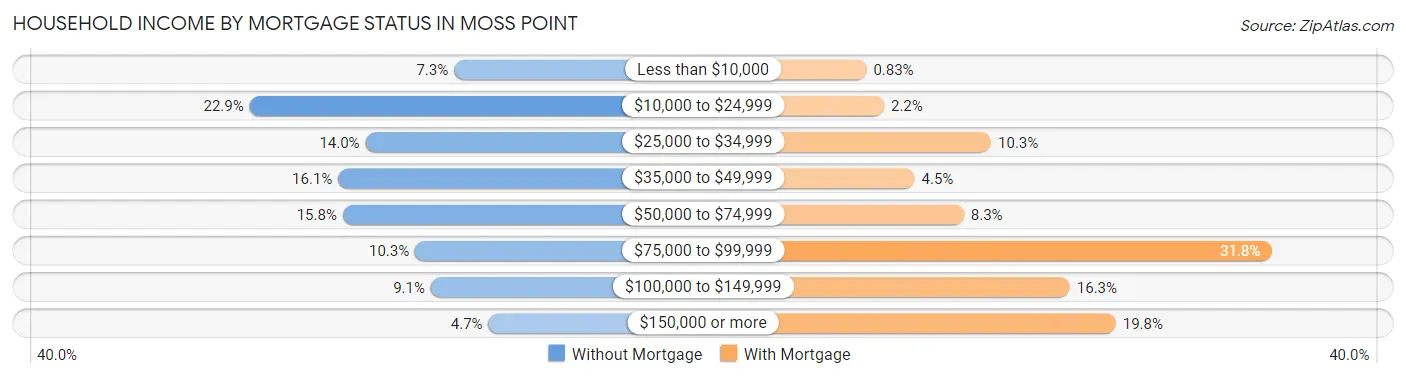
| Household Income | Without Mortgage | With Mortgage |
| Less than $10,000 | 164 (7.3%) | 10 (0.8%) |
| $10,000 to $24,999 | 515 (22.9%) | 26 (2.2%) |
| $25,000 to $34,999 | 316 (14.0%) | 124 (10.3%) |
| $35,000 to $49,999 | 363 (16.1%) | 54 (4.5%) |
| $50,000 to $74,999 | 355 (15.8%) | 99 (8.3%) |
| $75,000 to $99,999 | 231 (10.2%) | 381 (31.8%) |
| $100,000 to $149,999 | 204 (9.0%) | 196 (16.3%) |
| $150,000 or more | 105 (4.7%) | 238 (19.8%) |
| Total | 2,253 (100.0%) | 1,200 (100.0%) |
Property Value to Household Income Ratio in Moss Point
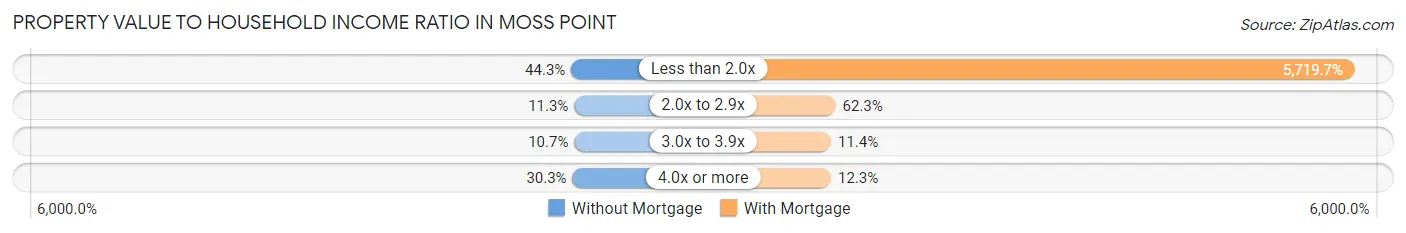
| Value-to-Income Ratio | Without Mortgage | With Mortgage |
| Less than 2.0x | 998 (44.3%) | 68,636 (5,719.7%) |
| 2.0x to 2.9x | 254 (11.3%) | 748 (62.3%) |
| 3.0x to 3.9x | 240 (10.6%) | 137 (11.4%) |
| 4.0x or more | 683 (30.3%) | 148 (12.3%) |
| Total | 2,253 (100.0%) | 1,200 (100.0%) |
Real Estate Taxes by Mortgage Status in Moss Point
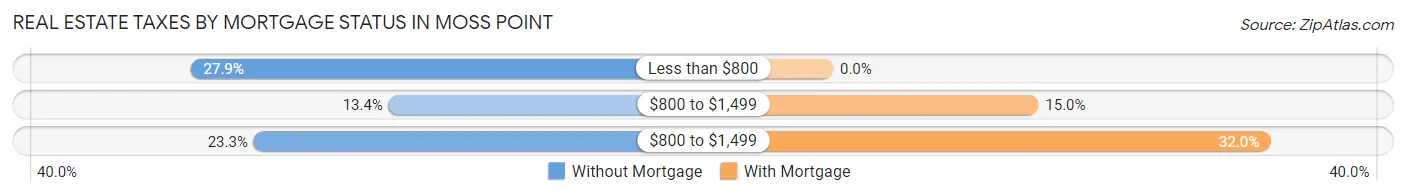
| Property Taxes | Without Mortgage | With Mortgage |
| Less than $800 | 628 (27.9%) | 0 (0.0%) |
| $800 to $1,499 | 302 (13.4%) | 180 (15.0%) |
| $800 to $1,499 | 524 (23.3%) | 384 (32.0%) |
| Total | 2,253 (100.0%) | 1,200 (100.0%) |
Health & Disability in Moss Point
Health Insurance Coverage by Age in Moss Point
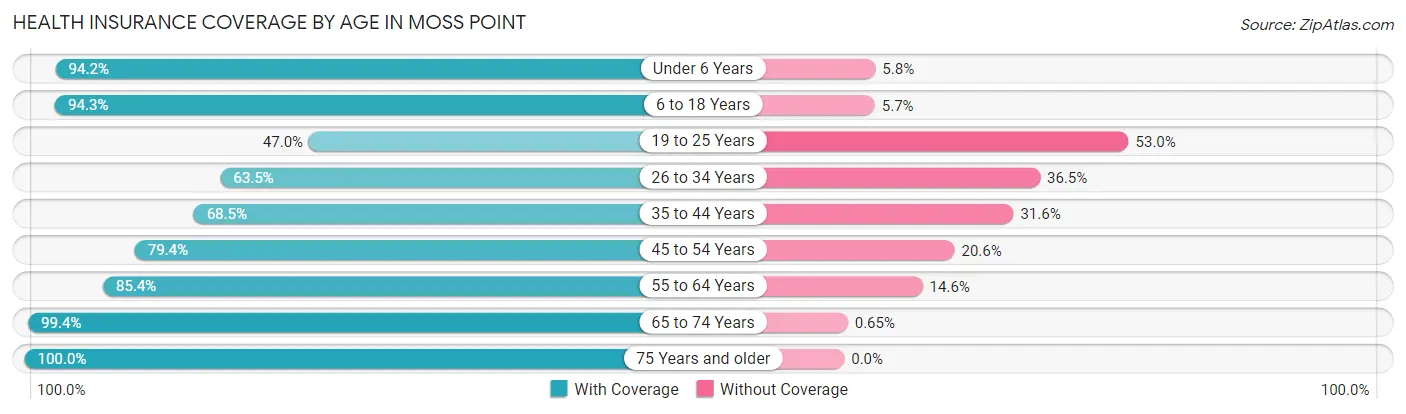
| Age Bracket | With Coverage | Without Coverage |
| Under 6 Years | 747 (94.2%) | 46 (5.8%) |
| 6 to 18 Years | 1,804 (94.3%) | 109 (5.7%) |
| 19 to 25 Years | 567 (47.0%) | 640 (53.0%) |
| 26 to 34 Years | 711 (63.5%) | 409 (36.5%) |
| 35 to 44 Years | 1,098 (68.4%) | 506 (31.6%) |
| 45 to 54 Years | 1,140 (79.4%) | 295 (20.6%) |
| 55 to 64 Years | 1,327 (85.4%) | 227 (14.6%) |
| 65 to 74 Years | 1,523 (99.4%) | 10 (0.6%) |
| 75 Years and older | 802 (100.0%) | 0 (0.0%) |
| Total | 9,719 (81.3%) | 2,242 (18.7%) |
Health Insurance Coverage by Citizenship Status in Moss Point
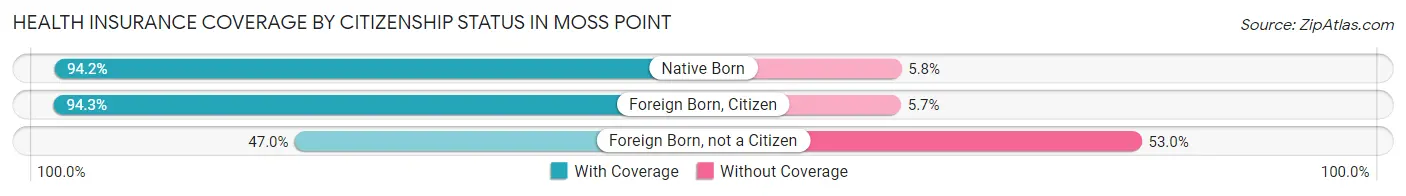
| Citizenship Status | With Coverage | Without Coverage |
| Native Born | 747 (94.2%) | 46 (5.8%) |
| Foreign Born, Citizen | 1,804 (94.3%) | 109 (5.7%) |
| Foreign Born, not a Citizen | 567 (47.0%) | 640 (53.0%) |
Health Insurance Coverage by Household Income in Moss Point
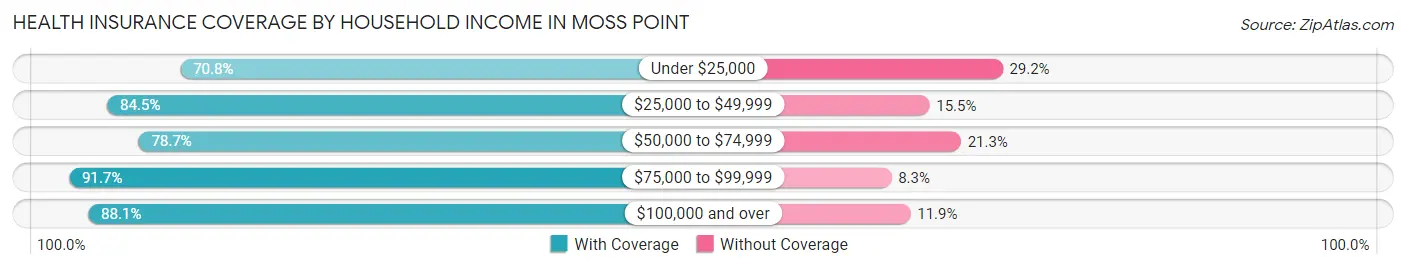
| Household Income | With Coverage | Without Coverage |
| Under $25,000 | 2,067 (70.8%) | 851 (29.2%) |
| $25,000 to $49,999 | 1,816 (84.5%) | 332 (15.5%) |
| $50,000 to $74,999 | 2,377 (78.7%) | 645 (21.3%) |
| $75,000 to $99,999 | 1,234 (91.7%) | 112 (8.3%) |
| $100,000 and over | 2,213 (88.1%) | 299 (11.9%) |
Public vs Private Health Insurance Coverage by Age in Moss Point
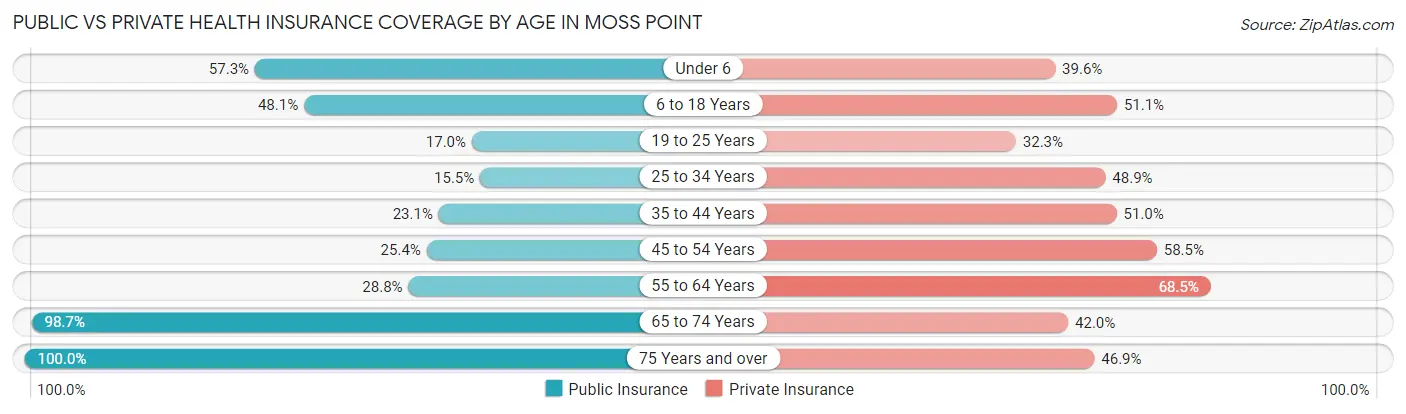
| Age Bracket | Public Insurance | Private Insurance |
| Under 6 | 454 (57.3%) | 314 (39.6%) |
| 6 to 18 Years | 921 (48.1%) | 977 (51.1%) |
| 19 to 25 Years | 205 (17.0%) | 390 (32.3%) |
| 25 to 34 Years | 173 (15.4%) | 548 (48.9%) |
| 35 to 44 Years | 371 (23.1%) | 818 (51.0%) |
| 45 to 54 Years | 364 (25.4%) | 839 (58.5%) |
| 55 to 64 Years | 447 (28.8%) | 1,064 (68.5%) |
| 65 to 74 Years | 1,513 (98.7%) | 644 (42.0%) |
| 75 Years and over | 802 (100.0%) | 376 (46.9%) |
| Total | 5,250 (43.9%) | 5,970 (49.9%) |
Disability Status by Sex by Age in Moss Point
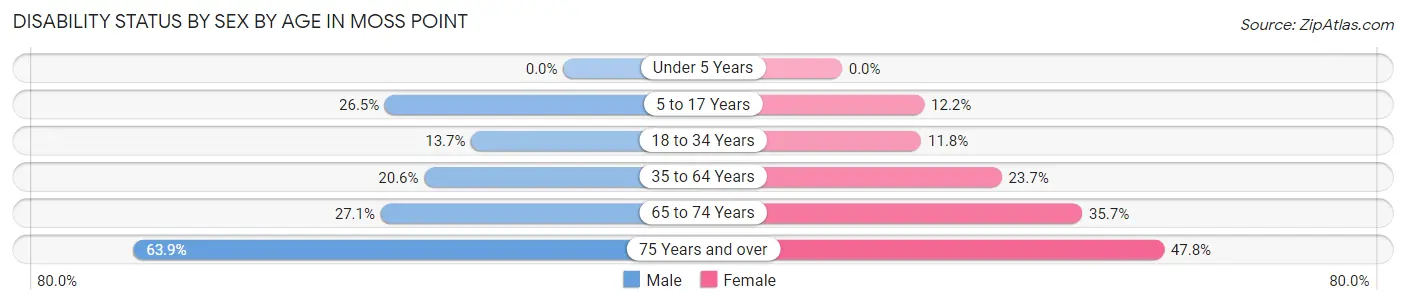
| Age Bracket | Male | Female |
| Under 5 Years | 0 (0.0%) | 0 (0.0%) |
| 5 to 17 Years | 284 (26.5%) | 93 (12.2%) |
| 18 to 34 Years | 175 (13.7%) | 135 (11.8%) |
| 35 to 64 Years | 437 (20.6%) | 587 (23.7%) |
| 65 to 74 Years | 180 (27.1%) | 310 (35.7%) |
| 75 Years and over | 129 (63.9%) | 287 (47.8%) |
Disability Class by Sex by Age in Moss Point
Disability Class: Hearing Difficulty
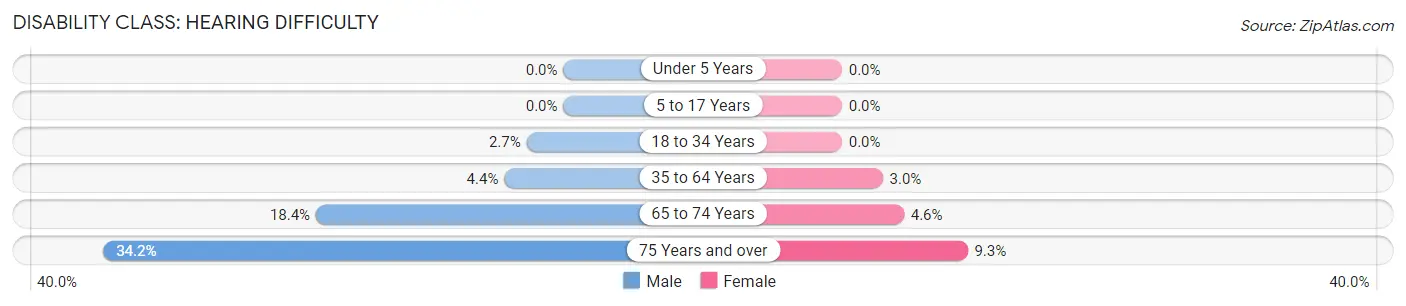
| Age Bracket | Male | Female |
| Under 5 Years | 0 (0.0%) | 0 (0.0%) |
| 5 to 17 Years | 0 (0.0%) | 0 (0.0%) |
| 18 to 34 Years | 35 (2.7%) | 0 (0.0%) |
| 35 to 64 Years | 93 (4.4%) | 75 (3.0%) |
| 65 to 74 Years | 122 (18.4%) | 40 (4.6%) |
| 75 Years and over | 69 (34.2%) | 56 (9.3%) |
Disability Class: Vision Difficulty
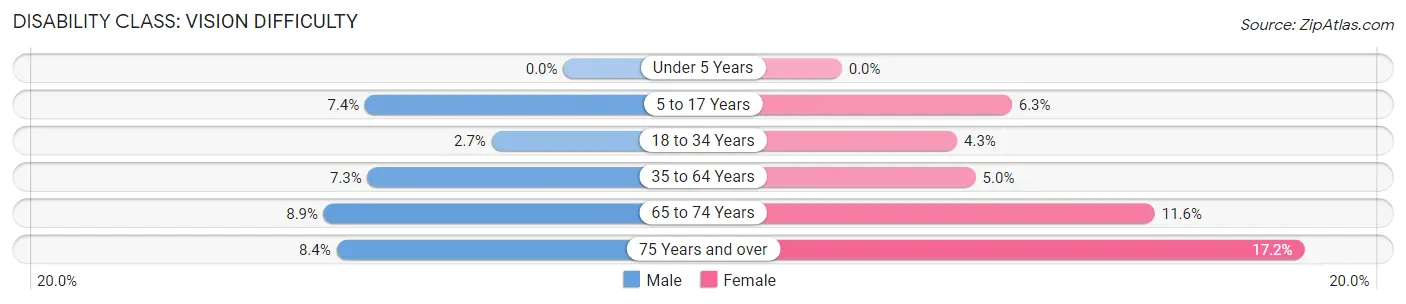
| Age Bracket | Male | Female |
| Under 5 Years | 0 (0.0%) | 0 (0.0%) |
| 5 to 17 Years | 79 (7.4%) | 48 (6.3%) |
| 18 to 34 Years | 34 (2.7%) | 49 (4.3%) |
| 35 to 64 Years | 154 (7.3%) | 123 (5.0%) |
| 65 to 74 Years | 59 (8.9%) | 101 (11.6%) |
| 75 Years and over | 17 (8.4%) | 103 (17.2%) |
Disability Class: Cognitive Difficulty
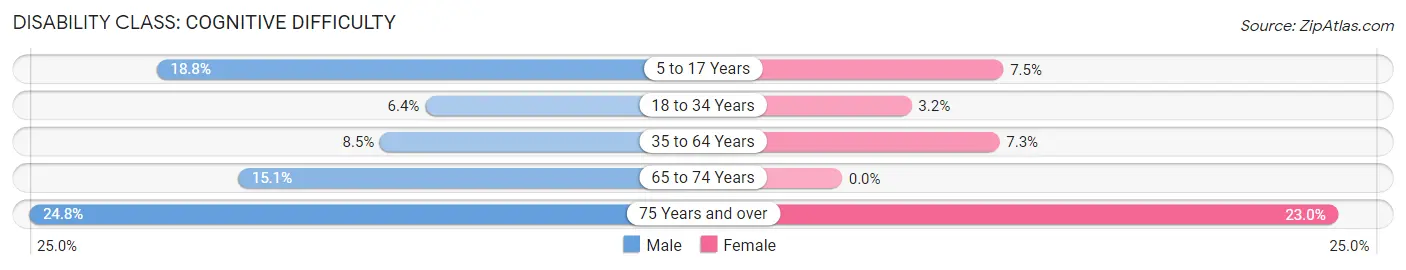
| Age Bracket | Male | Female |
| 5 to 17 Years | 202 (18.8%) | 57 (7.5%) |
| 18 to 34 Years | 82 (6.4%) | 37 (3.2%) |
| 35 to 64 Years | 180 (8.5%) | 181 (7.3%) |
| 65 to 74 Years | 100 (15.1%) | 0 (0.0%) |
| 75 Years and over | 50 (24.7%) | 138 (23.0%) |
Disability Class: Ambulatory Difficulty
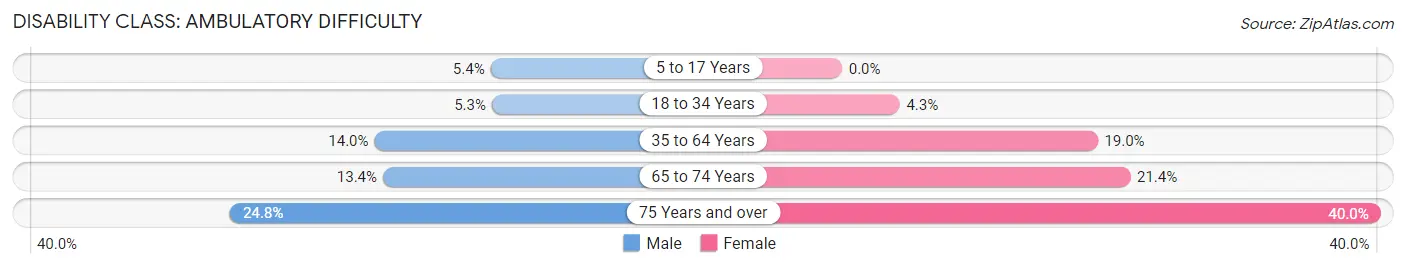
| Age Bracket | Male | Female |
| 5 to 17 Years | 58 (5.4%) | 0 (0.0%) |
| 18 to 34 Years | 68 (5.3%) | 49 (4.3%) |
| 35 to 64 Years | 297 (14.0%) | 470 (19.0%) |
| 65 to 74 Years | 89 (13.4%) | 186 (21.4%) |
| 75 Years and over | 50 (24.7%) | 240 (40.0%) |
Disability Class: Self-Care Difficulty
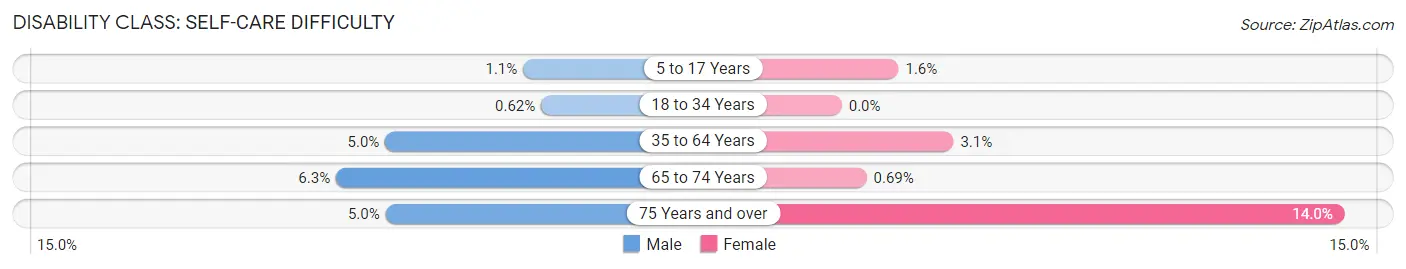
| Age Bracket | Male | Female |
| 5 to 17 Years | 12 (1.1%) | 12 (1.6%) |
| 18 to 34 Years | 8 (0.6%) | 0 (0.0%) |
| 35 to 64 Years | 105 (5.0%) | 77 (3.1%) |
| 65 to 74 Years | 42 (6.3%) | 6 (0.7%) |
| 75 Years and over | 10 (5.0%) | 84 (14.0%) |
Technology Access in Moss Point
Computing Device Access in Moss Point
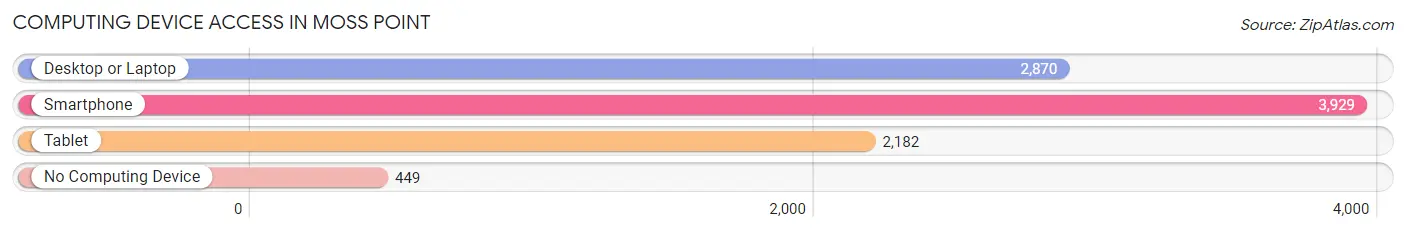
| Device Type | # Households | % Households |
| Desktop or Laptop | 2,870 | 62.1% |
| Smartphone | 3,929 | 85.0% |
| Tablet | 2,182 | 47.2% |
| No Computing Device | 449 | 9.7% |
| Total | 4,622 | 100.0% |
Internet Access in Moss Point
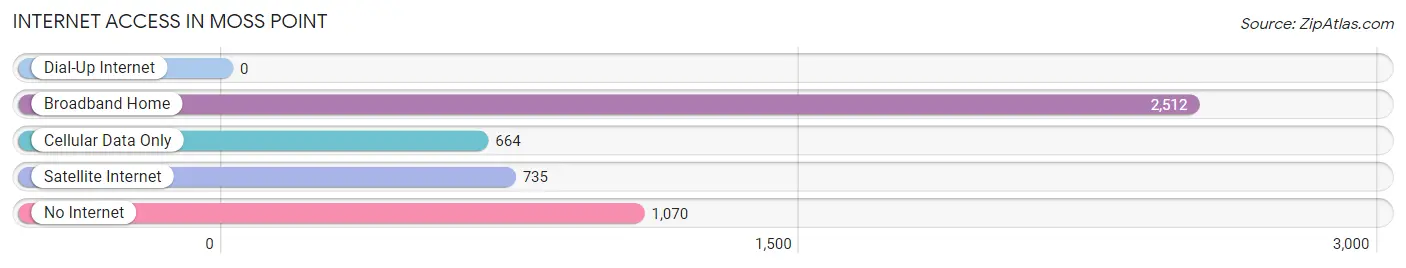
| Internet Type | # Households | % Households |
| Dial-Up Internet | 0 | 0.0% |
| Broadband Home | 2,512 | 54.3% |
| Cellular Data Only | 664 | 14.4% |
| Satellite Internet | 735 | 15.9% |
| No Internet | 1,070 | 23.2% |
| Total | 4,622 | 100.0% |
Moss Point Summary
Moss Point is a city located in Jackson County, Mississippi, United States. It is situated along the Mississippi Sound, just east of Pascagoula. The population was 13,704 at the 2010 census, down from 17,653 at the 2000 census. Moss Point is a part of the Pascagoula Metropolitan Statistical Area.
History
Moss Point was founded in 1854 by William H. Hardy, who named it for his wife's maiden name, Moss. The city was incorporated in 1891.
Moss Point was the site of a major shipbuilding industry during World War II. The Ingalls Shipbuilding Corporation employed thousands of workers to build ships for the war effort. The city was also home to a major lumber mill, which was destroyed by fire in the late 1940s.
Geography
Moss Point is located at 30°25'25" North, 88°32'45" West (30.423750, -88.545833). According to the United States Census Bureau, the city has a total area of 16.2 square miles (41.8 km2), of which 15.2 square miles (39.4 km2) is land and 1.0 square mile (2.4 km2) is water.
Economy
Moss Point's economy is largely based on the shipbuilding and repair industry. The city is home to Ingalls Shipbuilding, the largest shipyard in the United States. The shipyard is a major employer in the area, providing jobs for thousands of workers.
The city is also home to several other industries, including a paper mill, a chemical plant, and a steel mill. The city is also home to several retail stores, restaurants, and other businesses.
Demographics
As of the census of 2000, there were 17,653 people, 6,845 households, and 4,845 families residing in the city. The population density was 1,154.2 people per square mile (446.7/km2). There were 7,717 housing units at an average density of 507.2 per square mile (195.7/km2). The racial makeup of the city was 57.2% White, 40.2% African American, 0.3% Native American, 0.7% Asian, 0.1% Pacific Islander, 0.4% from other races, and 1.1% from two or more races. Hispanic or Latino of any race were 1.3% of the population.
There were 6,845 households, out of which 33.2% had children under the age of 18 living with them, 41.2% were married couples living together, 22.2% had a female householder with no husband present, and 32.2% were non-families. 27.2% of all households were made up of individuals, and 11.2% had someone living alone who was 65 years of age or older. The average household size was 2.54 and the average family size was 3.09.
In the city, the population was spread out, with 27.2% under the age of 18, 9.2% from 18 to 24, 26.2% from 25 to 44, 22.2% from 45 to 64, and 15.2% who were 65 years of age or older. The median age was 36 years. For every 100 females, there were 87.2 males. For every 100 females age 18 and over, there were 81.2 males.
The median income for a household in the city was $27,917, and the median income for a family was $33,917. Males had a median income of $30,917 versus $20,917 for females. The per capita income for the city was $14,917. About 18.2% of families and 21.2% of the population were below the poverty line, including 28.2% of those under age 18 and 16.2% of those age 65 or over.
Common Questions
What is Per Capita Income in Moss Point?
Per Capita income in Moss Point is $24,109.
What is the Median Family Income in Moss Point?
Median Family Income in Moss Point is $55,982.
What is the Median Household income in Moss Point?
Median Household Income in Moss Point is $44,779.
What is Income or Wage Gap in Moss Point?
Income or Wage Gap in Moss Point is 27.4%.
Women in Moss Point earn 72.6 cents for every dollar earned by a man.
What is Inequality or Gini Index in Moss Point?
Inequality or Gini Index in Moss Point is 0.47.
What is the Total Population of Moss Point?
Total Population of Moss Point is 12,173.
What is the Total Male Population of Moss Point?
Total Male Population of Moss Point is 5,871.
What is the Total Female Population of Moss Point?
Total Female Population of Moss Point is 6,302.
What is the Ratio of Males per 100 Females in Moss Point?
There are 93.16 Males per 100 Females in Moss Point.
What is the Ratio of Females per 100 Males in Moss Point?
There are 107.34 Females per 100 Males in Moss Point.
What is the Median Population Age in Moss Point?
Median Population Age in Moss Point is 41.5 Years.
What is the Average Family Size in Moss Point
Average Family Size in Moss Point is 3.3 People.
What is the Average Household Size in Moss Point
Average Household Size in Moss Point is 2.6 People.
How Large is the Labor Force in Moss Point?
There are 5,255 People in the Labor Forcein in Moss Point.
What is the Percentage of People in the Labor Force in Moss Point?
52.9% of People are in the Labor Force in Moss Point.
What is the Unemployment Rate in Moss Point?
Unemployment Rate in Moss Point is 9.9%.