Iuka, MS Map & Demographics
Iuka Map
Iuka Overview
$24,016
PER CAPITA INCOME
$52,365
AVG FAMILY INCOME
$43,887
AVG HOUSEHOLD INCOME
34.1%
WAGE / INCOME GAP [ % ]
65.9¢/ $1
WAGE / INCOME GAP [ $ ]
0.46
INEQUALITY / GINI INDEX
3,117
TOTAL POPULATION
1,476
MALE POPULATION
1,641
FEMALE POPULATION
89.95
MALES / 100 FEMALES
111.18
FEMALES / 100 MALES
37.2
MEDIAN AGE
2.9
AVG FAMILY SIZE
2.3
AVG HOUSEHOLD SIZE
1,107
LABOR FORCE [ PEOPLE ]
47.5%
PERCENT IN LABOR FORCE
5.9%
UNEMPLOYMENT RATE
Iuka Zip Codes
Iuka Area Codes
Income in Iuka
Income Overview in Iuka
Per Capita Income in Iuka is $24,016, while median incomes of families and households are $52,365 and $43,887 respectively.
| Characteristic | Number | Measure |
| Per Capita Income | 3,117 | $24,016 |
| Median Family Income | 810 | $52,365 |
| Mean Family Income | 810 | $79,911 |
| Median Household Income | 1,214 | $43,887 |
| Mean Household Income | 1,214 | $63,911 |
| Income Deficit | 810 | $0 |
| Wage / Income Gap (%) | 3,117 | 34.06% |
| Wage / Income Gap ($) | 3,117 | 65.94¢ per $1 |
| Gini / Inequality Index | 3,117 | 0.46 |
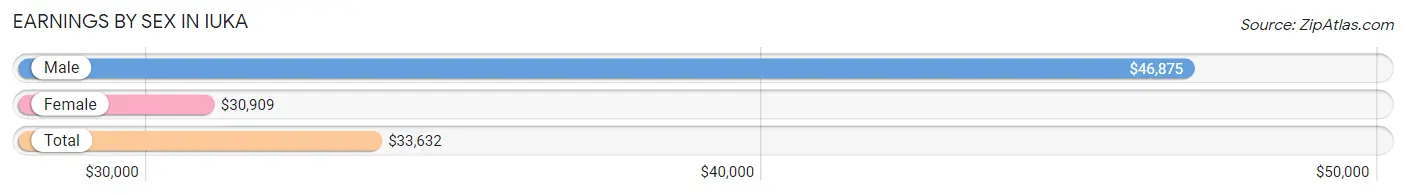
Earnings by Sex in Iuka
Average Earnings in Iuka are $33,632, $46,875 for men and $30,909 for women, a difference of 34.1%.
| Sex | Number | Average Earnings |
| Male | 591 (50.0%) | $46,875 |
| Female | 590 (50.0%) | $30,909 |
| Total | 1,181 (100.0%) | $33,632 |
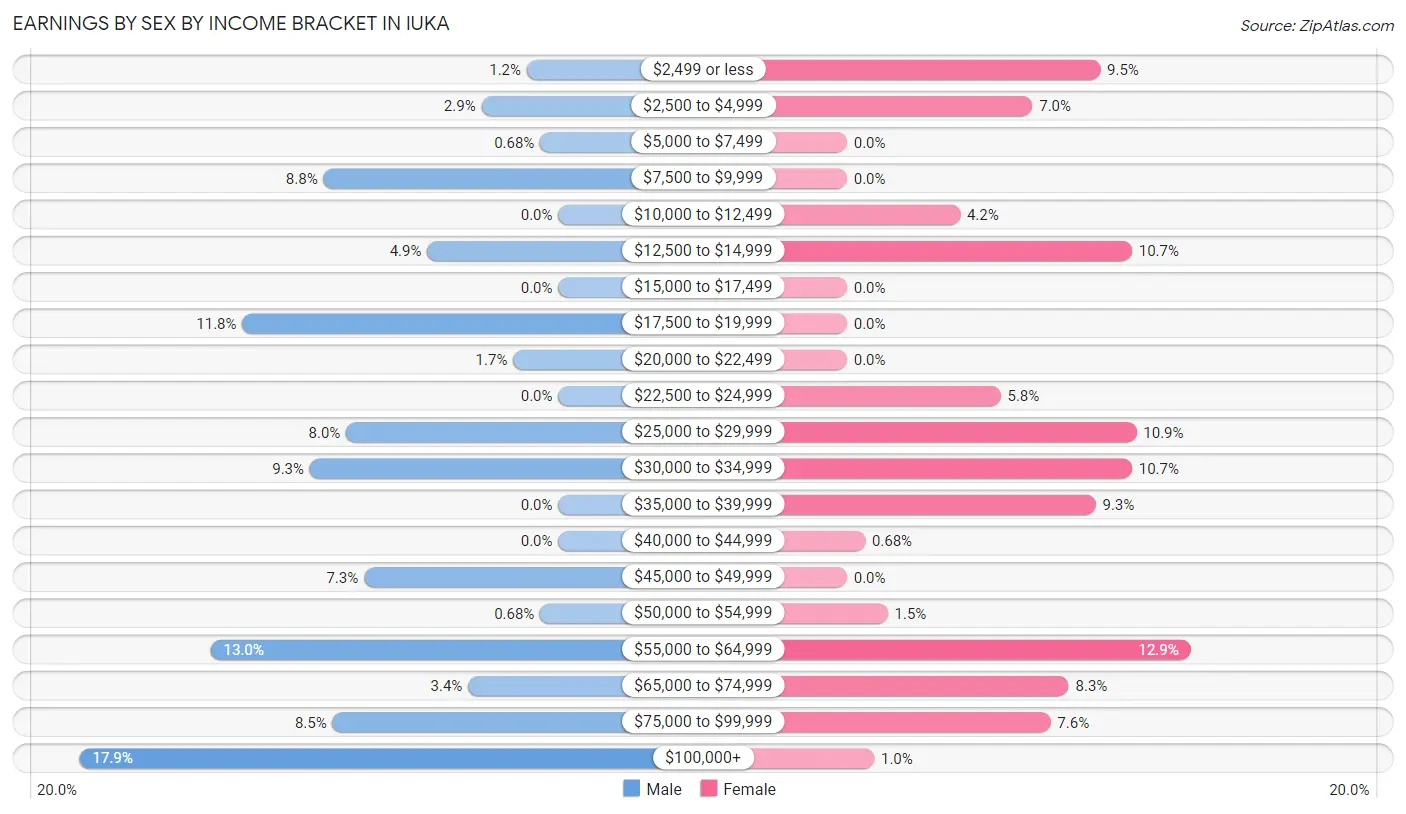
Earnings by Sex by Income Bracket in Iuka
The most common earnings brackets in Iuka are $100,000+ for men (106 | 17.9%) and $55,000 to $64,999 for women (76 | 12.9%).
| Income | Male | Female |
| $2,499 or less | 7 (1.2%) | 56 (9.5%) |
| $2,500 to $4,999 | 17 (2.9%) | 41 (7.0%) |
| $5,000 to $7,499 | 4 (0.7%) | 0 (0.0%) |
| $7,500 to $9,999 | 52 (8.8%) | 0 (0.0%) |
| $10,000 to $12,499 | 0 (0.0%) | 25 (4.2%) |
| $12,500 to $14,999 | 29 (4.9%) | 63 (10.7%) |
| $15,000 to $17,499 | 0 (0.0%) | 0 (0.0%) |
| $17,500 to $19,999 | 70 (11.8%) | 0 (0.0%) |
| $20,000 to $22,499 | 10 (1.7%) | 0 (0.0%) |
| $22,500 to $24,999 | 0 (0.0%) | 34 (5.8%) |
| $25,000 to $29,999 | 47 (8.0%) | 64 (10.8%) |
| $30,000 to $34,999 | 55 (9.3%) | 63 (10.7%) |
| $35,000 to $39,999 | 0 (0.0%) | 55 (9.3%) |
| $40,000 to $44,999 | 0 (0.0%) | 4 (0.7%) |
| $45,000 to $49,999 | 43 (7.3%) | 0 (0.0%) |
| $50,000 to $54,999 | 4 (0.7%) | 9 (1.5%) |
| $55,000 to $64,999 | 77 (13.0%) | 76 (12.9%) |
| $65,000 to $74,999 | 20 (3.4%) | 49 (8.3%) |
| $75,000 to $99,999 | 50 (8.5%) | 45 (7.6%) |
| $100,000+ | 106 (17.9%) | 6 (1.0%) |
| Total | 591 (100.0%) | 590 (100.0%) |
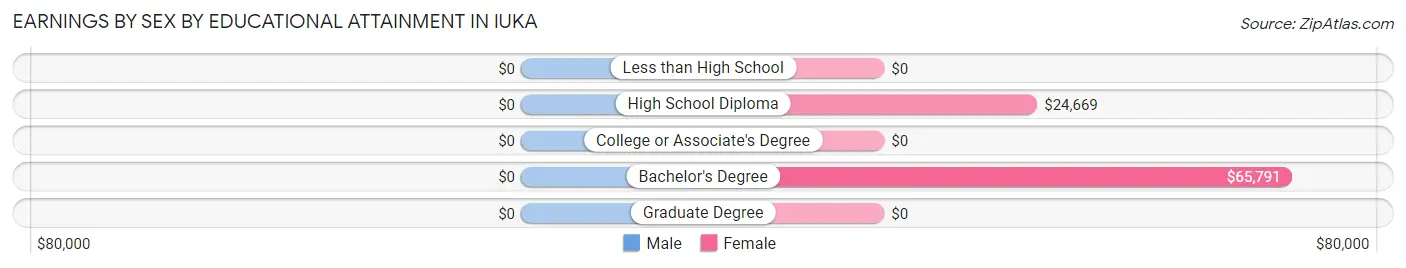
Earnings by Sex by Educational Attainment in Iuka
| Educational Attainment | Male Income | Female Income |
| Less than High School | - | - |
| High School Diploma | - | - |
| College or Associate's Degree | - | - |
| Bachelor's Degree | - | - |
| Graduate Degree | - | - |
| Total | $47,872 | $31,023 |
Family Income in Iuka
Family Income Brackets in Iuka
According to the Iuka family income data, there are 257 families falling into the $35,000 to $49,999 income range, which is the most common income bracket and makes up 31.7% of all families.
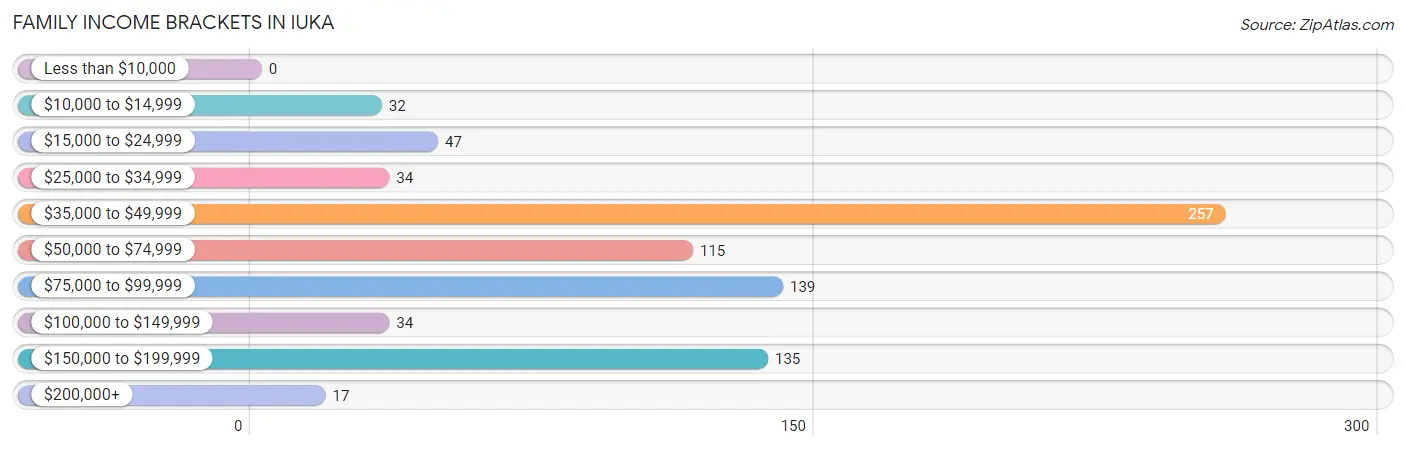
| Income Bracket | # Families | % Families |
| Less than $10,000 | 0 | 0.0% |
| $10,000 to $14,999 | 32 | 4.0% |
| $15,000 to $24,999 | 47 | 5.8% |
| $25,000 to $34,999 | 34 | 4.2% |
| $35,000 to $49,999 | 257 | 31.7% |
| $50,000 to $74,999 | 115 | 14.2% |
| $75,000 to $99,999 | 139 | 17.2% |
| $100,000 to $149,999 | 34 | 4.2% |
| $150,000 to $199,999 | 135 | 16.7% |
| $200,000+ | 17 | 2.1% |
Family Income by Famaliy Size in Iuka
4-person families (236 | 29.1%) account for the highest median family income in Iuka with $97,669 per family, while 4-person families (236 | 29.1%) have the highest median income of $24,417 per family member.
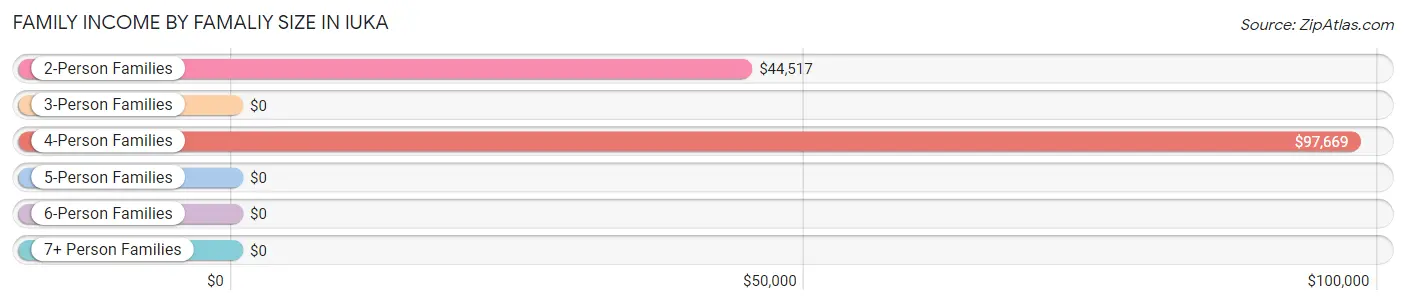
| Income Bracket | # Families | Median Income |
| 2-Person Families | 342 (42.2%) | $44,517 |
| 3-Person Families | 154 (19.0%) | $0 |
| 4-Person Families | 236 (29.1%) | $97,669 |
| 5-Person Families | 58 (7.2%) | $0 |
| 6-Person Families | 20 (2.5%) | $0 |
| 7+ Person Families | 0 (0.0%) | $0 |
| Total | 810 (100.0%) | $52,365 |
Family Income by Number of Earners in Iuka
The median family income in Iuka is $52,365, with families comprising 2 earners (381) having the highest median family income of $94,028, while families with 1 earner (150) have the lowest median family income of $28,125, accounting for 47.0% and 18.5% of families, respectively.
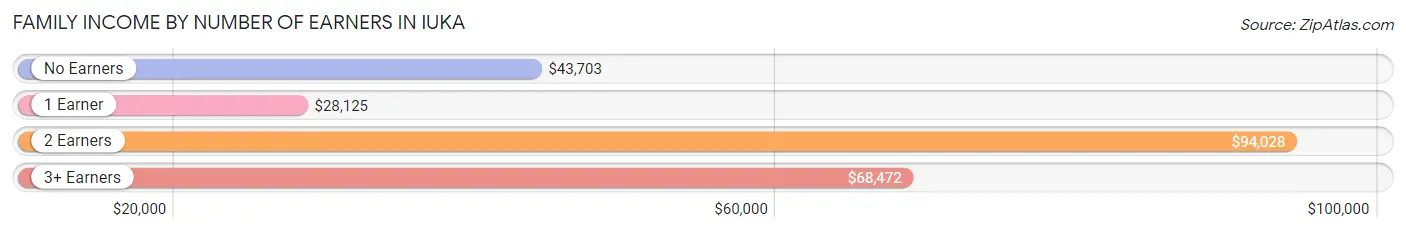
| Number of Earners | # Families | Median Income |
| No Earners | 209 (25.8%) | $43,703 |
| 1 Earner | 150 (18.5%) | $28,125 |
| 2 Earners | 381 (47.0%) | $94,028 |
| 3+ Earners | 70 (8.6%) | $68,472 |
| Total | 810 (100.0%) | $52,365 |
Household Income in Iuka
Household Income Brackets in Iuka
With 320 households falling in the category, the $35,000 to $49,999 income range is the most frequent in Iuka, accounting for 26.4% of all households. In contrast, only 34 households (2.8%) fall into the $100,000 to $149,999 income bracket, making it the least populous group.
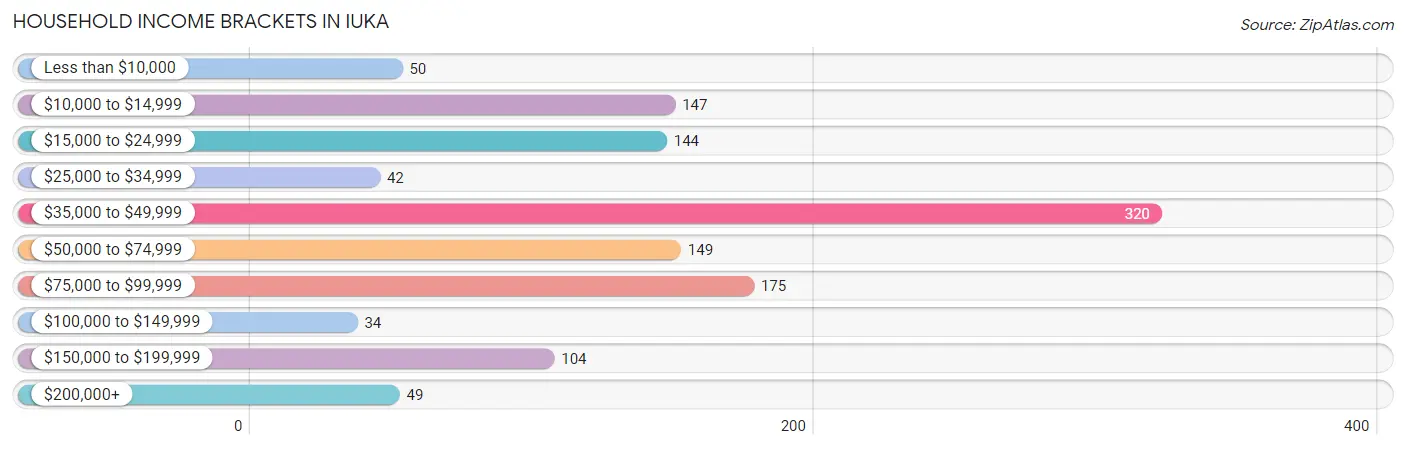
| Income Bracket | # Households | % Households |
| Less than $10,000 | 50 | 4.1% |
| $10,000 to $14,999 | 147 | 12.1% |
| $15,000 to $24,999 | 144 | 11.9% |
| $25,000 to $34,999 | 42 | 3.5% |
| $35,000 to $49,999 | 320 | 26.4% |
| $50,000 to $74,999 | 149 | 12.3% |
| $75,000 to $99,999 | 175 | 14.4% |
| $100,000 to $149,999 | 34 | 2.8% |
| $150,000 to $199,999 | 104 | 8.6% |
| $200,000+ | 49 | 4.0% |
Household Income by Householder Age in Iuka
The median household income in Iuka is $43,887, with the highest median household income of $50,372 found in the 45 to 64 years age bracket for the primary householder. A total of 383 households (31.6%) fall into this category. Meanwhile, the 15 to 24 years age bracket for the primary householder has the lowest median household income of $0, with 68 households (5.6%) in this group.
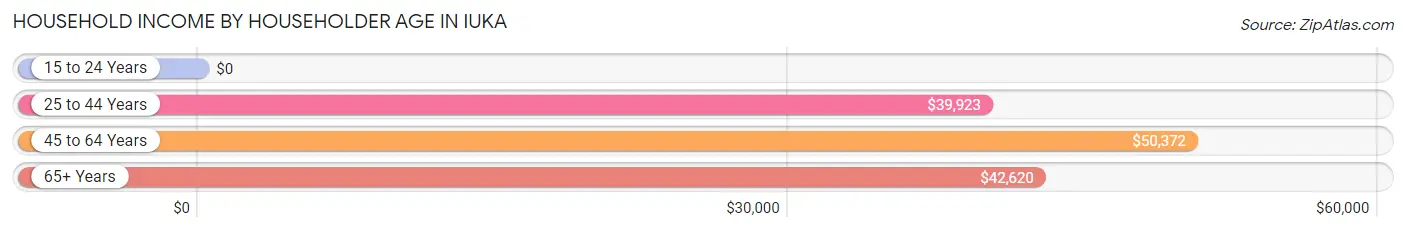
| Income Bracket | # Households | Median Income |
| 15 to 24 Years | 68 (5.6%) | $0 |
| 25 to 44 Years | 368 (30.3%) | $39,923 |
| 45 to 64 Years | 383 (31.6%) | $50,372 |
| 65+ Years | 395 (32.5%) | $42,620 |
| Total | 1,214 (100.0%) | $43,887 |
Poverty in Iuka
Income Below Poverty by Sex and Age in Iuka
With 15.5% poverty level for males and 24.9% for females among the residents of Iuka, 35 to 44 year old males and under 5 year old females are the most vulnerable to poverty, with 77 males (44.5%) and 132 females (62.6%) in their respective age groups living below the poverty level.
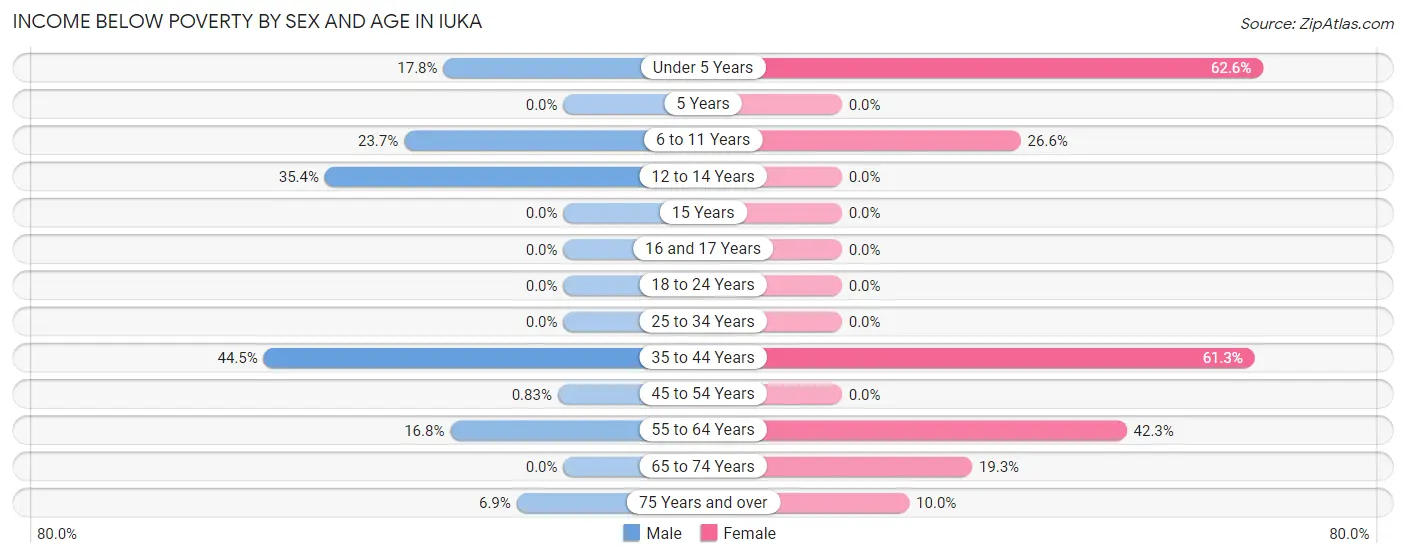
| Age Bracket | Male | Female |
| Under 5 Years | 18 (17.8%) | 132 (62.6%) |
| 5 Years | 0 (0.0%) | 0 (0.0%) |
| 6 to 11 Years | 62 (23.7%) | 34 (26.6%) |
| 12 to 14 Years | 17 (35.4%) | 0 (0.0%) |
| 15 Years | 0 (0.0%) | 0 (0.0%) |
| 16 and 17 Years | 0 (0.0%) | 0 (0.0%) |
| 18 to 24 Years | 0 (0.0%) | 0 (0.0%) |
| 25 to 34 Years | 0 (0.0%) | 0 (0.0%) |
| 35 to 44 Years | 77 (44.5%) | 84 (61.3%) |
| 45 to 54 Years | 1 (0.8%) | 0 (0.0%) |
| 55 to 64 Years | 21 (16.8%) | 74 (42.3%) |
| 65 to 74 Years | 0 (0.0%) | 29 (19.3%) |
| 75 Years and over | 10 (6.9%) | 22 (10.0%) |
| Total | 206 (15.5%) | 375 (24.9%) |
Income Above Poverty by Sex and Age in Iuka
According to the poverty statistics in Iuka, males aged 5 years and females aged 15 years are the age groups that are most secure financially, with 100.0% of males and 100.0% of females in these age groups living above the poverty line.
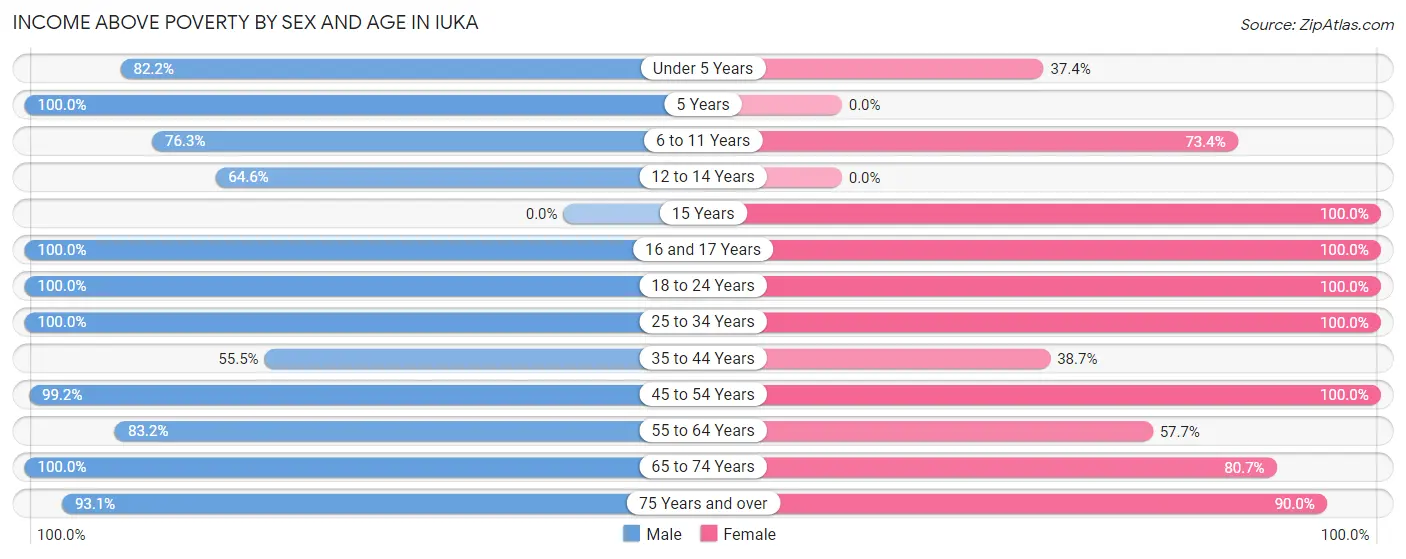
| Age Bracket | Male | Female |
| Under 5 Years | 83 (82.2%) | 79 (37.4%) |
| 5 Years | 11 (100.0%) | 0 (0.0%) |
| 6 to 11 Years | 200 (76.3%) | 94 (73.4%) |
| 12 to 14 Years | 31 (64.6%) | 0 (0.0%) |
| 15 Years | 0 (0.0%) | 26 (100.0%) |
| 16 and 17 Years | 22 (100.0%) | 16 (100.0%) |
| 18 to 24 Years | 87 (100.0%) | 65 (100.0%) |
| 25 to 34 Years | 188 (100.0%) | 265 (100.0%) |
| 35 to 44 Years | 96 (55.5%) | 53 (38.7%) |
| 45 to 54 Years | 119 (99.2%) | 115 (100.0%) |
| 55 to 64 Years | 104 (83.2%) | 101 (57.7%) |
| 65 to 74 Years | 50 (100.0%) | 121 (80.7%) |
| 75 Years and over | 134 (93.1%) | 198 (90.0%) |
| Total | 1,125 (84.5%) | 1,133 (75.1%) |
Income Below Poverty Among Married-Couple Families in Iuka
The poverty statistics for married-couple families in Iuka show that 4.7% or 26 of the total 558 families live below the poverty line. Families with 1 or 2 children have the highest poverty rate of 11.3%, comprising of 26 families. On the other hand, families with no children have the lowest poverty rate of 0.0%, which includes 0 families.
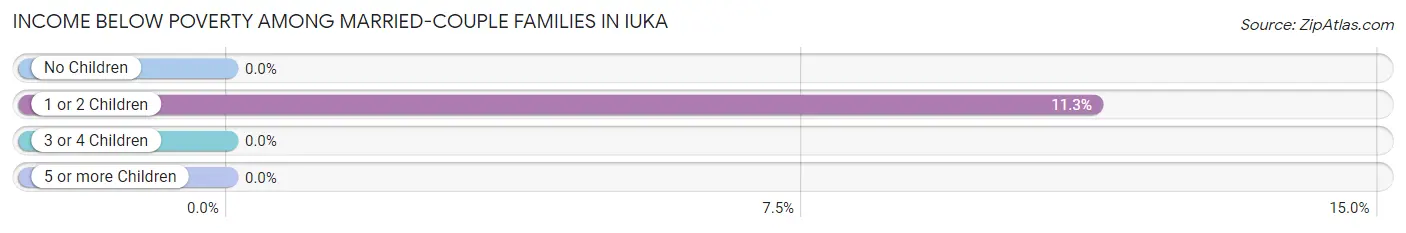
| Children | Above Poverty | Below Poverty |
| No Children | 277 (100.0%) | 0 (0.0%) |
| 1 or 2 Children | 204 (88.7%) | 26 (11.3%) |
| 3 or 4 Children | 51 (100.0%) | 0 (0.0%) |
| 5 or more Children | 0 (0.0%) | 0 (0.0%) |
| Total | 532 (95.3%) | 26 (4.7%) |
Income Below Poverty Among Single-Parent Households in Iuka
According to the poverty data in Iuka, 28.4% or 38 single-father households and 34.7% or 41 single-mother households are living below the poverty line. Among single-father households, those with 1 or 2 children have the highest poverty rate, with 38 households (28.4%) experiencing poverty. Likewise, among single-mother households, those with 1 or 2 children have the highest poverty rate, with 16 households (66.7%) falling below the poverty line.
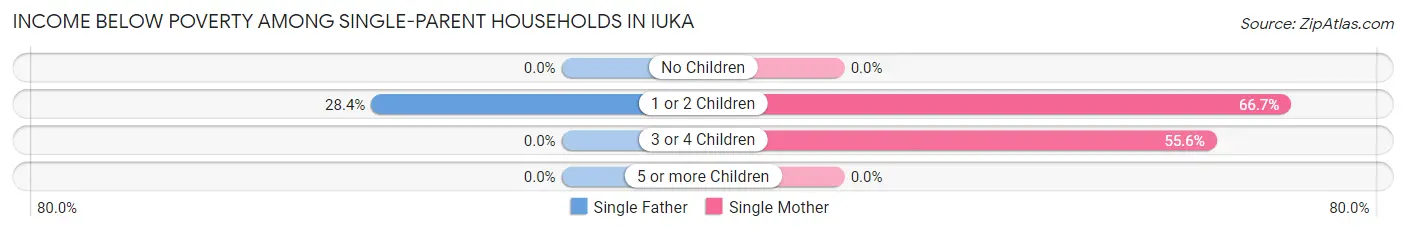
| Children | Single Father | Single Mother |
| No Children | 0 (0.0%) | 0 (0.0%) |
| 1 or 2 Children | 38 (28.4%) | 16 (66.7%) |
| 3 or 4 Children | 0 (0.0%) | 25 (55.6%) |
| 5 or more Children | 0 (0.0%) | 0 (0.0%) |
| Total | 38 (28.4%) | 41 (34.7%) |
Income Below Poverty Among Married-Couple vs Single-Parent Households in Iuka
The poverty data for Iuka shows that 26 of the married-couple family households (4.7%) and 79 of the single-parent households (31.4%) are living below the poverty level. Within the married-couple family households, those with 1 or 2 children have the highest poverty rate, with 26 households (11.3%) falling below the poverty line. Among the single-parent households, those with 3 or 4 children have the highest poverty rate, with 25 household (55.6%) living below poverty.
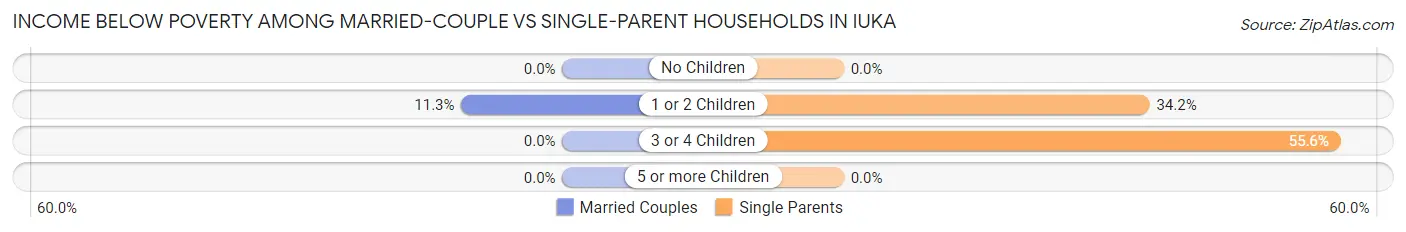
| Children | Married-Couple Families | Single-Parent Households |
| No Children | 0 (0.0%) | 0 (0.0%) |
| 1 or 2 Children | 26 (11.3%) | 54 (34.2%) |
| 3 or 4 Children | 0 (0.0%) | 25 (55.6%) |
| 5 or more Children | 0 (0.0%) | 0 (0.0%) |
| Total | 26 (4.7%) | 79 (31.4%) |
Race in Iuka
The most populous races in Iuka are White / Caucasian (2,915 | 93.5%), Black / African American (130 | 4.2%), and Two or more Races (69 | 2.2%).
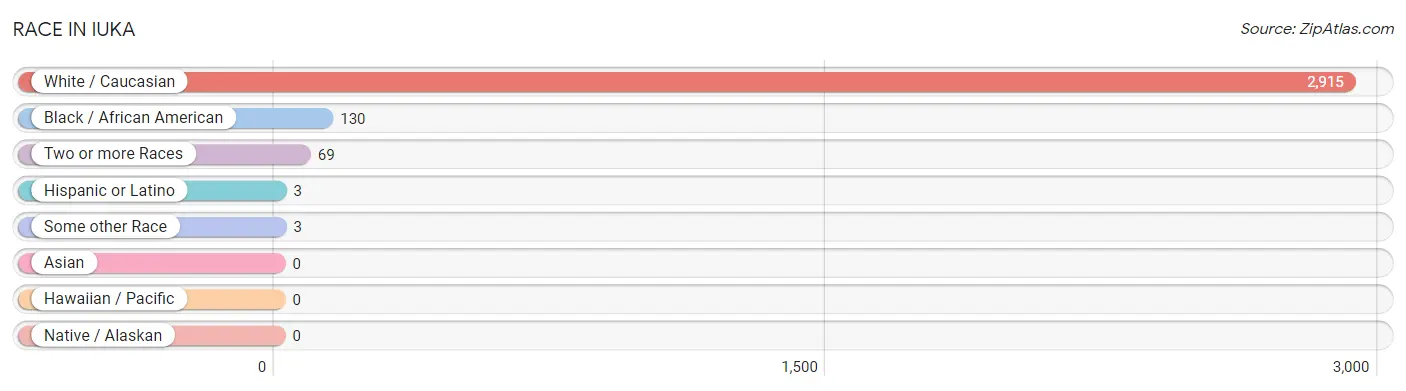
| Race | # Population | % Population |
| Asian | 0 | 0.0% |
| Black / African American | 130 | 4.2% |
| Hawaiian / Pacific | 0 | 0.0% |
| Hispanic or Latino | 3 | 0.1% |
| Native / Alaskan | 0 | 0.0% |
| White / Caucasian | 2,915 | 93.5% |
| Two or more Races | 69 | 2.2% |
| Some other Race | 3 | 0.1% |
| Total | 3,117 | 100.0% |
Ancestry in Iuka
The most populous ancestries reported in Iuka are American (645 | 20.7%), Irish (322 | 10.3%), English (307 | 9.9%), Dutch (119 | 3.8%), and German (61 | 2.0%), together accounting for 46.7% of all Iuka residents.
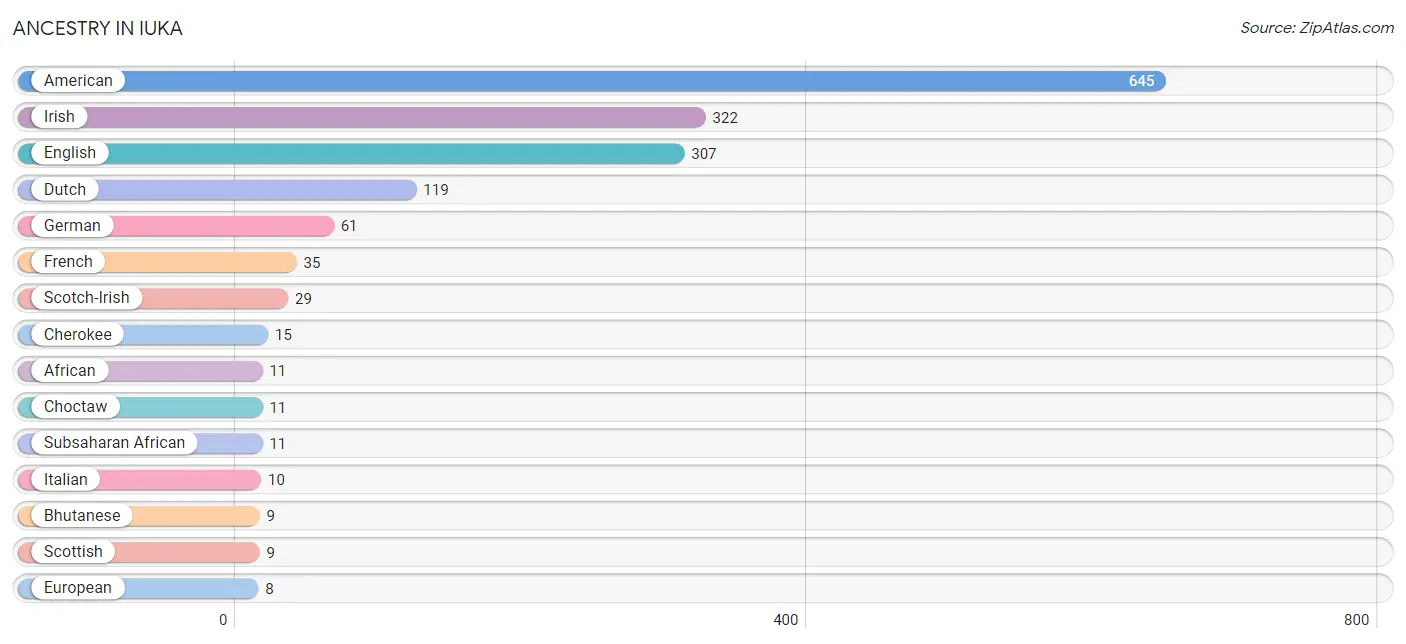
| Ancestry | # Population | % Population |
| African | 11 | 0.4% |
| American | 645 | 20.7% |
| Bhutanese | 9 | 0.3% |
| Cherokee | 15 | 0.5% |
| Choctaw | 11 | 0.4% |
| Dutch | 119 | 3.8% |
| English | 307 | 9.9% |
| European | 8 | 0.3% |
| French | 35 | 1.1% |
| German | 61 | 2.0% |
| Irish | 322 | 10.3% |
| Italian | 10 | 0.3% |
| Mexican | 3 | 0.1% |
| Scotch-Irish | 29 | 0.9% |
| Scottish | 9 | 0.3% |
| Subsaharan African | 11 | 0.4% | View All 16 Rows |
Immigrants in Iuka
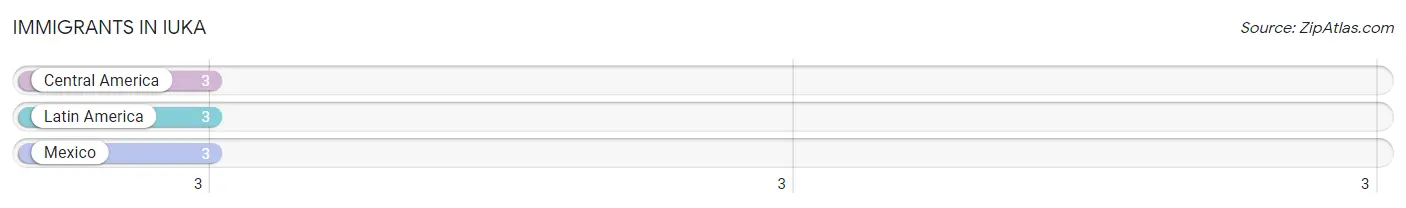
The most numerous immigrant groups reported in Iuka came from Central America (3 | 0.1%), Latin America (3 | 0.1%), and Mexico (3 | 0.1%), together accounting for 0.3% of all Iuka residents.
| Immigration Origin | # Population | % Population |
| Central America | 3 | 0.1% |
| Latin America | 3 | 0.1% |
| Mexico | 3 | 0.1% | View All 3 Rows |
Sex and Age in Iuka
Sex and Age in Iuka
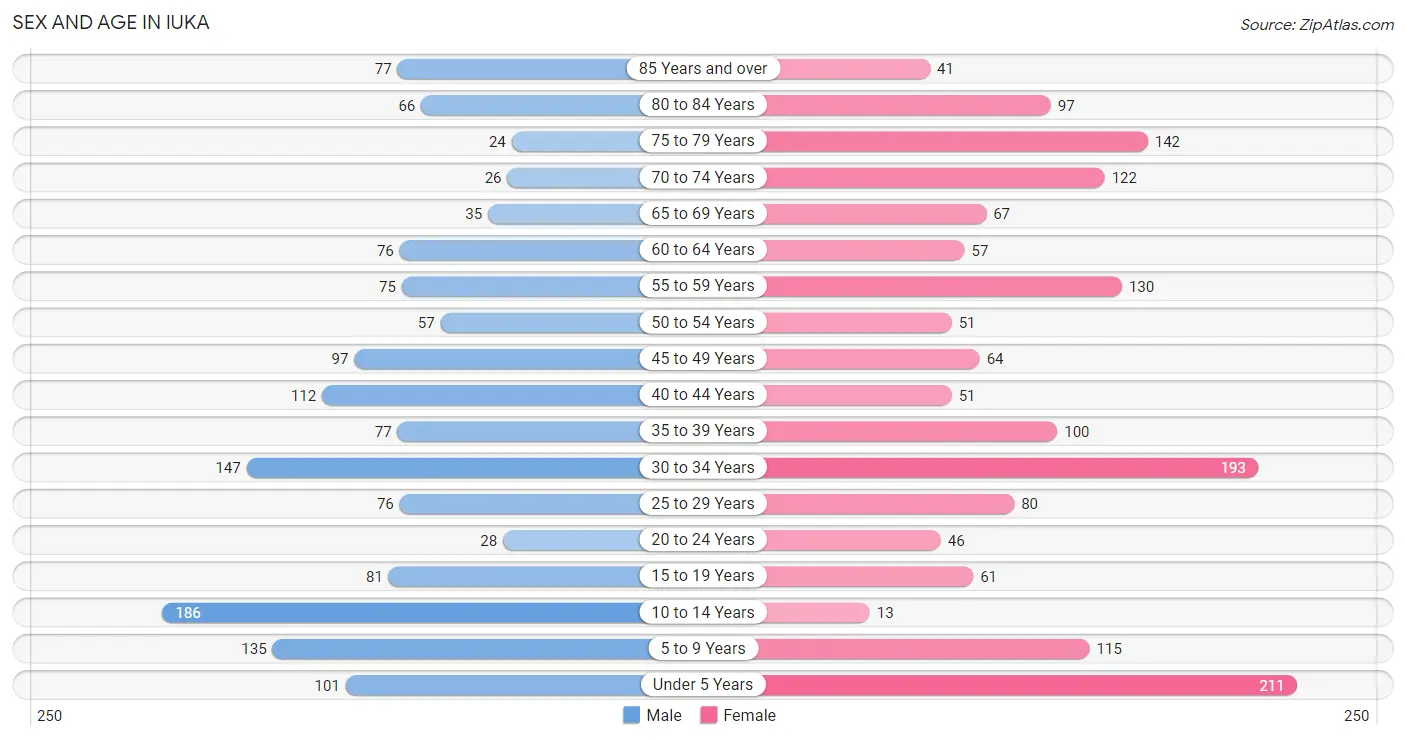
The most populous age groups in Iuka are 10 to 14 Years (186 | 12.6%) for men and Under 5 Years (211 | 12.9%) for women.
| Age Bracket | Male | Female |
| Under 5 Years | 101 (6.8%) | 211 (12.9%) |
| 5 to 9 Years | 135 (9.1%) | 115 (7.0%) |
| 10 to 14 Years | 186 (12.6%) | 13 (0.8%) |
| 15 to 19 Years | 81 (5.5%) | 61 (3.7%) |
| 20 to 24 Years | 28 (1.9%) | 46 (2.8%) |
| 25 to 29 Years | 76 (5.1%) | 80 (4.9%) |
| 30 to 34 Years | 147 (10.0%) | 193 (11.8%) |
| 35 to 39 Years | 77 (5.2%) | 100 (6.1%) |
| 40 to 44 Years | 112 (7.6%) | 51 (3.1%) |
| 45 to 49 Years | 97 (6.6%) | 64 (3.9%) |
| 50 to 54 Years | 57 (3.9%) | 51 (3.1%) |
| 55 to 59 Years | 75 (5.1%) | 130 (7.9%) |
| 60 to 64 Years | 76 (5.1%) | 57 (3.5%) |
| 65 to 69 Years | 35 (2.4%) | 67 (4.1%) |
| 70 to 74 Years | 26 (1.8%) | 122 (7.4%) |
| 75 to 79 Years | 24 (1.6%) | 142 (8.6%) |
| 80 to 84 Years | 66 (4.5%) | 97 (5.9%) |
| 85 Years and over | 77 (5.2%) | 41 (2.5%) |
| Total | 1,476 (100.0%) | 1,641 (100.0%) |
Families and Households in Iuka
Median Family Size in Iuka
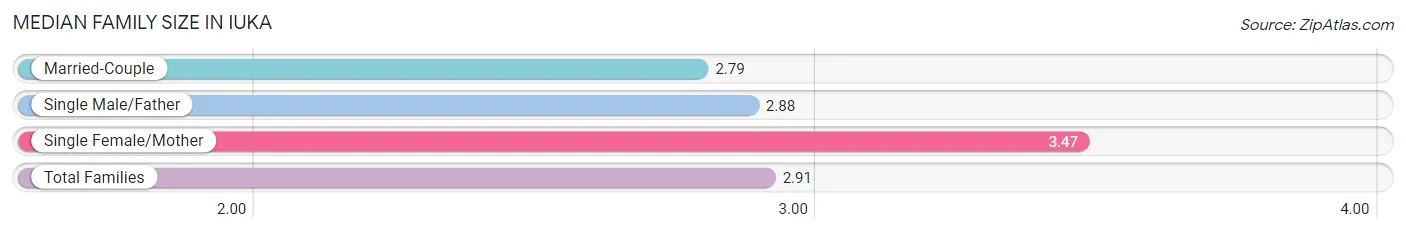
The median family size in Iuka is 2.91 persons per family, with single female/mother families (118 | 14.6%) accounting for the largest median family size of 3.47 persons per family. On the other hand, married-couple families (558 | 68.9%) represent the smallest median family size with 2.79 persons per family.
| Family Type | # Families | Family Size |
| Married-Couple | 558 (68.9%) | 2.79 |
| Single Male/Father | 134 (16.5%) | 2.88 |
| Single Female/Mother | 118 (14.6%) | 3.47 |
| Total Families | 810 (100.0%) | 2.91 |
Median Household Size in Iuka
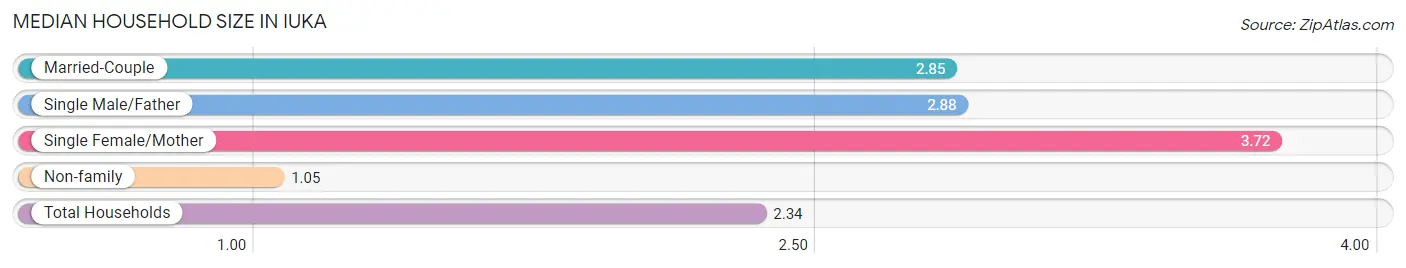
The median household size in Iuka is 2.34 persons per household, with single female/mother households (118 | 9.7%) accounting for the largest median household size of 3.72 persons per household. non-family households (404 | 33.3%) represent the smallest median household size with 1.05 persons per household.
| Household Type | # Households | Household Size |
| Married-Couple | 558 (46.0%) | 2.85 |
| Single Male/Father | 134 (11.0%) | 2.88 |
| Single Female/Mother | 118 (9.7%) | 3.72 |
| Non-family | 404 (33.3%) | 1.05 |
| Total Households | 1,214 (100.0%) | 2.34 |
Household Size by Marriage Status in Iuka
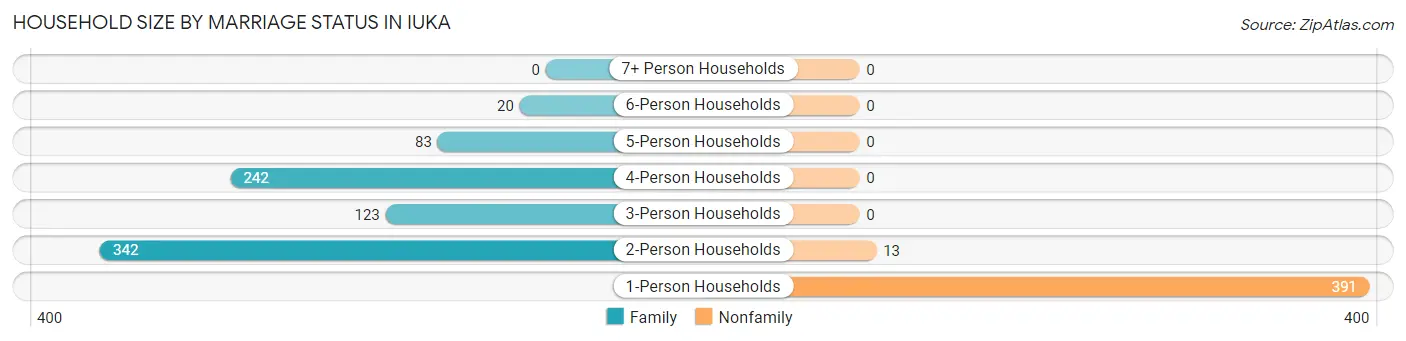
Out of a total of 1,214 households in Iuka, 810 (66.7%) are family households, while 404 (33.3%) are nonfamily households. The most numerous type of family households are 2-person households, comprising 342, and the most common type of nonfamily households are 1-person households, comprising 391.
| Household Size | Family Households | Nonfamily Households |
| 1-Person Households | - | 391 (32.2%) |
| 2-Person Households | 342 (28.2%) | 13 (1.1%) |
| 3-Person Households | 123 (10.1%) | 0 (0.0%) |
| 4-Person Households | 242 (19.9%) | 0 (0.0%) |
| 5-Person Households | 83 (6.8%) | 0 (0.0%) |
| 6-Person Households | 20 (1.7%) | 0 (0.0%) |
| 7+ Person Households | 0 (0.0%) | 0 (0.0%) |
| Total | 810 (66.7%) | 404 (33.3%) |
Female Fertility in Iuka
Fertility by Age in Iuka
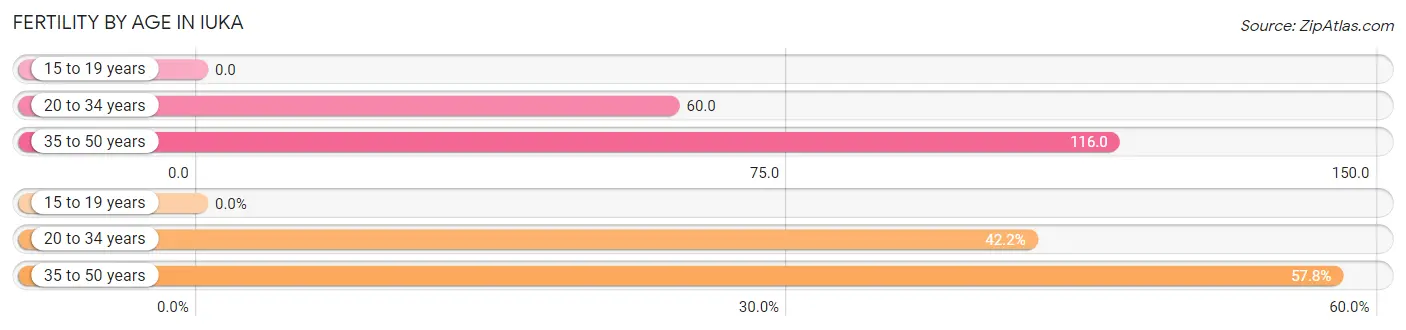
Average fertility rate in Iuka is 75.0 births per 1,000 women. Women in the age bracket of 35 to 50 years have the highest fertility rate with 116.0 births per 1,000 women. Women in the age bracket of 35 to 50 years acount for 57.8% of all women with births.
| Age Bracket | Women with Births | Births / 1,000 Women |
| 15 to 19 years | 0 (0.0%) | 0.0 |
| 20 to 34 years | 19 (42.2%) | 60.0 |
| 35 to 50 years | 26 (57.8%) | 116.0 |
| Total | 45 (100.0%) | 75.0 |
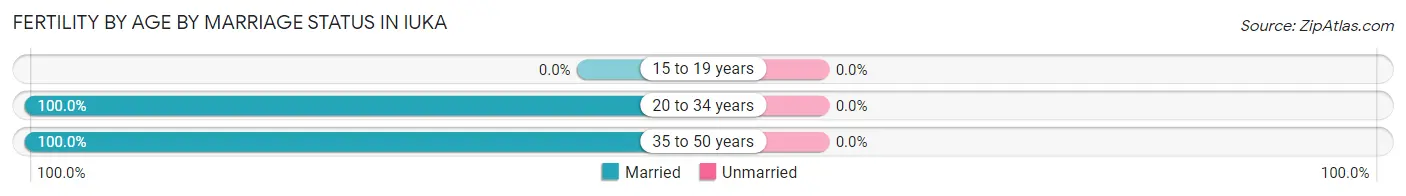
Fertility by Age by Marriage Status in Iuka
| Age Bracket | Married | Unmarried |
| 15 to 19 years | 0 (0.0%) | 0 (0.0%) |
| 20 to 34 years | 19 (100.0%) | 0 (0.0%) |
| 35 to 50 years | 26 (100.0%) | 0 (0.0%) |
| Total | 45 (100.0%) | 0 (0.0%) |
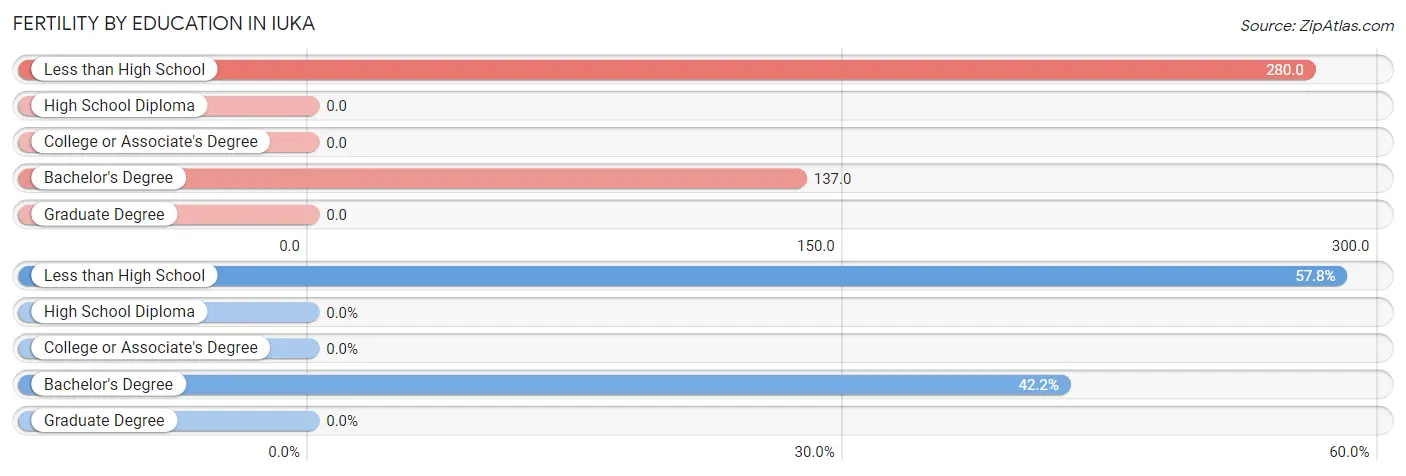
Fertility by Education in Iuka
| Educational Attainment | Women with Births | Births / 1,000 Women |
| Less than High School | 26 (57.8%) | 280.0 |
| High School Diploma | 0 (0.0%) | 0.0 |
| College or Associate's Degree | 0 (0.0%) | 0.0 |
| Bachelor's Degree | 19 (42.2%) | 137.0 |
| Graduate Degree | 0 (0.0%) | 0.0 |
| Total | 45 (100.0%) | 75.0 |
Fertility by Education by Marriage Status in Iuka
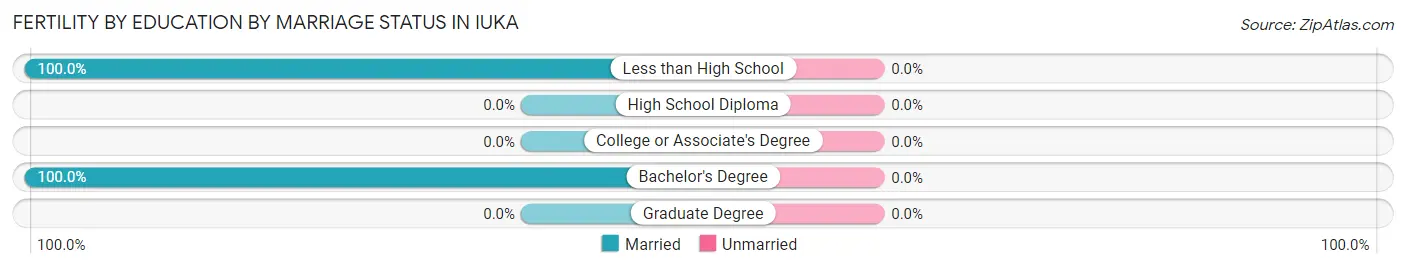
| Educational Attainment | Married | Unmarried |
| Less than High School | 26 (100.0%) | 0 (0.0%) |
| High School Diploma | 0 (0.0%) | 0 (0.0%) |
| College or Associate's Degree | 0 (0.0%) | 0 (0.0%) |
| Bachelor's Degree | 19 (100.0%) | 0 (0.0%) |
| Graduate Degree | 0 (0.0%) | 0 (0.0%) |
| Total | 45 (100.0%) | 0 (0.0%) |
Employment Characteristics in Iuka
Employment by Class of Employer in Iuka
Among the 1,013 employed individuals in Iuka, private company employees (672 | 66.3%), local government employees (99 | 9.8%), and self-employed (incorporated) (94 | 9.3%) make up the most common classes of employment.
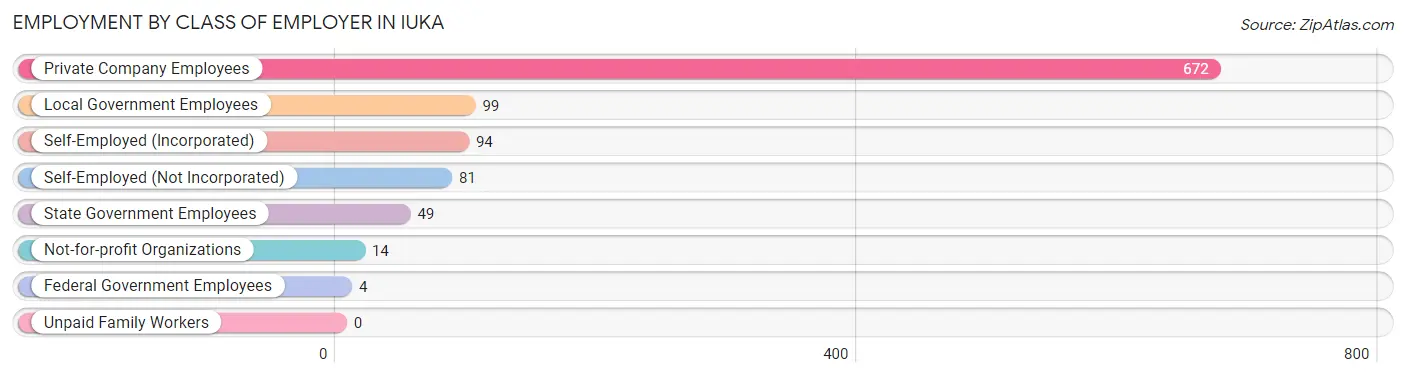
| Employer Class | # Employees | % Employees |
| Private Company Employees | 672 | 66.3% |
| Self-Employed (Incorporated) | 94 | 9.3% |
| Self-Employed (Not Incorporated) | 81 | 8.0% |
| Not-for-profit Organizations | 14 | 1.4% |
| Local Government Employees | 99 | 9.8% |
| State Government Employees | 49 | 4.8% |
| Federal Government Employees | 4 | 0.4% |
| Unpaid Family Workers | 0 | 0.0% |
| Total | 1,013 | 100.0% |
Employment Status by Age in Iuka
According to the labor force statistics for Iuka, out of the total population over 16 years of age (2,330), 47.5% or 1,107 individuals are in the labor force, with 5.9% or 65 of them unemployed. The age group with the highest labor force participation rate is 20 to 24 years, with 100.0% or 74 individuals in the labor force. Within the labor force, the 16 to 19 years age range has the highest percentage of unemployed individuals, with 45.7% or 16 of them being unemployed.
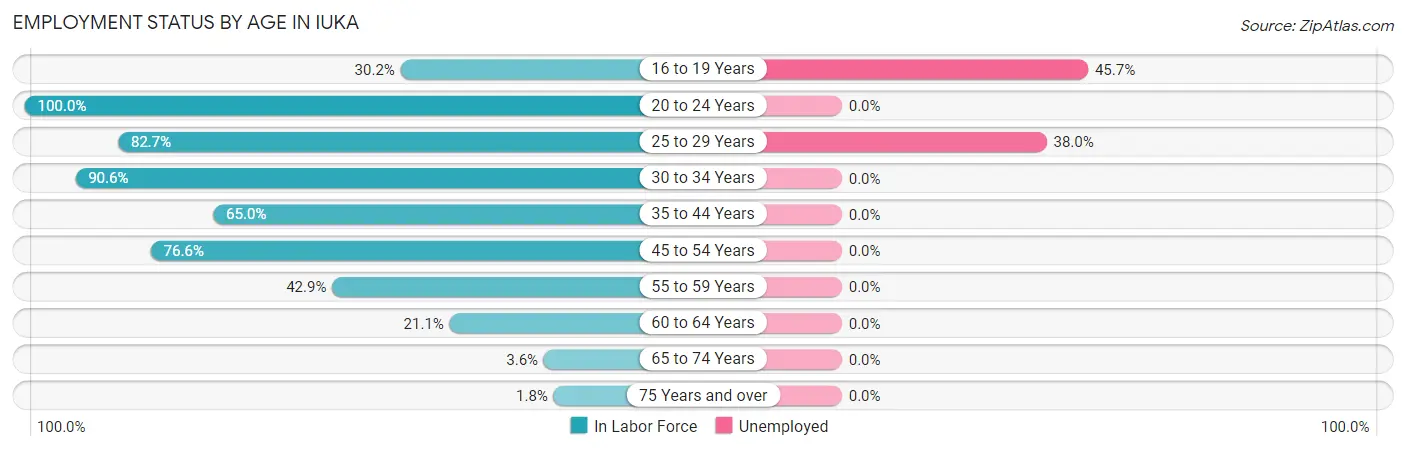
| Age Bracket | In Labor Force | Unemployed |
| 16 to 19 Years | 35 (30.2%) | 16 (45.7%) |
| 20 to 24 Years | 74 (100.0%) | 0 (0.0%) |
| 25 to 29 Years | 129 (82.7%) | 49 (38.0%) |
| 30 to 34 Years | 308 (90.6%) | 0 (0.0%) |
| 35 to 44 Years | 221 (65.0%) | 0 (0.0%) |
| 45 to 54 Years | 206 (76.6%) | 0 (0.0%) |
| 55 to 59 Years | 88 (42.9%) | 0 (0.0%) |
| 60 to 64 Years | 28 (21.1%) | 0 (0.0%) |
| 65 to 74 Years | 9 (3.6%) | 0 (0.0%) |
| 75 Years and over | 8 (1.8%) | 0 (0.0%) |
| Total | 1,107 (47.5%) | 65 (5.9%) |
Employment Status by Educational Attainment in Iuka
According to labor force statistics for Iuka, 67.9% of individuals (980) out of the total population between 25 and 64 years of age (1,443) are in the labor force, with 5.0% or 49 of them being unemployed. The group with the highest labor force participation rate are those with the educational attainment of bachelor's degree or higher, with 94.0% or 266 individuals in the labor force. Within the labor force, individuals with high school diploma education have the highest percentage of unemployment, with 18.1% or 49 of them being unemployed.
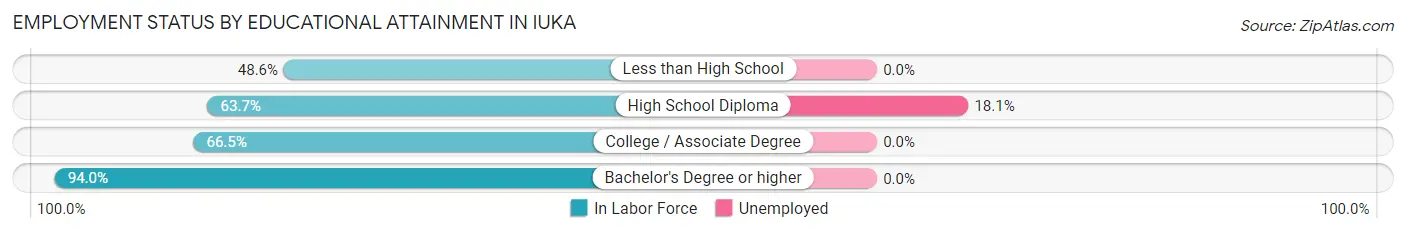
| Educational Attainment | In Labor Force | Unemployed |
| Less than High School | 124 (48.6%) | 0 (0.0%) |
| High School Diploma | 270 (63.7%) | 77 (18.1%) |
| College / Associate Degree | 320 (66.5%) | 0 (0.0%) |
| Bachelor's Degree or higher | 266 (94.0%) | 0 (0.0%) |
| Total | 980 (67.9%) | 72 (5.0%) |
Employment Occupations by Sex in Iuka
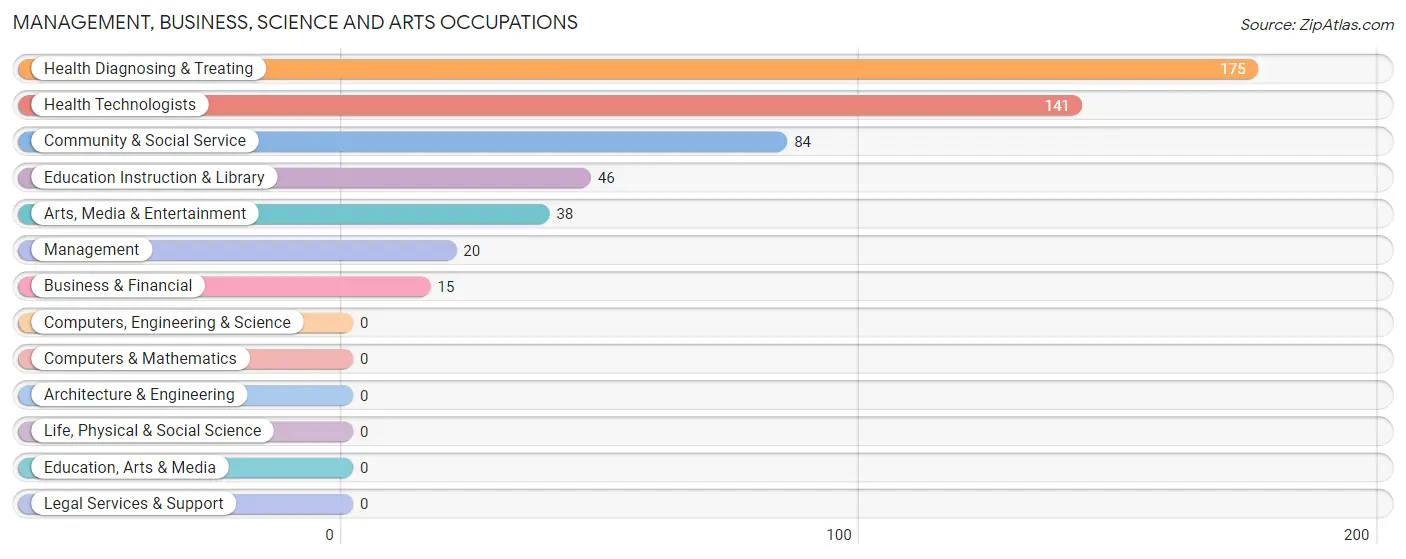
Management, Business, Science and Arts Occupations
The most common Management, Business, Science and Arts occupations in Iuka are Health Diagnosing & Treating (175 | 16.8%), Health Technologists (141 | 13.5%), Community & Social Service (84 | 8.1%), Education Instruction & Library (46 | 4.4%), and Arts, Media & Entertainment (38 | 3.6%).
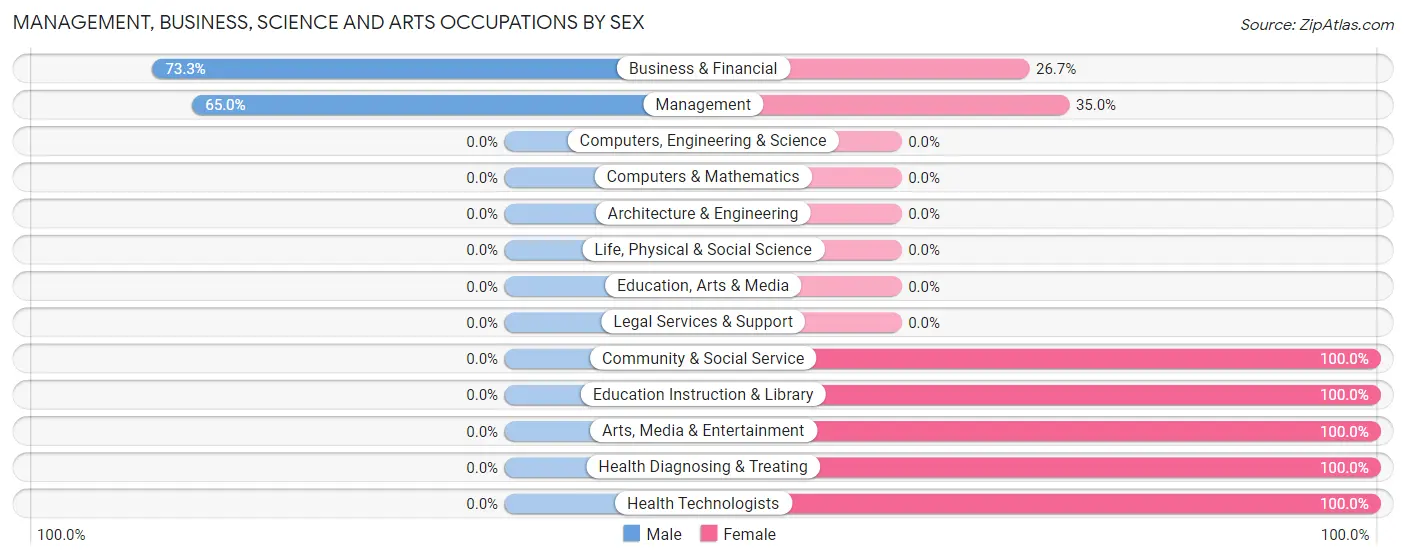
Management, Business, Science and Arts Occupations by Sex
Within the Management, Business, Science and Arts occupations in Iuka, the most male-oriented occupations are Business & Financial (73.3%), and Management (65.0%), while the most female-oriented occupations are Community & Social Service (100.0%), Education Instruction & Library (100.0%), and Arts, Media & Entertainment (100.0%).
| Occupation | Male | Female |
| Management | 13 (65.0%) | 7 (35.0%) |
| Business & Financial | 11 (73.3%) | 4 (26.7%) |
| Computers, Engineering & Science | 0 (0.0%) | 0 (0.0%) |
| Computers & Mathematics | 0 (0.0%) | 0 (0.0%) |
| Architecture & Engineering | 0 (0.0%) | 0 (0.0%) |
| Life, Physical & Social Science | 0 (0.0%) | 0 (0.0%) |
| Community & Social Service | 0 (0.0%) | 84 (100.0%) |
| Education, Arts & Media | 0 (0.0%) | 0 (0.0%) |
| Legal Services & Support | 0 (0.0%) | 0 (0.0%) |
| Education Instruction & Library | 0 (0.0%) | 46 (100.0%) |
| Arts, Media & Entertainment | 0 (0.0%) | 38 (100.0%) |
| Health Diagnosing & Treating | 0 (0.0%) | 175 (100.0%) |
| Health Technologists | 0 (0.0%) | 141 (100.0%) |
| Total (Category) | 24 (8.2%) | 270 (91.8%) |
| Total (Overall) | 488 (46.9%) | 553 (53.1%) |
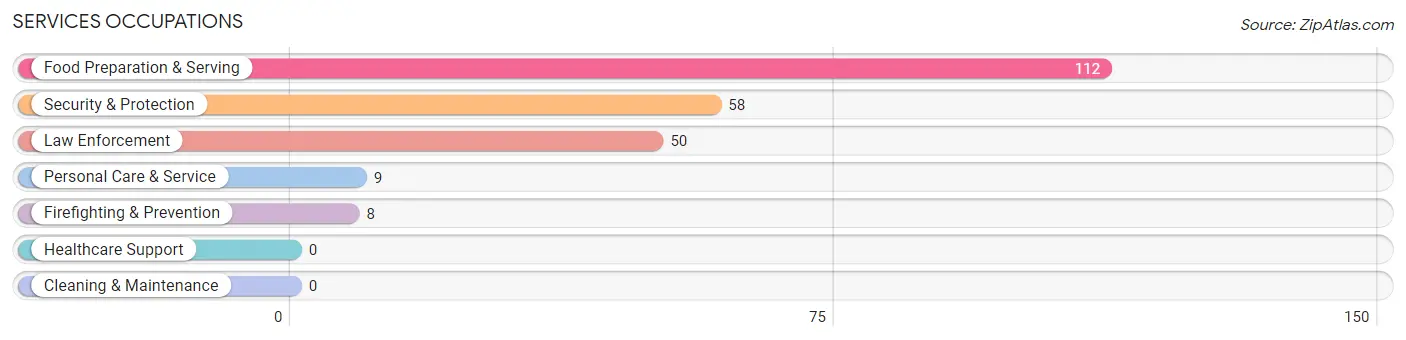
Services Occupations
The most common Services occupations in Iuka are Food Preparation & Serving (112 | 10.8%), Security & Protection (58 | 5.6%), Law Enforcement (50 | 4.8%), Personal Care & Service (9 | 0.9%), and Firefighting & Prevention (8 | 0.8%).
Services Occupations by Sex
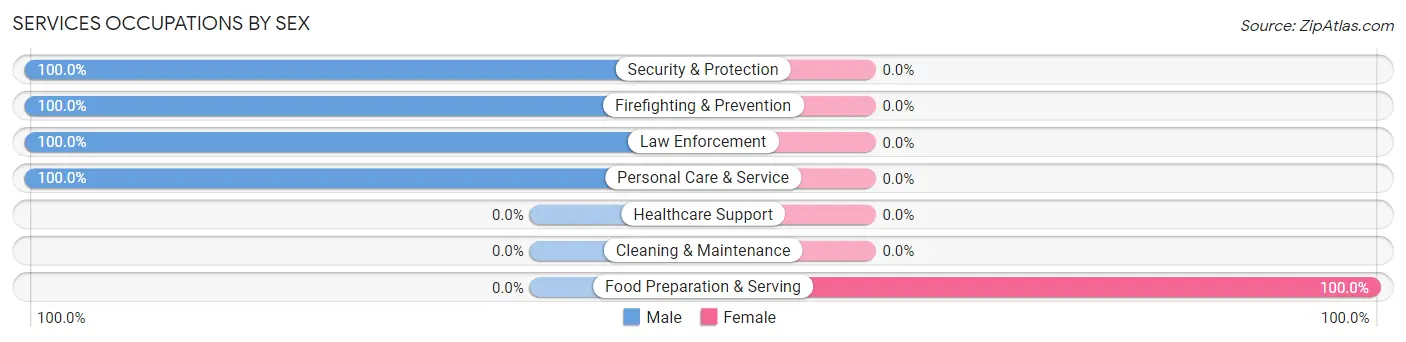
| Occupation | Male | Female |
| Healthcare Support | 0 (0.0%) | 0 (0.0%) |
| Security & Protection | 58 (100.0%) | 0 (0.0%) |
| Firefighting & Prevention | 8 (100.0%) | 0 (0.0%) |
| Law Enforcement | 50 (100.0%) | 0 (0.0%) |
| Food Preparation & Serving | 0 (0.0%) | 112 (100.0%) |
| Cleaning & Maintenance | 0 (0.0%) | 0 (0.0%) |
| Personal Care & Service | 9 (100.0%) | 0 (0.0%) |
| Total (Category) | 67 (37.4%) | 112 (62.6%) |
| Total (Overall) | 488 (46.9%) | 553 (53.1%) |
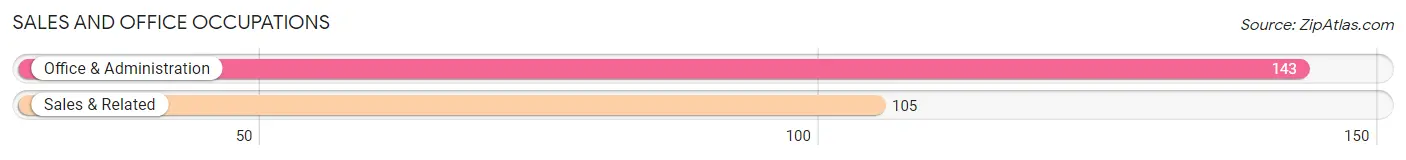
Sales and Office Occupations
The most common Sales and Office occupations in Iuka are Office & Administration (143 | 13.7%), and Sales & Related (105 | 10.1%).
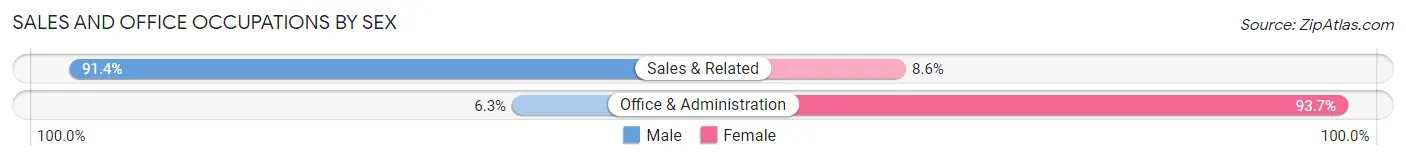
Sales and Office Occupations by Sex
| Occupation | Male | Female |
| Sales & Related | 96 (91.4%) | 9 (8.6%) |
| Office & Administration | 9 (6.3%) | 134 (93.7%) |
| Total (Category) | 105 (42.3%) | 143 (57.7%) |
| Total (Overall) | 488 (46.9%) | 553 (53.1%) |
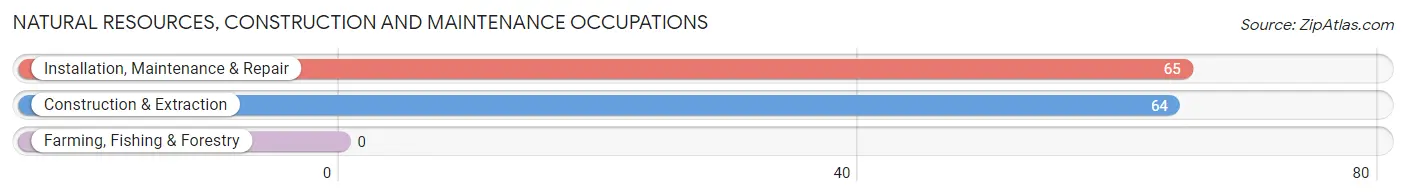
Natural Resources, Construction and Maintenance Occupations
The most common Natural Resources, Construction and Maintenance occupations in Iuka are Installation, Maintenance & Repair (65 | 6.2%), and Construction & Extraction (64 | 6.1%).
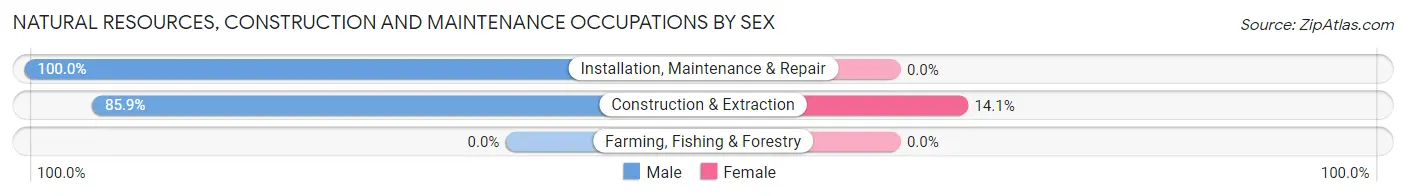
Natural Resources, Construction and Maintenance Occupations by Sex
| Occupation | Male | Female |
| Farming, Fishing & Forestry | 0 (0.0%) | 0 (0.0%) |
| Construction & Extraction | 55 (85.9%) | 9 (14.1%) |
| Installation, Maintenance & Repair | 65 (100.0%) | 0 (0.0%) |
| Total (Category) | 120 (93.0%) | 9 (7.0%) |
| Total (Overall) | 488 (46.9%) | 553 (53.1%) |
Production, Transportation and Moving Occupations
The most common Production, Transportation and Moving occupations in Iuka are Production (87 | 8.4%), Transportation (85 | 8.2%), and Material Moving (19 | 1.8%).
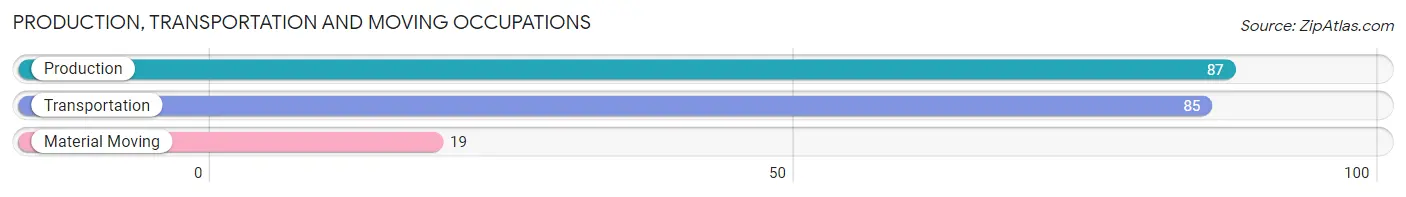
Production, Transportation and Moving Occupations by Sex
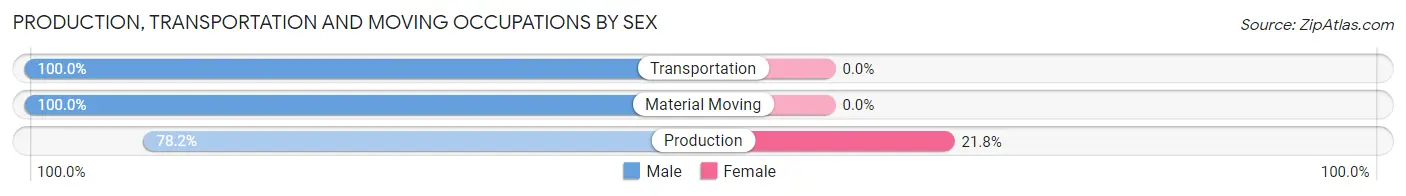
| Occupation | Male | Female |
| Production | 68 (78.2%) | 19 (21.8%) |
| Transportation | 85 (100.0%) | 0 (0.0%) |
| Material Moving | 19 (100.0%) | 0 (0.0%) |
| Total (Category) | 172 (90.0%) | 19 (10.0%) |
| Total (Overall) | 488 (46.9%) | 553 (53.1%) |
Employment Industries by Sex in Iuka
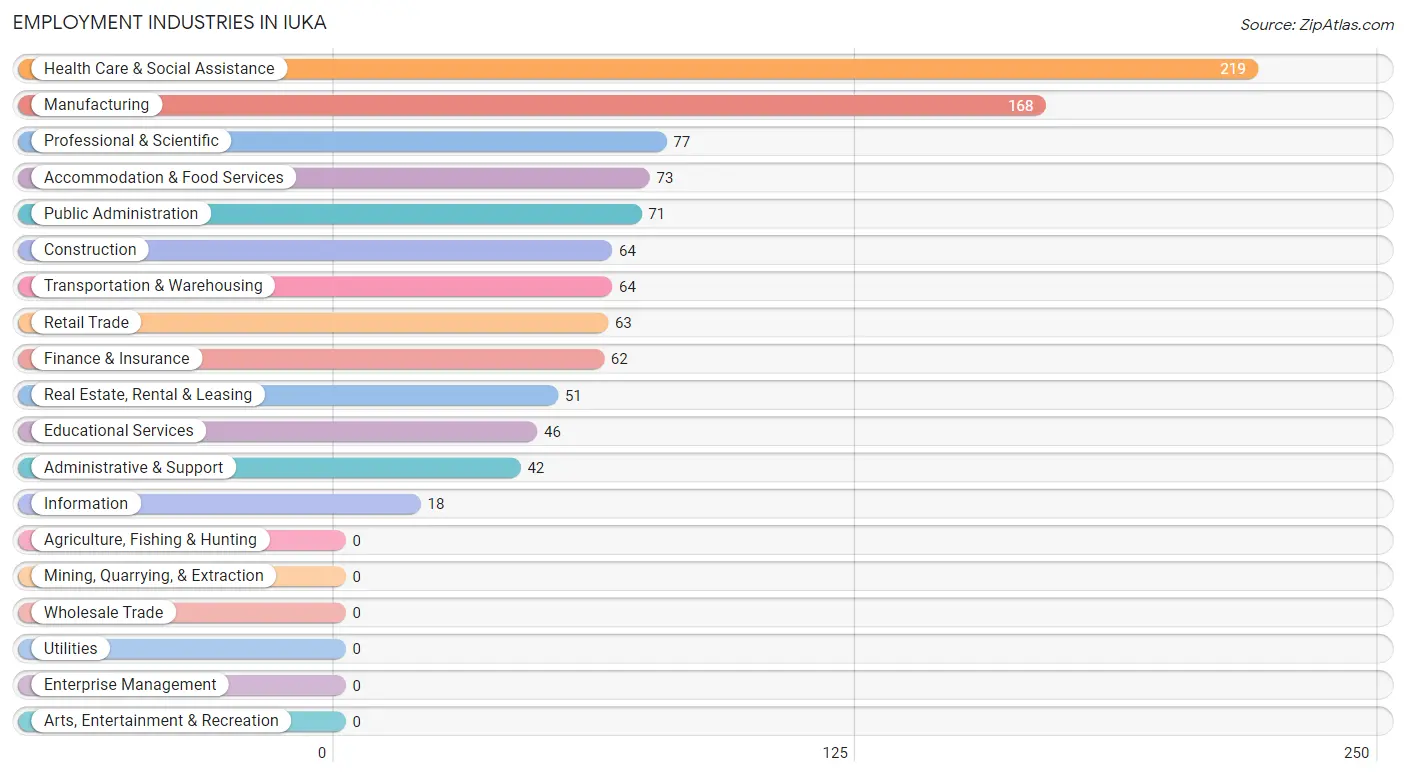
Employment Industries in Iuka
The major employment industries in Iuka include Health Care & Social Assistance (219 | 21.0%), Manufacturing (168 | 16.1%), Professional & Scientific (77 | 7.4%), Accommodation & Food Services (73 | 7.0%), and Public Administration (71 | 6.8%).
Employment Industries by Sex in Iuka
The Iuka industries that see more men than women are Administrative & Support (100.0%), Manufacturing (88.7%), and Finance & Insurance (87.1%), whereas the industries that tend to have a higher number of women are Real Estate, Rental & Leasing (100.0%), Educational Services (100.0%), and Health Care & Social Assistance (100.0%).
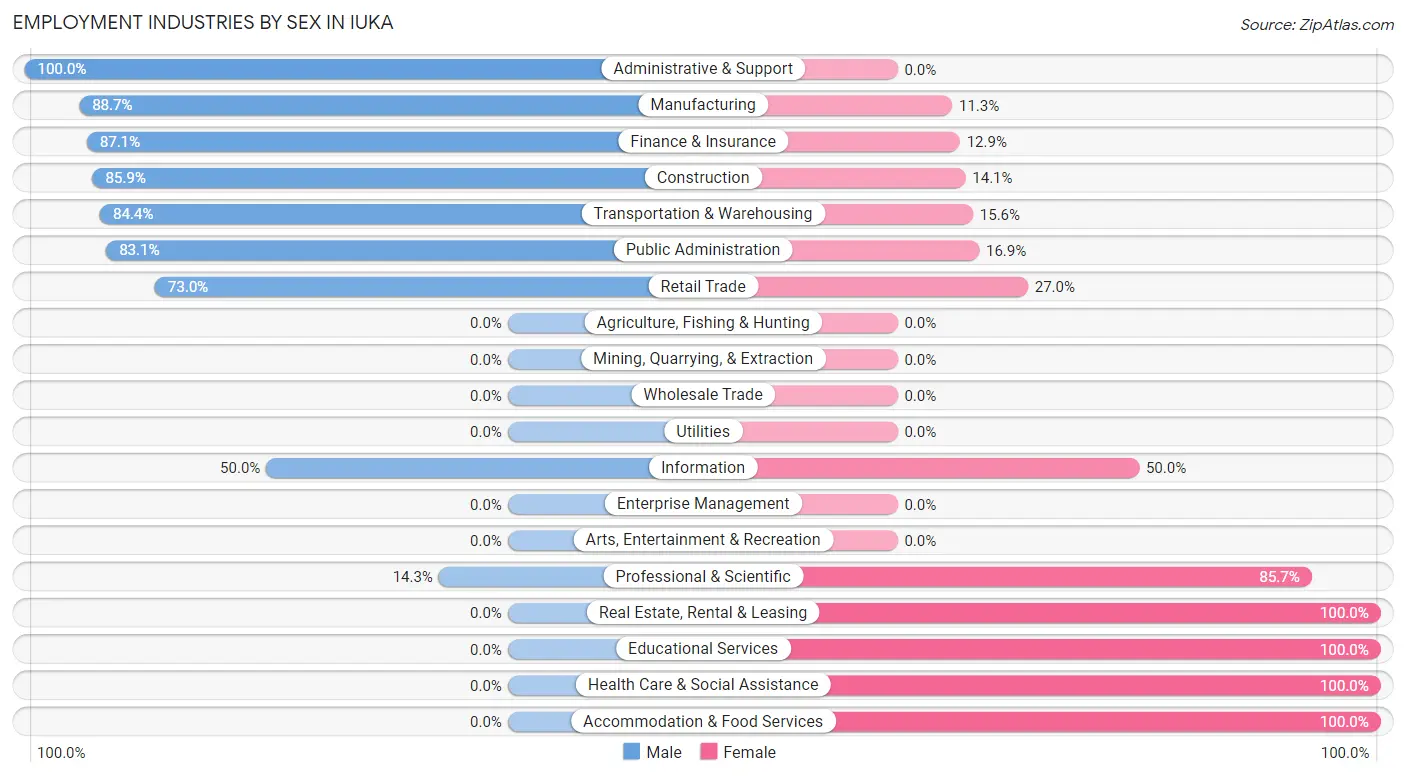
| Industry | Male | Female |
| Agriculture, Fishing & Hunting | 0 (0.0%) | 0 (0.0%) |
| Mining, Quarrying, & Extraction | 0 (0.0%) | 0 (0.0%) |
| Construction | 55 (85.9%) | 9 (14.1%) |
| Manufacturing | 149 (88.7%) | 19 (11.3%) |
| Wholesale Trade | 0 (0.0%) | 0 (0.0%) |
| Retail Trade | 46 (73.0%) | 17 (27.0%) |
| Transportation & Warehousing | 54 (84.4%) | 10 (15.6%) |
| Utilities | 0 (0.0%) | 0 (0.0%) |
| Information | 9 (50.0%) | 9 (50.0%) |
| Finance & Insurance | 54 (87.1%) | 8 (12.9%) |
| Real Estate, Rental & Leasing | 0 (0.0%) | 51 (100.0%) |
| Professional & Scientific | 11 (14.3%) | 66 (85.7%) |
| Enterprise Management | 0 (0.0%) | 0 (0.0%) |
| Administrative & Support | 42 (100.0%) | 0 (0.0%) |
| Educational Services | 0 (0.0%) | 46 (100.0%) |
| Health Care & Social Assistance | 0 (0.0%) | 219 (100.0%) |
| Arts, Entertainment & Recreation | 0 (0.0%) | 0 (0.0%) |
| Accommodation & Food Services | 0 (0.0%) | 73 (100.0%) |
| Public Administration | 59 (83.1%) | 12 (16.9%) |
| Total | 488 (46.9%) | 553 (53.1%) |
Education in Iuka
School Enrollment in Iuka
The most common levels of schooling among the 636 students in Iuka are elementary school (219 | 34.4%), middle school (160 | 25.2%), and nursery / preschool (75 | 11.8%).
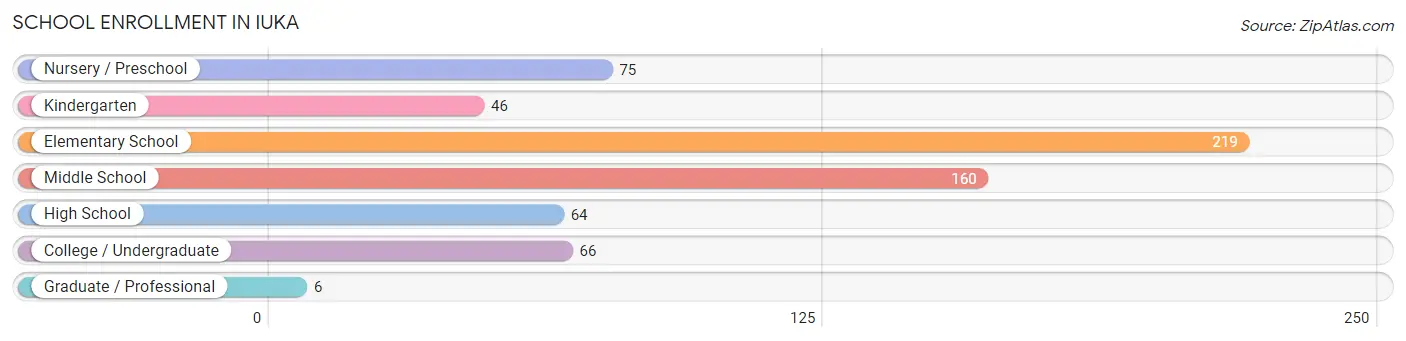
| School Level | # Students | % Students |
| Nursery / Preschool | 75 | 11.8% |
| Kindergarten | 46 | 7.2% |
| Elementary School | 219 | 34.4% |
| Middle School | 160 | 25.2% |
| High School | 64 | 10.1% |
| College / Undergraduate | 66 | 10.4% |
| Graduate / Professional | 6 | 0.9% |
| Total | 636 | 100.0% |
School Enrollment by Age by Funding Source in Iuka
Out of a total of 636 students who are enrolled in schools in Iuka, 194 (30.5%) attend a private institution, while the remaining 442 (69.5%) are enrolled in public schools. The age group of 3 to 4 year olds has the highest likelihood of being enrolled in private schools, with 64 (100.0% in the age bracket) enrolled. Conversely, the age group of 15 to 17 year olds has the lowest likelihood of being enrolled in a private school, with 64 (100.0% in the age bracket) attending a public institution.
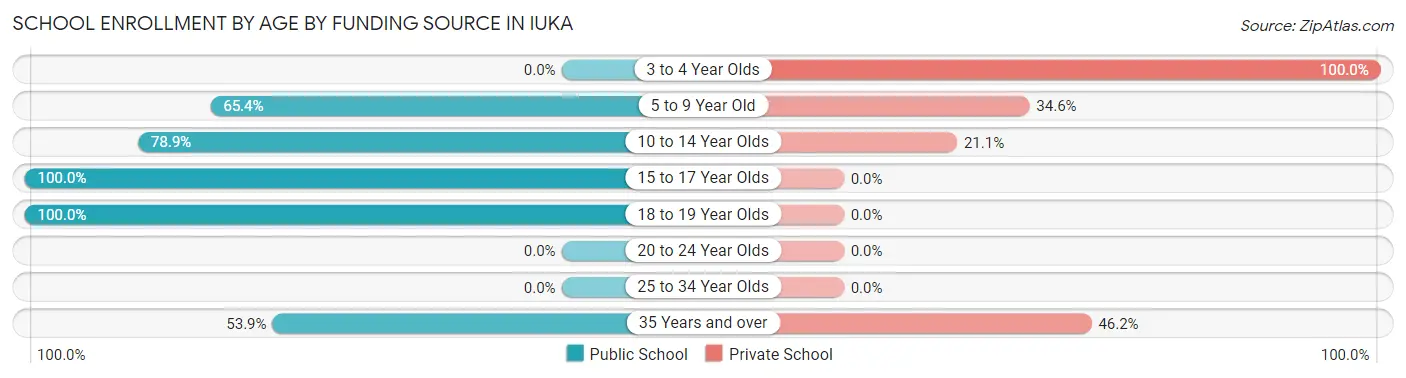
| Age Bracket | Public School | Private School |
| 3 to 4 Year Olds | 0 (0.0%) | 64 (100.0%) |
| 5 to 9 Year Old | 155 (65.4%) | 82 (34.6%) |
| 10 to 14 Year Olds | 157 (78.9%) | 42 (21.1%) |
| 15 to 17 Year Olds | 64 (100.0%) | 0 (0.0%) |
| 18 to 19 Year Olds | 59 (100.0%) | 0 (0.0%) |
| 20 to 24 Year Olds | 0 (0.0%) | 0 (0.0%) |
| 25 to 34 Year Olds | 0 (0.0%) | 0 (0.0%) |
| 35 Years and over | 7 (53.8%) | 6 (46.2%) |
| Total | 442 (69.5%) | 194 (30.5%) |
Educational Attainment by Field of Study in Iuka
Science & technology (121 | 34.2%), education (89 | 25.1%), business (80 | 22.6%), psychology (44 | 12.4%), and computers & mathematics (9 | 2.5%) are the most common fields of study among 354 individuals in Iuka who have obtained a bachelor's degree or higher.
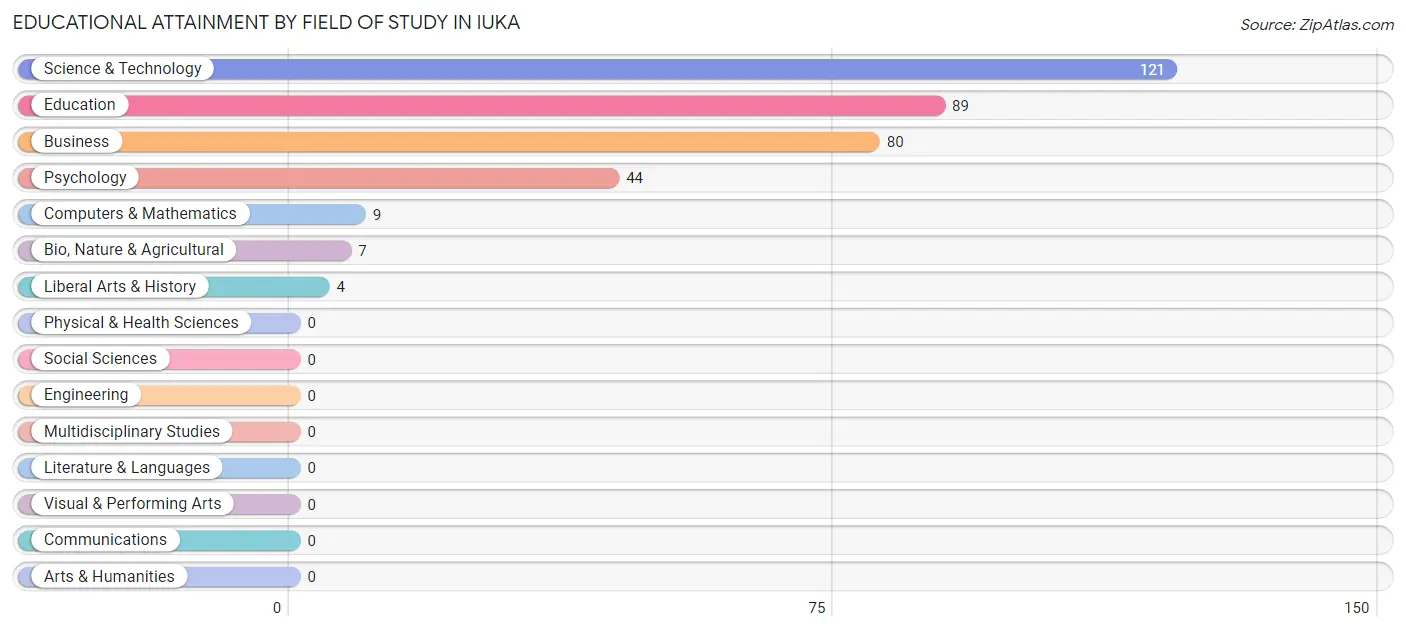
| Field of Study | # Graduates | % Graduates |
| Computers & Mathematics | 9 | 2.5% |
| Bio, Nature & Agricultural | 7 | 2.0% |
| Physical & Health Sciences | 0 | 0.0% |
| Psychology | 44 | 12.4% |
| Social Sciences | 0 | 0.0% |
| Engineering | 0 | 0.0% |
| Multidisciplinary Studies | 0 | 0.0% |
| Science & Technology | 121 | 34.2% |
| Business | 80 | 22.6% |
| Education | 89 | 25.1% |
| Literature & Languages | 0 | 0.0% |
| Liberal Arts & History | 4 | 1.1% |
| Visual & Performing Arts | 0 | 0.0% |
| Communications | 0 | 0.0% |
| Arts & Humanities | 0 | 0.0% |
| Total | 354 | 100.0% |
Transportation & Commute in Iuka
Vehicle Availability by Sex in Iuka
The most prevalent vehicle ownership categories in Iuka are males with 3 vehicles (268, accounting for 57.0%) and females with 3 vehicles (248, making up 49.4%).
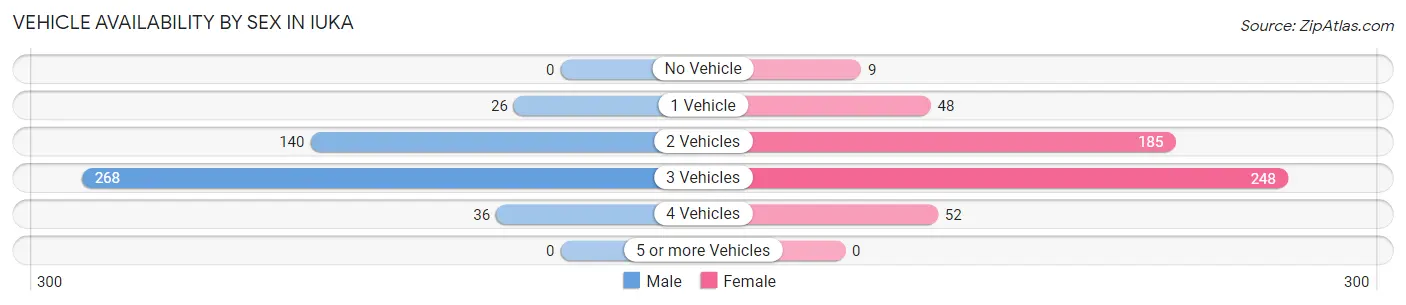
| Vehicles Available | Male | Female |
| No Vehicle | 0 (0.0%) | 9 (1.7%) |
| 1 Vehicle | 26 (5.5%) | 48 (8.9%) |
| 2 Vehicles | 140 (29.8%) | 185 (34.1%) |
| 3 Vehicles | 268 (57.0%) | 248 (45.8%) |
| 4 Vehicles | 36 (7.7%) | 52 (9.6%) |
| 5 or more Vehicles | 0 (0.0%) | 0 (0.0%) |
| Total | 470 (100.0%) | 542 (100.0%) |
Commute Time in Iuka
The most frequently occuring commute durations in Iuka are 30 to 34 minutes (241 commuters, 24.5%), 5 to 9 minutes (193 commuters, 19.6%), and 10 to 14 minutes (175 commuters, 17.8%).
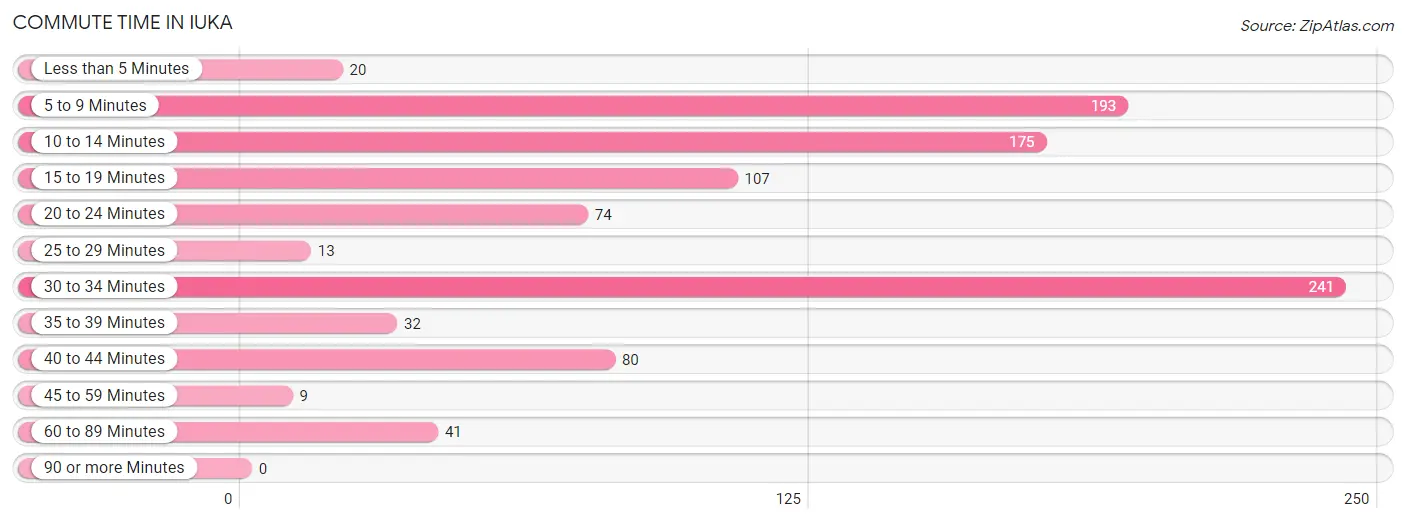
| Commute Time | # Commuters | % Commuters |
| Less than 5 Minutes | 20 | 2.0% |
| 5 to 9 Minutes | 193 | 19.6% |
| 10 to 14 Minutes | 175 | 17.8% |
| 15 to 19 Minutes | 107 | 10.9% |
| 20 to 24 Minutes | 74 | 7.5% |
| 25 to 29 Minutes | 13 | 1.3% |
| 30 to 34 Minutes | 241 | 24.5% |
| 35 to 39 Minutes | 32 | 3.3% |
| 40 to 44 Minutes | 80 | 8.1% |
| 45 to 59 Minutes | 9 | 0.9% |
| 60 to 89 Minutes | 41 | 4.2% |
| 90 or more Minutes | 0 | 0.0% |
Commute Time by Sex in Iuka
The most common commute times in Iuka are 30 to 34 minutes (120 commuters, 25.5%) for males and 10 to 14 minutes (174 commuters, 33.9%) for females.
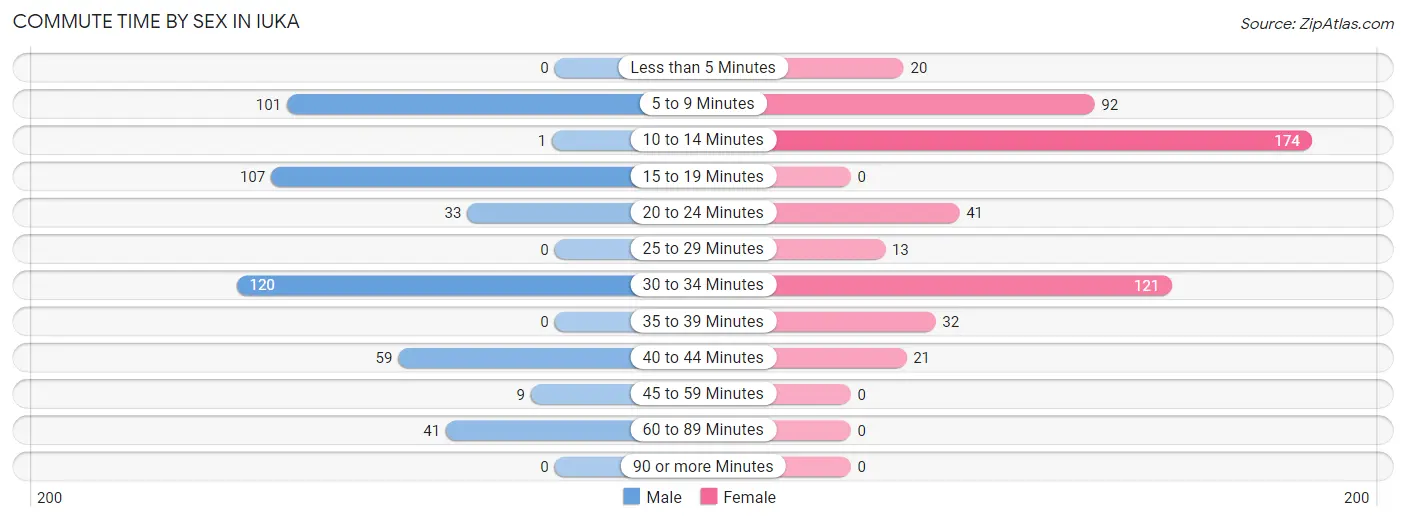
| Commute Time | Male | Female |
| Less than 5 Minutes | 0 (0.0%) | 20 (3.9%) |
| 5 to 9 Minutes | 101 (21.4%) | 92 (17.9%) |
| 10 to 14 Minutes | 1 (0.2%) | 174 (33.9%) |
| 15 to 19 Minutes | 107 (22.7%) | 0 (0.0%) |
| 20 to 24 Minutes | 33 (7.0%) | 41 (8.0%) |
| 25 to 29 Minutes | 0 (0.0%) | 13 (2.5%) |
| 30 to 34 Minutes | 120 (25.5%) | 121 (23.5%) |
| 35 to 39 Minutes | 0 (0.0%) | 32 (6.2%) |
| 40 to 44 Minutes | 59 (12.5%) | 21 (4.1%) |
| 45 to 59 Minutes | 9 (1.9%) | 0 (0.0%) |
| 60 to 89 Minutes | 41 (8.7%) | 0 (0.0%) |
| 90 or more Minutes | 0 (0.0%) | 0 (0.0%) |
Time of Departure to Work by Sex in Iuka
The most frequent times of departure to work in Iuka are 6:30 AM to 6:59 AM (113, 24.0%) for males and 8:00 AM to 8:29 AM (139, 27.0%) for females.
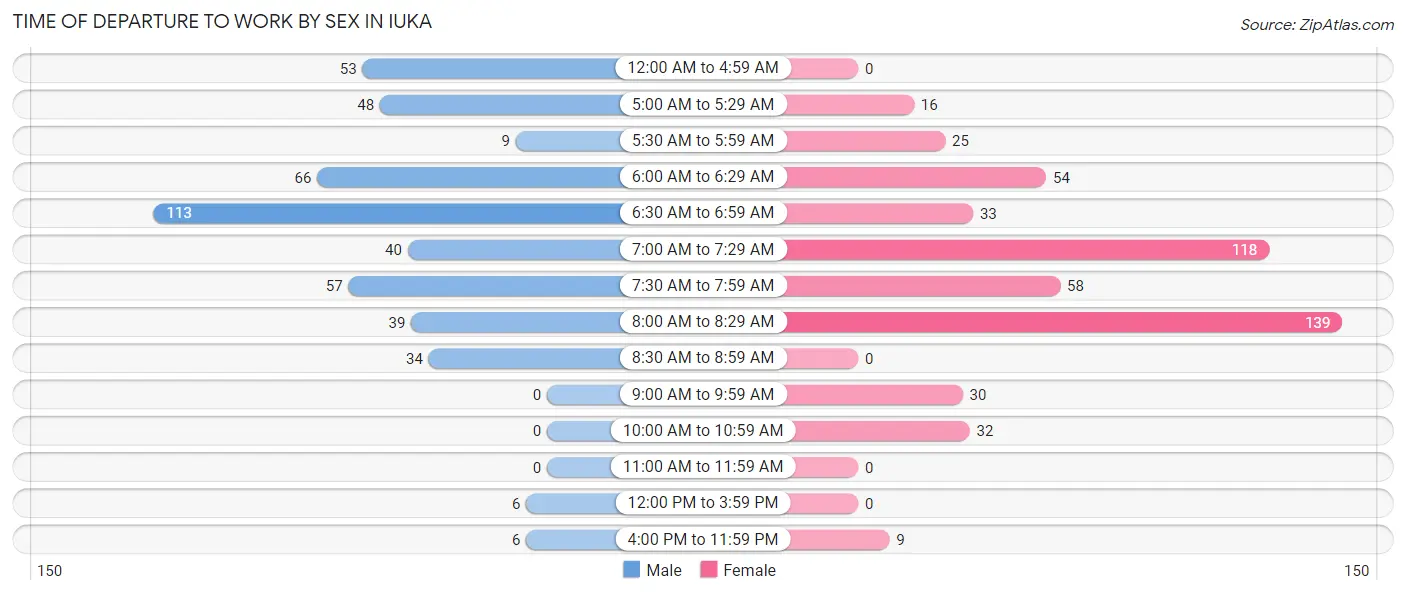
| Time of Departure | Male | Female |
| 12:00 AM to 4:59 AM | 53 (11.3%) | 0 (0.0%) |
| 5:00 AM to 5:29 AM | 48 (10.2%) | 16 (3.1%) |
| 5:30 AM to 5:59 AM | 9 (1.9%) | 25 (4.9%) |
| 6:00 AM to 6:29 AM | 66 (14.0%) | 54 (10.5%) |
| 6:30 AM to 6:59 AM | 113 (24.0%) | 33 (6.4%) |
| 7:00 AM to 7:29 AM | 40 (8.5%) | 118 (23.0%) |
| 7:30 AM to 7:59 AM | 57 (12.1%) | 58 (11.3%) |
| 8:00 AM to 8:29 AM | 39 (8.3%) | 139 (27.0%) |
| 8:30 AM to 8:59 AM | 34 (7.2%) | 0 (0.0%) |
| 9:00 AM to 9:59 AM | 0 (0.0%) | 30 (5.8%) |
| 10:00 AM to 10:59 AM | 0 (0.0%) | 32 (6.2%) |
| 11:00 AM to 11:59 AM | 0 (0.0%) | 0 (0.0%) |
| 12:00 PM to 3:59 PM | 6 (1.3%) | 0 (0.0%) |
| 4:00 PM to 11:59 PM | 6 (1.3%) | 9 (1.8%) |
| Total | 471 (100.0%) | 514 (100.0%) |
Housing Occupancy in Iuka
Occupancy by Ownership in Iuka
Of the total 1,214 dwellings in Iuka, owner-occupied units account for 744 (61.3%), while renter-occupied units make up 470 (38.7%).
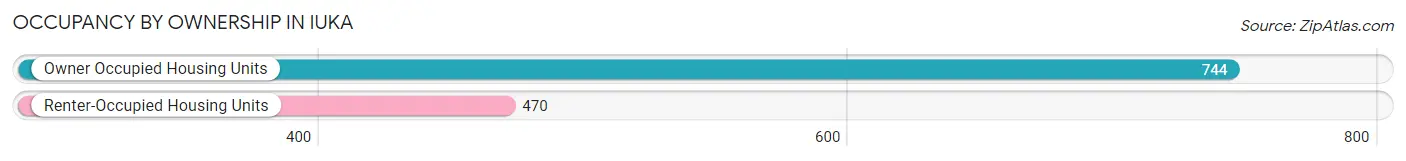
| Occupancy | # Housing Units | % Housing Units |
| Owner Occupied Housing Units | 744 | 61.3% |
| Renter-Occupied Housing Units | 470 | 38.7% |
| Total Occupied Housing Units | 1,214 | 100.0% |
Occupancy by Household Size in Iuka
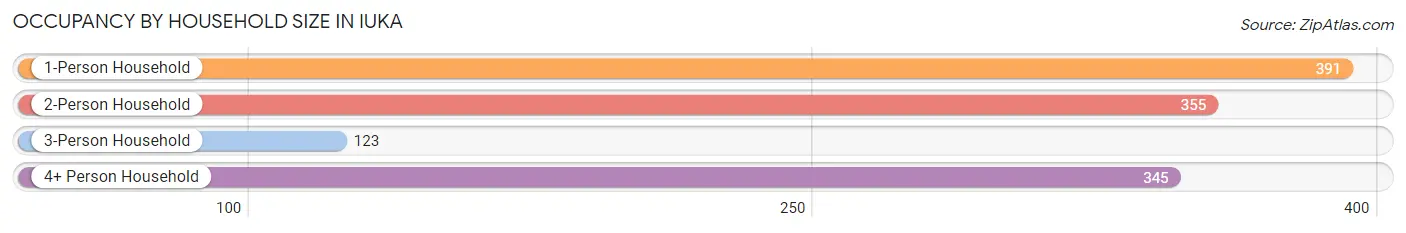
| Household Size | # Housing Units | % Housing Units |
| 1-Person Household | 391 | 32.2% |
| 2-Person Household | 355 | 29.2% |
| 3-Person Household | 123 | 10.1% |
| 4+ Person Household | 345 | 28.4% |
| Total Housing Units | 1,214 | 100.0% |
Occupancy by Ownership by Household Size in Iuka
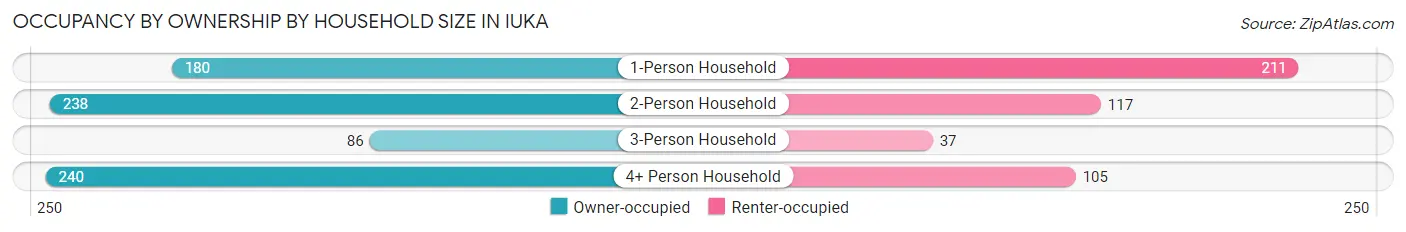
| Household Size | Owner-occupied | Renter-occupied |
| 1-Person Household | 180 (46.0%) | 211 (54.0%) |
| 2-Person Household | 238 (67.0%) | 117 (33.0%) |
| 3-Person Household | 86 (69.9%) | 37 (30.1%) |
| 4+ Person Household | 240 (69.6%) | 105 (30.4%) |
| Total Housing Units | 744 (61.3%) | 470 (38.7%) |
Occupancy by Educational Attainment in Iuka
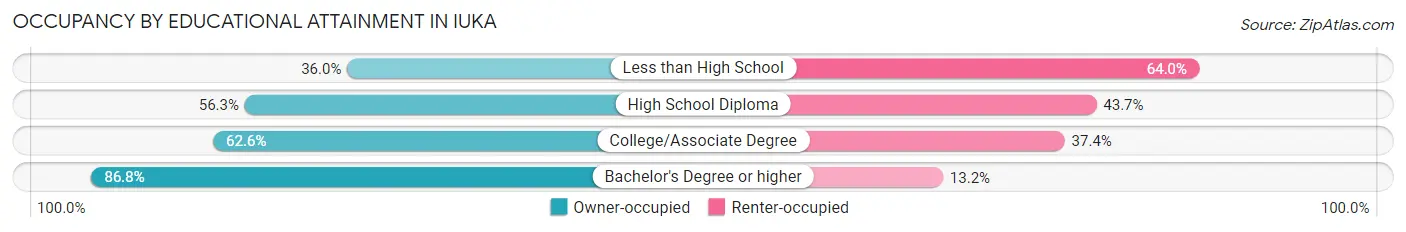
| Household Size | Owner-occupied | Renter-occupied |
| Less than High School | 49 (36.0%) | 87 (64.0%) |
| High School Diploma | 231 (56.3%) | 179 (43.7%) |
| College/Associate Degree | 300 (62.6%) | 179 (37.4%) |
| Bachelor's Degree or higher | 164 (86.8%) | 25 (13.2%) |
Occupancy by Age of Householder in Iuka
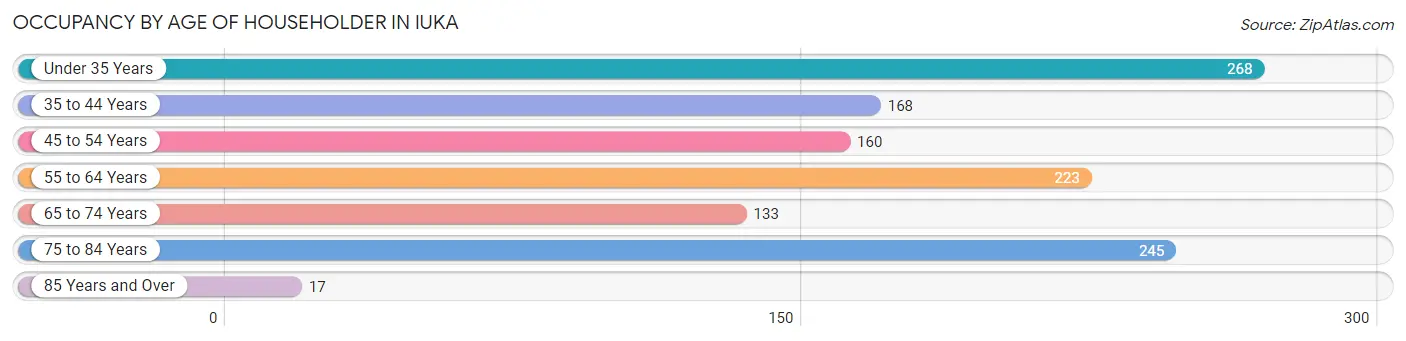
| Age Bracket | # Households | % Households |
| Under 35 Years | 268 | 22.1% |
| 35 to 44 Years | 168 | 13.8% |
| 45 to 54 Years | 160 | 13.2% |
| 55 to 64 Years | 223 | 18.4% |
| 65 to 74 Years | 133 | 11.0% |
| 75 to 84 Years | 245 | 20.2% |
| 85 Years and Over | 17 | 1.4% |
| Total | 1,214 | 100.0% |
Housing Finances in Iuka
Median Income by Occupancy in Iuka
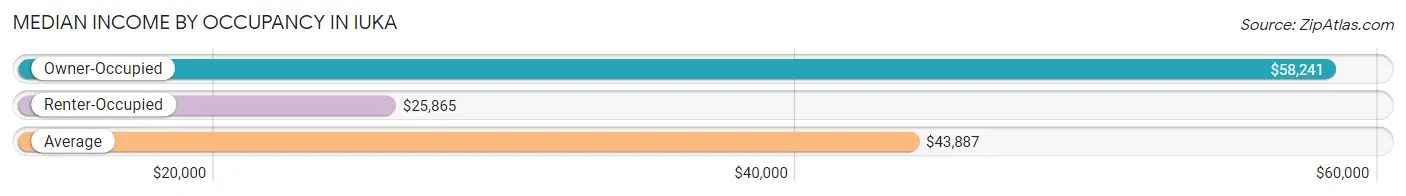
| Occupancy Type | # Households | Median Income |
| Owner-Occupied | 744 (61.3%) | $58,241 |
| Renter-Occupied | 470 (38.7%) | $25,865 |
| Average | 1,214 (100.0%) | $43,887 |
Occupancy by Householder Income Bracket in Iuka
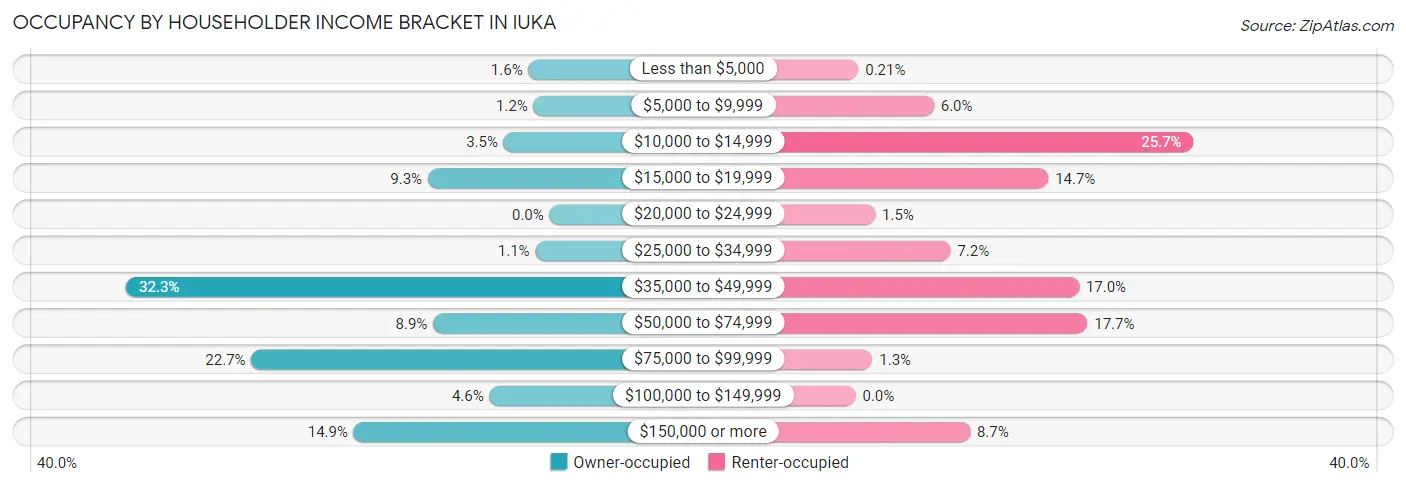
| Income Bracket | Owner-occupied | Renter-occupied |
| Less than $5,000 | 12 (1.6%) | 1 (0.2%) |
| $5,000 to $9,999 | 9 (1.2%) | 28 (6.0%) |
| $10,000 to $14,999 | 26 (3.5%) | 121 (25.7%) |
| $15,000 to $19,999 | 69 (9.3%) | 69 (14.7%) |
| $20,000 to $24,999 | 0 (0.0%) | 7 (1.5%) |
| $25,000 to $34,999 | 8 (1.1%) | 34 (7.2%) |
| $35,000 to $49,999 | 240 (32.3%) | 80 (17.0%) |
| $50,000 to $74,999 | 66 (8.9%) | 83 (17.7%) |
| $75,000 to $99,999 | 169 (22.7%) | 6 (1.3%) |
| $100,000 to $149,999 | 34 (4.6%) | 0 (0.0%) |
| $150,000 or more | 111 (14.9%) | 41 (8.7%) |
| Total | 744 (100.0%) | 470 (100.0%) |
Monthly Housing Cost Tiers in Iuka
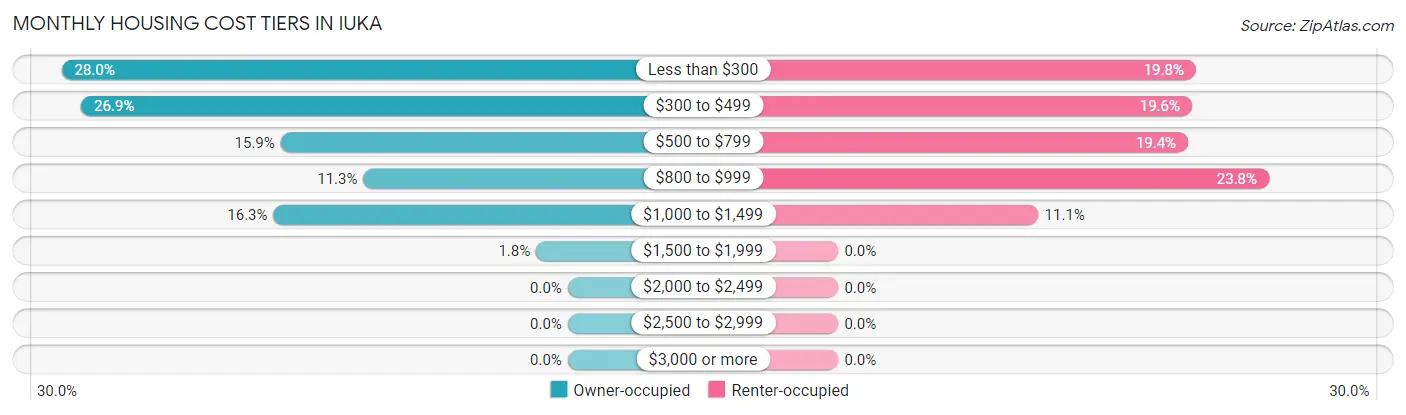
| Monthly Cost | Owner-occupied | Renter-occupied |
| Less than $300 | 208 (28.0%) | 93 (19.8%) |
| $300 to $499 | 200 (26.9%) | 92 (19.6%) |
| $500 to $799 | 118 (15.9%) | 91 (19.4%) |
| $800 to $999 | 84 (11.3%) | 112 (23.8%) |
| $1,000 to $1,499 | 121 (16.3%) | 52 (11.1%) |
| $1,500 to $1,999 | 13 (1.8%) | 0 (0.0%) |
| $2,000 to $2,499 | 0 (0.0%) | 0 (0.0%) |
| $2,500 to $2,999 | 0 (0.0%) | 0 (0.0%) |
| $3,000 or more | 0 (0.0%) | 0 (0.0%) |
| Total | 744 (100.0%) | 470 (100.0%) |
Physical Housing Characteristics in Iuka
Housing Structures in Iuka
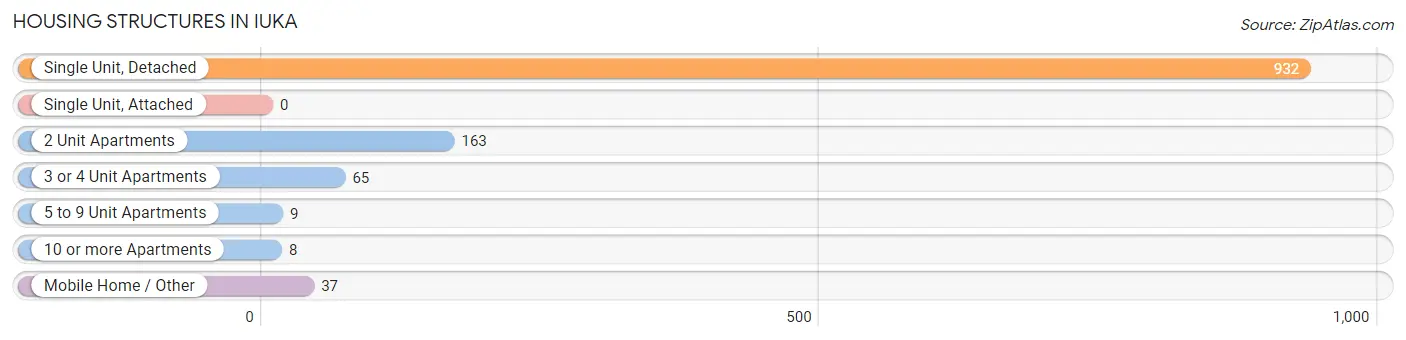
| Structure Type | # Housing Units | % Housing Units |
| Single Unit, Detached | 932 | 76.8% |
| Single Unit, Attached | 0 | 0.0% |
| 2 Unit Apartments | 163 | 13.4% |
| 3 or 4 Unit Apartments | 65 | 5.3% |
| 5 to 9 Unit Apartments | 9 | 0.7% |
| 10 or more Apartments | 8 | 0.7% |
| Mobile Home / Other | 37 | 3.0% |
| Total | 1,214 | 100.0% |
Housing Structures by Occupancy in Iuka
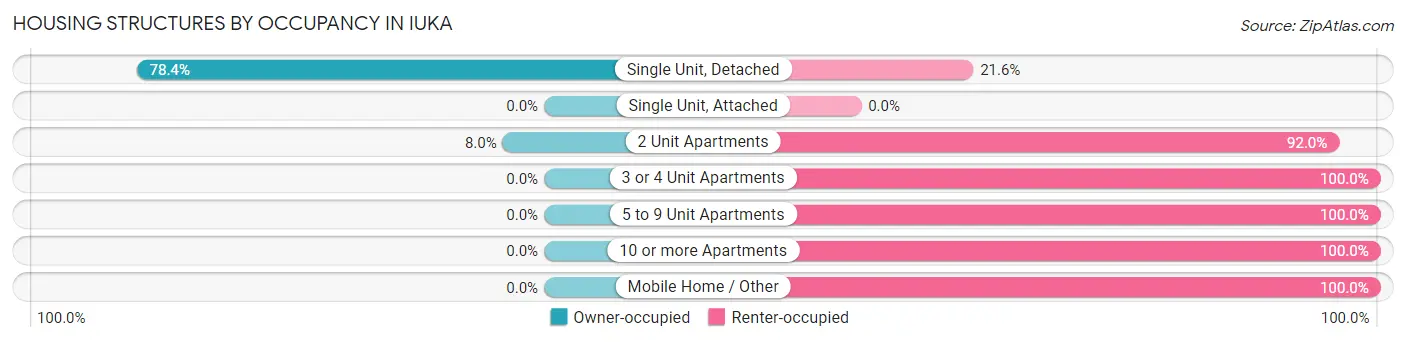
| Structure Type | Owner-occupied | Renter-occupied |
| Single Unit, Detached | 731 (78.4%) | 201 (21.6%) |
| Single Unit, Attached | 0 (0.0%) | 0 (0.0%) |
| 2 Unit Apartments | 13 (8.0%) | 150 (92.0%) |
| 3 or 4 Unit Apartments | 0 (0.0%) | 65 (100.0%) |
| 5 to 9 Unit Apartments | 0 (0.0%) | 9 (100.0%) |
| 10 or more Apartments | 0 (0.0%) | 8 (100.0%) |
| Mobile Home / Other | 0 (0.0%) | 37 (100.0%) |
| Total | 744 (61.3%) | 470 (38.7%) |
Housing Structures by Number of Rooms in Iuka
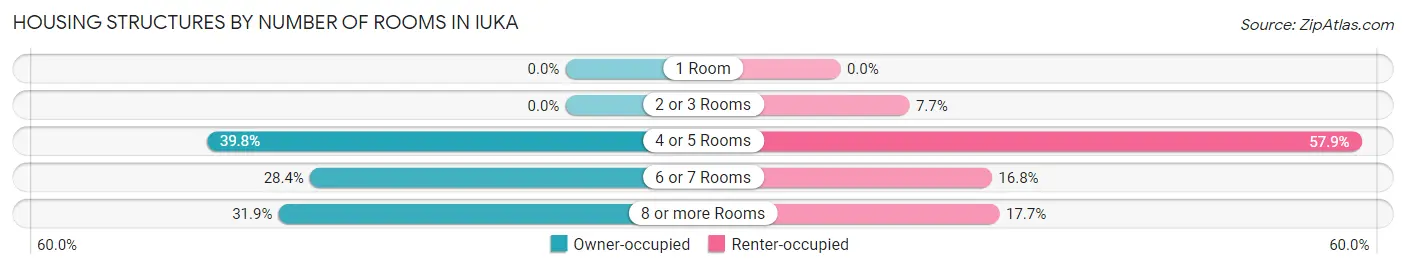
| Number of Rooms | Owner-occupied | Renter-occupied |
| 1 Room | 0 (0.0%) | 0 (0.0%) |
| 2 or 3 Rooms | 0 (0.0%) | 36 (7.7%) |
| 4 or 5 Rooms | 296 (39.8%) | 272 (57.9%) |
| 6 or 7 Rooms | 211 (28.4%) | 79 (16.8%) |
| 8 or more Rooms | 237 (31.9%) | 83 (17.7%) |
| Total | 744 (100.0%) | 470 (100.0%) |
Housing Structure by Heating Type in Iuka
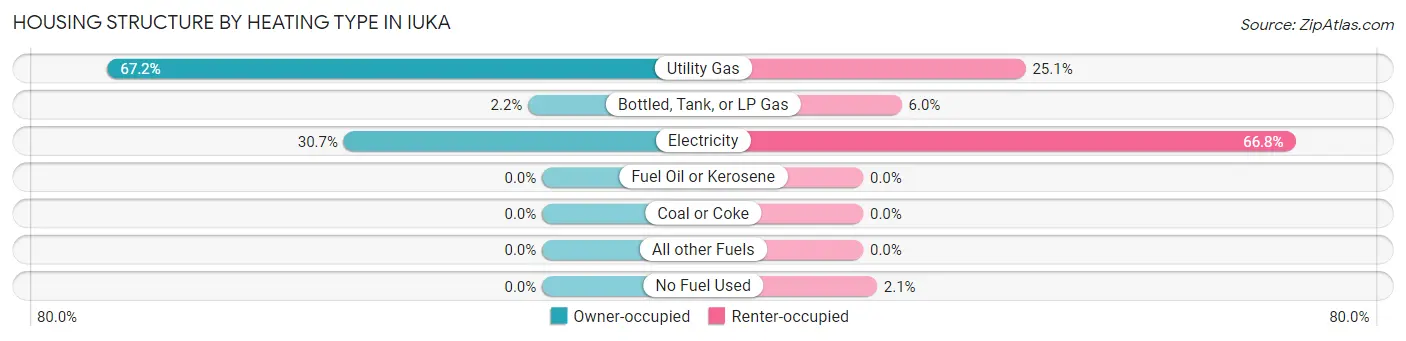
| Heating Type | Owner-occupied | Renter-occupied |
| Utility Gas | 500 (67.2%) | 118 (25.1%) |
| Bottled, Tank, or LP Gas | 16 (2.1%) | 28 (6.0%) |
| Electricity | 228 (30.6%) | 314 (66.8%) |
| Fuel Oil or Kerosene | 0 (0.0%) | 0 (0.0%) |
| Coal or Coke | 0 (0.0%) | 0 (0.0%) |
| All other Fuels | 0 (0.0%) | 0 (0.0%) |
| No Fuel Used | 0 (0.0%) | 10 (2.1%) |
| Total | 744 (100.0%) | 470 (100.0%) |
Household Vehicle Usage in Iuka
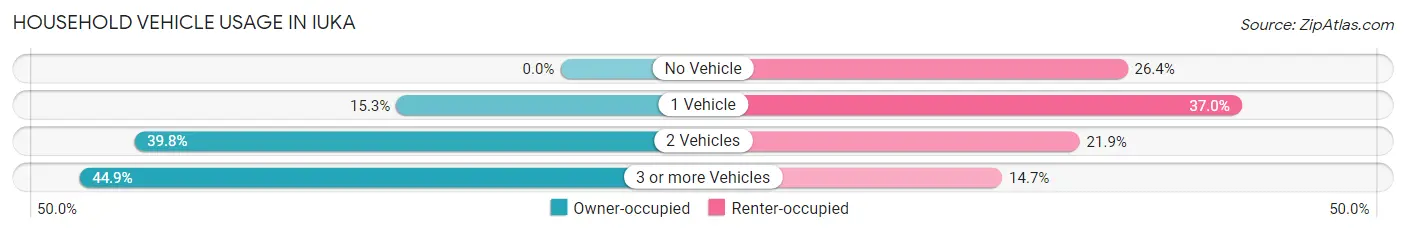
| Vehicles per Household | Owner-occupied | Renter-occupied |
| No Vehicle | 0 (0.0%) | 124 (26.4%) |
| 1 Vehicle | 114 (15.3%) | 174 (37.0%) |
| 2 Vehicles | 296 (39.8%) | 103 (21.9%) |
| 3 or more Vehicles | 334 (44.9%) | 69 (14.7%) |
| Total | 744 (100.0%) | 470 (100.0%) |
Real Estate & Mortgages in Iuka
Real Estate and Mortgage Overview in Iuka
| Characteristic | Without Mortgage | With Mortgage |
| Housing Units | 509 | 235 |
| Median Property Value | $111,000 | $141,200 |
| Median Household Income | $43,856 | $94 |
| Monthly Housing Costs | $359 | $0 |
| Real Estate Taxes | $431 | $18 |
Property Value by Mortgage Status in Iuka
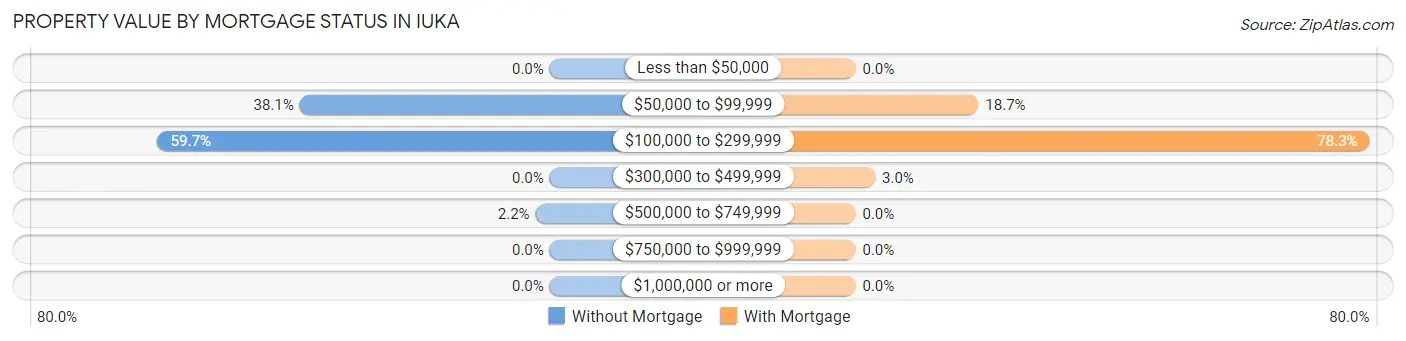
| Property Value | Without Mortgage | With Mortgage |
| Less than $50,000 | 0 (0.0%) | 0 (0.0%) |
| $50,000 to $99,999 | 194 (38.1%) | 44 (18.7%) |
| $100,000 to $299,999 | 304 (59.7%) | 184 (78.3%) |
| $300,000 to $499,999 | 0 (0.0%) | 7 (3.0%) |
| $500,000 to $749,999 | 11 (2.2%) | 0 (0.0%) |
| $750,000 to $999,999 | 0 (0.0%) | 0 (0.0%) |
| $1,000,000 or more | 0 (0.0%) | 0 (0.0%) |
| Total | 509 (100.0%) | 235 (100.0%) |
Household Income by Mortgage Status in Iuka
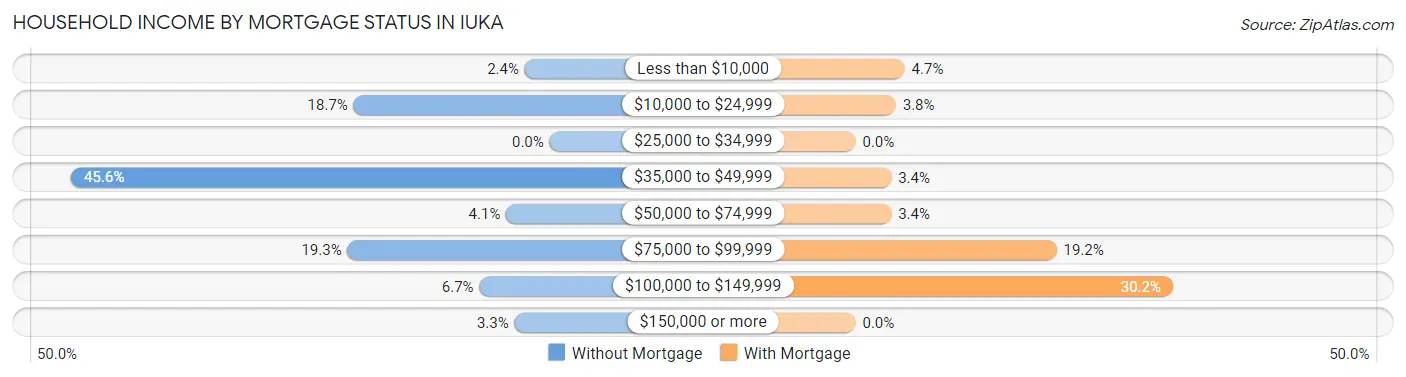
| Household Income | Without Mortgage | With Mortgage |
| Less than $10,000 | 12 (2.4%) | 11 (4.7%) |
| $10,000 to $24,999 | 95 (18.7%) | 9 (3.8%) |
| $25,000 to $34,999 | 0 (0.0%) | 0 (0.0%) |
| $35,000 to $49,999 | 232 (45.6%) | 8 (3.4%) |
| $50,000 to $74,999 | 21 (4.1%) | 8 (3.4%) |
| $75,000 to $99,999 | 98 (19.3%) | 45 (19.2%) |
| $100,000 to $149,999 | 34 (6.7%) | 71 (30.2%) |
| $150,000 or more | 17 (3.3%) | 0 (0.0%) |
| Total | 509 (100.0%) | 235 (100.0%) |
Property Value to Household Income Ratio in Iuka
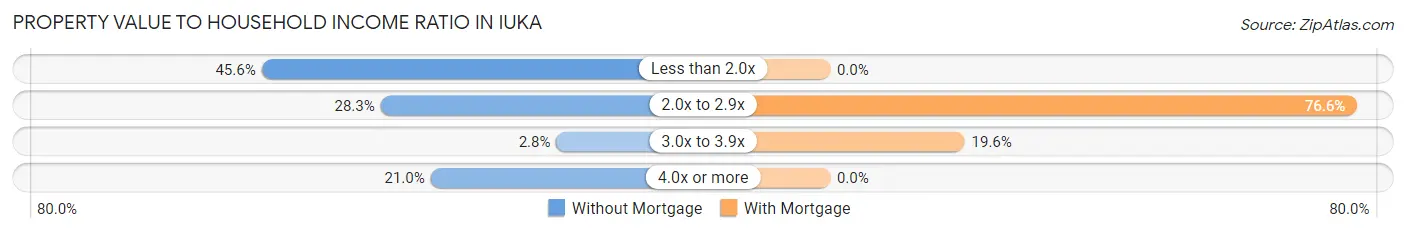
| Value-to-Income Ratio | Without Mortgage | With Mortgage |
| Less than 2.0x | 232 (45.6%) | 0 (0.0%) |
| 2.0x to 2.9x | 144 (28.3%) | 180 (76.6%) |
| 3.0x to 3.9x | 14 (2.8%) | 46 (19.6%) |
| 4.0x or more | 107 (21.0%) | 0 (0.0%) |
| Total | 509 (100.0%) | 235 (100.0%) |
Real Estate Taxes by Mortgage Status in Iuka
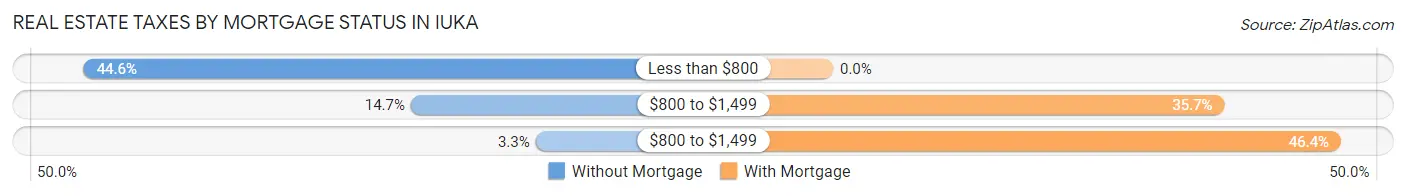
| Property Taxes | Without Mortgage | With Mortgage |
| Less than $800 | 227 (44.6%) | 0 (0.0%) |
| $800 to $1,499 | 75 (14.7%) | 84 (35.7%) |
| $800 to $1,499 | 17 (3.3%) | 109 (46.4%) |
| Total | 509 (100.0%) | 235 (100.0%) |
Health & Disability in Iuka
Health Insurance Coverage by Age in Iuka
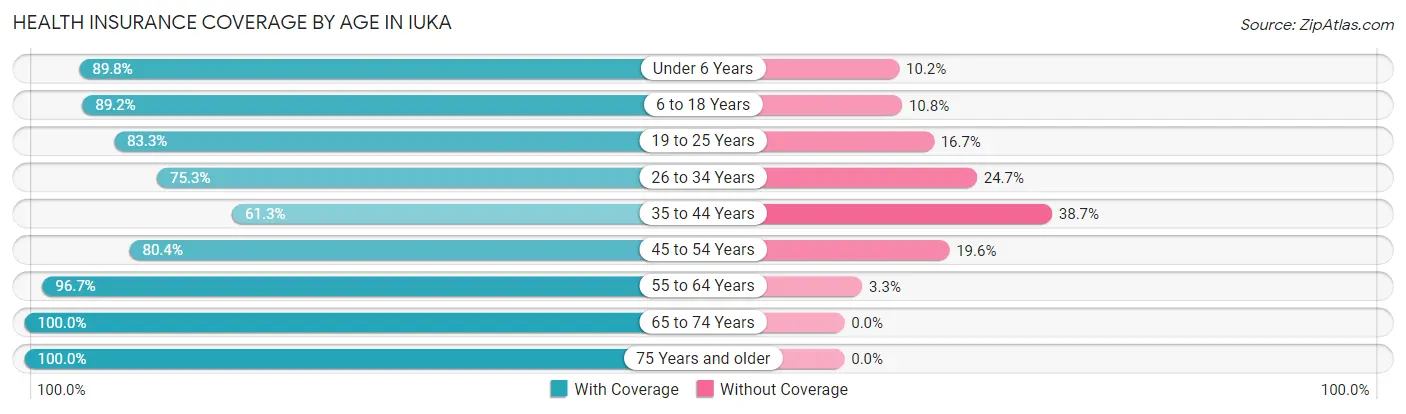
| Age Bracket | With Coverage | Without Coverage |
| Under 6 Years | 290 (89.8%) | 33 (10.2%) |
| 6 to 18 Years | 448 (89.2%) | 54 (10.8%) |
| 19 to 25 Years | 140 (83.3%) | 28 (16.7%) |
| 26 to 34 Years | 329 (75.3%) | 108 (24.7%) |
| 35 to 44 Years | 190 (61.3%) | 120 (38.7%) |
| 45 to 54 Years | 189 (80.4%) | 46 (19.6%) |
| 55 to 64 Years | 290 (96.7%) | 10 (3.3%) |
| 65 to 74 Years | 200 (100.0%) | 0 (0.0%) |
| 75 Years and older | 364 (100.0%) | 0 (0.0%) |
| Total | 2,440 (86.0%) | 399 (14.1%) |
Health Insurance Coverage by Citizenship Status in Iuka
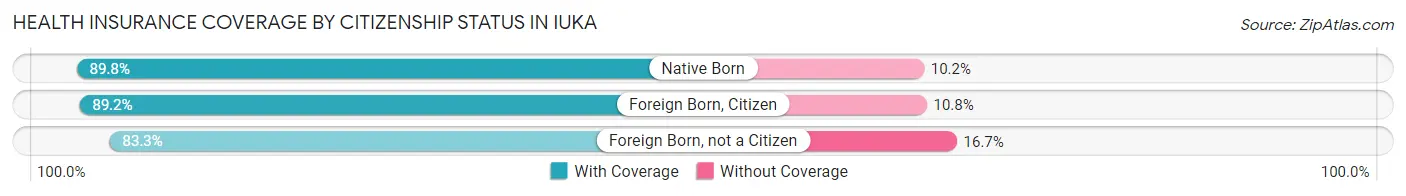
| Citizenship Status | With Coverage | Without Coverage |
| Native Born | 290 (89.8%) | 33 (10.2%) |
| Foreign Born, Citizen | 448 (89.2%) | 54 (10.8%) |
| Foreign Born, not a Citizen | 140 (83.3%) | 28 (16.7%) |
Health Insurance Coverage by Household Income in Iuka
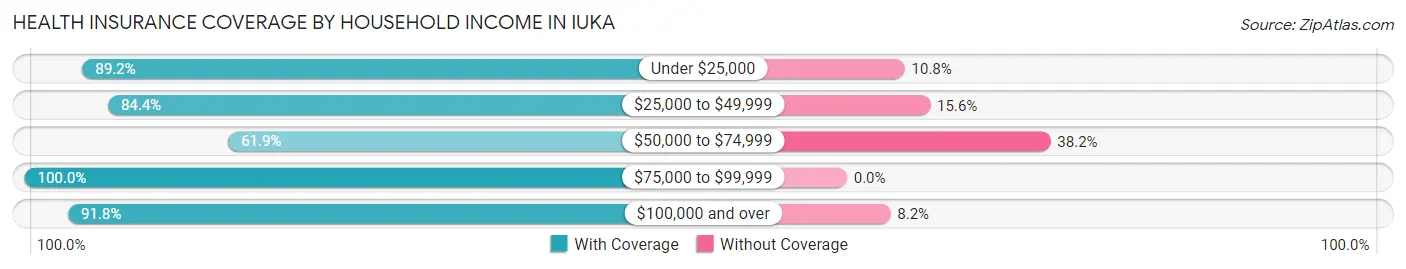
| Household Income | With Coverage | Without Coverage |
| Under $25,000 | 387 (89.2%) | 47 (10.8%) |
| $25,000 to $49,999 | 794 (84.4%) | 147 (15.6%) |
| $50,000 to $74,999 | 261 (61.9%) | 161 (38.2%) |
| $75,000 to $99,999 | 502 (100.0%) | 0 (0.0%) |
| $100,000 and over | 495 (91.8%) | 44 (8.2%) |
Public vs Private Health Insurance Coverage by Age in Iuka
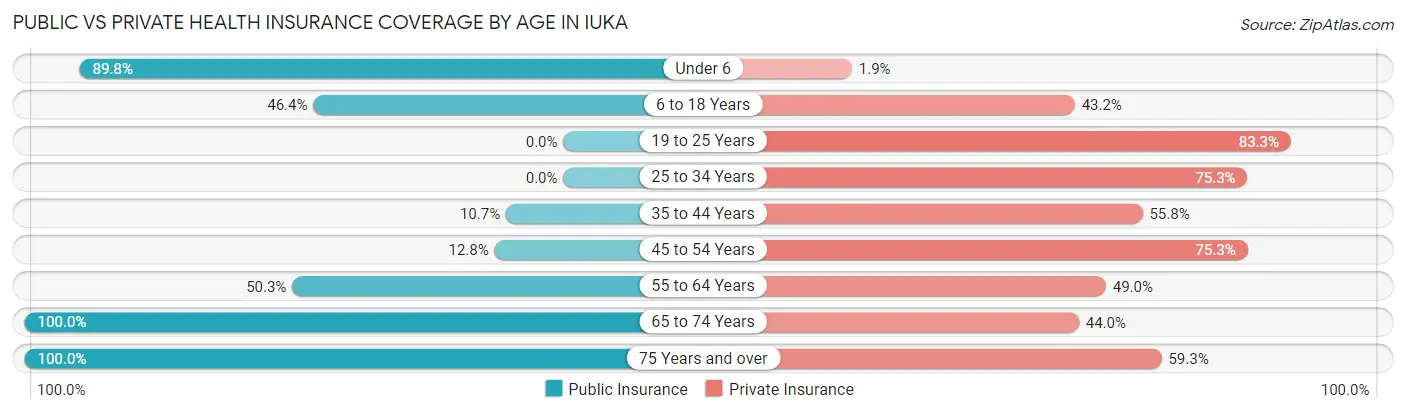
| Age Bracket | Public Insurance | Private Insurance |
| Under 6 | 290 (89.8%) | 6 (1.9%) |
| 6 to 18 Years | 233 (46.4%) | 217 (43.2%) |
| 19 to 25 Years | 0 (0.0%) | 140 (83.3%) |
| 25 to 34 Years | 0 (0.0%) | 329 (75.3%) |
| 35 to 44 Years | 33 (10.6%) | 173 (55.8%) |
| 45 to 54 Years | 30 (12.8%) | 177 (75.3%) |
| 55 to 64 Years | 151 (50.3%) | 147 (49.0%) |
| 65 to 74 Years | 200 (100.0%) | 88 (44.0%) |
| 75 Years and over | 364 (100.0%) | 216 (59.3%) |
| Total | 1,301 (45.8%) | 1,493 (52.6%) |
Disability Status by Sex by Age in Iuka
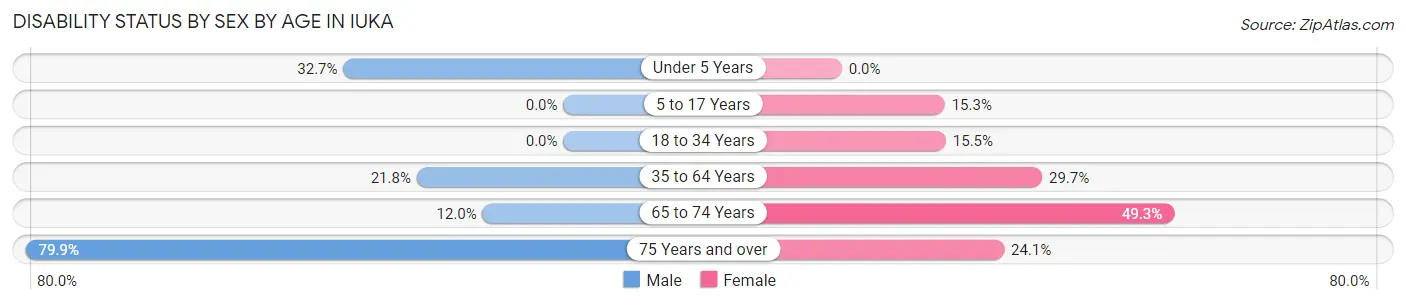
| Age Bracket | Male | Female |
| Under 5 Years | 33 (32.7%) | 0 (0.0%) |
| 5 to 17 Years | 0 (0.0%) | 26 (15.3%) |
| 18 to 34 Years | 0 (0.0%) | 51 (15.4%) |
| 35 to 64 Years | 91 (21.8%) | 127 (29.7%) |
| 65 to 74 Years | 6 (12.0%) | 74 (49.3%) |
| 75 Years and over | 115 (79.9%) | 53 (24.1%) |
Disability Class by Sex by Age in Iuka
Disability Class: Hearing Difficulty
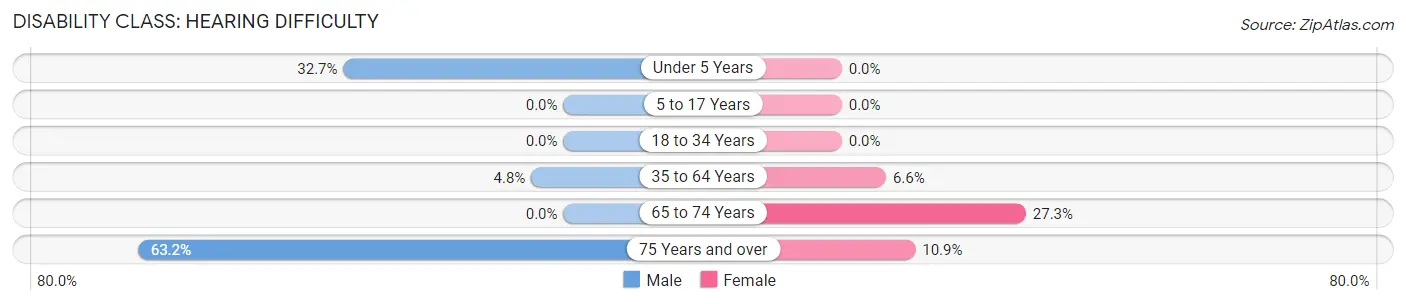
| Age Bracket | Male | Female |
| Under 5 Years | 33 (32.7%) | 0 (0.0%) |
| 5 to 17 Years | 0 (0.0%) | 0 (0.0%) |
| 18 to 34 Years | 0 (0.0%) | 0 (0.0%) |
| 35 to 64 Years | 20 (4.8%) | 28 (6.6%) |
| 65 to 74 Years | 0 (0.0%) | 41 (27.3%) |
| 75 Years and over | 91 (63.2%) | 24 (10.9%) |
Disability Class: Vision Difficulty
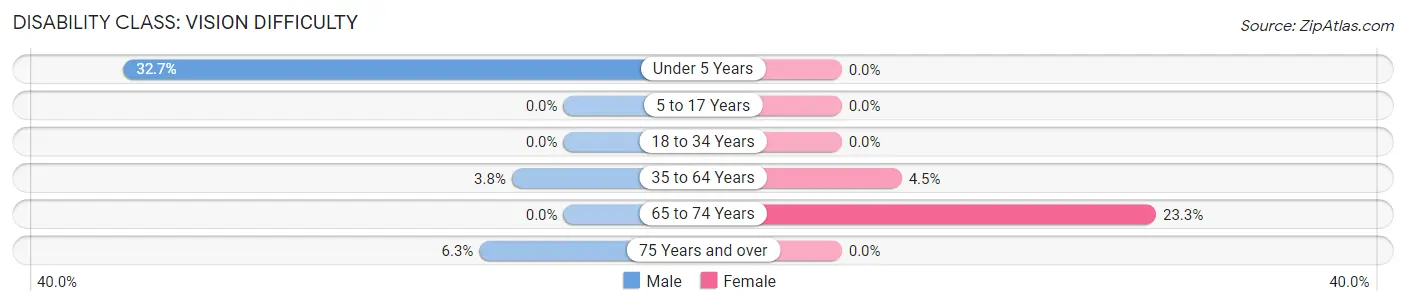
| Age Bracket | Male | Female |
| Under 5 Years | 33 (32.7%) | 0 (0.0%) |
| 5 to 17 Years | 0 (0.0%) | 0 (0.0%) |
| 18 to 34 Years | 0 (0.0%) | 0 (0.0%) |
| 35 to 64 Years | 16 (3.8%) | 19 (4.4%) |
| 65 to 74 Years | 0 (0.0%) | 35 (23.3%) |
| 75 Years and over | 9 (6.2%) | 0 (0.0%) |
Disability Class: Cognitive Difficulty
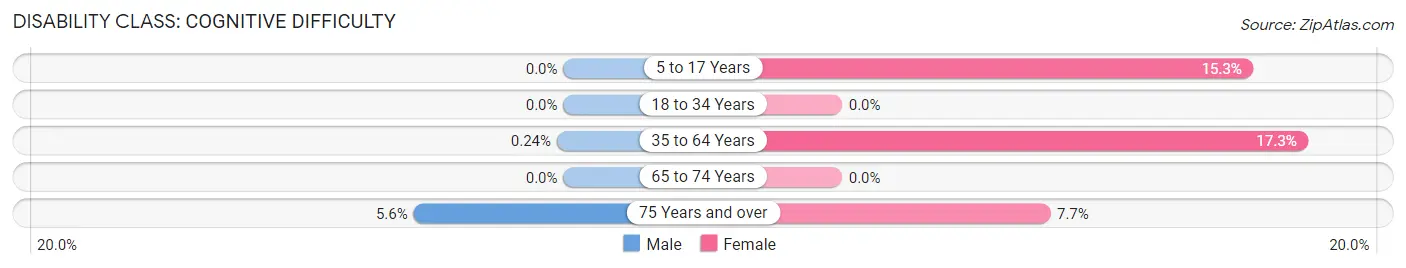
| Age Bracket | Male | Female |
| 5 to 17 Years | 0 (0.0%) | 26 (15.3%) |
| 18 to 34 Years | 0 (0.0%) | 0 (0.0%) |
| 35 to 64 Years | 1 (0.2%) | 74 (17.3%) |
| 65 to 74 Years | 0 (0.0%) | 0 (0.0%) |
| 75 Years and over | 8 (5.6%) | 17 (7.7%) |
Disability Class: Ambulatory Difficulty
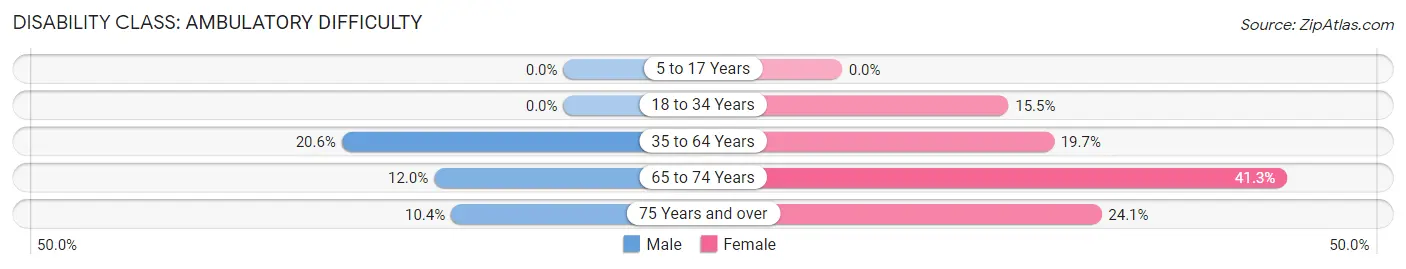
| Age Bracket | Male | Female |
| 5 to 17 Years | 0 (0.0%) | 0 (0.0%) |
| 18 to 34 Years | 0 (0.0%) | 51 (15.4%) |
| 35 to 64 Years | 86 (20.6%) | 84 (19.7%) |
| 65 to 74 Years | 6 (12.0%) | 62 (41.3%) |
| 75 Years and over | 15 (10.4%) | 53 (24.1%) |
Disability Class: Self-Care Difficulty
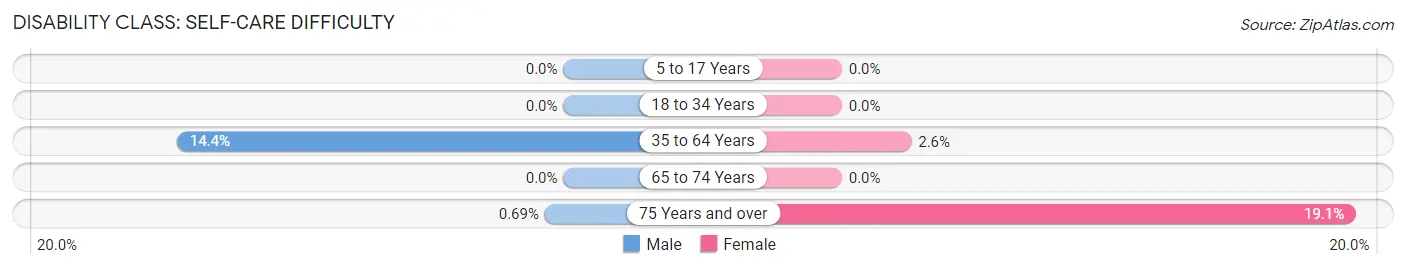
| Age Bracket | Male | Female |
| 5 to 17 Years | 0 (0.0%) | 0 (0.0%) |
| 18 to 34 Years | 0 (0.0%) | 0 (0.0%) |
| 35 to 64 Years | 60 (14.3%) | 11 (2.6%) |
| 65 to 74 Years | 0 (0.0%) | 0 (0.0%) |
| 75 Years and over | 1 (0.7%) | 42 (19.1%) |
Technology Access in Iuka
Computing Device Access in Iuka
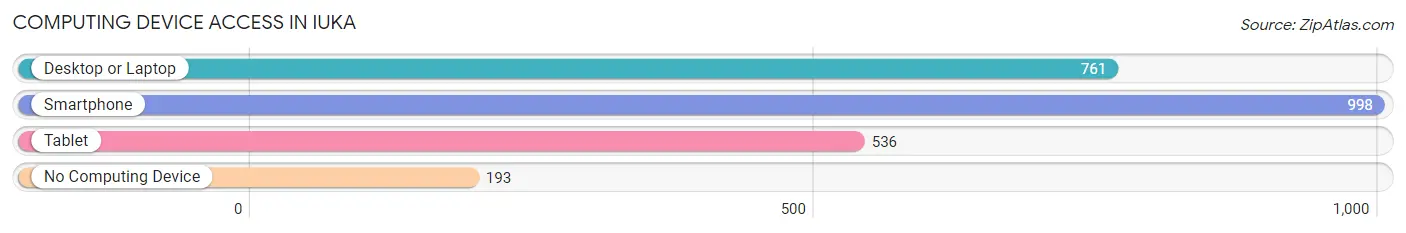
| Device Type | # Households | % Households |
| Desktop or Laptop | 761 | 62.7% |
| Smartphone | 998 | 82.2% |
| Tablet | 536 | 44.2% |
| No Computing Device | 193 | 15.9% |
| Total | 1,214 | 100.0% |
Internet Access in Iuka
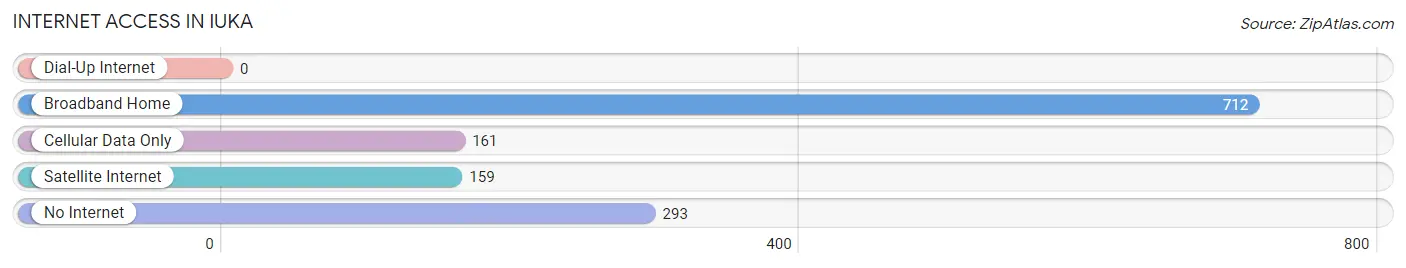
| Internet Type | # Households | % Households |
| Dial-Up Internet | 0 | 0.0% |
| Broadband Home | 712 | 58.7% |
| Cellular Data Only | 161 | 13.3% |
| Satellite Internet | 159 | 13.1% |
| No Internet | 293 | 24.1% |
| Total | 1,214 | 100.0% |
Iuka Summary
Iuka is a city located in Tishomingo County, Mississippi. It is situated in the foothills of the Appalachian Mountains, and is the county seat of Tishomingo County. The city is located along the Tennessee River, and is home to a population of approximately 3,000 people.
History
Iuka was founded in 1857 by a group of settlers from Tennessee. The city was named after Chief Iuka of the Chickasaw Nation, who had been a leader in the area prior to the arrival of the settlers. The city was incorporated in 1858, and was the first city in Tishomingo County.
During the Civil War, Iuka was the site of two major battles. The first battle, known as the Battle of Iuka, was fought on September 19, 1862. The Union forces, led by General Ulysses S. Grant, were victorious in the battle. The second battle, known as the Second Battle of Iuka, was fought on October 3, 1862. The Confederate forces, led by General Sterling Price, were victorious in this battle.
Geography
Iuka is located in the foothills of the Appalachian Mountains, and is situated along the Tennessee River. The city has a total area of 4.2 square miles, all of which is land. The city is located at an elevation of 590 feet above sea level.
The climate in Iuka is classified as humid subtropical, with hot, humid summers and mild winters. The average annual temperature is 64°F, and the average annual precipitation is 48 inches.
Economy
The economy of Iuka is largely based on agriculture and manufacturing. The city is home to several large manufacturing plants, including a paper mill, a furniture factory, and a plastics plant. Agriculture is also an important part of the local economy, with corn, soybeans, and cotton being the main crops grown in the area.
The city is also home to several retail stores, restaurants, and other businesses. The city is served by the Iuka Airport, which offers flights to several major cities in the region.
Demographics
As of the 2010 census, the population of Iuka was 3,058. The racial makeup of the city was 79.3% White, 18.2% African American, 0.3% Native American, 0.3% Asian, 0.1% Pacific Islander, 0.7% from other races, and 1.4% from two or more races. Hispanic or Latino of any race were 1.7% of the population.
The median household income in Iuka was $30,938, and the median family income was $37,813. The per capita income in the city was $17,845. About 17.3% of the population was below the poverty line.
Common Questions
What is Per Capita Income in Iuka?
Per Capita income in Iuka is $24,016.
What is the Median Family Income in Iuka?
Median Family Income in Iuka is $52,365.
What is the Median Household income in Iuka?
Median Household Income in Iuka is $43,887.
What is Income or Wage Gap in Iuka?
Income or Wage Gap in Iuka is 34.1%.
Women in Iuka earn 65.9 cents for every dollar earned by a man.
What is Inequality or Gini Index in Iuka?
Inequality or Gini Index in Iuka is 0.46.
What is the Total Population of Iuka?
Total Population of Iuka is 3,117.
What is the Total Male Population of Iuka?
Total Male Population of Iuka is 1,476.
What is the Total Female Population of Iuka?
Total Female Population of Iuka is 1,641.
What is the Ratio of Males per 100 Females in Iuka?
There are 89.95 Males per 100 Females in Iuka.
What is the Ratio of Females per 100 Males in Iuka?
There are 111.18 Females per 100 Males in Iuka.
What is the Median Population Age in Iuka?
Median Population Age in Iuka is 37.2 Years.
What is the Average Family Size in Iuka
Average Family Size in Iuka is 2.9 People.
What is the Average Household Size in Iuka
Average Household Size in Iuka is 2.3 People.
How Large is the Labor Force in Iuka?
There are 1,107 People in the Labor Forcein in Iuka.
What is the Percentage of People in the Labor Force in Iuka?
47.5% of People are in the Labor Force in Iuka.
What is the Unemployment Rate in Iuka?
Unemployment Rate in Iuka is 5.9%.