Forest, MS Map & Demographics
Forest Map
Forest Overview
$21,007
PER CAPITA INCOME
$52,486
AVG FAMILY INCOME
$50,093
AVG HOUSEHOLD INCOME
16.5%
WAGE / INCOME GAP [ % ]
83.5¢/ $1
WAGE / INCOME GAP [ $ ]
0.43
INEQUALITY / GINI INDEX
5,416
TOTAL POPULATION
2,901
MALE POPULATION
2,515
FEMALE POPULATION
115.35
MALES / 100 FEMALES
86.69
FEMALES / 100 MALES
36.4
MEDIAN AGE
3.5
AVG FAMILY SIZE
2.7
AVG HOUSEHOLD SIZE
2,140
LABOR FORCE [ PEOPLE ]
50.1%
PERCENT IN LABOR FORCE
7.1%
UNEMPLOYMENT RATE
Forest Zip Codes
Income in Forest
Income Overview in Forest
Per Capita Income in Forest is $21,007, while median incomes of families and households are $52,486 and $50,093 respectively.
| Characteristic | Number | Measure |
| Per Capita Income | 5,416 | $21,007 |
| Median Family Income | 1,211 | $52,486 |
| Mean Family Income | 1,211 | $65,012 |
| Median Household Income | 1,989 | $50,093 |
| Mean Household Income | 1,989 | $55,426 |
| Income Deficit | 1,211 | $0 |
| Wage / Income Gap (%) | 5,416 | 16.53% |
| Wage / Income Gap ($) | 5,416 | 83.47¢ per $1 |
| Gini / Inequality Index | 5,416 | 0.43 |
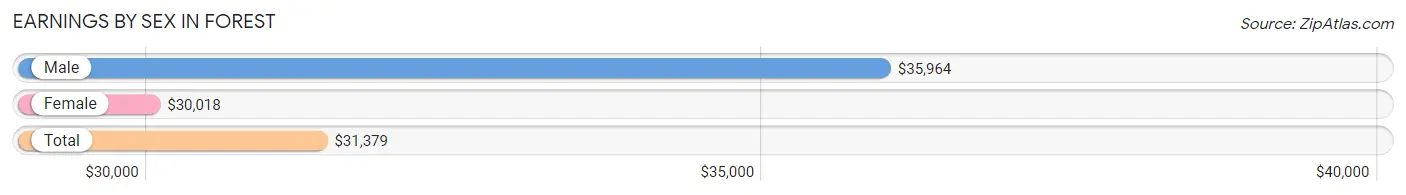
Earnings by Sex in Forest
Average Earnings in Forest are $31,379, $35,964 for men and $30,018 for women, a difference of 16.5%.
| Sex | Number | Average Earnings |
| Male | 1,288 (55.5%) | $35,964 |
| Female | 1,031 (44.5%) | $30,018 |
| Total | 2,319 (100.0%) | $31,379 |
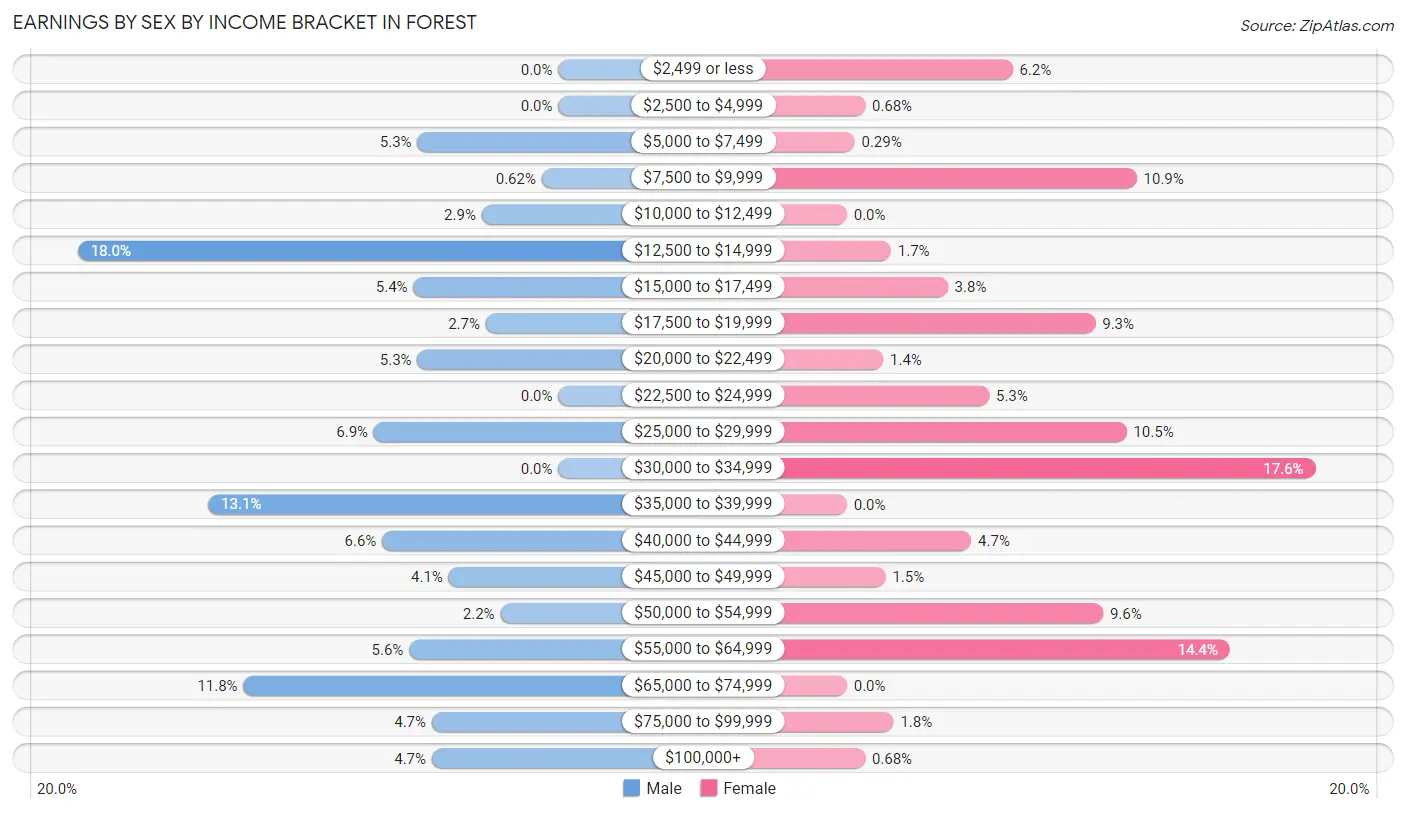
Earnings by Sex by Income Bracket in Forest
The most common earnings brackets in Forest are $12,500 to $14,999 for men (232 | 18.0%) and $30,000 to $34,999 for women (181 | 17.6%).
| Income | Male | Female |
| $2,499 or less | 0 (0.0%) | 64 (6.2%) |
| $2,500 to $4,999 | 0 (0.0%) | 7 (0.7%) |
| $5,000 to $7,499 | 68 (5.3%) | 3 (0.3%) |
| $7,500 to $9,999 | 8 (0.6%) | 112 (10.9%) |
| $10,000 to $12,499 | 37 (2.9%) | 0 (0.0%) |
| $12,500 to $14,999 | 232 (18.0%) | 17 (1.7%) |
| $15,000 to $17,499 | 70 (5.4%) | 39 (3.8%) |
| $17,500 to $19,999 | 35 (2.7%) | 96 (9.3%) |
| $20,000 to $22,499 | 68 (5.3%) | 14 (1.4%) |
| $22,500 to $24,999 | 0 (0.0%) | 55 (5.3%) |
| $25,000 to $29,999 | 89 (6.9%) | 108 (10.5%) |
| $30,000 to $34,999 | 0 (0.0%) | 181 (17.6%) |
| $35,000 to $39,999 | 169 (13.1%) | 0 (0.0%) |
| $40,000 to $44,999 | 85 (6.6%) | 48 (4.7%) |
| $45,000 to $49,999 | 53 (4.1%) | 15 (1.5%) |
| $50,000 to $54,999 | 28 (2.2%) | 99 (9.6%) |
| $55,000 to $64,999 | 72 (5.6%) | 148 (14.3%) |
| $65,000 to $74,999 | 152 (11.8%) | 0 (0.0%) |
| $75,000 to $99,999 | 61 (4.7%) | 18 (1.8%) |
| $100,000+ | 61 (4.7%) | 7 (0.7%) |
| Total | 1,288 (100.0%) | 1,031 (100.0%) |
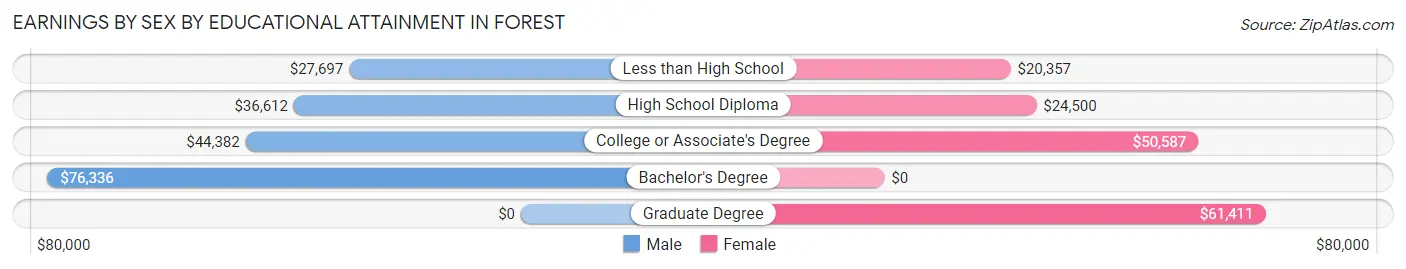
Earnings by Sex by Educational Attainment in Forest
Average earnings in Forest are $39,332 for men and $31,654 for women, a difference of 19.5%. Men with an educational attainment of bachelor's degree enjoy the highest average annual earnings of $76,336, while those with less than high school education earn the least with $27,697. Women with an educational attainment of graduate degree earn the most with the average annual earnings of $61,411, while those with less than high school education have the smallest earnings of $20,357.
| Educational Attainment | Male Income | Female Income |
| Less than High School | $27,697 | $20,357 |
| High School Diploma | $36,612 | $24,500 |
| College or Associate's Degree | $44,382 | $50,587 |
| Bachelor's Degree | $76,336 | $0 |
| Graduate Degree | - | - |
| Total | $39,332 | $31,654 |
Family Income in Forest
Family Income Brackets in Forest
According to the Forest family income data, there are 272 families falling into the $50,000 to $74,999 income range, which is the most common income bracket and makes up 22.5% of all families. Conversely, the $200,000+ income bracket is the least frequent group with only 7 families (0.6%) belonging to this category.
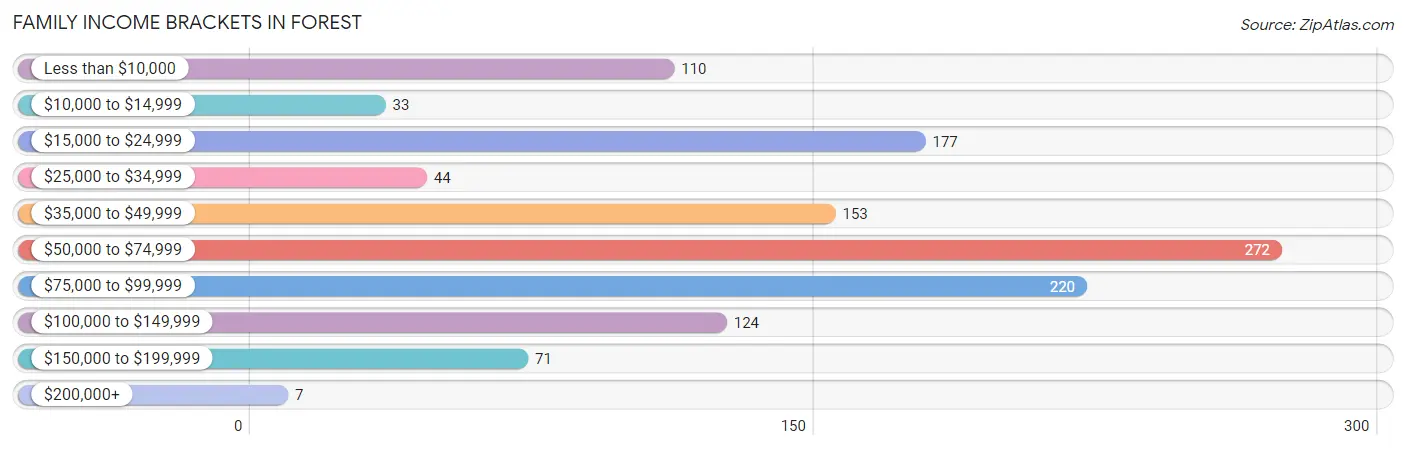
| Income Bracket | # Families | % Families |
| Less than $10,000 | 110 | 9.1% |
| $10,000 to $14,999 | 33 | 2.7% |
| $15,000 to $24,999 | 177 | 14.6% |
| $25,000 to $34,999 | 44 | 3.6% |
| $35,000 to $49,999 | 153 | 12.6% |
| $50,000 to $74,999 | 272 | 22.5% |
| $75,000 to $99,999 | 220 | 18.2% |
| $100,000 to $149,999 | 124 | 10.2% |
| $150,000 to $199,999 | 71 | 5.9% |
| $200,000+ | 7 | 0.6% |
Family Income by Famaliy Size in Forest
4-person families (248 | 20.5%) account for the highest median family income in Forest with $56,384 per family, while 2-person families (617 | 50.9%) have the highest median income of $24,515 per family member.
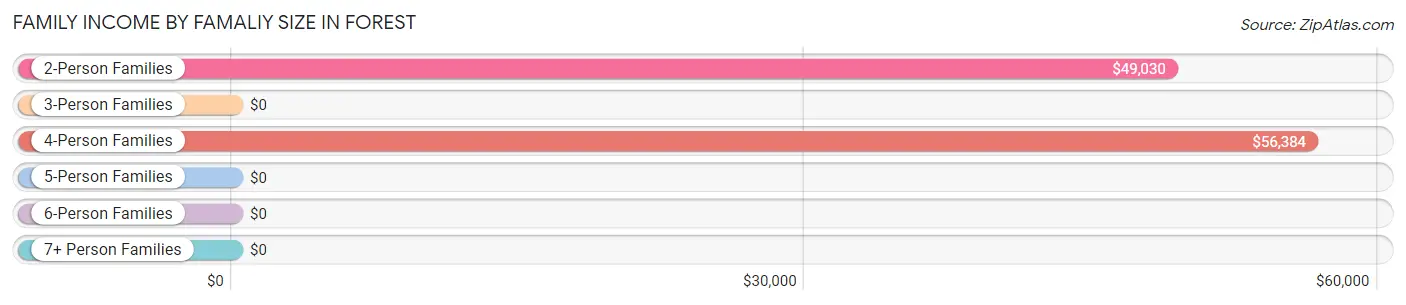
| Income Bracket | # Families | Median Income |
| 2-Person Families | 617 (50.9%) | $49,030 |
| 3-Person Families | 225 (18.6%) | $0 |
| 4-Person Families | 248 (20.5%) | $56,384 |
| 5-Person Families | 109 (9.0%) | $0 |
| 6-Person Families | 12 (1.0%) | $0 |
| 7+ Person Families | 0 (0.0%) | $0 |
| Total | 1,211 (100.0%) | $52,486 |
Family Income by Number of Earners in Forest
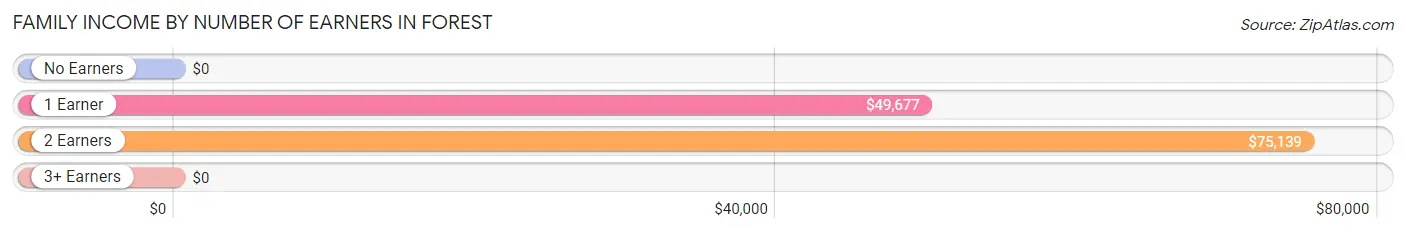
| Number of Earners | # Families | Median Income |
| No Earners | 266 (22.0%) | $0 |
| 1 Earner | 417 (34.4%) | $49,677 |
| 2 Earners | 447 (36.9%) | $75,139 |
| 3+ Earners | 81 (6.7%) | $0 |
| Total | 1,211 (100.0%) | $52,486 |
Household Income in Forest
Household Income Brackets in Forest
With 491 households falling in the category, the $50,000 to $74,999 income range is the most frequent in Forest, accounting for 24.7% of all households. In contrast, only 8 households (0.4%) fall into the $200,000+ income bracket, making it the least populous group.
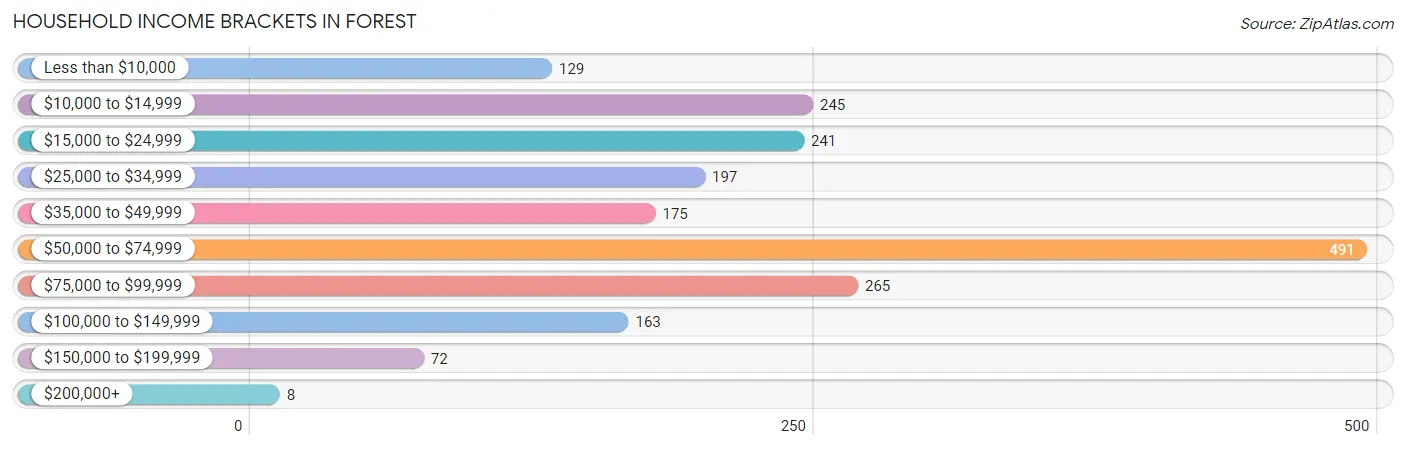
| Income Bracket | # Households | % Households |
| Less than $10,000 | 129 | 6.5% |
| $10,000 to $14,999 | 245 | 12.3% |
| $15,000 to $24,999 | 241 | 12.1% |
| $25,000 to $34,999 | 197 | 9.9% |
| $35,000 to $49,999 | 175 | 8.8% |
| $50,000 to $74,999 | 491 | 24.7% |
| $75,000 to $99,999 | 265 | 13.3% |
| $100,000 to $149,999 | 163 | 8.2% |
| $150,000 to $199,999 | 72 | 3.6% |
| $200,000+ | 8 | 0.4% |
Household Income by Householder Age in Forest
The median household income in Forest is $50,093, with the highest median household income of $62,639 found in the 25 to 44 years age bracket for the primary householder. A total of 622 households (31.3%) fall into this category. Meanwhile, the 15 to 24 years age bracket for the primary householder has the lowest median household income of $0, with 88 households (4.4%) in this group.
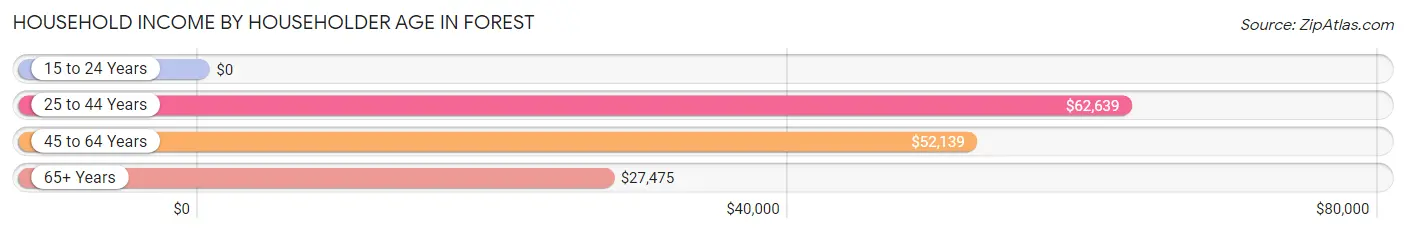
| Income Bracket | # Households | Median Income |
| 15 to 24 Years | 88 (4.4%) | $0 |
| 25 to 44 Years | 622 (31.3%) | $62,639 |
| 45 to 64 Years | 736 (37.0%) | $52,139 |
| 65+ Years | 543 (27.3%) | $27,475 |
| Total | 1,989 (100.0%) | $50,093 |
Poverty in Forest
Income Below Poverty by Sex and Age in Forest
With 11.7% poverty level for males and 28.5% for females among the residents of Forest, 6 to 11 year old males and 18 to 24 year old females are the most vulnerable to poverty, with 53 males (49.1%) and 122 females (57.8%) in their respective age groups living below the poverty level.
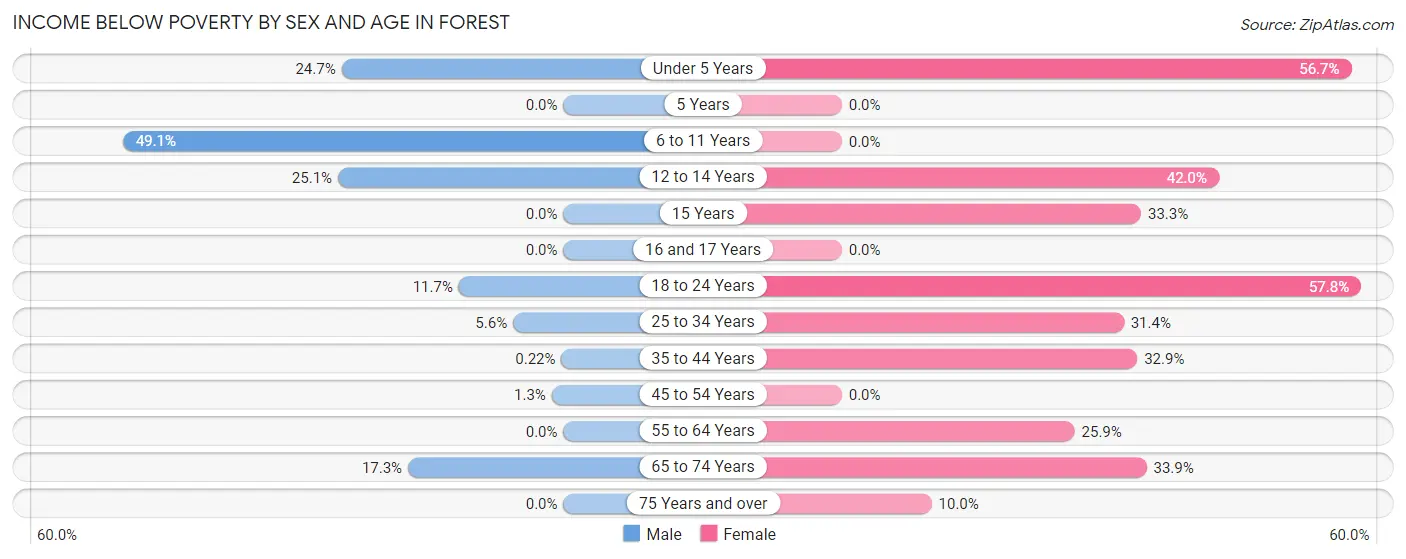
| Age Bracket | Male | Female |
| Under 5 Years | 107 (24.7%) | 80 (56.7%) |
| 5 Years | 0 (0.0%) | 0 (0.0%) |
| 6 to 11 Years | 53 (49.1%) | 0 (0.0%) |
| 12 to 14 Years | 58 (25.1%) | 34 (42.0%) |
| 15 Years | 0 (0.0%) | 3 (33.3%) |
| 16 and 17 Years | 0 (0.0%) | 0 (0.0%) |
| 18 to 24 Years | 41 (11.7%) | 122 (57.8%) |
| 25 to 34 Years | 16 (5.6%) | 141 (31.4%) |
| 35 to 44 Years | 1 (0.2%) | 101 (32.9%) |
| 45 to 54 Years | 2 (1.3%) | 0 (0.0%) |
| 55 to 64 Years | 0 (0.0%) | 126 (25.9%) |
| 65 to 74 Years | 49 (17.3%) | 56 (33.9%) |
| 75 Years and over | 0 (0.0%) | 26 (10.0%) |
| Total | 327 (11.7%) | 689 (28.5%) |
Income Above Poverty by Sex and Age in Forest
According to the poverty statistics in Forest, males aged 5 years and females aged 6 to 11 years are the age groups that are most secure financially, with 100.0% of males and 100.0% of females in these age groups living above the poverty line.
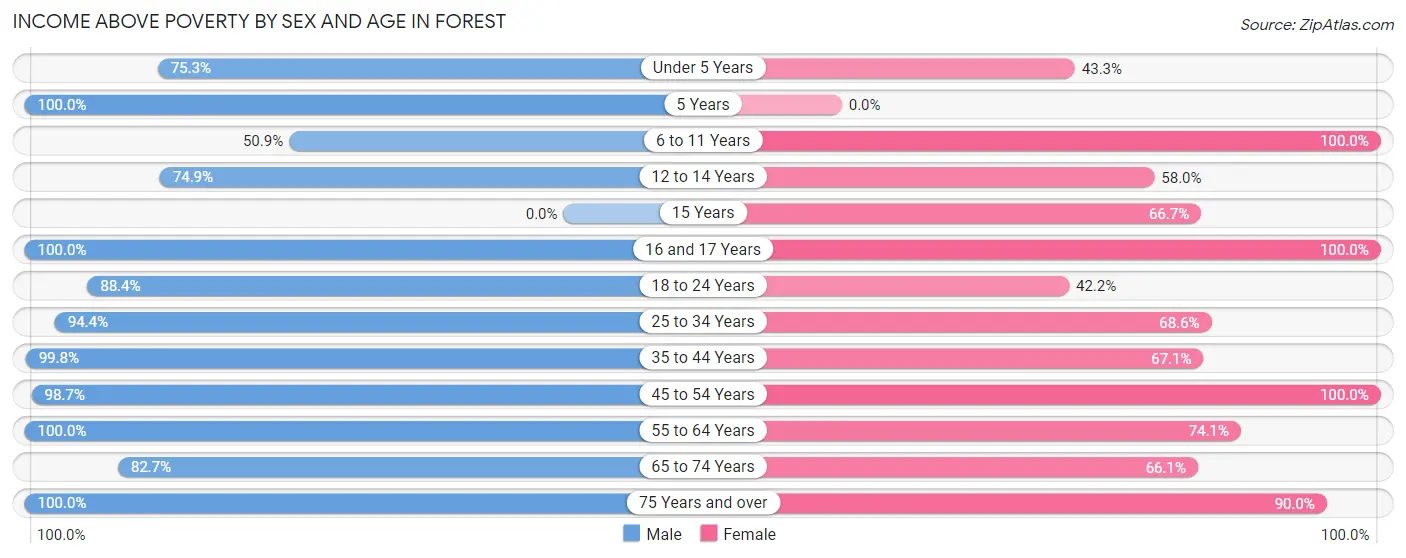
| Age Bracket | Male | Female |
| Under 5 Years | 326 (75.3%) | 61 (43.3%) |
| 5 Years | 8 (100.0%) | 0 (0.0%) |
| 6 to 11 Years | 55 (50.9%) | 63 (100.0%) |
| 12 to 14 Years | 173 (74.9%) | 47 (58.0%) |
| 15 Years | 0 (0.0%) | 6 (66.7%) |
| 16 and 17 Years | 95 (100.0%) | 59 (100.0%) |
| 18 to 24 Years | 311 (88.3%) | 89 (42.2%) |
| 25 to 34 Years | 269 (94.4%) | 308 (68.6%) |
| 35 to 44 Years | 459 (99.8%) | 206 (67.1%) |
| 45 to 54 Years | 152 (98.7%) | 186 (100.0%) |
| 55 to 64 Years | 248 (100.0%) | 360 (74.1%) |
| 65 to 74 Years | 234 (82.7%) | 109 (66.1%) |
| 75 Years and over | 150 (100.0%) | 234 (90.0%) |
| Total | 2,480 (88.3%) | 1,728 (71.5%) |
Income Below Poverty Among Married-Couple Families in Forest
The poverty statistics for married-couple families in Forest show that 2.0% or 16 of the total 788 families live below the poverty line. Families with 1 or 2 children have the highest poverty rate of 5.6%, comprising of 16 families. On the other hand, families with no children have the lowest poverty rate of 0.0%, which includes 0 families.
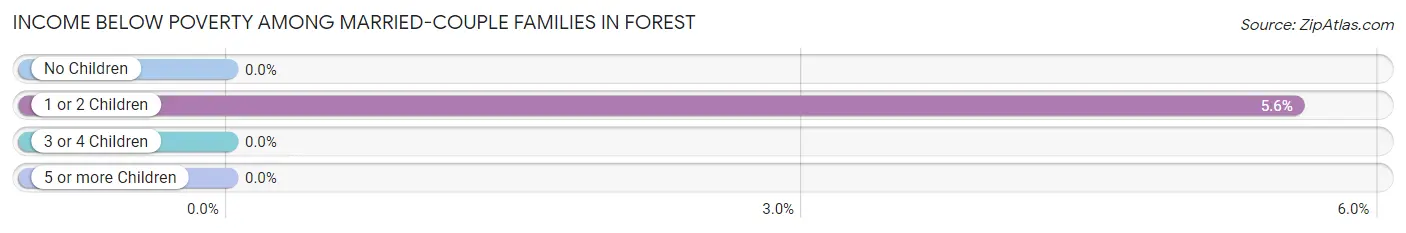
| Children | Above Poverty | Below Poverty |
| No Children | 489 (100.0%) | 0 (0.0%) |
| 1 or 2 Children | 271 (94.4%) | 16 (5.6%) |
| 3 or 4 Children | 12 (100.0%) | 0 (0.0%) |
| 5 or more Children | 0 (0.0%) | 0 (0.0%) |
| Total | 772 (98.0%) | 16 (2.0%) |
Income Below Poverty Among Single-Parent Households in Forest
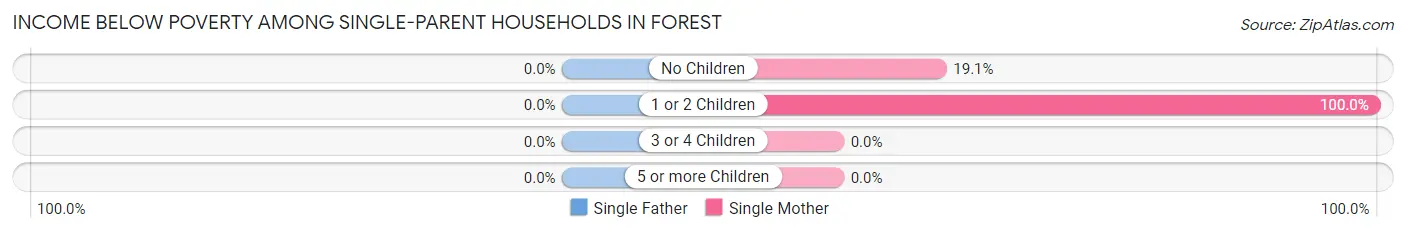
| Children | Single Father | Single Mother |
| No Children | 0 (0.0%) | 22 (19.1%) |
| 1 or 2 Children | 0 (0.0%) | 171 (100.0%) |
| 3 or 4 Children | 0 (0.0%) | 0 (0.0%) |
| 5 or more Children | 0 (0.0%) | 0 (0.0%) |
| Total | 0 (0.0%) | 193 (67.5%) |
Income Below Poverty Among Married-Couple vs Single-Parent Households in Forest
The poverty data for Forest shows that 16 of the married-couple family households (2.0%) and 193 of the single-parent households (45.6%) are living below the poverty level. Within the married-couple family households, those with 1 or 2 children have the highest poverty rate, with 16 households (5.6%) falling below the poverty line. Among the single-parent households, those with 1 or 2 children have the highest poverty rate, with 171 household (65.3%) living below poverty.
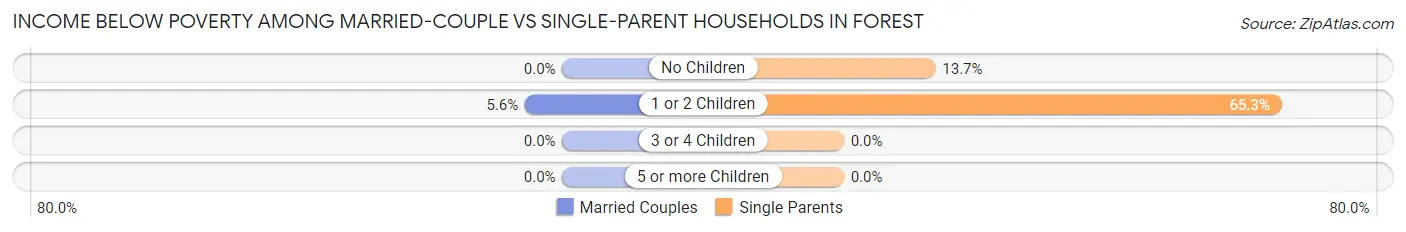
| Children | Married-Couple Families | Single-Parent Households |
| No Children | 0 (0.0%) | 22 (13.7%) |
| 1 or 2 Children | 16 (5.6%) | 171 (65.3%) |
| 3 or 4 Children | 0 (0.0%) | 0 (0.0%) |
| 5 or more Children | 0 (0.0%) | 0 (0.0%) |
| Total | 16 (2.0%) | 193 (45.6%) |
Race in Forest
The most populous races in Forest are White / Caucasian (2,481 | 45.8%), Black / African American (2,310 | 42.6%), and Hispanic or Latino (1,623 | 30.0%).
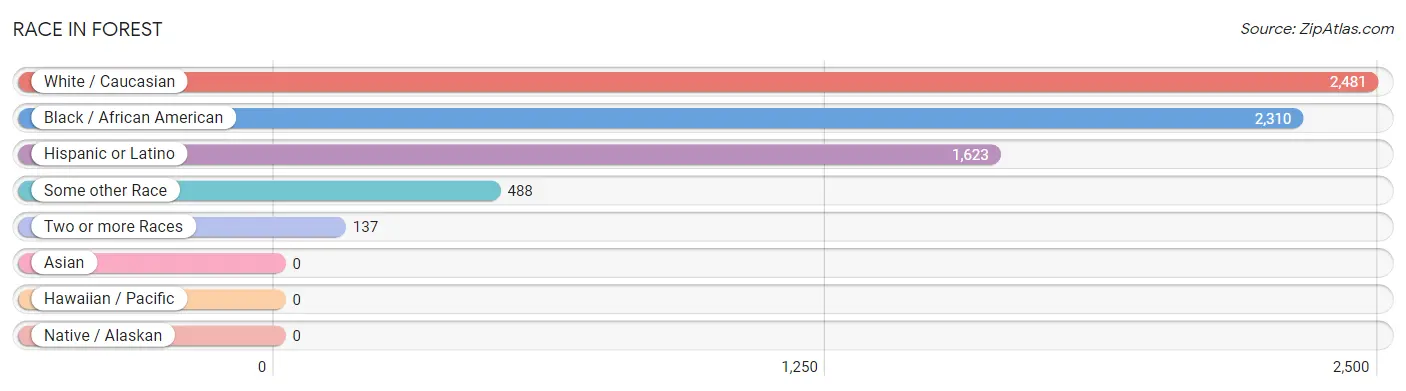
| Race | # Population | % Population |
| Asian | 0 | 0.0% |
| Black / African American | 2,310 | 42.6% |
| Hawaiian / Pacific | 0 | 0.0% |
| Hispanic or Latino | 1,623 | 30.0% |
| Native / Alaskan | 0 | 0.0% |
| White / Caucasian | 2,481 | 45.8% |
| Two or more Races | 137 | 2.5% |
| Some other Race | 488 | 9.0% |
| Total | 5,416 | 100.0% |
Ancestry in Forest
The most populous ancestries reported in Forest are American (1,084 | 20.0%), Central American (680 | 12.6%), Guatemalan (539 | 10.0%), Spanish (342 | 6.3%), and Mexican (328 | 6.1%), together accounting for 54.9% of all Forest residents.
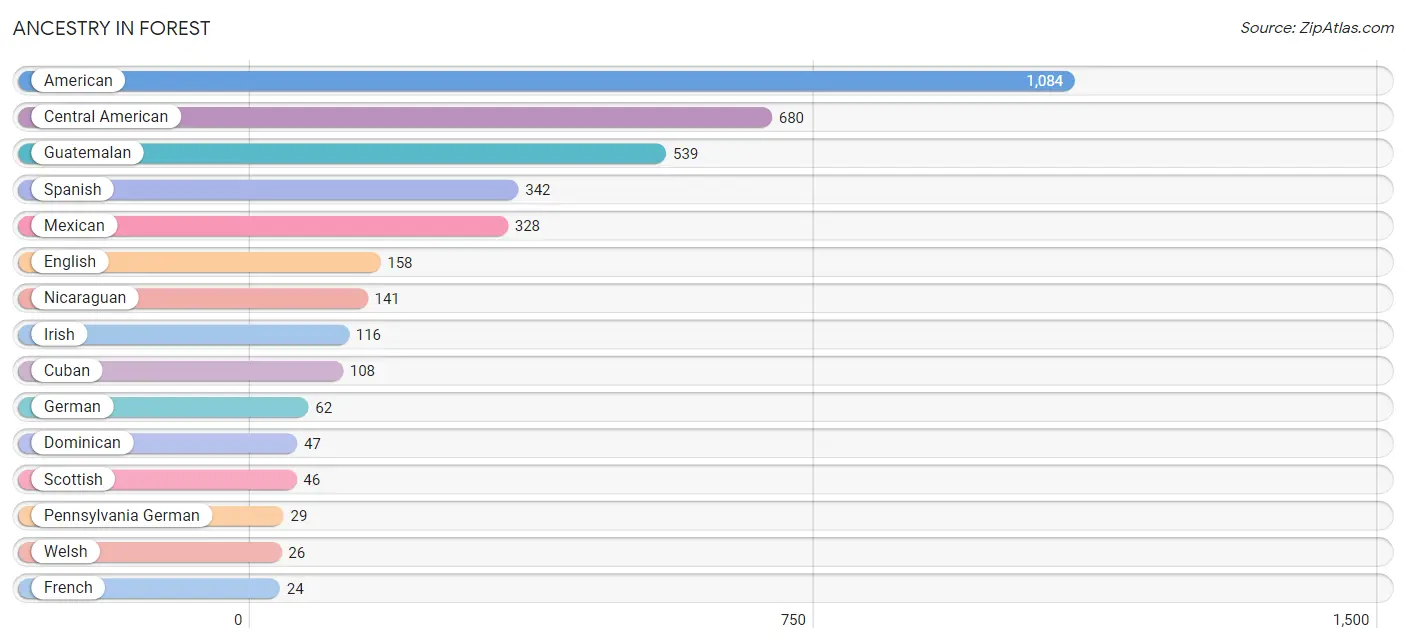
| Ancestry | # Population | % Population |
| American | 1,084 | 20.0% |
| Bolivian | 14 | 0.3% |
| Central American | 680 | 12.6% |
| Cuban | 108 | 2.0% |
| Dominican | 47 | 0.9% |
| Dutch | 12 | 0.2% |
| English | 158 | 2.9% |
| European | 16 | 0.3% |
| French | 24 | 0.4% |
| German | 62 | 1.1% |
| Guatemalan | 539 | 10.0% |
| Irish | 116 | 2.1% |
| Mexican | 328 | 6.1% |
| Nicaraguan | 141 | 2.6% |
| Pennsylvania German | 29 | 0.5% |
| Scotch-Irish | 16 | 0.3% |
| Scottish | 46 | 0.9% |
| South American | 14 | 0.3% |
| Spanish | 342 | 6.3% |
| Welsh | 26 | 0.5% | View All 20 Rows |
Immigrants in Forest
The most numerous immigrant groups reported in Forest came from Latin America (1,060 | 19.6%), Central America (948 | 17.5%), Guatemala (690 | 12.7%), Mexico (202 | 3.7%), and Caribbean (98 | 1.8%), together accounting for 55.4% of all Forest residents.
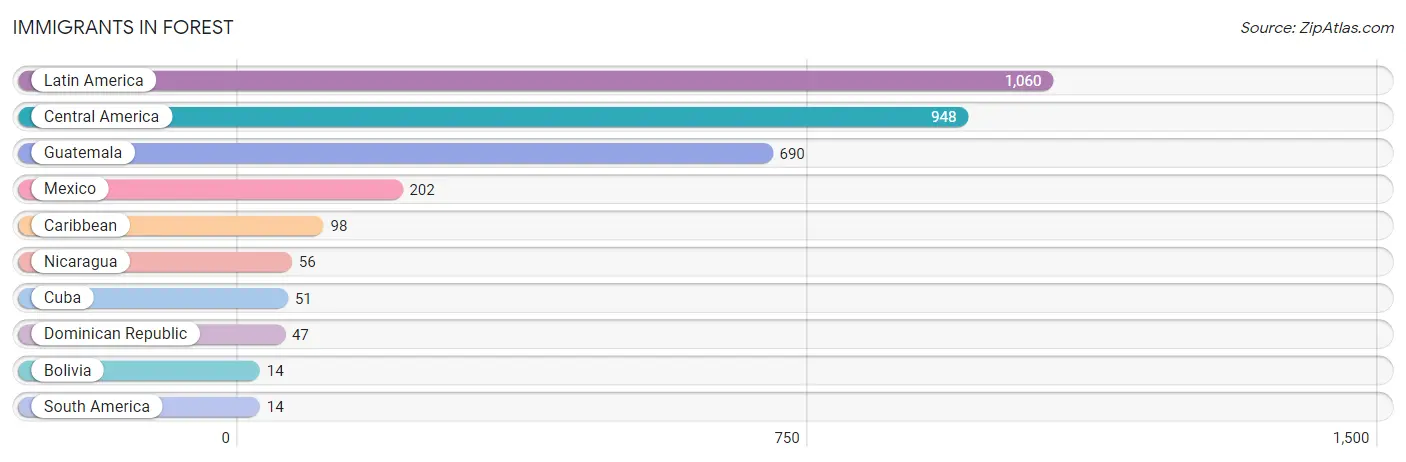
| Immigration Origin | # Population | % Population |
| Bolivia | 14 | 0.3% |
| Caribbean | 98 | 1.8% |
| Central America | 948 | 17.5% |
| Cuba | 51 | 0.9% |
| Dominican Republic | 47 | 0.9% |
| Guatemala | 690 | 12.7% |
| Latin America | 1,060 | 19.6% |
| Mexico | 202 | 3.7% |
| Nicaragua | 56 | 1.0% |
| South America | 14 | 0.3% | View All 10 Rows |
Sex and Age in Forest
Sex and Age in Forest
The most populous age groups in Forest are Under 5 Years (433 | 14.9%) for men and 55 to 59 Years (294 | 11.7%) for women.
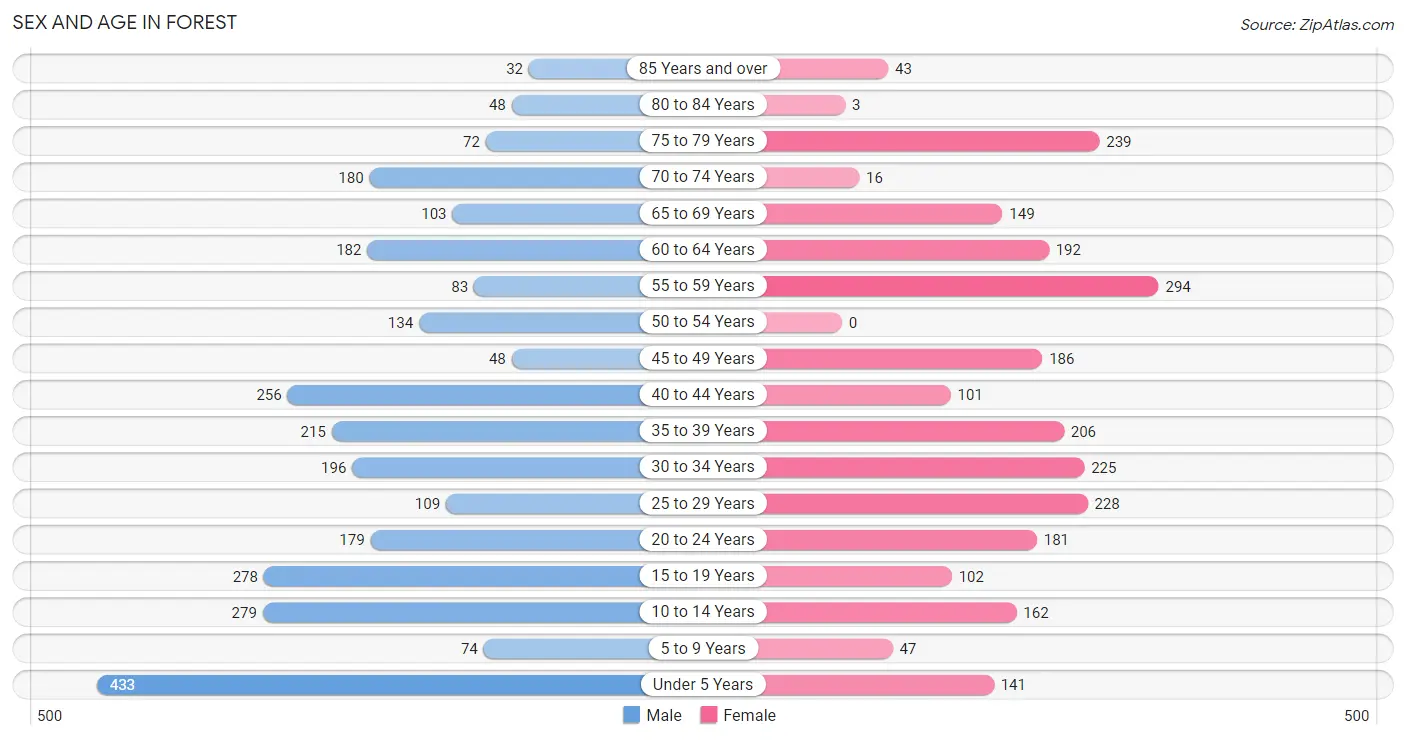
| Age Bracket | Male | Female |
| Under 5 Years | 433 (14.9%) | 141 (5.6%) |
| 5 to 9 Years | 74 (2.5%) | 47 (1.9%) |
| 10 to 14 Years | 279 (9.6%) | 162 (6.4%) |
| 15 to 19 Years | 278 (9.6%) | 102 (4.1%) |
| 20 to 24 Years | 179 (6.2%) | 181 (7.2%) |
| 25 to 29 Years | 109 (3.8%) | 228 (9.1%) |
| 30 to 34 Years | 196 (6.8%) | 225 (8.9%) |
| 35 to 39 Years | 215 (7.4%) | 206 (8.2%) |
| 40 to 44 Years | 256 (8.8%) | 101 (4.0%) |
| 45 to 49 Years | 48 (1.7%) | 186 (7.4%) |
| 50 to 54 Years | 134 (4.6%) | 0 (0.0%) |
| 55 to 59 Years | 83 (2.9%) | 294 (11.7%) |
| 60 to 64 Years | 182 (6.3%) | 192 (7.6%) |
| 65 to 69 Years | 103 (3.5%) | 149 (5.9%) |
| 70 to 74 Years | 180 (6.2%) | 16 (0.6%) |
| 75 to 79 Years | 72 (2.5%) | 239 (9.5%) |
| 80 to 84 Years | 48 (1.7%) | 3 (0.1%) |
| 85 Years and over | 32 (1.1%) | 43 (1.7%) |
| Total | 2,901 (100.0%) | 2,515 (100.0%) |
Families and Households in Forest
Median Family Size in Forest
The median family size in Forest is 3.53 persons per family, with single male/father families (137 | 11.3%) accounting for the largest median family size of 4.52 persons per family. On the other hand, single female/mother families (286 | 23.6%) represent the smallest median family size with 2.89 persons per family.
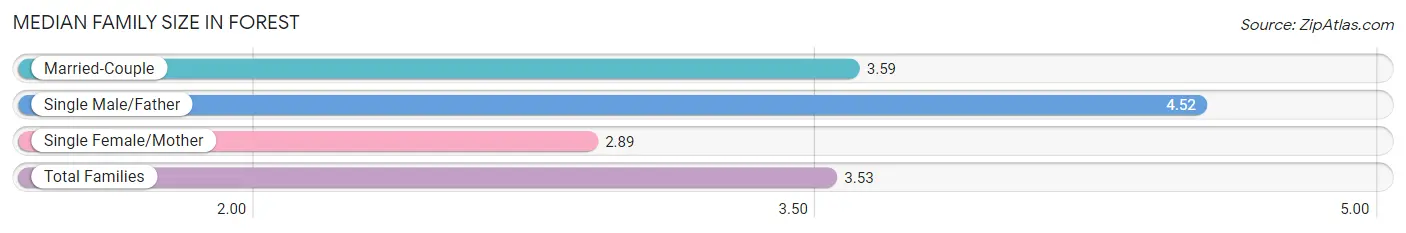
| Family Type | # Families | Family Size |
| Married-Couple | 788 (65.1%) | 3.59 |
| Single Male/Father | 137 (11.3%) | 4.52 |
| Single Female/Mother | 286 (23.6%) | 2.89 |
| Total Families | 1,211 (100.0%) | 3.53 |
Median Household Size in Forest
The median household size in Forest is 2.66 persons per household, with single male/father households (137 | 6.9%) accounting for the largest median household size of 4.65 persons per household. non-family households (778 | 39.1%) represent the smallest median household size with 1.07 persons per household.
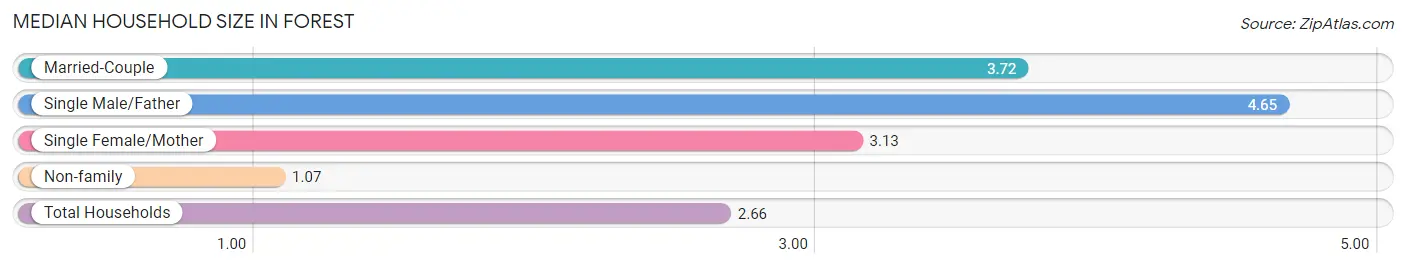
| Household Type | # Households | Household Size |
| Married-Couple | 788 (39.6%) | 3.72 |
| Single Male/Father | 137 (6.9%) | 4.65 |
| Single Female/Mother | 286 (14.4%) | 3.13 |
| Non-family | 778 (39.1%) | 1.07 |
| Total Households | 1,989 (100.0%) | 2.66 |
Household Size by Marriage Status in Forest
Out of a total of 1,989 households in Forest, 1,211 (60.9%) are family households, while 778 (39.1%) are nonfamily households. The most numerous type of family households are 2-person households, comprising 595, and the most common type of nonfamily households are 1-person households, comprising 719.
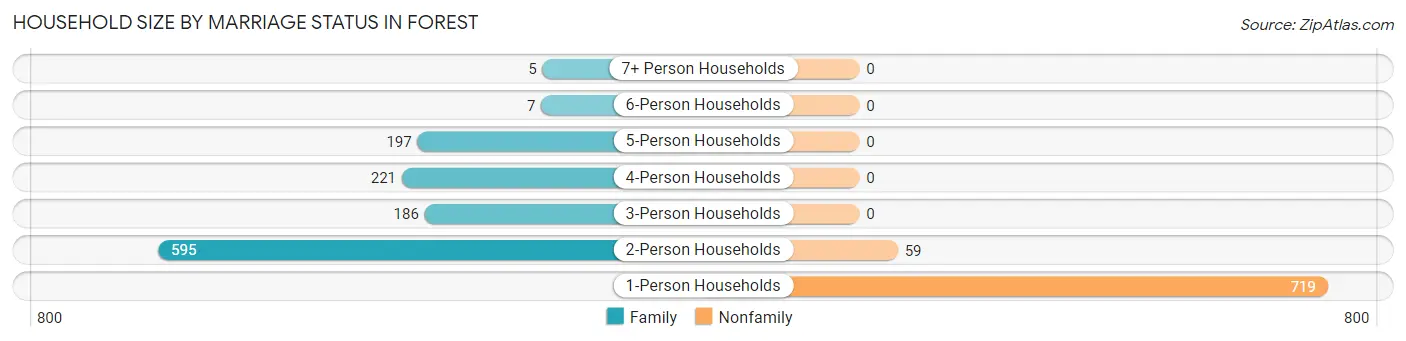
| Household Size | Family Households | Nonfamily Households |
| 1-Person Households | - | 719 (36.1%) |
| 2-Person Households | 595 (29.9%) | 59 (3.0%) |
| 3-Person Households | 186 (9.3%) | 0 (0.0%) |
| 4-Person Households | 221 (11.1%) | 0 (0.0%) |
| 5-Person Households | 197 (9.9%) | 0 (0.0%) |
| 6-Person Households | 7 (0.4%) | 0 (0.0%) |
| 7+ Person Households | 5 (0.3%) | 0 (0.0%) |
| Total | 1,211 (60.9%) | 778 (39.1%) |
Female Fertility in Forest
Fertility by Age in Forest
Average fertility rate in Forest is 72.0 births per 1,000 women. Women in the age bracket of 35 to 50 years have the highest fertility rate with 142.0 births per 1,000 women. Women in the age bracket of 35 to 50 years acount for 79.5% of all women with births.
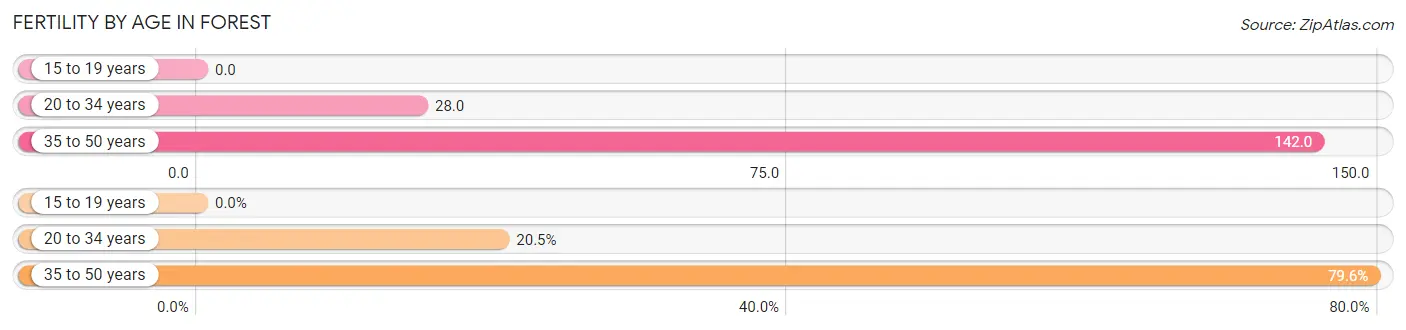
| Age Bracket | Women with Births | Births / 1,000 Women |
| 15 to 19 years | 0 (0.0%) | 0.0 |
| 20 to 34 years | 18 (20.4%) | 28.0 |
| 35 to 50 years | 70 (79.5%) | 142.0 |
| Total | 88 (100.0%) | 72.0 |
Fertility by Age by Marriage Status in Forest
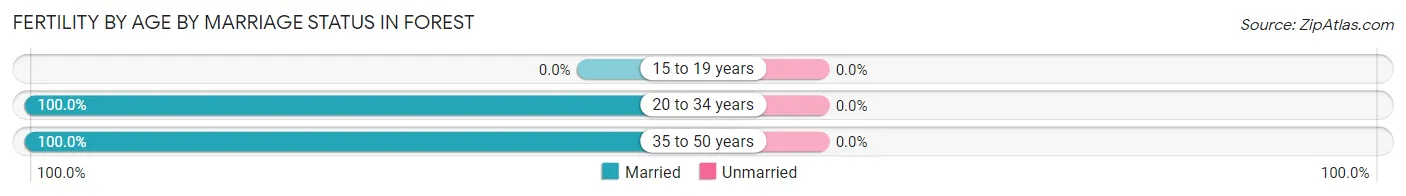
| Age Bracket | Married | Unmarried |
| 15 to 19 years | 0 (0.0%) | 0 (0.0%) |
| 20 to 34 years | 18 (100.0%) | 0 (0.0%) |
| 35 to 50 years | 70 (100.0%) | 0 (0.0%) |
| Total | 88 (100.0%) | 0 (0.0%) |
Fertility by Education in Forest
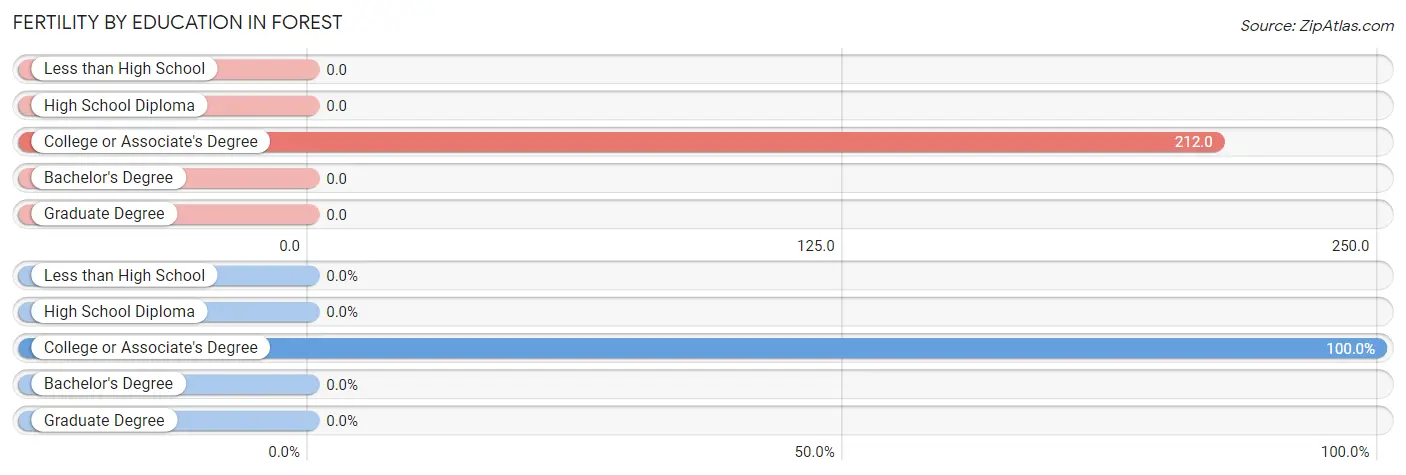
| Educational Attainment | Women with Births | Births / 1,000 Women |
| Less than High School | 0 (0.0%) | 0.0 |
| High School Diploma | 0 (0.0%) | 0.0 |
| College or Associate's Degree | 88 (100.0%) | 212.0 |
| Bachelor's Degree | 0 (0.0%) | 0.0 |
| Graduate Degree | 0 (0.0%) | 0.0 |
| Total | 88 (100.0%) | 72.0 |
Fertility by Education by Marriage Status in Forest
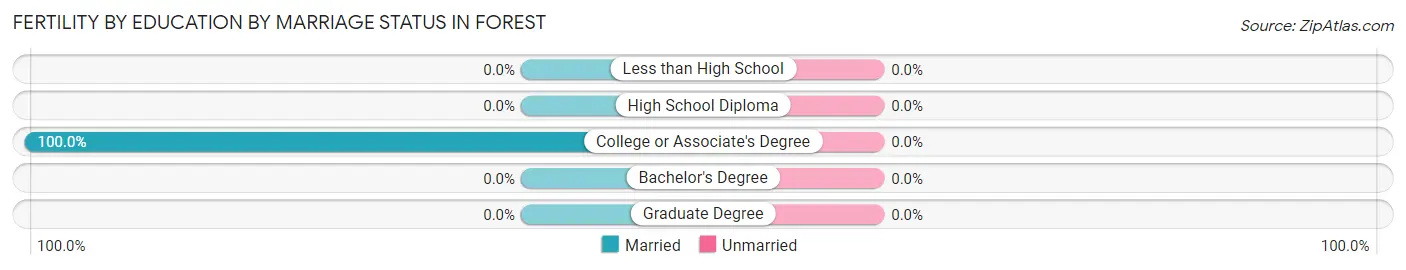
| Educational Attainment | Married | Unmarried |
| Less than High School | 0 (0.0%) | 0 (0.0%) |
| High School Diploma | 0 (0.0%) | 0 (0.0%) |
| College or Associate's Degree | 88 (100.0%) | 0 (0.0%) |
| Bachelor's Degree | 0 (0.0%) | 0 (0.0%) |
| Graduate Degree | 0 (0.0%) | 0 (0.0%) |
| Total | 88 (100.0%) | 0 (0.0%) |
Employment Characteristics in Forest
Employment by Class of Employer in Forest
Among the 1,987 employed individuals in Forest, private company employees (1,421 | 71.5%), self-employed (not incorporated) (241 | 12.1%), and state government employees (174 | 8.8%) make up the most common classes of employment.
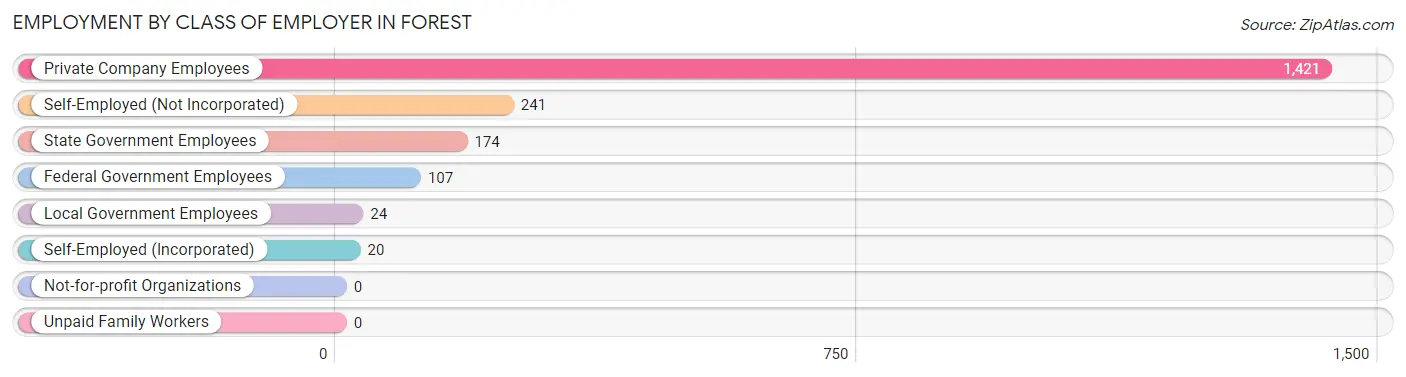
| Employer Class | # Employees | % Employees |
| Private Company Employees | 1,421 | 71.5% |
| Self-Employed (Incorporated) | 20 | 1.0% |
| Self-Employed (Not Incorporated) | 241 | 12.1% |
| Not-for-profit Organizations | 0 | 0.0% |
| Local Government Employees | 24 | 1.2% |
| State Government Employees | 174 | 8.8% |
| Federal Government Employees | 107 | 5.4% |
| Unpaid Family Workers | 0 | 0.0% |
| Total | 1,987 | 100.0% |
Employment Status by Age in Forest
According to the labor force statistics for Forest, out of the total population over 16 years of age (4,271), 50.1% or 2,140 individuals are in the labor force, with 7.1% or 152 of them unemployed. The age group with the highest labor force participation rate is 45 to 54 years, with 79.9% or 294 individuals in the labor force. Within the labor force, the 25 to 29 years age range has the highest percentage of unemployed individuals, with 61.3% or 152 of them being unemployed.
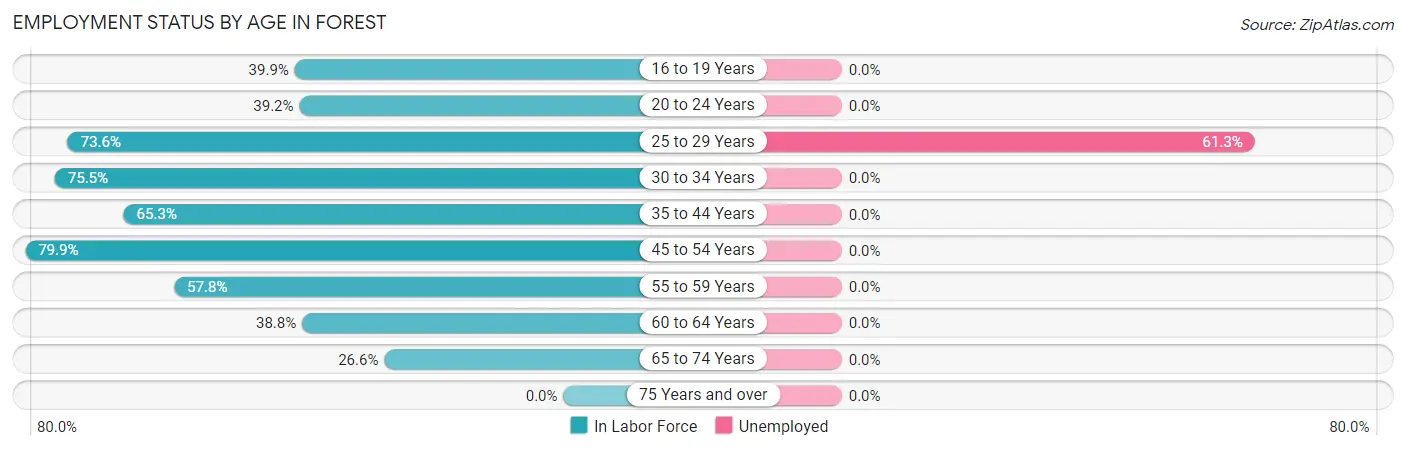
| Age Bracket | In Labor Force | Unemployed |
| 16 to 19 Years | 148 (39.9%) | 0 (0.0%) |
| 20 to 24 Years | 141 (39.2%) | 0 (0.0%) |
| 25 to 29 Years | 248 (73.6%) | 152 (61.3%) |
| 30 to 34 Years | 318 (75.5%) | 0 (0.0%) |
| 35 to 44 Years | 508 (65.3%) | 0 (0.0%) |
| 45 to 54 Years | 294 (79.9%) | 0 (0.0%) |
| 55 to 59 Years | 218 (57.8%) | 0 (0.0%) |
| 60 to 64 Years | 145 (38.8%) | 0 (0.0%) |
| 65 to 74 Years | 119 (26.6%) | 0 (0.0%) |
| 75 Years and over | 0 (0.0%) | 0 (0.0%) |
| Total | 2,140 (50.1%) | 152 (7.1%) |
Employment Status by Educational Attainment in Forest
According to labor force statistics for Forest, 65.2% of individuals (1,731) out of the total population between 25 and 64 years of age (2,655) are in the labor force, with 8.8% or 152 of them being unemployed. The group with the highest labor force participation rate are those with the educational attainment of high school diploma, with 79.3% or 540 individuals in the labor force. Within the labor force, individuals with high school diploma education have the highest percentage of unemployment, with 23.5% or 127 of them being unemployed.
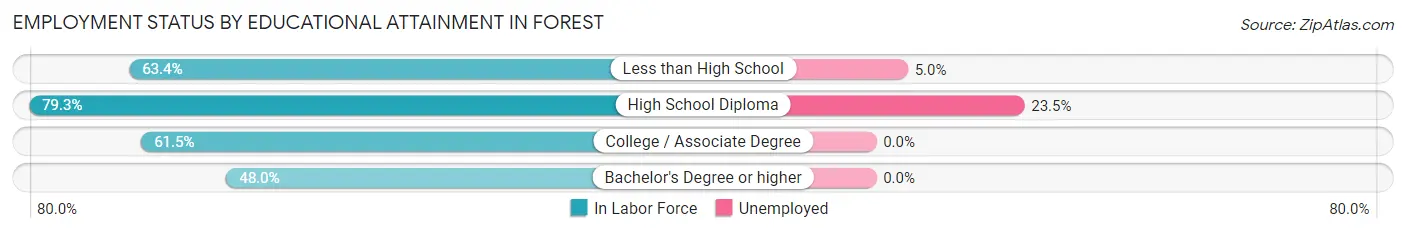
| Educational Attainment | In Labor Force | Unemployed |
| Less than High School | 503 (63.4%) | 40 (5.0%) |
| High School Diploma | 540 (79.3%) | 160 (23.5%) |
| College / Associate Degree | 555 (61.5%) | 0 (0.0%) |
| Bachelor's Degree or higher | 133 (48.0%) | 0 (0.0%) |
| Total | 1,731 (65.2%) | 234 (8.8%) |
Employment Occupations by Sex in Forest
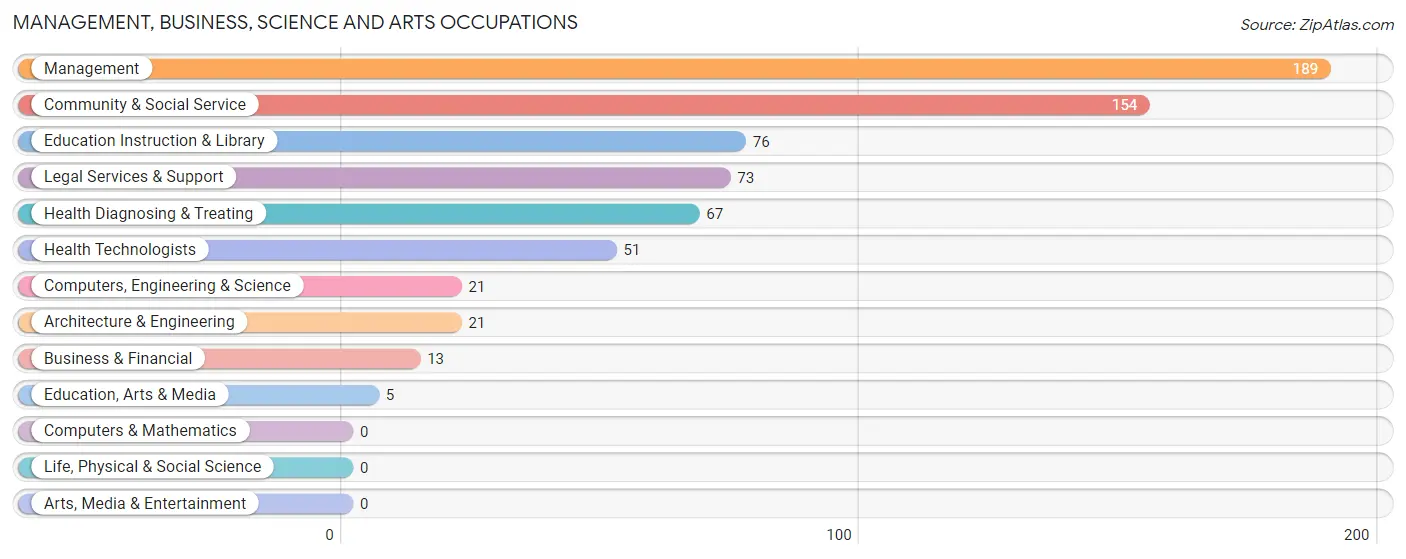
Management, Business, Science and Arts Occupations
The most common Management, Business, Science and Arts occupations in Forest are Management (189 | 9.5%), Community & Social Service (154 | 7.7%), Education Instruction & Library (76 | 3.8%), Legal Services & Support (73 | 3.7%), and Health Diagnosing & Treating (67 | 3.4%).
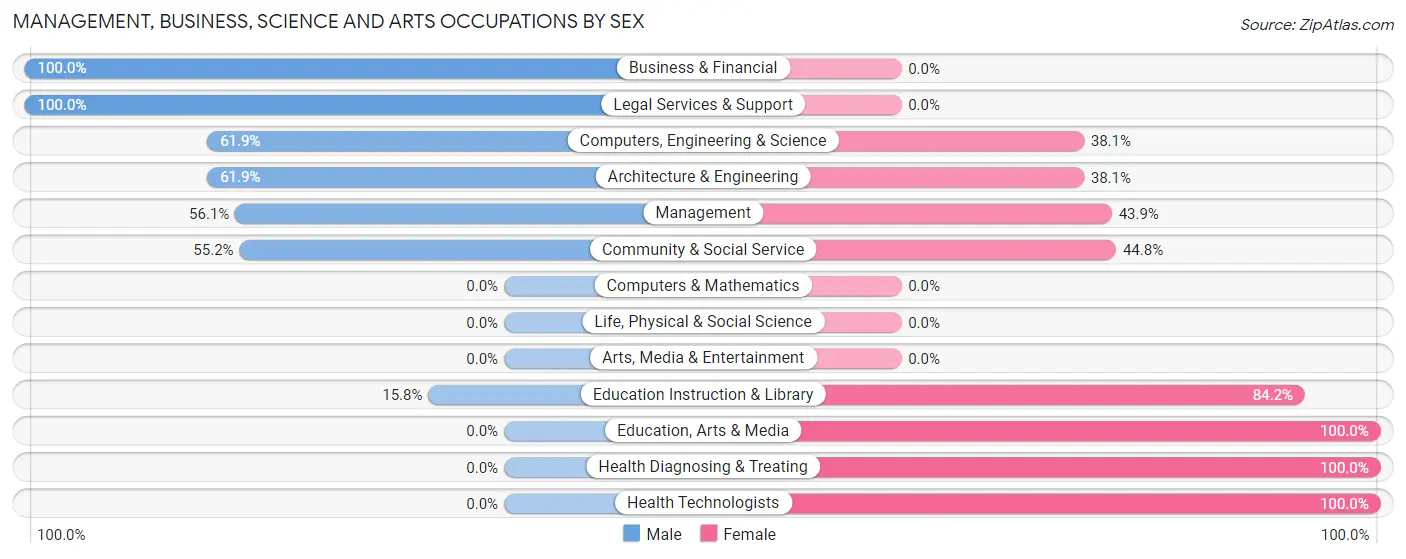
Management, Business, Science and Arts Occupations by Sex
Within the Management, Business, Science and Arts occupations in Forest, the most male-oriented occupations are Business & Financial (100.0%), Legal Services & Support (100.0%), and Computers, Engineering & Science (61.9%), while the most female-oriented occupations are Education, Arts & Media (100.0%), Health Diagnosing & Treating (100.0%), and Health Technologists (100.0%).
| Occupation | Male | Female |
| Management | 106 (56.1%) | 83 (43.9%) |
| Business & Financial | 13 (100.0%) | 0 (0.0%) |
| Computers, Engineering & Science | 13 (61.9%) | 8 (38.1%) |
| Computers & Mathematics | 0 (0.0%) | 0 (0.0%) |
| Architecture & Engineering | 13 (61.9%) | 8 (38.1%) |
| Life, Physical & Social Science | 0 (0.0%) | 0 (0.0%) |
| Community & Social Service | 85 (55.2%) | 69 (44.8%) |
| Education, Arts & Media | 0 (0.0%) | 5 (100.0%) |
| Legal Services & Support | 73 (100.0%) | 0 (0.0%) |
| Education Instruction & Library | 12 (15.8%) | 64 (84.2%) |
| Arts, Media & Entertainment | 0 (0.0%) | 0 (0.0%) |
| Health Diagnosing & Treating | 0 (0.0%) | 67 (100.0%) |
| Health Technologists | 0 (0.0%) | 51 (100.0%) |
| Total (Category) | 217 (48.9%) | 227 (51.1%) |
| Total (Overall) | 1,095 (55.1%) | 892 (44.9%) |
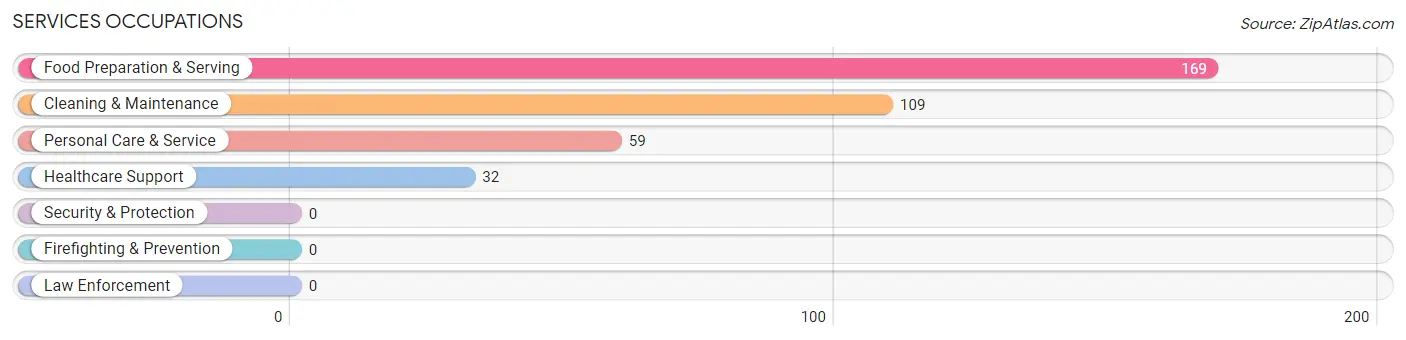
Services Occupations
The most common Services occupations in Forest are Food Preparation & Serving (169 | 8.5%), Cleaning & Maintenance (109 | 5.5%), Personal Care & Service (59 | 3.0%), and Healthcare Support (32 | 1.6%).
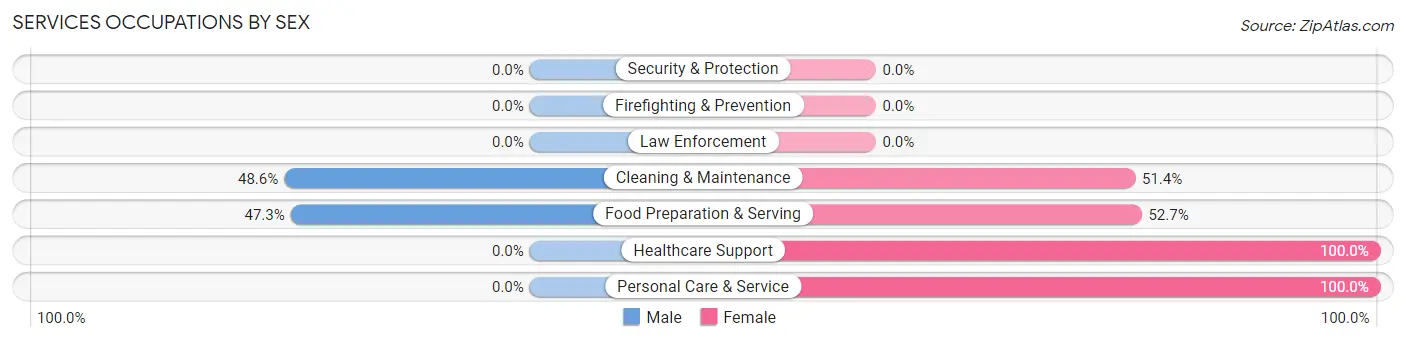
Services Occupations by Sex
Within the Services occupations in Forest, the most male-oriented occupations are Cleaning & Maintenance (48.6%), and Food Preparation & Serving (47.3%), while the most female-oriented occupations are Healthcare Support (100.0%), Personal Care & Service (100.0%), and Food Preparation & Serving (52.7%).
| Occupation | Male | Female |
| Healthcare Support | 0 (0.0%) | 32 (100.0%) |
| Security & Protection | 0 (0.0%) | 0 (0.0%) |
| Firefighting & Prevention | 0 (0.0%) | 0 (0.0%) |
| Law Enforcement | 0 (0.0%) | 0 (0.0%) |
| Food Preparation & Serving | 80 (47.3%) | 89 (52.7%) |
| Cleaning & Maintenance | 53 (48.6%) | 56 (51.4%) |
| Personal Care & Service | 0 (0.0%) | 59 (100.0%) |
| Total (Category) | 133 (36.0%) | 236 (64.0%) |
| Total (Overall) | 1,095 (55.1%) | 892 (44.9%) |
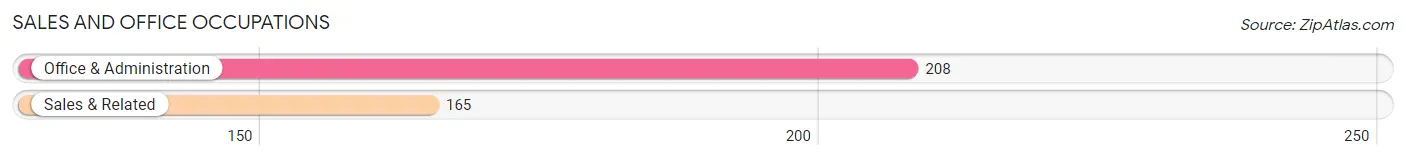
Sales and Office Occupations
The most common Sales and Office occupations in Forest are Office & Administration (208 | 10.5%), and Sales & Related (165 | 8.3%).
Sales and Office Occupations by Sex
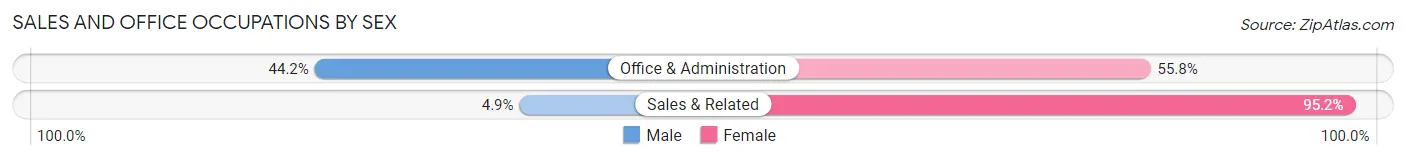
| Occupation | Male | Female |
| Sales & Related | 8 (4.9%) | 157 (95.2%) |
| Office & Administration | 92 (44.2%) | 116 (55.8%) |
| Total (Category) | 100 (26.8%) | 273 (73.2%) |
| Total (Overall) | 1,095 (55.1%) | 892 (44.9%) |
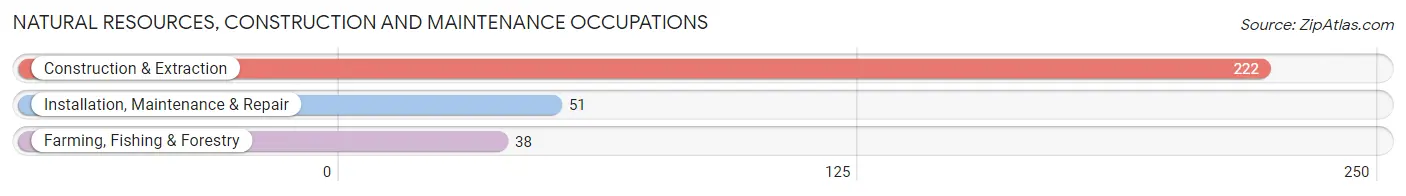
Natural Resources, Construction and Maintenance Occupations
The most common Natural Resources, Construction and Maintenance occupations in Forest are Construction & Extraction (222 | 11.2%), Installation, Maintenance & Repair (51 | 2.6%), and Farming, Fishing & Forestry (38 | 1.9%).
Natural Resources, Construction and Maintenance Occupations by Sex
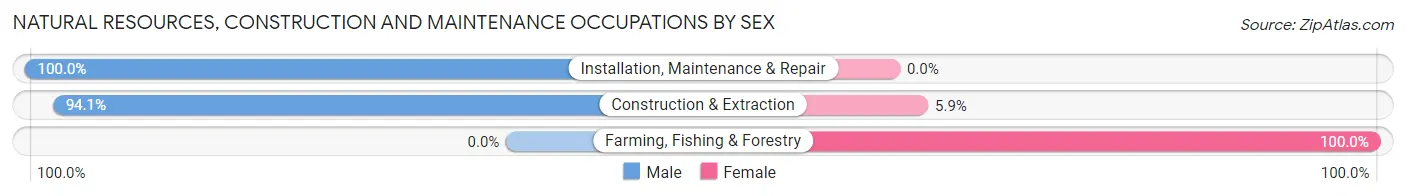
| Occupation | Male | Female |
| Farming, Fishing & Forestry | 0 (0.0%) | 38 (100.0%) |
| Construction & Extraction | 209 (94.1%) | 13 (5.9%) |
| Installation, Maintenance & Repair | 51 (100.0%) | 0 (0.0%) |
| Total (Category) | 260 (83.6%) | 51 (16.4%) |
| Total (Overall) | 1,095 (55.1%) | 892 (44.9%) |
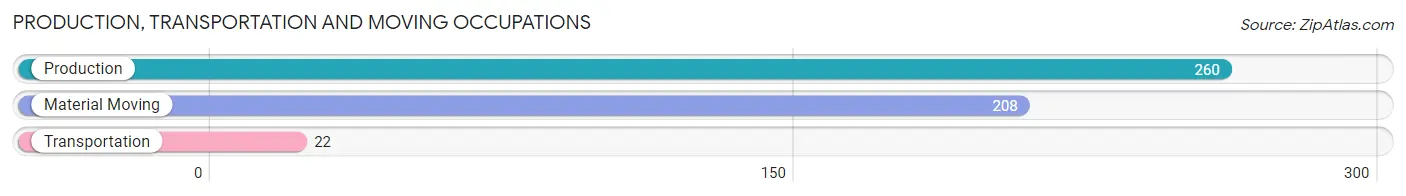
Production, Transportation and Moving Occupations
The most common Production, Transportation and Moving occupations in Forest are Production (260 | 13.1%), Material Moving (208 | 10.5%), and Transportation (22 | 1.1%).
Production, Transportation and Moving Occupations by Sex
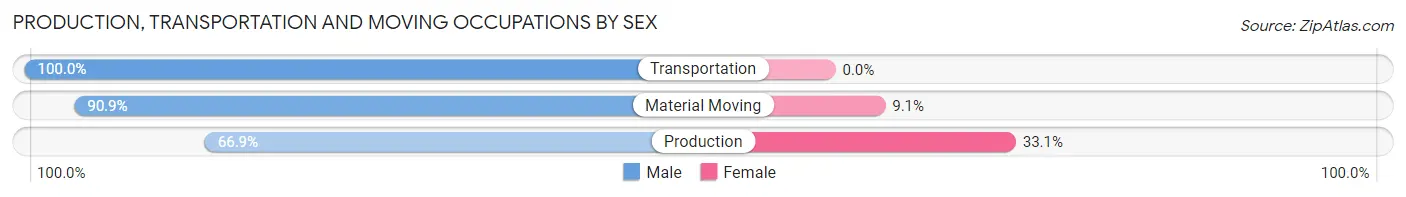
| Occupation | Male | Female |
| Production | 174 (66.9%) | 86 (33.1%) |
| Transportation | 22 (100.0%) | 0 (0.0%) |
| Material Moving | 189 (90.9%) | 19 (9.1%) |
| Total (Category) | 385 (78.6%) | 105 (21.4%) |
| Total (Overall) | 1,095 (55.1%) | 892 (44.9%) |
Employment Industries by Sex in Forest
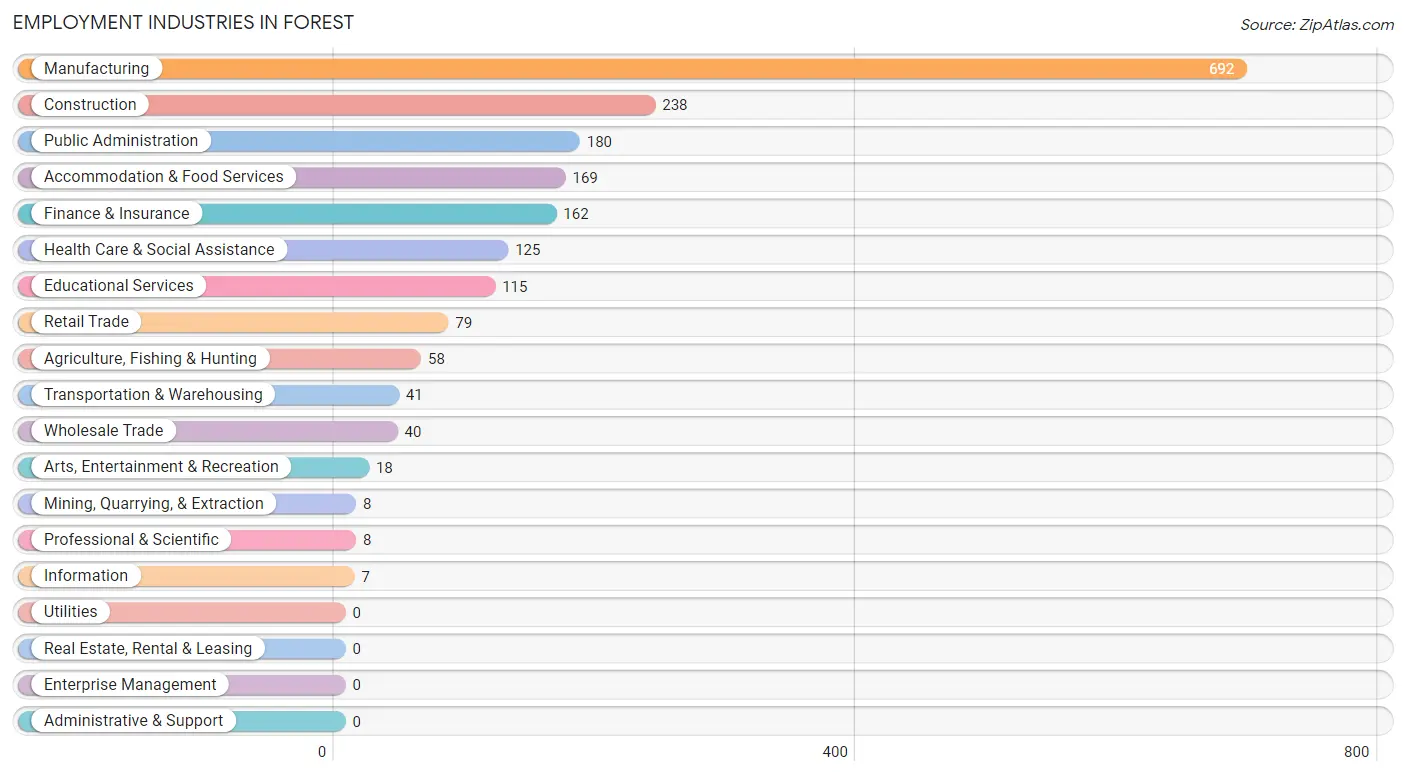
Employment Industries in Forest
The major employment industries in Forest include Manufacturing (692 | 34.8%), Construction (238 | 12.0%), Public Administration (180 | 9.1%), Accommodation & Food Services (169 | 8.5%), and Finance & Insurance (162 | 8.2%).
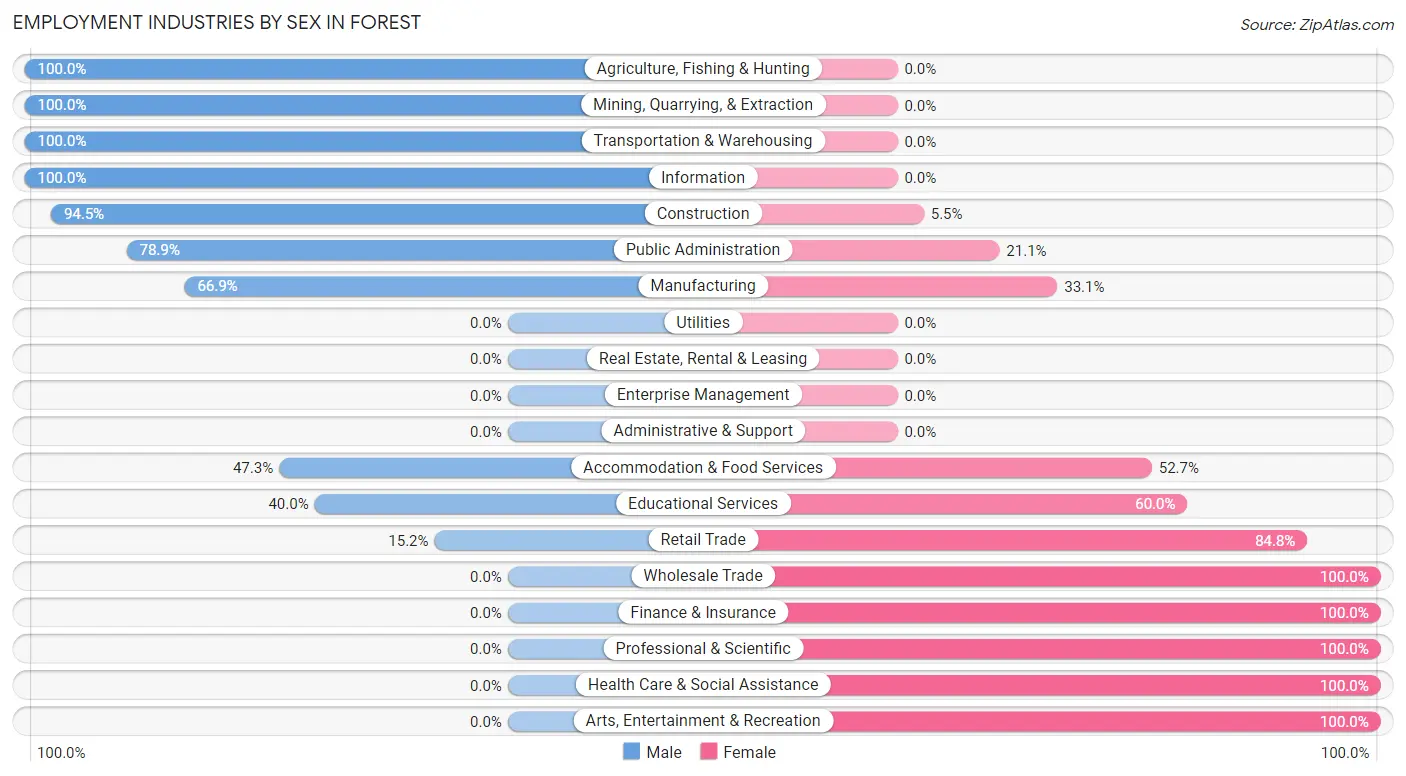
Employment Industries by Sex in Forest
The Forest industries that see more men than women are Agriculture, Fishing & Hunting (100.0%), Mining, Quarrying, & Extraction (100.0%), and Transportation & Warehousing (100.0%), whereas the industries that tend to have a higher number of women are Wholesale Trade (100.0%), Finance & Insurance (100.0%), and Professional & Scientific (100.0%).
| Industry | Male | Female |
| Agriculture, Fishing & Hunting | 58 (100.0%) | 0 (0.0%) |
| Mining, Quarrying, & Extraction | 8 (100.0%) | 0 (0.0%) |
| Construction | 225 (94.5%) | 13 (5.5%) |
| Manufacturing | 463 (66.9%) | 229 (33.1%) |
| Wholesale Trade | 0 (0.0%) | 40 (100.0%) |
| Retail Trade | 12 (15.2%) | 67 (84.8%) |
| Transportation & Warehousing | 41 (100.0%) | 0 (0.0%) |
| Utilities | 0 (0.0%) | 0 (0.0%) |
| Information | 7 (100.0%) | 0 (0.0%) |
| Finance & Insurance | 0 (0.0%) | 162 (100.0%) |
| Real Estate, Rental & Leasing | 0 (0.0%) | 0 (0.0%) |
| Professional & Scientific | 0 (0.0%) | 8 (100.0%) |
| Enterprise Management | 0 (0.0%) | 0 (0.0%) |
| Administrative & Support | 0 (0.0%) | 0 (0.0%) |
| Educational Services | 46 (40.0%) | 69 (60.0%) |
| Health Care & Social Assistance | 0 (0.0%) | 125 (100.0%) |
| Arts, Entertainment & Recreation | 0 (0.0%) | 18 (100.0%) |
| Accommodation & Food Services | 80 (47.3%) | 89 (52.7%) |
| Public Administration | 142 (78.9%) | 38 (21.1%) |
| Total | 1,095 (55.1%) | 892 (44.9%) |
Education in Forest
School Enrollment in Forest
The most common levels of schooling among the 932 students in Forest are college / undergraduate (244 | 26.2%), middle school (223 | 23.9%), and high school (169 | 18.1%).
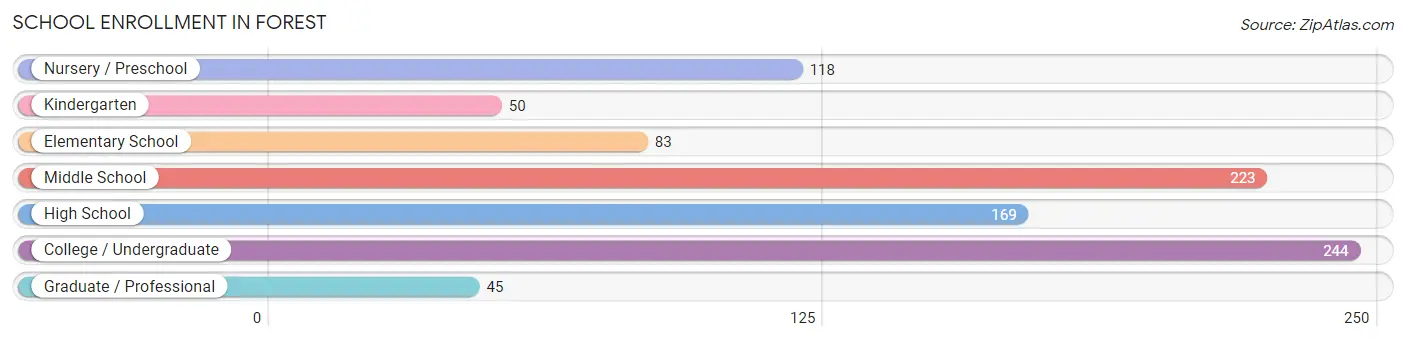
| School Level | # Students | % Students |
| Nursery / Preschool | 118 | 12.7% |
| Kindergarten | 50 | 5.4% |
| Elementary School | 83 | 8.9% |
| Middle School | 223 | 23.9% |
| High School | 169 | 18.1% |
| College / Undergraduate | 244 | 26.2% |
| Graduate / Professional | 45 | 4.8% |
| Total | 932 | 100.0% |
School Enrollment by Age by Funding Source in Forest
Out of a total of 932 students who are enrolled in schools in Forest, 160 (17.2%) attend a private institution, while the remaining 772 (82.8%) are enrolled in public schools. The age group of 3 to 4 year olds has the highest likelihood of being enrolled in private schools, with 79 (66.9% in the age bracket) enrolled. Conversely, the age group of 15 to 17 year olds has the lowest likelihood of being enrolled in a private school, with 54 (100.0% in the age bracket) attending a public institution.
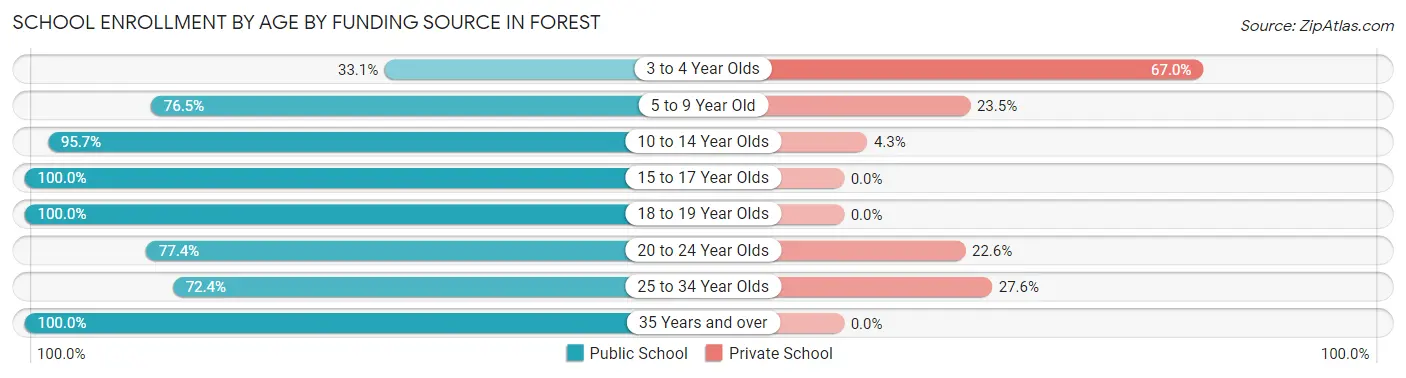
| Age Bracket | Public School | Private School |
| 3 to 4 Year Olds | 39 (33.1%) | 79 (66.9%) |
| 5 to 9 Year Old | 52 (76.5%) | 16 (23.5%) |
| 10 to 14 Year Olds | 353 (95.7%) | 16 (4.3%) |
| 15 to 17 Year Olds | 54 (100.0%) | 0 (0.0%) |
| 18 to 19 Year Olds | 34 (100.0%) | 0 (0.0%) |
| 20 to 24 Year Olds | 113 (77.4%) | 33 (22.6%) |
| 25 to 34 Year Olds | 42 (72.4%) | 16 (27.6%) |
| 35 Years and over | 85 (100.0%) | 0 (0.0%) |
| Total | 772 (82.8%) | 160 (17.2%) |
Educational Attainment by Field of Study in Forest
Education (219 | 45.7%), business (52 | 10.9%), arts & humanities (49 | 10.2%), engineering (32 | 6.7%), and communications (28 | 5.9%) are the most common fields of study among 479 individuals in Forest who have obtained a bachelor's degree or higher.
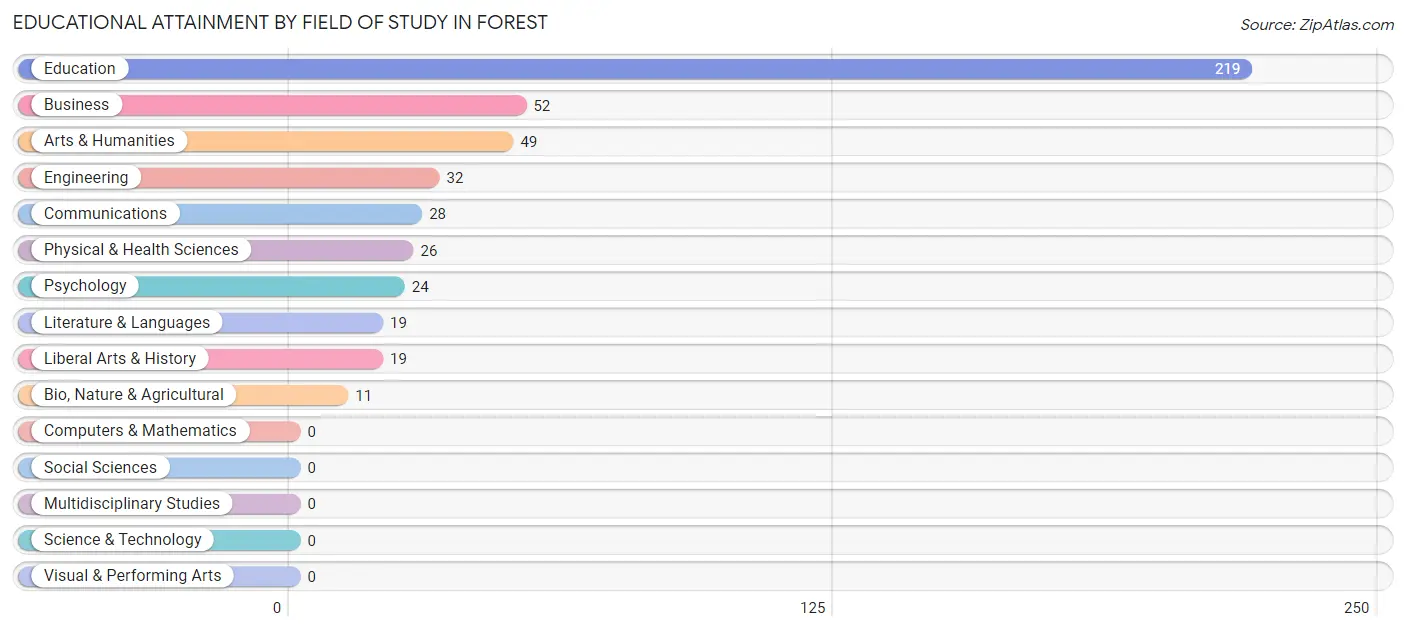
| Field of Study | # Graduates | % Graduates |
| Computers & Mathematics | 0 | 0.0% |
| Bio, Nature & Agricultural | 11 | 2.3% |
| Physical & Health Sciences | 26 | 5.4% |
| Psychology | 24 | 5.0% |
| Social Sciences | 0 | 0.0% |
| Engineering | 32 | 6.7% |
| Multidisciplinary Studies | 0 | 0.0% |
| Science & Technology | 0 | 0.0% |
| Business | 52 | 10.9% |
| Education | 219 | 45.7% |
| Literature & Languages | 19 | 4.0% |
| Liberal Arts & History | 19 | 4.0% |
| Visual & Performing Arts | 0 | 0.0% |
| Communications | 28 | 5.9% |
| Arts & Humanities | 49 | 10.2% |
| Total | 479 | 100.0% |
Transportation & Commute in Forest
Vehicle Availability by Sex in Forest
The most prevalent vehicle ownership categories in Forest are males with 2 vehicles (495, accounting for 45.2%) and females with 2 vehicles (299, making up 55.5%).
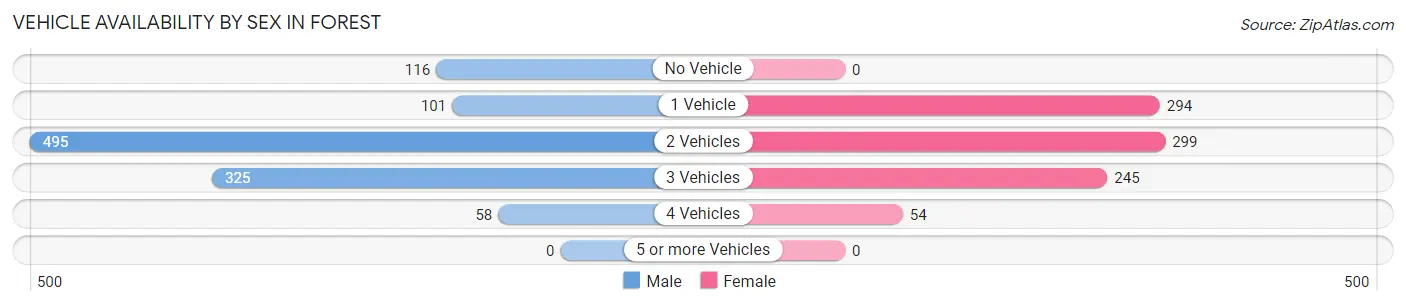
| Vehicles Available | Male | Female |
| No Vehicle | 116 (10.6%) | 0 (0.0%) |
| 1 Vehicle | 101 (9.2%) | 294 (33.0%) |
| 2 Vehicles | 495 (45.2%) | 299 (33.5%) |
| 3 Vehicles | 325 (29.7%) | 245 (27.5%) |
| 4 Vehicles | 58 (5.3%) | 54 (6.0%) |
| 5 or more Vehicles | 0 (0.0%) | 0 (0.0%) |
| Total | 1,095 (100.0%) | 892 (100.0%) |
Commute Time in Forest
The most frequently occuring commute durations in Forest are 15 to 19 minutes (473 commuters, 23.8%), less than 5 minutes (432 commuters, 21.7%), and 10 to 14 minutes (218 commuters, 11.0%).
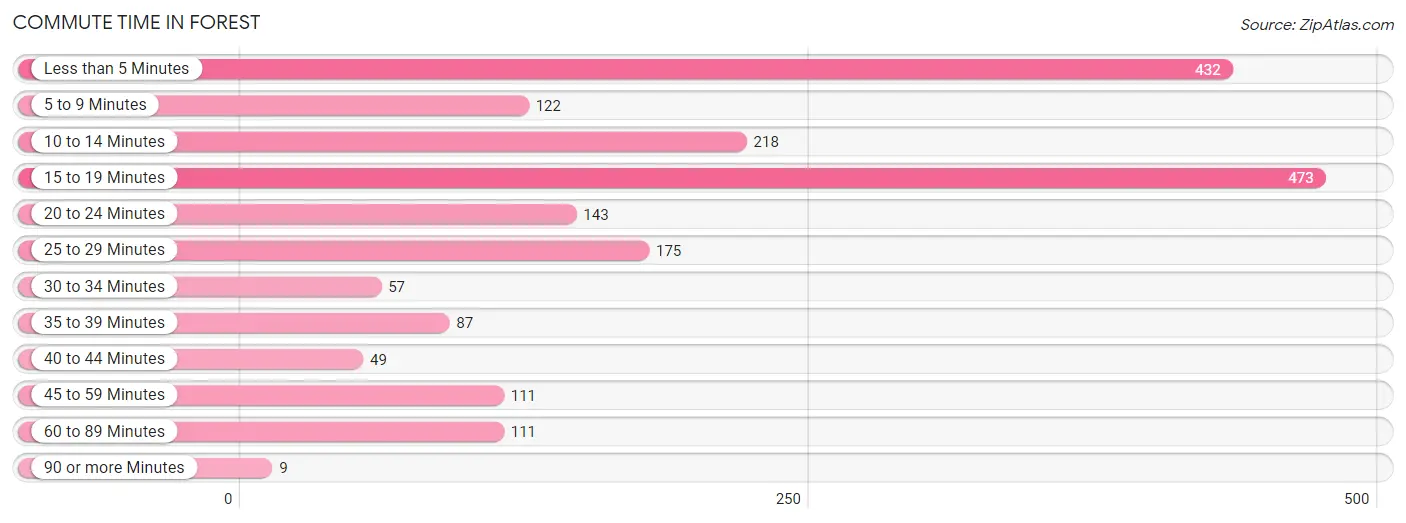
| Commute Time | # Commuters | % Commuters |
| Less than 5 Minutes | 432 | 21.7% |
| 5 to 9 Minutes | 122 | 6.1% |
| 10 to 14 Minutes | 218 | 11.0% |
| 15 to 19 Minutes | 473 | 23.8% |
| 20 to 24 Minutes | 143 | 7.2% |
| 25 to 29 Minutes | 175 | 8.8% |
| 30 to 34 Minutes | 57 | 2.9% |
| 35 to 39 Minutes | 87 | 4.4% |
| 40 to 44 Minutes | 49 | 2.5% |
| 45 to 59 Minutes | 111 | 5.6% |
| 60 to 89 Minutes | 111 | 5.6% |
| 90 or more Minutes | 9 | 0.4% |
Commute Time by Sex in Forest
The most common commute times in Forest are less than 5 minutes (304 commuters, 27.8%) for males and 15 to 19 minutes (220 commuters, 24.7%) for females.
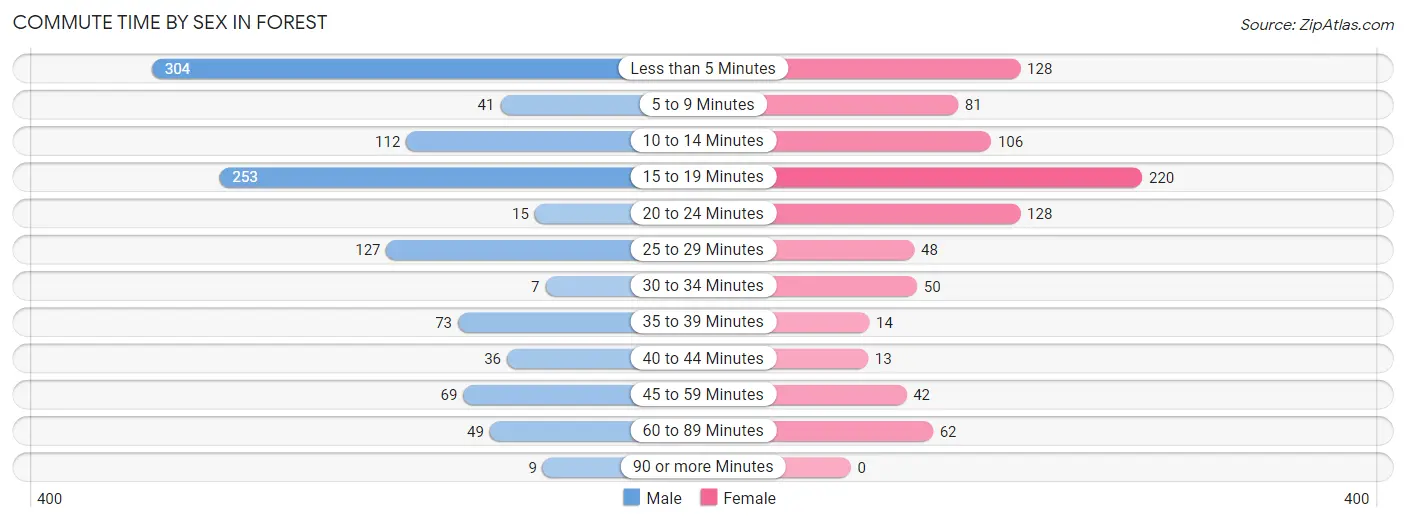
| Commute Time | Male | Female |
| Less than 5 Minutes | 304 (27.8%) | 128 (14.3%) |
| 5 to 9 Minutes | 41 (3.7%) | 81 (9.1%) |
| 10 to 14 Minutes | 112 (10.2%) | 106 (11.9%) |
| 15 to 19 Minutes | 253 (23.1%) | 220 (24.7%) |
| 20 to 24 Minutes | 15 (1.4%) | 128 (14.3%) |
| 25 to 29 Minutes | 127 (11.6%) | 48 (5.4%) |
| 30 to 34 Minutes | 7 (0.6%) | 50 (5.6%) |
| 35 to 39 Minutes | 73 (6.7%) | 14 (1.6%) |
| 40 to 44 Minutes | 36 (3.3%) | 13 (1.5%) |
| 45 to 59 Minutes | 69 (6.3%) | 42 (4.7%) |
| 60 to 89 Minutes | 49 (4.5%) | 62 (7.0%) |
| 90 or more Minutes | 9 (0.8%) | 0 (0.0%) |
Time of Departure to Work by Sex in Forest
The most frequent times of departure to work in Forest are 4:00 PM to 11:59 PM (318, 29.0%) for males and 9:00 AM to 9:59 AM (151, 16.9%) for females.
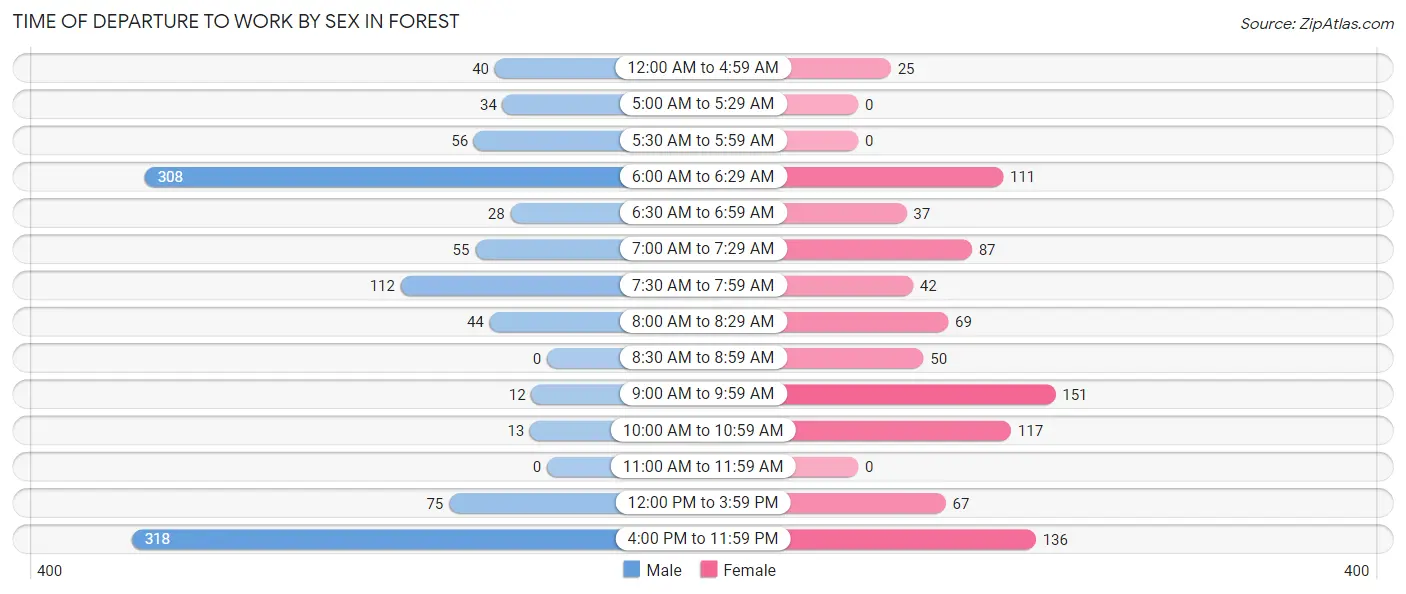
| Time of Departure | Male | Female |
| 12:00 AM to 4:59 AM | 40 (3.6%) | 25 (2.8%) |
| 5:00 AM to 5:29 AM | 34 (3.1%) | 0 (0.0%) |
| 5:30 AM to 5:59 AM | 56 (5.1%) | 0 (0.0%) |
| 6:00 AM to 6:29 AM | 308 (28.1%) | 111 (12.4%) |
| 6:30 AM to 6:59 AM | 28 (2.6%) | 37 (4.2%) |
| 7:00 AM to 7:29 AM | 55 (5.0%) | 87 (9.8%) |
| 7:30 AM to 7:59 AM | 112 (10.2%) | 42 (4.7%) |
| 8:00 AM to 8:29 AM | 44 (4.0%) | 69 (7.7%) |
| 8:30 AM to 8:59 AM | 0 (0.0%) | 50 (5.6%) |
| 9:00 AM to 9:59 AM | 12 (1.1%) | 151 (16.9%) |
| 10:00 AM to 10:59 AM | 13 (1.2%) | 117 (13.1%) |
| 11:00 AM to 11:59 AM | 0 (0.0%) | 0 (0.0%) |
| 12:00 PM to 3:59 PM | 75 (6.9%) | 67 (7.5%) |
| 4:00 PM to 11:59 PM | 318 (29.0%) | 136 (15.2%) |
| Total | 1,095 (100.0%) | 892 (100.0%) |
Housing Occupancy in Forest
Occupancy by Ownership in Forest
Of the total 1,989 dwellings in Forest, owner-occupied units account for 1,051 (52.8%), while renter-occupied units make up 938 (47.2%).
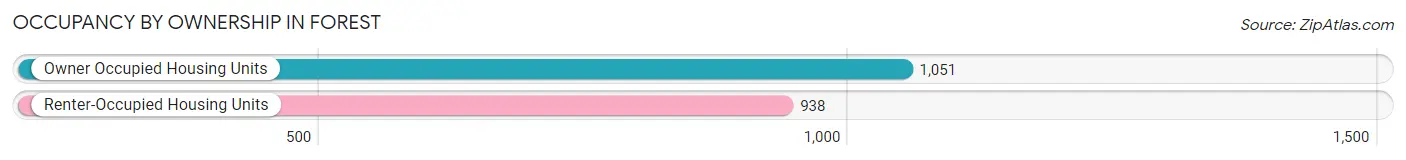
| Occupancy | # Housing Units | % Housing Units |
| Owner Occupied Housing Units | 1,051 | 52.8% |
| Renter-Occupied Housing Units | 938 | 47.2% |
| Total Occupied Housing Units | 1,989 | 100.0% |
Occupancy by Household Size in Forest
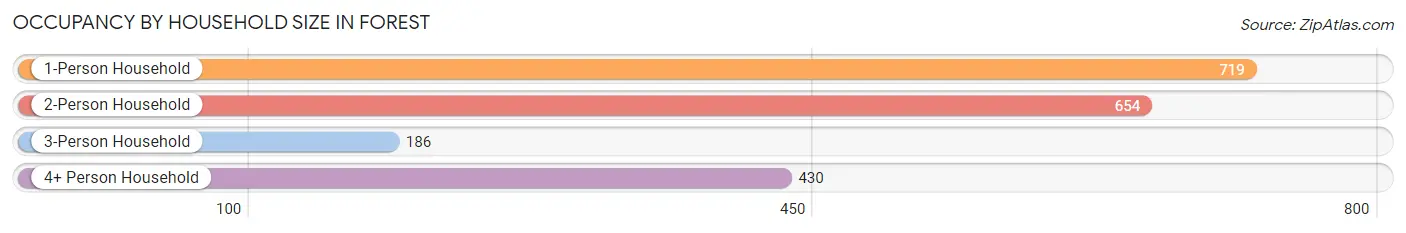
| Household Size | # Housing Units | % Housing Units |
| 1-Person Household | 719 | 36.1% |
| 2-Person Household | 654 | 32.9% |
| 3-Person Household | 186 | 9.3% |
| 4+ Person Household | 430 | 21.6% |
| Total Housing Units | 1,989 | 100.0% |
Occupancy by Ownership by Household Size in Forest
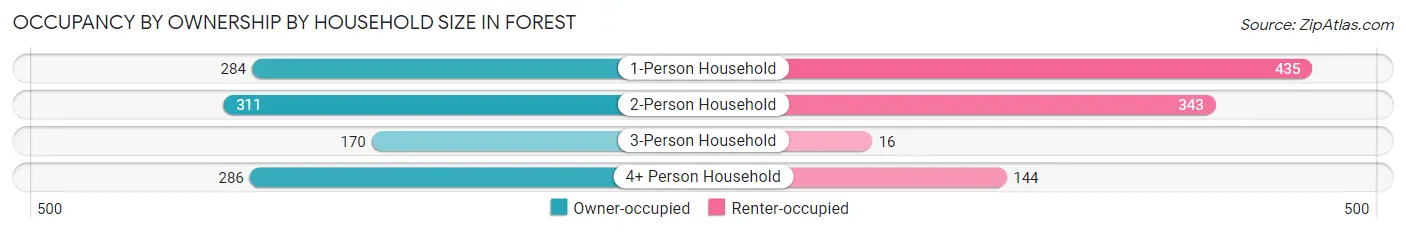
| Household Size | Owner-occupied | Renter-occupied |
| 1-Person Household | 284 (39.5%) | 435 (60.5%) |
| 2-Person Household | 311 (47.5%) | 343 (52.4%) |
| 3-Person Household | 170 (91.4%) | 16 (8.6%) |
| 4+ Person Household | 286 (66.5%) | 144 (33.5%) |
| Total Housing Units | 1,051 (52.8%) | 938 (47.2%) |
Occupancy by Educational Attainment in Forest
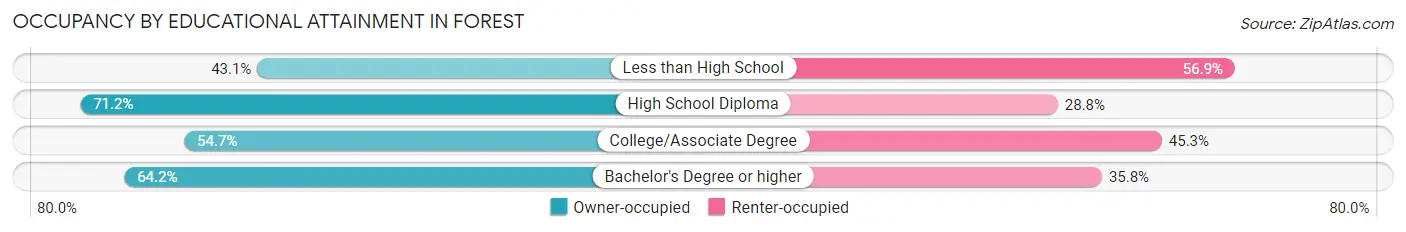
| Household Size | Owner-occupied | Renter-occupied |
| Less than High School | 322 (43.1%) | 425 (56.9%) |
| High School Diploma | 121 (71.2%) | 49 (28.8%) |
| College/Associate Degree | 461 (54.7%) | 382 (45.3%) |
| Bachelor's Degree or higher | 147 (64.2%) | 82 (35.8%) |
Occupancy by Age of Householder in Forest
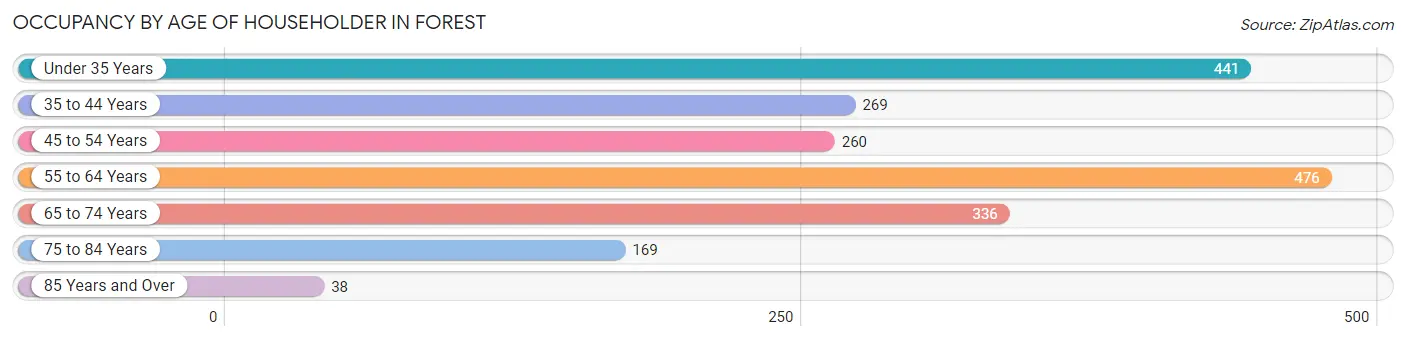
| Age Bracket | # Households | % Households |
| Under 35 Years | 441 | 22.2% |
| 35 to 44 Years | 269 | 13.5% |
| 45 to 54 Years | 260 | 13.1% |
| 55 to 64 Years | 476 | 23.9% |
| 65 to 74 Years | 336 | 16.9% |
| 75 to 84 Years | 169 | 8.5% |
| 85 Years and Over | 38 | 1.9% |
| Total | 1,989 | 100.0% |
Housing Finances in Forest
Median Income by Occupancy in Forest
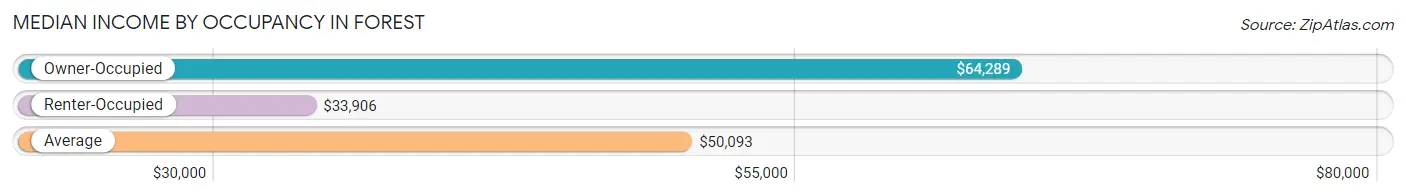
| Occupancy Type | # Households | Median Income |
| Owner-Occupied | 1,051 (52.8%) | $64,289 |
| Renter-Occupied | 938 (47.2%) | $33,906 |
| Average | 1,989 (100.0%) | $50,093 |
Occupancy by Householder Income Bracket in Forest
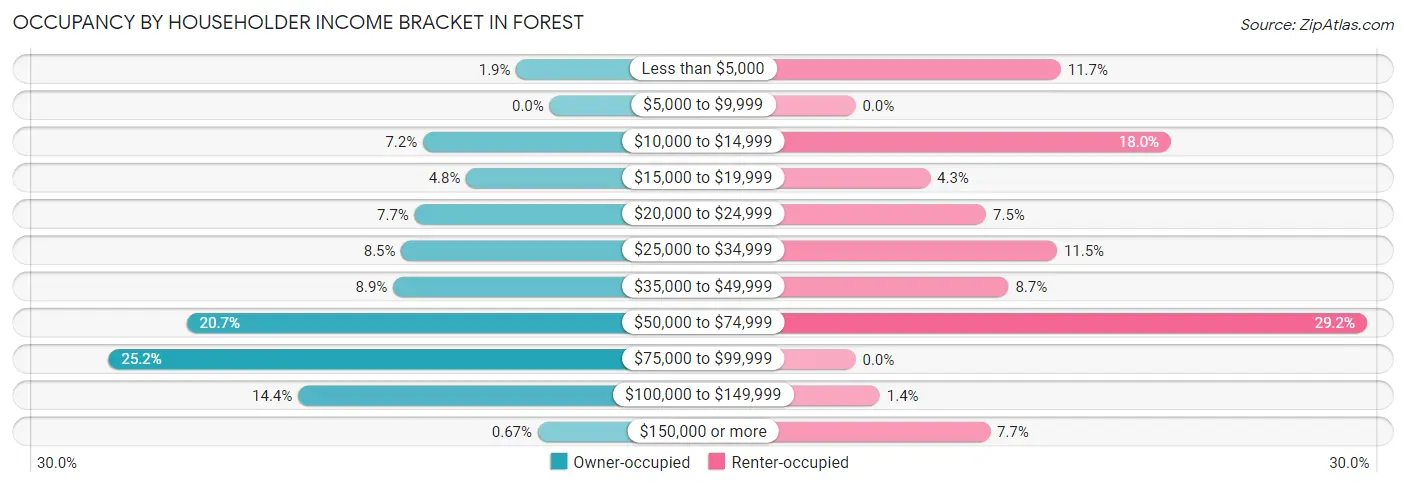
| Income Bracket | Owner-occupied | Renter-occupied |
| Less than $5,000 | 20 (1.9%) | 110 (11.7%) |
| $5,000 to $9,999 | 0 (0.0%) | 0 (0.0%) |
| $10,000 to $14,999 | 76 (7.2%) | 169 (18.0%) |
| $15,000 to $19,999 | 50 (4.8%) | 40 (4.3%) |
| $20,000 to $24,999 | 81 (7.7%) | 70 (7.5%) |
| $25,000 to $34,999 | 89 (8.5%) | 108 (11.5%) |
| $35,000 to $49,999 | 94 (8.9%) | 82 (8.7%) |
| $50,000 to $74,999 | 218 (20.7%) | 274 (29.2%) |
| $75,000 to $99,999 | 265 (25.2%) | 0 (0.0%) |
| $100,000 to $149,999 | 151 (14.4%) | 13 (1.4%) |
| $150,000 or more | 7 (0.7%) | 72 (7.7%) |
| Total | 1,051 (100.0%) | 938 (100.0%) |
Monthly Housing Cost Tiers in Forest
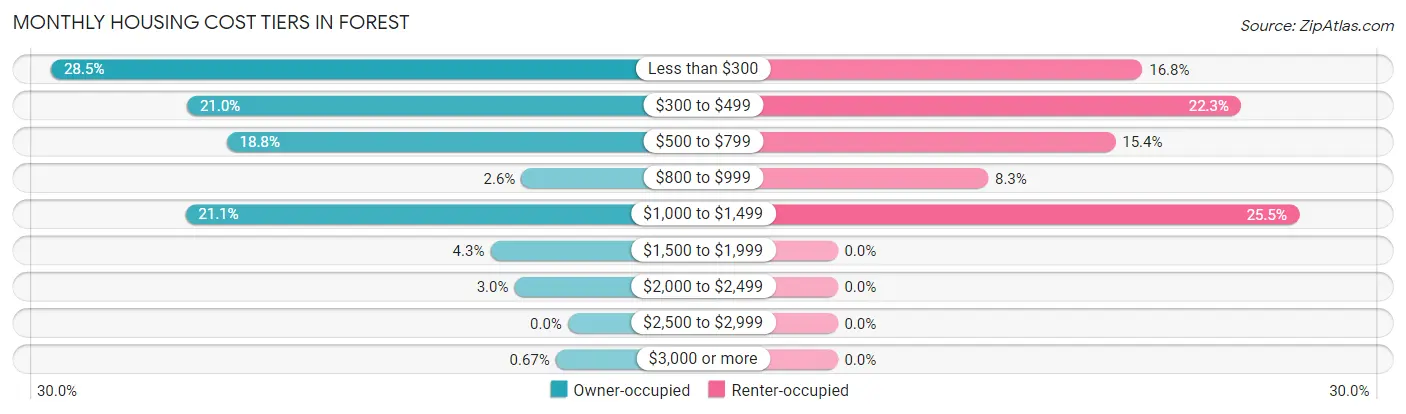
| Monthly Cost | Owner-occupied | Renter-occupied |
| Less than $300 | 300 (28.5%) | 158 (16.8%) |
| $300 to $499 | 221 (21.0%) | 209 (22.3%) |
| $500 to $799 | 198 (18.8%) | 144 (15.3%) |
| $800 to $999 | 27 (2.6%) | 78 (8.3%) |
| $1,000 to $1,499 | 222 (21.1%) | 239 (25.5%) |
| $1,500 to $1,999 | 45 (4.3%) | 0 (0.0%) |
| $2,000 to $2,499 | 31 (2.9%) | 0 (0.0%) |
| $2,500 to $2,999 | 0 (0.0%) | 0 (0.0%) |
| $3,000 or more | 7 (0.7%) | 0 (0.0%) |
| Total | 1,051 (100.0%) | 938 (100.0%) |
Physical Housing Characteristics in Forest
Housing Structures in Forest
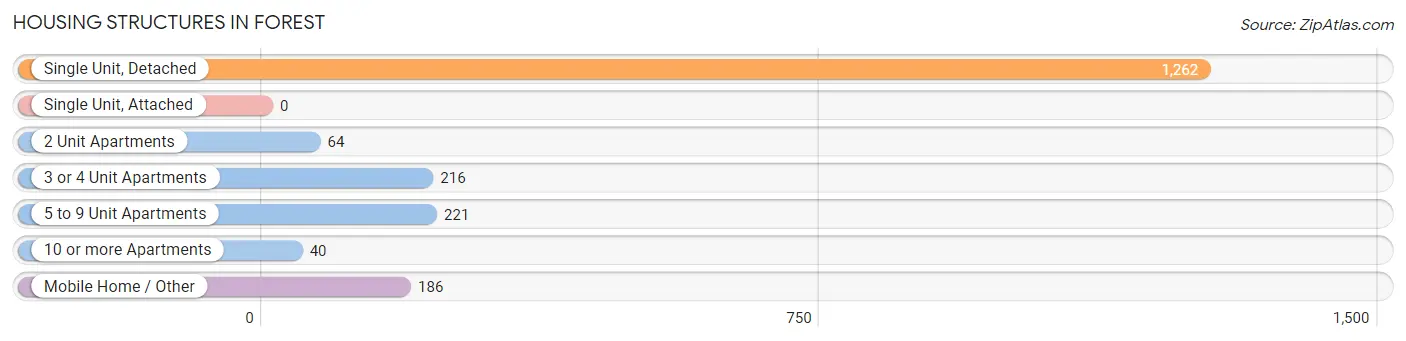
| Structure Type | # Housing Units | % Housing Units |
| Single Unit, Detached | 1,262 | 63.4% |
| Single Unit, Attached | 0 | 0.0% |
| 2 Unit Apartments | 64 | 3.2% |
| 3 or 4 Unit Apartments | 216 | 10.9% |
| 5 to 9 Unit Apartments | 221 | 11.1% |
| 10 or more Apartments | 40 | 2.0% |
| Mobile Home / Other | 186 | 9.3% |
| Total | 1,989 | 100.0% |
Housing Structures by Occupancy in Forest
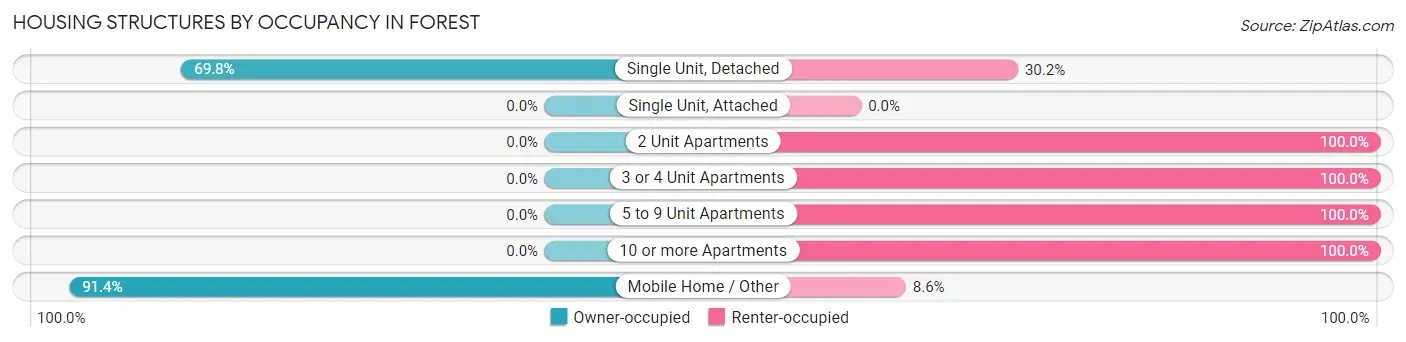
| Structure Type | Owner-occupied | Renter-occupied |
| Single Unit, Detached | 881 (69.8%) | 381 (30.2%) |
| Single Unit, Attached | 0 (0.0%) | 0 (0.0%) |
| 2 Unit Apartments | 0 (0.0%) | 64 (100.0%) |
| 3 or 4 Unit Apartments | 0 (0.0%) | 216 (100.0%) |
| 5 to 9 Unit Apartments | 0 (0.0%) | 221 (100.0%) |
| 10 or more Apartments | 0 (0.0%) | 40 (100.0%) |
| Mobile Home / Other | 170 (91.4%) | 16 (8.6%) |
| Total | 1,051 (52.8%) | 938 (47.2%) |
Housing Structures by Number of Rooms in Forest
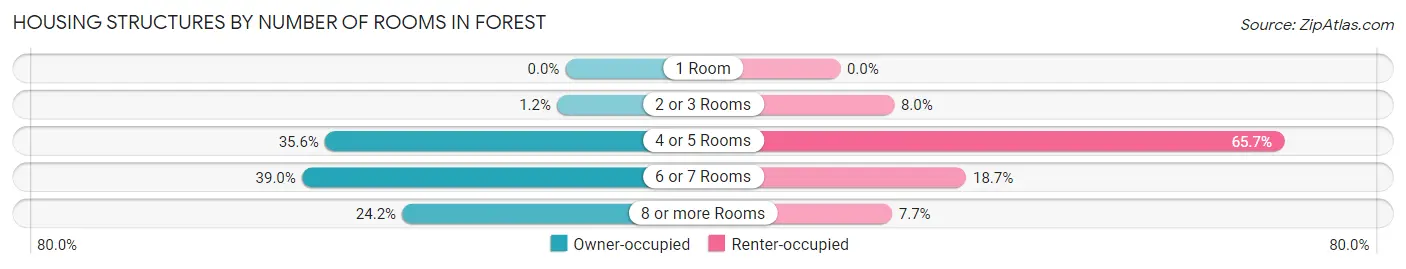
| Number of Rooms | Owner-occupied | Renter-occupied |
| 1 Room | 0 (0.0%) | 0 (0.0%) |
| 2 or 3 Rooms | 13 (1.2%) | 75 (8.0%) |
| 4 or 5 Rooms | 374 (35.6%) | 616 (65.7%) |
| 6 or 7 Rooms | 410 (39.0%) | 175 (18.7%) |
| 8 or more Rooms | 254 (24.2%) | 72 (7.7%) |
| Total | 1,051 (100.0%) | 938 (100.0%) |
Housing Structure by Heating Type in Forest
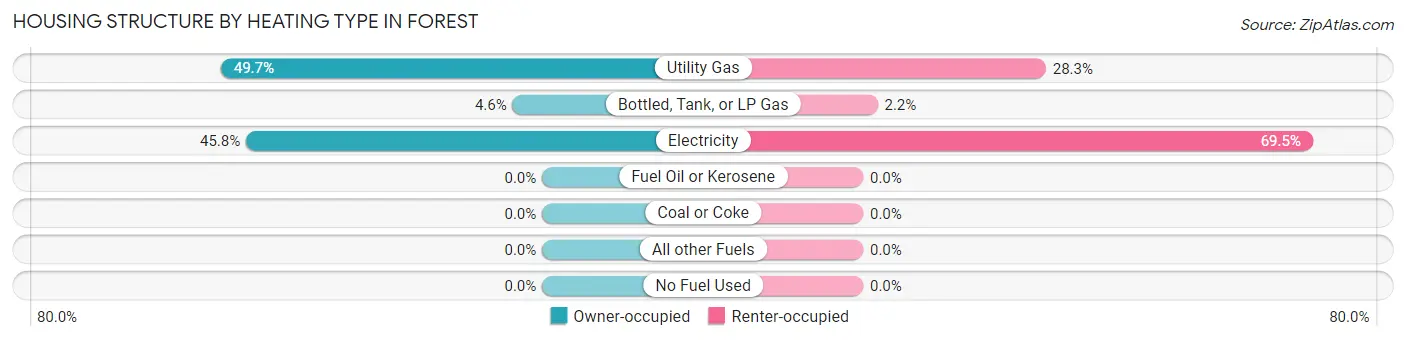
| Heating Type | Owner-occupied | Renter-occupied |
| Utility Gas | 522 (49.7%) | 265 (28.2%) |
| Bottled, Tank, or LP Gas | 48 (4.6%) | 21 (2.2%) |
| Electricity | 481 (45.8%) | 652 (69.5%) |
| Fuel Oil or Kerosene | 0 (0.0%) | 0 (0.0%) |
| Coal or Coke | 0 (0.0%) | 0 (0.0%) |
| All other Fuels | 0 (0.0%) | 0 (0.0%) |
| No Fuel Used | 0 (0.0%) | 0 (0.0%) |
| Total | 1,051 (100.0%) | 938 (100.0%) |
Household Vehicle Usage in Forest
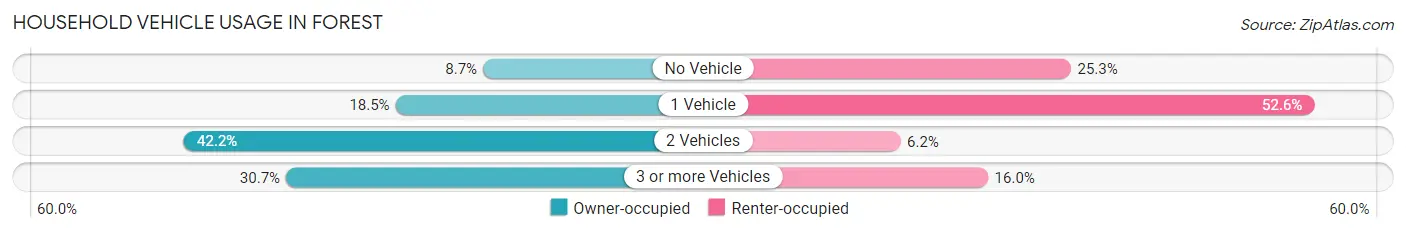
| Vehicles per Household | Owner-occupied | Renter-occupied |
| No Vehicle | 91 (8.7%) | 237 (25.3%) |
| 1 Vehicle | 194 (18.5%) | 493 (52.6%) |
| 2 Vehicles | 443 (42.1%) | 58 (6.2%) |
| 3 or more Vehicles | 323 (30.7%) | 150 (16.0%) |
| Total | 1,051 (100.0%) | 938 (100.0%) |
Real Estate & Mortgages in Forest
Real Estate and Mortgage Overview in Forest
| Characteristic | Without Mortgage | With Mortgage |
| Housing Units | 699 | 352 |
| Median Property Value | $101,800 | $137,200 |
| Median Household Income | $53,051 | $0 |
| Monthly Housing Costs | $390 | $7 |
| Real Estate Taxes | $760 | $29 |
Property Value by Mortgage Status in Forest
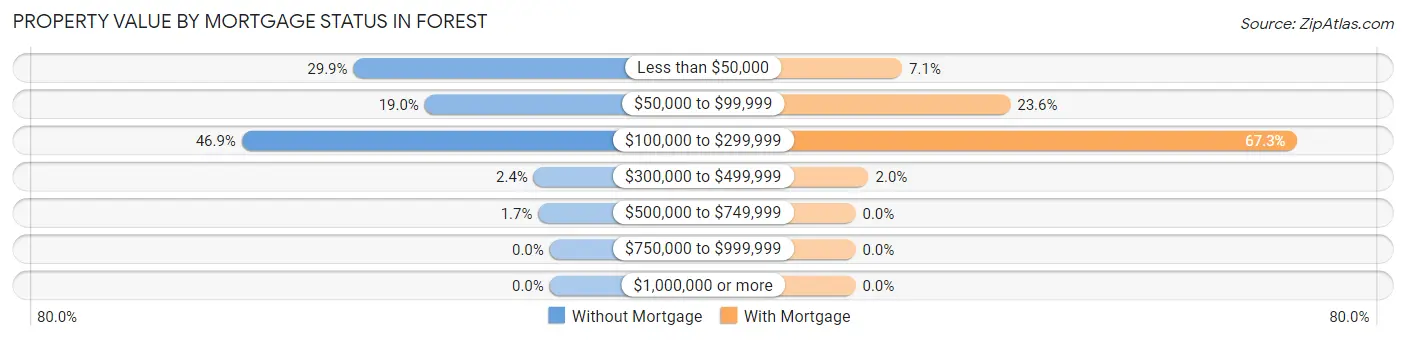
| Property Value | Without Mortgage | With Mortgage |
| Less than $50,000 | 209 (29.9%) | 25 (7.1%) |
| $50,000 to $99,999 | 133 (19.0%) | 83 (23.6%) |
| $100,000 to $299,999 | 328 (46.9%) | 237 (67.3%) |
| $300,000 to $499,999 | 17 (2.4%) | 7 (2.0%) |
| $500,000 to $749,999 | 12 (1.7%) | 0 (0.0%) |
| $750,000 to $999,999 | 0 (0.0%) | 0 (0.0%) |
| $1,000,000 or more | 0 (0.0%) | 0 (0.0%) |
| Total | 699 (100.0%) | 352 (100.0%) |
Household Income by Mortgage Status in Forest
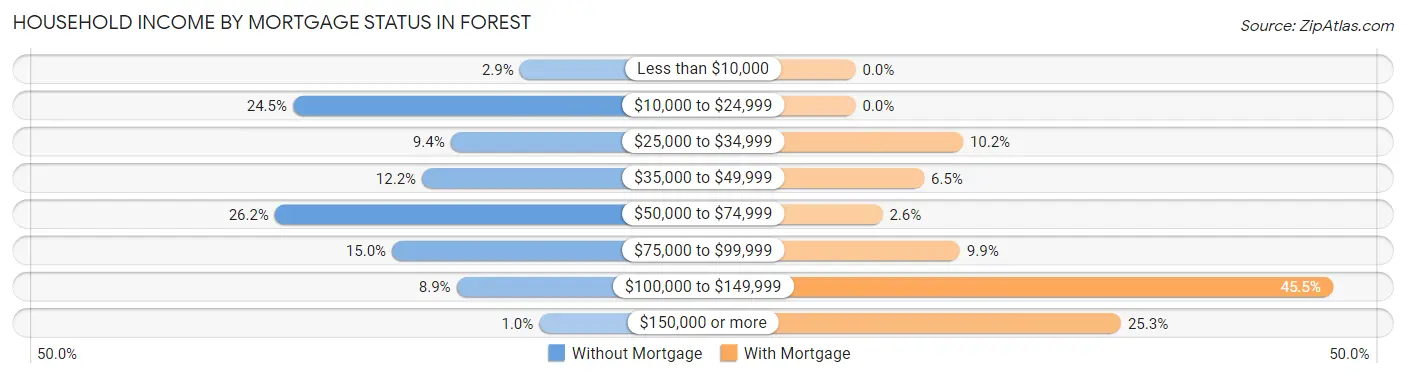
| Household Income | Without Mortgage | With Mortgage |
| Less than $10,000 | 20 (2.9%) | 0 (0.0%) |
| $10,000 to $24,999 | 171 (24.5%) | 0 (0.0%) |
| $25,000 to $34,999 | 66 (9.4%) | 36 (10.2%) |
| $35,000 to $49,999 | 85 (12.2%) | 23 (6.5%) |
| $50,000 to $74,999 | 183 (26.2%) | 9 (2.6%) |
| $75,000 to $99,999 | 105 (15.0%) | 35 (9.9%) |
| $100,000 to $149,999 | 62 (8.9%) | 160 (45.5%) |
| $150,000 or more | 7 (1.0%) | 89 (25.3%) |
| Total | 699 (100.0%) | 352 (100.0%) |
Property Value to Household Income Ratio in Forest
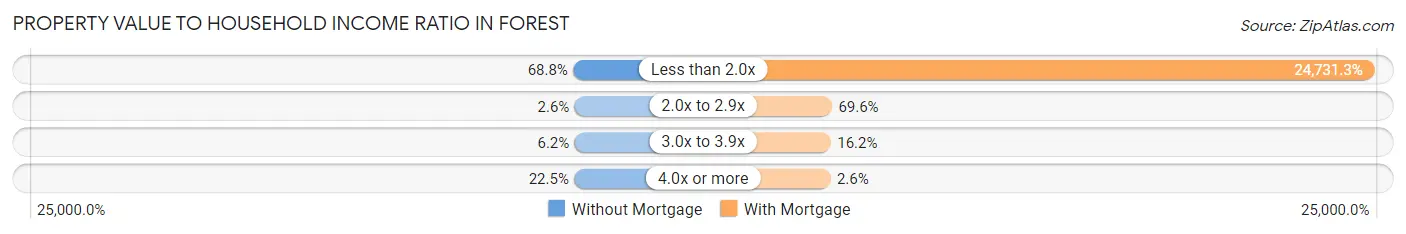
| Value-to-Income Ratio | Without Mortgage | With Mortgage |
| Less than 2.0x | 481 (68.8%) | 87,054 (24,731.2%) |
| 2.0x to 2.9x | 18 (2.6%) | 245 (69.6%) |
| 3.0x to 3.9x | 43 (6.1%) | 57 (16.2%) |
| 4.0x or more | 157 (22.5%) | 9 (2.6%) |
| Total | 699 (100.0%) | 352 (100.0%) |
Real Estate Taxes by Mortgage Status in Forest
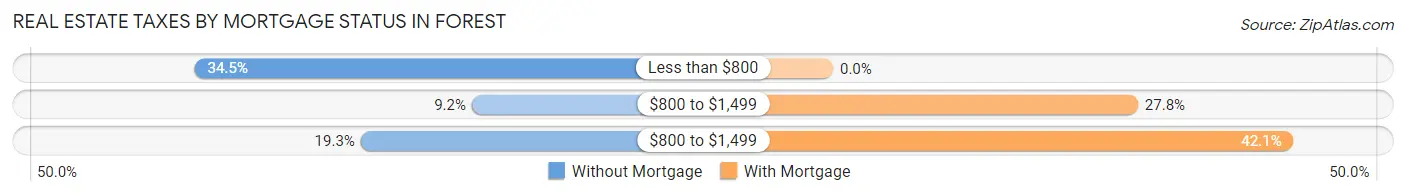
| Property Taxes | Without Mortgage | With Mortgage |
| Less than $800 | 241 (34.5%) | 0 (0.0%) |
| $800 to $1,499 | 64 (9.2%) | 98 (27.8%) |
| $800 to $1,499 | 135 (19.3%) | 148 (42.0%) |
| Total | 699 (100.0%) | 352 (100.0%) |
Health & Disability in Forest
Health Insurance Coverage by Age in Forest
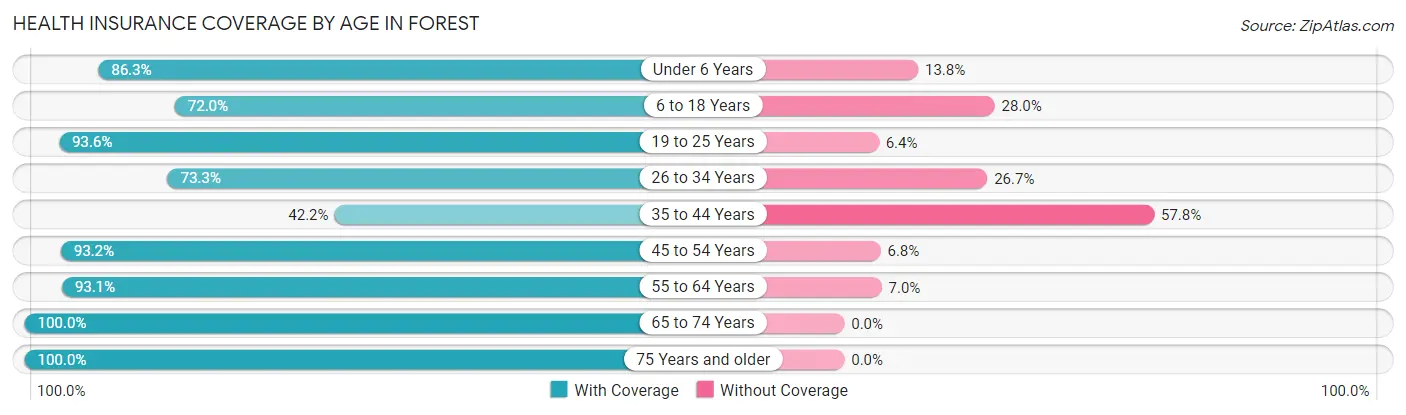
| Age Bracket | With Coverage | Without Coverage |
| Under 6 Years | 502 (86.3%) | 80 (13.8%) |
| 6 to 18 Years | 670 (72.0%) | 261 (28.0%) |
| 19 to 25 Years | 350 (93.6%) | 24 (6.4%) |
| 26 to 34 Years | 520 (73.3%) | 189 (26.7%) |
| 35 to 44 Years | 324 (42.2%) | 443 (57.8%) |
| 45 to 54 Years | 317 (93.2%) | 23 (6.8%) |
| 55 to 64 Years | 683 (93.0%) | 51 (7.0%) |
| 65 to 74 Years | 448 (100.0%) | 0 (0.0%) |
| 75 Years and older | 410 (100.0%) | 0 (0.0%) |
| Total | 4,224 (79.8%) | 1,071 (20.2%) |
Health Insurance Coverage by Citizenship Status in Forest
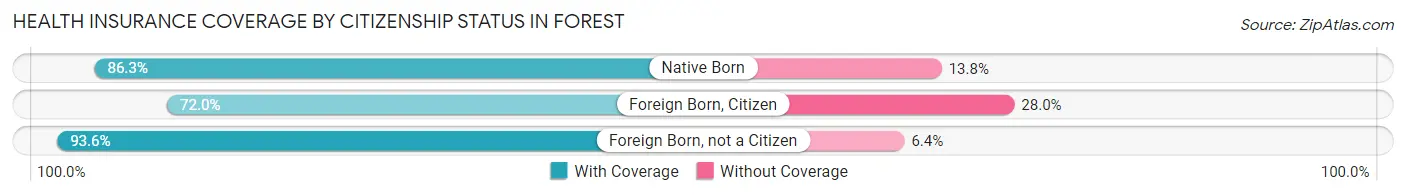
| Citizenship Status | With Coverage | Without Coverage |
| Native Born | 502 (86.3%) | 80 (13.8%) |
| Foreign Born, Citizen | 670 (72.0%) | 261 (28.0%) |
| Foreign Born, not a Citizen | 350 (93.6%) | 24 (6.4%) |
Health Insurance Coverage by Household Income in Forest
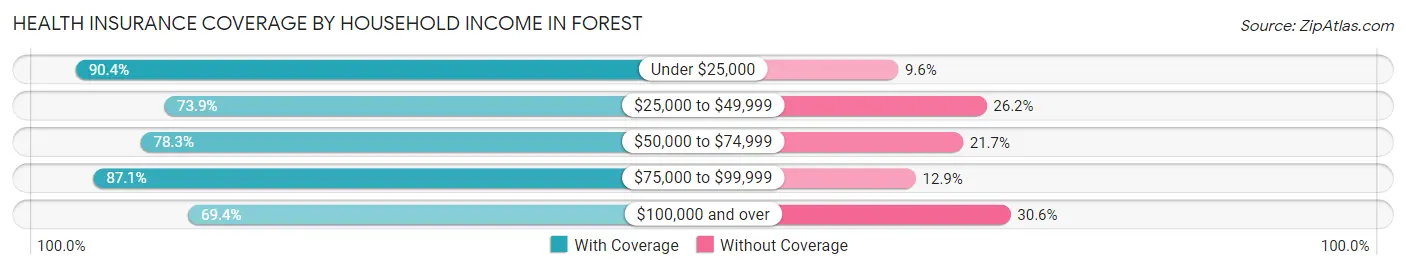
| Household Income | With Coverage | Without Coverage |
| Under $25,000 | 1,084 (90.4%) | 115 (9.6%) |
| $25,000 to $49,999 | 768 (73.9%) | 272 (26.2%) |
| $50,000 to $74,999 | 1,250 (78.3%) | 347 (21.7%) |
| $75,000 to $99,999 | 534 (87.1%) | 79 (12.9%) |
| $100,000 and over | 584 (69.4%) | 258 (30.6%) |
Public vs Private Health Insurance Coverage by Age in Forest
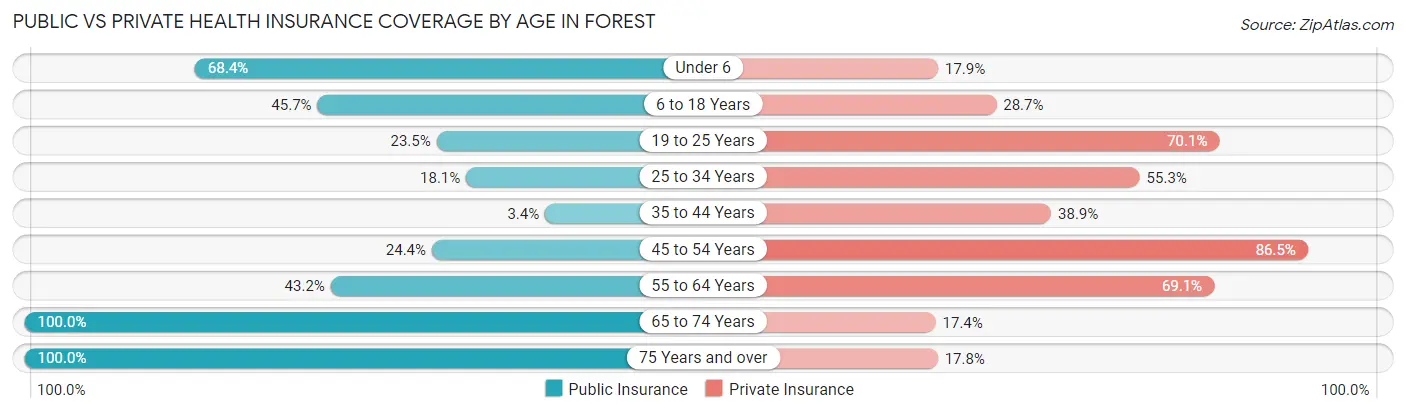
| Age Bracket | Public Insurance | Private Insurance |
| Under 6 | 398 (68.4%) | 104 (17.9%) |
| 6 to 18 Years | 425 (45.7%) | 267 (28.7%) |
| 19 to 25 Years | 88 (23.5%) | 262 (70.1%) |
| 25 to 34 Years | 128 (18.0%) | 392 (55.3%) |
| 35 to 44 Years | 26 (3.4%) | 298 (38.9%) |
| 45 to 54 Years | 83 (24.4%) | 294 (86.5%) |
| 55 to 64 Years | 317 (43.2%) | 507 (69.1%) |
| 65 to 74 Years | 448 (100.0%) | 78 (17.4%) |
| 75 Years and over | 410 (100.0%) | 73 (17.8%) |
| Total | 2,323 (43.9%) | 2,275 (43.0%) |
Disability Status by Sex by Age in Forest
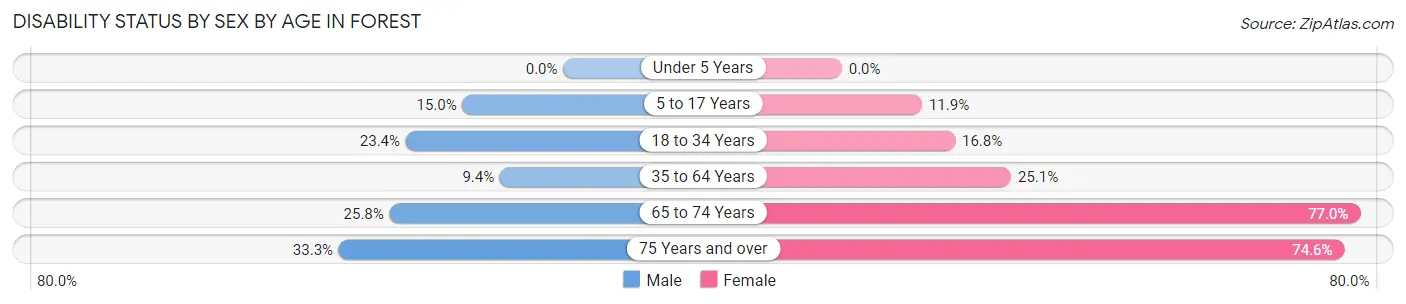
| Age Bracket | Male | Female |
| Under 5 Years | 0 (0.0%) | 0 (0.0%) |
| 5 to 17 Years | 67 (15.0%) | 33 (11.9%) |
| 18 to 34 Years | 149 (23.4%) | 111 (16.8%) |
| 35 to 64 Years | 81 (9.4%) | 246 (25.1%) |
| 65 to 74 Years | 73 (25.8%) | 127 (77.0%) |
| 75 Years and over | 50 (33.3%) | 194 (74.6%) |
Disability Class by Sex by Age in Forest
Disability Class: Hearing Difficulty
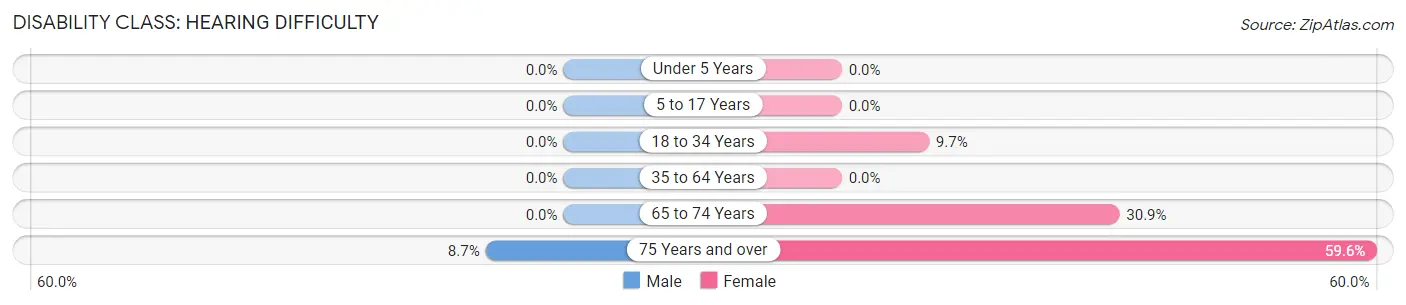
| Age Bracket | Male | Female |
| Under 5 Years | 0 (0.0%) | 0 (0.0%) |
| 5 to 17 Years | 0 (0.0%) | 0 (0.0%) |
| 18 to 34 Years | 0 (0.0%) | 64 (9.7%) |
| 35 to 64 Years | 0 (0.0%) | 0 (0.0%) |
| 65 to 74 Years | 0 (0.0%) | 51 (30.9%) |
| 75 Years and over | 13 (8.7%) | 155 (59.6%) |
Disability Class: Vision Difficulty
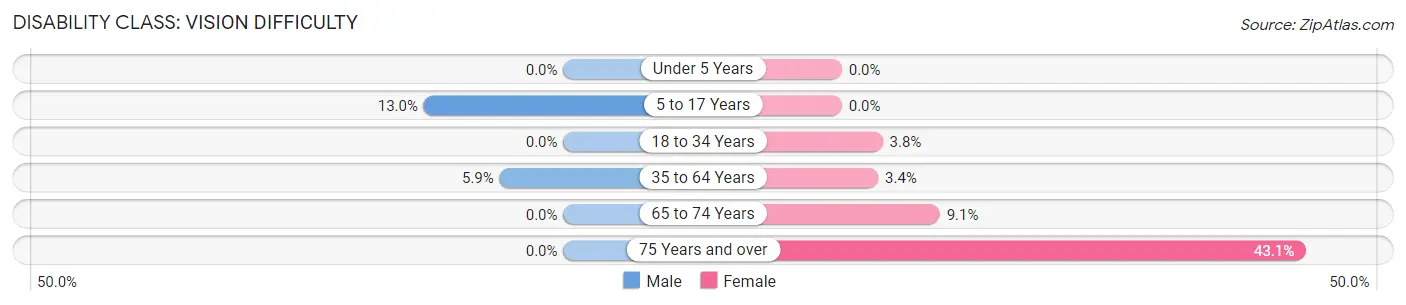
| Age Bracket | Male | Female |
| Under 5 Years | 0 (0.0%) | 0 (0.0%) |
| 5 to 17 Years | 58 (13.0%) | 0 (0.0%) |
| 18 to 34 Years | 0 (0.0%) | 25 (3.8%) |
| 35 to 64 Years | 51 (5.9%) | 33 (3.4%) |
| 65 to 74 Years | 0 (0.0%) | 15 (9.1%) |
| 75 Years and over | 0 (0.0%) | 112 (43.1%) |
Disability Class: Cognitive Difficulty
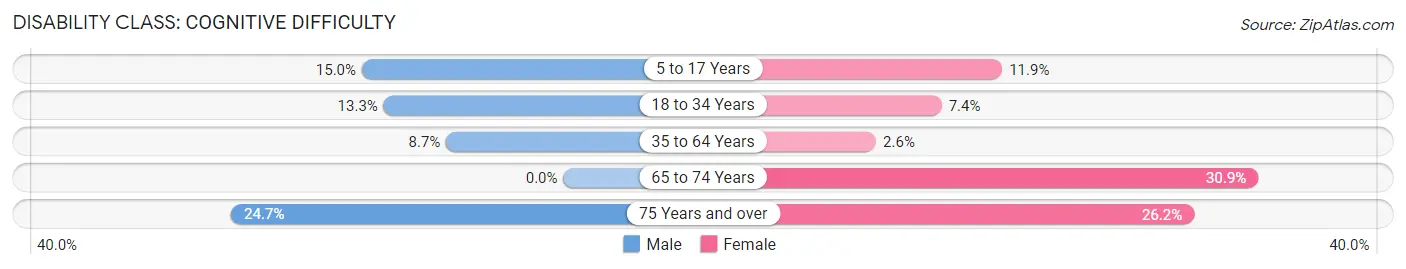
| Age Bracket | Male | Female |
| 5 to 17 Years | 67 (15.0%) | 33 (11.9%) |
| 18 to 34 Years | 85 (13.3%) | 49 (7.4%) |
| 35 to 64 Years | 75 (8.7%) | 25 (2.5%) |
| 65 to 74 Years | 0 (0.0%) | 51 (30.9%) |
| 75 Years and over | 37 (24.7%) | 68 (26.2%) |
Disability Class: Ambulatory Difficulty
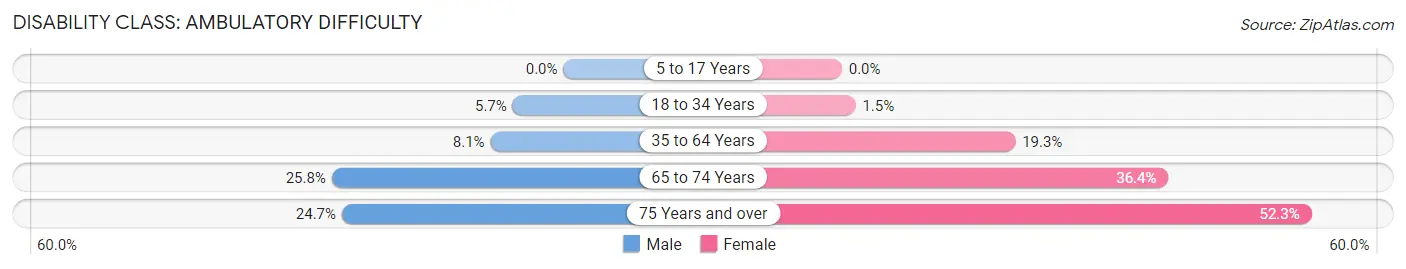
| Age Bracket | Male | Female |
| 5 to 17 Years | 0 (0.0%) | 0 (0.0%) |
| 18 to 34 Years | 36 (5.7%) | 10 (1.5%) |
| 35 to 64 Years | 70 (8.1%) | 189 (19.3%) |
| 65 to 74 Years | 73 (25.8%) | 60 (36.4%) |
| 75 Years and over | 37 (24.7%) | 136 (52.3%) |
Disability Class: Self-Care Difficulty
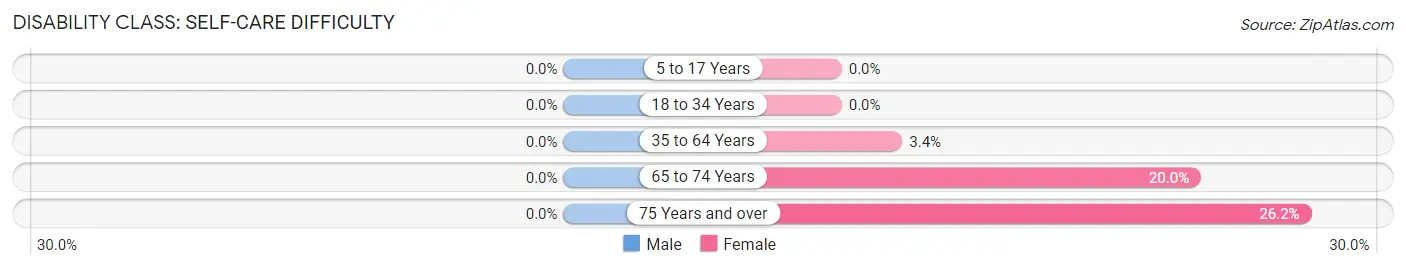
| Age Bracket | Male | Female |
| 5 to 17 Years | 0 (0.0%) | 0 (0.0%) |
| 18 to 34 Years | 0 (0.0%) | 0 (0.0%) |
| 35 to 64 Years | 0 (0.0%) | 33 (3.4%) |
| 65 to 74 Years | 0 (0.0%) | 33 (20.0%) |
| 75 Years and over | 0 (0.0%) | 68 (26.2%) |
Technology Access in Forest
Computing Device Access in Forest
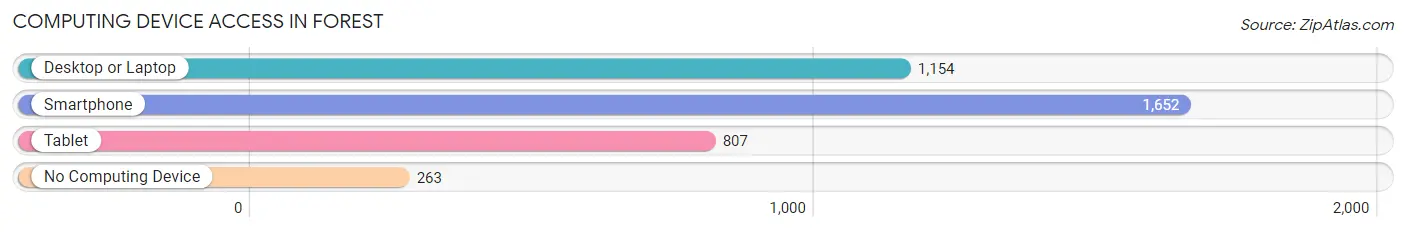
| Device Type | # Households | % Households |
| Desktop or Laptop | 1,154 | 58.0% |
| Smartphone | 1,652 | 83.1% |
| Tablet | 807 | 40.6% |
| No Computing Device | 263 | 13.2% |
| Total | 1,989 | 100.0% |
Internet Access in Forest
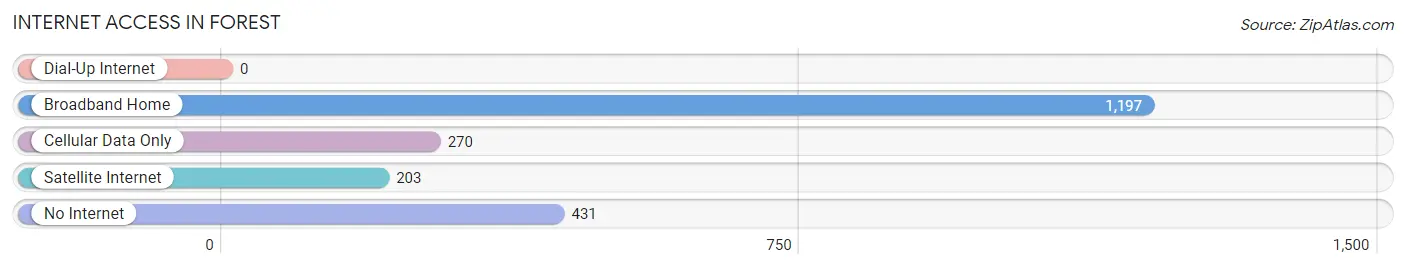
| Internet Type | # Households | % Households |
| Dial-Up Internet | 0 | 0.0% |
| Broadband Home | 1,197 | 60.2% |
| Cellular Data Only | 270 | 13.6% |
| Satellite Internet | 203 | 10.2% |
| No Internet | 431 | 21.7% |
| Total | 1,989 | 100.0% |
Forest Summary
Forest, Mississippi is a small city located in Scott County, Mississippi. It is situated in the northeastern part of the state, approximately 20 miles south of the state capital, Jackson. The city has a population of approximately 5,000 people and is part of the Jackson Metropolitan Statistical Area.
History
The area that is now Forest was first settled in the early 1800s by settlers from the Choctaw Nation. The town was originally known as “Chickasawhay” and was located near the Chickasawhay River. In 1837, the town was renamed “Forest” after the nearby forest.
In the late 1800s, the town began to grow and develop. The first post office was established in 1887 and the first school was built in 1889. The town was incorporated in 1895 and the first mayor was elected in 1896.
In the early 1900s, the town continued to grow and develop. The first bank was established in 1906 and the first newspaper was published in 1907. The town also had a cotton gin, a sawmill, and a gristmill.
In the mid-1900s, the town experienced a period of decline. The cotton gin and sawmill closed in the 1940s and the gristmill closed in the 1950s. The population of the town began to decline as well.
In the late 1900s, the town began to experience a period of revitalization. The population began to increase and new businesses began to open. The town also began to attract new residents and visitors.
Geography
Forest is located in the northeastern part of Mississippi, approximately 20 miles south of the state capital, Jackson. The city is situated in the rolling hills of the Piney Woods region of the state. The city is located near the Chickasawhay River and is surrounded by forests and farmland.
The climate in Forest is humid subtropical, with hot, humid summers and mild winters. The average annual temperature is around 70 degrees Fahrenheit. The average annual precipitation is around 50 inches.
Economy
The economy of Forest is largely based on agriculture and forestry. The city is home to several farms and timber companies. The city also has a few small businesses, including restaurants, retail stores, and service providers.
The city is also home to a few manufacturing companies, including a furniture factory and a plastics factory. The city is also home to a few educational institutions, including a community college and a technical college.
Demographics
As of the 2010 census, the population of Forest was 5,039. The racial makeup of the city was 79.3% White, 17.7% African American, 0.3% Native American, 0.3% Asian, 0.1% Pacific Islander, 0.7% from other races, and 1.9% from two or more races. Hispanic or Latino of any race were 2.2% of the population.
The median household income in Forest was $30,938, and the median family income was $37,917. The per capita income in Forest was $15,945. About 17.2% of families and 20.7% of the population were below the poverty line, including 28.2% of those under age 18 and 16.2% of those age 65 or over.
Common Questions
What is Per Capita Income in Forest?
Per Capita income in Forest is $21,007.
What is the Median Family Income in Forest?
Median Family Income in Forest is $52,486.
What is the Median Household income in Forest?
Median Household Income in Forest is $50,093.
What is Income or Wage Gap in Forest?
Income or Wage Gap in Forest is 16.5%.
Women in Forest earn 83.5 cents for every dollar earned by a man.
What is Inequality or Gini Index in Forest?
Inequality or Gini Index in Forest is 0.43.
What is the Total Population of Forest?
Total Population of Forest is 5,416.
What is the Total Male Population of Forest?
Total Male Population of Forest is 2,901.
What is the Total Female Population of Forest?
Total Female Population of Forest is 2,515.
What is the Ratio of Males per 100 Females in Forest?
There are 115.35 Males per 100 Females in Forest.
What is the Ratio of Females per 100 Males in Forest?
There are 86.69 Females per 100 Males in Forest.
What is the Median Population Age in Forest?
Median Population Age in Forest is 36.4 Years.
What is the Average Family Size in Forest
Average Family Size in Forest is 3.5 People.
What is the Average Household Size in Forest
Average Household Size in Forest is 2.7 People.
How Large is the Labor Force in Forest?
There are 2,140 People in the Labor Forcein in Forest.
What is the Percentage of People in the Labor Force in Forest?
50.1% of People are in the Labor Force in Forest.
What is the Unemployment Rate in Forest?
Unemployment Rate in Forest is 7.1%.