Farrell, MS Map & Demographics
Farrell Map
Farrell Overview
$23,113
PER CAPITA INCOME
$36,815
AVG FAMILY INCOME
$43,125
AVG HOUSEHOLD INCOME
17.2%
WAGE / INCOME GAP [ % ]
82.8¢/ $1
WAGE / INCOME GAP [ $ ]
0.23
INEQUALITY / GINI INDEX
265
TOTAL POPULATION
102
MALE POPULATION
163
FEMALE POPULATION
62.58
MALES / 100 FEMALES
159.80
FEMALES / 100 MALES
37.1
MEDIAN AGE
2.8
AVG FAMILY SIZE
2.2
AVG HOUSEHOLD SIZE
114
LABOR FORCE [ PEOPLE ]
69.1%
PERCENT IN LABOR FORCE
3.5%
UNEMPLOYMENT RATE
Farrell Area Codes
Income in Farrell
Income Overview in Farrell
Per Capita Income in Farrell is $23,113, while median incomes of families and households are $36,815 and $43,125 respectively.
| Characteristic | Number | Measure |
| Per Capita Income | 265 | $23,113 |
| Median Family Income | 75 | $36,815 |
| Mean Family Income | 75 | $47,380 |
| Median Household Income | 122 | $43,125 |
| Mean Household Income | 122 | $49,905 |
| Income Deficit | 75 | $0 |
| Wage / Income Gap (%) | 265 | 17.24% |
| Wage / Income Gap ($) | 265 | 82.76¢ per $1 |
| Gini / Inequality Index | 265 | 0.23 |
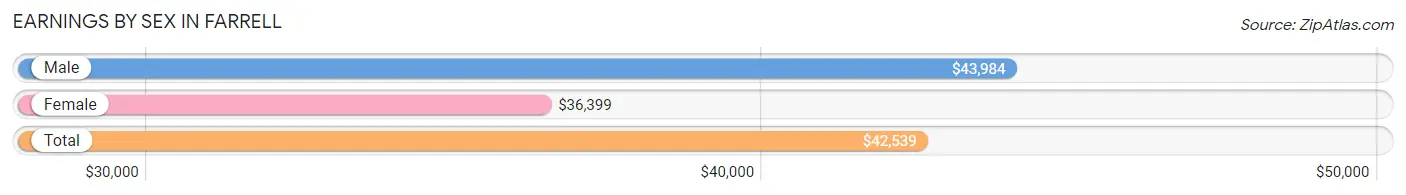
Earnings by Sex in Farrell
Average Earnings in Farrell are $42,539, $43,984 for men and $36,399 for women, a difference of 17.2%.
| Sex | Number | Average Earnings |
| Male | 56 (43.4%) | $43,984 |
| Female | 73 (56.6%) | $36,399 |
| Total | 129 (100.0%) | $42,539 |
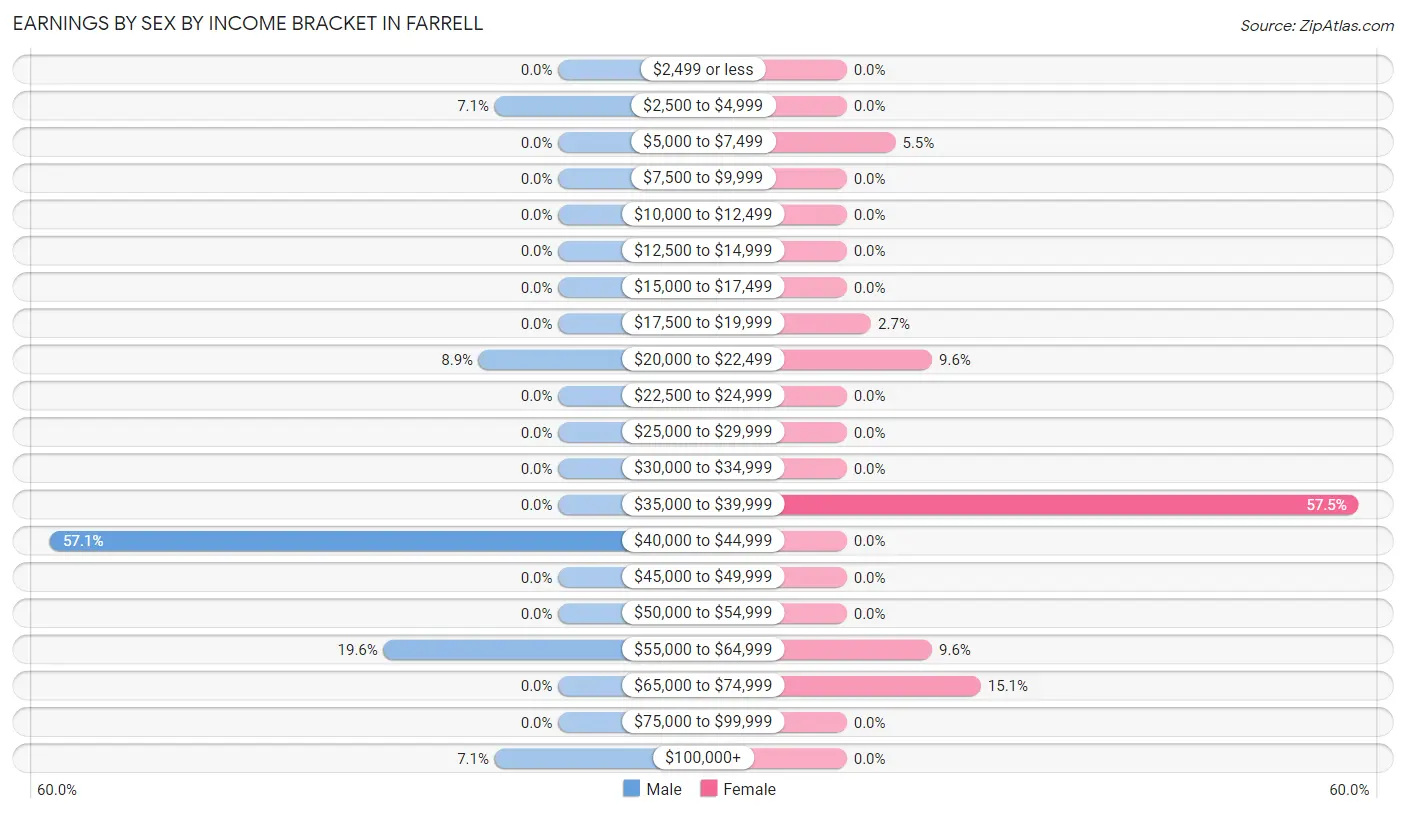
Earnings by Sex by Income Bracket in Farrell
The most common earnings brackets in Farrell are $40,000 to $44,999 for men (32 | 57.1%) and $35,000 to $39,999 for women (42 | 57.5%).
| Income | Male | Female |
| $2,499 or less | 0 (0.0%) | 0 (0.0%) |
| $2,500 to $4,999 | 4 (7.1%) | 0 (0.0%) |
| $5,000 to $7,499 | 0 (0.0%) | 4 (5.5%) |
| $7,500 to $9,999 | 0 (0.0%) | 0 (0.0%) |
| $10,000 to $12,499 | 0 (0.0%) | 0 (0.0%) |
| $12,500 to $14,999 | 0 (0.0%) | 0 (0.0%) |
| $15,000 to $17,499 | 0 (0.0%) | 0 (0.0%) |
| $17,500 to $19,999 | 0 (0.0%) | 2 (2.7%) |
| $20,000 to $22,499 | 5 (8.9%) | 7 (9.6%) |
| $22,500 to $24,999 | 0 (0.0%) | 0 (0.0%) |
| $25,000 to $29,999 | 0 (0.0%) | 0 (0.0%) |
| $30,000 to $34,999 | 0 (0.0%) | 0 (0.0%) |
| $35,000 to $39,999 | 0 (0.0%) | 42 (57.5%) |
| $40,000 to $44,999 | 32 (57.1%) | 0 (0.0%) |
| $45,000 to $49,999 | 0 (0.0%) | 0 (0.0%) |
| $50,000 to $54,999 | 0 (0.0%) | 0 (0.0%) |
| $55,000 to $64,999 | 11 (19.6%) | 7 (9.6%) |
| $65,000 to $74,999 | 0 (0.0%) | 11 (15.1%) |
| $75,000 to $99,999 | 0 (0.0%) | 0 (0.0%) |
| $100,000+ | 4 (7.1%) | 0 (0.0%) |
| Total | 56 (100.0%) | 73 (100.0%) |
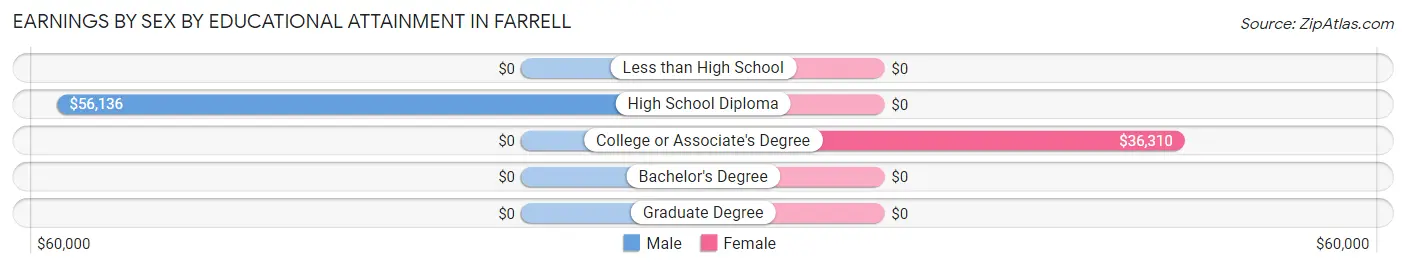
Earnings by Sex by Educational Attainment in Farrell
Average earnings in Farrell are $43,984 for men and $36,399 for women, a difference of 17.2%. Men with an educational attainment of high school diploma enjoy the highest average annual earnings of $56,136, while those with high school diploma education earn the least with $56,136. Women with an educational attainment of college or associate's degree earn the most with the average annual earnings of $36,310, while those with college or associate's degree education have the smallest earnings of $36,310.
| Educational Attainment | Male Income | Female Income |
| Less than High School | - | - |
| High School Diploma | $56,136 | $0 |
| College or Associate's Degree | - | - |
| Bachelor's Degree | - | - |
| Graduate Degree | - | - |
| Total | $43,984 | $36,399 |
Family Income in Farrell
Family Income Brackets in Farrell
According to the Farrell family income data, there are 45 families falling into the $35,000 to $49,999 income range, which is the most common income bracket and makes up 60.0% of all families.
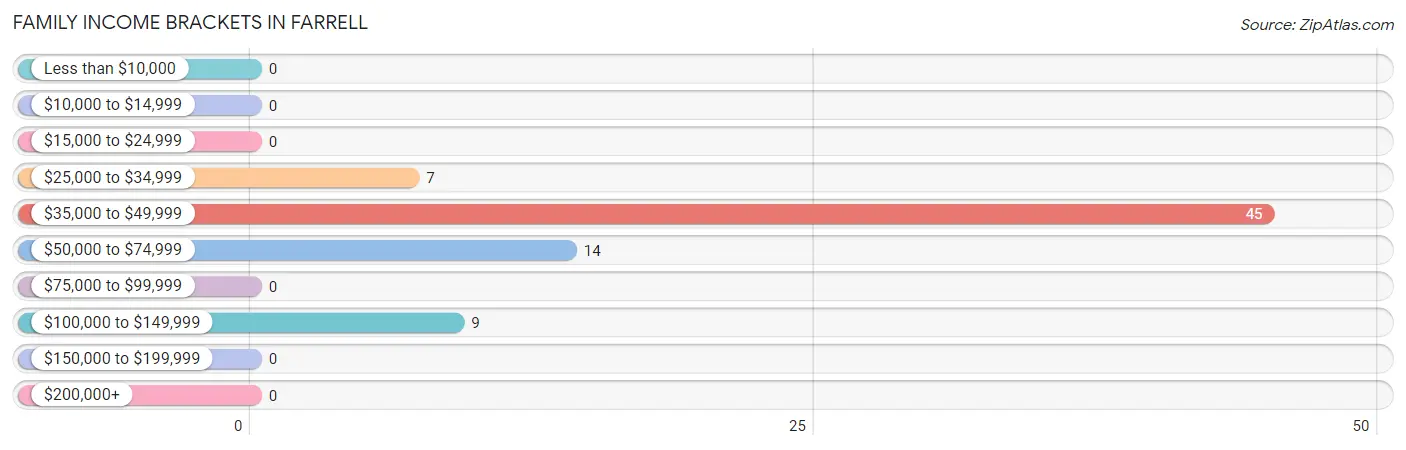
| Income Bracket | # Families | % Families |
| Less than $10,000 | 0 | 0.0% |
| $10,000 to $14,999 | 0 | 0.0% |
| $15,000 to $24,999 | 0 | 0.0% |
| $25,000 to $34,999 | 7 | 9.3% |
| $35,000 to $49,999 | 45 | 60.0% |
| $50,000 to $74,999 | 14 | 18.7% |
| $75,000 to $99,999 | 0 | 0.0% |
| $100,000 to $149,999 | 9 | 12.0% |
| $150,000 to $199,999 | 0 | 0.0% |
| $200,000+ | 0 | 0.0% |
Family Income by Famaliy Size in Farrell
2-person families (53 | 70.7%) account for the highest median family income in Farrell with $36,161 per family, while 2-person families (53 | 70.7%) have the highest median income of $18,080 per family member.
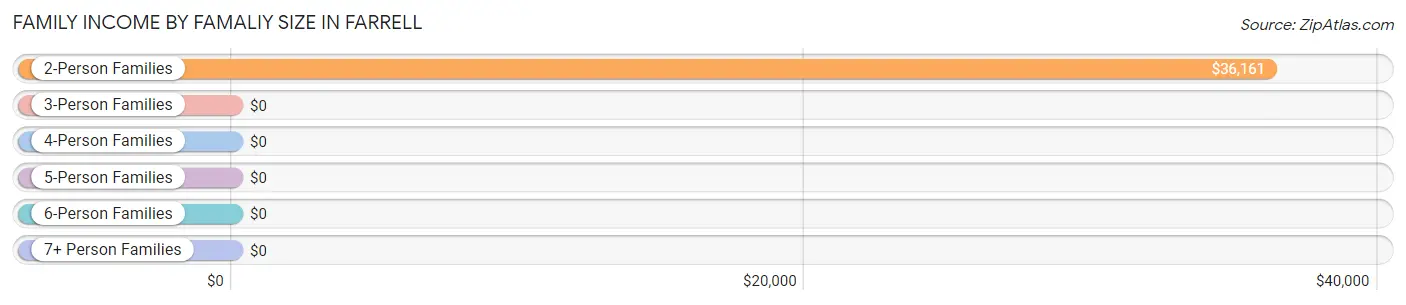
| Income Bracket | # Families | Median Income |
| 2-Person Families | 53 (70.7%) | $36,161 |
| 3-Person Families | 8 (10.7%) | $0 |
| 4-Person Families | 0 (0.0%) | $0 |
| 5-Person Families | 11 (14.7%) | $0 |
| 6-Person Families | 0 (0.0%) | $0 |
| 7+ Person Families | 3 (4.0%) | $0 |
| Total | 75 (100.0%) | $36,815 |
Family Income by Number of Earners in Farrell
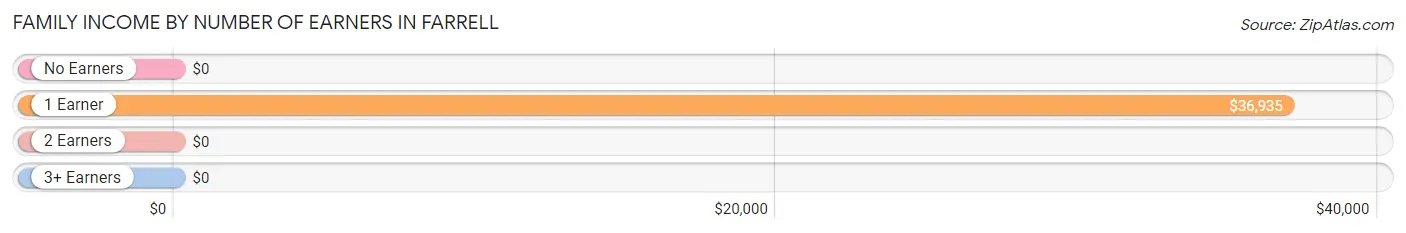
| Number of Earners | # Families | Median Income |
| No Earners | 7 (9.3%) | $0 |
| 1 Earner | 65 (86.7%) | $36,935 |
| 2 Earners | 0 (0.0%) | $0 |
| 3+ Earners | 3 (4.0%) | $0 |
| Total | 75 (100.0%) | $36,815 |
Household Income in Farrell
Household Income Brackets in Farrell
With 77 households falling in the category, the $35,000 to $49,999 income range is the most frequent in Farrell, accounting for 63.1% of all households.
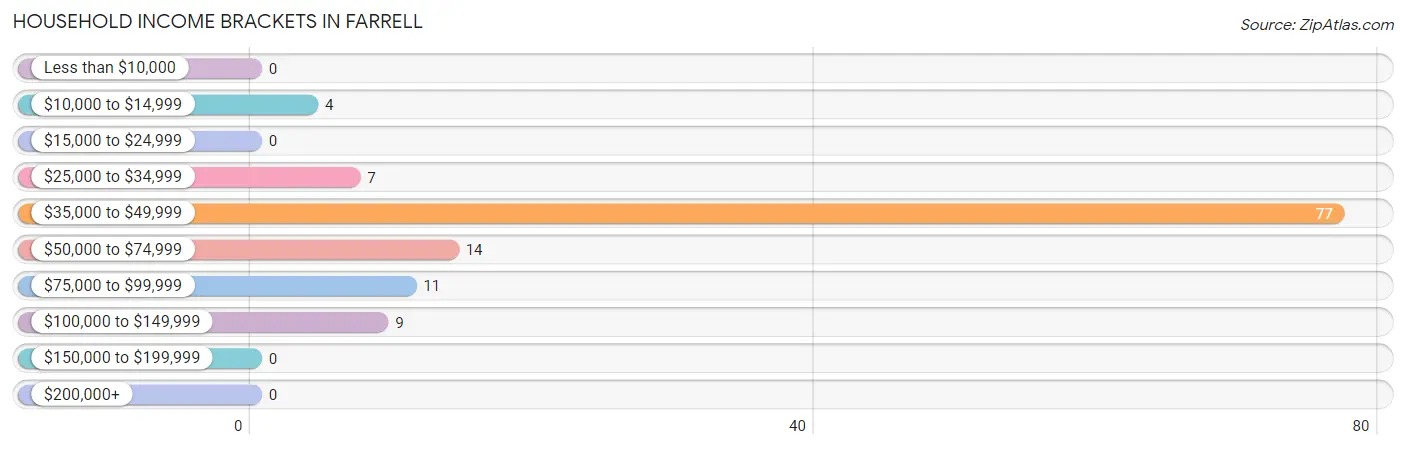
| Income Bracket | # Households | % Households |
| Less than $10,000 | 0 | 0.0% |
| $10,000 to $14,999 | 4 | 3.3% |
| $15,000 to $24,999 | 0 | 0.0% |
| $25,000 to $34,999 | 7 | 5.7% |
| $35,000 to $49,999 | 77 | 63.1% |
| $50,000 to $74,999 | 14 | 11.5% |
| $75,000 to $99,999 | 11 | 9.0% |
| $100,000 to $149,999 | 9 | 7.4% |
| $150,000 to $199,999 | 0 | 0.0% |
| $200,000+ | 0 | 0.0% |
Household Income by Householder Age in Farrell
The median household income in Farrell is $43,125, with the highest median household income of $44,648 found in the 45 to 64 years age bracket for the primary householder. A total of 55 households (45.1%) fall into this category.
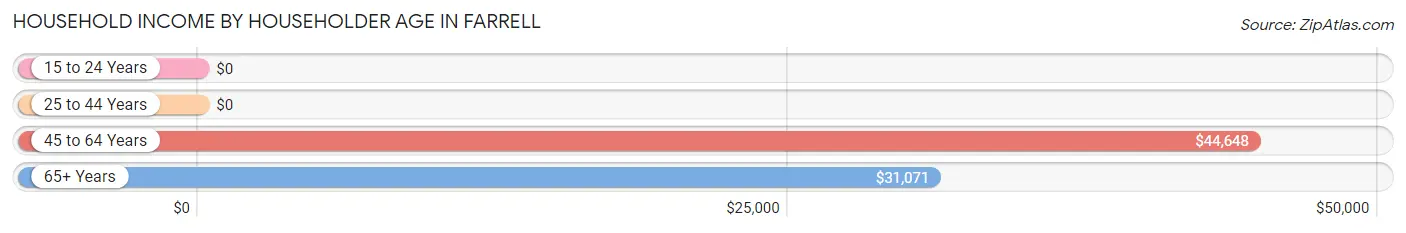
| Income Bracket | # Households | Median Income |
| 15 to 24 Years | 0 (0.0%) | $0 |
| 25 to 44 Years | 53 (43.4%) | $0 |
| 45 to 64 Years | 55 (45.1%) | $44,648 |
| 65+ Years | 14 (11.5%) | $31,071 |
| Total | 122 (100.0%) | $43,125 |
Poverty in Farrell
Income Below Poverty by Sex and Age in Farrell
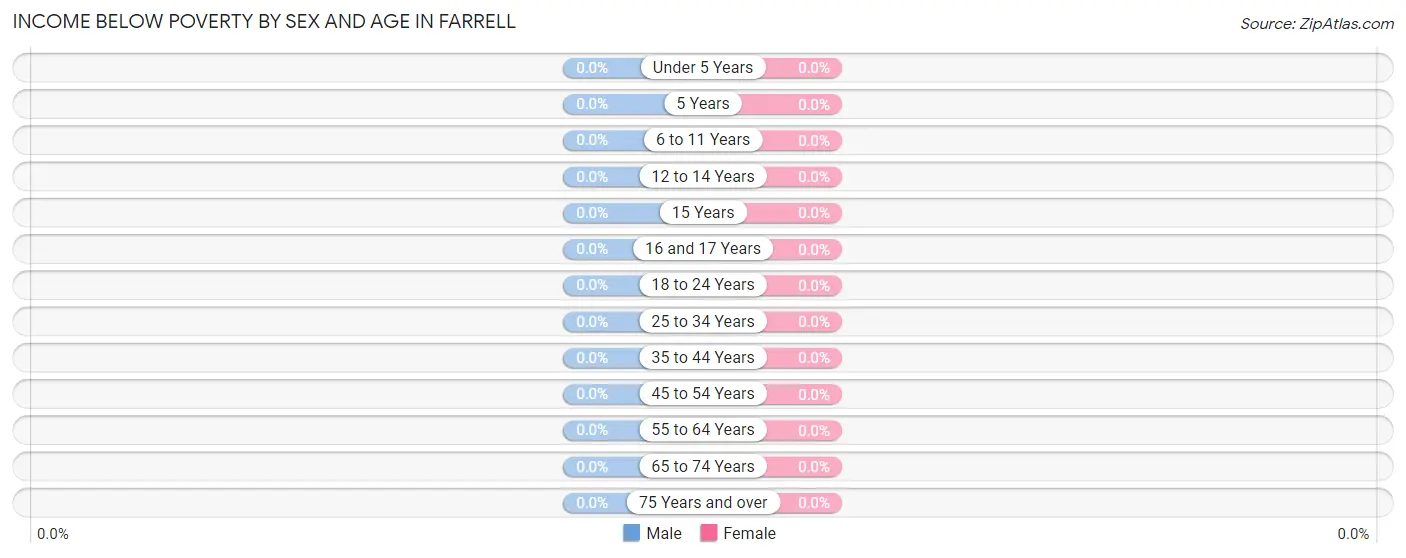
| Age Bracket | Male | Female |
| Under 5 Years | 0 (0.0%) | 0 (0.0%) |
| 5 Years | 0 (0.0%) | 0 (0.0%) |
| 6 to 11 Years | 0 (0.0%) | 0 (0.0%) |
| 12 to 14 Years | 0 (0.0%) | 0 (0.0%) |
| 15 Years | 0 (0.0%) | 0 (0.0%) |
| 16 and 17 Years | 0 (0.0%) | 0 (0.0%) |
| 18 to 24 Years | 0 (0.0%) | 0 (0.0%) |
| 25 to 34 Years | 0 (0.0%) | 0 (0.0%) |
| 35 to 44 Years | 0 (0.0%) | 0 (0.0%) |
| 45 to 54 Years | 0 (0.0%) | 0 (0.0%) |
| 55 to 64 Years | 0 (0.0%) | 0 (0.0%) |
| 65 to 74 Years | 0 (0.0%) | 0 (0.0%) |
| 75 Years and over | 0 (0.0%) | 0 (0.0%) |
| Total | 0 (0.0%) | 0 (0.0%) |
Income Above Poverty by Sex and Age in Farrell
According to the poverty statistics in Farrell, males aged under 5 years and females aged under 5 years are the age groups that are most secure financially, with 100.0% of males and 100.0% of females in these age groups living above the poverty line.
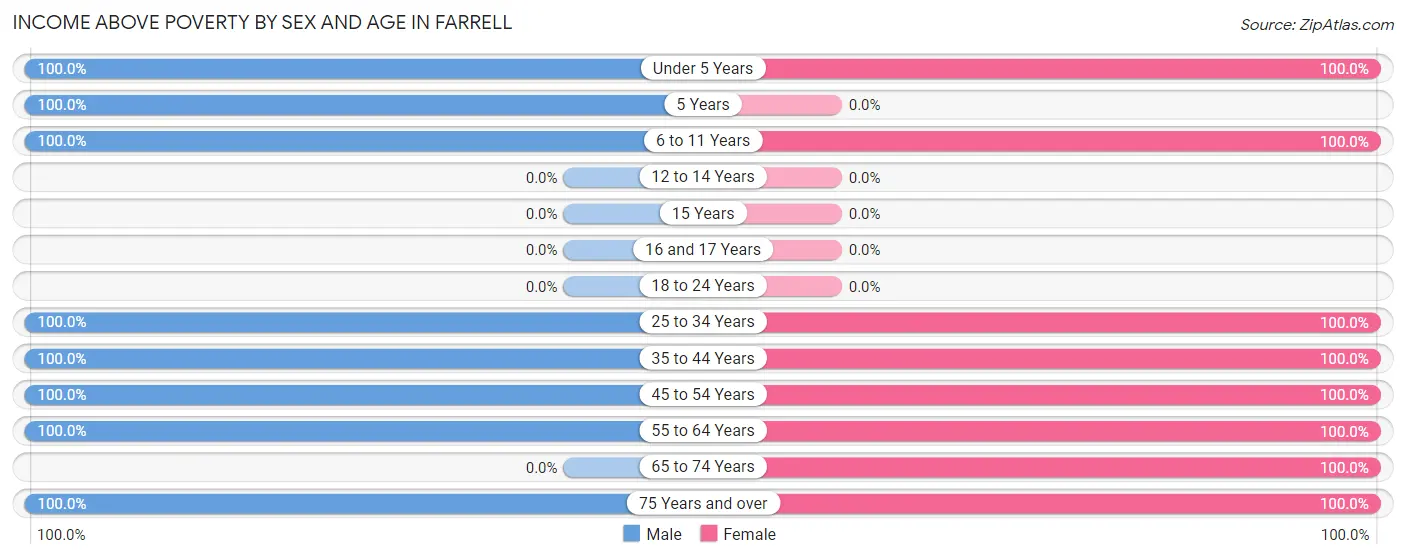
| Age Bracket | Male | Female |
| Under 5 Years | 3 (100.0%) | 25 (100.0%) |
| 5 Years | 9 (100.0%) | 0 (0.0%) |
| 6 to 11 Years | 18 (100.0%) | 45 (100.0%) |
| 12 to 14 Years | 0 (0.0%) | 0 (0.0%) |
| 15 Years | 0 (0.0%) | 0 (0.0%) |
| 16 and 17 Years | 0 (0.0%) | 0 (0.0%) |
| 18 to 24 Years | 0 (0.0%) | 0 (0.0%) |
| 25 to 34 Years | 11 (100.0%) | 18 (100.0%) |
| 35 to 44 Years | 4 (100.0%) | 42 (100.0%) |
| 45 to 54 Years | 36 (100.0%) | 4 (100.0%) |
| 55 to 64 Years | 8 (100.0%) | 18 (100.0%) |
| 65 to 74 Years | 0 (0.0%) | 7 (100.0%) |
| 75 Years and over | 13 (100.0%) | 4 (100.0%) |
| Total | 102 (100.0%) | 163 (100.0%) |
Income Below Poverty Among Married-Couple Families in Farrell
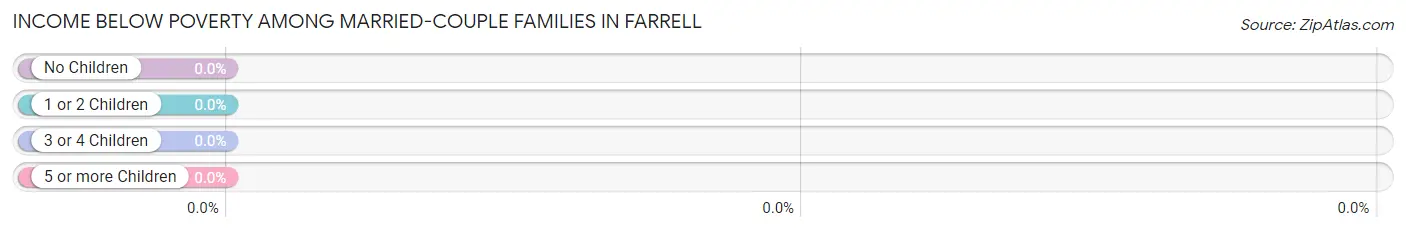
| Children | Above Poverty | Below Poverty |
| No Children | 14 (100.0%) | 0 (0.0%) |
| 1 or 2 Children | 0 (0.0%) | 0 (0.0%) |
| 3 or 4 Children | 3 (100.0%) | 0 (0.0%) |
| 5 or more Children | 0 (0.0%) | 0 (0.0%) |
| Total | 17 (100.0%) | 0 (0.0%) |
Income Below Poverty Among Single-Parent Households in Farrell
| Children | Single Father | Single Mother |
| No Children | 0 (0.0%) | 0 (0.0%) |
| 1 or 2 Children | 0 (0.0%) | 0 (0.0%) |
| 3 or 4 Children | 0 (0.0%) | 0 (0.0%) |
| 5 or more Children | 0 (0.0%) | 0 (0.0%) |
| Total | 0 (0.0%) | 0 (0.0%) |
Income Below Poverty Among Married-Couple vs Single-Parent Households in Farrell
| Children | Married-Couple Families | Single-Parent Households |
| No Children | 0 (0.0%) | 0 (0.0%) |
| 1 or 2 Children | 0 (0.0%) | 0 (0.0%) |
| 3 or 4 Children | 0 (0.0%) | 0 (0.0%) |
| 5 or more Children | 0 (0.0%) | 0 (0.0%) |
| Total | 0 (0.0%) | 0 (0.0%) |
Race in Farrell
The most populous races in Farrell are Black / African American (257 | 97.0%), and White / Caucasian (8 | 3.0%).
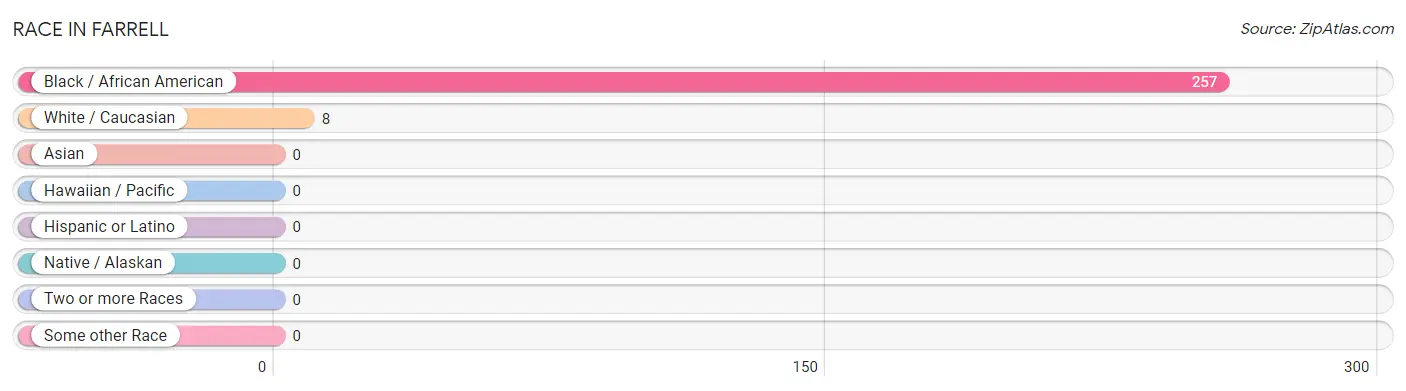
| Race | # Population | % Population |
| Asian | 0 | 0.0% |
| Black / African American | 257 | 97.0% |
| Hawaiian / Pacific | 0 | 0.0% |
| Hispanic or Latino | 0 | 0.0% |
| Native / Alaskan | 0 | 0.0% |
| White / Caucasian | 8 | 3.0% |
| Two or more Races | 0 | 0.0% |
| Some other Race | 0 | 0.0% |
| Total | 265 | 100.0% |
Ancestry in Farrell

| Ancestry | # Population | % Population | View All 0 Rows |
Immigrants in Farrell

| Immigration Origin | # Population | % Population | View All 0 Rows |
Sex and Age in Farrell
Sex and Age in Farrell
The most populous age groups in Farrell are 45 to 49 Years (36 | 35.3%) for men and 10 to 14 Years (45 | 27.6%) for women.
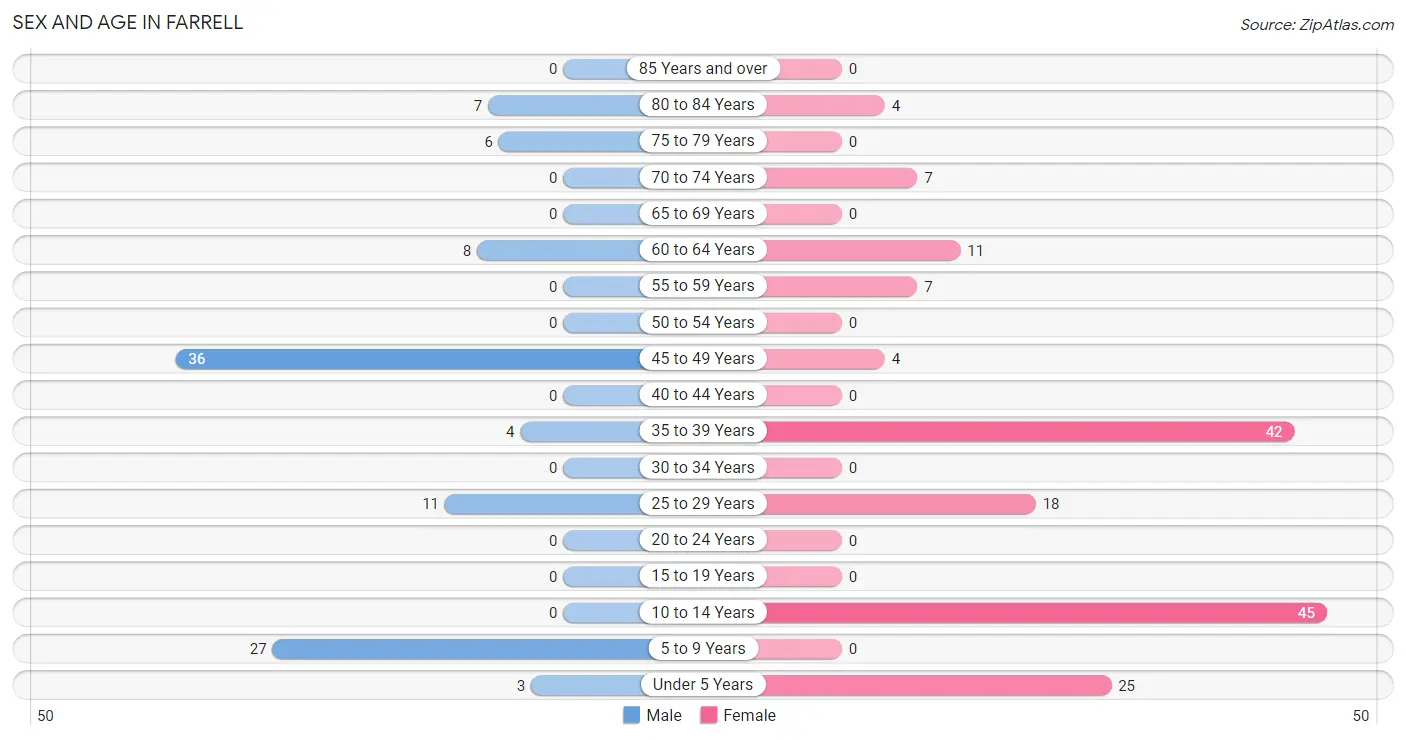
| Age Bracket | Male | Female |
| Under 5 Years | 3 (2.9%) | 25 (15.3%) |
| 5 to 9 Years | 27 (26.5%) | 0 (0.0%) |
| 10 to 14 Years | 0 (0.0%) | 45 (27.6%) |
| 15 to 19 Years | 0 (0.0%) | 0 (0.0%) |
| 20 to 24 Years | 0 (0.0%) | 0 (0.0%) |
| 25 to 29 Years | 11 (10.8%) | 18 (11.0%) |
| 30 to 34 Years | 0 (0.0%) | 0 (0.0%) |
| 35 to 39 Years | 4 (3.9%) | 42 (25.8%) |
| 40 to 44 Years | 0 (0.0%) | 0 (0.0%) |
| 45 to 49 Years | 36 (35.3%) | 4 (2.5%) |
| 50 to 54 Years | 0 (0.0%) | 0 (0.0%) |
| 55 to 59 Years | 0 (0.0%) | 7 (4.3%) |
| 60 to 64 Years | 8 (7.8%) | 11 (6.8%) |
| 65 to 69 Years | 0 (0.0%) | 0 (0.0%) |
| 70 to 74 Years | 0 (0.0%) | 7 (4.3%) |
| 75 to 79 Years | 6 (5.9%) | 0 (0.0%) |
| 80 to 84 Years | 7 (6.9%) | 4 (2.5%) |
| 85 Years and over | 0 (0.0%) | 0 (0.0%) |
| Total | 102 (100.0%) | 163 (100.0%) |
Families and Households in Farrell
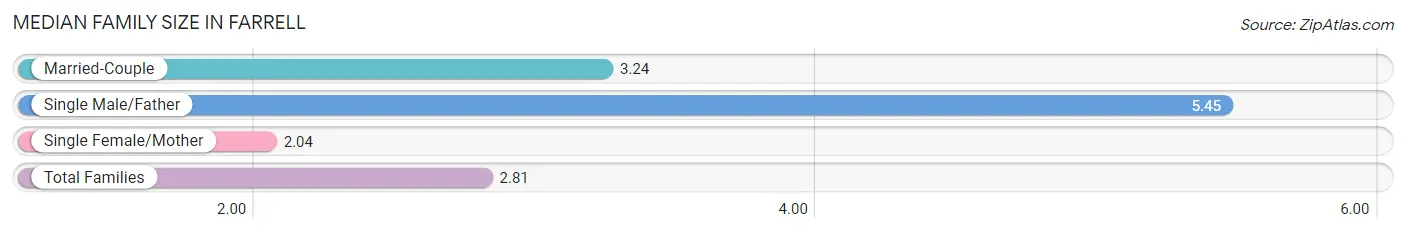
Median Family Size in Farrell
The median family size in Farrell is 2.81 persons per family, with single male/father families (11 | 14.7%) accounting for the largest median family size of 5.45 persons per family. On the other hand, single female/mother families (47 | 62.7%) represent the smallest median family size with 2.04 persons per family.
| Family Type | # Families | Family Size |
| Married-Couple | 17 (22.7%) | 3.24 |
| Single Male/Father | 11 (14.7%) | 5.45 |
| Single Female/Mother | 47 (62.7%) | 2.04 |
| Total Families | 75 (100.0%) | 2.81 |
Median Household Size in Farrell
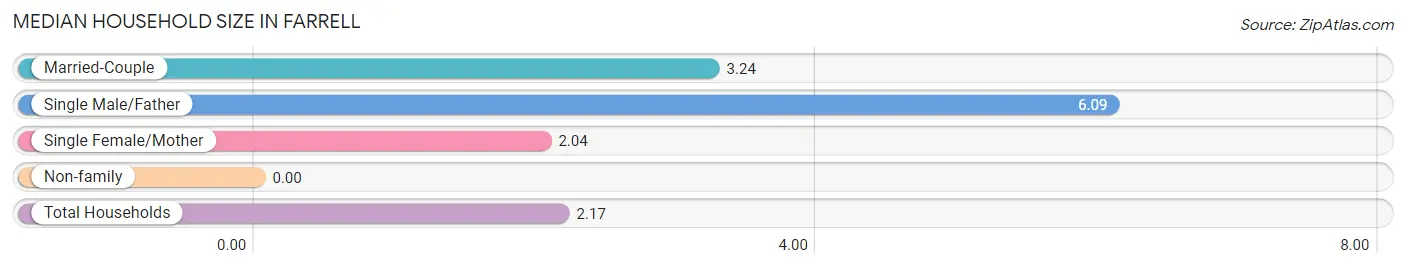
| Household Type | # Households | Household Size |
| Married-Couple | 17 (13.9%) | 3.24 |
| Single Male/Father | 11 (9.0%) | 6.09 |
| Single Female/Mother | 47 (38.5%) | 2.04 |
| Non-family | 47 (38.5%) | - |
| Total Households | 122 (100.0%) | 2.17 |
Household Size by Marriage Status in Farrell
Out of a total of 122 households in Farrell, 75 (61.5%) are family households, while 47 (38.5%) are nonfamily households. The most numerous type of family households are 2-person households, comprising 53, and the most common type of nonfamily households are 1-person households, comprising 47.
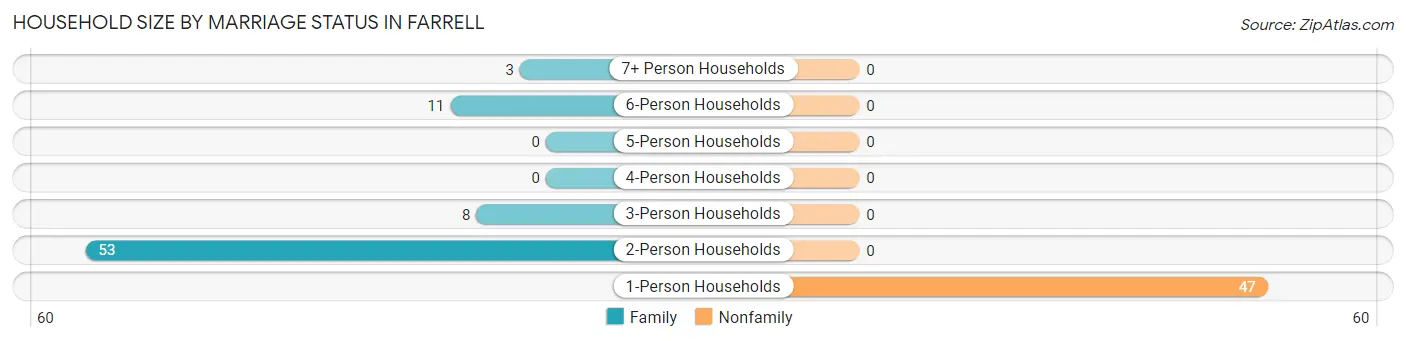
| Household Size | Family Households | Nonfamily Households |
| 1-Person Households | - | 47 (38.5%) |
| 2-Person Households | 53 (43.4%) | 0 (0.0%) |
| 3-Person Households | 8 (6.6%) | 0 (0.0%) |
| 4-Person Households | 0 (0.0%) | 0 (0.0%) |
| 5-Person Households | 0 (0.0%) | 0 (0.0%) |
| 6-Person Households | 11 (9.0%) | 0 (0.0%) |
| 7+ Person Households | 3 (2.5%) | 0 (0.0%) |
| Total | 75 (61.5%) | 47 (38.5%) |
Female Fertility in Farrell
Fertility by Age in Farrell
Average fertility rate in Farrell is 63.0 births per 1,000 women. Women in the age bracket of 20 to 34 years have the highest fertility rate with 222.0 births per 1,000 women. Women in the age bracket of 20 to 34 years acount for 100.0% of all women with births.
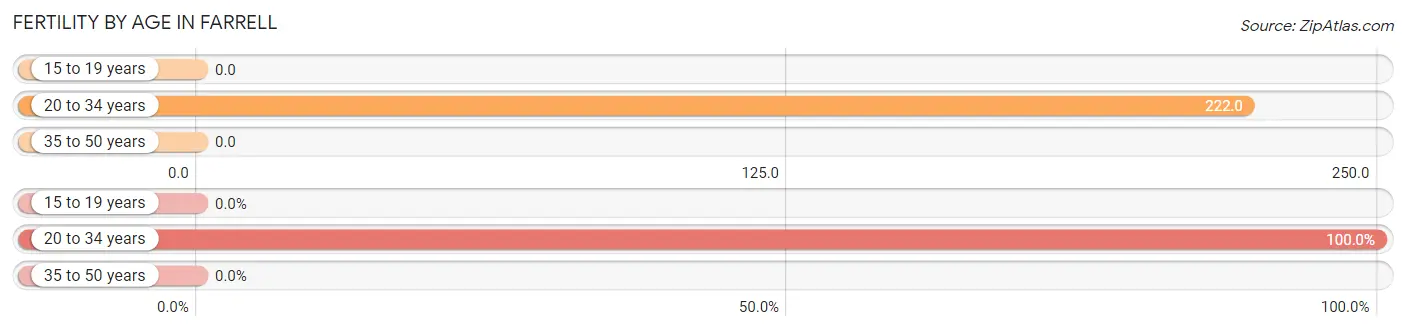
| Age Bracket | Women with Births | Births / 1,000 Women |
| 15 to 19 years | 0 (0.0%) | 0.0 |
| 20 to 34 years | 4 (100.0%) | 222.0 |
| 35 to 50 years | 0 (0.0%) | 0.0 |
| Total | 4 (100.0%) | 63.0 |
Fertility by Age by Marriage Status in Farrell
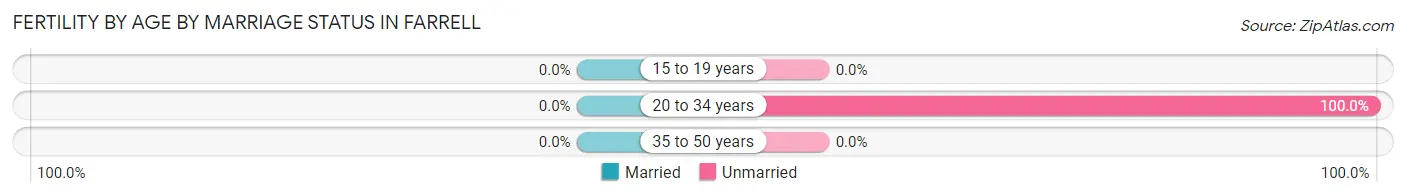
| Age Bracket | Married | Unmarried |
| 15 to 19 years | 0 (0.0%) | 0 (0.0%) |
| 20 to 34 years | 0 (0.0%) | 4 (100.0%) |
| 35 to 50 years | 0 (0.0%) | 0 (0.0%) |
| Total | 0 (0.0%) | 4 (100.0%) |
Fertility by Education in Farrell
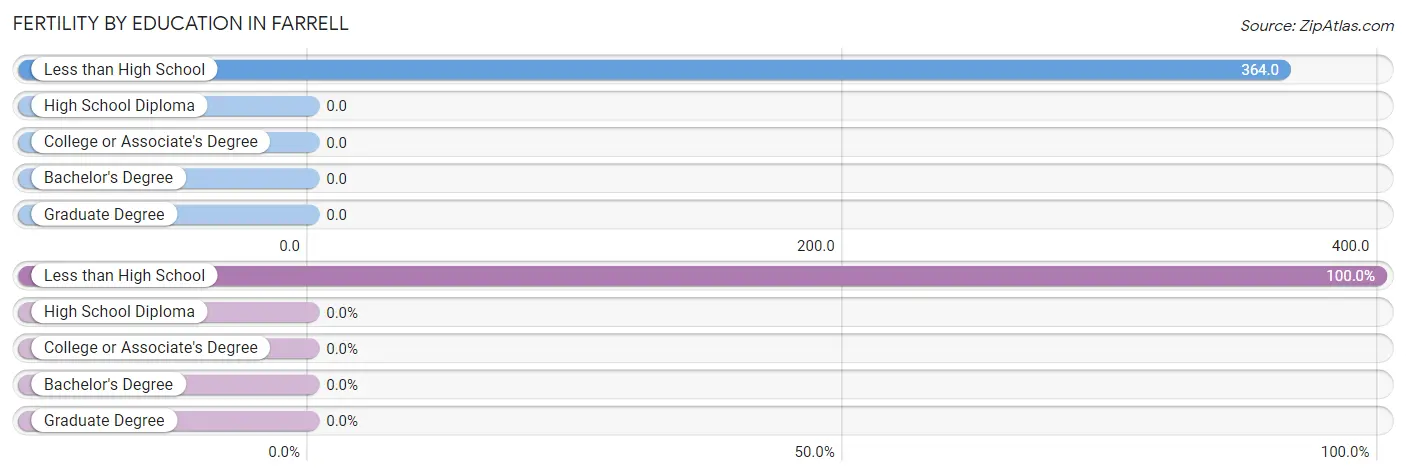
| Educational Attainment | Women with Births | Births / 1,000 Women |
| Less than High School | 4 (100.0%) | 364.0 |
| High School Diploma | 0 (0.0%) | 0.0 |
| College or Associate's Degree | 0 (0.0%) | 0.0 |
| Bachelor's Degree | 0 (0.0%) | 0.0 |
| Graduate Degree | 0 (0.0%) | 0.0 |
| Total | 4 (100.0%) | 63.0 |
Fertility by Education by Marriage Status in Farrell
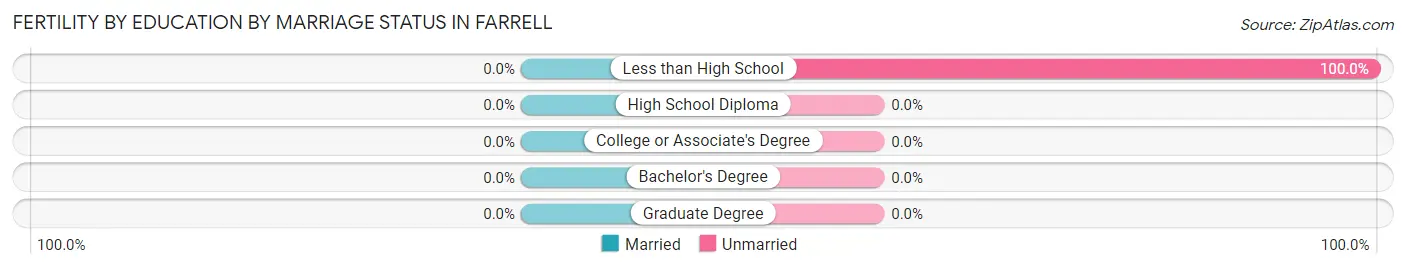
| Educational Attainment | Married | Unmarried |
| Less than High School | 0 (0.0%) | 4 (100.0%) |
| High School Diploma | 0 (0.0%) | 0 (0.0%) |
| College or Associate's Degree | 0 (0.0%) | 0 (0.0%) |
| Bachelor's Degree | 0 (0.0%) | 0 (0.0%) |
| Graduate Degree | 0 (0.0%) | 0 (0.0%) |
| Total | 0 (0.0%) | 4 (100.0%) |
Employment Characteristics in Farrell
Employment by Class of Employer in Farrell
Among the 110 employed individuals in Farrell, private company employees (64 | 58.2%), federal government employees (42 | 38.2%), and self-employed (incorporated) (4 | 3.6%) make up the most common classes of employment.
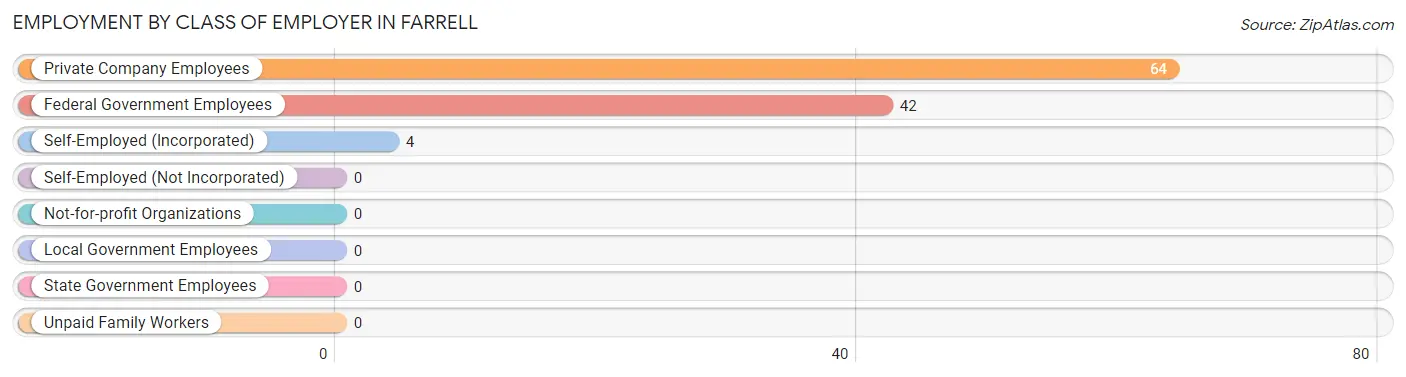
| Employer Class | # Employees | % Employees |
| Private Company Employees | 64 | 58.2% |
| Self-Employed (Incorporated) | 4 | 3.6% |
| Self-Employed (Not Incorporated) | 0 | 0.0% |
| Not-for-profit Organizations | 0 | 0.0% |
| Local Government Employees | 0 | 0.0% |
| State Government Employees | 0 | 0.0% |
| Federal Government Employees | 42 | 38.2% |
| Unpaid Family Workers | 0 | 0.0% |
| Total | 110 | 100.0% |
Employment Status by Age in Farrell
According to the labor force statistics for Farrell, out of the total population over 16 years of age (165), 69.1% or 114 individuals are in the labor force, with 3.5% or 4 of them unemployed. The age group with the highest labor force participation rate is 25 to 29 years, with 100.0% or 29 individuals in the labor force. Within the labor force, the 25 to 29 years age range has the highest percentage of unemployed individuals, with 13.8% or 4 of them being unemployed.
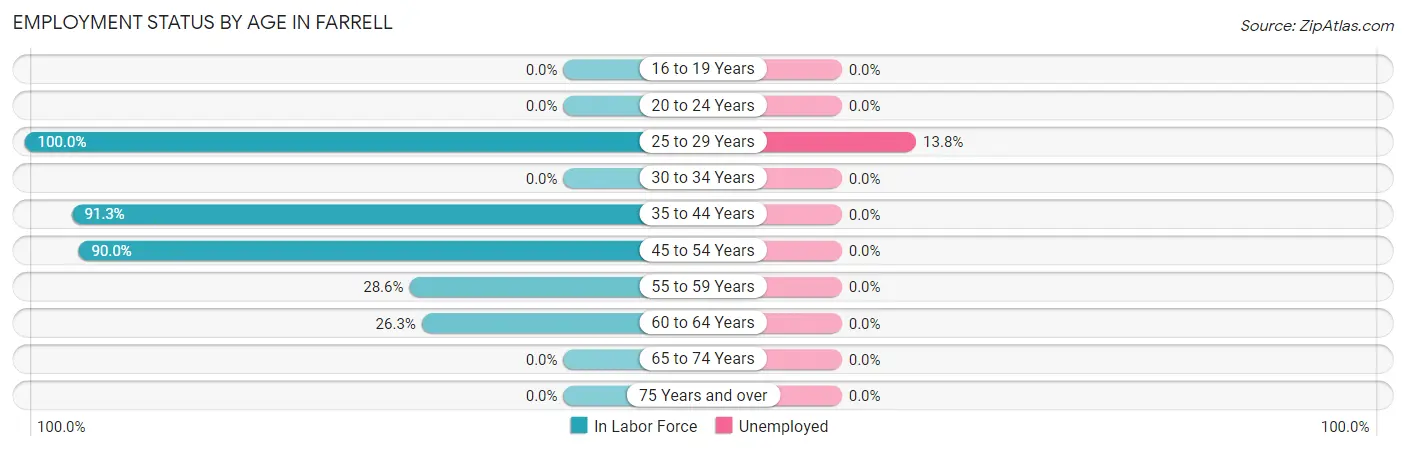
| Age Bracket | In Labor Force | Unemployed |
| 16 to 19 Years | 0 (0.0%) | 0 (0.0%) |
| 20 to 24 Years | 0 (0.0%) | 0 (0.0%) |
| 25 to 29 Years | 29 (100.0%) | 4 (13.8%) |
| 30 to 34 Years | 0 (0.0%) | 0 (0.0%) |
| 35 to 44 Years | 42 (91.3%) | 0 (0.0%) |
| 45 to 54 Years | 36 (90.0%) | 0 (0.0%) |
| 55 to 59 Years | 2 (28.6%) | 0 (0.0%) |
| 60 to 64 Years | 5 (26.3%) | 0 (0.0%) |
| 65 to 74 Years | 0 (0.0%) | 0 (0.0%) |
| 75 Years and over | 0 (0.0%) | 0 (0.0%) |
| Total | 114 (69.1%) | 4 (3.5%) |
Employment Status by Educational Attainment in Farrell
According to labor force statistics for Farrell, 80.9% of individuals (114) out of the total population between 25 and 64 years of age (141) are in the labor force, with 3.5% or 4 of them being unemployed. The group with the highest labor force participation rate are those with the educational attainment of less than high school, with 91.5% or 43 individuals in the labor force. Within the labor force, individuals with less than high school education have the highest percentage of unemployment, with 9.3% or 4 of them being unemployed.
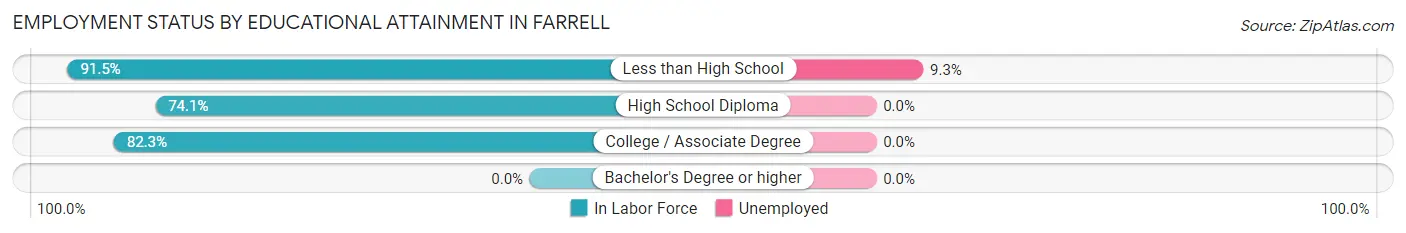
| Educational Attainment | In Labor Force | Unemployed |
| Less than High School | 43 (91.5%) | 4 (9.3%) |
| High School Diploma | 20 (74.1%) | 0 (0.0%) |
| College / Associate Degree | 51 (82.3%) | 0 (0.0%) |
| Bachelor's Degree or higher | 0 (0.0%) | 0 (0.0%) |
| Total | 114 (80.9%) | 5 (3.5%) |
Employment Occupations by Sex in Farrell
Management, Business, Science and Arts Occupations
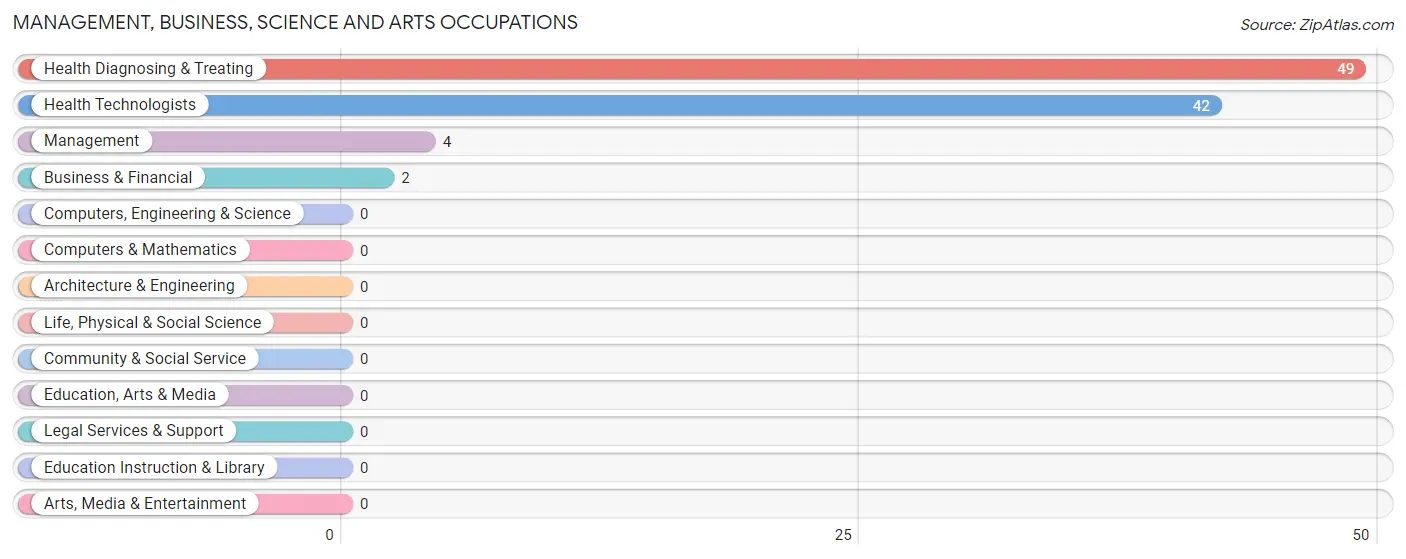
The most common Management, Business, Science and Arts occupations in Farrell are Health Diagnosing & Treating (49 | 44.6%), Health Technologists (42 | 38.2%), Management (4 | 3.6%), and Business & Financial (2 | 1.8%).
Management, Business, Science and Arts Occupations by Sex
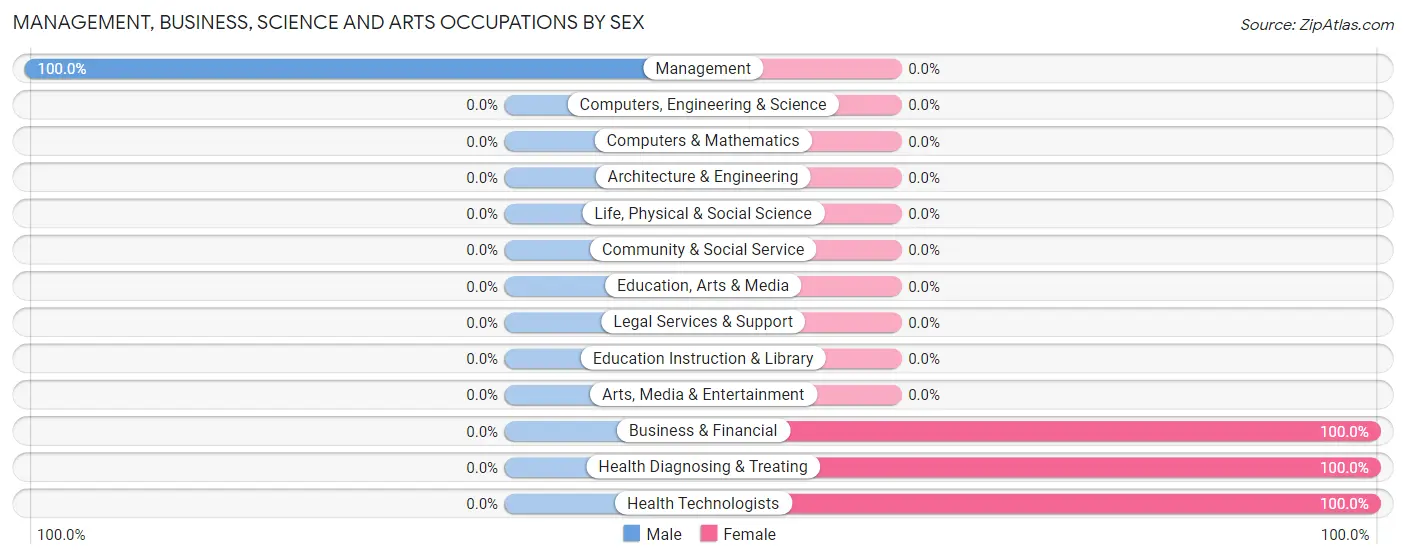
| Occupation | Male | Female |
| Management | 4 (100.0%) | 0 (0.0%) |
| Business & Financial | 0 (0.0%) | 2 (100.0%) |
| Computers, Engineering & Science | 0 (0.0%) | 0 (0.0%) |
| Computers & Mathematics | 0 (0.0%) | 0 (0.0%) |
| Architecture & Engineering | 0 (0.0%) | 0 (0.0%) |
| Life, Physical & Social Science | 0 (0.0%) | 0 (0.0%) |
| Community & Social Service | 0 (0.0%) | 0 (0.0%) |
| Education, Arts & Media | 0 (0.0%) | 0 (0.0%) |
| Legal Services & Support | 0 (0.0%) | 0 (0.0%) |
| Education Instruction & Library | 0 (0.0%) | 0 (0.0%) |
| Arts, Media & Entertainment | 0 (0.0%) | 0 (0.0%) |
| Health Diagnosing & Treating | 0 (0.0%) | 49 (100.0%) |
| Health Technologists | 0 (0.0%) | 42 (100.0%) |
| Total (Category) | 4 (7.3%) | 51 (92.7%) |
| Total (Overall) | 52 (47.3%) | 58 (52.7%) |
Services Occupations
The most common Services occupations in Farrell are , and Personal Care & Service (7 | 6.4%).
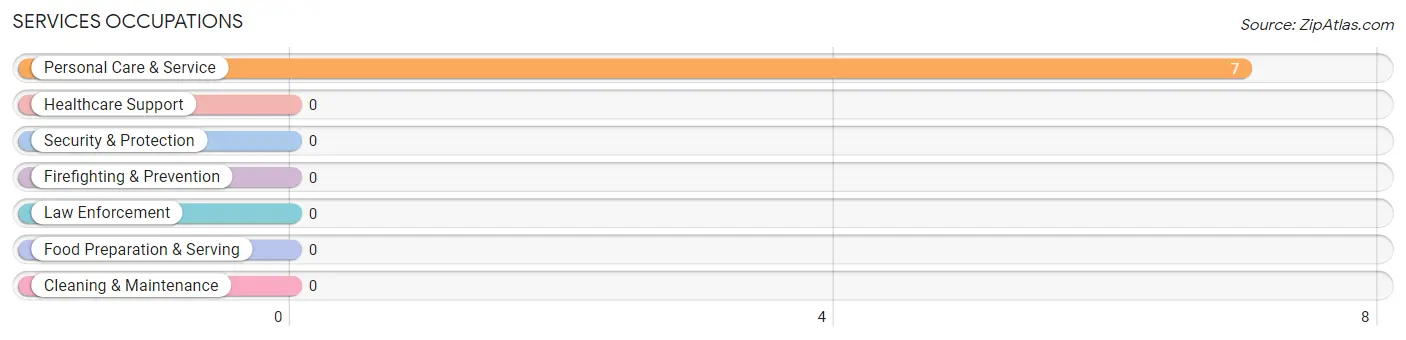
Services Occupations by Sex
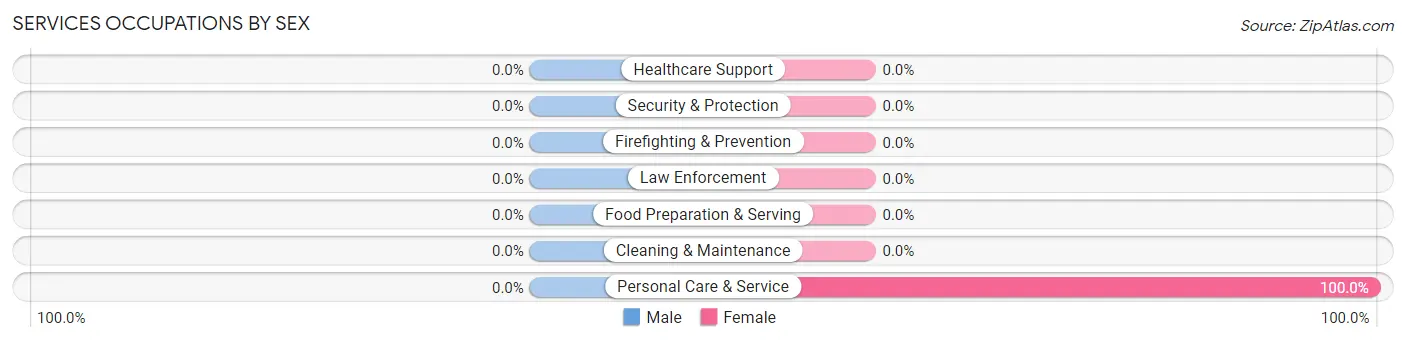
| Occupation | Male | Female |
| Healthcare Support | 0 (0.0%) | 0 (0.0%) |
| Security & Protection | 0 (0.0%) | 0 (0.0%) |
| Firefighting & Prevention | 0 (0.0%) | 0 (0.0%) |
| Law Enforcement | 0 (0.0%) | 0 (0.0%) |
| Food Preparation & Serving | 0 (0.0%) | 0 (0.0%) |
| Cleaning & Maintenance | 0 (0.0%) | 0 (0.0%) |
| Personal Care & Service | 0 (0.0%) | 7 (100.0%) |
| Total (Category) | 0 (0.0%) | 7 (100.0%) |
| Total (Overall) | 52 (47.3%) | 58 (52.7%) |
Sales and Office Occupations
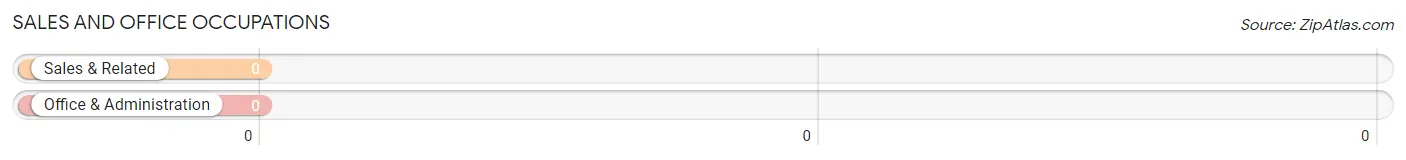
Sales and Office Occupations by Sex
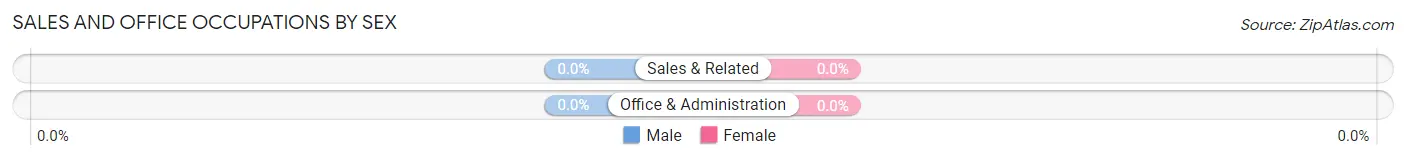
| Occupation | Male | Female |
| Sales & Related | 0 (0.0%) | 0 (0.0%) |
| Office & Administration | 0 (0.0%) | 0 (0.0%) |
| Total (Category) | 0 (0.0%) | 0 (0.0%) |
| Total (Overall) | 52 (47.3%) | 58 (52.7%) |
Natural Resources, Construction and Maintenance Occupations
The most common Natural Resources, Construction and Maintenance occupations in Farrell are , and Installation, Maintenance & Repair (32 | 29.1%).
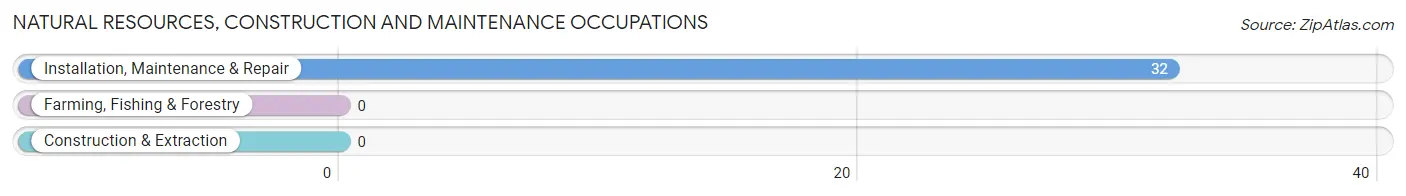
Natural Resources, Construction and Maintenance Occupations by Sex
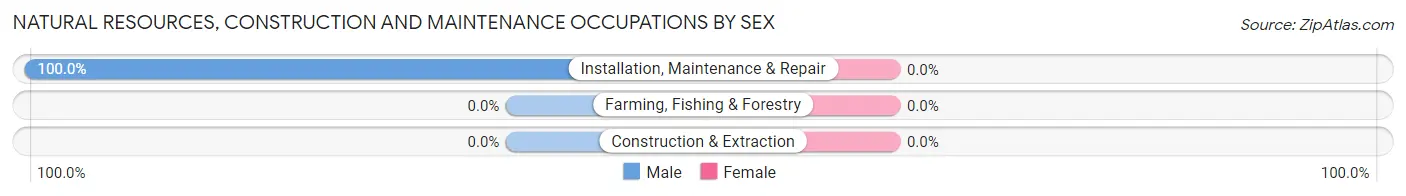
| Occupation | Male | Female |
| Farming, Fishing & Forestry | 0 (0.0%) | 0 (0.0%) |
| Construction & Extraction | 0 (0.0%) | 0 (0.0%) |
| Installation, Maintenance & Repair | 32 (100.0%) | 0 (0.0%) |
| Total (Category) | 32 (100.0%) | 0 (0.0%) |
| Total (Overall) | 52 (47.3%) | 58 (52.7%) |
Production, Transportation and Moving Occupations
The most common Production, Transportation and Moving occupations in Farrell are Material Moving (11 | 10.0%), and Production (5 | 4.5%).
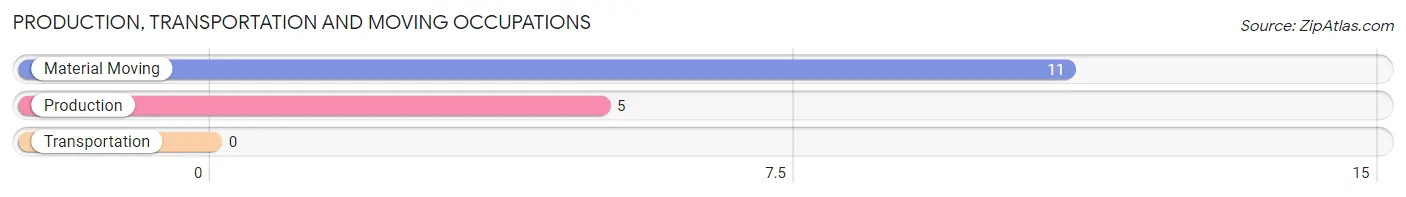
Production, Transportation and Moving Occupations by Sex
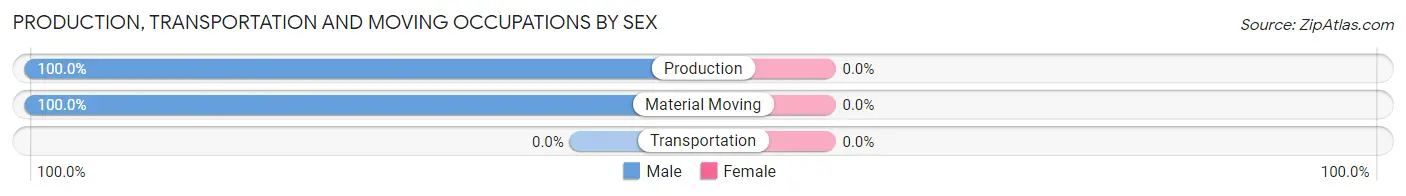
| Occupation | Male | Female |
| Production | 5 (100.0%) | 0 (0.0%) |
| Transportation | 0 (0.0%) | 0 (0.0%) |
| Material Moving | 11 (100.0%) | 0 (0.0%) |
| Total (Category) | 16 (100.0%) | 0 (0.0%) |
| Total (Overall) | 52 (47.3%) | 58 (52.7%) |
Employment Industries by Sex in Farrell
Employment Industries in Farrell
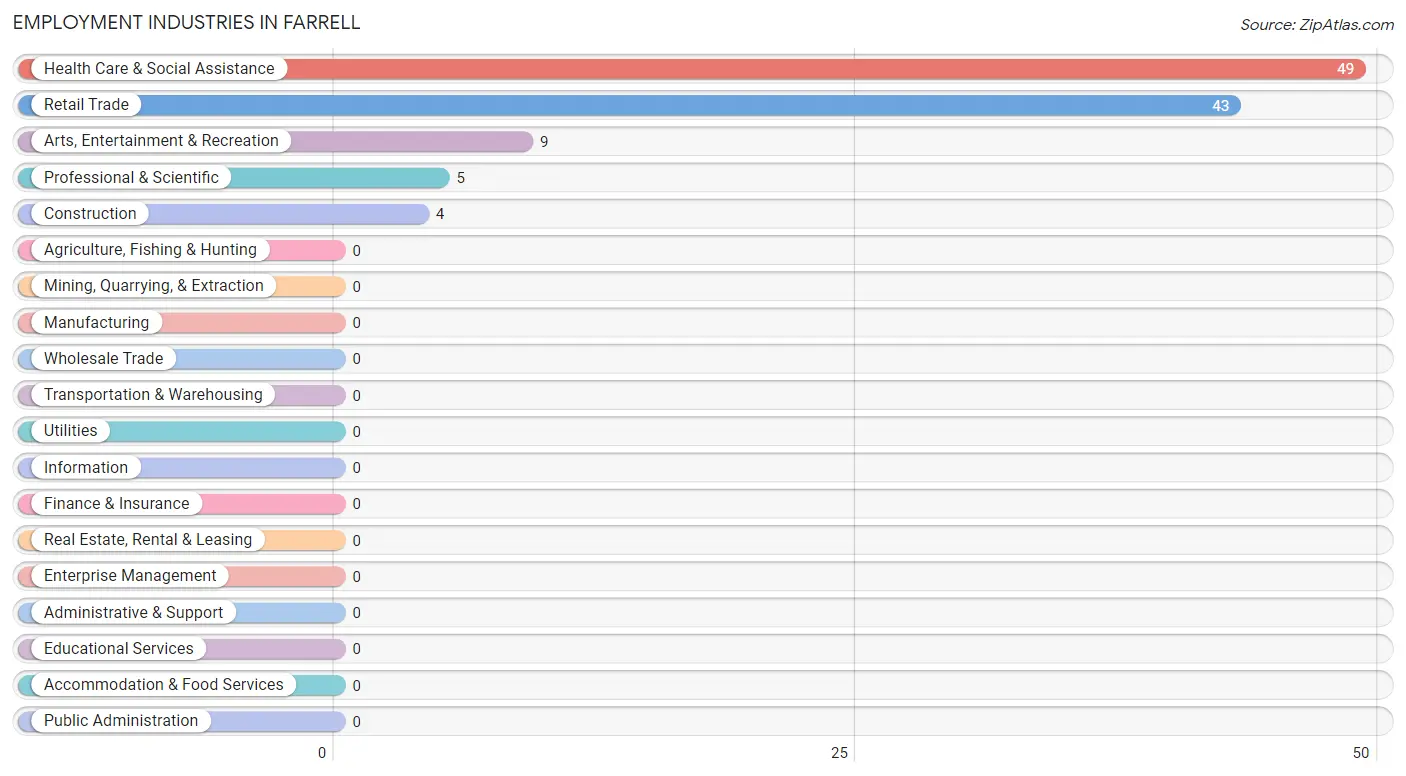
The major employment industries in Farrell include Health Care & Social Assistance (49 | 44.6%), Retail Trade (43 | 39.1%), Arts, Entertainment & Recreation (9 | 8.2%), Professional & Scientific (5 | 4.5%), and Construction (4 | 3.6%).
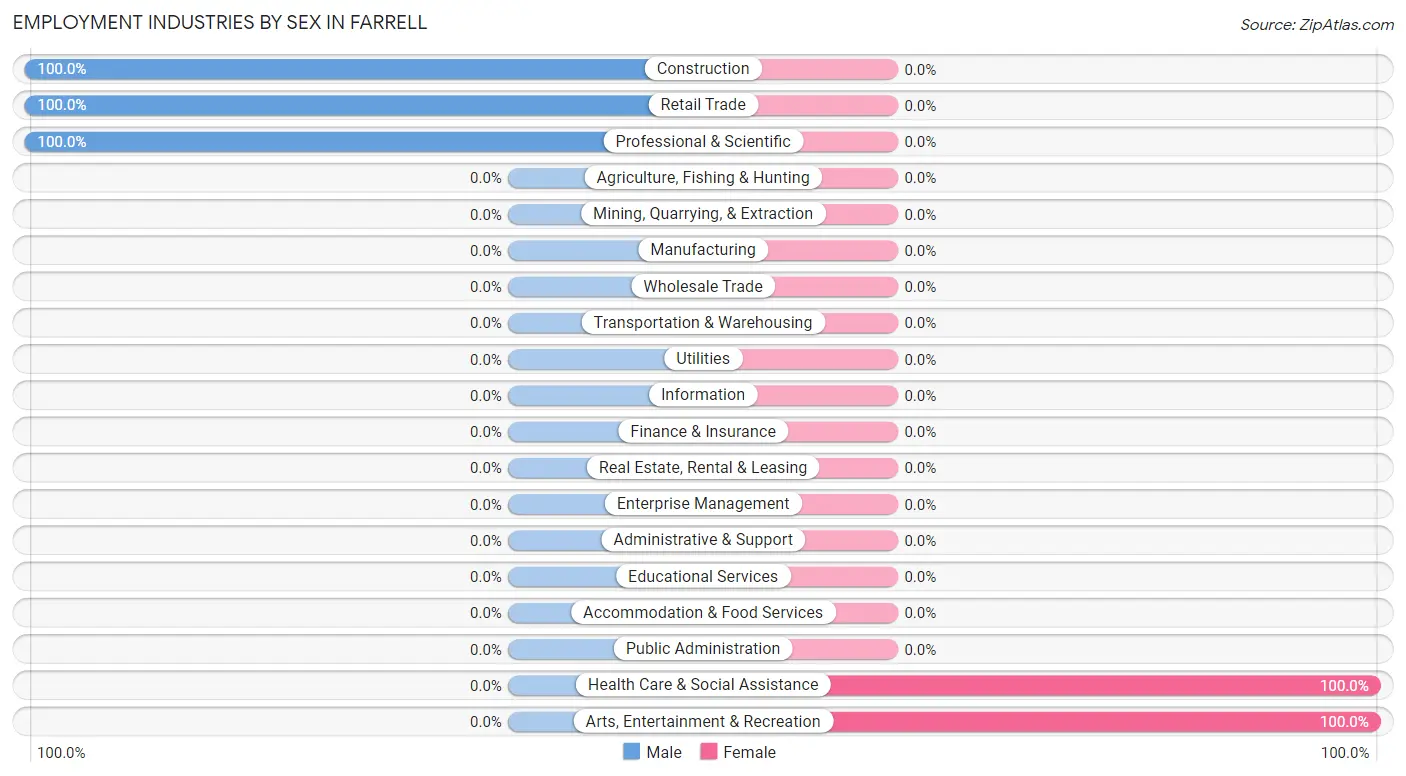
Employment Industries by Sex in Farrell
The Farrell industries that see more men than women are Construction (100.0%), Retail Trade (100.0%), and Professional & Scientific (100.0%), whereas the industries that tend to have a higher number of women are Health Care & Social Assistance (100.0%), and Arts, Entertainment & Recreation (100.0%).
| Industry | Male | Female |
| Agriculture, Fishing & Hunting | 0 (0.0%) | 0 (0.0%) |
| Mining, Quarrying, & Extraction | 0 (0.0%) | 0 (0.0%) |
| Construction | 4 (100.0%) | 0 (0.0%) |
| Manufacturing | 0 (0.0%) | 0 (0.0%) |
| Wholesale Trade | 0 (0.0%) | 0 (0.0%) |
| Retail Trade | 43 (100.0%) | 0 (0.0%) |
| Transportation & Warehousing | 0 (0.0%) | 0 (0.0%) |
| Utilities | 0 (0.0%) | 0 (0.0%) |
| Information | 0 (0.0%) | 0 (0.0%) |
| Finance & Insurance | 0 (0.0%) | 0 (0.0%) |
| Real Estate, Rental & Leasing | 0 (0.0%) | 0 (0.0%) |
| Professional & Scientific | 5 (100.0%) | 0 (0.0%) |
| Enterprise Management | 0 (0.0%) | 0 (0.0%) |
| Administrative & Support | 0 (0.0%) | 0 (0.0%) |
| Educational Services | 0 (0.0%) | 0 (0.0%) |
| Health Care & Social Assistance | 0 (0.0%) | 49 (100.0%) |
| Arts, Entertainment & Recreation | 0 (0.0%) | 9 (100.0%) |
| Accommodation & Food Services | 0 (0.0%) | 0 (0.0%) |
| Public Administration | 0 (0.0%) | 0 (0.0%) |
| Total | 52 (47.3%) | 58 (52.7%) |
Education in Farrell
School Enrollment in Farrell
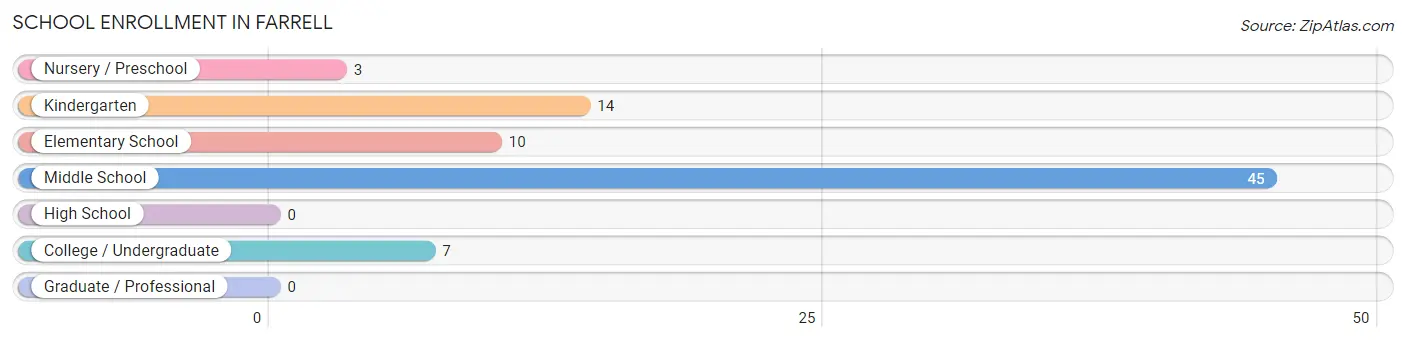
The most common levels of schooling among the 79 students in Farrell are middle school (45 | 57.0%), kindergarten (14 | 17.7%), and elementary school (10 | 12.7%).
| School Level | # Students | % Students |
| Nursery / Preschool | 3 | 3.8% |
| Kindergarten | 14 | 17.7% |
| Elementary School | 10 | 12.7% |
| Middle School | 45 | 57.0% |
| High School | 0 | 0.0% |
| College / Undergraduate | 7 | 8.9% |
| Graduate / Professional | 0 | 0.0% |
| Total | 79 | 100.0% |
School Enrollment by Age by Funding Source in Farrell
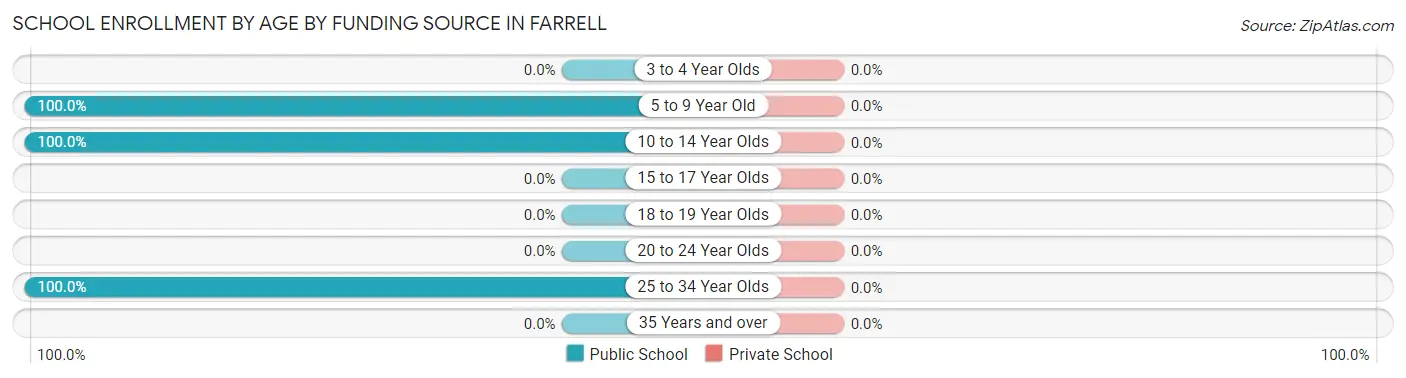
| Age Bracket | Public School | Private School |
| 3 to 4 Year Olds | 0 (0.0%) | 0 (0.0%) |
| 5 to 9 Year Old | 27 (100.0%) | 0 (0.0%) |
| 10 to 14 Year Olds | 45 (100.0%) | 0 (0.0%) |
| 15 to 17 Year Olds | 0 (0.0%) | 0 (0.0%) |
| 18 to 19 Year Olds | 0 (0.0%) | 0 (0.0%) |
| 20 to 24 Year Olds | 0 (0.0%) | 0 (0.0%) |
| 25 to 34 Year Olds | 7 (100.0%) | 0 (0.0%) |
| 35 Years and over | 0 (0.0%) | 0 (0.0%) |
| Total | 79 (100.0%) | 0 (0.0%) |
Educational Attainment by Field of Study in Farrell
, and multidisciplinary studies (5 | 100.0%) are the most common fields of study among 5 individuals in Farrell who have obtained a bachelor's degree or higher.
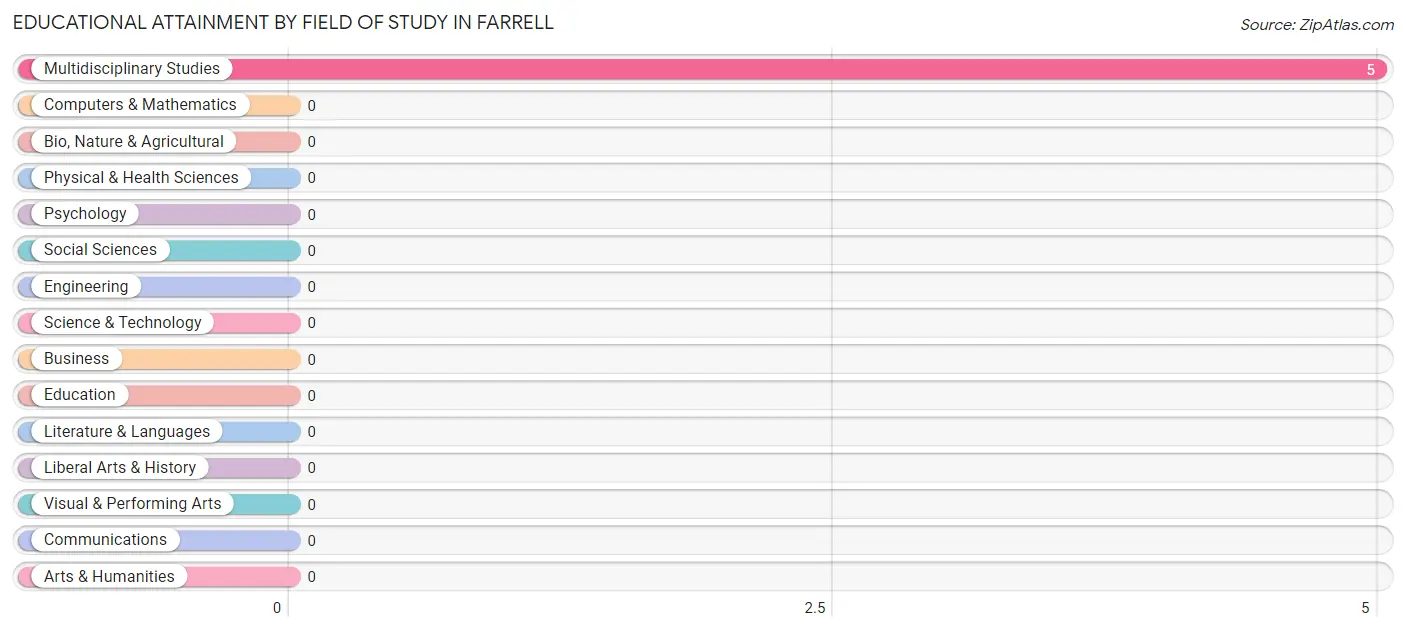
| Field of Study | # Graduates | % Graduates |
| Computers & Mathematics | 0 | 0.0% |
| Bio, Nature & Agricultural | 0 | 0.0% |
| Physical & Health Sciences | 0 | 0.0% |
| Psychology | 0 | 0.0% |
| Social Sciences | 0 | 0.0% |
| Engineering | 0 | 0.0% |
| Multidisciplinary Studies | 5 | 100.0% |
| Science & Technology | 0 | 0.0% |
| Business | 0 | 0.0% |
| Education | 0 | 0.0% |
| Literature & Languages | 0 | 0.0% |
| Liberal Arts & History | 0 | 0.0% |
| Visual & Performing Arts | 0 | 0.0% |
| Communications | 0 | 0.0% |
| Arts & Humanities | 0 | 0.0% |
| Total | 5 | 100.0% |
Transportation & Commute in Farrell
Vehicle Availability by Sex in Farrell
The most prevalent vehicle ownership categories in Farrell are males with 1 vehicle (43, accounting for 82.7%) and females with 1 vehicle (14, making up 74.1%).
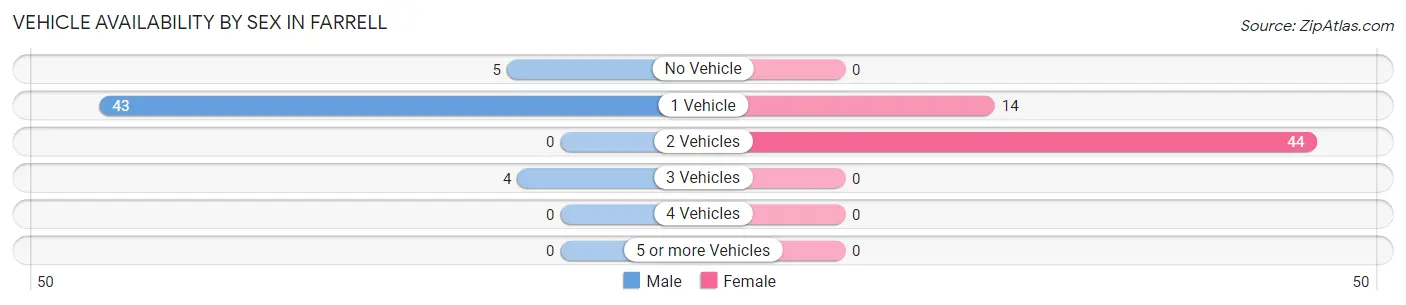
| Vehicles Available | Male | Female |
| No Vehicle | 5 (9.6%) | 0 (0.0%) |
| 1 Vehicle | 43 (82.7%) | 14 (24.1%) |
| 2 Vehicles | 0 (0.0%) | 44 (75.9%) |
| 3 Vehicles | 4 (7.7%) | 0 (0.0%) |
| 4 Vehicles | 0 (0.0%) | 0 (0.0%) |
| 5 or more Vehicles | 0 (0.0%) | 0 (0.0%) |
| Total | 52 (100.0%) | 58 (100.0%) |
Commute Time in Farrell
The most frequently occuring commute durations in Farrell are 5 to 9 minutes (42 commuters, 38.2%), 15 to 19 minutes (32 commuters, 29.1%), and 20 to 24 minutes (11 commuters, 10.0%).
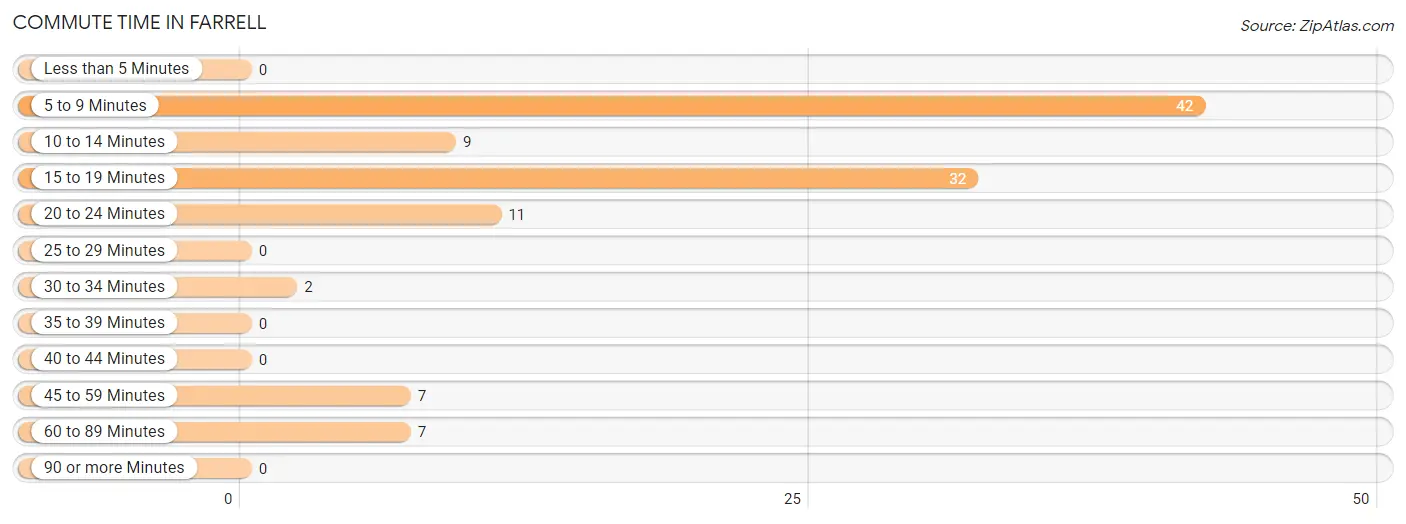
| Commute Time | # Commuters | % Commuters |
| Less than 5 Minutes | 0 | 0.0% |
| 5 to 9 Minutes | 42 | 38.2% |
| 10 to 14 Minutes | 9 | 8.2% |
| 15 to 19 Minutes | 32 | 29.1% |
| 20 to 24 Minutes | 11 | 10.0% |
| 25 to 29 Minutes | 0 | 0.0% |
| 30 to 34 Minutes | 2 | 1.8% |
| 35 to 39 Minutes | 0 | 0.0% |
| 40 to 44 Minutes | 0 | 0.0% |
| 45 to 59 Minutes | 7 | 6.4% |
| 60 to 89 Minutes | 7 | 6.4% |
| 90 or more Minutes | 0 | 0.0% |
Commute Time by Sex in Farrell
The most common commute times in Farrell are 15 to 19 minutes (32 commuters, 61.5%) for males and 5 to 9 minutes (42 commuters, 72.4%) for females.
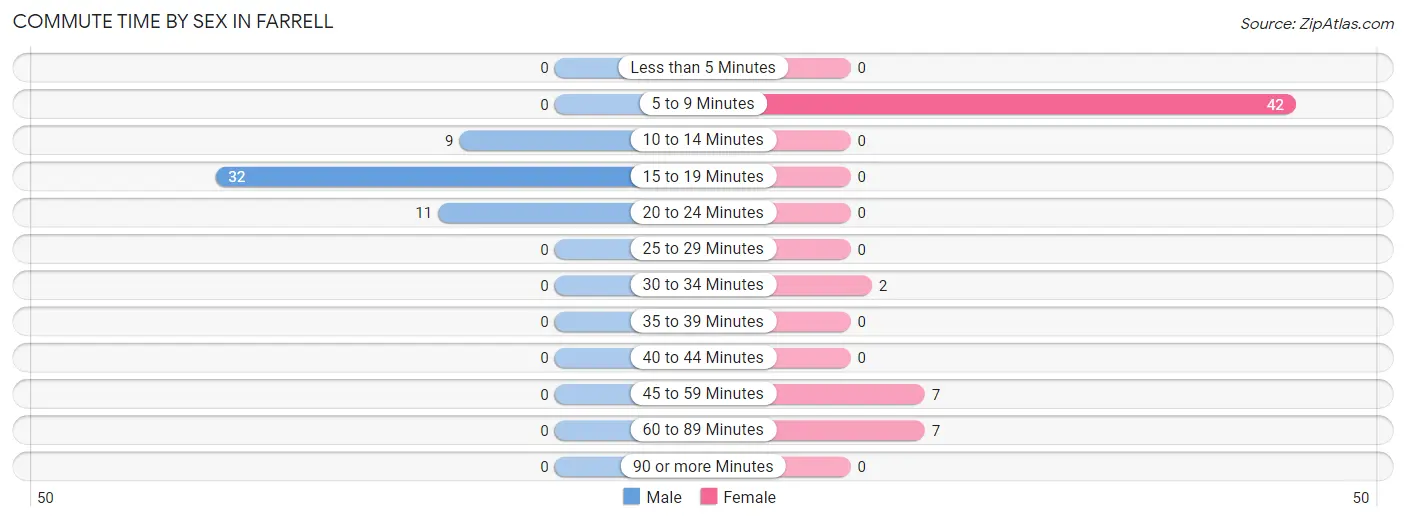
| Commute Time | Male | Female |
| Less than 5 Minutes | 0 (0.0%) | 0 (0.0%) |
| 5 to 9 Minutes | 0 (0.0%) | 42 (72.4%) |
| 10 to 14 Minutes | 9 (17.3%) | 0 (0.0%) |
| 15 to 19 Minutes | 32 (61.5%) | 0 (0.0%) |
| 20 to 24 Minutes | 11 (21.1%) | 0 (0.0%) |
| 25 to 29 Minutes | 0 (0.0%) | 0 (0.0%) |
| 30 to 34 Minutes | 0 (0.0%) | 2 (3.5%) |
| 35 to 39 Minutes | 0 (0.0%) | 0 (0.0%) |
| 40 to 44 Minutes | 0 (0.0%) | 0 (0.0%) |
| 45 to 59 Minutes | 0 (0.0%) | 7 (12.1%) |
| 60 to 89 Minutes | 0 (0.0%) | 7 (12.1%) |
| 90 or more Minutes | 0 (0.0%) | 0 (0.0%) |
Time of Departure to Work by Sex in Farrell
The most frequent times of departure to work in Farrell are 6:30 AM to 6:59 AM (37, 71.2%) for males and 8:00 AM to 8:29 AM (42, 72.4%) for females.
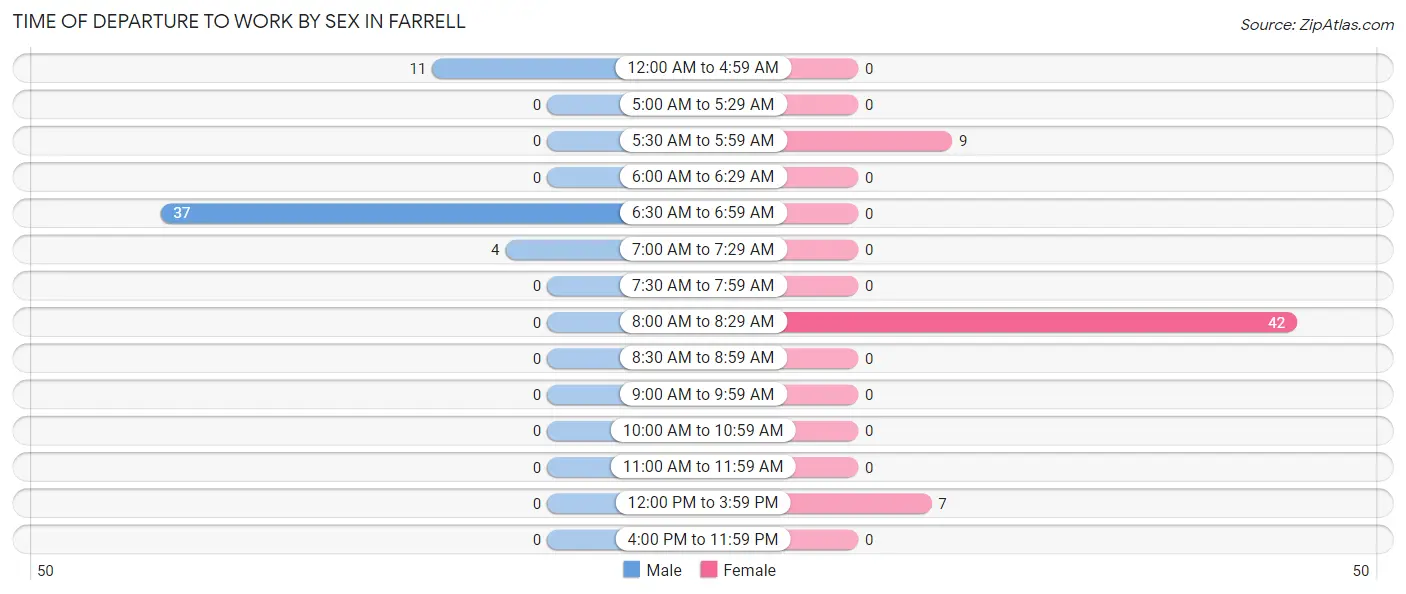
| Time of Departure | Male | Female |
| 12:00 AM to 4:59 AM | 11 (21.1%) | 0 (0.0%) |
| 5:00 AM to 5:29 AM | 0 (0.0%) | 0 (0.0%) |
| 5:30 AM to 5:59 AM | 0 (0.0%) | 9 (15.5%) |
| 6:00 AM to 6:29 AM | 0 (0.0%) | 0 (0.0%) |
| 6:30 AM to 6:59 AM | 37 (71.2%) | 0 (0.0%) |
| 7:00 AM to 7:29 AM | 4 (7.7%) | 0 (0.0%) |
| 7:30 AM to 7:59 AM | 0 (0.0%) | 0 (0.0%) |
| 8:00 AM to 8:29 AM | 0 (0.0%) | 42 (72.4%) |
| 8:30 AM to 8:59 AM | 0 (0.0%) | 0 (0.0%) |
| 9:00 AM to 9:59 AM | 0 (0.0%) | 0 (0.0%) |
| 10:00 AM to 10:59 AM | 0 (0.0%) | 0 (0.0%) |
| 11:00 AM to 11:59 AM | 0 (0.0%) | 0 (0.0%) |
| 12:00 PM to 3:59 PM | 0 (0.0%) | 7 (12.1%) |
| 4:00 PM to 11:59 PM | 0 (0.0%) | 0 (0.0%) |
| Total | 52 (100.0%) | 58 (100.0%) |
Housing Occupancy in Farrell
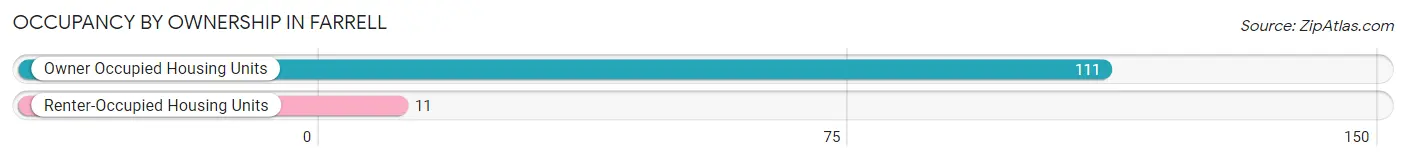
Occupancy by Ownership in Farrell
Of the total 122 dwellings in Farrell, owner-occupied units account for 111 (91.0%), while renter-occupied units make up 11 (9.0%).
| Occupancy | # Housing Units | % Housing Units |
| Owner Occupied Housing Units | 111 | 91.0% |
| Renter-Occupied Housing Units | 11 | 9.0% |
| Total Occupied Housing Units | 122 | 100.0% |
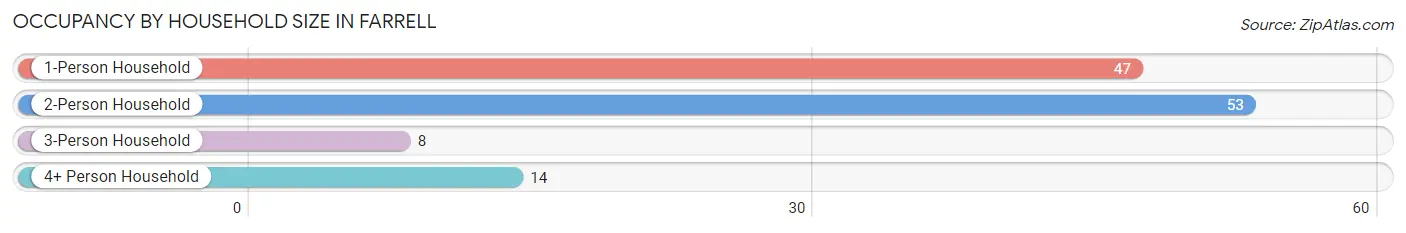
Occupancy by Household Size in Farrell
| Household Size | # Housing Units | % Housing Units |
| 1-Person Household | 47 | 38.5% |
| 2-Person Household | 53 | 43.4% |
| 3-Person Household | 8 | 6.6% |
| 4+ Person Household | 14 | 11.5% |
| Total Housing Units | 122 | 100.0% |
Occupancy by Ownership by Household Size in Farrell
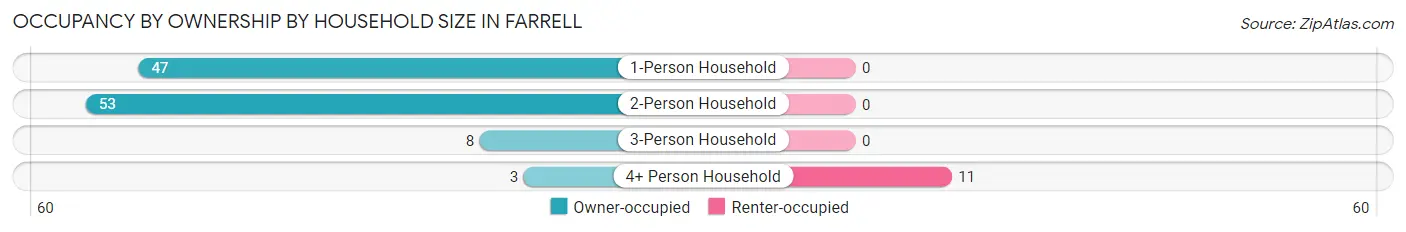
| Household Size | Owner-occupied | Renter-occupied |
| 1-Person Household | 47 (100.0%) | 0 (0.0%) |
| 2-Person Household | 53 (100.0%) | 0 (0.0%) |
| 3-Person Household | 8 (100.0%) | 0 (0.0%) |
| 4+ Person Household | 3 (21.4%) | 11 (78.6%) |
| Total Housing Units | 111 (91.0%) | 11 (9.0%) |
Occupancy by Educational Attainment in Farrell
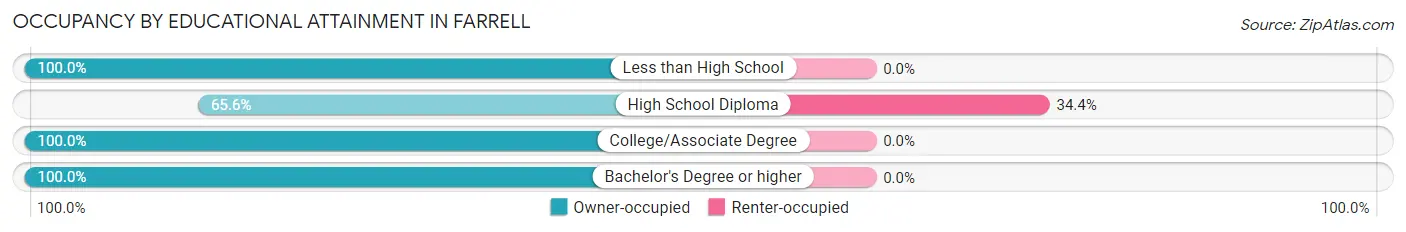
| Household Size | Owner-occupied | Renter-occupied |
| Less than High School | 32 (100.0%) | 0 (0.0%) |
| High School Diploma | 21 (65.6%) | 11 (34.4%) |
| College/Associate Degree | 53 (100.0%) | 0 (0.0%) |
| Bachelor's Degree or higher | 5 (100.0%) | 0 (0.0%) |
Occupancy by Age of Householder in Farrell
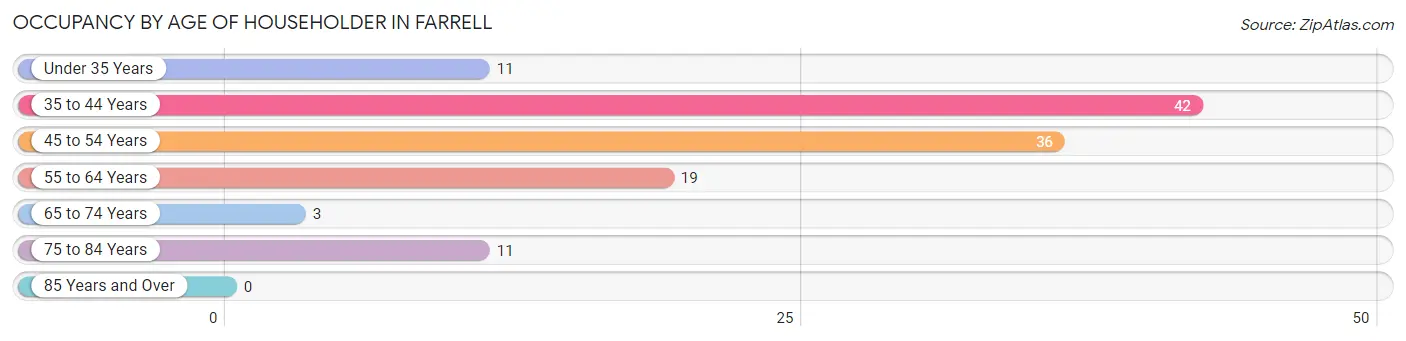
| Age Bracket | # Households | % Households |
| Under 35 Years | 11 | 9.0% |
| 35 to 44 Years | 42 | 34.4% |
| 45 to 54 Years | 36 | 29.5% |
| 55 to 64 Years | 19 | 15.6% |
| 65 to 74 Years | 3 | 2.5% |
| 75 to 84 Years | 11 | 9.0% |
| 85 Years and Over | 0 | 0.0% |
| Total | 122 | 100.0% |
Housing Finances in Farrell
Median Income by Occupancy in Farrell
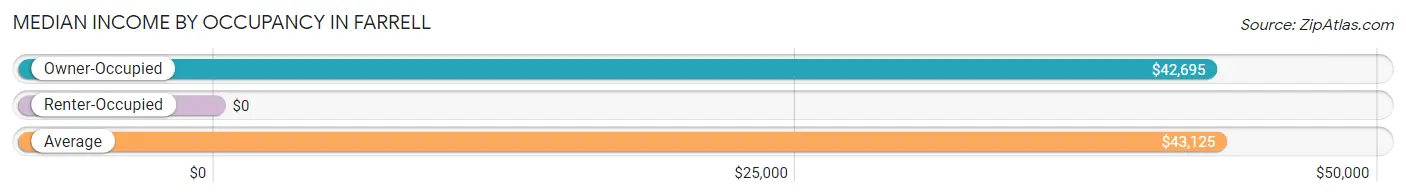
| Occupancy Type | # Households | Median Income |
| Owner-Occupied | 111 (91.0%) | $42,695 |
| Renter-Occupied | 11 (9.0%) | $0 |
| Average | 122 (100.0%) | $43,125 |
Occupancy by Householder Income Bracket in Farrell
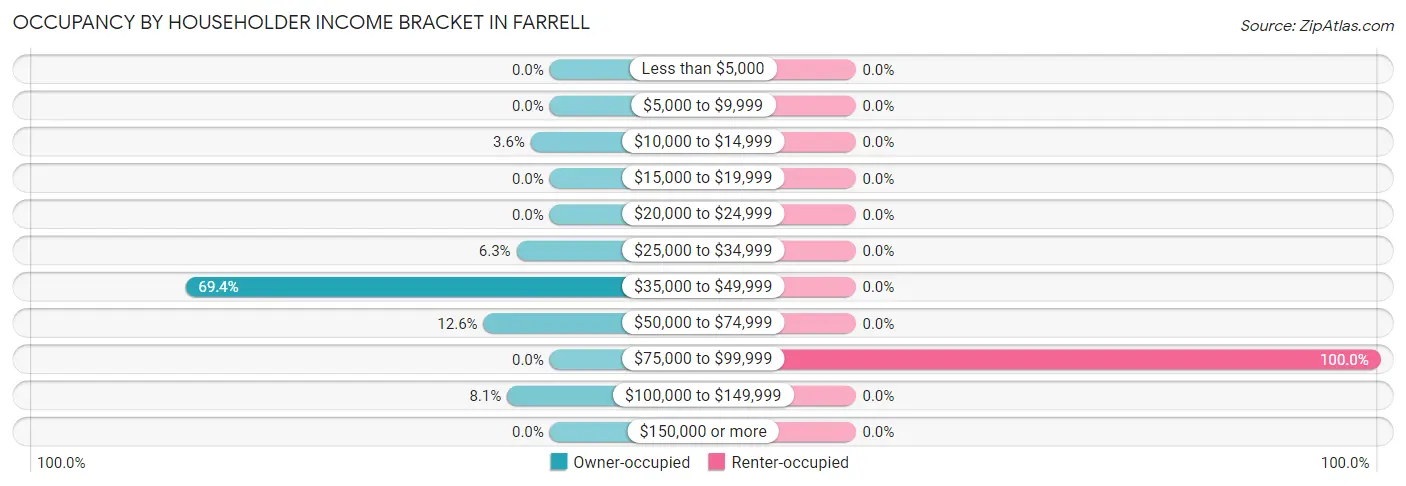
| Income Bracket | Owner-occupied | Renter-occupied |
| Less than $5,000 | 0 (0.0%) | 0 (0.0%) |
| $5,000 to $9,999 | 0 (0.0%) | 0 (0.0%) |
| $10,000 to $14,999 | 4 (3.6%) | 0 (0.0%) |
| $15,000 to $19,999 | 0 (0.0%) | 0 (0.0%) |
| $20,000 to $24,999 | 0 (0.0%) | 0 (0.0%) |
| $25,000 to $34,999 | 7 (6.3%) | 0 (0.0%) |
| $35,000 to $49,999 | 77 (69.4%) | 0 (0.0%) |
| $50,000 to $74,999 | 14 (12.6%) | 0 (0.0%) |
| $75,000 to $99,999 | 0 (0.0%) | 11 (100.0%) |
| $100,000 to $149,999 | 9 (8.1%) | 0 (0.0%) |
| $150,000 or more | 0 (0.0%) | 0 (0.0%) |
| Total | 111 (100.0%) | 11 (100.0%) |
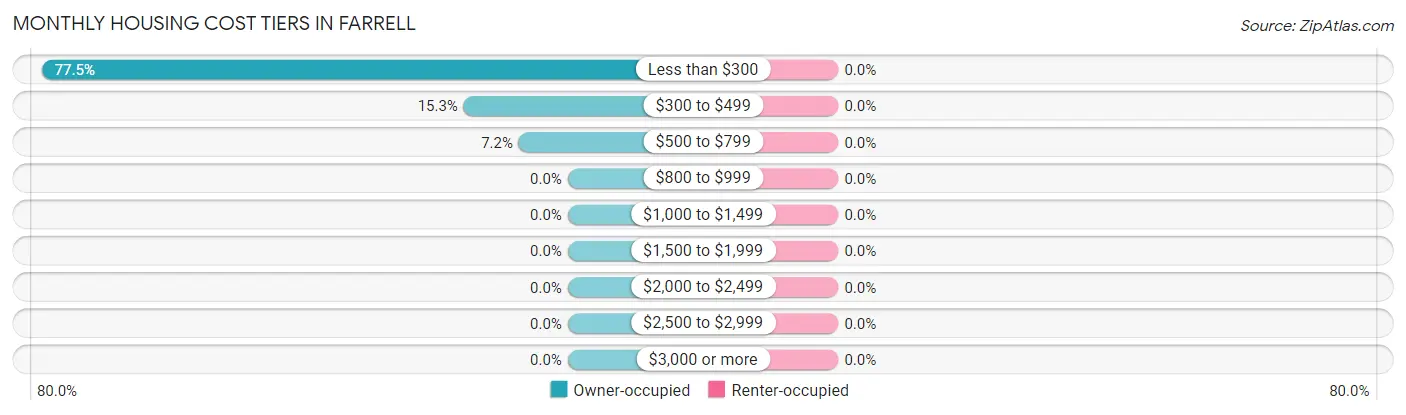
Monthly Housing Cost Tiers in Farrell
| Monthly Cost | Owner-occupied | Renter-occupied |
| Less than $300 | 86 (77.5%) | 0 (0.0%) |
| $300 to $499 | 17 (15.3%) | 0 (0.0%) |
| $500 to $799 | 8 (7.2%) | 0 (0.0%) |
| $800 to $999 | 0 (0.0%) | 0 (0.0%) |
| $1,000 to $1,499 | 0 (0.0%) | 0 (0.0%) |
| $1,500 to $1,999 | 0 (0.0%) | 0 (0.0%) |
| $2,000 to $2,499 | 0 (0.0%) | 0 (0.0%) |
| $2,500 to $2,999 | 0 (0.0%) | 0 (0.0%) |
| $3,000 or more | 0 (0.0%) | 0 (0.0%) |
| Total | 111 (100.0%) | 11 (100.0%) |
Physical Housing Characteristics in Farrell
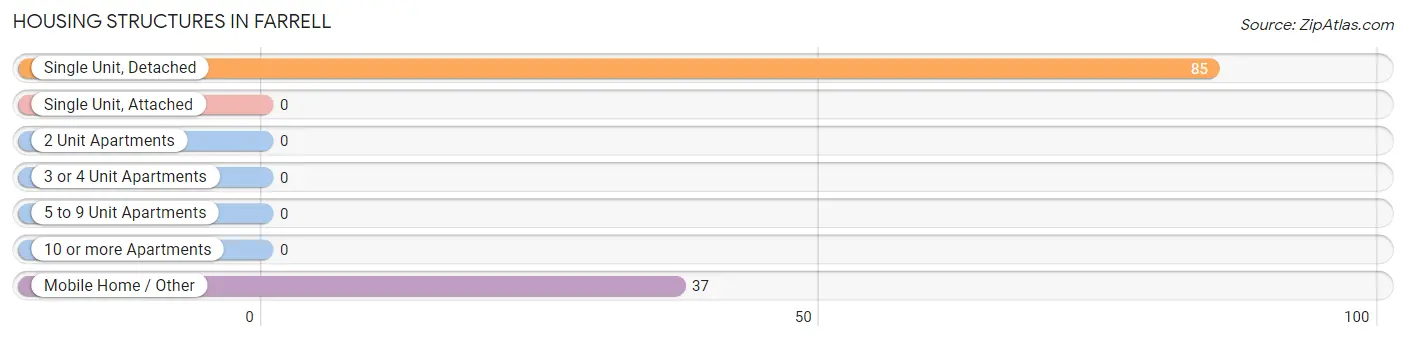
Housing Structures in Farrell
| Structure Type | # Housing Units | % Housing Units |
| Single Unit, Detached | 85 | 69.7% |
| Single Unit, Attached | 0 | 0.0% |
| 2 Unit Apartments | 0 | 0.0% |
| 3 or 4 Unit Apartments | 0 | 0.0% |
| 5 to 9 Unit Apartments | 0 | 0.0% |
| 10 or more Apartments | 0 | 0.0% |
| Mobile Home / Other | 37 | 30.3% |
| Total | 122 | 100.0% |
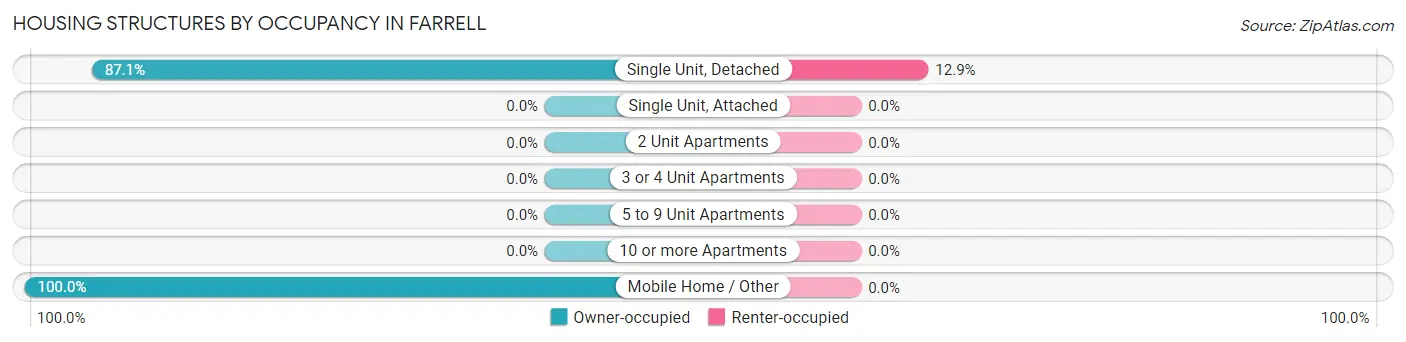
Housing Structures by Occupancy in Farrell
| Structure Type | Owner-occupied | Renter-occupied |
| Single Unit, Detached | 74 (87.1%) | 11 (12.9%) |
| Single Unit, Attached | 0 (0.0%) | 0 (0.0%) |
| 2 Unit Apartments | 0 (0.0%) | 0 (0.0%) |
| 3 or 4 Unit Apartments | 0 (0.0%) | 0 (0.0%) |
| 5 to 9 Unit Apartments | 0 (0.0%) | 0 (0.0%) |
| 10 or more Apartments | 0 (0.0%) | 0 (0.0%) |
| Mobile Home / Other | 37 (100.0%) | 0 (0.0%) |
| Total | 111 (91.0%) | 11 (9.0%) |
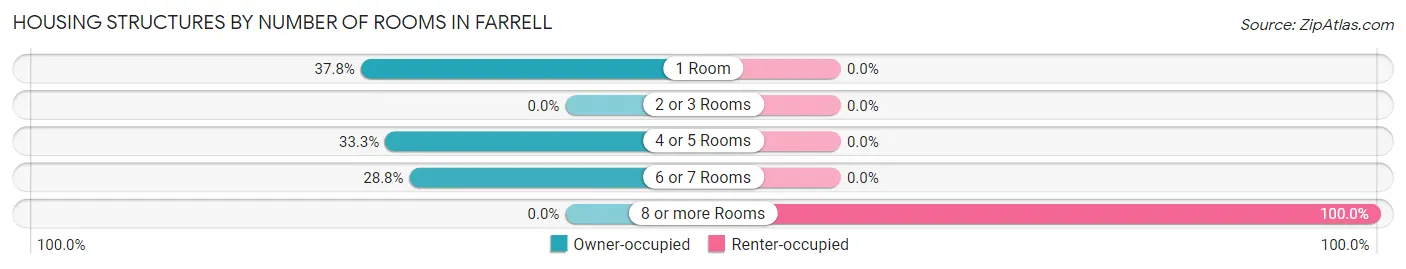
Housing Structures by Number of Rooms in Farrell
| Number of Rooms | Owner-occupied | Renter-occupied |
| 1 Room | 42 (37.8%) | 0 (0.0%) |
| 2 or 3 Rooms | 0 (0.0%) | 0 (0.0%) |
| 4 or 5 Rooms | 37 (33.3%) | 0 (0.0%) |
| 6 or 7 Rooms | 32 (28.8%) | 0 (0.0%) |
| 8 or more Rooms | 0 (0.0%) | 11 (100.0%) |
| Total | 111 (100.0%) | 11 (100.0%) |
Housing Structure by Heating Type in Farrell
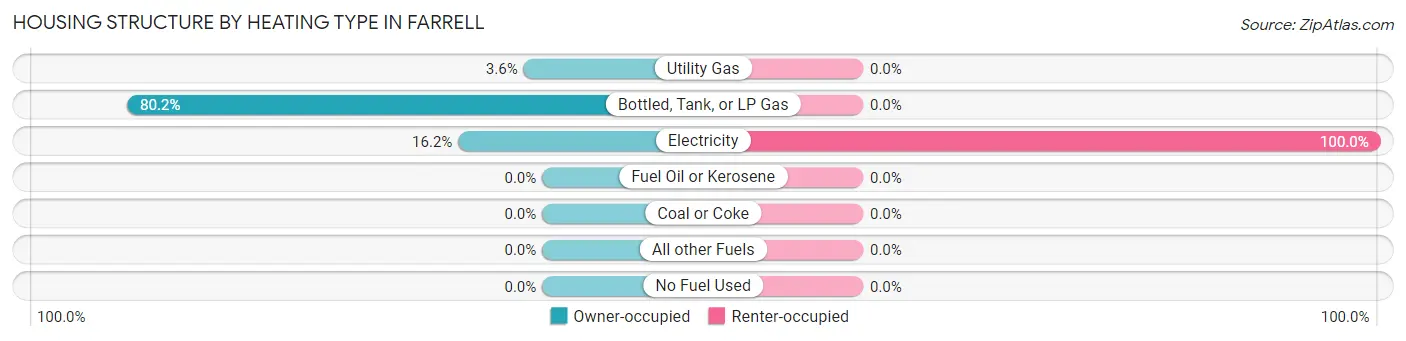
| Heating Type | Owner-occupied | Renter-occupied |
| Utility Gas | 4 (3.6%) | 0 (0.0%) |
| Bottled, Tank, or LP Gas | 89 (80.2%) | 0 (0.0%) |
| Electricity | 18 (16.2%) | 11 (100.0%) |
| Fuel Oil or Kerosene | 0 (0.0%) | 0 (0.0%) |
| Coal or Coke | 0 (0.0%) | 0 (0.0%) |
| All other Fuels | 0 (0.0%) | 0 (0.0%) |
| No Fuel Used | 0 (0.0%) | 0 (0.0%) |
| Total | 111 (100.0%) | 11 (100.0%) |
Household Vehicle Usage in Farrell
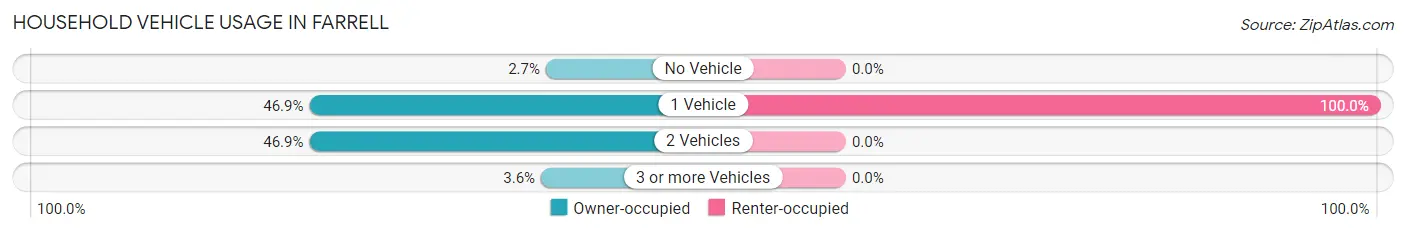
| Vehicles per Household | Owner-occupied | Renter-occupied |
| No Vehicle | 3 (2.7%) | 0 (0.0%) |
| 1 Vehicle | 52 (46.9%) | 11 (100.0%) |
| 2 Vehicles | 52 (46.9%) | 0 (0.0%) |
| 3 or more Vehicles | 4 (3.6%) | 0 (0.0%) |
| Total | 111 (100.0%) | 11 (100.0%) |
Real Estate & Mortgages in Farrell
Real Estate and Mortgage Overview in Farrell
| Characteristic | Without Mortgage | With Mortgage |
| Housing Units | 111 | 0 |
| Median Property Value | $32,200 | $0 |
| Median Household Income | $42,695 | $0 |
| Monthly Housing Costs | $235 | $0 |
| Real Estate Taxes | $273 | $0 |
Property Value by Mortgage Status in Farrell
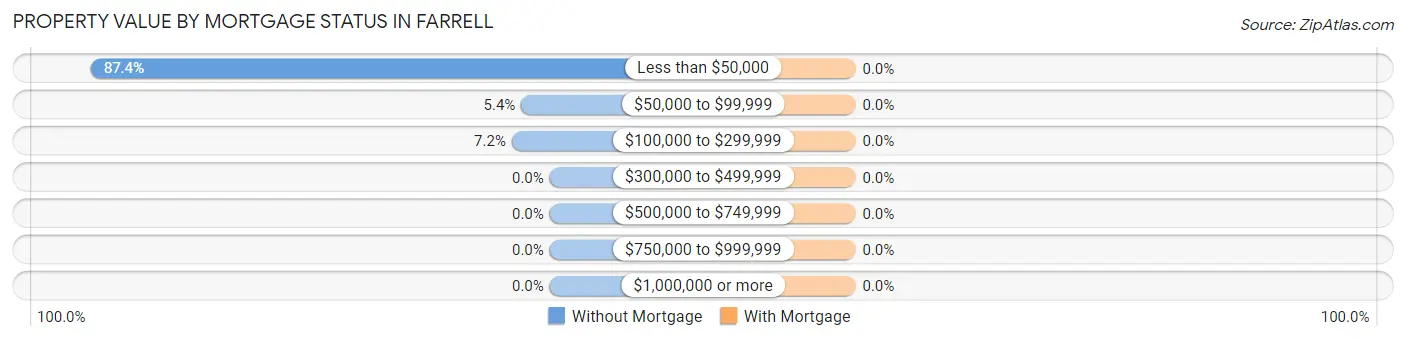
| Property Value | Without Mortgage | With Mortgage |
| Less than $50,000 | 97 (87.4%) | 0 (0.0%) |
| $50,000 to $99,999 | 6 (5.4%) | 0 (0.0%) |
| $100,000 to $299,999 | 8 (7.2%) | 0 (0.0%) |
| $300,000 to $499,999 | 0 (0.0%) | 0 (0.0%) |
| $500,000 to $749,999 | 0 (0.0%) | 0 (0.0%) |
| $750,000 to $999,999 | 0 (0.0%) | 0 (0.0%) |
| $1,000,000 or more | 0 (0.0%) | 0 (0.0%) |
| Total | 111 (100.0%) | 0 (0.0%) |
Household Income by Mortgage Status in Farrell

| Household Income | Without Mortgage | With Mortgage |
| Less than $10,000 | 0 (0.0%) | 0 (0.0%) |
| $10,000 to $24,999 | 4 (3.6%) | 0 (0.0%) |
| $25,000 to $34,999 | 7 (6.3%) | 0 (0.0%) |
| $35,000 to $49,999 | 77 (69.4%) | 0 (0.0%) |
| $50,000 to $74,999 | 14 (12.6%) | 0 (0.0%) |
| $75,000 to $99,999 | 0 (0.0%) | 0 (0.0%) |
| $100,000 to $149,999 | 9 (8.1%) | 0 (0.0%) |
| $150,000 or more | 0 (0.0%) | 0 (0.0%) |
| Total | 111 (100.0%) | 0 (0.0%) |
Property Value to Household Income Ratio in Farrell
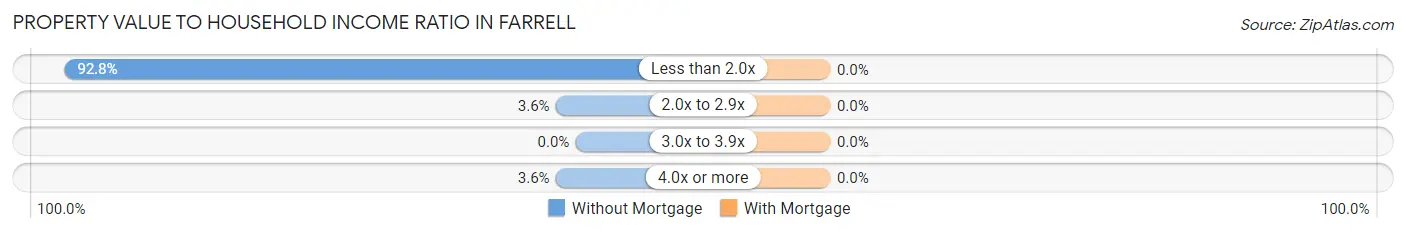
| Value-to-Income Ratio | Without Mortgage | With Mortgage |
| Less than 2.0x | 103 (92.8%) | 0 (0.0%) |
| 2.0x to 2.9x | 4 (3.6%) | 0 (0.0%) |
| 3.0x to 3.9x | 0 (0.0%) | 0 (0.0%) |
| 4.0x or more | 4 (3.6%) | 0 (0.0%) |
| Total | 111 (100.0%) | 0 (0.0%) |
Real Estate Taxes by Mortgage Status in Farrell
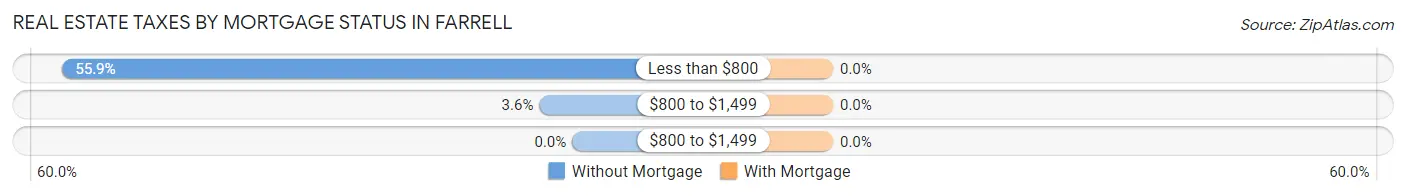
| Property Taxes | Without Mortgage | With Mortgage |
| Less than $800 | 62 (55.9%) | 0 (0.0%) |
| $800 to $1,499 | 4 (3.6%) | 0 (0.0%) |
| $800 to $1,499 | 0 (0.0%) | 0 (0.0%) |
| Total | 111 (100.0%) | 0 (0.0%) |
Health & Disability in Farrell
Health Insurance Coverage by Age in Farrell
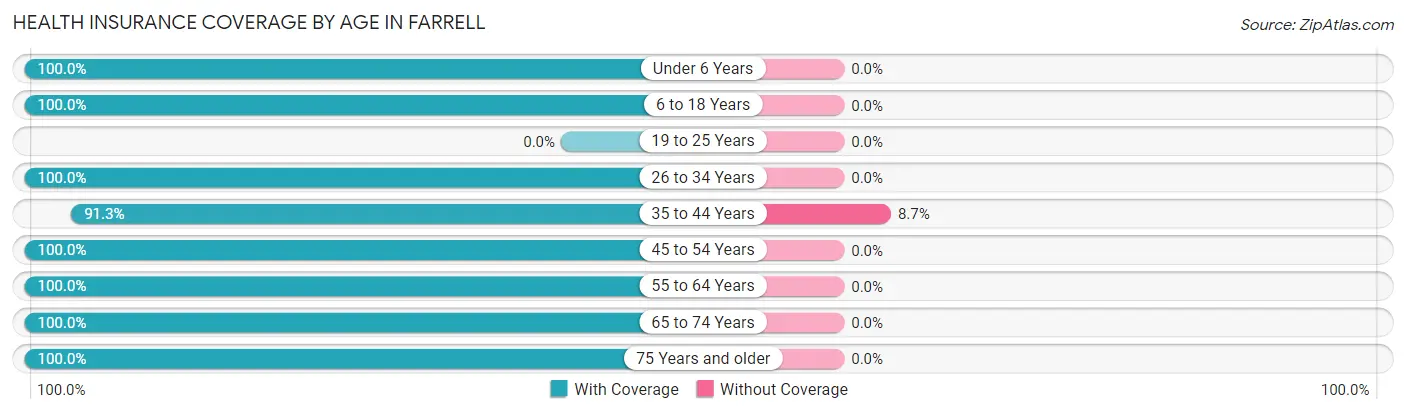
| Age Bracket | With Coverage | Without Coverage |
| Under 6 Years | 37 (100.0%) | 0 (0.0%) |
| 6 to 18 Years | 63 (100.0%) | 0 (0.0%) |
| 19 to 25 Years | 0 (0.0%) | 0 (0.0%) |
| 26 to 34 Years | 29 (100.0%) | 0 (0.0%) |
| 35 to 44 Years | 42 (91.3%) | 4 (8.7%) |
| 45 to 54 Years | 40 (100.0%) | 0 (0.0%) |
| 55 to 64 Years | 26 (100.0%) | 0 (0.0%) |
| 65 to 74 Years | 7 (100.0%) | 0 (0.0%) |
| 75 Years and older | 17 (100.0%) | 0 (0.0%) |
| Total | 261 (98.5%) | 4 (1.5%) |
Health Insurance Coverage by Citizenship Status in Farrell
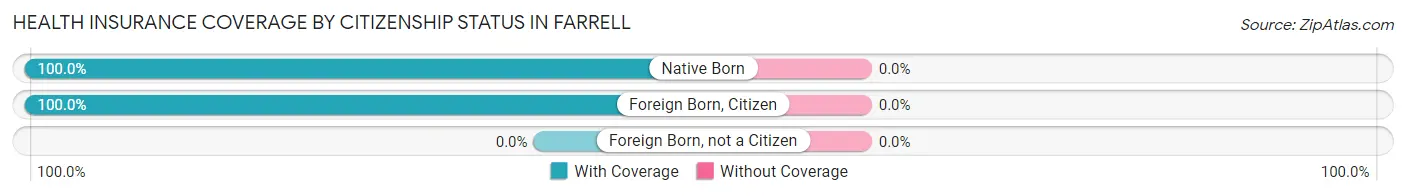
| Citizenship Status | With Coverage | Without Coverage |
| Native Born | 37 (100.0%) | 0 (0.0%) |
| Foreign Born, Citizen | 63 (100.0%) | 0 (0.0%) |
| Foreign Born, not a Citizen | 0 (0.0%) | 0 (0.0%) |
Health Insurance Coverage by Household Income in Farrell
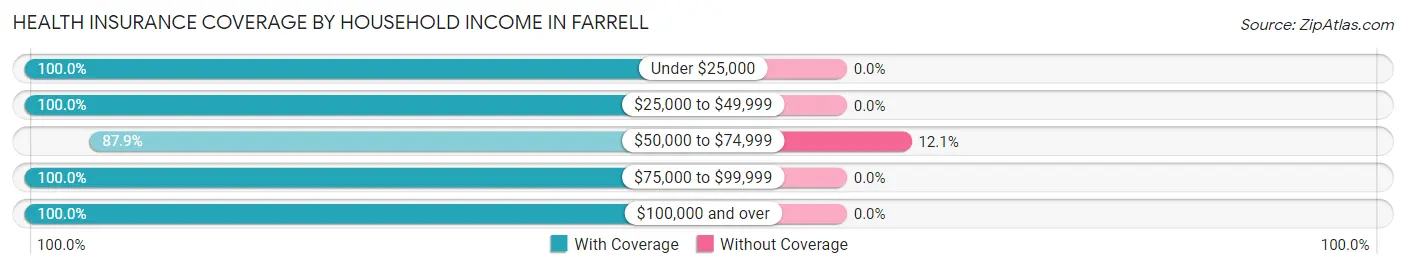
| Household Income | With Coverage | Without Coverage |
| Under $25,000 | 4 (100.0%) | 0 (0.0%) |
| $25,000 to $49,999 | 135 (100.0%) | 0 (0.0%) |
| $50,000 to $74,999 | 29 (87.9%) | 4 (12.1%) |
| $75,000 to $99,999 | 67 (100.0%) | 0 (0.0%) |
| $100,000 and over | 26 (100.0%) | 0 (0.0%) |
Public vs Private Health Insurance Coverage by Age in Farrell
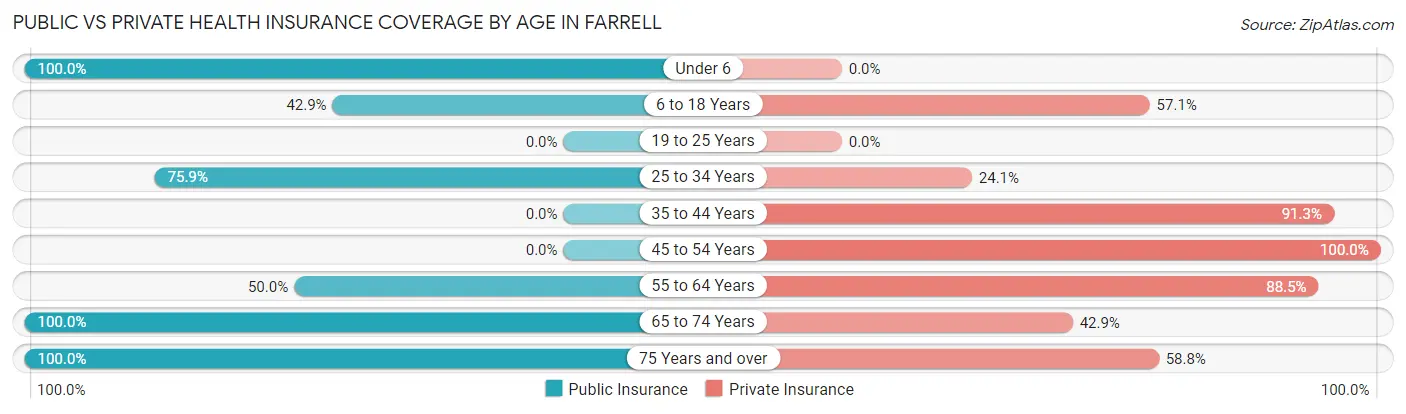
| Age Bracket | Public Insurance | Private Insurance |
| Under 6 | 37 (100.0%) | 0 (0.0%) |
| 6 to 18 Years | 27 (42.9%) | 36 (57.1%) |
| 19 to 25 Years | 0 (0.0%) | 0 (0.0%) |
| 25 to 34 Years | 22 (75.9%) | 7 (24.1%) |
| 35 to 44 Years | 0 (0.0%) | 42 (91.3%) |
| 45 to 54 Years | 0 (0.0%) | 40 (100.0%) |
| 55 to 64 Years | 13 (50.0%) | 23 (88.5%) |
| 65 to 74 Years | 7 (100.0%) | 3 (42.9%) |
| 75 Years and over | 17 (100.0%) | 10 (58.8%) |
| Total | 123 (46.4%) | 161 (60.8%) |
Disability Status by Sex by Age in Farrell
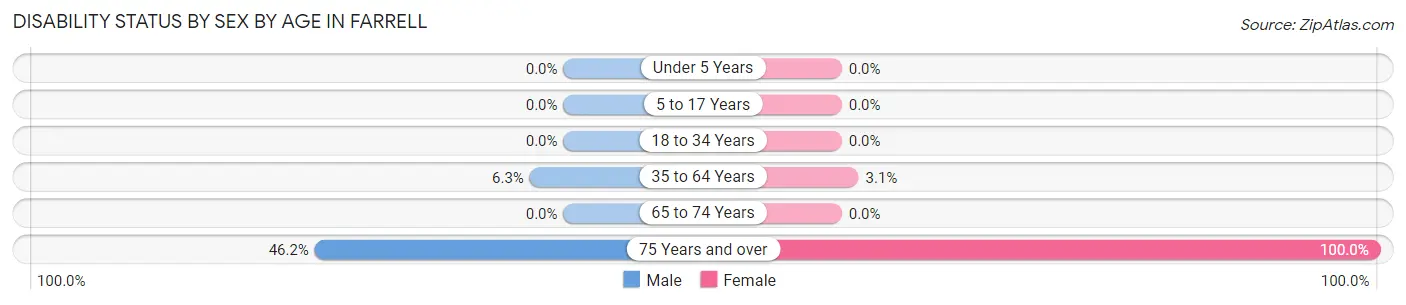
| Age Bracket | Male | Female |
| Under 5 Years | 0 (0.0%) | 0 (0.0%) |
| 5 to 17 Years | 0 (0.0%) | 0 (0.0%) |
| 18 to 34 Years | 0 (0.0%) | 0 (0.0%) |
| 35 to 64 Years | 3 (6.2%) | 2 (3.1%) |
| 65 to 74 Years | 0 (0.0%) | 0 (0.0%) |
| 75 Years and over | 6 (46.2%) | 4 (100.0%) |
Disability Class by Sex by Age in Farrell
Disability Class: Hearing Difficulty
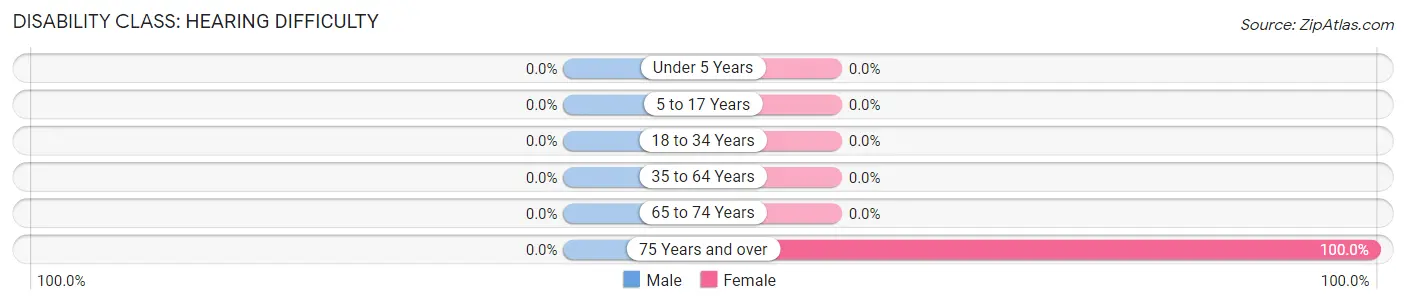
| Age Bracket | Male | Female |
| Under 5 Years | 0 (0.0%) | 0 (0.0%) |
| 5 to 17 Years | 0 (0.0%) | 0 (0.0%) |
| 18 to 34 Years | 0 (0.0%) | 0 (0.0%) |
| 35 to 64 Years | 0 (0.0%) | 0 (0.0%) |
| 65 to 74 Years | 0 (0.0%) | 0 (0.0%) |
| 75 Years and over | 0 (0.0%) | 4 (100.0%) |
Disability Class: Vision Difficulty
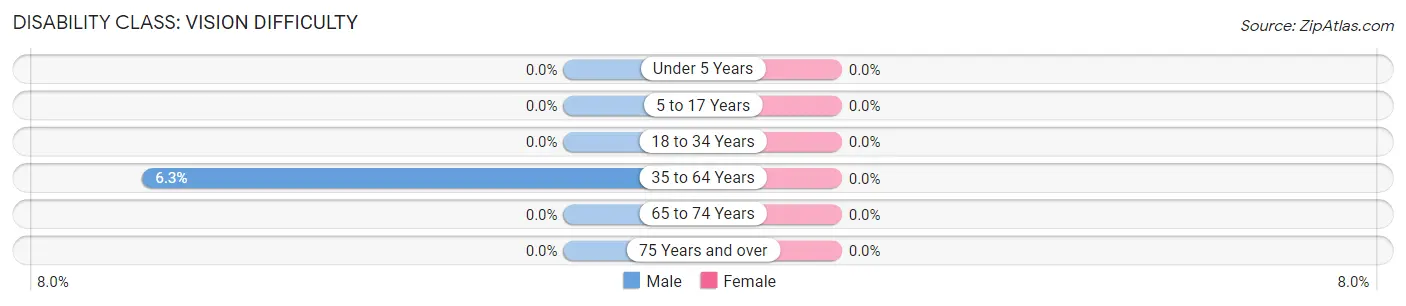
| Age Bracket | Male | Female |
| Under 5 Years | 0 (0.0%) | 0 (0.0%) |
| 5 to 17 Years | 0 (0.0%) | 0 (0.0%) |
| 18 to 34 Years | 0 (0.0%) | 0 (0.0%) |
| 35 to 64 Years | 3 (6.2%) | 0 (0.0%) |
| 65 to 74 Years | 0 (0.0%) | 0 (0.0%) |
| 75 Years and over | 0 (0.0%) | 0 (0.0%) |
Disability Class: Cognitive Difficulty
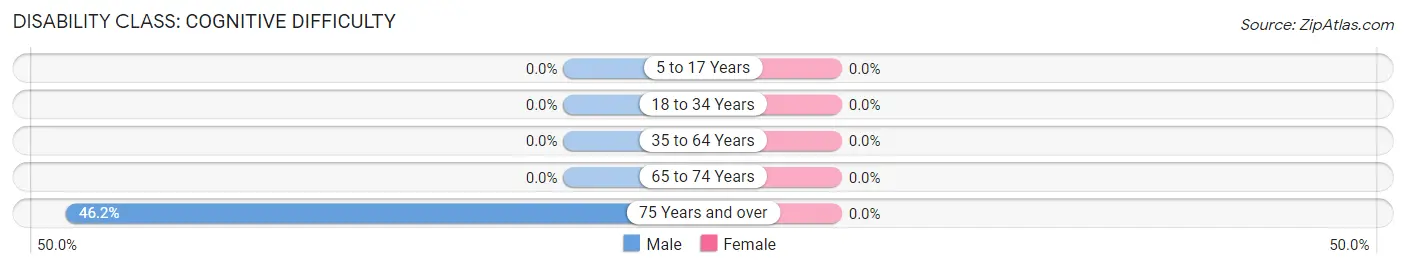
| Age Bracket | Male | Female |
| 5 to 17 Years | 0 (0.0%) | 0 (0.0%) |
| 18 to 34 Years | 0 (0.0%) | 0 (0.0%) |
| 35 to 64 Years | 0 (0.0%) | 0 (0.0%) |
| 65 to 74 Years | 0 (0.0%) | 0 (0.0%) |
| 75 Years and over | 6 (46.2%) | 0 (0.0%) |
Disability Class: Ambulatory Difficulty
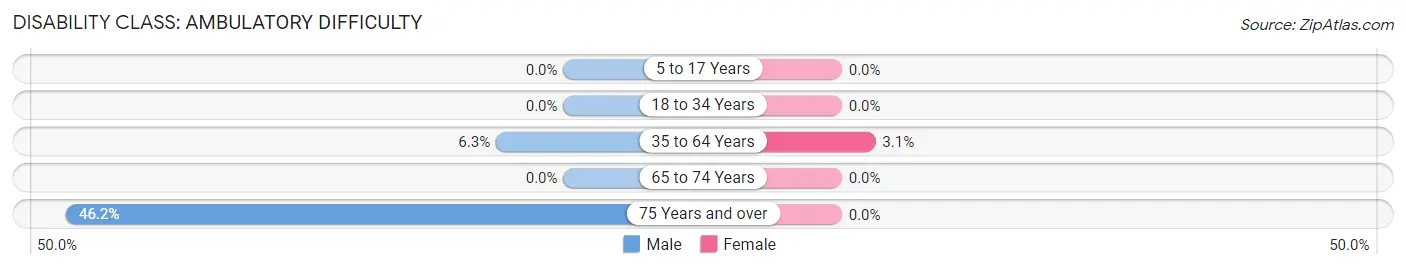
| Age Bracket | Male | Female |
| 5 to 17 Years | 0 (0.0%) | 0 (0.0%) |
| 18 to 34 Years | 0 (0.0%) | 0 (0.0%) |
| 35 to 64 Years | 3 (6.2%) | 2 (3.1%) |
| 65 to 74 Years | 0 (0.0%) | 0 (0.0%) |
| 75 Years and over | 6 (46.2%) | 0 (0.0%) |
Disability Class: Self-Care Difficulty

| Age Bracket | Male | Female |
| 5 to 17 Years | 0 (0.0%) | 0 (0.0%) |
| 18 to 34 Years | 0 (0.0%) | 0 (0.0%) |
| 35 to 64 Years | 0 (0.0%) | 0 (0.0%) |
| 65 to 74 Years | 0 (0.0%) | 0 (0.0%) |
| 75 Years and over | 6 (46.2%) | 0 (0.0%) |
Technology Access in Farrell
Computing Device Access in Farrell
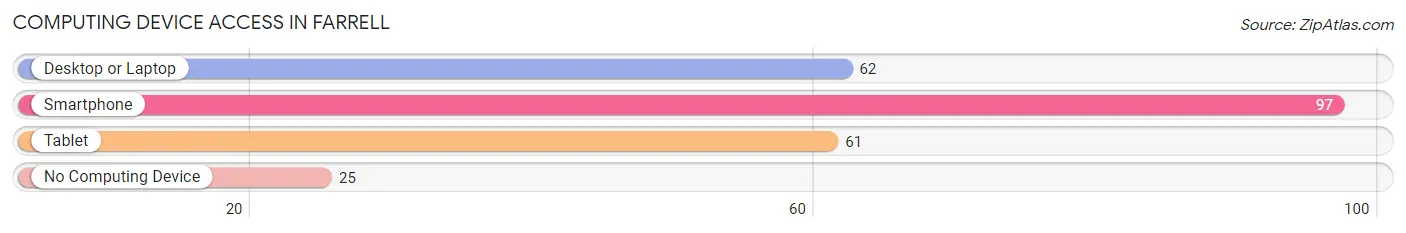
| Device Type | # Households | % Households |
| Desktop or Laptop | 62 | 50.8% |
| Smartphone | 97 | 79.5% |
| Tablet | 61 | 50.0% |
| No Computing Device | 25 | 20.5% |
| Total | 122 | 100.0% |
Internet Access in Farrell
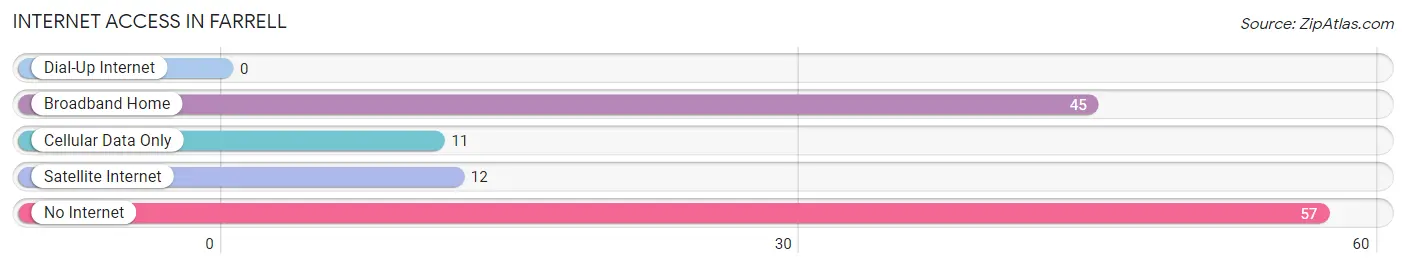
| Internet Type | # Households | % Households |
| Dial-Up Internet | 0 | 0.0% |
| Broadband Home | 45 | 36.9% |
| Cellular Data Only | 11 | 9.0% |
| Satellite Internet | 12 | 9.8% |
| No Internet | 57 | 46.7% |
| Total | 122 | 100.0% |
Farrell Summary
The city of Farrell, Pennsylvania is located in Mercer County in the western part of the state. It is situated along the Shenango River and is part of the Youngstown-Warren-Boardman metropolitan area. The city has a population of approximately 5,000 people and is known for its strong industrial heritage.
History
Farrell was founded in 1891 by the Farrell Brothers, who were looking to capitalize on the area’s natural resources. The city was named after the brothers’ father, James Farrell, who had been a successful businessman in the area. The city quickly grew and by the early 1900s, it was a thriving industrial center. The city was home to several steel mills, coal mines, and other industries.
The city’s economy was heavily dependent on the steel industry, and when the industry began to decline in the 1970s, Farrell was hit hard. Many of the steel mills and other industries closed, leaving the city with a high unemployment rate. In the 1980s, the city began to diversify its economy and attract new businesses. Today, Farrell is home to a variety of businesses, including manufacturing, healthcare, and retail.
Geography
Farrell is located in western Pennsylvania, about 30 miles northwest of Pittsburgh. The city is situated along the Shenango River and is part of the Youngstown-Warren-Boardman metropolitan area. The city has a total area of 2.2 square miles, all of which is land. The terrain is mostly flat, with some rolling hills in the northern part of the city.
The climate in Farrell is typical of the region, with cold winters and hot, humid summers. The average annual temperature is around 50 degrees Fahrenheit, with average highs in the summer reaching around 80 degrees and lows in the winter dropping to around 20 degrees.
Economy
Farrell’s economy is largely based on manufacturing and healthcare. The city is home to several manufacturing companies, including a steel mill, a plastics plant, and a paper mill. The city is also home to several healthcare facilities, including a hospital and several medical offices.
In addition to manufacturing and healthcare, Farrell is also home to a variety of retail stores, restaurants, and other businesses. The city is also home to several educational institutions, including a community college and a vocational school.
Demographics
As of the 2010 census, Farrell had a population of 5,000 people. The racial makeup of the city was 79.3% White, 16.2% African American, 0.3% Native American, 0.7% Asian, and 3.5% from other races. The median household income was $27,000, and the median age was 37.
Farrell is a diverse city, with a variety of cultures and backgrounds represented. The city is home to a large Italian-American population, as well as a growing Hispanic population. The city also has a large African-American population, with many of the city’s residents having roots in the South.
Common Questions
What is Per Capita Income in Farrell?
Per Capita income in Farrell is $23,113.
What is the Median Family Income in Farrell?
Median Family Income in Farrell is $36,815.
What is the Median Household income in Farrell?
Median Household Income in Farrell is $43,125.
What is Income or Wage Gap in Farrell?
Income or Wage Gap in Farrell is 17.2%.
Women in Farrell earn 82.8 cents for every dollar earned by a man.
What is Inequality or Gini Index in Farrell?
Inequality or Gini Index in Farrell is 0.23.
What is the Total Population of Farrell?
Total Population of Farrell is 265.
What is the Total Male Population of Farrell?
Total Male Population of Farrell is 102.
What is the Total Female Population of Farrell?
Total Female Population of Farrell is 163.
What is the Ratio of Males per 100 Females in Farrell?
There are 62.58 Males per 100 Females in Farrell.
What is the Ratio of Females per 100 Males in Farrell?
There are 159.80 Females per 100 Males in Farrell.
What is the Median Population Age in Farrell?
Median Population Age in Farrell is 37.1 Years.
What is the Average Family Size in Farrell
Average Family Size in Farrell is 2.8 People.
What is the Average Household Size in Farrell
Average Household Size in Farrell is 2.2 People.
How Large is the Labor Force in Farrell?
There are 114 People in the Labor Forcein in Farrell.
What is the Percentage of People in the Labor Force in Farrell?
69.1% of People are in the Labor Force in Farrell.
What is the Unemployment Rate in Farrell?
Unemployment Rate in Farrell is 3.5%.