Drew, MS Map & Demographics
Drew Map
Drew Overview
$14,160
PER CAPITA INCOME
$26,528
AVG FAMILY INCOME
$21,512
AVG HOUSEHOLD INCOME
22.1%
WAGE / INCOME GAP [ % ]
77.9¢/ $1
WAGE / INCOME GAP [ $ ]
$13,080
FAMILY INCOME DEFICIT
0.47
INEQUALITY / GINI INDEX
2,225
TOTAL POPULATION
1,025
MALE POPULATION
1,200
FEMALE POPULATION
85.42
MALES / 100 FEMALES
117.07
FEMALES / 100 MALES
36.1
MEDIAN AGE
3.6
AVG FAMILY SIZE
2.8
AVG HOUSEHOLD SIZE
881
LABOR FORCE [ PEOPLE ]
50.3%
PERCENT IN LABOR FORCE
11.2%
UNEMPLOYMENT RATE
Drew Zip Codes
Drew Area Codes
Income in Drew
Income Overview in Drew
Per Capita Income in Drew is $14,160, while median incomes of families and households are $26,528 and $21,512 respectively.
| Characteristic | Number | Measure |
| Per Capita Income | 2,225 | $14,160 |
| Median Family Income | 482 | $26,528 |
| Mean Family Income | 482 | $41,812 |
| Median Household Income | 810 | $21,512 |
| Mean Household Income | 810 | $33,538 |
| Income Deficit | 482 | $13,080 |
| Wage / Income Gap (%) | 2,225 | 22.06% |
| Wage / Income Gap ($) | 2,225 | 77.94¢ per $1 |
| Gini / Inequality Index | 2,225 | 0.47 |
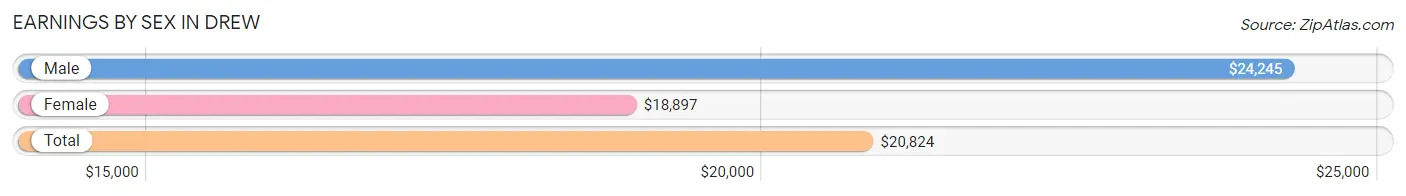
Earnings by Sex in Drew
Average Earnings in Drew are $20,824, $24,245 for men and $18,897 for women, a difference of 22.1%.
| Sex | Number | Average Earnings |
| Male | 325 (39.0%) | $24,245 |
| Female | 509 (61.0%) | $18,897 |
| Total | 834 (100.0%) | $20,824 |
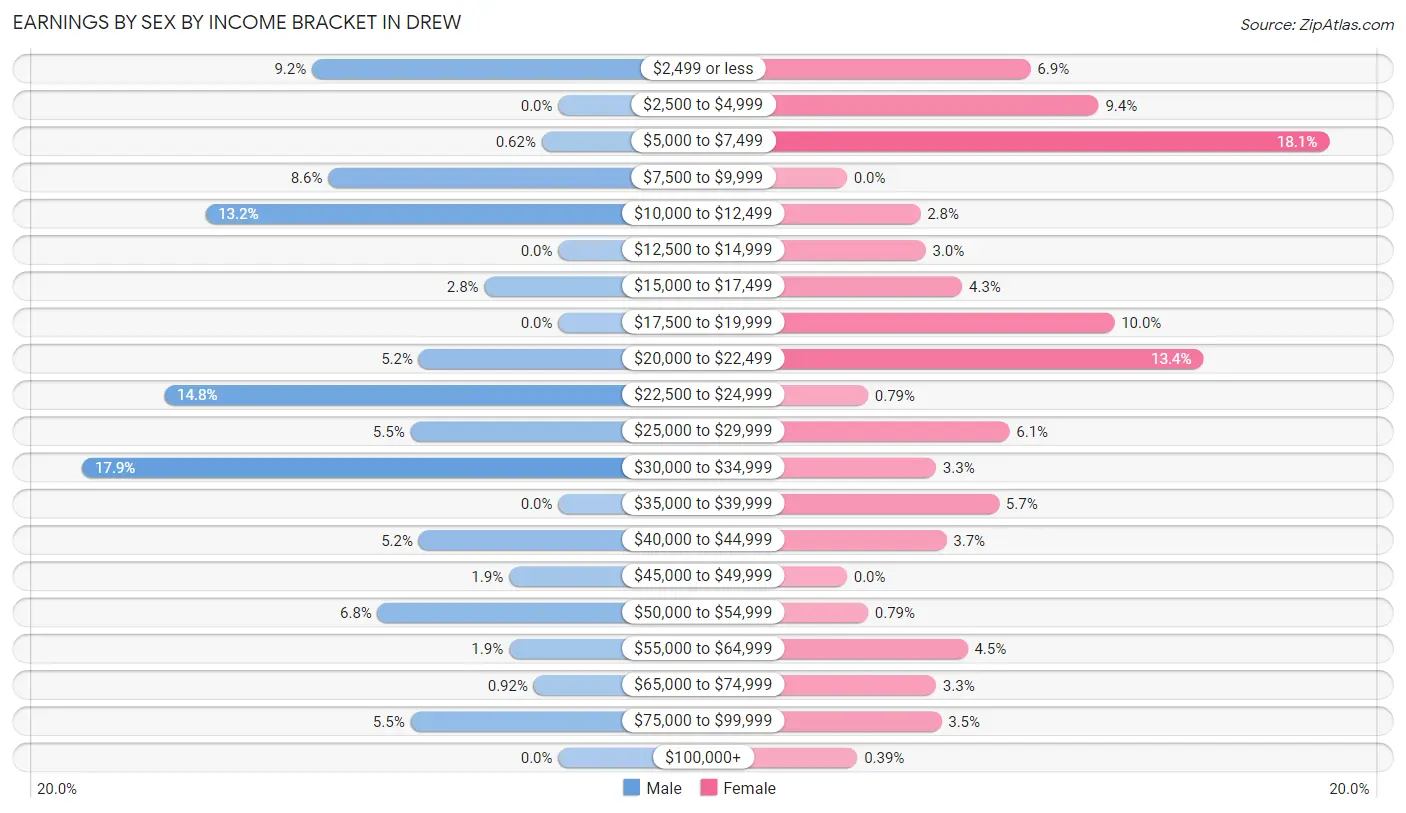
Earnings by Sex by Income Bracket in Drew
The most common earnings brackets in Drew are $30,000 to $34,999 for men (58 | 17.8%) and $5,000 to $7,499 for women (92 | 18.1%).
| Income | Male | Female |
| $2,499 or less | 30 (9.2%) | 35 (6.9%) |
| $2,500 to $4,999 | 0 (0.0%) | 48 (9.4%) |
| $5,000 to $7,499 | 2 (0.6%) | 92 (18.1%) |
| $7,500 to $9,999 | 28 (8.6%) | 0 (0.0%) |
| $10,000 to $12,499 | 43 (13.2%) | 14 (2.8%) |
| $12,500 to $14,999 | 0 (0.0%) | 15 (2.9%) |
| $15,000 to $17,499 | 9 (2.8%) | 22 (4.3%) |
| $17,500 to $19,999 | 0 (0.0%) | 51 (10.0%) |
| $20,000 to $22,499 | 17 (5.2%) | 68 (13.4%) |
| $22,500 to $24,999 | 48 (14.8%) | 4 (0.8%) |
| $25,000 to $29,999 | 18 (5.5%) | 31 (6.1%) |
| $30,000 to $34,999 | 58 (17.8%) | 17 (3.3%) |
| $35,000 to $39,999 | 0 (0.0%) | 29 (5.7%) |
| $40,000 to $44,999 | 17 (5.2%) | 19 (3.7%) |
| $45,000 to $49,999 | 6 (1.8%) | 0 (0.0%) |
| $50,000 to $54,999 | 22 (6.8%) | 4 (0.8%) |
| $55,000 to $64,999 | 6 (1.8%) | 23 (4.5%) |
| $65,000 to $74,999 | 3 (0.9%) | 17 (3.3%) |
| $75,000 to $99,999 | 18 (5.5%) | 18 (3.5%) |
| $100,000+ | 0 (0.0%) | 2 (0.4%) |
| Total | 325 (100.0%) | 509 (100.0%) |
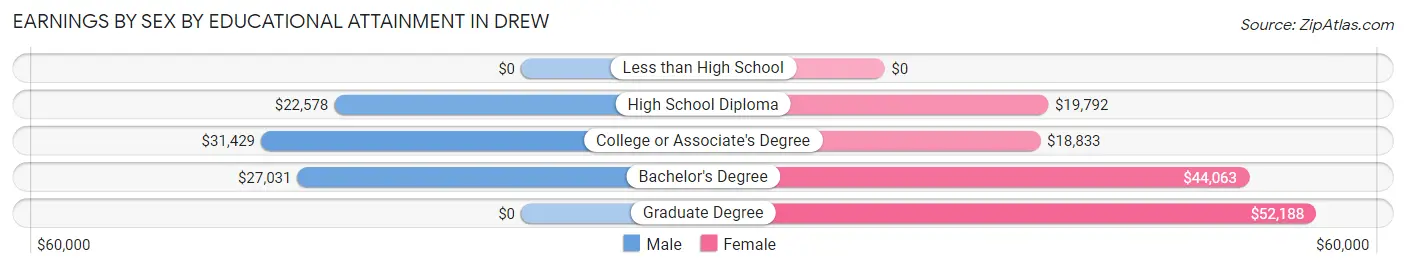
Earnings by Sex by Educational Attainment in Drew
Average earnings in Drew are $25,417 for men and $21,085 for women, a difference of 17.0%. Men with an educational attainment of college or associate's degree enjoy the highest average annual earnings of $31,429, while those with high school diploma education earn the least with $22,578. Women with an educational attainment of graduate degree earn the most with the average annual earnings of $52,188, while those with college or associate's degree education have the smallest earnings of $18,833.
| Educational Attainment | Male Income | Female Income |
| Less than High School | - | - |
| High School Diploma | $22,578 | $19,792 |
| College or Associate's Degree | $31,429 | $18,833 |
| Bachelor's Degree | $27,031 | $44,063 |
| Graduate Degree | - | - |
| Total | $25,417 | $21,085 |
Family Income in Drew
Family Income Brackets in Drew
According to the Drew family income data, there are 113 families falling into the $15,000 to $24,999 income range, which is the most common income bracket and makes up 23.4% of all families.
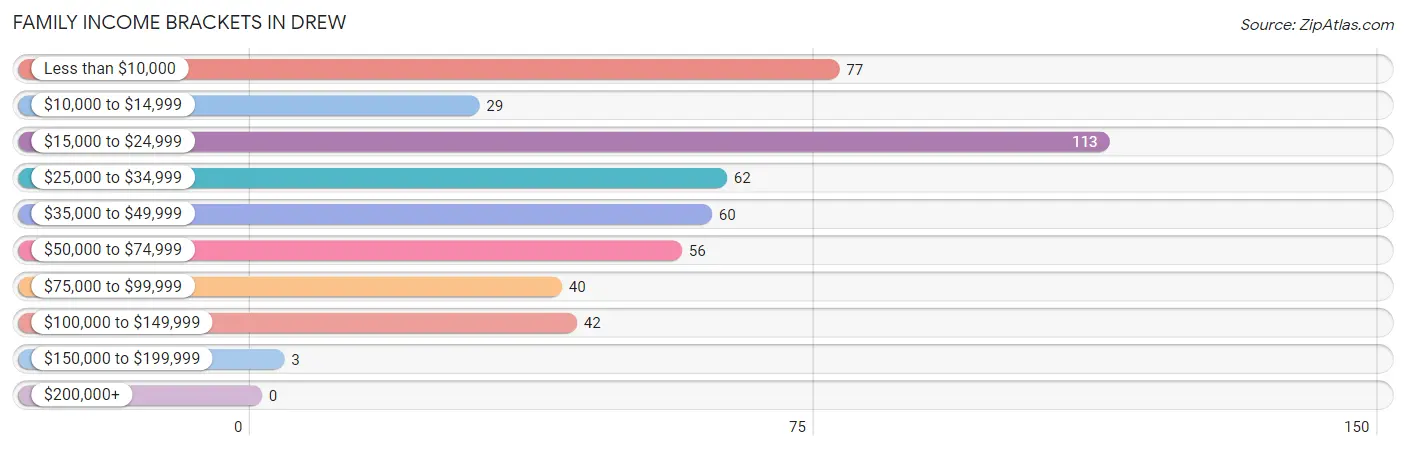
| Income Bracket | # Families | % Families |
| Less than $10,000 | 77 | 16.0% |
| $10,000 to $14,999 | 29 | 6.0% |
| $15,000 to $24,999 | 113 | 23.4% |
| $25,000 to $34,999 | 62 | 12.9% |
| $35,000 to $49,999 | 60 | 12.4% |
| $50,000 to $74,999 | 56 | 11.6% |
| $75,000 to $99,999 | 40 | 8.3% |
| $100,000 to $149,999 | 42 | 8.7% |
| $150,000 to $199,999 | 3 | 0.6% |
| $200,000+ | 0 | 0.0% |
Family Income by Famaliy Size in Drew
4-person families (65 | 13.5%) account for the highest median family income in Drew with $41,250 per family, while 2-person families (288 | 59.8%) have the highest median income of $13,125 per family member.
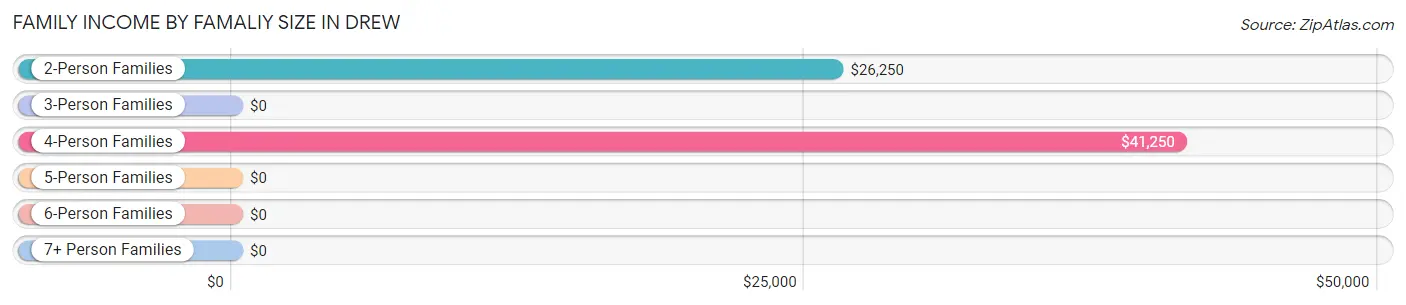
| Income Bracket | # Families | Median Income |
| 2-Person Families | 288 (59.8%) | $26,250 |
| 3-Person Families | 70 (14.5%) | $0 |
| 4-Person Families | 65 (13.5%) | $41,250 |
| 5-Person Families | 45 (9.3%) | $0 |
| 6-Person Families | 10 (2.1%) | $0 |
| 7+ Person Families | 4 (0.8%) | $0 |
| Total | 482 (100.0%) | $26,528 |
Family Income by Number of Earners in Drew
The median family income in Drew is $26,528, with families comprising 3+ earners (16) having the highest median family income of $143,438, while families with no earners (130) have the lowest median family income of $20,400, accounting for 3.3% and 27.0% of families, respectively.
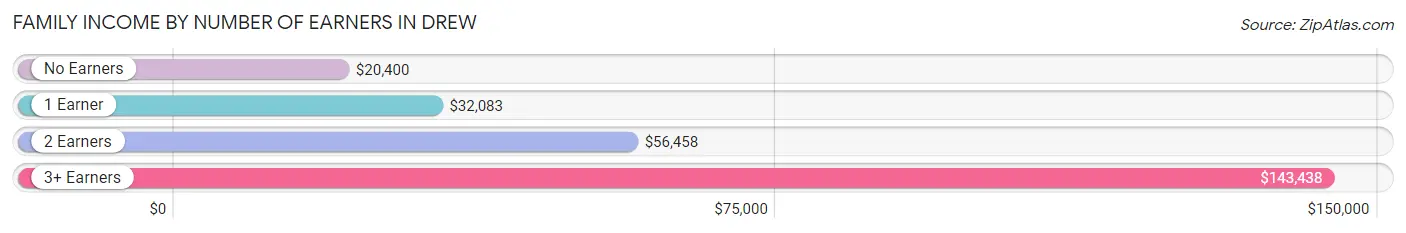
| Number of Earners | # Families | Median Income |
| No Earners | 130 (27.0%) | $20,400 |
| 1 Earner | 251 (52.1%) | $32,083 |
| 2 Earners | 85 (17.6%) | $56,458 |
| 3+ Earners | 16 (3.3%) | $143,438 |
| Total | 482 (100.0%) | $26,528 |
Household Income in Drew
Household Income Brackets in Drew
With 269 households falling in the category, the $15,000 to $24,999 income range is the most frequent in Drew, accounting for 33.2% of all households.
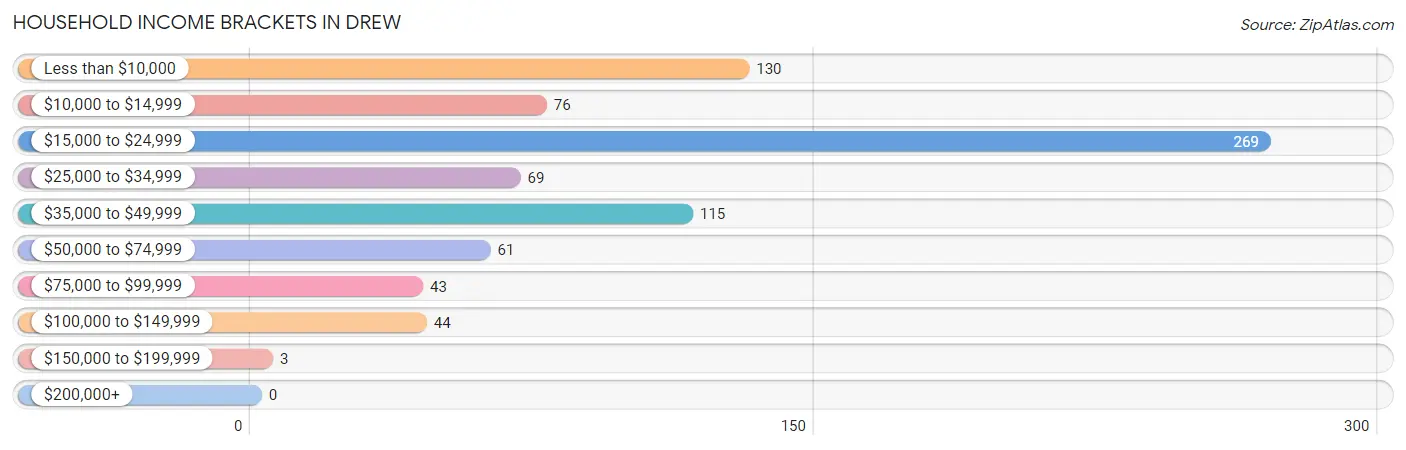
| Income Bracket | # Households | % Households |
| Less than $10,000 | 130 | 16.0% |
| $10,000 to $14,999 | 76 | 9.4% |
| $15,000 to $24,999 | 269 | 33.2% |
| $25,000 to $34,999 | 69 | 8.5% |
| $35,000 to $49,999 | 115 | 14.2% |
| $50,000 to $74,999 | 61 | 7.5% |
| $75,000 to $99,999 | 43 | 5.3% |
| $100,000 to $149,999 | 44 | 5.4% |
| $150,000 to $199,999 | 3 | 0.4% |
| $200,000+ | 0 | 0.0% |
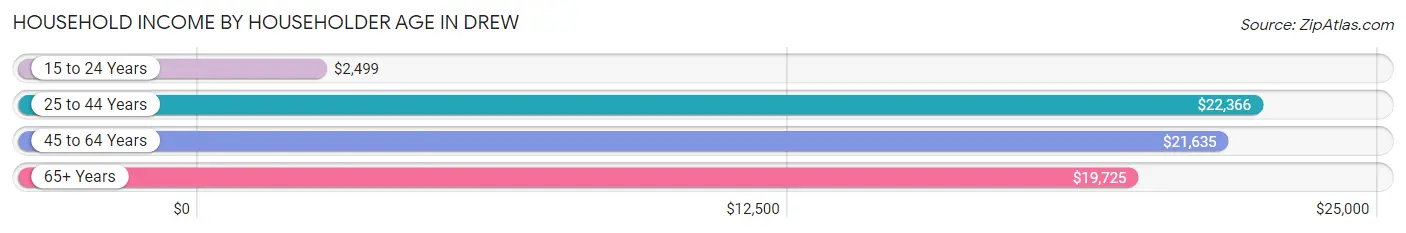
Household Income by Householder Age in Drew
The median household income in Drew is $21,512, with the highest median household income of $22,366 found in the 25 to 44 years age bracket for the primary householder. A total of 278 households (34.3%) fall into this category. Meanwhile, the 15 to 24 years age bracket for the primary householder has the lowest median household income of $2,499, with 40 households (4.9%) in this group.
| Income Bracket | # Households | Median Income |
| 15 to 24 Years | 40 (4.9%) | $2,499 |
| 25 to 44 Years | 278 (34.3%) | $22,366 |
| 45 to 64 Years | 261 (32.2%) | $21,635 |
| 65+ Years | 231 (28.5%) | $19,725 |
| Total | 810 (100.0%) | $21,512 |
Poverty in Drew
Income Below Poverty by Sex and Age in Drew
With 34.8% poverty level for males and 50.1% for females among the residents of Drew, 5 year old males and 16 and 17 year old females are the most vulnerable to poverty, with 21 males (100.0%) and 10 females (100.0%) in their respective age groups living below the poverty level.
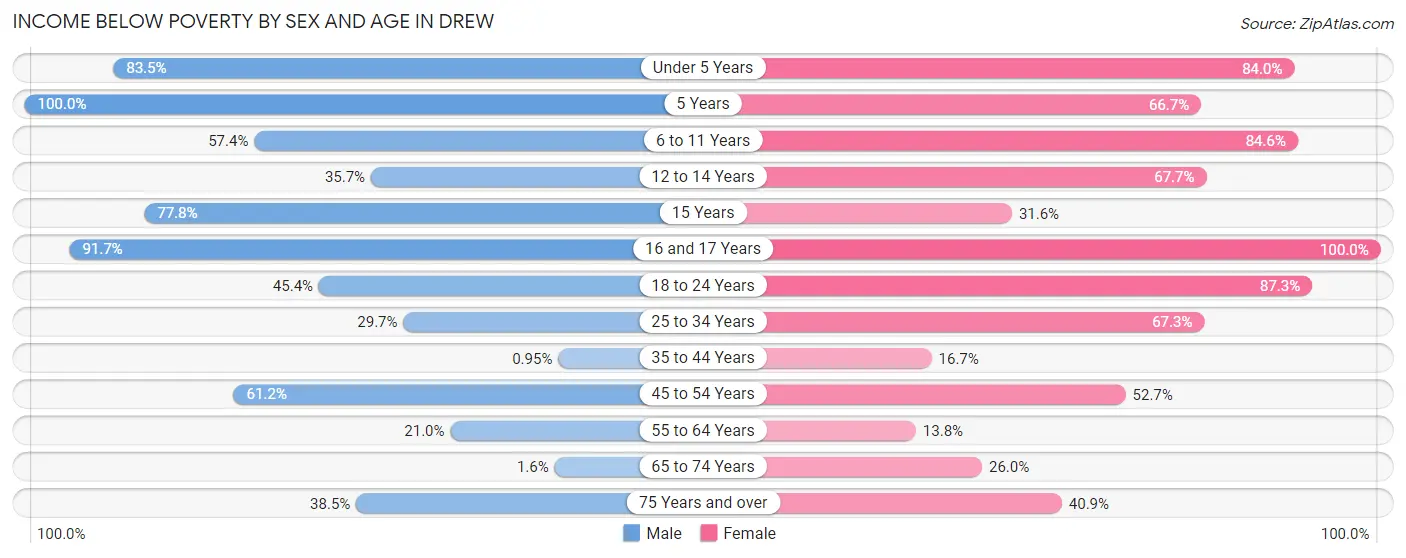
| Age Bracket | Male | Female |
| Under 5 Years | 71 (83.5%) | 110 (84.0%) |
| 5 Years | 21 (100.0%) | 6 (66.7%) |
| 6 to 11 Years | 35 (57.4%) | 44 (84.6%) |
| 12 to 14 Years | 5 (35.7%) | 23 (67.6%) |
| 15 Years | 7 (77.8%) | 18 (31.6%) |
| 16 and 17 Years | 22 (91.7%) | 10 (100.0%) |
| 18 to 24 Years | 49 (45.4%) | 151 (87.3%) |
| 25 to 34 Years | 49 (29.7%) | 74 (67.3%) |
| 35 to 44 Years | 2 (0.9%) | 26 (16.7%) |
| 45 to 54 Years | 71 (61.2%) | 59 (52.7%) |
| 55 to 64 Years | 13 (21.0%) | 26 (13.8%) |
| 65 to 74 Years | 2 (1.6%) | 25 (26.0%) |
| 75 Years and over | 10 (38.5%) | 29 (40.8%) |
| Total | 357 (34.8%) | 601 (50.1%) |
Income Above Poverty by Sex and Age in Drew
According to the poverty statistics in Drew, males aged 35 to 44 years and females aged 55 to 64 years are the age groups that are most secure financially, with 99.1% of males and 86.2% of females in these age groups living above the poverty line.
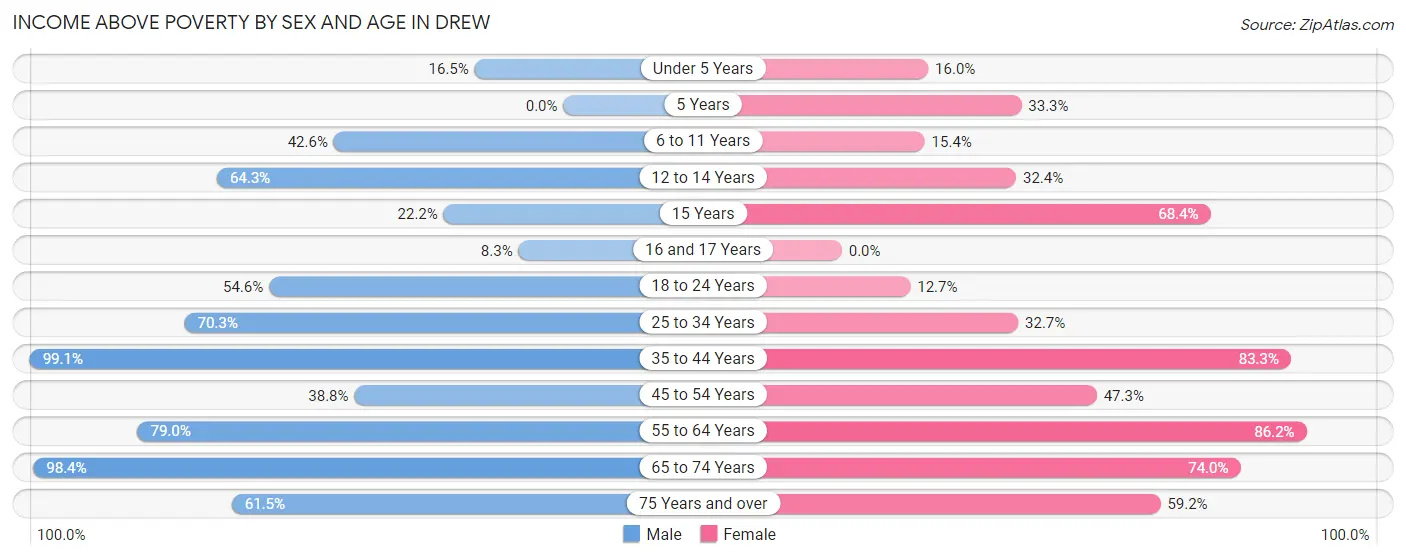
| Age Bracket | Male | Female |
| Under 5 Years | 14 (16.5%) | 21 (16.0%) |
| 5 Years | 0 (0.0%) | 3 (33.3%) |
| 6 to 11 Years | 26 (42.6%) | 8 (15.4%) |
| 12 to 14 Years | 9 (64.3%) | 11 (32.4%) |
| 15 Years | 2 (22.2%) | 39 (68.4%) |
| 16 and 17 Years | 2 (8.3%) | 0 (0.0%) |
| 18 to 24 Years | 59 (54.6%) | 22 (12.7%) |
| 25 to 34 Years | 116 (70.3%) | 36 (32.7%) |
| 35 to 44 Years | 209 (99.1%) | 130 (83.3%) |
| 45 to 54 Years | 45 (38.8%) | 53 (47.3%) |
| 55 to 64 Years | 49 (79.0%) | 163 (86.2%) |
| 65 to 74 Years | 121 (98.4%) | 71 (74.0%) |
| 75 Years and over | 16 (61.5%) | 42 (59.2%) |
| Total | 668 (65.2%) | 599 (49.9%) |
Income Below Poverty Among Married-Couple Families in Drew
The poverty statistics for married-couple families in Drew show that 17.8% or 21 of the total 118 families live below the poverty line. Families with no children have the highest poverty rate of 27.3%, comprising of 21 families. On the other hand, families with 1 or 2 children have the lowest poverty rate of 0.0%, which includes 0 families.
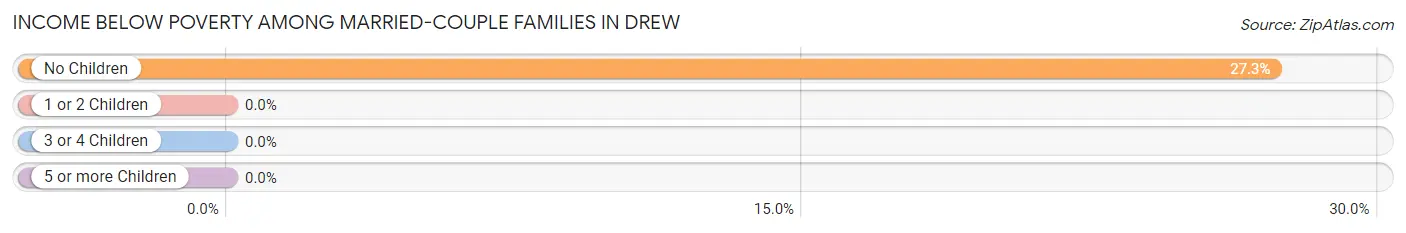
| Children | Above Poverty | Below Poverty |
| No Children | 56 (72.7%) | 21 (27.3%) |
| 1 or 2 Children | 37 (100.0%) | 0 (0.0%) |
| 3 or 4 Children | 4 (100.0%) | 0 (0.0%) |
| 5 or more Children | 0 (0.0%) | 0 (0.0%) |
| Total | 97 (82.2%) | 21 (17.8%) |
Income Below Poverty Among Single-Parent Households in Drew
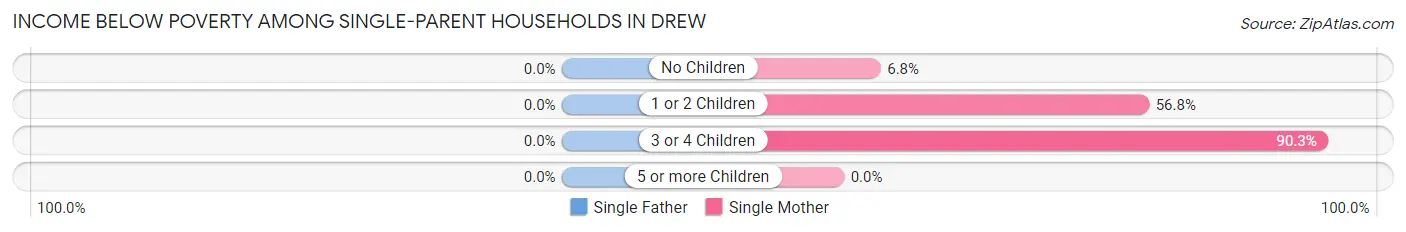
| Children | Single Father | Single Mother |
| No Children | 0 (0.0%) | 9 (6.8%) |
| 1 or 2 Children | 0 (0.0%) | 75 (56.8%) |
| 3 or 4 Children | 0 (0.0%) | 56 (90.3%) |
| 5 or more Children | 0 (0.0%) | 0 (0.0%) |
| Total | 0 (0.0%) | 140 (42.9%) |
Income Below Poverty Among Married-Couple vs Single-Parent Households in Drew
The poverty data for Drew shows that 21 of the married-couple family households (17.8%) and 140 of the single-parent households (38.5%) are living below the poverty level. Within the married-couple family households, those with no children have the highest poverty rate, with 21 households (27.3%) falling below the poverty line. Among the single-parent households, those with 3 or 4 children have the highest poverty rate, with 56 household (90.3%) living below poverty.
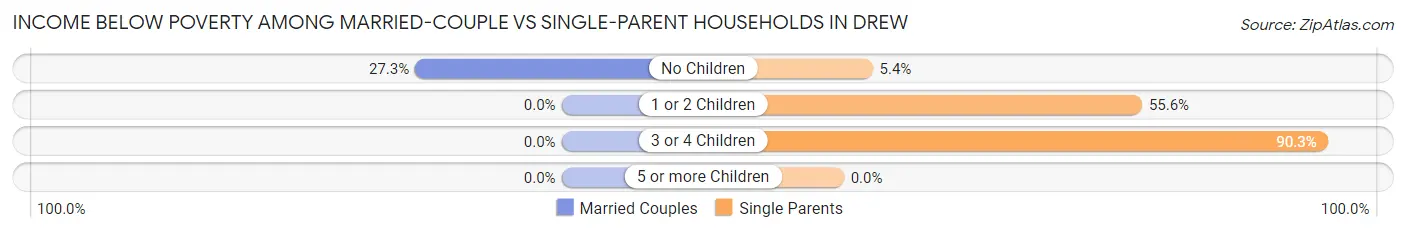
| Children | Married-Couple Families | Single-Parent Households |
| No Children | 21 (27.3%) | 9 (5.4%) |
| 1 or 2 Children | 0 (0.0%) | 75 (55.6%) |
| 3 or 4 Children | 0 (0.0%) | 56 (90.3%) |
| 5 or more Children | 0 (0.0%) | 0 (0.0%) |
| Total | 21 (17.8%) | 140 (38.5%) |
Race in Drew
The most populous races in Drew are Black / African American (1,845 | 82.9%), White / Caucasian (269 | 12.1%), and Hispanic or Latino (89 | 4.0%).
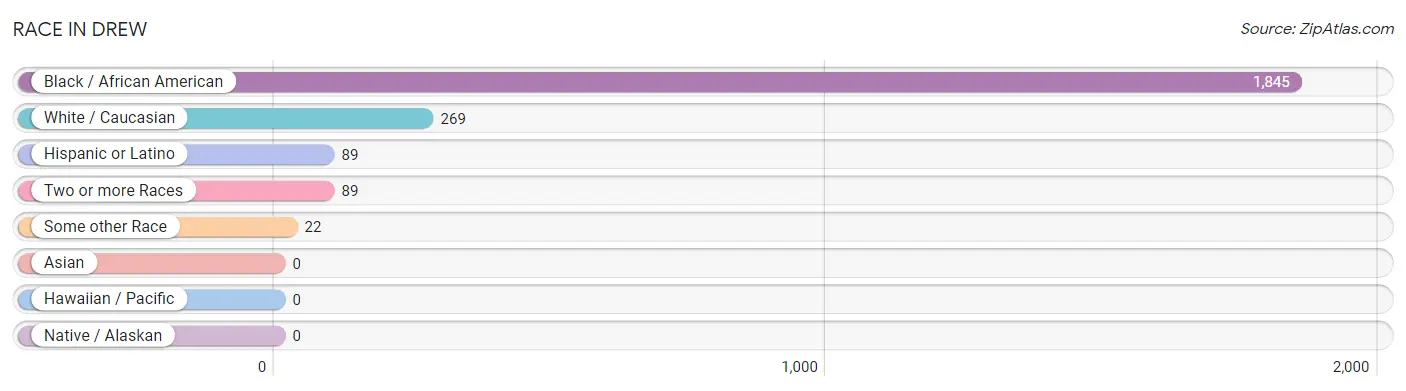
| Race | # Population | % Population |
| Asian | 0 | 0.0% |
| Black / African American | 1,845 | 82.9% |
| Hawaiian / Pacific | 0 | 0.0% |
| Hispanic or Latino | 89 | 4.0% |
| Native / Alaskan | 0 | 0.0% |
| White / Caucasian | 269 | 12.1% |
| Two or more Races | 89 | 4.0% |
| Some other Race | 22 | 1.0% |
| Total | 2,225 | 100.0% |
Ancestry in Drew
The most populous ancestries reported in Drew are American (381 | 17.1%), Mexican (74 | 3.3%), English (57 | 2.6%), Irish (34 | 1.5%), and German (22 | 1.0%), together accounting for 25.5% of all Drew residents.
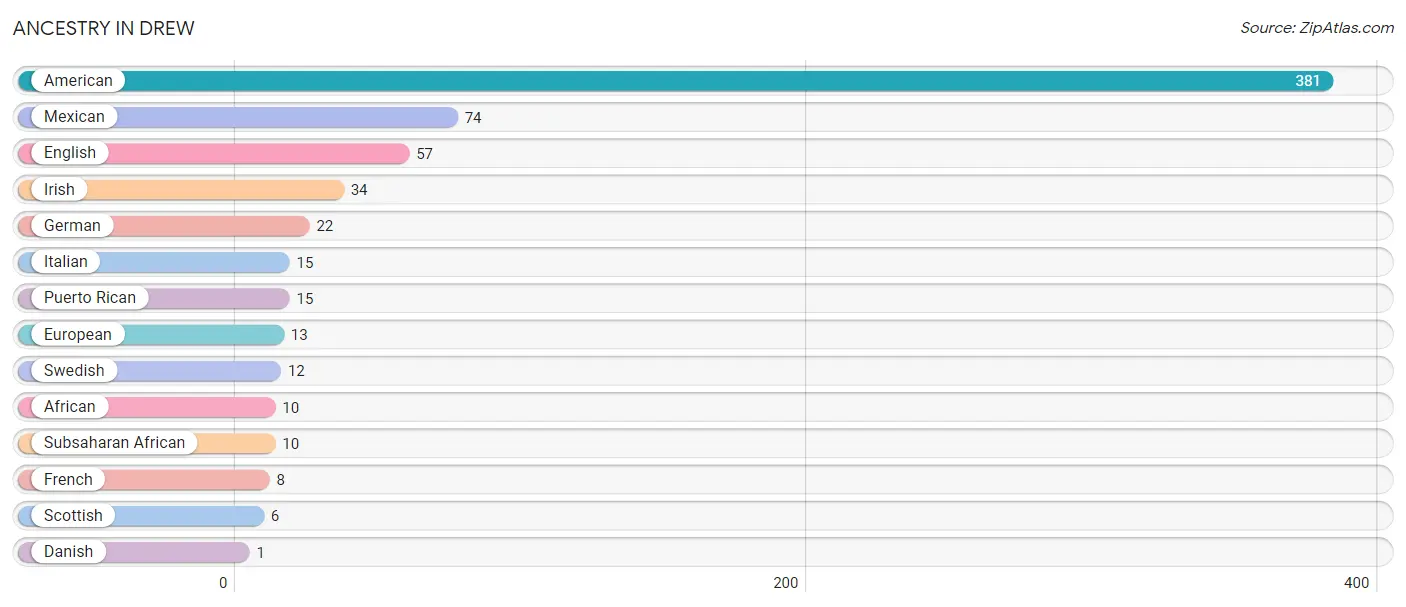
| Ancestry | # Population | % Population |
| African | 10 | 0.4% |
| American | 381 | 17.1% |
| Danish | 1 | 0.0% |
| English | 57 | 2.6% |
| European | 13 | 0.6% |
| French | 8 | 0.4% |
| German | 22 | 1.0% |
| Irish | 34 | 1.5% |
| Italian | 15 | 0.7% |
| Mexican | 74 | 3.3% |
| Puerto Rican | 15 | 0.7% |
| Scottish | 6 | 0.3% |
| Subsaharan African | 10 | 0.4% |
| Swedish | 12 | 0.5% | View All 14 Rows |
Immigrants in Drew

| Immigration Origin | # Population | % Population | View All 0 Rows |
Sex and Age in Drew
Sex and Age in Drew
The most populous age groups in Drew are 35 to 39 Years (158 | 15.4%) for men and 20 to 24 Years (170 | 14.2%) for women.
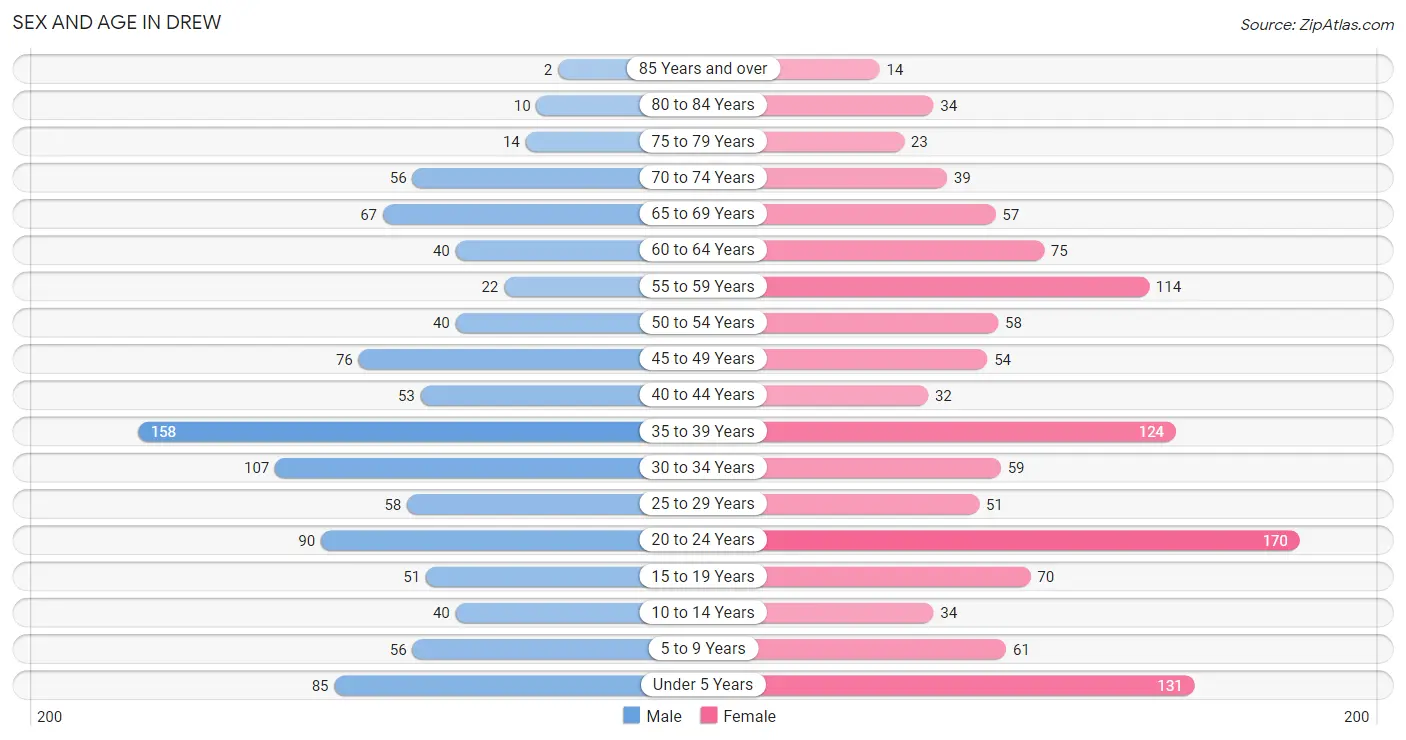
| Age Bracket | Male | Female |
| Under 5 Years | 85 (8.3%) | 131 (10.9%) |
| 5 to 9 Years | 56 (5.5%) | 61 (5.1%) |
| 10 to 14 Years | 40 (3.9%) | 34 (2.8%) |
| 15 to 19 Years | 51 (5.0%) | 70 (5.8%) |
| 20 to 24 Years | 90 (8.8%) | 170 (14.2%) |
| 25 to 29 Years | 58 (5.7%) | 51 (4.3%) |
| 30 to 34 Years | 107 (10.4%) | 59 (4.9%) |
| 35 to 39 Years | 158 (15.4%) | 124 (10.3%) |
| 40 to 44 Years | 53 (5.2%) | 32 (2.7%) |
| 45 to 49 Years | 76 (7.4%) | 54 (4.5%) |
| 50 to 54 Years | 40 (3.9%) | 58 (4.8%) |
| 55 to 59 Years | 22 (2.1%) | 114 (9.5%) |
| 60 to 64 Years | 40 (3.9%) | 75 (6.2%) |
| 65 to 69 Years | 67 (6.5%) | 57 (4.8%) |
| 70 to 74 Years | 56 (5.5%) | 39 (3.3%) |
| 75 to 79 Years | 14 (1.4%) | 23 (1.9%) |
| 80 to 84 Years | 10 (1.0%) | 34 (2.8%) |
| 85 Years and over | 2 (0.2%) | 14 (1.2%) |
| Total | 1,025 (100.0%) | 1,200 (100.0%) |
Families and Households in Drew
Median Family Size in Drew
The median family size in Drew is 3.56 persons per family, with single female/mother families (326 | 67.6%) accounting for the largest median family size of 3.75 persons per family. On the other hand, married-couple families (118 | 24.5%) represent the smallest median family size with 2.99 persons per family.
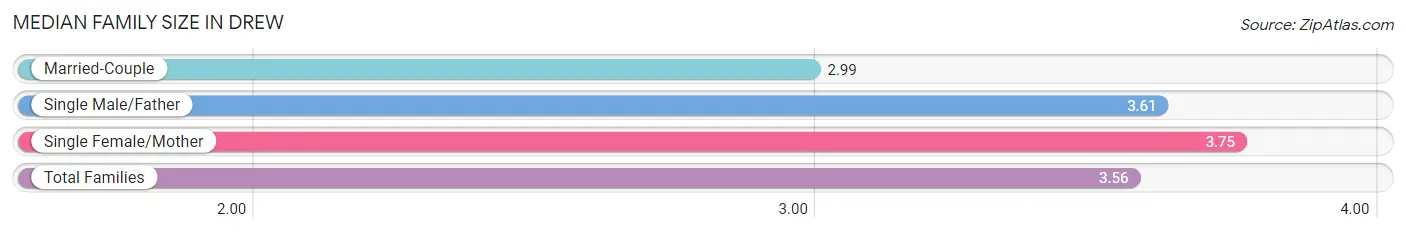
| Family Type | # Families | Family Size |
| Married-Couple | 118 (24.5%) | 2.99 |
| Single Male/Father | 38 (7.9%) | 3.61 |
| Single Female/Mother | 326 (67.6%) | 3.75 |
| Total Families | 482 (100.0%) | 3.56 |
Median Household Size in Drew
The median household size in Drew is 2.75 persons per household, with single female/mother households (326 | 40.3%) accounting for the largest median household size of 4.07 persons per household. non-family households (328 | 40.5%) represent the smallest median household size with 1.23 persons per household.
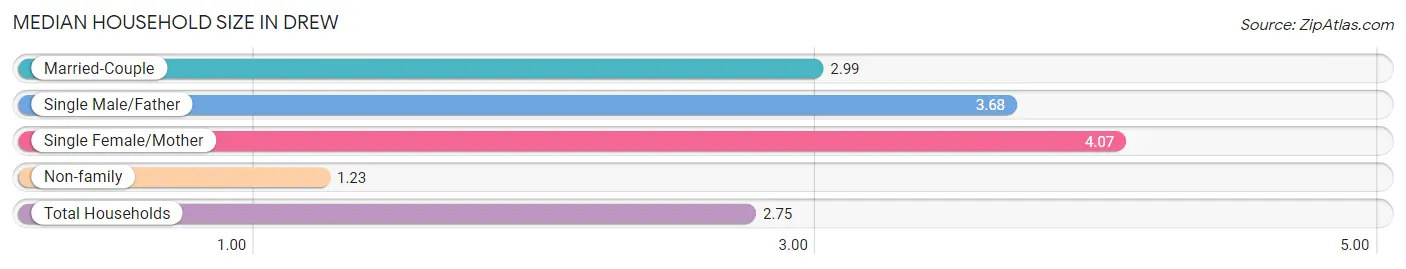
| Household Type | # Households | Household Size |
| Married-Couple | 118 (14.6%) | 2.99 |
| Single Male/Father | 38 (4.7%) | 3.68 |
| Single Female/Mother | 326 (40.3%) | 4.07 |
| Non-family | 328 (40.5%) | 1.23 |
| Total Households | 810 (100.0%) | 2.75 |
Household Size by Marriage Status in Drew
Out of a total of 810 households in Drew, 482 (59.5%) are family households, while 328 (40.5%) are nonfamily households. The most numerous type of family households are 2-person households, comprising 231, and the most common type of nonfamily households are 1-person households, comprising 314.
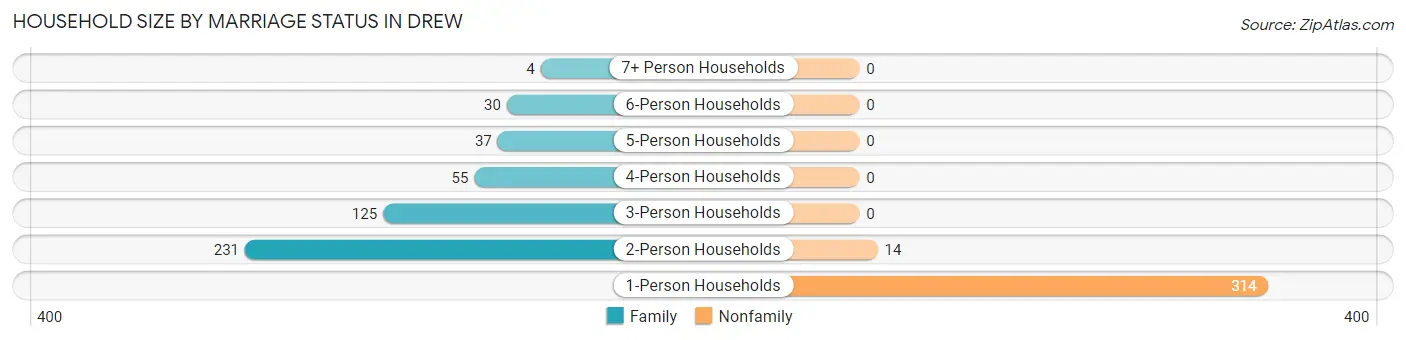
| Household Size | Family Households | Nonfamily Households |
| 1-Person Households | - | 314 (38.8%) |
| 2-Person Households | 231 (28.5%) | 14 (1.7%) |
| 3-Person Households | 125 (15.4%) | 0 (0.0%) |
| 4-Person Households | 55 (6.8%) | 0 (0.0%) |
| 5-Person Households | 37 (4.6%) | 0 (0.0%) |
| 6-Person Households | 30 (3.7%) | 0 (0.0%) |
| 7+ Person Households | 4 (0.5%) | 0 (0.0%) |
| Total | 482 (59.5%) | 328 (40.5%) |
Female Fertility in Drew
Fertility by Age in Drew
Average fertility rate in Drew is 147.0 births per 1,000 women. Women in the age bracket of 20 to 34 years have the highest fertility rate with 300.0 births per 1,000 women. Women in the age bracket of 20 to 34 years acount for 100.0% of all women with births.
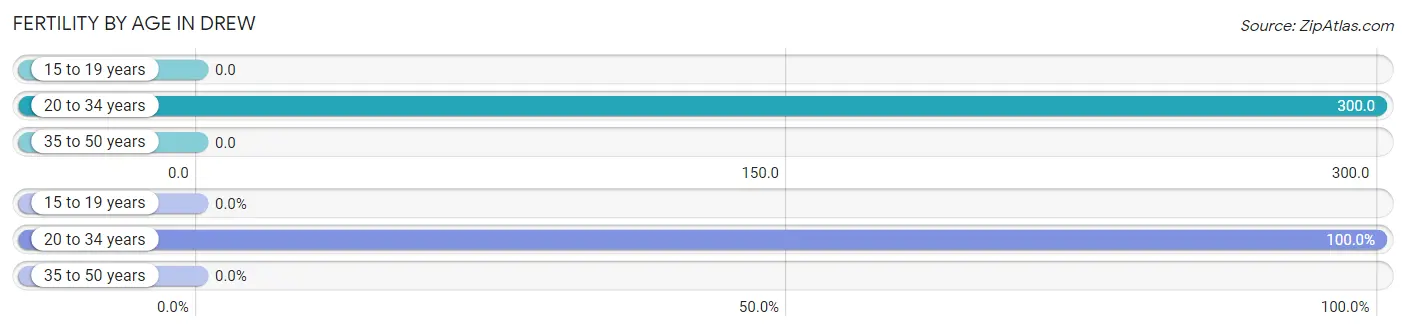
| Age Bracket | Women with Births | Births / 1,000 Women |
| 15 to 19 years | 0 (0.0%) | 0.0 |
| 20 to 34 years | 84 (100.0%) | 300.0 |
| 35 to 50 years | 0 (0.0%) | 0.0 |
| Total | 84 (100.0%) | 147.0 |
Fertility by Age by Marriage Status in Drew
4.8% of women with births (84) in Drew are married. The highest percentage of unmarried women with births falls into 20 to 34 years age bracket with 95.2% of them unmarried at the time of birth, while the lowest percentage of unmarried women with births belong to 20 to 34 years age bracket with 95.2% of them unmarried.
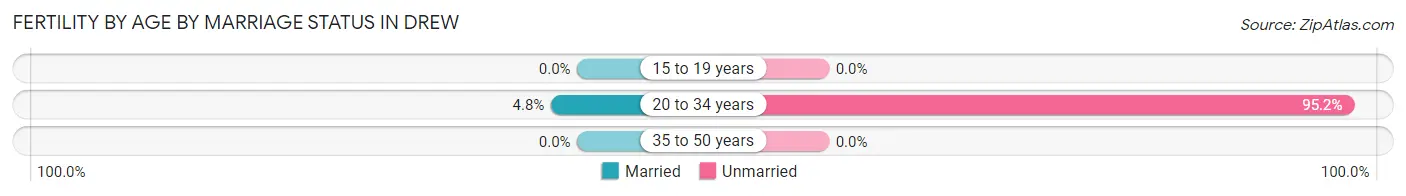
| Age Bracket | Married | Unmarried |
| 15 to 19 years | 0 (0.0%) | 0 (0.0%) |
| 20 to 34 years | 4 (4.8%) | 80 (95.2%) |
| 35 to 50 years | 0 (0.0%) | 0 (0.0%) |
| Total | 4 (4.8%) | 80 (95.2%) |
Fertility by Education in Drew
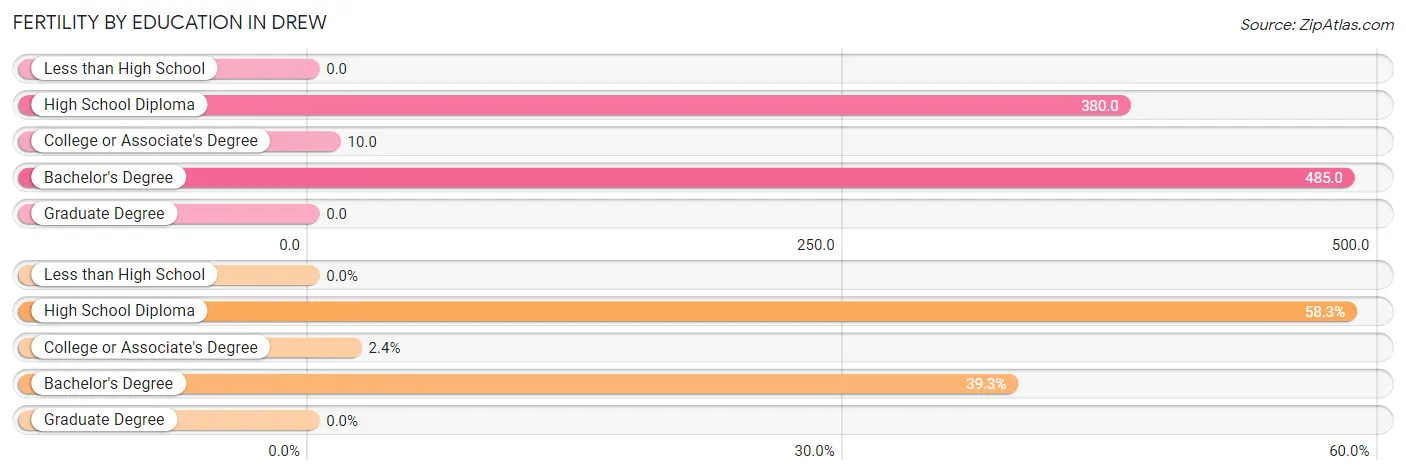
| Educational Attainment | Women with Births | Births / 1,000 Women |
| Less than High School | 0 (0.0%) | 0.0 |
| High School Diploma | 49 (58.3%) | 380.0 |
| College or Associate's Degree | 2 (2.4%) | 10.0 |
| Bachelor's Degree | 33 (39.3%) | 485.0 |
| Graduate Degree | 0 (0.0%) | 0.0 |
| Total | 84 (100.0%) | 147.0 |
Fertility by Education by Marriage Status in Drew
95.2% of women with births in Drew are unmarried. Women with the educational attainment of bachelor's degree are most likely to be married with 12.1% of them married at childbirth, while women with the educational attainment of high school diploma are least likely to be married with 100.0% of them unmarried at childbirth.
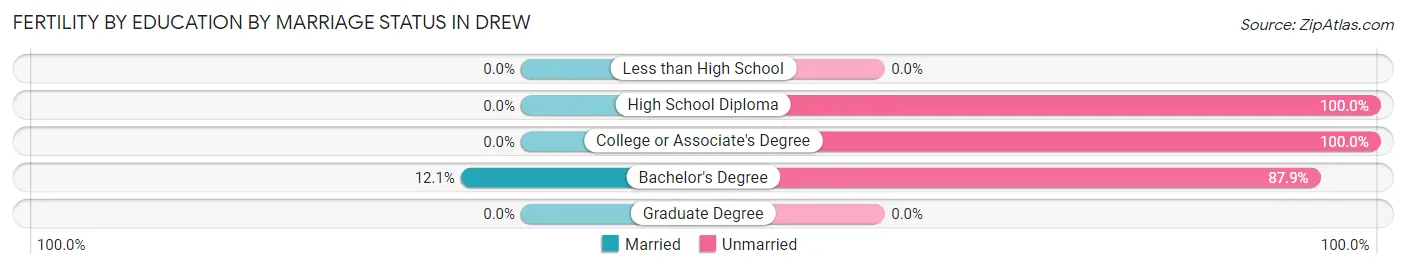
| Educational Attainment | Married | Unmarried |
| Less than High School | 0 (0.0%) | 0 (0.0%) |
| High School Diploma | 0 (0.0%) | 49 (100.0%) |
| College or Associate's Degree | 0 (0.0%) | 2 (100.0%) |
| Bachelor's Degree | 4 (12.1%) | 29 (87.9%) |
| Graduate Degree | 0 (0.0%) | 0 (0.0%) |
| Total | 4 (4.8%) | 80 (95.2%) |
Employment Characteristics in Drew
Employment by Class of Employer in Drew
Among the 762 employed individuals in Drew, private company employees (447 | 58.7%), state government employees (189 | 24.8%), and local government employees (58 | 7.6%) make up the most common classes of employment.
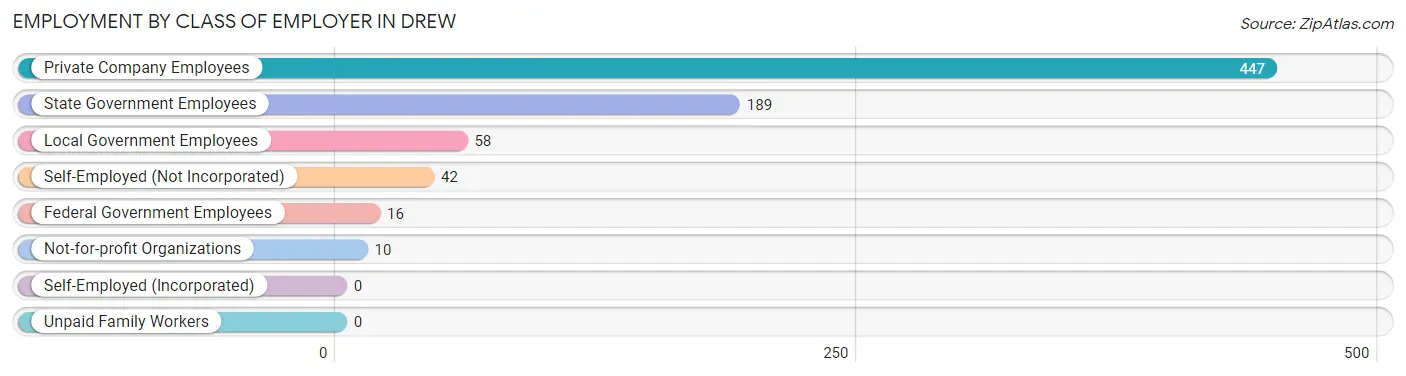
| Employer Class | # Employees | % Employees |
| Private Company Employees | 447 | 58.7% |
| Self-Employed (Incorporated) | 0 | 0.0% |
| Self-Employed (Not Incorporated) | 42 | 5.5% |
| Not-for-profit Organizations | 10 | 1.3% |
| Local Government Employees | 58 | 7.6% |
| State Government Employees | 189 | 24.8% |
| Federal Government Employees | 16 | 2.1% |
| Unpaid Family Workers | 0 | 0.0% |
| Total | 762 | 100.0% |
Employment Status by Age in Drew
According to the labor force statistics for Drew, out of the total population over 16 years of age (1,752), 50.3% or 881 individuals are in the labor force, with 11.2% or 99 of them unemployed. The age group with the highest labor force participation rate is 30 to 34 years, with 95.2% or 158 individuals in the labor force. Within the labor force, the 16 to 19 years age range has the highest percentage of unemployed individuals, with 40.0% or 6 of them being unemployed.
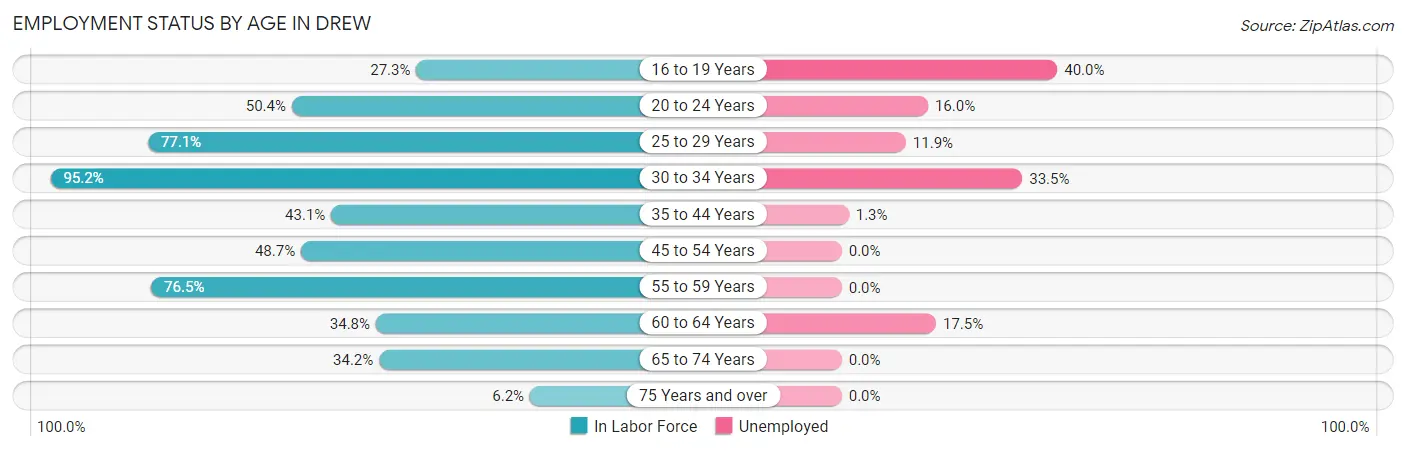
| Age Bracket | In Labor Force | Unemployed |
| 16 to 19 Years | 15 (27.3%) | 6 (40.0%) |
| 20 to 24 Years | 131 (50.4%) | 21 (16.0%) |
| 25 to 29 Years | 84 (77.1%) | 10 (11.9%) |
| 30 to 34 Years | 158 (95.2%) | 53 (33.5%) |
| 35 to 44 Years | 158 (43.1%) | 2 (1.3%) |
| 45 to 54 Years | 111 (48.7%) | 0 (0.0%) |
| 55 to 59 Years | 104 (76.5%) | 0 (0.0%) |
| 60 to 64 Years | 40 (34.8%) | 7 (17.5%) |
| 65 to 74 Years | 75 (34.2%) | 0 (0.0%) |
| 75 Years and over | 6 (6.2%) | 0 (0.0%) |
| Total | 881 (50.3%) | 99 (11.2%) |
Employment Status by Educational Attainment in Drew
According to labor force statistics for Drew, 58.4% of individuals (655) out of the total population between 25 and 64 years of age (1,121) are in the labor force, with 11.0% or 72 of them being unemployed. The group with the highest labor force participation rate are those with the educational attainment of bachelor's degree or higher, with 91.0% or 162 individuals in the labor force. Within the labor force, individuals with less than high school education have the highest percentage of unemployment, with 76.8% or 53 of them being unemployed.
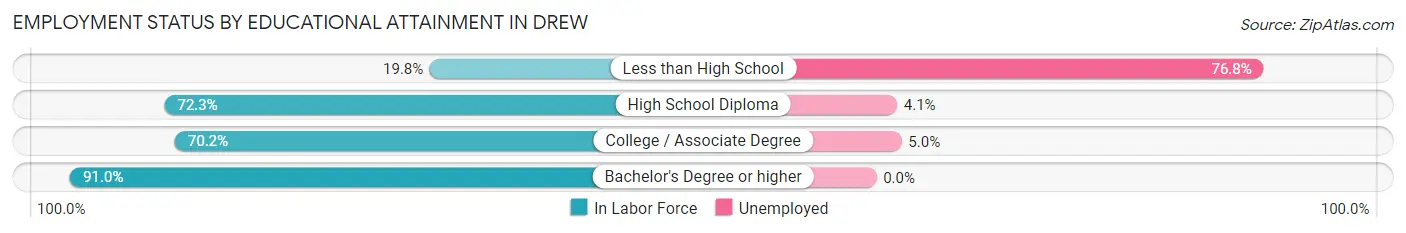
| Educational Attainment | In Labor Force | Unemployed |
| Less than High School | 69 (19.8%) | 268 (76.8%) |
| High School Diploma | 243 (72.3%) | 14 (4.1%) |
| College / Associate Degree | 181 (70.2%) | 13 (5.0%) |
| Bachelor's Degree or higher | 162 (91.0%) | 0 (0.0%) |
| Total | 655 (58.4%) | 123 (11.0%) |
Employment Occupations by Sex in Drew
Management, Business, Science and Arts Occupations
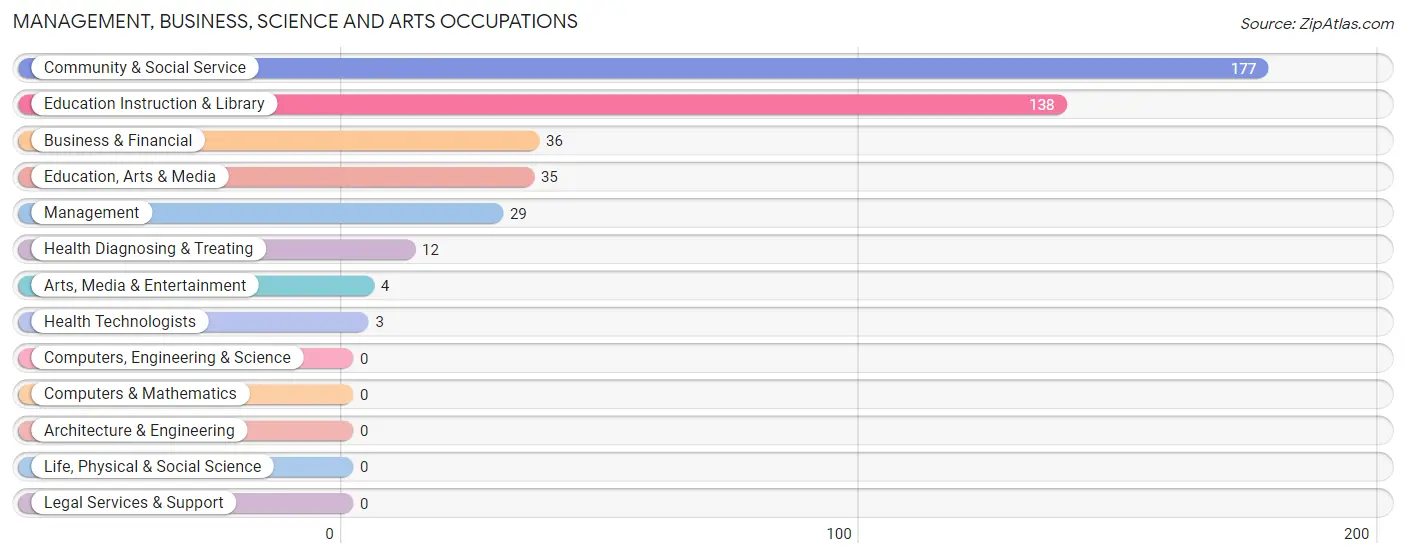
The most common Management, Business, Science and Arts occupations in Drew are Community & Social Service (177 | 22.6%), Education Instruction & Library (138 | 17.6%), Business & Financial (36 | 4.6%), Education, Arts & Media (35 | 4.5%), and Management (29 | 3.7%).
Management, Business, Science and Arts Occupations by Sex
Within the Management, Business, Science and Arts occupations in Drew, the most male-oriented occupations are Arts, Media & Entertainment (100.0%), Business & Financial (97.2%), and Management (44.8%), while the most female-oriented occupations are Health Diagnosing & Treating (100.0%), Health Technologists (100.0%), and Education Instruction & Library (89.9%).
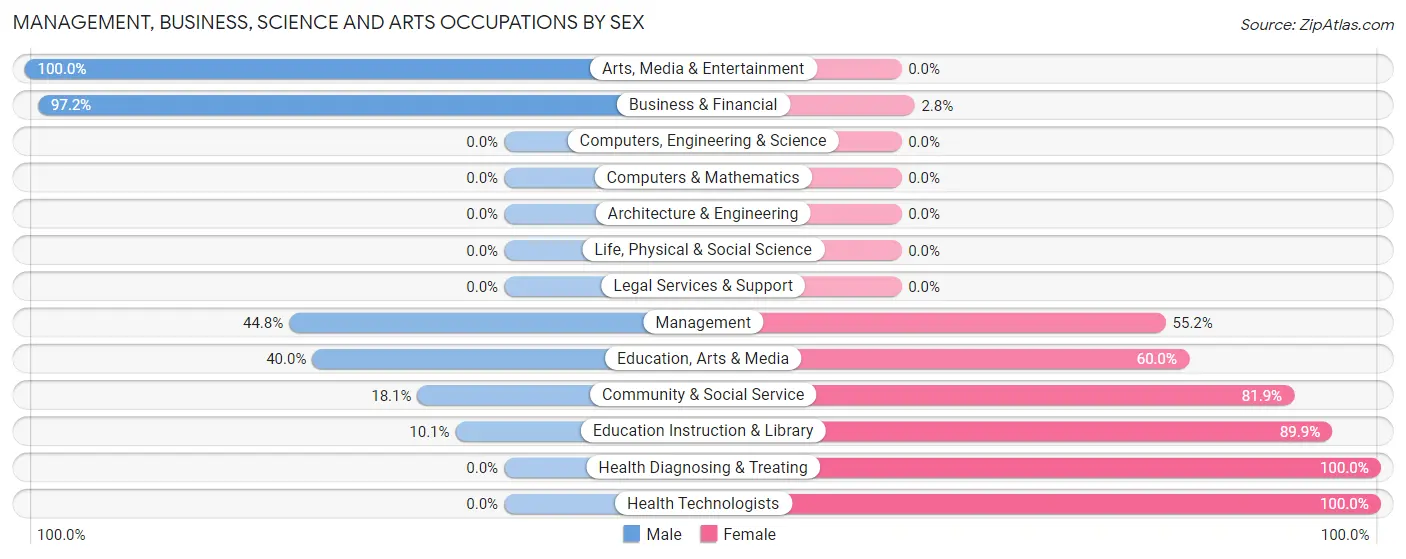
| Occupation | Male | Female |
| Management | 13 (44.8%) | 16 (55.2%) |
| Business & Financial | 35 (97.2%) | 1 (2.8%) |
| Computers, Engineering & Science | 0 (0.0%) | 0 (0.0%) |
| Computers & Mathematics | 0 (0.0%) | 0 (0.0%) |
| Architecture & Engineering | 0 (0.0%) | 0 (0.0%) |
| Life, Physical & Social Science | 0 (0.0%) | 0 (0.0%) |
| Community & Social Service | 32 (18.1%) | 145 (81.9%) |
| Education, Arts & Media | 14 (40.0%) | 21 (60.0%) |
| Legal Services & Support | 0 (0.0%) | 0 (0.0%) |
| Education Instruction & Library | 14 (10.1%) | 124 (89.9%) |
| Arts, Media & Entertainment | 4 (100.0%) | 0 (0.0%) |
| Health Diagnosing & Treating | 0 (0.0%) | 12 (100.0%) |
| Health Technologists | 0 (0.0%) | 3 (100.0%) |
| Total (Category) | 80 (31.5%) | 174 (68.5%) |
| Total (Overall) | 315 (40.2%) | 468 (59.8%) |
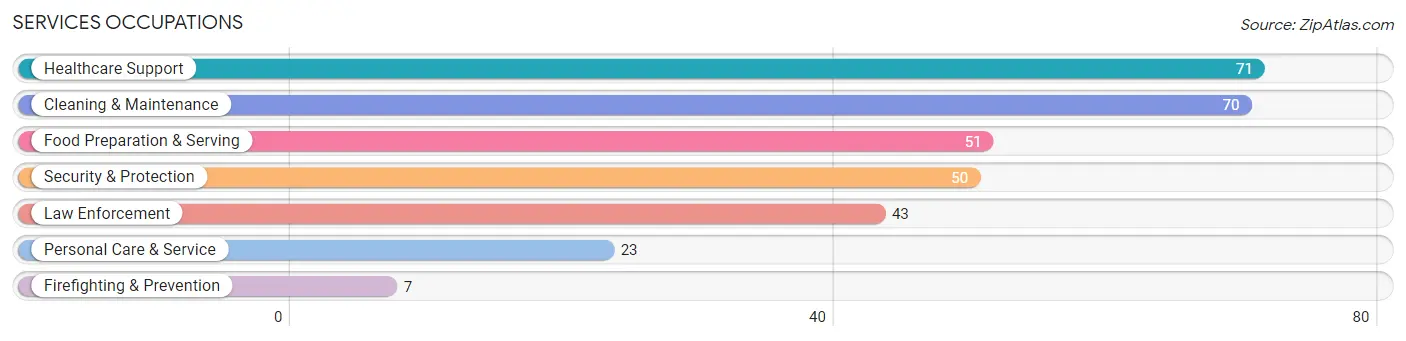
Services Occupations
The most common Services occupations in Drew are Healthcare Support (71 | 9.1%), Cleaning & Maintenance (70 | 8.9%), Food Preparation & Serving (51 | 6.5%), Security & Protection (50 | 6.4%), and Law Enforcement (43 | 5.5%).
Services Occupations by Sex
Within the Services occupations in Drew, the most male-oriented occupations are Cleaning & Maintenance (38.6%), Law Enforcement (34.9%), and Security & Protection (34.0%), while the most female-oriented occupations are Healthcare Support (100.0%), Personal Care & Service (78.3%), and Firefighting & Prevention (71.4%).
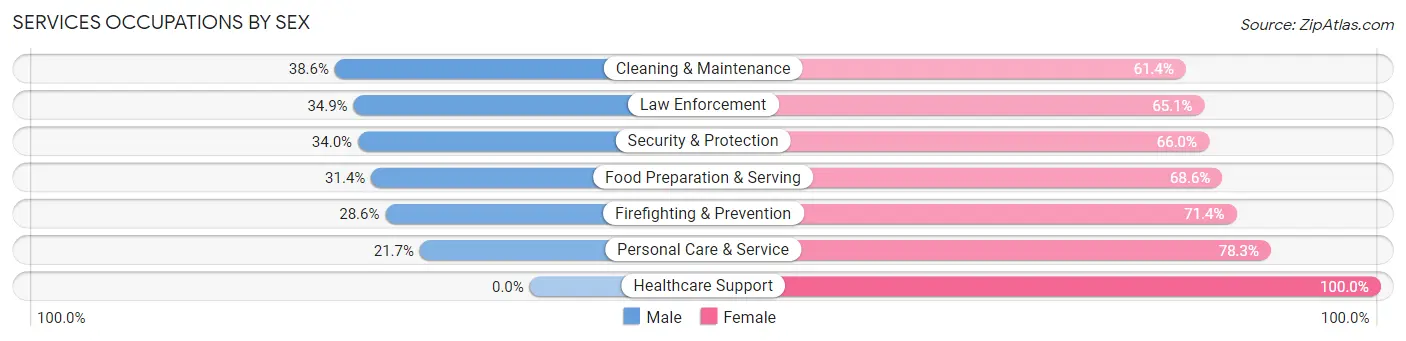
| Occupation | Male | Female |
| Healthcare Support | 0 (0.0%) | 71 (100.0%) |
| Security & Protection | 17 (34.0%) | 33 (66.0%) |
| Firefighting & Prevention | 2 (28.6%) | 5 (71.4%) |
| Law Enforcement | 15 (34.9%) | 28 (65.1%) |
| Food Preparation & Serving | 16 (31.4%) | 35 (68.6%) |
| Cleaning & Maintenance | 27 (38.6%) | 43 (61.4%) |
| Personal Care & Service | 5 (21.7%) | 18 (78.3%) |
| Total (Category) | 65 (24.5%) | 200 (75.5%) |
| Total (Overall) | 315 (40.2%) | 468 (59.8%) |
Sales and Office Occupations
The most common Sales and Office occupations in Drew are Office & Administration (63 | 8.1%), and Sales & Related (25 | 3.2%).

Sales and Office Occupations by Sex
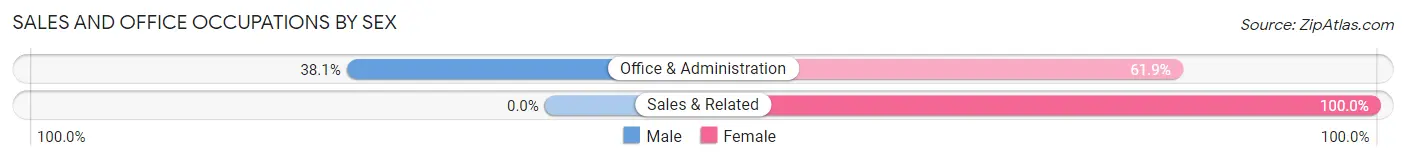
| Occupation | Male | Female |
| Sales & Related | 0 (0.0%) | 25 (100.0%) |
| Office & Administration | 24 (38.1%) | 39 (61.9%) |
| Total (Category) | 24 (27.3%) | 64 (72.7%) |
| Total (Overall) | 315 (40.2%) | 468 (59.8%) |
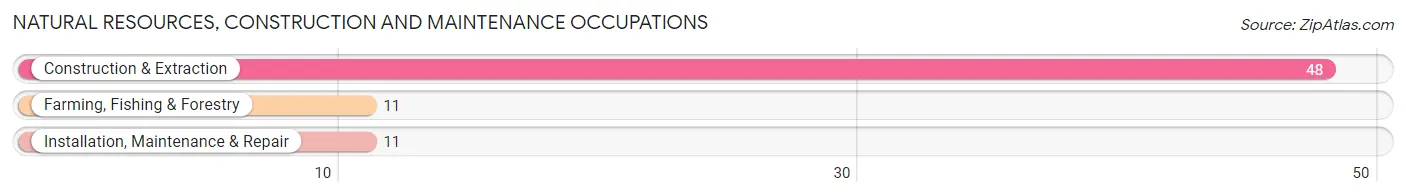
Natural Resources, Construction and Maintenance Occupations
The most common Natural Resources, Construction and Maintenance occupations in Drew are Construction & Extraction (48 | 6.1%), Farming, Fishing & Forestry (11 | 1.4%), and Installation, Maintenance & Repair (11 | 1.4%).
Natural Resources, Construction and Maintenance Occupations by Sex
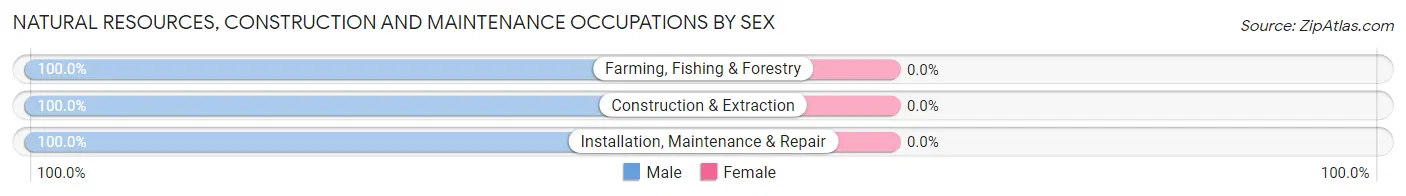
| Occupation | Male | Female |
| Farming, Fishing & Forestry | 11 (100.0%) | 0 (0.0%) |
| Construction & Extraction | 48 (100.0%) | 0 (0.0%) |
| Installation, Maintenance & Repair | 11 (100.0%) | 0 (0.0%) |
| Total (Category) | 70 (100.0%) | 0 (0.0%) |
| Total (Overall) | 315 (40.2%) | 468 (59.8%) |
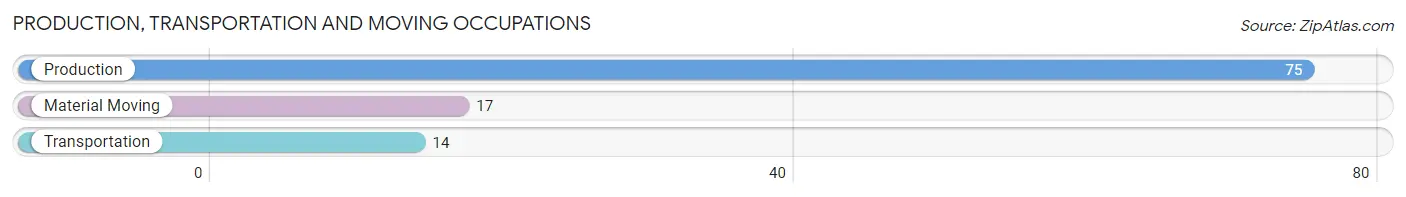
Production, Transportation and Moving Occupations
The most common Production, Transportation and Moving occupations in Drew are Production (75 | 9.6%), Material Moving (17 | 2.2%), and Transportation (14 | 1.8%).
Production, Transportation and Moving Occupations by Sex
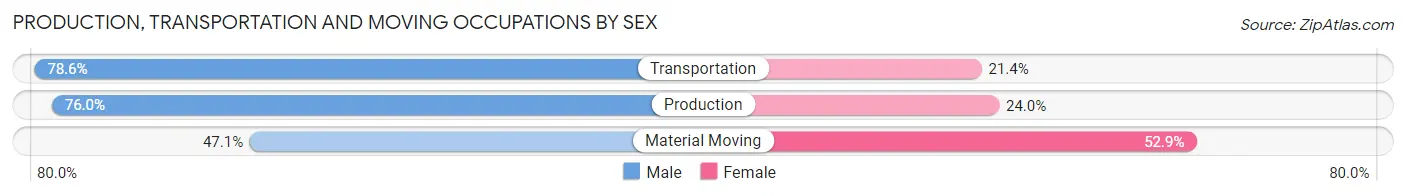
| Occupation | Male | Female |
| Production | 57 (76.0%) | 18 (24.0%) |
| Transportation | 11 (78.6%) | 3 (21.4%) |
| Material Moving | 8 (47.1%) | 9 (52.9%) |
| Total (Category) | 76 (71.7%) | 30 (28.3%) |
| Total (Overall) | 315 (40.2%) | 468 (59.8%) |
Employment Industries by Sex in Drew
Employment Industries in Drew
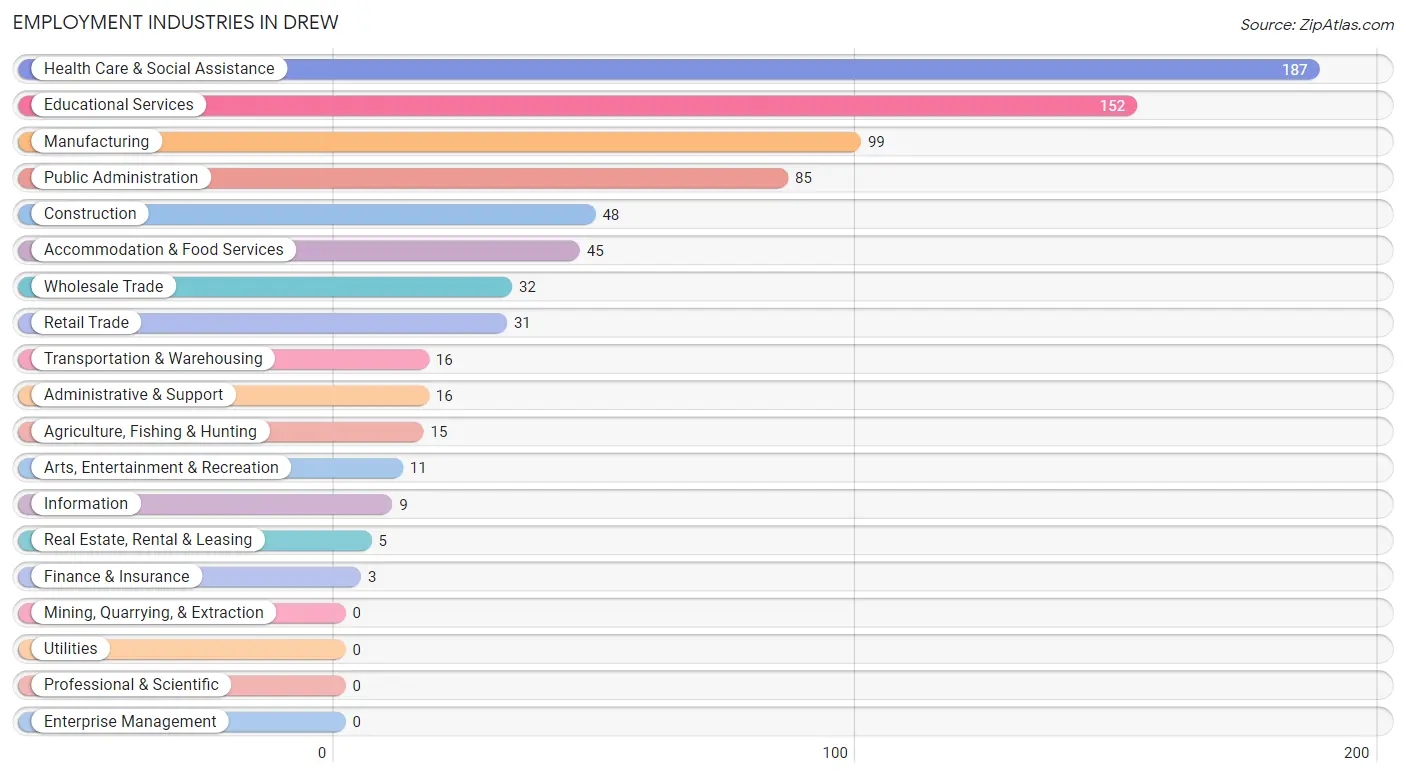
The major employment industries in Drew include Health Care & Social Assistance (187 | 23.9%), Educational Services (152 | 19.4%), Manufacturing (99 | 12.6%), Public Administration (85 | 10.9%), and Construction (48 | 6.1%).
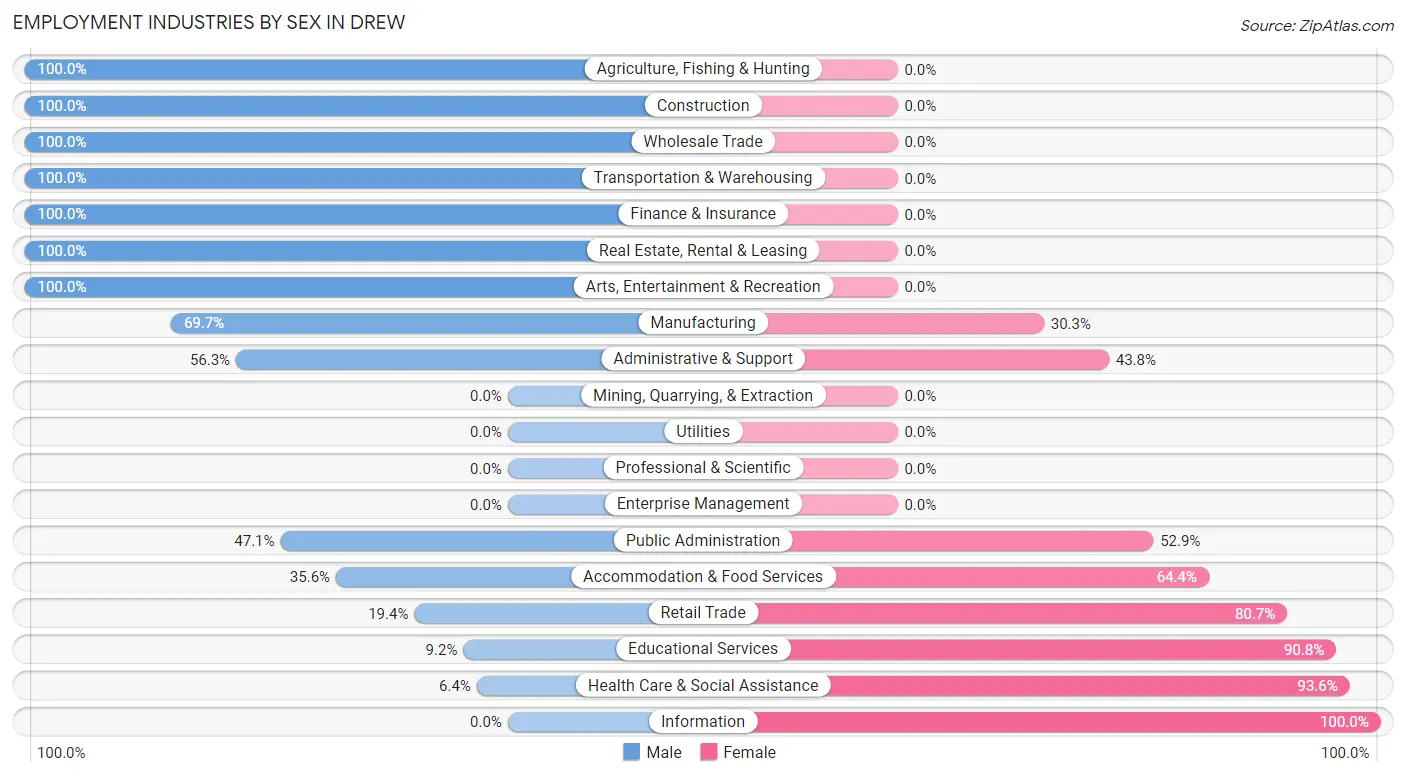
Employment Industries by Sex in Drew
The Drew industries that see more men than women are Agriculture, Fishing & Hunting (100.0%), Construction (100.0%), and Wholesale Trade (100.0%), whereas the industries that tend to have a higher number of women are Information (100.0%), Health Care & Social Assistance (93.6%), and Educational Services (90.8%).
| Industry | Male | Female |
| Agriculture, Fishing & Hunting | 15 (100.0%) | 0 (0.0%) |
| Mining, Quarrying, & Extraction | 0 (0.0%) | 0 (0.0%) |
| Construction | 48 (100.0%) | 0 (0.0%) |
| Manufacturing | 69 (69.7%) | 30 (30.3%) |
| Wholesale Trade | 32 (100.0%) | 0 (0.0%) |
| Retail Trade | 6 (19.4%) | 25 (80.6%) |
| Transportation & Warehousing | 16 (100.0%) | 0 (0.0%) |
| Utilities | 0 (0.0%) | 0 (0.0%) |
| Information | 0 (0.0%) | 9 (100.0%) |
| Finance & Insurance | 3 (100.0%) | 0 (0.0%) |
| Real Estate, Rental & Leasing | 5 (100.0%) | 0 (0.0%) |
| Professional & Scientific | 0 (0.0%) | 0 (0.0%) |
| Enterprise Management | 0 (0.0%) | 0 (0.0%) |
| Administrative & Support | 9 (56.2%) | 7 (43.8%) |
| Educational Services | 14 (9.2%) | 138 (90.8%) |
| Health Care & Social Assistance | 12 (6.4%) | 175 (93.6%) |
| Arts, Entertainment & Recreation | 11 (100.0%) | 0 (0.0%) |
| Accommodation & Food Services | 16 (35.6%) | 29 (64.4%) |
| Public Administration | 40 (47.1%) | 45 (52.9%) |
| Total | 315 (40.2%) | 468 (59.8%) |
Education in Drew
School Enrollment in Drew
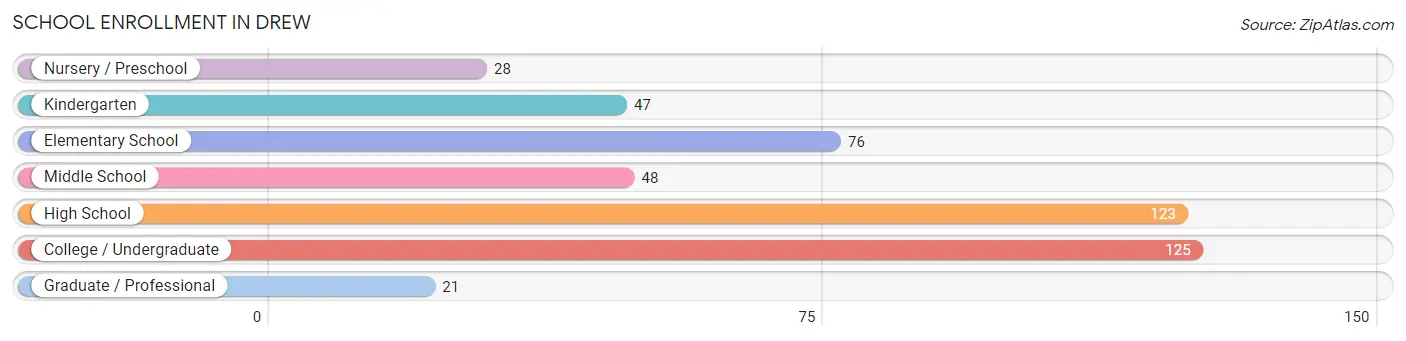
The most common levels of schooling among the 468 students in Drew are college / undergraduate (125 | 26.7%), high school (123 | 26.3%), and elementary school (76 | 16.2%).
| School Level | # Students | % Students |
| Nursery / Preschool | 28 | 6.0% |
| Kindergarten | 47 | 10.0% |
| Elementary School | 76 | 16.2% |
| Middle School | 48 | 10.3% |
| High School | 123 | 26.3% |
| College / Undergraduate | 125 | 26.7% |
| Graduate / Professional | 21 | 4.5% |
| Total | 468 | 100.0% |
School Enrollment by Age by Funding Source in Drew
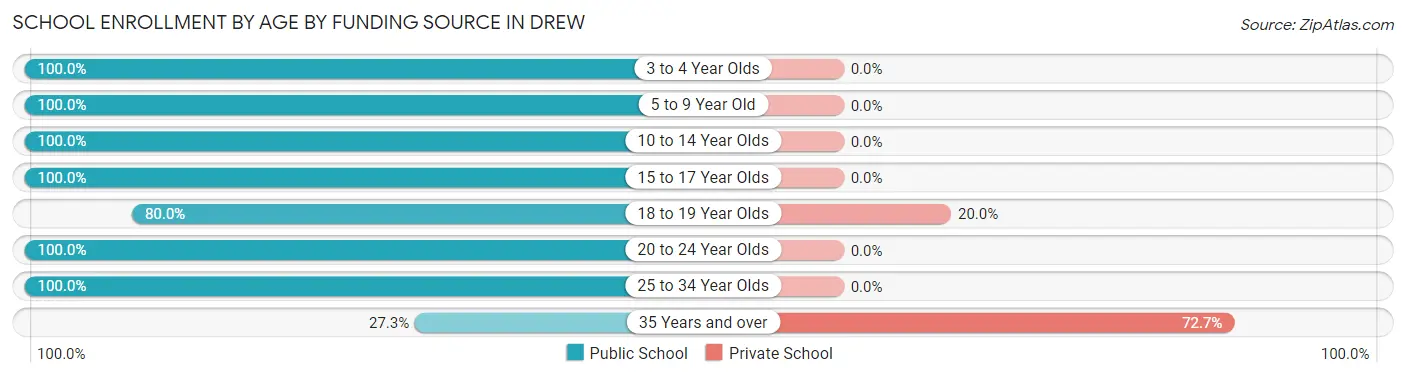
Out of a total of 468 students who are enrolled in schools in Drew, 11 (2.4%) attend a private institution, while the remaining 457 (97.6%) are enrolled in public schools. The age group of 35 years and over has the highest likelihood of being enrolled in private schools, with 8 (72.7% in the age bracket) enrolled. Conversely, the age group of 3 to 4 year olds has the lowest likelihood of being enrolled in a private school, with 25 (100.0% in the age bracket) attending a public institution.
| Age Bracket | Public School | Private School |
| 3 to 4 Year Olds | 25 (100.0%) | 0 (0.0%) |
| 5 to 9 Year Old | 117 (100.0%) | 0 (0.0%) |
| 10 to 14 Year Olds | 74 (100.0%) | 0 (0.0%) |
| 15 to 17 Year Olds | 100 (100.0%) | 0 (0.0%) |
| 18 to 19 Year Olds | 12 (80.0%) | 3 (20.0%) |
| 20 to 24 Year Olds | 118 (100.0%) | 0 (0.0%) |
| 25 to 34 Year Olds | 8 (100.0%) | 0 (0.0%) |
| 35 Years and over | 3 (27.3%) | 8 (72.7%) |
| Total | 457 (97.6%) | 11 (2.4%) |
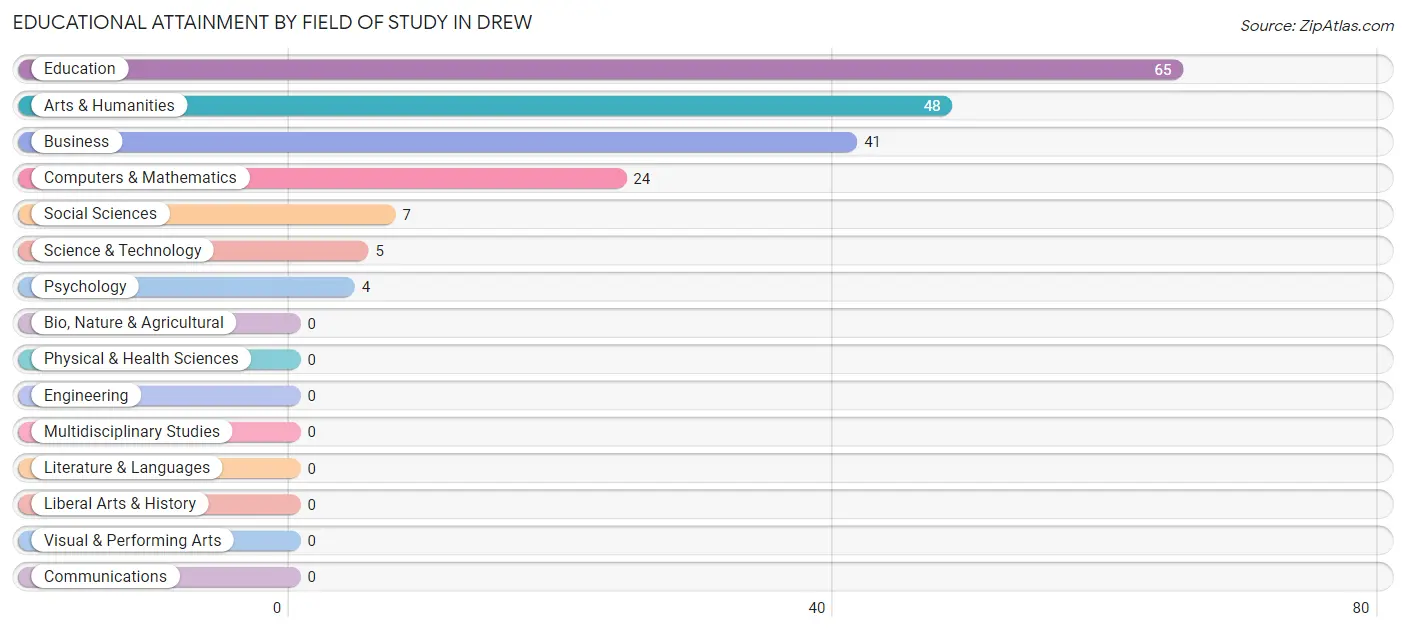
Educational Attainment by Field of Study in Drew
Education (65 | 33.5%), arts & humanities (48 | 24.7%), business (41 | 21.1%), computers & mathematics (24 | 12.4%), and social sciences (7 | 3.6%) are the most common fields of study among 194 individuals in Drew who have obtained a bachelor's degree or higher.
| Field of Study | # Graduates | % Graduates |
| Computers & Mathematics | 24 | 12.4% |
| Bio, Nature & Agricultural | 0 | 0.0% |
| Physical & Health Sciences | 0 | 0.0% |
| Psychology | 4 | 2.1% |
| Social Sciences | 7 | 3.6% |
| Engineering | 0 | 0.0% |
| Multidisciplinary Studies | 0 | 0.0% |
| Science & Technology | 5 | 2.6% |
| Business | 41 | 21.1% |
| Education | 65 | 33.5% |
| Literature & Languages | 0 | 0.0% |
| Liberal Arts & History | 0 | 0.0% |
| Visual & Performing Arts | 0 | 0.0% |
| Communications | 0 | 0.0% |
| Arts & Humanities | 48 | 24.7% |
| Total | 194 | 100.0% |
Transportation & Commute in Drew
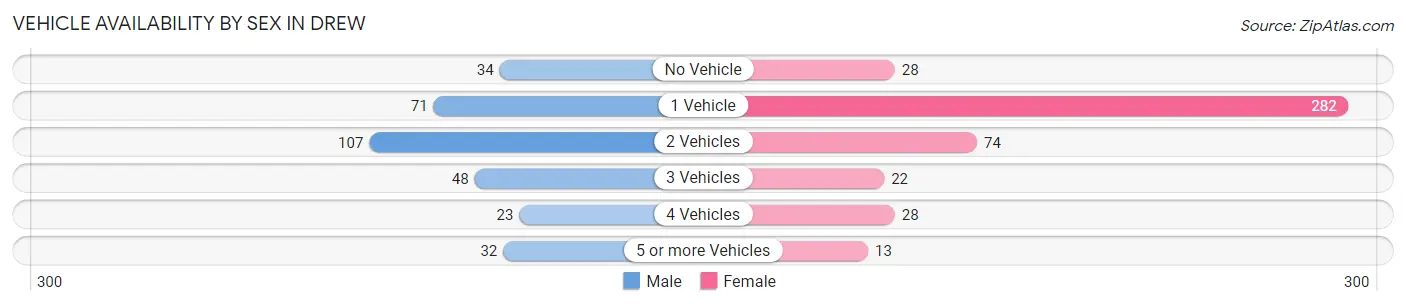
Vehicle Availability by Sex in Drew
The most prevalent vehicle ownership categories in Drew are males with 2 vehicles (107, accounting for 34.0%) and females with 2 vehicles (74, making up 23.9%).
| Vehicles Available | Male | Female |
| No Vehicle | 34 (10.8%) | 28 (6.3%) |
| 1 Vehicle | 71 (22.5%) | 282 (63.1%) |
| 2 Vehicles | 107 (34.0%) | 74 (16.6%) |
| 3 Vehicles | 48 (15.2%) | 22 (4.9%) |
| 4 Vehicles | 23 (7.3%) | 28 (6.3%) |
| 5 or more Vehicles | 32 (10.2%) | 13 (2.9%) |
| Total | 315 (100.0%) | 447 (100.0%) |
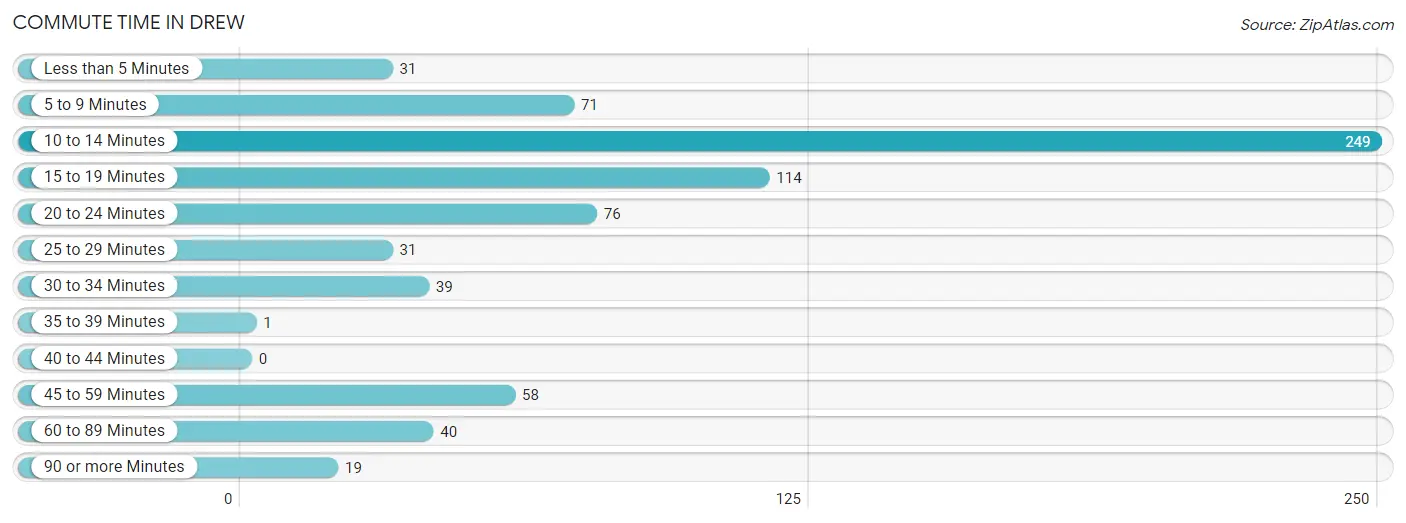
Commute Time in Drew
The most frequently occuring commute durations in Drew are 10 to 14 minutes (249 commuters, 34.2%), 15 to 19 minutes (114 commuters, 15.6%), and 20 to 24 minutes (76 commuters, 10.4%).
| Commute Time | # Commuters | % Commuters |
| Less than 5 Minutes | 31 | 4.3% |
| 5 to 9 Minutes | 71 | 9.7% |
| 10 to 14 Minutes | 249 | 34.2% |
| 15 to 19 Minutes | 114 | 15.6% |
| 20 to 24 Minutes | 76 | 10.4% |
| 25 to 29 Minutes | 31 | 4.3% |
| 30 to 34 Minutes | 39 | 5.3% |
| 35 to 39 Minutes | 1 | 0.1% |
| 40 to 44 Minutes | 0 | 0.0% |
| 45 to 59 Minutes | 58 | 8.0% |
| 60 to 89 Minutes | 40 | 5.5% |
| 90 or more Minutes | 19 | 2.6% |
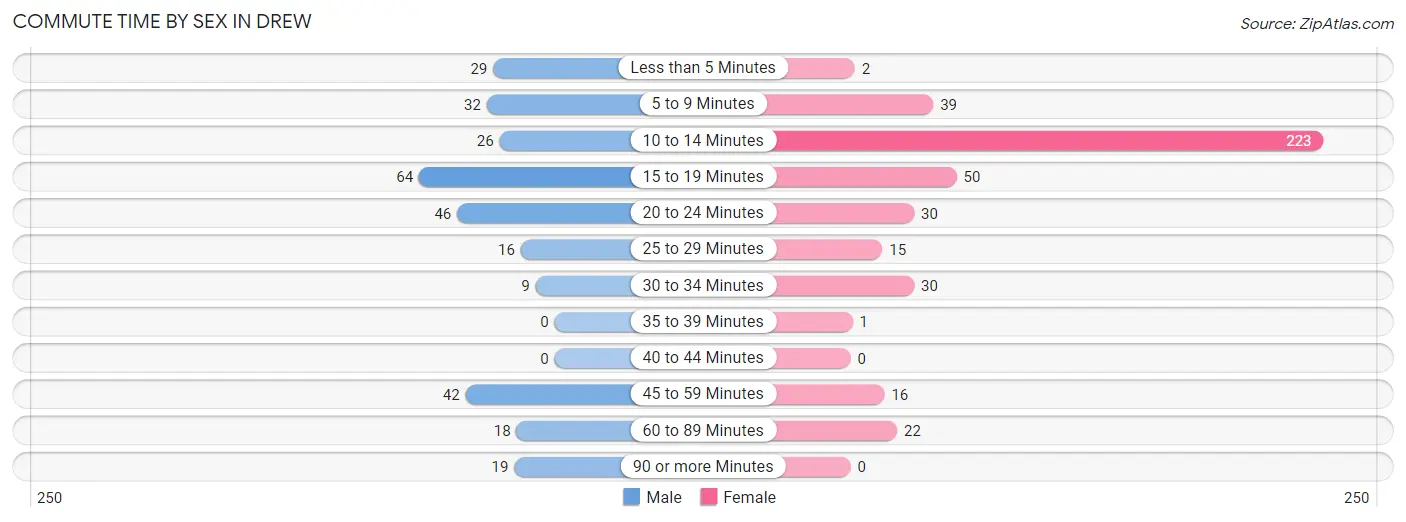
Commute Time by Sex in Drew
The most common commute times in Drew are 15 to 19 minutes (64 commuters, 21.3%) for males and 10 to 14 minutes (223 commuters, 52.1%) for females.
| Commute Time | Male | Female |
| Less than 5 Minutes | 29 (9.6%) | 2 (0.5%) |
| 5 to 9 Minutes | 32 (10.6%) | 39 (9.1%) |
| 10 to 14 Minutes | 26 (8.6%) | 223 (52.1%) |
| 15 to 19 Minutes | 64 (21.3%) | 50 (11.7%) |
| 20 to 24 Minutes | 46 (15.3%) | 30 (7.0%) |
| 25 to 29 Minutes | 16 (5.3%) | 15 (3.5%) |
| 30 to 34 Minutes | 9 (3.0%) | 30 (7.0%) |
| 35 to 39 Minutes | 0 (0.0%) | 1 (0.2%) |
| 40 to 44 Minutes | 0 (0.0%) | 0 (0.0%) |
| 45 to 59 Minutes | 42 (14.0%) | 16 (3.7%) |
| 60 to 89 Minutes | 18 (6.0%) | 22 (5.1%) |
| 90 or more Minutes | 19 (6.3%) | 0 (0.0%) |
Time of Departure to Work by Sex in Drew
The most frequent times of departure to work in Drew are 6:30 AM to 6:59 AM (81, 26.9%) for males and 7:30 AM to 7:59 AM (108, 25.2%) for females.
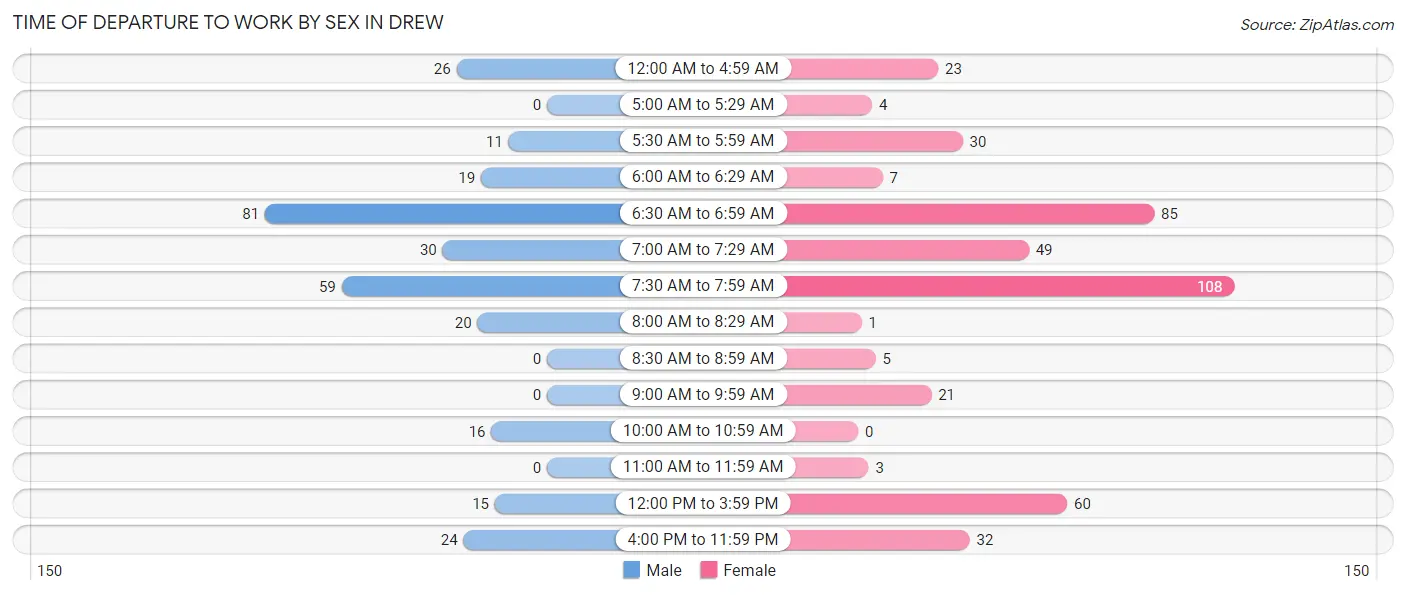
| Time of Departure | Male | Female |
| 12:00 AM to 4:59 AM | 26 (8.6%) | 23 (5.4%) |
| 5:00 AM to 5:29 AM | 0 (0.0%) | 4 (0.9%) |
| 5:30 AM to 5:59 AM | 11 (3.6%) | 30 (7.0%) |
| 6:00 AM to 6:29 AM | 19 (6.3%) | 7 (1.6%) |
| 6:30 AM to 6:59 AM | 81 (26.9%) | 85 (19.9%) |
| 7:00 AM to 7:29 AM | 30 (10.0%) | 49 (11.5%) |
| 7:30 AM to 7:59 AM | 59 (19.6%) | 108 (25.2%) |
| 8:00 AM to 8:29 AM | 20 (6.6%) | 1 (0.2%) |
| 8:30 AM to 8:59 AM | 0 (0.0%) | 5 (1.2%) |
| 9:00 AM to 9:59 AM | 0 (0.0%) | 21 (4.9%) |
| 10:00 AM to 10:59 AM | 16 (5.3%) | 0 (0.0%) |
| 11:00 AM to 11:59 AM | 0 (0.0%) | 3 (0.7%) |
| 12:00 PM to 3:59 PM | 15 (5.0%) | 60 (14.0%) |
| 4:00 PM to 11:59 PM | 24 (8.0%) | 32 (7.5%) |
| Total | 301 (100.0%) | 428 (100.0%) |
Housing Occupancy in Drew
Occupancy by Ownership in Drew
Of the total 810 dwellings in Drew, owner-occupied units account for 393 (48.5%), while renter-occupied units make up 417 (51.5%).
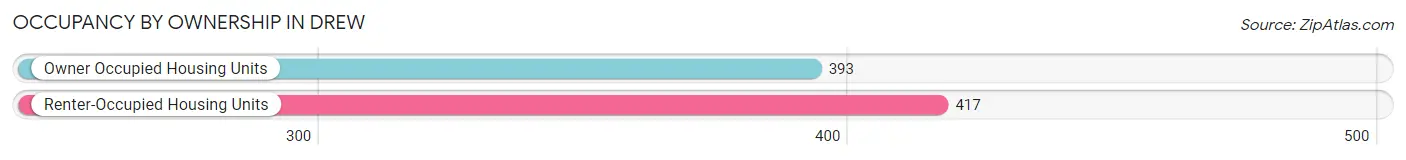
| Occupancy | # Housing Units | % Housing Units |
| Owner Occupied Housing Units | 393 | 48.5% |
| Renter-Occupied Housing Units | 417 | 51.5% |
| Total Occupied Housing Units | 810 | 100.0% |
Occupancy by Household Size in Drew
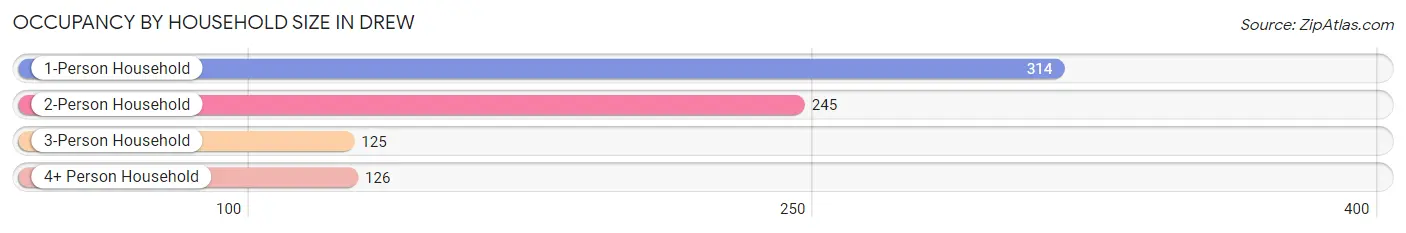
| Household Size | # Housing Units | % Housing Units |
| 1-Person Household | 314 | 38.8% |
| 2-Person Household | 245 | 30.2% |
| 3-Person Household | 125 | 15.4% |
| 4+ Person Household | 126 | 15.6% |
| Total Housing Units | 810 | 100.0% |
Occupancy by Ownership by Household Size in Drew
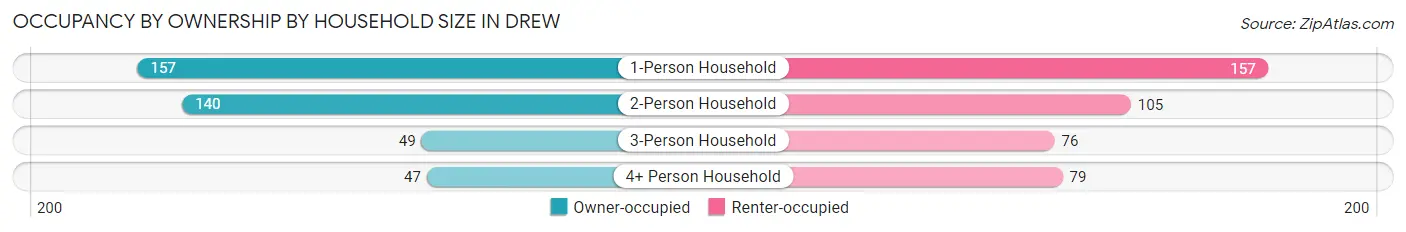
| Household Size | Owner-occupied | Renter-occupied |
| 1-Person Household | 157 (50.0%) | 157 (50.0%) |
| 2-Person Household | 140 (57.1%) | 105 (42.9%) |
| 3-Person Household | 49 (39.2%) | 76 (60.8%) |
| 4+ Person Household | 47 (37.3%) | 79 (62.7%) |
| Total Housing Units | 393 (48.5%) | 417 (51.5%) |
Occupancy by Educational Attainment in Drew
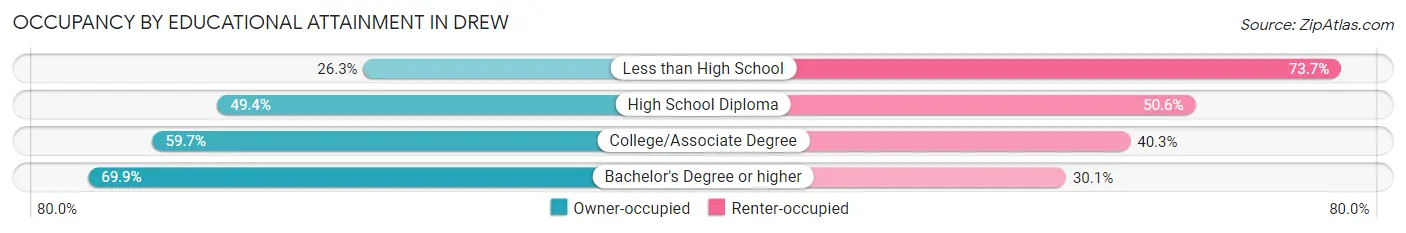
| Household Size | Owner-occupied | Renter-occupied |
| Less than High School | 52 (26.3%) | 146 (73.7%) |
| High School Diploma | 162 (49.4%) | 166 (50.6%) |
| College/Associate Degree | 114 (59.7%) | 77 (40.3%) |
| Bachelor's Degree or higher | 65 (69.9%) | 28 (30.1%) |
Occupancy by Age of Householder in Drew
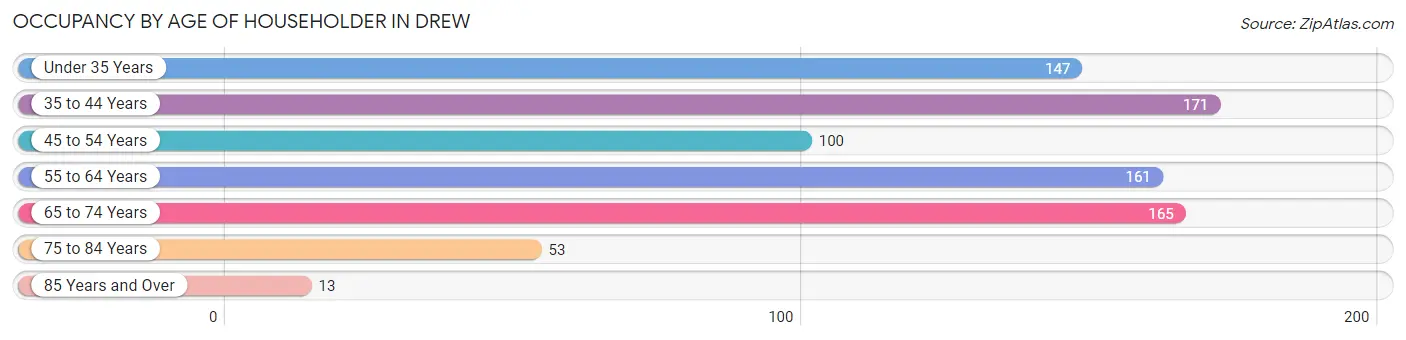
| Age Bracket | # Households | % Households |
| Under 35 Years | 147 | 18.1% |
| 35 to 44 Years | 171 | 21.1% |
| 45 to 54 Years | 100 | 12.3% |
| 55 to 64 Years | 161 | 19.9% |
| 65 to 74 Years | 165 | 20.4% |
| 75 to 84 Years | 53 | 6.5% |
| 85 Years and Over | 13 | 1.6% |
| Total | 810 | 100.0% |
Housing Finances in Drew
Median Income by Occupancy in Drew
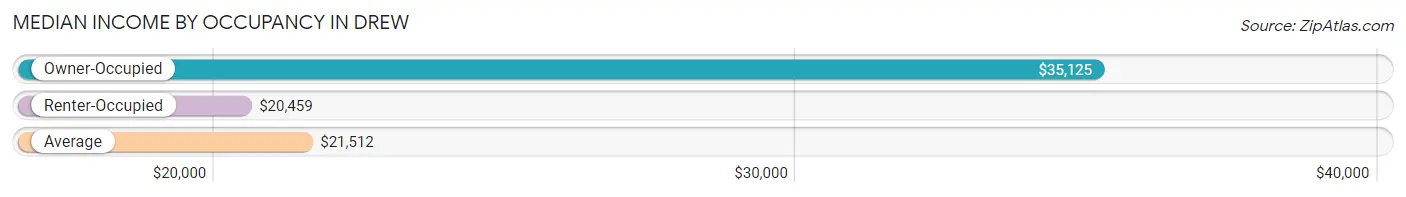
| Occupancy Type | # Households | Median Income |
| Owner-Occupied | 393 (48.5%) | $35,125 |
| Renter-Occupied | 417 (51.5%) | $20,459 |
| Average | 810 (100.0%) | $21,512 |
Occupancy by Householder Income Bracket in Drew
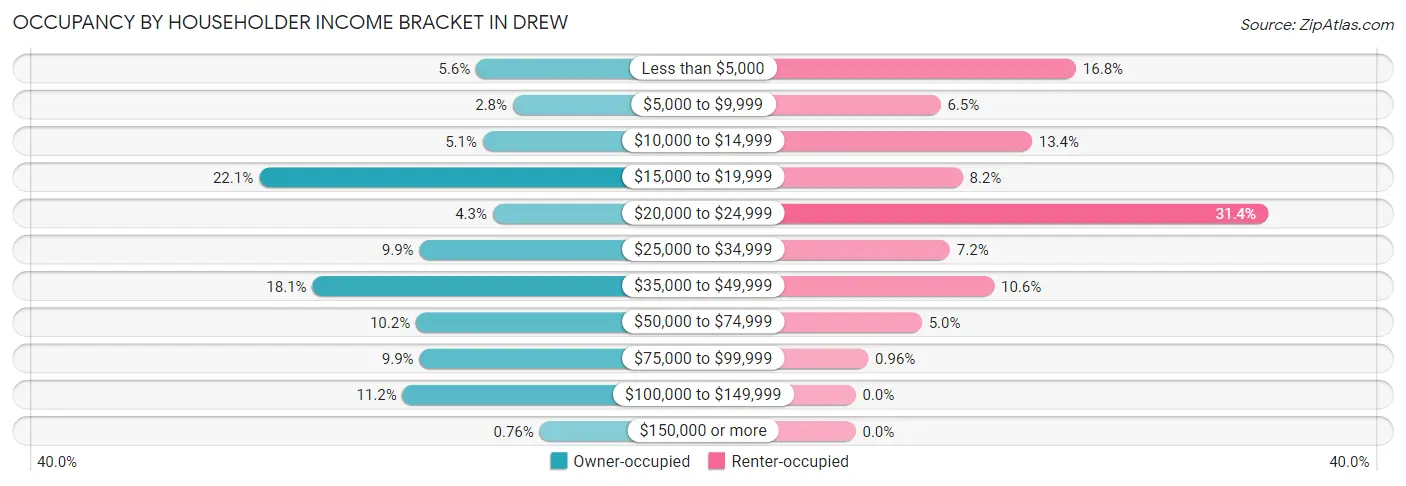
| Income Bracket | Owner-occupied | Renter-occupied |
| Less than $5,000 | 22 (5.6%) | 70 (16.8%) |
| $5,000 to $9,999 | 11 (2.8%) | 27 (6.5%) |
| $10,000 to $14,999 | 20 (5.1%) | 56 (13.4%) |
| $15,000 to $19,999 | 87 (22.1%) | 34 (8.2%) |
| $20,000 to $24,999 | 17 (4.3%) | 131 (31.4%) |
| $25,000 to $34,999 | 39 (9.9%) | 30 (7.2%) |
| $35,000 to $49,999 | 71 (18.1%) | 44 (10.5%) |
| $50,000 to $74,999 | 40 (10.2%) | 21 (5.0%) |
| $75,000 to $99,999 | 39 (9.9%) | 4 (1.0%) |
| $100,000 to $149,999 | 44 (11.2%) | 0 (0.0%) |
| $150,000 or more | 3 (0.8%) | 0 (0.0%) |
| Total | 393 (100.0%) | 417 (100.0%) |
Monthly Housing Cost Tiers in Drew
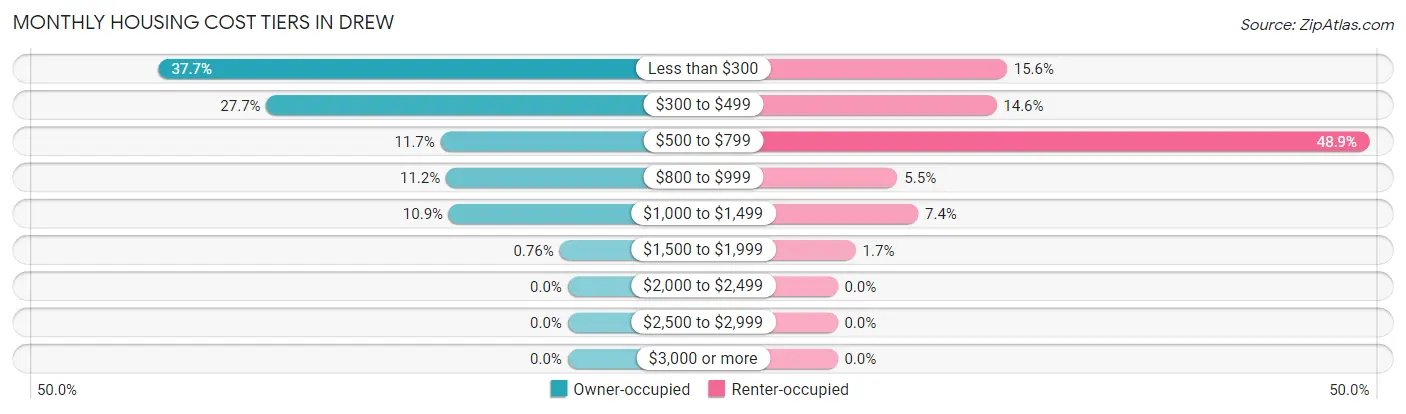
| Monthly Cost | Owner-occupied | Renter-occupied |
| Less than $300 | 148 (37.7%) | 65 (15.6%) |
| $300 to $499 | 109 (27.7%) | 61 (14.6%) |
| $500 to $799 | 46 (11.7%) | 204 (48.9%) |
| $800 to $999 | 44 (11.2%) | 23 (5.5%) |
| $1,000 to $1,499 | 43 (10.9%) | 31 (7.4%) |
| $1,500 to $1,999 | 3 (0.8%) | 7 (1.7%) |
| $2,000 to $2,499 | 0 (0.0%) | 0 (0.0%) |
| $2,500 to $2,999 | 0 (0.0%) | 0 (0.0%) |
| $3,000 or more | 0 (0.0%) | 0 (0.0%) |
| Total | 393 (100.0%) | 417 (100.0%) |
Physical Housing Characteristics in Drew
Housing Structures in Drew
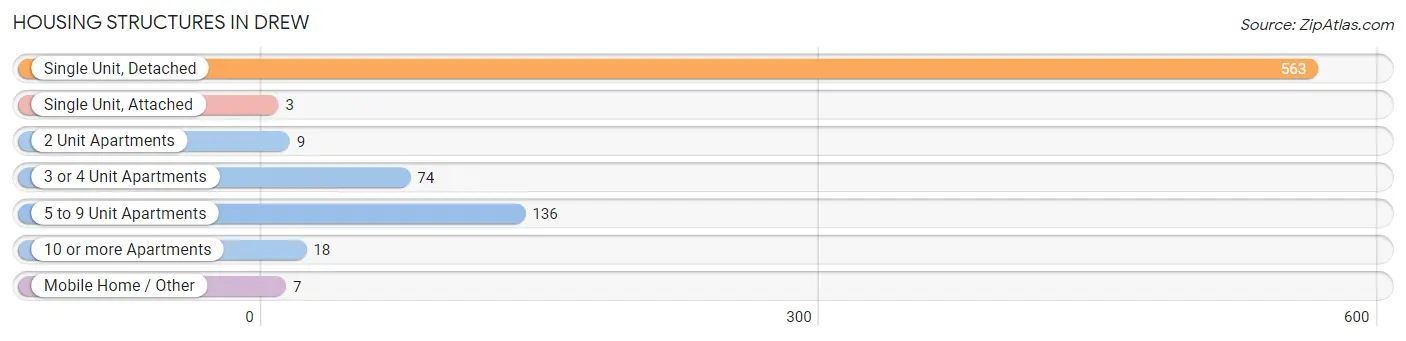
| Structure Type | # Housing Units | % Housing Units |
| Single Unit, Detached | 563 | 69.5% |
| Single Unit, Attached | 3 | 0.4% |
| 2 Unit Apartments | 9 | 1.1% |
| 3 or 4 Unit Apartments | 74 | 9.1% |
| 5 to 9 Unit Apartments | 136 | 16.8% |
| 10 or more Apartments | 18 | 2.2% |
| Mobile Home / Other | 7 | 0.9% |
| Total | 810 | 100.0% |
Housing Structures by Occupancy in Drew
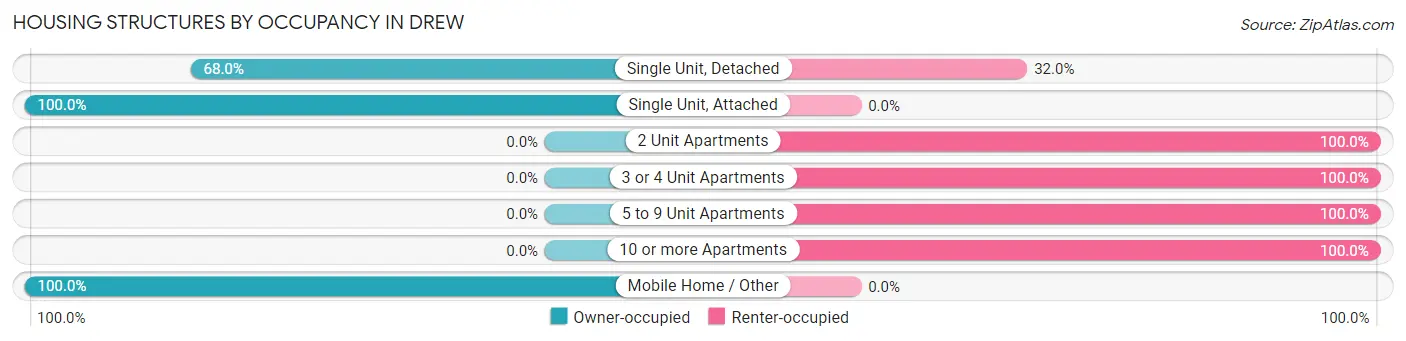
| Structure Type | Owner-occupied | Renter-occupied |
| Single Unit, Detached | 383 (68.0%) | 180 (32.0%) |
| Single Unit, Attached | 3 (100.0%) | 0 (0.0%) |
| 2 Unit Apartments | 0 (0.0%) | 9 (100.0%) |
| 3 or 4 Unit Apartments | 0 (0.0%) | 74 (100.0%) |
| 5 to 9 Unit Apartments | 0 (0.0%) | 136 (100.0%) |
| 10 or more Apartments | 0 (0.0%) | 18 (100.0%) |
| Mobile Home / Other | 7 (100.0%) | 0 (0.0%) |
| Total | 393 (48.5%) | 417 (51.5%) |
Housing Structures by Number of Rooms in Drew
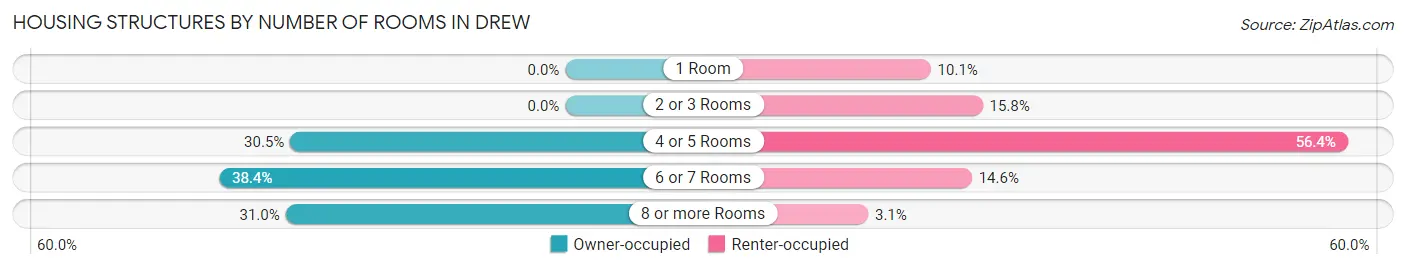
| Number of Rooms | Owner-occupied | Renter-occupied |
| 1 Room | 0 (0.0%) | 42 (10.1%) |
| 2 or 3 Rooms | 0 (0.0%) | 66 (15.8%) |
| 4 or 5 Rooms | 120 (30.5%) | 235 (56.4%) |
| 6 or 7 Rooms | 151 (38.4%) | 61 (14.6%) |
| 8 or more Rooms | 122 (31.0%) | 13 (3.1%) |
| Total | 393 (100.0%) | 417 (100.0%) |
Housing Structure by Heating Type in Drew
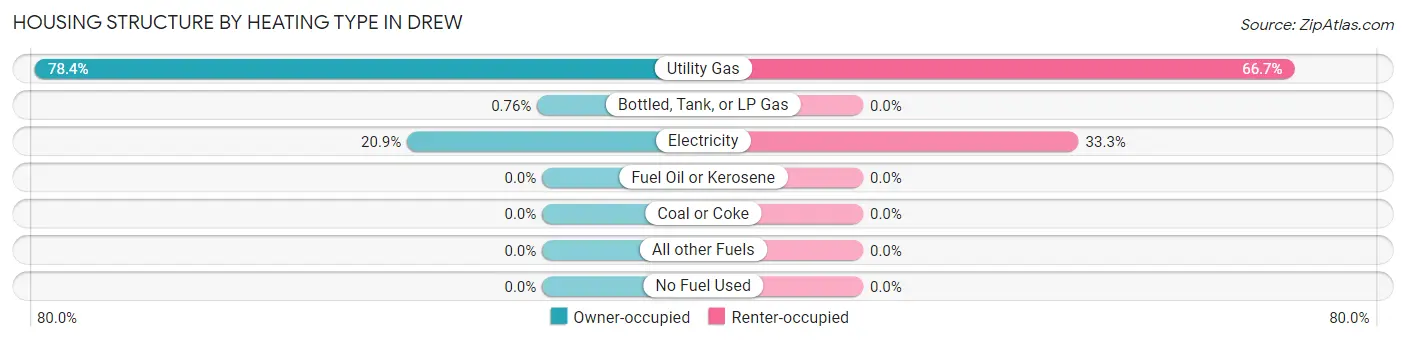
| Heating Type | Owner-occupied | Renter-occupied |
| Utility Gas | 308 (78.4%) | 278 (66.7%) |
| Bottled, Tank, or LP Gas | 3 (0.8%) | 0 (0.0%) |
| Electricity | 82 (20.9%) | 139 (33.3%) |
| Fuel Oil or Kerosene | 0 (0.0%) | 0 (0.0%) |
| Coal or Coke | 0 (0.0%) | 0 (0.0%) |
| All other Fuels | 0 (0.0%) | 0 (0.0%) |
| No Fuel Used | 0 (0.0%) | 0 (0.0%) |
| Total | 393 (100.0%) | 417 (100.0%) |
Household Vehicle Usage in Drew
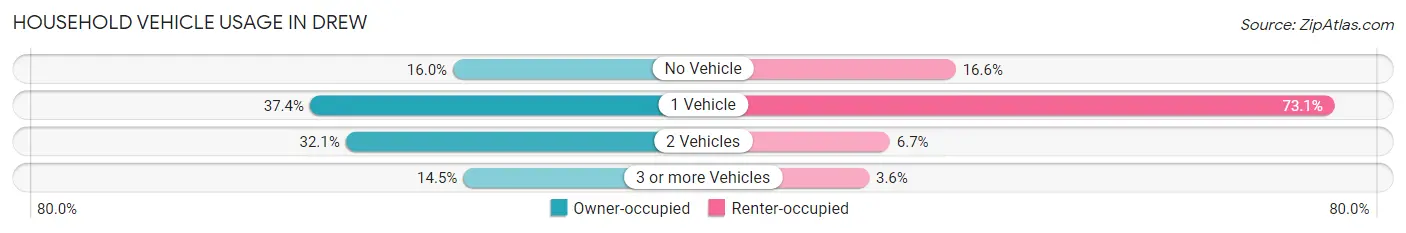
| Vehicles per Household | Owner-occupied | Renter-occupied |
| No Vehicle | 63 (16.0%) | 69 (16.6%) |
| 1 Vehicle | 147 (37.4%) | 305 (73.1%) |
| 2 Vehicles | 126 (32.1%) | 28 (6.7%) |
| 3 or more Vehicles | 57 (14.5%) | 15 (3.6%) |
| Total | 393 (100.0%) | 417 (100.0%) |
Real Estate & Mortgages in Drew
Real Estate and Mortgage Overview in Drew
| Characteristic | Without Mortgage | With Mortgage |
| Housing Units | 250 | 143 |
| Median Property Value | $50,000 | $71,600 |
| Median Household Income | $32,870 | $3 |
| Monthly Housing Costs | $283 | $0 |
| Real Estate Taxes | $624 | $39 |
Property Value by Mortgage Status in Drew
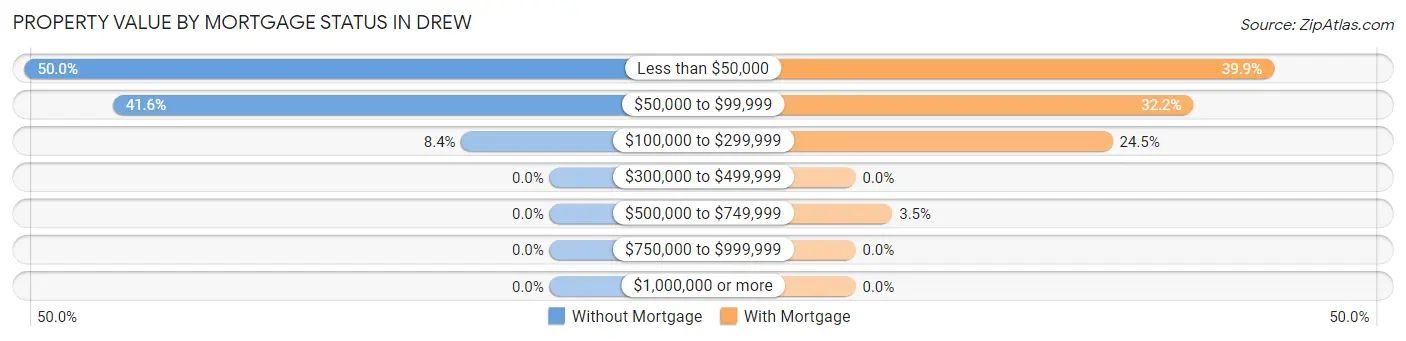
| Property Value | Without Mortgage | With Mortgage |
| Less than $50,000 | 125 (50.0%) | 57 (39.9%) |
| $50,000 to $99,999 | 104 (41.6%) | 46 (32.2%) |
| $100,000 to $299,999 | 21 (8.4%) | 35 (24.5%) |
| $300,000 to $499,999 | 0 (0.0%) | 0 (0.0%) |
| $500,000 to $749,999 | 0 (0.0%) | 5 (3.5%) |
| $750,000 to $999,999 | 0 (0.0%) | 0 (0.0%) |
| $1,000,000 or more | 0 (0.0%) | 0 (0.0%) |
| Total | 250 (100.0%) | 143 (100.0%) |
Household Income by Mortgage Status in Drew
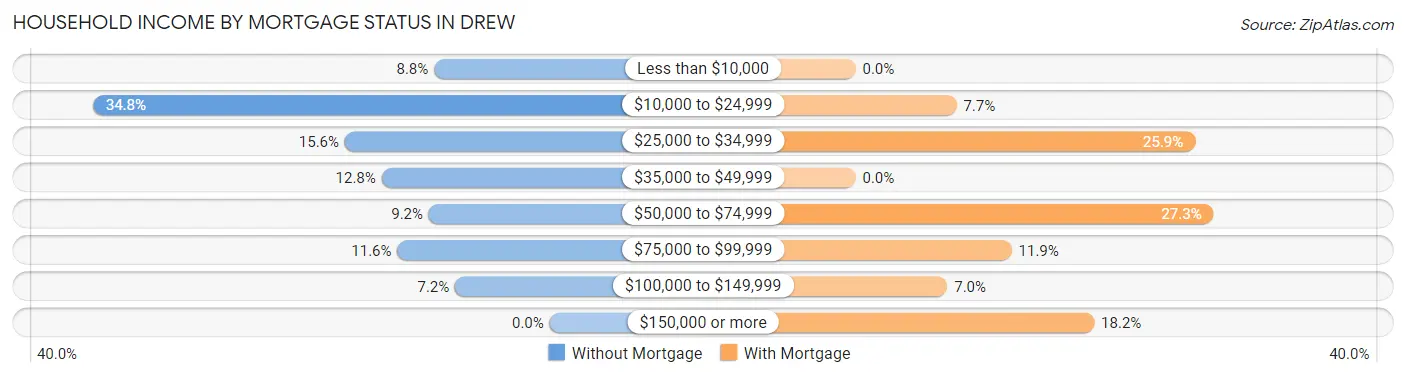
| Household Income | Without Mortgage | With Mortgage |
| Less than $10,000 | 22 (8.8%) | 0 (0.0%) |
| $10,000 to $24,999 | 87 (34.8%) | 11 (7.7%) |
| $25,000 to $34,999 | 39 (15.6%) | 37 (25.9%) |
| $35,000 to $49,999 | 32 (12.8%) | 0 (0.0%) |
| $50,000 to $74,999 | 23 (9.2%) | 39 (27.3%) |
| $75,000 to $99,999 | 29 (11.6%) | 17 (11.9%) |
| $100,000 to $149,999 | 18 (7.2%) | 10 (7.0%) |
| $150,000 or more | 0 (0.0%) | 26 (18.2%) |
| Total | 250 (100.0%) | 143 (100.0%) |
Property Value to Household Income Ratio in Drew
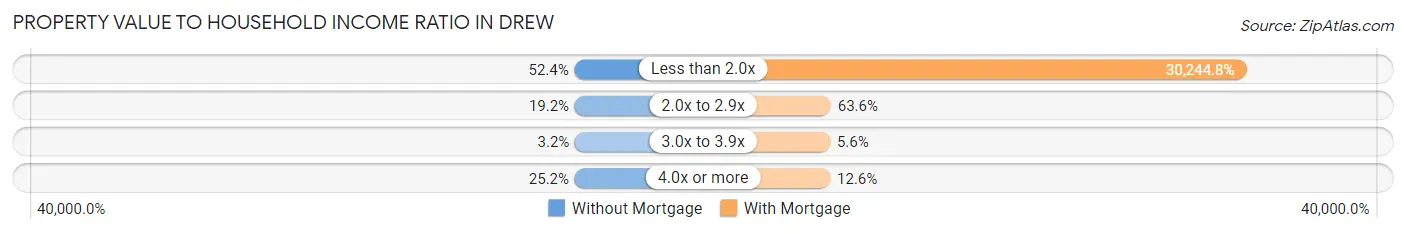
| Value-to-Income Ratio | Without Mortgage | With Mortgage |
| Less than 2.0x | 131 (52.4%) | 43,250 (30,244.8%) |
| 2.0x to 2.9x | 48 (19.2%) | 91 (63.6%) |
| 3.0x to 3.9x | 8 (3.2%) | 8 (5.6%) |
| 4.0x or more | 63 (25.2%) | 18 (12.6%) |
| Total | 250 (100.0%) | 143 (100.0%) |
Real Estate Taxes by Mortgage Status in Drew
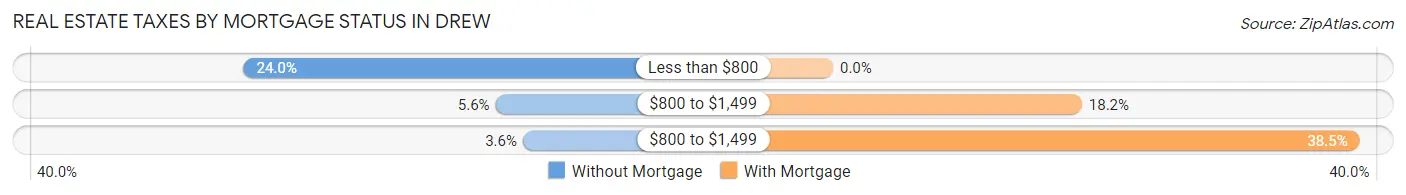
| Property Taxes | Without Mortgage | With Mortgage |
| Less than $800 | 60 (24.0%) | 0 (0.0%) |
| $800 to $1,499 | 14 (5.6%) | 26 (18.2%) |
| $800 to $1,499 | 9 (3.6%) | 55 (38.5%) |
| Total | 250 (100.0%) | 143 (100.0%) |
Health & Disability in Drew
Health Insurance Coverage by Age in Drew
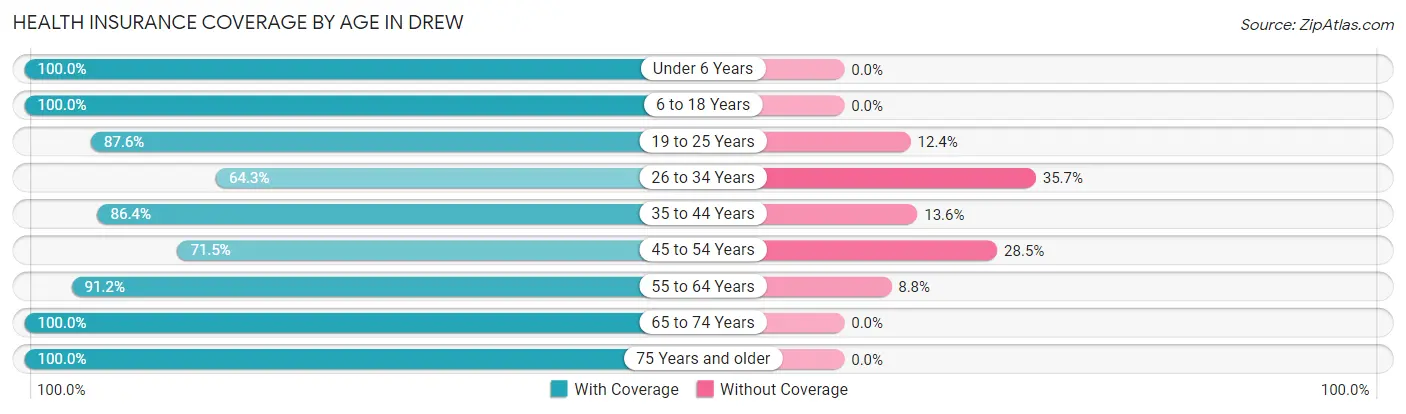
| Age Bracket | With Coverage | Without Coverage |
| Under 6 Years | 246 (100.0%) | 0 (0.0%) |
| 6 to 18 Years | 282 (100.0%) | 0 (0.0%) |
| 19 to 25 Years | 248 (87.6%) | 35 (12.4%) |
| 26 to 34 Years | 162 (64.3%) | 90 (35.7%) |
| 35 to 44 Years | 317 (86.4%) | 50 (13.6%) |
| 45 to 54 Years | 163 (71.5%) | 65 (28.5%) |
| 55 to 64 Years | 229 (91.2%) | 22 (8.8%) |
| 65 to 74 Years | 219 (100.0%) | 0 (0.0%) |
| 75 Years and older | 97 (100.0%) | 0 (0.0%) |
| Total | 1,963 (88.2%) | 262 (11.8%) |
Health Insurance Coverage by Citizenship Status in Drew
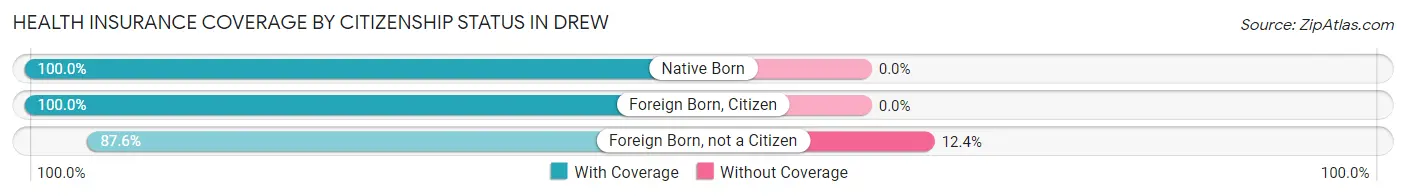
| Citizenship Status | With Coverage | Without Coverage |
| Native Born | 246 (100.0%) | 0 (0.0%) |
| Foreign Born, Citizen | 282 (100.0%) | 0 (0.0%) |
| Foreign Born, not a Citizen | 248 (87.6%) | 35 (12.4%) |
Health Insurance Coverage by Household Income in Drew
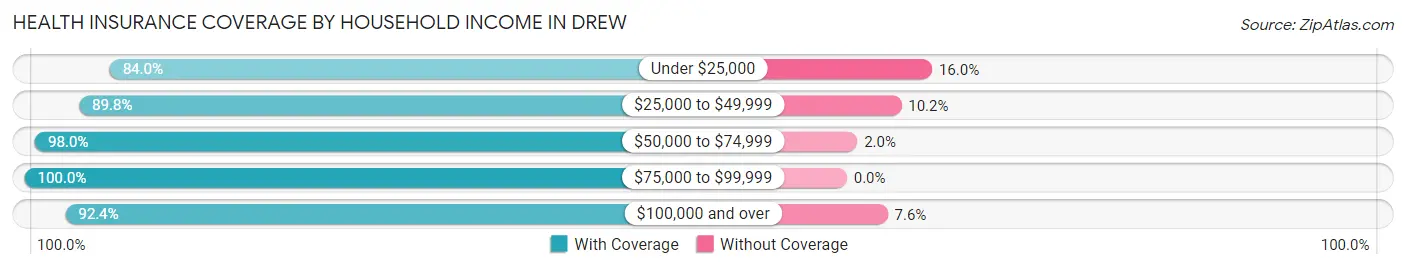
| Household Income | With Coverage | Without Coverage |
| Under $25,000 | 1,011 (84.0%) | 192 (16.0%) |
| $25,000 to $49,999 | 475 (89.8%) | 54 (10.2%) |
| $50,000 to $74,999 | 200 (98.0%) | 4 (2.0%) |
| $75,000 to $99,999 | 132 (100.0%) | 0 (0.0%) |
| $100,000 and over | 145 (92.4%) | 12 (7.6%) |
Public vs Private Health Insurance Coverage by Age in Drew
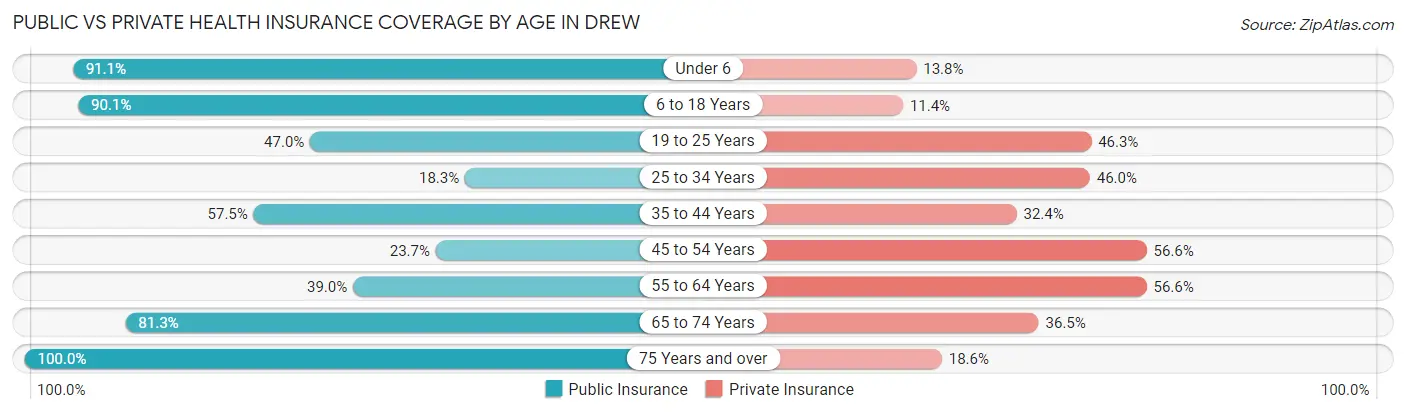
| Age Bracket | Public Insurance | Private Insurance |
| Under 6 | 224 (91.1%) | 34 (13.8%) |
| 6 to 18 Years | 254 (90.1%) | 32 (11.4%) |
| 19 to 25 Years | 133 (47.0%) | 131 (46.3%) |
| 25 to 34 Years | 46 (18.2%) | 116 (46.0%) |
| 35 to 44 Years | 211 (57.5%) | 119 (32.4%) |
| 45 to 54 Years | 54 (23.7%) | 129 (56.6%) |
| 55 to 64 Years | 98 (39.0%) | 142 (56.6%) |
| 65 to 74 Years | 178 (81.3%) | 80 (36.5%) |
| 75 Years and over | 97 (100.0%) | 18 (18.6%) |
| Total | 1,295 (58.2%) | 801 (36.0%) |
Disability Status by Sex by Age in Drew
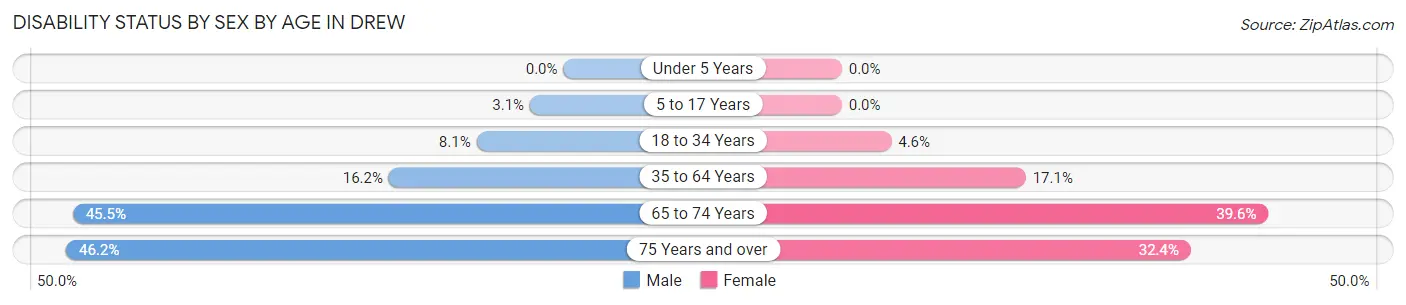
| Age Bracket | Male | Female |
| Under 5 Years | 0 (0.0%) | 0 (0.0%) |
| 5 to 17 Years | 4 (3.1%) | 0 (0.0%) |
| 18 to 34 Years | 22 (8.1%) | 13 (4.6%) |
| 35 to 64 Years | 63 (16.2%) | 78 (17.1%) |
| 65 to 74 Years | 56 (45.5%) | 38 (39.6%) |
| 75 Years and over | 12 (46.2%) | 23 (32.4%) |
Disability Class by Sex by Age in Drew
Disability Class: Hearing Difficulty
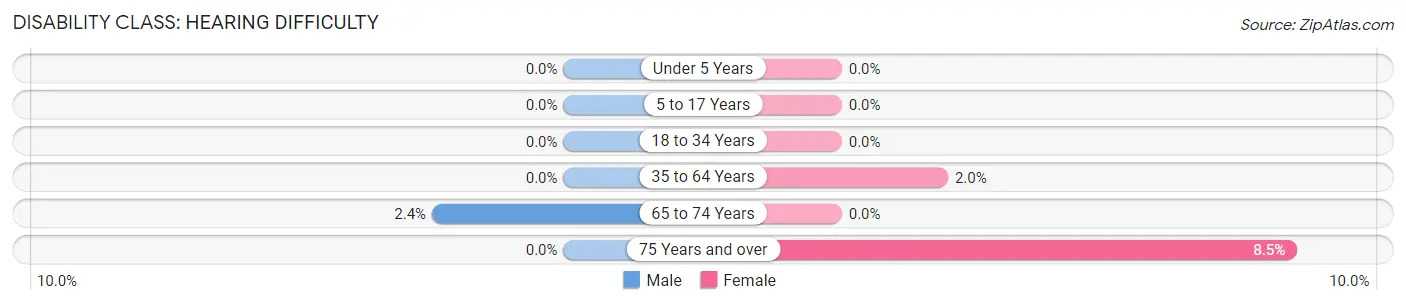
| Age Bracket | Male | Female |
| Under 5 Years | 0 (0.0%) | 0 (0.0%) |
| 5 to 17 Years | 0 (0.0%) | 0 (0.0%) |
| 18 to 34 Years | 0 (0.0%) | 0 (0.0%) |
| 35 to 64 Years | 0 (0.0%) | 9 (2.0%) |
| 65 to 74 Years | 3 (2.4%) | 0 (0.0%) |
| 75 Years and over | 0 (0.0%) | 6 (8.5%) |
Disability Class: Vision Difficulty
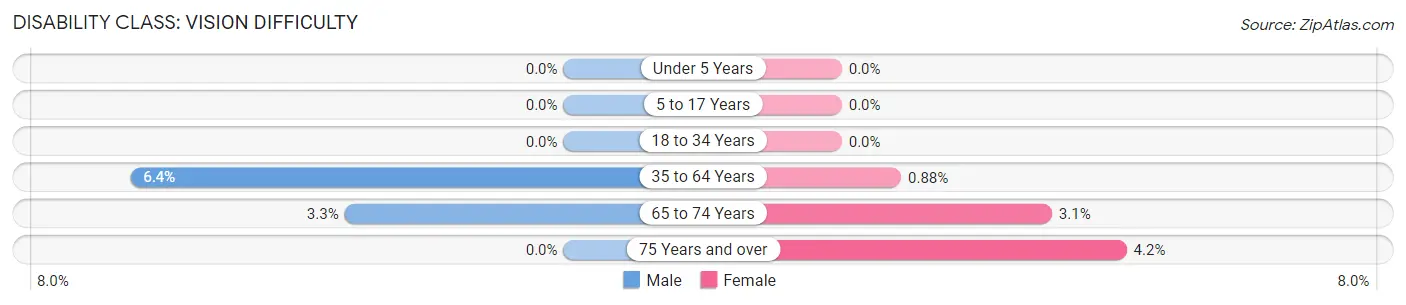
| Age Bracket | Male | Female |
| Under 5 Years | 0 (0.0%) | 0 (0.0%) |
| 5 to 17 Years | 0 (0.0%) | 0 (0.0%) |
| 18 to 34 Years | 0 (0.0%) | 0 (0.0%) |
| 35 to 64 Years | 25 (6.4%) | 4 (0.9%) |
| 65 to 74 Years | 4 (3.3%) | 3 (3.1%) |
| 75 Years and over | 0 (0.0%) | 3 (4.2%) |
Disability Class: Cognitive Difficulty
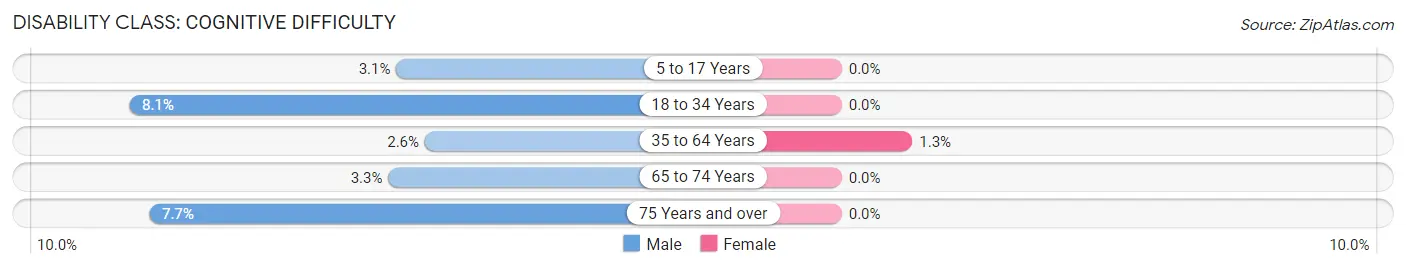
| Age Bracket | Male | Female |
| 5 to 17 Years | 4 (3.1%) | 0 (0.0%) |
| 18 to 34 Years | 22 (8.1%) | 0 (0.0%) |
| 35 to 64 Years | 10 (2.6%) | 6 (1.3%) |
| 65 to 74 Years | 4 (3.3%) | 0 (0.0%) |
| 75 Years and over | 2 (7.7%) | 0 (0.0%) |
Disability Class: Ambulatory Difficulty
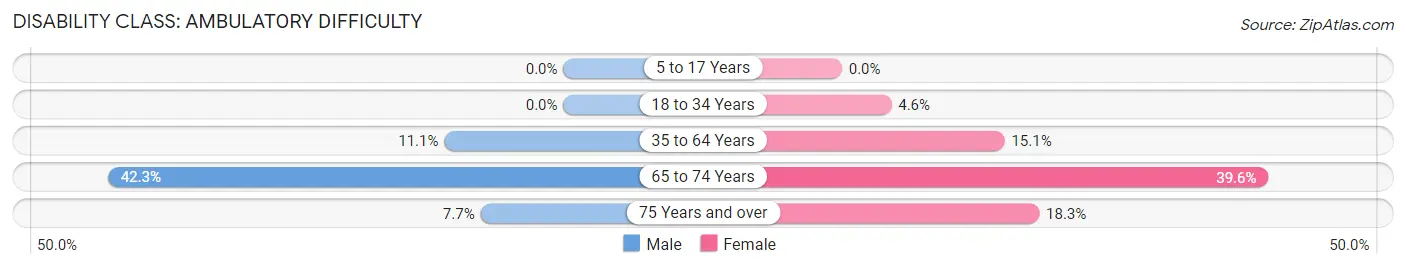
| Age Bracket | Male | Female |
| 5 to 17 Years | 0 (0.0%) | 0 (0.0%) |
| 18 to 34 Years | 0 (0.0%) | 13 (4.6%) |
| 35 to 64 Years | 43 (11.1%) | 69 (15.1%) |
| 65 to 74 Years | 52 (42.3%) | 38 (39.6%) |
| 75 Years and over | 2 (7.7%) | 13 (18.3%) |
Disability Class: Self-Care Difficulty
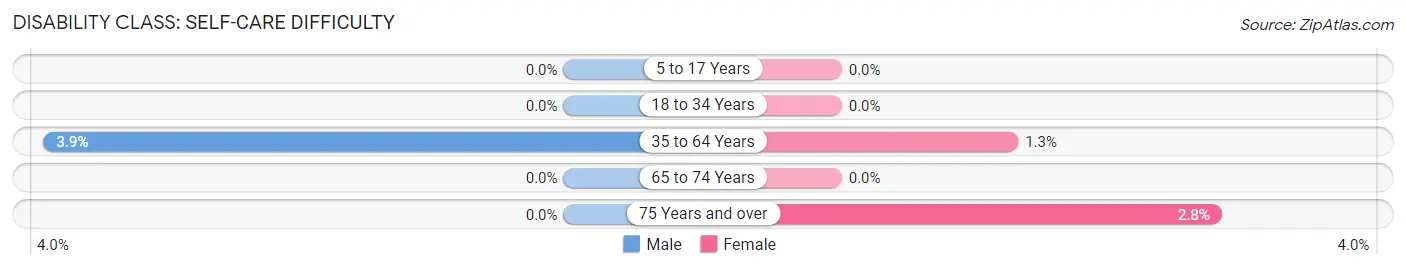
| Age Bracket | Male | Female |
| 5 to 17 Years | 0 (0.0%) | 0 (0.0%) |
| 18 to 34 Years | 0 (0.0%) | 0 (0.0%) |
| 35 to 64 Years | 15 (3.9%) | 6 (1.3%) |
| 65 to 74 Years | 0 (0.0%) | 0 (0.0%) |
| 75 Years and over | 0 (0.0%) | 2 (2.8%) |
Technology Access in Drew
Computing Device Access in Drew
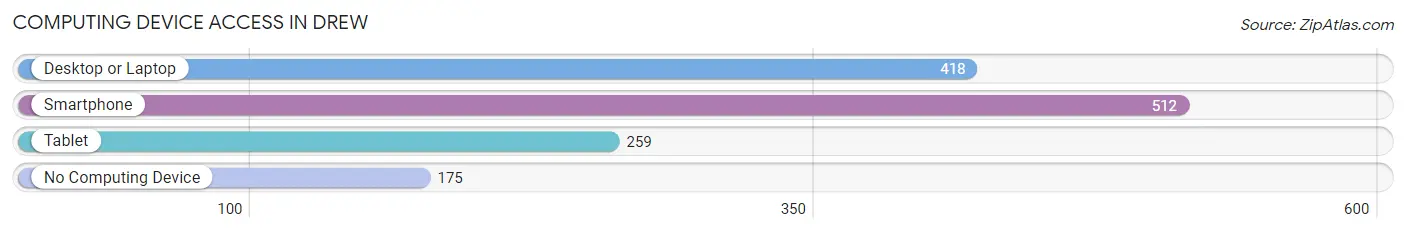
| Device Type | # Households | % Households |
| Desktop or Laptop | 418 | 51.6% |
| Smartphone | 512 | 63.2% |
| Tablet | 259 | 32.0% |
| No Computing Device | 175 | 21.6% |
| Total | 810 | 100.0% |
Internet Access in Drew
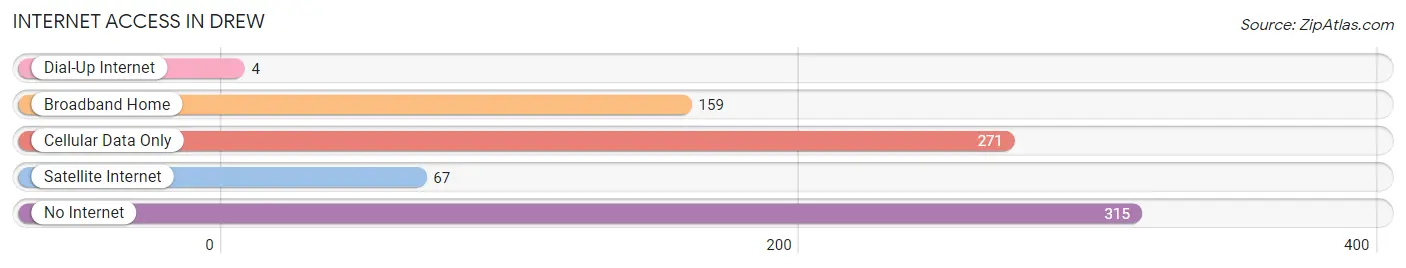
| Internet Type | # Households | % Households |
| Dial-Up Internet | 4 | 0.5% |
| Broadband Home | 159 | 19.6% |
| Cellular Data Only | 271 | 33.5% |
| Satellite Internet | 67 | 8.3% |
| No Internet | 315 | 38.9% |
| Total | 810 | 100.0% |
Drew Summary
MS History
Mississippi is a state located in the southeastern region of the United States. It is bordered by Tennessee to the north, Alabama to the east, the Gulf of Mexico to the south, and Louisiana and Arkansas to the west. Mississippi has a rich and diverse history, with its roots stretching back to the early days of the United States. The state was originally part of the French colony of Louisiana, and was later ceded to the United States in the Louisiana Purchase of 1803. Mississippi was admitted to the Union as the 20th state in 1817.
The state has a long and complex history, with its roots stretching back to the early days of the United States. Mississippi was home to many Native American tribes, including the Choctaw, Chickasaw, and Natchez. The first Europeans to explore the area were the Spanish, who arrived in the 16th century. The French also explored the area, and established a colony in the region in the early 1700s. The British took control of the region in 1763, and it remained under British control until the end of the American Revolution in 1783.
Mississippi was a major battleground during the Civil War, with many battles taking place in the state. The state was the site of the Battle of Vicksburg, which was a major victory for the Union forces. After the war, Mississippi was readmitted to the Union in 1870.
In the late 19th and early 20th centuries, Mississippi was a major center of the civil rights movement. The state was the site of the famous Freedom Summer of 1964, when civil rights activists from around the country came to Mississippi to register African-American voters. The state was also the site of the famous march from Selma to Montgomery, Alabama, in 1965.
MS Geography
Mississippi is located in the southeastern region of the United States. It is bordered by Tennessee to the north, Alabama to the east, the Gulf of Mexico to the south, and Louisiana and Arkansas to the west. The state has a total area of 48,430 square miles, making it the 32nd largest state in the country.
The landscape of Mississippi is mostly flat, with rolling hills in the north and east. The state is divided into three distinct geographic regions: the Gulf Coastal Plain, the Mississippi Alluvial Plain, and the Mississippi Delta. The Gulf Coastal Plain is located along the Gulf of Mexico and is characterized by sandy beaches and marshlands. The Mississippi Alluvial Plain is located in the central part of the state and is characterized by flat, fertile land. The Mississippi Delta is located in the northwest corner of the state and is characterized by flat, low-lying land.
The state is home to a variety of rivers, including the Mississippi River, the Yazoo River, and the Pearl River. The Mississippi River forms the western border of the state and is the second longest river in the United States. The Yazoo River is located in the central part of the state and is a major tributary of the Mississippi River. The Pearl River is located in the southeastern part of the state and is a major tributary of the Gulf of Mexico.
MS Economy
The economy of Mississippi is largely based on agriculture, manufacturing, and services. The state is a major producer of cotton, soybeans, corn, and rice. Mississippi is also a major producer of timber, and the state is home to a number of lumber mills.
Manufacturing is also an important part of the state’s economy. Mississippi is home to a number of automotive, aerospace, and defense-related industries. The state is also home to a number of shipbuilding and ship repair facilities.
The service sector is also an important part of the state’s economy. Mississippi is home to a number of universities and colleges, as well as a number of hospitals and medical centers. Tourism is also an important part of the state’s economy, with many visitors coming to the state to enjoy its beaches, parks, and other attractions.
MS Demographics
As of 2020, the population of Mississippi was estimated to be around 3 million people. The state has a population density of about 60 people per square mile, making it the 37th most densely populated state in the country.
The racial makeup of Mississippi is predominantly white, with about 58% of the population identifying as white. African Americans make up about 37% of the population, while Hispanics and Latinos make up about 4%. Other races make up the remaining 1%.
The median household income in Mississippi is around $45,000, which is lower than the national median of $60,000. The poverty rate in the state is around 19%, which is higher than the national average of 11%. The unemployment rate in the state is around 6%, which is lower than the national average of 8%.
Common Questions
What is Per Capita Income in Drew?
Per Capita income in Drew is $14,160.
What is the Median Family Income in Drew?
Median Family Income in Drew is $26,528.
What is the Median Household income in Drew?
Median Household Income in Drew is $21,512.
What is Income or Wage Gap in Drew?
Income or Wage Gap in Drew is 22.1%.
Women in Drew earn 77.9 cents for every dollar earned by a man.
What is Family Income Deficit in Drew?
Family Income Deficit in Drew is $13,080.
Families that are below poverty line in Drew earn $13,080 less on average than the poverty threshold level.
What is Inequality or Gini Index in Drew?
Inequality or Gini Index in Drew is 0.47.
What is the Total Population of Drew?
Total Population of Drew is 2,225.
What is the Total Male Population of Drew?
Total Male Population of Drew is 1,025.
What is the Total Female Population of Drew?
Total Female Population of Drew is 1,200.
What is the Ratio of Males per 100 Females in Drew?
There are 85.42 Males per 100 Females in Drew.
What is the Ratio of Females per 100 Males in Drew?
There are 117.07 Females per 100 Males in Drew.
What is the Median Population Age in Drew?
Median Population Age in Drew is 36.1 Years.
What is the Average Family Size in Drew
Average Family Size in Drew is 3.6 People.
What is the Average Household Size in Drew
Average Household Size in Drew is 2.8 People.
How Large is the Labor Force in Drew?
There are 881 People in the Labor Forcein in Drew.
What is the Percentage of People in the Labor Force in Drew?
50.3% of People are in the Labor Force in Drew.
What is the Unemployment Rate in Drew?
Unemployment Rate in Drew is 11.2%.