Tate County, MS Map & Demographics
Tate County Map
Tate County Overview
$28,306
PER CAPITA INCOME
$68,494
AVG FAMILY INCOME
$61,286
AVG HOUSEHOLD INCOME
37.9%
WAGE / INCOME GAP [ % ]
62.1¢/ $1
WAGE / INCOME GAP [ $ ]
$8,371
FAMILY INCOME DEFICIT
0.43
INEQUALITY / GINI INDEX
28,094
TOTAL POPULATION
13,587
MALE POPULATION
14,507
FEMALE POPULATION
93.66
MALES / 100 FEMALES
106.77
FEMALES / 100 MALES
38.3
MEDIAN AGE
2.9
AVG FAMILY SIZE
2.5
AVG HOUSEHOLD SIZE
12,883
LABOR FORCE [ PEOPLE ]
57.4%
PERCENT IN LABOR FORCE
7.2%
UNEMPLOYMENT RATE
Tate County Area Codes
Income in Tate County
Income Overview in Tate County
Per Capita Income in Tate County is $28,306, while median incomes of families and households are $68,494 and $61,286 respectively.
| Characteristic | Number | Measure |
| Per Capita Income | 28,094 | $28,306 |
| Median Family Income | 7,757 | $68,494 |
| Mean Family Income | 7,757 | $82,387 |
| Median Household Income | 10,496 | $61,286 |
| Mean Household Income | 10,496 | $74,352 |
| Income Deficit | 7,757 | $8,371 |
| Wage / Income Gap (%) | 28,094 | 37.91% |
| Wage / Income Gap ($) | 28,094 | 62.09¢ per $1 |
| Gini / Inequality Index | 28,094 | 0.43 |
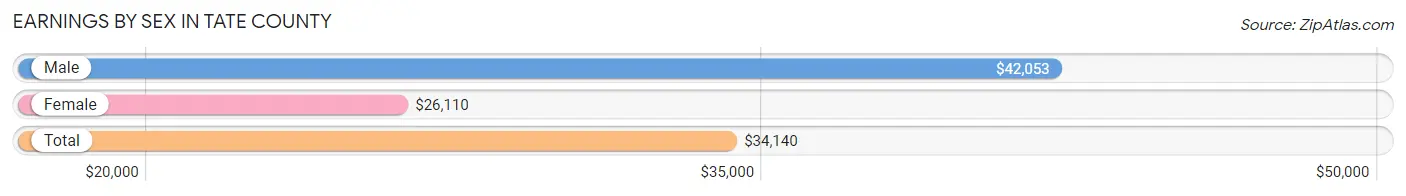
Earnings by Sex in Tate County
Average Earnings in Tate County are $34,140, $42,053 for men and $26,110 for women, a difference of 37.9%.
| Sex | Number | Average Earnings |
| Male | 7,165 (52.7%) | $42,053 |
| Female | 6,423 (47.3%) | $26,110 |
| Total | 13,588 (100.0%) | $34,140 |
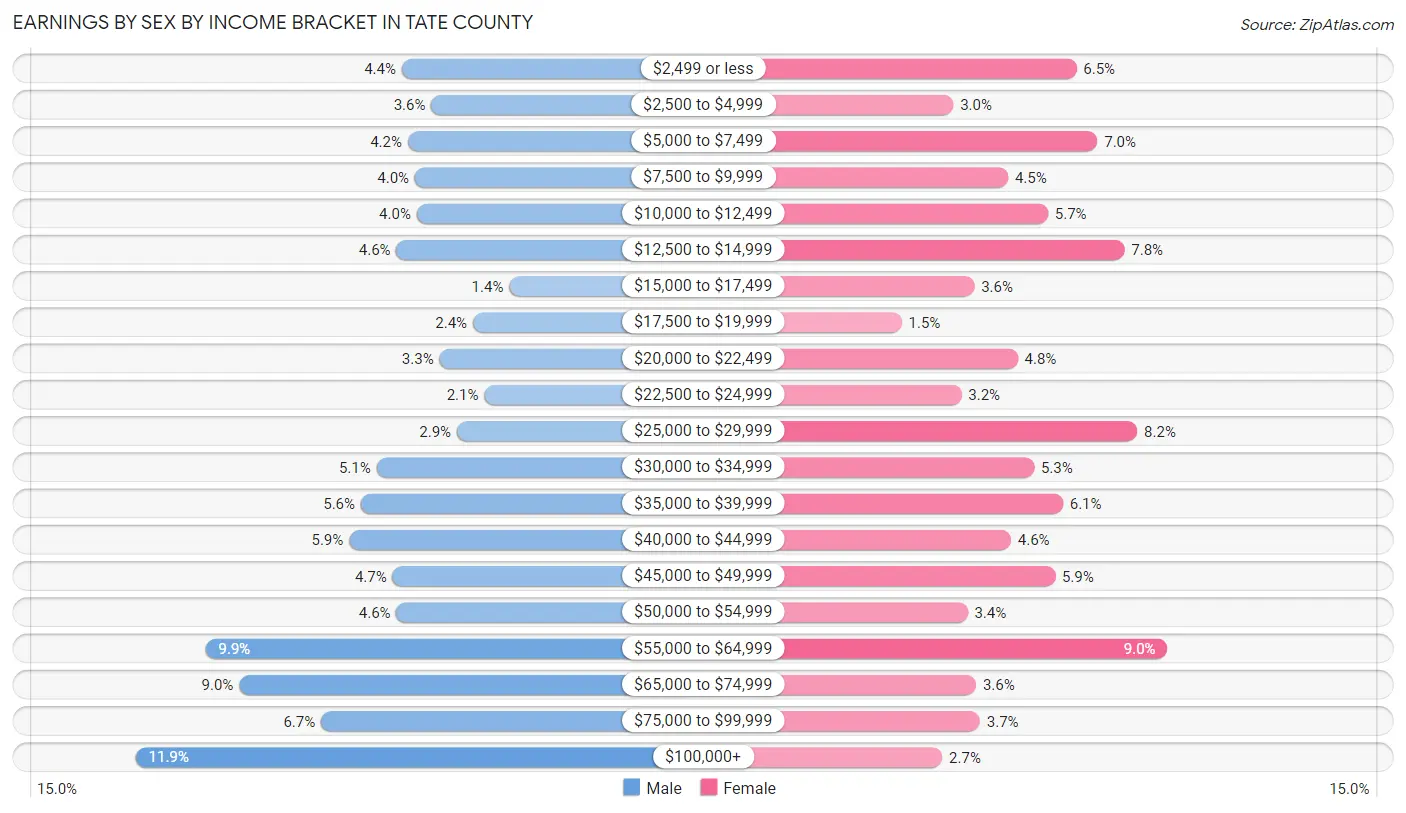
Earnings by Sex by Income Bracket in Tate County
The most common earnings brackets in Tate County are $100,000+ for men (851 | 11.9%) and $55,000 to $64,999 for women (579 | 9.0%).
| Income | Male | Female |
| $2,499 or less | 315 (4.4%) | 414 (6.5%) |
| $2,500 to $4,999 | 256 (3.6%) | 192 (3.0%) |
| $5,000 to $7,499 | 303 (4.2%) | 452 (7.0%) |
| $7,500 to $9,999 | 289 (4.0%) | 291 (4.5%) |
| $10,000 to $12,499 | 285 (4.0%) | 363 (5.7%) |
| $12,500 to $14,999 | 326 (4.5%) | 501 (7.8%) |
| $15,000 to $17,499 | 99 (1.4%) | 230 (3.6%) |
| $17,500 to $19,999 | 172 (2.4%) | 99 (1.5%) |
| $20,000 to $22,499 | 239 (3.3%) | 308 (4.8%) |
| $22,500 to $24,999 | 149 (2.1%) | 207 (3.2%) |
| $25,000 to $29,999 | 204 (2.9%) | 524 (8.2%) |
| $30,000 to $34,999 | 366 (5.1%) | 338 (5.3%) |
| $35,000 to $39,999 | 398 (5.6%) | 390 (6.1%) |
| $40,000 to $44,999 | 421 (5.9%) | 296 (4.6%) |
| $45,000 to $49,999 | 334 (4.7%) | 376 (5.9%) |
| $50,000 to $54,999 | 326 (4.5%) | 218 (3.4%) |
| $55,000 to $64,999 | 711 (9.9%) | 579 (9.0%) |
| $65,000 to $74,999 | 643 (9.0%) | 233 (3.6%) |
| $75,000 to $99,999 | 478 (6.7%) | 240 (3.7%) |
| $100,000+ | 851 (11.9%) | 172 (2.7%) |
| Total | 7,165 (100.0%) | 6,423 (100.0%) |
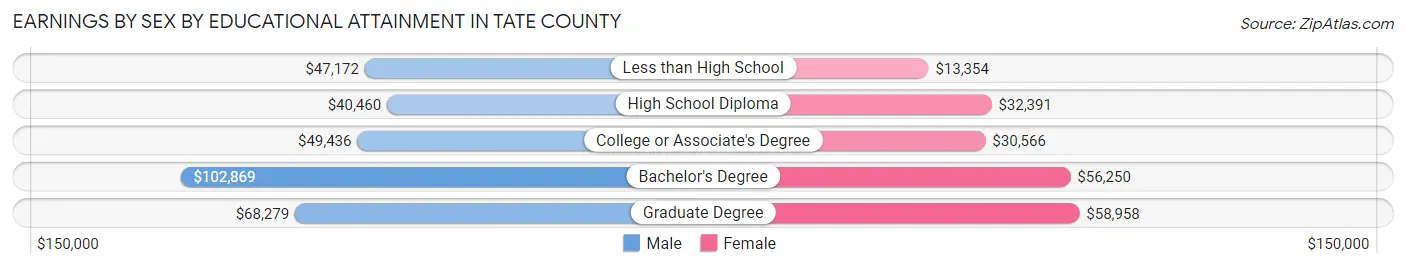
Earnings by Sex by Educational Attainment in Tate County
Average earnings in Tate County are $50,828 for men and $32,275 for women, a difference of 36.5%. Men with an educational attainment of bachelor's degree enjoy the highest average annual earnings of $102,869, while those with high school diploma education earn the least with $40,460. Women with an educational attainment of graduate degree earn the most with the average annual earnings of $58,958, while those with less than high school education have the smallest earnings of $13,354.
| Educational Attainment | Male Income | Female Income |
| Less than High School | $47,172 | $13,354 |
| High School Diploma | $40,460 | $32,391 |
| College or Associate's Degree | $49,436 | $30,566 |
| Bachelor's Degree | $102,869 | $56,250 |
| Graduate Degree | $68,279 | $58,958 |
| Total | $50,828 | $32,275 |
Family Income in Tate County
Family Income Brackets in Tate County
According to the Tate County family income data, there are 1,551 families falling into the $100,000 to $149,999 income range, which is the most common income bracket and makes up 20.0% of all families. Conversely, the less than $10,000 income bracket is the least frequent group with only 186 families (2.4%) belonging to this category.
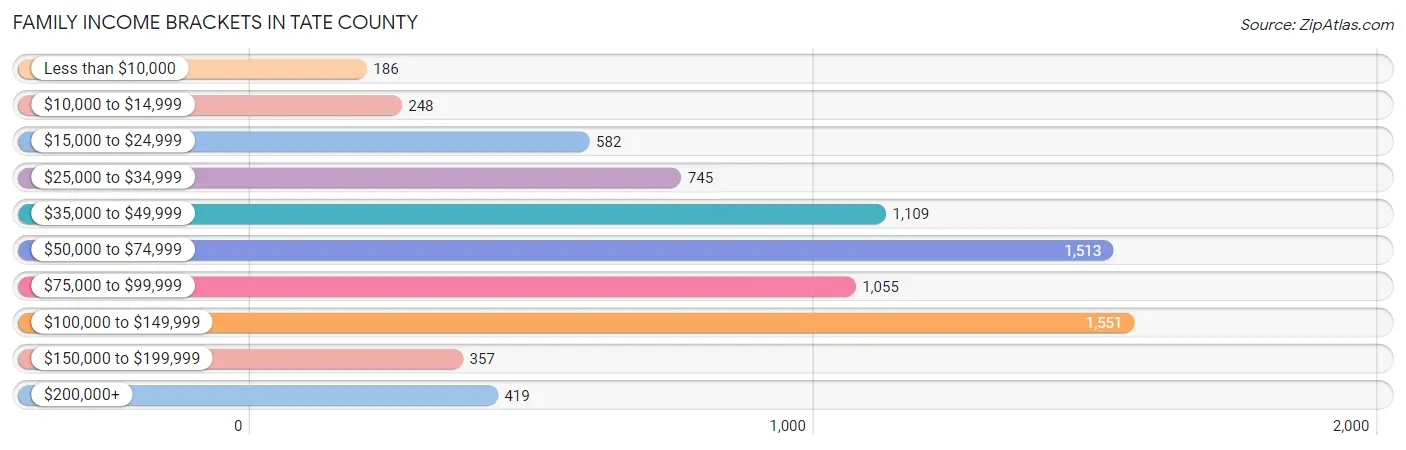
| Income Bracket | # Families | % Families |
| Less than $10,000 | 186 | 2.4% |
| $10,000 to $14,999 | 248 | 3.2% |
| $15,000 to $24,999 | 582 | 7.5% |
| $25,000 to $34,999 | 745 | 9.6% |
| $35,000 to $49,999 | 1,109 | 14.3% |
| $50,000 to $74,999 | 1,513 | 19.5% |
| $75,000 to $99,999 | 1,055 | 13.6% |
| $100,000 to $149,999 | 1,551 | 20.0% |
| $150,000 to $199,999 | 357 | 4.6% |
| $200,000+ | 419 | 5.4% |
Family Income by Famaliy Size in Tate County
7+ person families (170 | 2.2%) account for the highest median family income in Tate County with $86,635 per family, while 2-person families (3,348 | 43.2%) have the highest median income of $30,579 per family member.
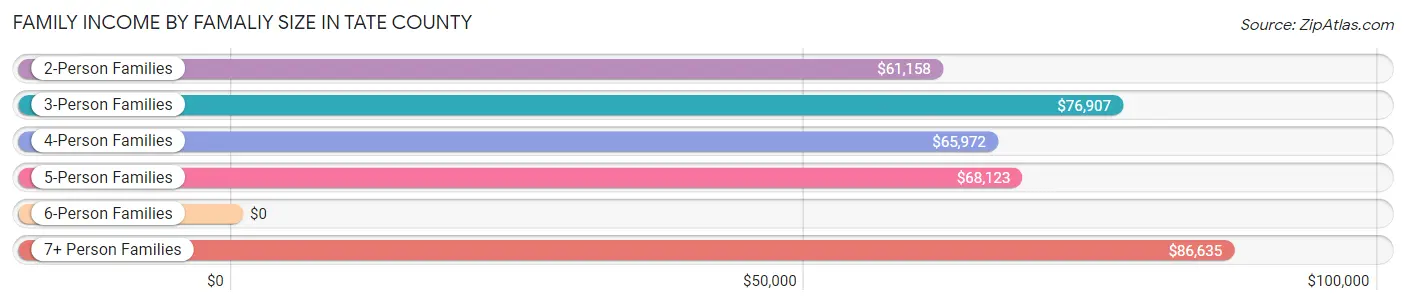
| Income Bracket | # Families | Median Income |
| 2-Person Families | 3,348 (43.2%) | $61,158 |
| 3-Person Families | 1,562 (20.1%) | $76,907 |
| 4-Person Families | 1,518 (19.6%) | $65,972 |
| 5-Person Families | 790 (10.2%) | $68,123 |
| 6-Person Families | 369 (4.8%) | $0 |
| 7+ Person Families | 170 (2.2%) | $86,635 |
| Total | 7,757 (100.0%) | $68,494 |
Family Income by Number of Earners in Tate County
The median family income in Tate County is $68,494, with families comprising 3+ earners (1,084) having the highest median family income of $98,143, while families with no earners (1,487) have the lowest median family income of $33,147, accounting for 14.0% and 19.2% of families, respectively.
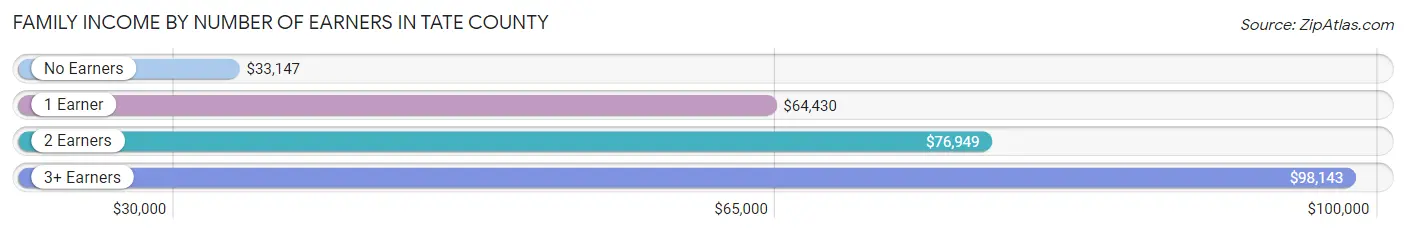
| Number of Earners | # Families | Median Income |
| No Earners | 1,487 (19.2%) | $33,147 |
| 1 Earner | 2,714 (35.0%) | $64,430 |
| 2 Earners | 2,472 (31.9%) | $76,949 |
| 3+ Earners | 1,084 (14.0%) | $98,143 |
| Total | 7,757 (100.0%) | $68,494 |
Household Income in Tate County
Household Income Brackets in Tate County
With 2,078 households falling in the category, the $50,000 to $74,999 income range is the most frequent in Tate County, accounting for 19.8% of all households. In contrast, only 409 households (3.9%) fall into the less than $10,000 income bracket, making it the least populous group.
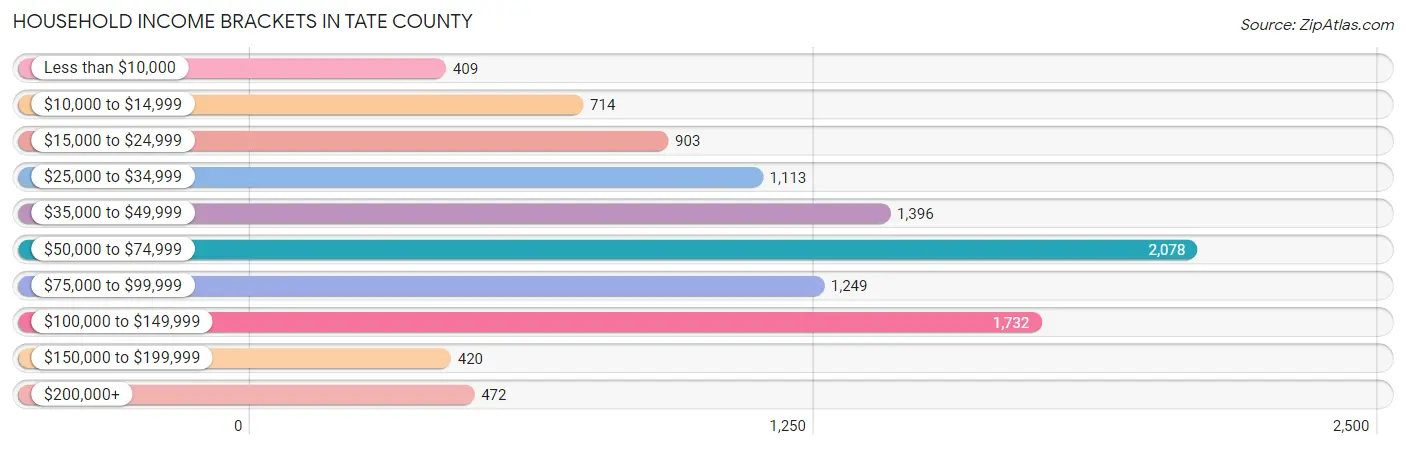
| Income Bracket | # Households | % Households |
| Less than $10,000 | 409 | 3.9% |
| $10,000 to $14,999 | 714 | 6.8% |
| $15,000 to $24,999 | 903 | 8.6% |
| $25,000 to $34,999 | 1,113 | 10.6% |
| $35,000 to $49,999 | 1,396 | 13.3% |
| $50,000 to $74,999 | 2,078 | 19.8% |
| $75,000 to $99,999 | 1,249 | 11.9% |
| $100,000 to $149,999 | 1,732 | 16.5% |
| $150,000 to $199,999 | 420 | 4.0% |
| $200,000+ | 472 | 4.5% |
Household Income by Householder Age in Tate County
The median household income in Tate County is $61,286, with the highest median household income of $68,079 found in the 25 to 44 years age bracket for the primary householder. A total of 2,966 households (28.3%) fall into this category. Meanwhile, the 65+ years age bracket for the primary householder has the lowest median household income of $43,628, with 2,883 households (27.5%) in this group.
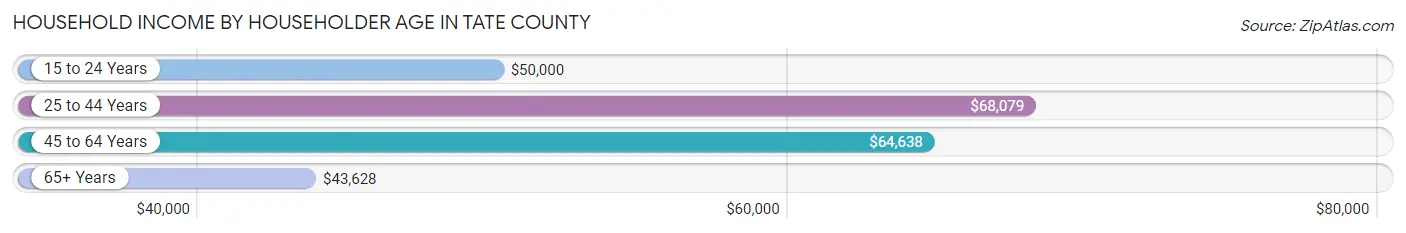
| Income Bracket | # Households | Median Income |
| 15 to 24 Years | 196 (1.9%) | $50,000 |
| 25 to 44 Years | 2,966 (28.3%) | $68,079 |
| 45 to 64 Years | 4,451 (42.4%) | $64,638 |
| 65+ Years | 2,883 (27.5%) | $43,628 |
| Total | 10,496 (100.0%) | $61,286 |
Poverty in Tate County
Income Below Poverty by Sex and Age in Tate County
With 16.6% poverty level for males and 16.7% for females among the residents of Tate County, 12 to 14 year old males and 6 to 11 year old females are the most vulnerable to poverty, with 111 males (30.3%) and 384 females (34.0%) in their respective age groups living below the poverty level.
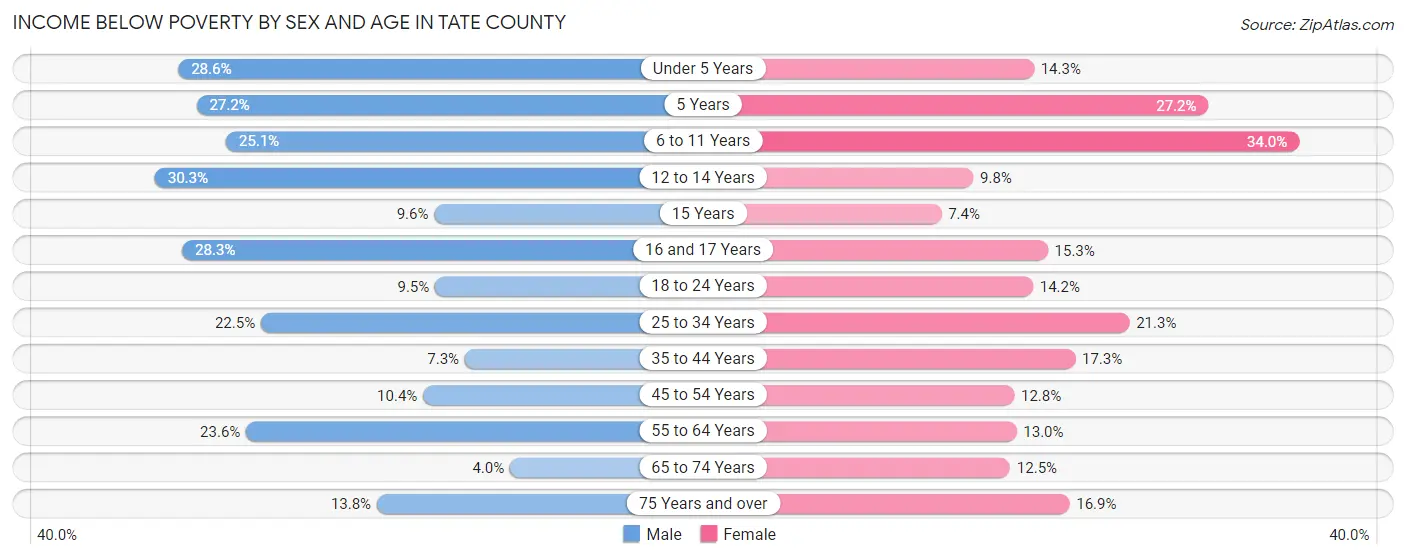
| Age Bracket | Male | Female |
| Under 5 Years | 229 (28.6%) | 111 (14.2%) |
| 5 Years | 73 (27.2%) | 37 (27.2%) |
| 6 to 11 Years | 268 (25.1%) | 384 (34.0%) |
| 12 to 14 Years | 111 (30.3%) | 46 (9.8%) |
| 15 Years | 25 (9.6%) | 11 (7.4%) |
| 16 and 17 Years | 92 (28.3%) | 59 (15.3%) |
| 18 to 24 Years | 89 (9.5%) | 129 (14.2%) |
| 25 to 34 Years | 363 (22.5%) | 370 (21.3%) |
| 35 to 44 Years | 107 (7.3%) | 293 (17.3%) |
| 45 to 54 Years | 171 (10.4%) | 234 (12.8%) |
| 55 to 64 Years | 417 (23.5%) | 245 (13.0%) |
| 65 to 74 Years | 55 (4.0%) | 193 (12.5%) |
| 75 Years and over | 88 (13.8%) | 152 (16.9%) |
| Total | 2,088 (16.6%) | 2,264 (16.7%) |
Income Above Poverty by Sex and Age in Tate County
According to the poverty statistics in Tate County, males aged 65 to 74 years and females aged 15 years are the age groups that are most secure financially, with 96.0% of males and 92.6% of females in these age groups living above the poverty line.
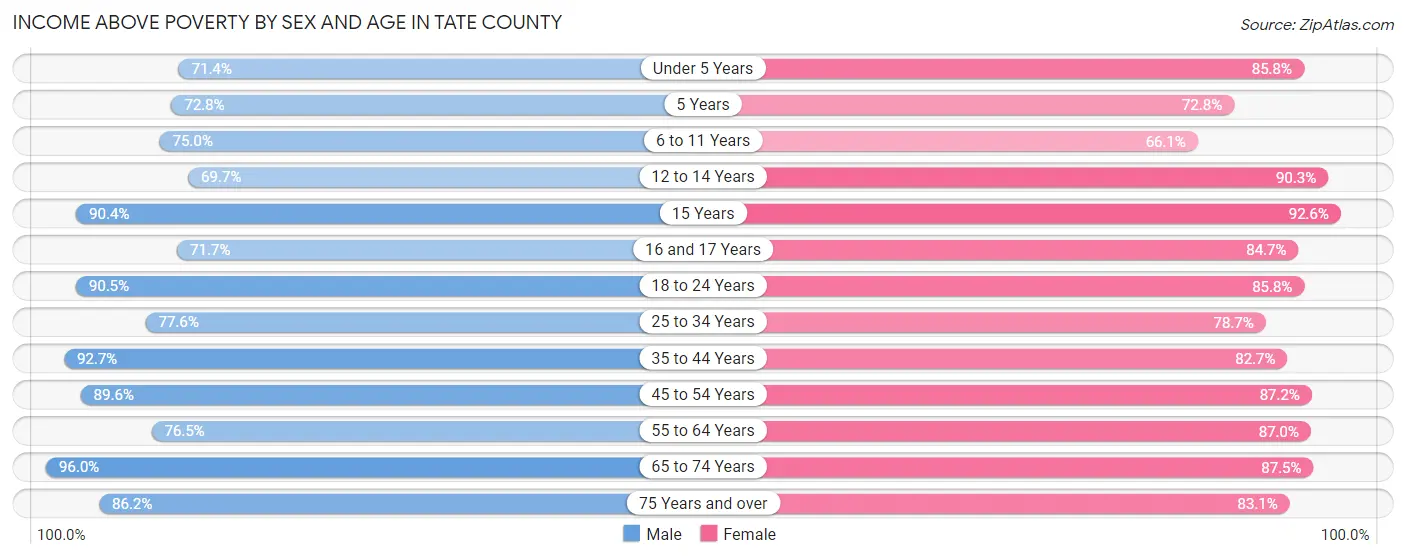
| Age Bracket | Male | Female |
| Under 5 Years | 572 (71.4%) | 668 (85.8%) |
| 5 Years | 195 (72.8%) | 99 (72.8%) |
| 6 to 11 Years | 802 (75.0%) | 747 (66.0%) |
| 12 to 14 Years | 255 (69.7%) | 426 (90.2%) |
| 15 Years | 236 (90.4%) | 138 (92.6%) |
| 16 and 17 Years | 233 (71.7%) | 327 (84.7%) |
| 18 to 24 Years | 846 (90.5%) | 781 (85.8%) |
| 25 to 34 Years | 1,254 (77.5%) | 1,364 (78.7%) |
| 35 to 44 Years | 1,357 (92.7%) | 1,399 (82.7%) |
| 45 to 54 Years | 1,472 (89.6%) | 1,596 (87.2%) |
| 55 to 64 Years | 1,354 (76.4%) | 1,645 (87.0%) |
| 65 to 74 Years | 1,334 (96.0%) | 1,353 (87.5%) |
| 75 Years and over | 548 (86.2%) | 748 (83.1%) |
| Total | 10,458 (83.4%) | 11,291 (83.3%) |
Income Below Poverty Among Married-Couple Families in Tate County
The poverty statistics for married-couple families in Tate County show that 8.3% or 455 of the total 5,459 families live below the poverty line. Families with 5 or more children have the highest poverty rate of 45.5%, comprising of 20 families. On the other hand, families with no children have the lowest poverty rate of 4.9%, which includes 137 families.
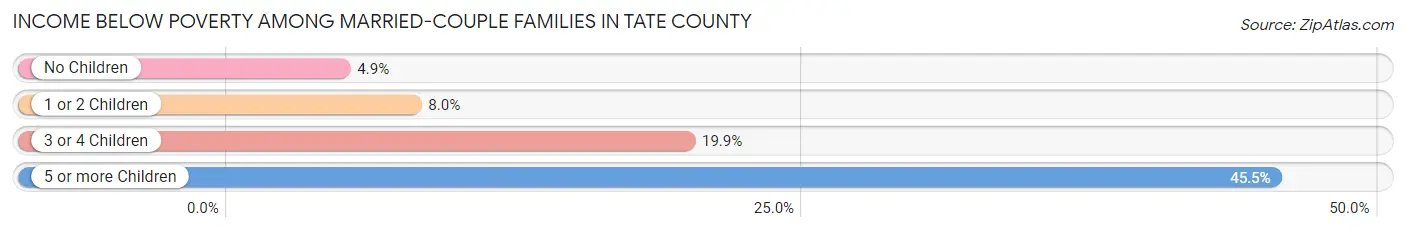
| Children | Above Poverty | Below Poverty |
| No Children | 2,662 (95.1%) | 137 (4.9%) |
| 1 or 2 Children | 1,718 (92.0%) | 149 (8.0%) |
| 3 or 4 Children | 600 (80.1%) | 149 (19.9%) |
| 5 or more Children | 24 (54.5%) | 20 (45.5%) |
| Total | 5,004 (91.7%) | 455 (8.3%) |
Income Below Poverty Among Single-Parent Households in Tate County
According to the poverty data in Tate County, 35.7% or 153 single-father households and 27.2% or 509 single-mother households are living below the poverty line. Among single-father households, those with 1 or 2 children have the highest poverty rate, with 133 households (61.3%) experiencing poverty. Likewise, among single-mother households, those with 5 or more children have the highest poverty rate, with 77 households (100.0%) falling below the poverty line.
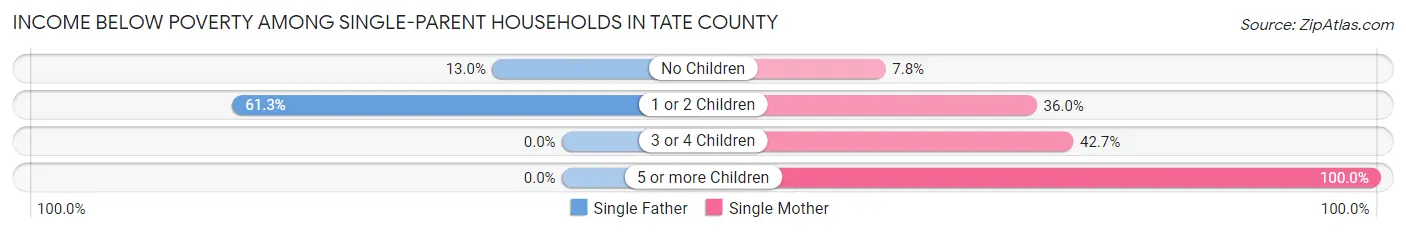
| Children | Single Father | Single Mother |
| No Children | 20 (13.0%) | 63 (7.8%) |
| 1 or 2 Children | 133 (61.3%) | 266 (35.9%) |
| 3 or 4 Children | 0 (0.0%) | 103 (42.7%) |
| 5 or more Children | 0 (0.0%) | 77 (100.0%) |
| Total | 153 (35.7%) | 509 (27.2%) |
Income Below Poverty Among Married-Couple vs Single-Parent Households in Tate County
The poverty data for Tate County shows that 455 of the married-couple family households (8.3%) and 662 of the single-parent households (28.8%) are living below the poverty level. Within the married-couple family households, those with 5 or more children have the highest poverty rate, with 20 households (45.5%) falling below the poverty line. Among the single-parent households, those with 5 or more children have the highest poverty rate, with 77 household (100.0%) living below poverty.
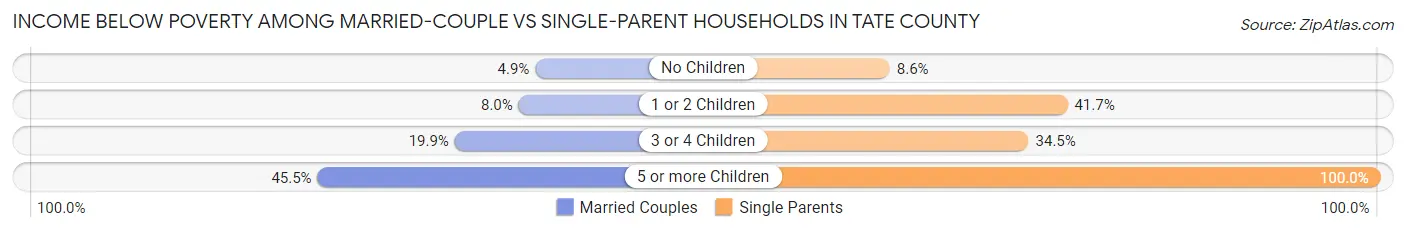
| Children | Married-Couple Families | Single-Parent Households |
| No Children | 137 (4.9%) | 83 (8.6%) |
| 1 or 2 Children | 149 (8.0%) | 399 (41.7%) |
| 3 or 4 Children | 149 (19.9%) | 103 (34.4%) |
| 5 or more Children | 20 (45.5%) | 77 (100.0%) |
| Total | 455 (8.3%) | 662 (28.8%) |
Race in Tate County
The most populous races in Tate County are White / Caucasian (18,805 | 66.9%), Black / African American (8,556 | 30.4%), and Hispanic or Latino (946 | 3.4%).
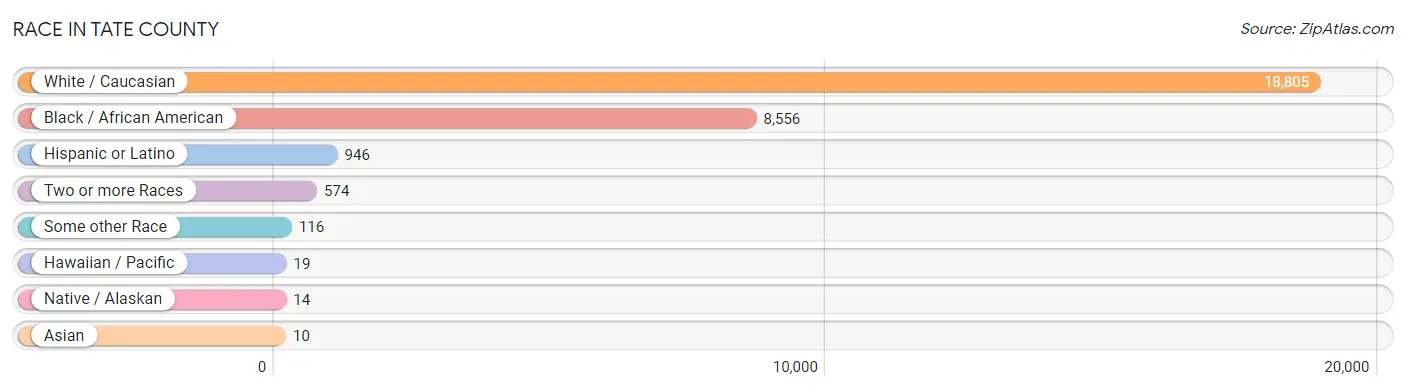
| Race | # Population | % Population |
| Asian | 10 | 0.0% |
| Black / African American | 8,556 | 30.4% |
| Hawaiian / Pacific | 19 | 0.1% |
| Hispanic or Latino | 946 | 3.4% |
| Native / Alaskan | 14 | 0.1% |
| White / Caucasian | 18,805 | 66.9% |
| Two or more Races | 574 | 2.0% |
| Some other Race | 116 | 0.4% |
| Total | 28,094 | 100.0% |
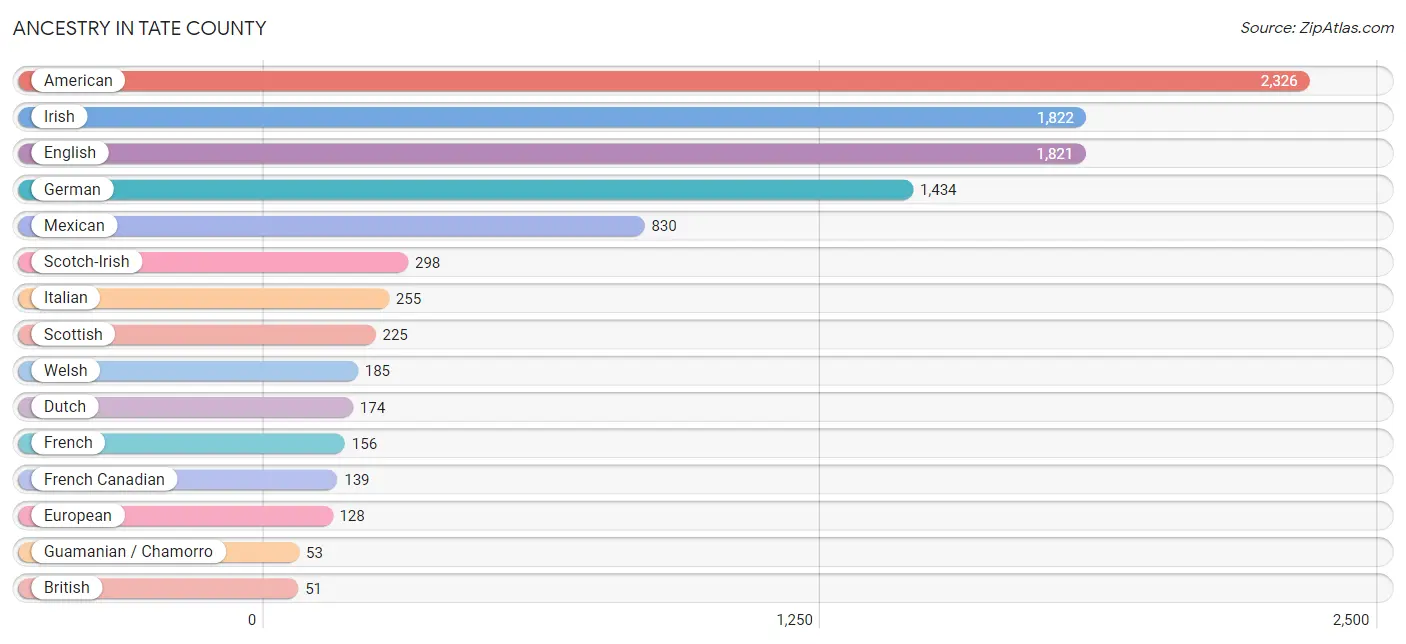
Ancestry in Tate County
The most populous ancestries reported in Tate County are American (2,326 | 8.3%), Irish (1,822 | 6.5%), English (1,821 | 6.5%), German (1,434 | 5.1%), and Mexican (830 | 2.9%), together accounting for 29.3% of all Tate County residents.
| Ancestry | # Population | % Population |
| American | 2,326 | 8.3% |
| Armenian | 8 | 0.0% |
| Bahamian | 12 | 0.0% |
| British | 51 | 0.2% |
| Canadian | 7 | 0.0% |
| Central American | 26 | 0.1% |
| Cherokee | 39 | 0.1% |
| Choctaw | 9 | 0.0% |
| Cuban | 7 | 0.0% |
| Dutch | 174 | 0.6% |
| Eastern European | 40 | 0.1% |
| English | 1,821 | 6.5% |
| European | 128 | 0.5% |
| French | 156 | 0.6% |
| French Canadian | 139 | 0.5% |
| German | 1,434 | 5.1% |
| Greek | 12 | 0.0% |
| Guamanian / Chamorro | 53 | 0.2% |
| Honduran | 21 | 0.1% |
| Hungarian | 12 | 0.0% |
| Indian (Asian) | 8 | 0.0% |
| Irish | 1,822 | 6.5% |
| Italian | 255 | 0.9% |
| Korean | 5 | 0.0% |
| Mexican | 830 | 2.9% |
| Native Hawaiian | 5 | 0.0% |
| Nigerian | 31 | 0.1% |
| Polish | 40 | 0.1% |
| Puerto Rican | 29 | 0.1% |
| Russian | 11 | 0.0% |
| Salvadoran | 5 | 0.0% |
| Scandinavian | 8 | 0.0% |
| Scotch-Irish | 298 | 1.1% |
| Scottish | 225 | 0.8% |
| Spanish | 40 | 0.1% |
| Subsaharan African | 31 | 0.1% |
| Swedish | 17 | 0.1% |
| Welsh | 185 | 0.7% | View All 38 Rows |
Immigrants in Tate County
The most numerous immigrant groups reported in Tate County came from Latin America (300 | 1.1%), Central America (286 | 1.0%), Mexico (265 | 0.9%), Africa (31 | 0.1%), and Nigeria (31 | 0.1%), together accounting for 3.2% of all Tate County residents.
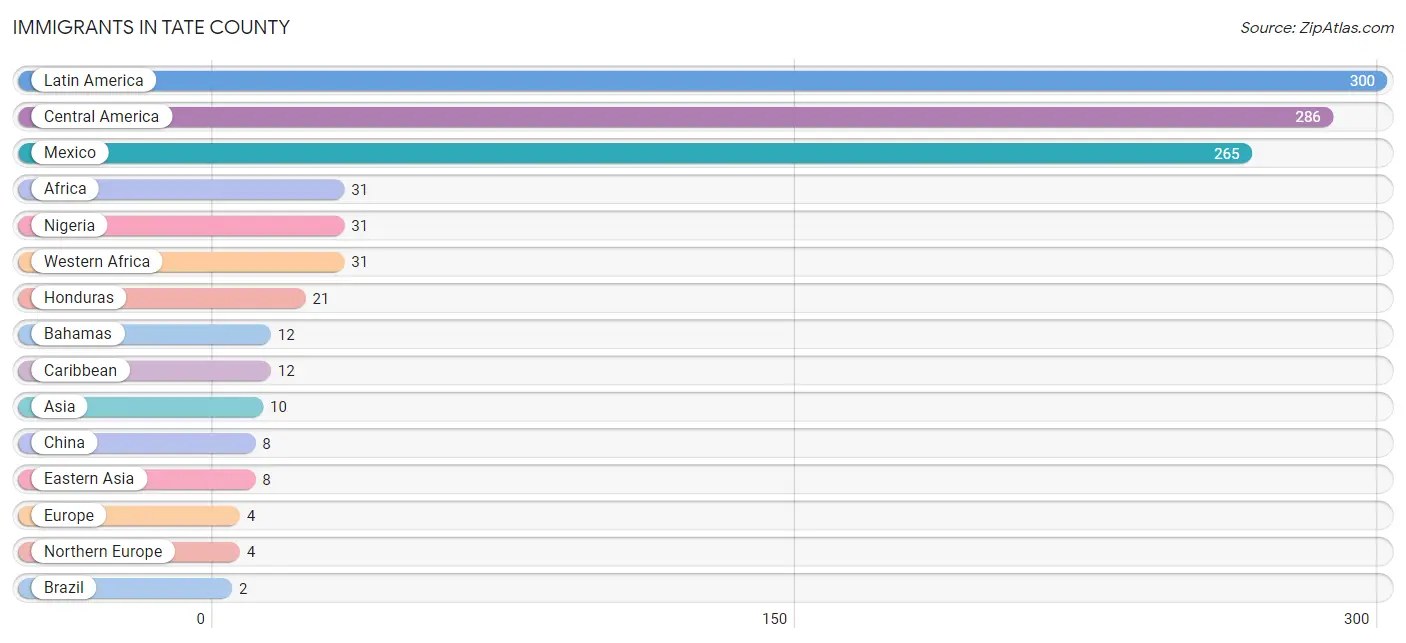
| Immigration Origin | # Population | % Population |
| Africa | 31 | 0.1% |
| Asia | 10 | 0.0% |
| Bahamas | 12 | 0.0% |
| Brazil | 2 | 0.0% |
| Caribbean | 12 | 0.0% |
| Central America | 286 | 1.0% |
| China | 8 | 0.0% |
| Eastern Asia | 8 | 0.0% |
| Europe | 4 | 0.0% |
| Honduras | 21 | 0.1% |
| Latin America | 300 | 1.1% |
| Mexico | 265 | 0.9% |
| Nigeria | 31 | 0.1% |
| Northern Europe | 4 | 0.0% |
| Philippines | 2 | 0.0% |
| South America | 2 | 0.0% |
| South Eastern Asia | 2 | 0.0% |
| Western Africa | 31 | 0.1% | View All 18 Rows |
Sex and Age in Tate County
Sex and Age in Tate County
The most populous age groups in Tate County are 15 to 19 Years (1,628 | 12.0%) for men and 15 to 19 Years (1,429 | 9.9%) for women.
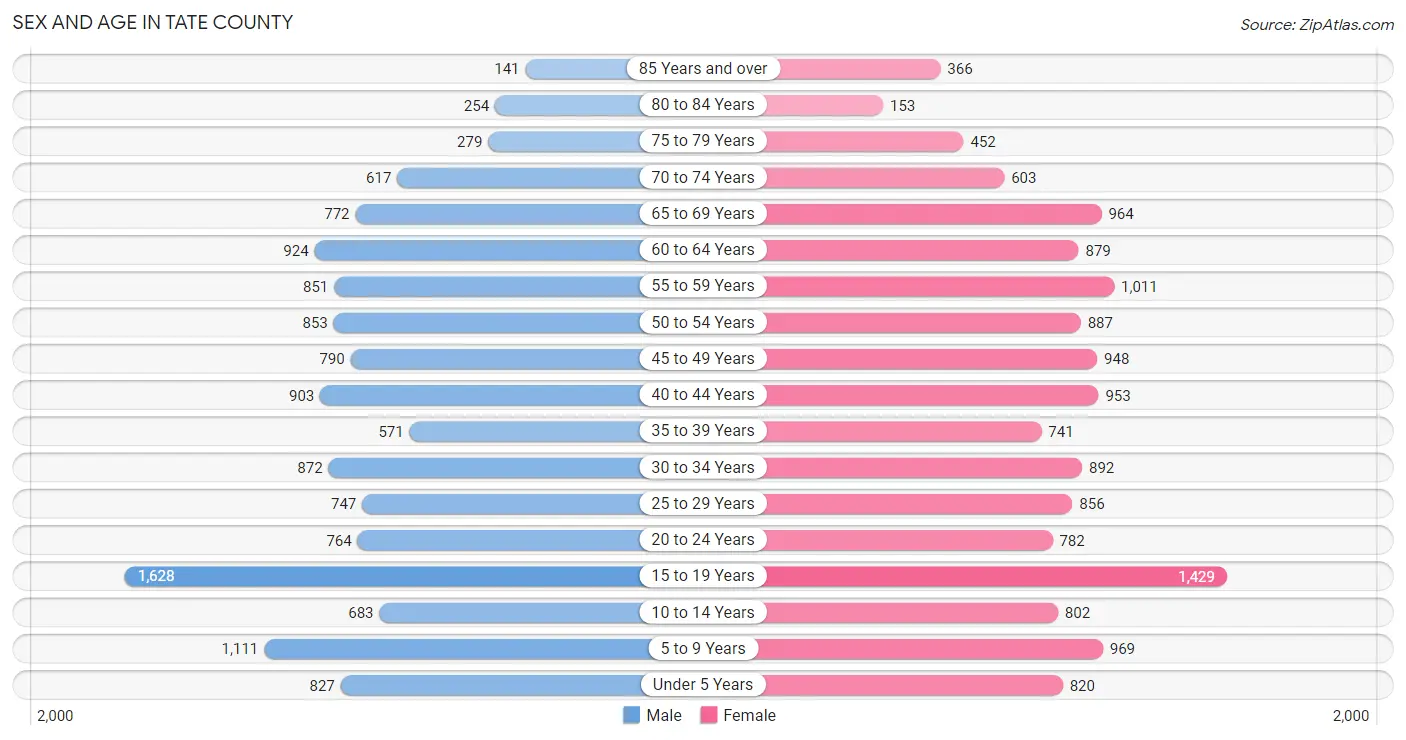
| Age Bracket | Male | Female |
| Under 5 Years | 827 (6.1%) | 820 (5.7%) |
| 5 to 9 Years | 1,111 (8.2%) | 969 (6.7%) |
| 10 to 14 Years | 683 (5.0%) | 802 (5.5%) |
| 15 to 19 Years | 1,628 (12.0%) | 1,429 (9.9%) |
| 20 to 24 Years | 764 (5.6%) | 782 (5.4%) |
| 25 to 29 Years | 747 (5.5%) | 856 (5.9%) |
| 30 to 34 Years | 872 (6.4%) | 892 (6.1%) |
| 35 to 39 Years | 571 (4.2%) | 741 (5.1%) |
| 40 to 44 Years | 903 (6.7%) | 953 (6.6%) |
| 45 to 49 Years | 790 (5.8%) | 948 (6.5%) |
| 50 to 54 Years | 853 (6.3%) | 887 (6.1%) |
| 55 to 59 Years | 851 (6.3%) | 1,011 (7.0%) |
| 60 to 64 Years | 924 (6.8%) | 879 (6.1%) |
| 65 to 69 Years | 772 (5.7%) | 964 (6.7%) |
| 70 to 74 Years | 617 (4.5%) | 603 (4.2%) |
| 75 to 79 Years | 279 (2.1%) | 452 (3.1%) |
| 80 to 84 Years | 254 (1.9%) | 153 (1.1%) |
| 85 Years and over | 141 (1.0%) | 366 (2.5%) |
| Total | 13,587 (100.0%) | 14,507 (100.0%) |
Families and Households in Tate County
Median Family Size in Tate County
The median family size in Tate County is 2.90 persons per family, with married-couple families (5,459 | 70.4%) accounting for the largest median family size of 3.02 persons per family. On the other hand, single male/father families (429 | 5.5%) represent the smallest median family size with 2.31 persons per family.
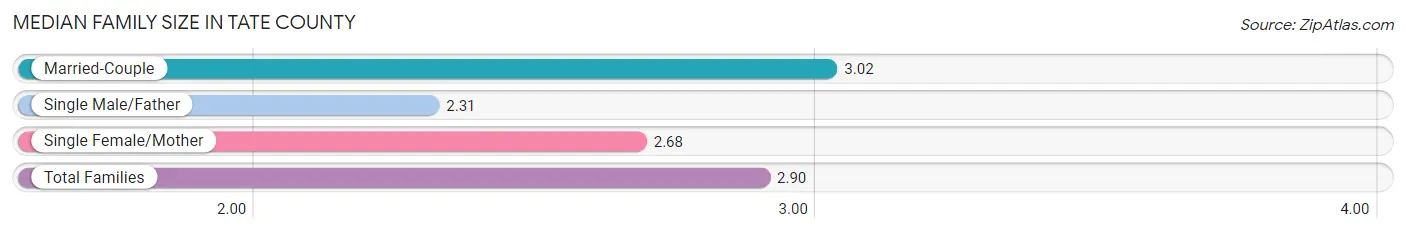
| Family Type | # Families | Family Size |
| Married-Couple | 5,459 (70.4%) | 3.02 |
| Single Male/Father | 429 (5.5%) | 2.31 |
| Single Female/Mother | 1,869 (24.1%) | 2.68 |
| Total Families | 7,757 (100.0%) | 2.90 |
Median Household Size in Tate County
The median household size in Tate County is 2.50 persons per household, with married-couple households (5,459 | 52.0%) accounting for the largest median household size of 3.02 persons per household. non-family households (2,739 | 26.1%) represent the smallest median household size with 1.18 persons per household.
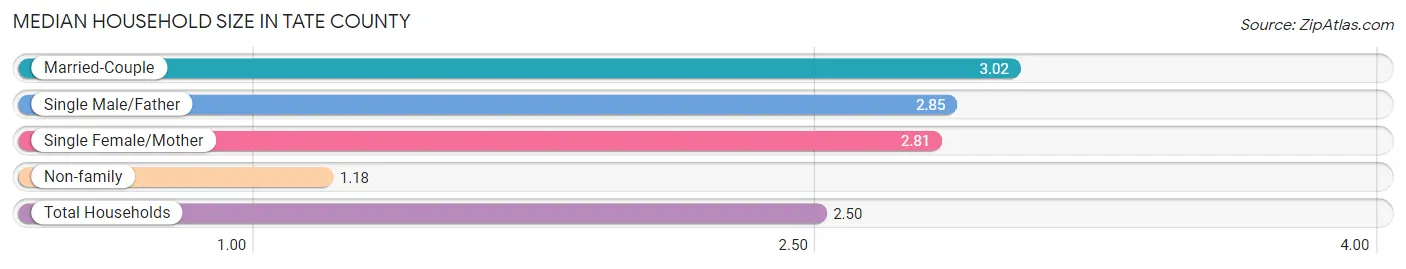
| Household Type | # Households | Household Size |
| Married-Couple | 5,459 (52.0%) | 3.02 |
| Single Male/Father | 429 (4.1%) | 2.85 |
| Single Female/Mother | 1,869 (17.8%) | 2.81 |
| Non-family | 2,739 (26.1%) | 1.18 |
| Total Households | 10,496 (100.0%) | 2.50 |
Household Size by Marriage Status in Tate County
Out of a total of 10,496 households in Tate County, 7,757 (73.9%) are family households, while 2,739 (26.1%) are nonfamily households. The most numerous type of family households are 2-person households, comprising 3,270, and the most common type of nonfamily households are 1-person households, comprising 2,306.
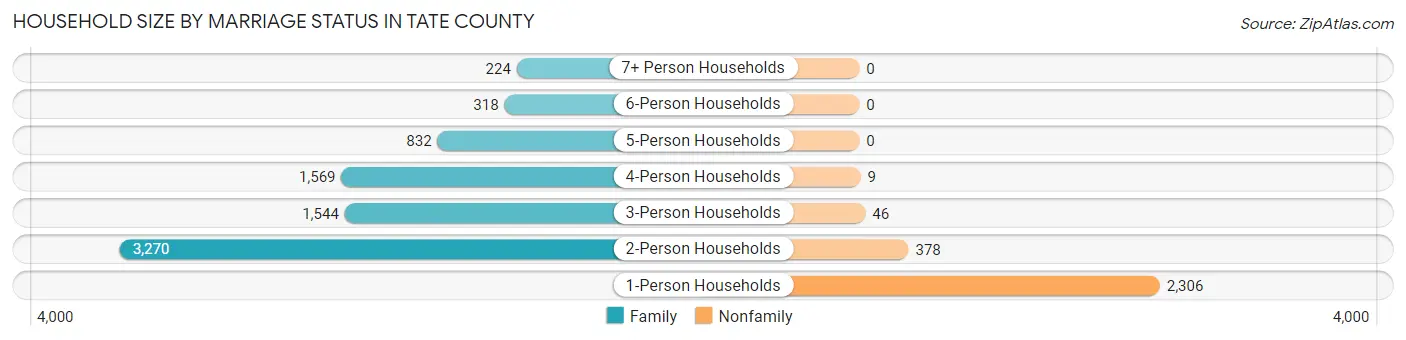
| Household Size | Family Households | Nonfamily Households |
| 1-Person Households | - | 2,306 (22.0%) |
| 2-Person Households | 3,270 (31.1%) | 378 (3.6%) |
| 3-Person Households | 1,544 (14.7%) | 46 (0.4%) |
| 4-Person Households | 1,569 (14.9%) | 9 (0.1%) |
| 5-Person Households | 832 (7.9%) | 0 (0.0%) |
| 6-Person Households | 318 (3.0%) | 0 (0.0%) |
| 7+ Person Households | 224 (2.1%) | 0 (0.0%) |
| Total | 7,757 (73.9%) | 2,739 (26.1%) |
Female Fertility in Tate County
Fertility by Age in Tate County
Average fertility rate in Tate County is 48.0 births per 1,000 women. Women in the age bracket of 20 to 34 years have the highest fertility rate with 111.0 births per 1,000 women. Women in the age bracket of 20 to 34 years acount for 86.2% of all women with births.
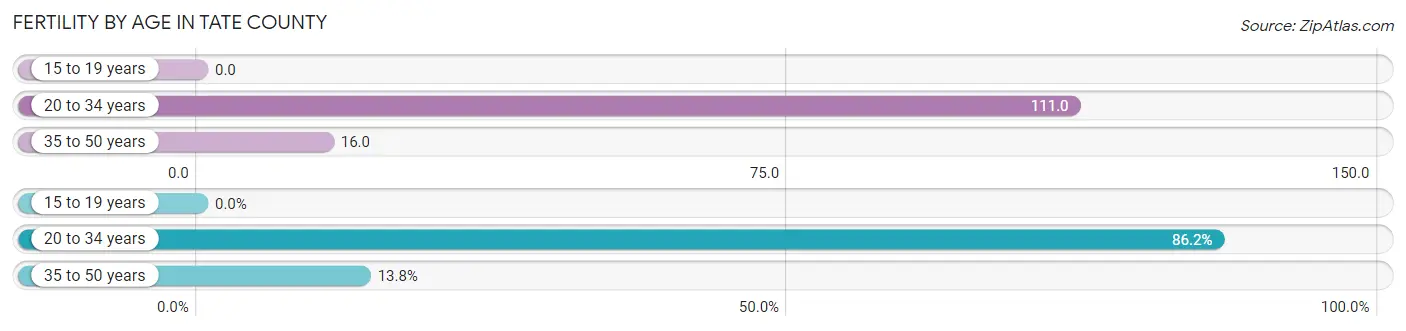
| Age Bracket | Women with Births | Births / 1,000 Women |
| 15 to 19 years | 0 (0.0%) | 0.0 |
| 20 to 34 years | 281 (86.2%) | 111.0 |
| 35 to 50 years | 45 (13.8%) | 16.0 |
| Total | 326 (100.0%) | 48.0 |
Fertility by Age by Marriage Status in Tate County
55.5% of women with births (326) in Tate County are married. The highest percentage of unmarried women with births falls into 20 to 34 years age bracket with 51.6% of them unmarried at the time of birth, while the lowest percentage of unmarried women with births belong to 35 to 50 years age bracket with 0.0% of them unmarried.
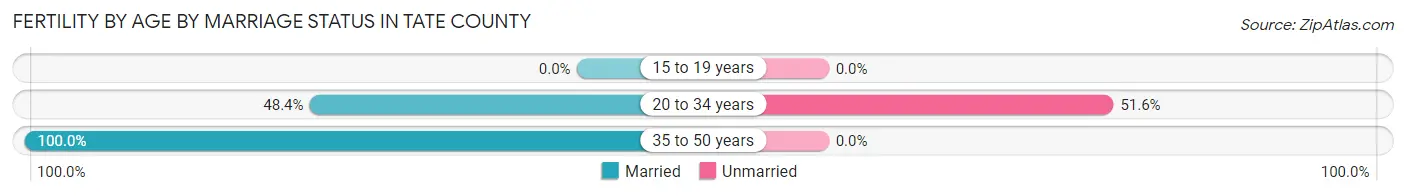
| Age Bracket | Married | Unmarried |
| 15 to 19 years | 0 (0.0%) | 0 (0.0%) |
| 20 to 34 years | 136 (48.4%) | 145 (51.6%) |
| 35 to 50 years | 45 (100.0%) | 0 (0.0%) |
| Total | 181 (55.5%) | 145 (44.5%) |
Fertility by Education in Tate County
Average fertility rate in Tate County is 48.0 births per 1,000 women. Women with the education attainment of high school diploma have the highest fertility rate of 80.0 births per 1,000 women, while women with the education attainment of less than high school have the lowest fertility at 28.0 births per 1,000 women. Women with the education attainment of high school diploma represent 41.1% of all women with births.
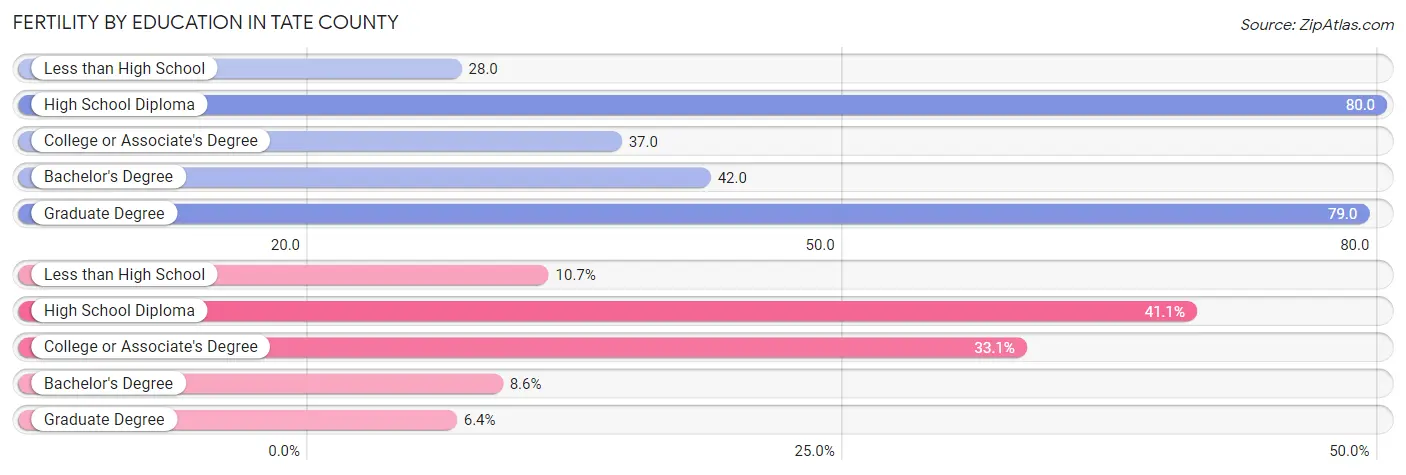
| Educational Attainment | Women with Births | Births / 1,000 Women |
| Less than High School | 35 (10.7%) | 28.0 |
| High School Diploma | 134 (41.1%) | 80.0 |
| College or Associate's Degree | 108 (33.1%) | 37.0 |
| Bachelor's Degree | 28 (8.6%) | 42.0 |
| Graduate Degree | 21 (6.4%) | 79.0 |
| Total | 326 (100.0%) | 48.0 |
Fertility by Education by Marriage Status in Tate County
44.5% of women with births in Tate County are unmarried. Women with the educational attainment of less than high school are most likely to be married with 100.0% of them married at childbirth, while women with the educational attainment of college or associate's degree are least likely to be married with 91.7% of them unmarried at childbirth.
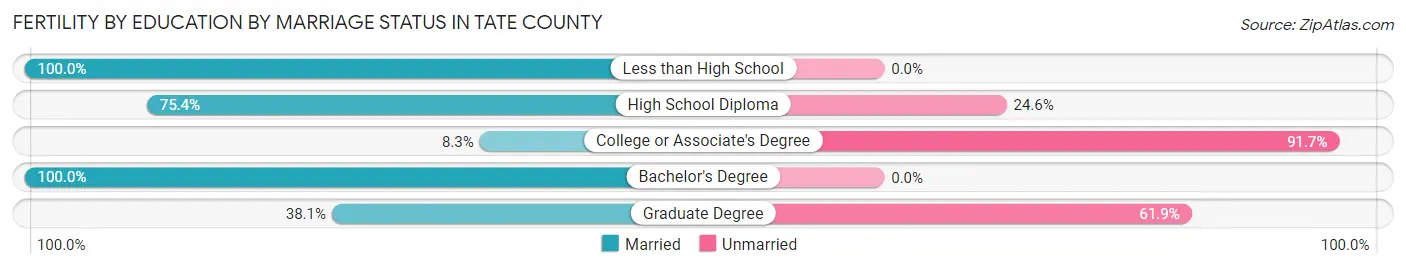
| Educational Attainment | Married | Unmarried |
| Less than High School | 35 (100.0%) | 0 (0.0%) |
| High School Diploma | 101 (75.4%) | 33 (24.6%) |
| College or Associate's Degree | 9 (8.3%) | 99 (91.7%) |
| Bachelor's Degree | 28 (100.0%) | 0 (0.0%) |
| Graduate Degree | 8 (38.1%) | 13 (61.9%) |
| Total | 181 (55.5%) | 145 (44.5%) |
Employment Characteristics in Tate County
Employment by Class of Employer in Tate County
Among the 11,725 employed individuals in Tate County, private company employees (8,339 | 71.1%), local government employees (832 | 7.1%), and not-for-profit organizations (659 | 5.6%) make up the most common classes of employment.
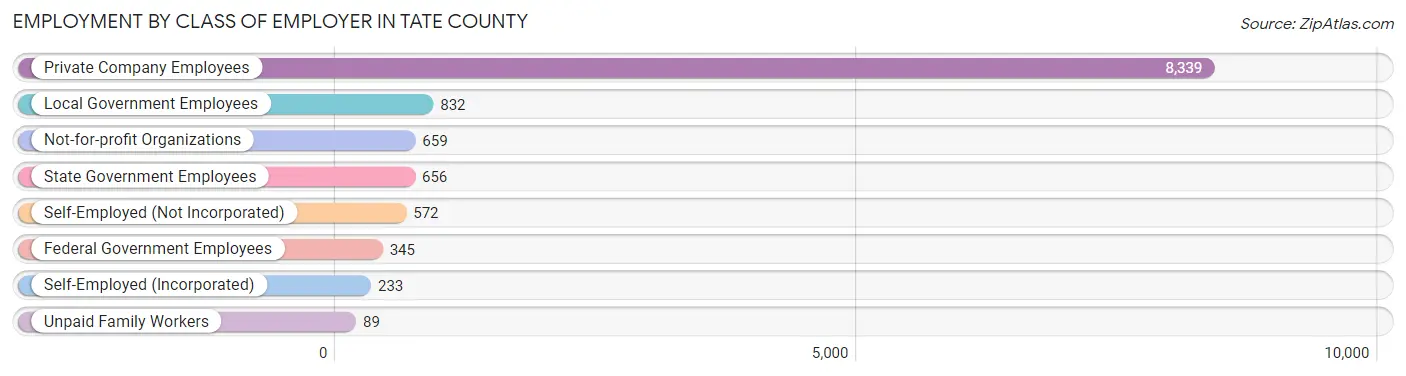
| Employer Class | # Employees | % Employees |
| Private Company Employees | 8,339 | 71.1% |
| Self-Employed (Incorporated) | 233 | 2.0% |
| Self-Employed (Not Incorporated) | 572 | 4.9% |
| Not-for-profit Organizations | 659 | 5.6% |
| Local Government Employees | 832 | 7.1% |
| State Government Employees | 656 | 5.6% |
| Federal Government Employees | 345 | 2.9% |
| Unpaid Family Workers | 89 | 0.8% |
| Total | 11,725 | 100.0% |
Employment Status by Age in Tate County
According to the labor force statistics for Tate County, out of the total population over 16 years of age (22,445), 57.4% or 12,883 individuals are in the labor force, with 7.2% or 928 of them unemployed. The age group with the highest labor force participation rate is 25 to 29 years, with 82.1% or 1,316 individuals in the labor force. Within the labor force, the 30 to 34 years age range has the highest percentage of unemployed individuals, with 15.0% or 217 of them being unemployed.
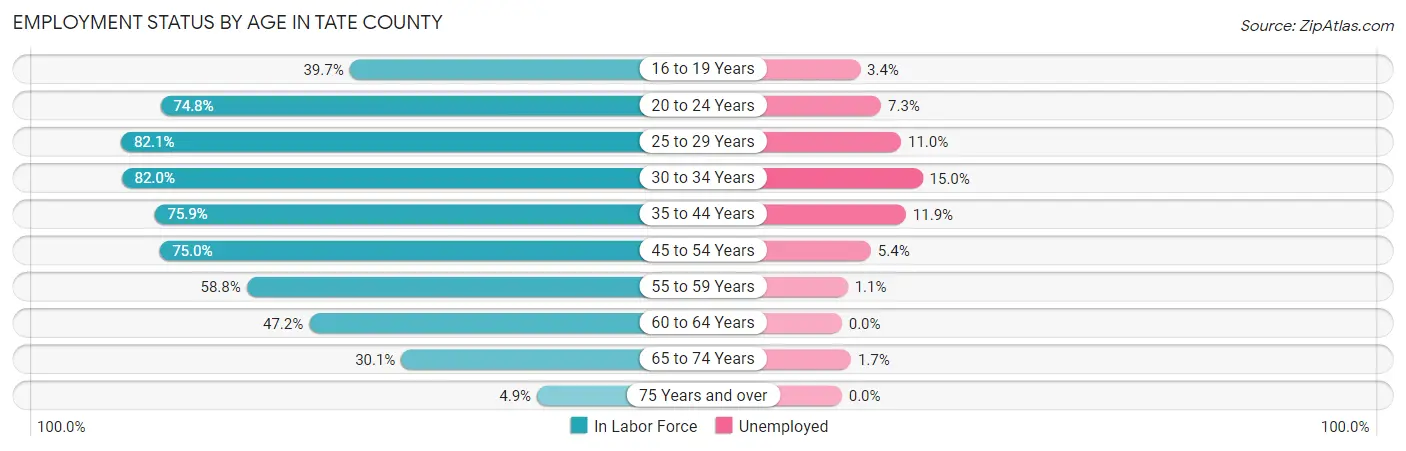
| Age Bracket | In Labor Force | Unemployed |
| 16 to 19 Years | 1,040 (39.7%) | 35 (3.4%) |
| 20 to 24 Years | 1,156 (74.8%) | 84 (7.3%) |
| 25 to 29 Years | 1,316 (82.1%) | 145 (11.0%) |
| 30 to 34 Years | 1,446 (82.0%) | 217 (15.0%) |
| 35 to 44 Years | 2,405 (75.9%) | 286 (11.9%) |
| 45 to 54 Years | 2,608 (75.0%) | 141 (5.4%) |
| 55 to 59 Years | 1,095 (58.8%) | 12 (1.1%) |
| 60 to 64 Years | 851 (47.2%) | 0 (0.0%) |
| 65 to 74 Years | 890 (30.1%) | 15 (1.7%) |
| 75 Years and over | 81 (4.9%) | 0 (0.0%) |
| Total | 12,883 (57.4%) | 928 (7.2%) |
Employment Status by Educational Attainment in Tate County
According to labor force statistics for Tate County, 71.1% of individuals (9,725) out of the total population between 25 and 64 years of age (13,678) are in the labor force, with 8.2% or 797 of them being unemployed. The group with the highest labor force participation rate are those with the educational attainment of bachelor's degree or higher, with 85.1% or 2,128 individuals in the labor force. Within the labor force, individuals with less than high school education have the highest percentage of unemployment, with 22.6% or 243 of them being unemployed.
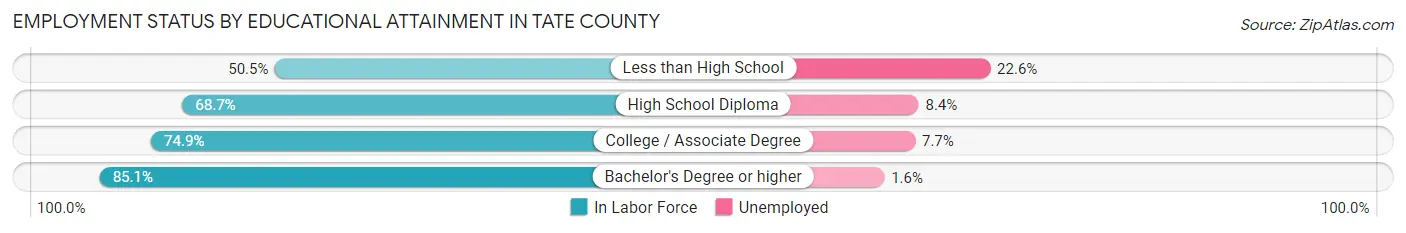
| Educational Attainment | In Labor Force | Unemployed |
| Less than High School | 1,077 (50.5%) | 482 (22.6%) |
| High School Diploma | 2,872 (68.7%) | 351 (8.4%) |
| College / Associate Degree | 3,644 (74.9%) | 375 (7.7%) |
| Bachelor's Degree or higher | 2,128 (85.1%) | 40 (1.6%) |
| Total | 9,725 (71.1%) | 1,122 (8.2%) |
Employment Occupations by Sex in Tate County
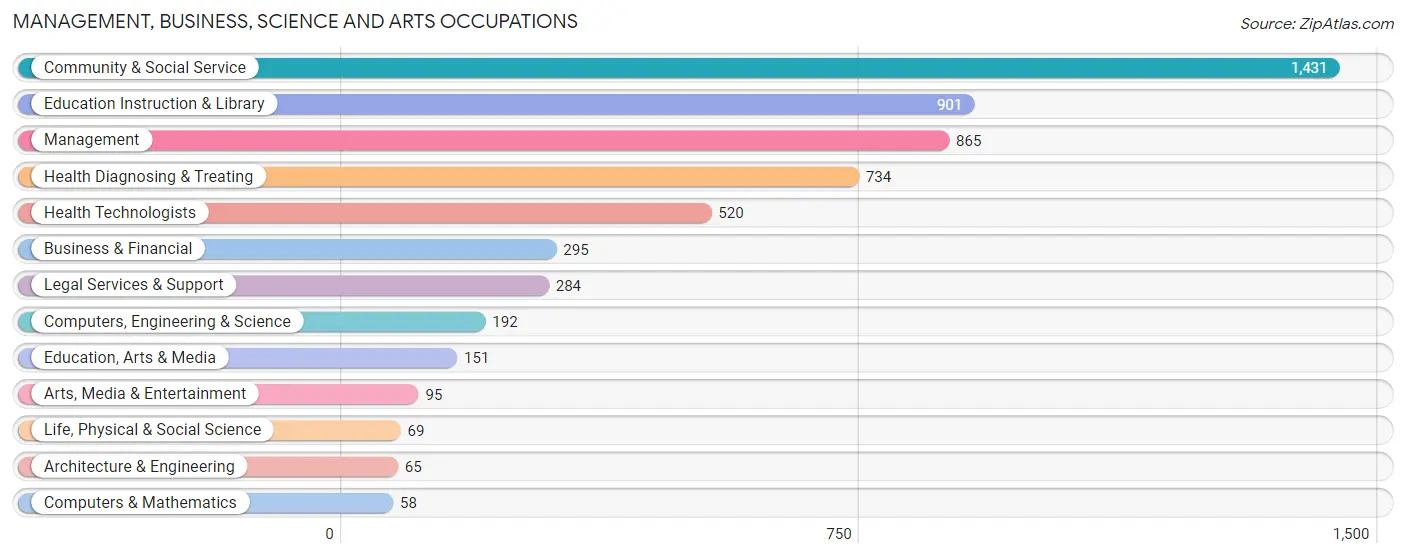
Management, Business, Science and Arts Occupations
The most common Management, Business, Science and Arts occupations in Tate County are Community & Social Service (1,431 | 12.0%), Education Instruction & Library (901 | 7.5%), Management (865 | 7.2%), Health Diagnosing & Treating (734 | 6.1%), and Health Technologists (520 | 4.3%).
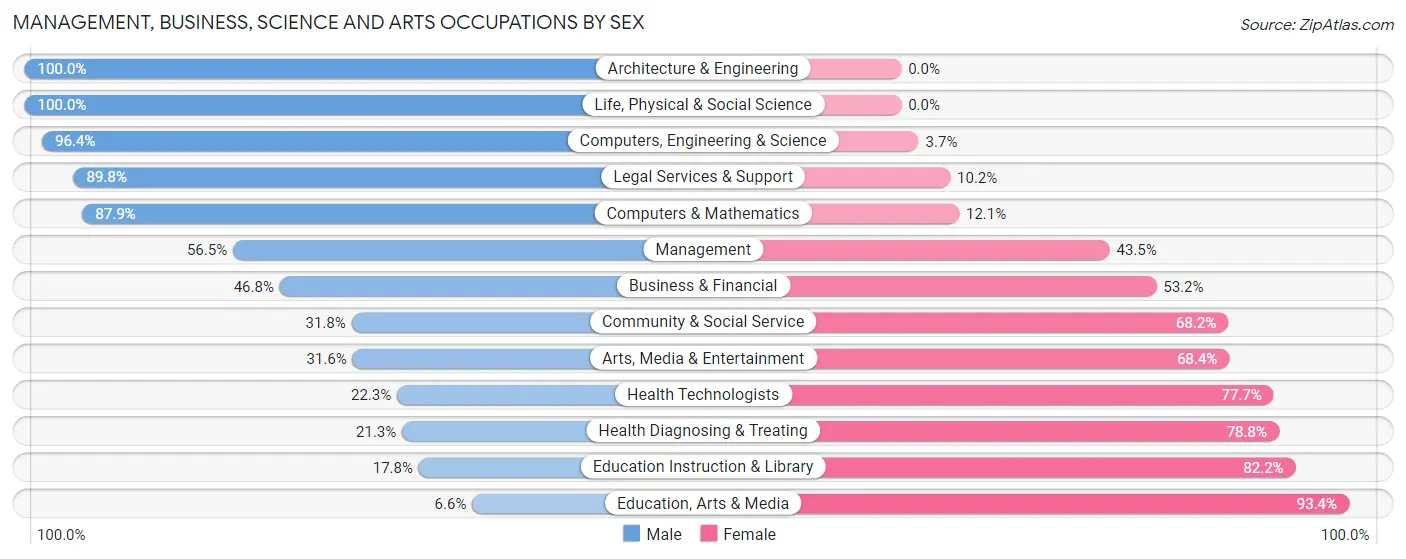
Management, Business, Science and Arts Occupations by Sex
Within the Management, Business, Science and Arts occupations in Tate County, the most male-oriented occupations are Architecture & Engineering (100.0%), Life, Physical & Social Science (100.0%), and Computers, Engineering & Science (96.4%), while the most female-oriented occupations are Education, Arts & Media (93.4%), Education Instruction & Library (82.2%), and Health Diagnosing & Treating (78.7%).
| Occupation | Male | Female |
| Management | 489 (56.5%) | 376 (43.5%) |
| Business & Financial | 138 (46.8%) | 157 (53.2%) |
| Computers, Engineering & Science | 185 (96.4%) | 7 (3.6%) |
| Computers & Mathematics | 51 (87.9%) | 7 (12.1%) |
| Architecture & Engineering | 65 (100.0%) | 0 (0.0%) |
| Life, Physical & Social Science | 69 (100.0%) | 0 (0.0%) |
| Community & Social Service | 455 (31.8%) | 976 (68.2%) |
| Education, Arts & Media | 10 (6.6%) | 141 (93.4%) |
| Legal Services & Support | 255 (89.8%) | 29 (10.2%) |
| Education Instruction & Library | 160 (17.8%) | 741 (82.2%) |
| Arts, Media & Entertainment | 30 (31.6%) | 65 (68.4%) |
| Health Diagnosing & Treating | 156 (21.2%) | 578 (78.7%) |
| Health Technologists | 116 (22.3%) | 404 (77.7%) |
| Total (Category) | 1,423 (40.5%) | 2,094 (59.5%) |
| Total (Overall) | 6,263 (52.4%) | 5,690 (47.6%) |
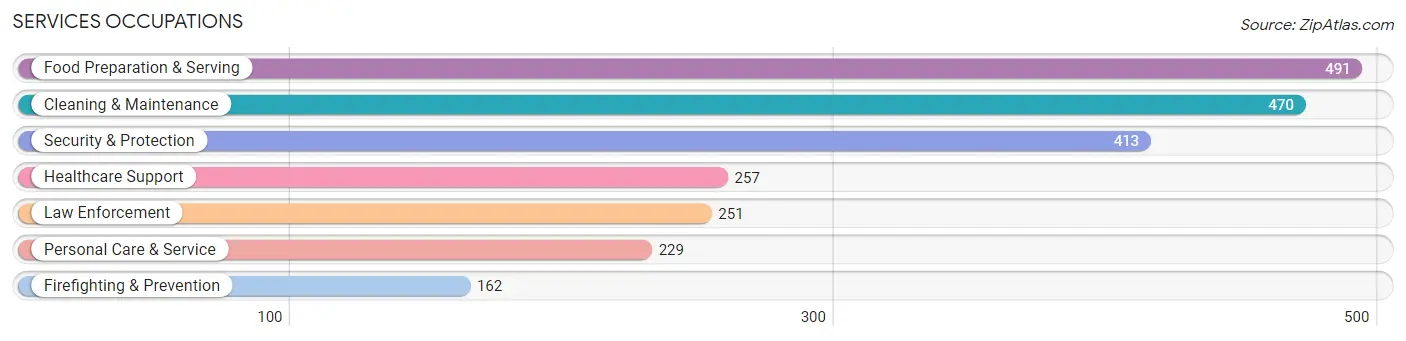
Services Occupations
The most common Services occupations in Tate County are Food Preparation & Serving (491 | 4.1%), Cleaning & Maintenance (470 | 3.9%), Security & Protection (413 | 3.5%), Healthcare Support (257 | 2.1%), and Law Enforcement (251 | 2.1%).
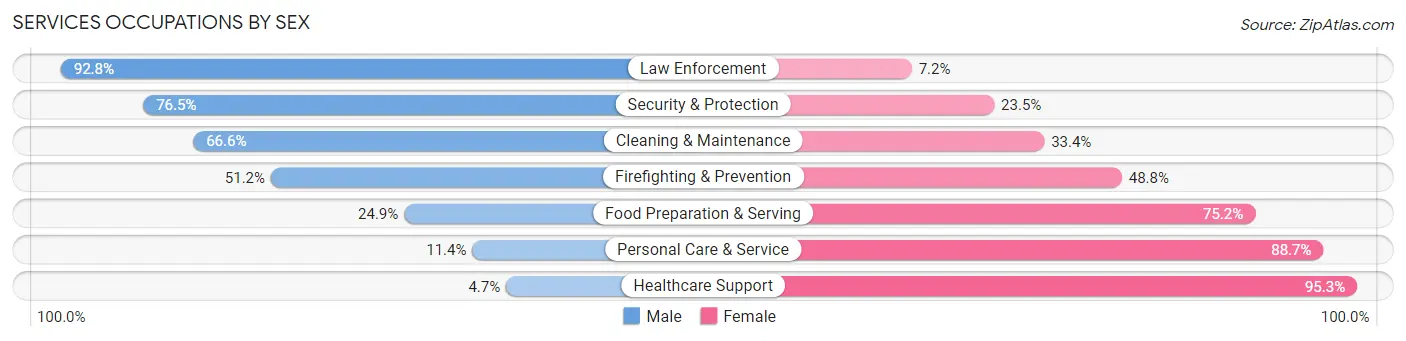
Services Occupations by Sex
Within the Services occupations in Tate County, the most male-oriented occupations are Law Enforcement (92.8%), Security & Protection (76.5%), and Cleaning & Maintenance (66.6%), while the most female-oriented occupations are Healthcare Support (95.3%), Personal Care & Service (88.6%), and Food Preparation & Serving (75.1%).
| Occupation | Male | Female |
| Healthcare Support | 12 (4.7%) | 245 (95.3%) |
| Security & Protection | 316 (76.5%) | 97 (23.5%) |
| Firefighting & Prevention | 83 (51.2%) | 79 (48.8%) |
| Law Enforcement | 233 (92.8%) | 18 (7.2%) |
| Food Preparation & Serving | 122 (24.8%) | 369 (75.1%) |
| Cleaning & Maintenance | 313 (66.6%) | 157 (33.4%) |
| Personal Care & Service | 26 (11.4%) | 203 (88.6%) |
| Total (Category) | 789 (42.4%) | 1,071 (57.6%) |
| Total (Overall) | 6,263 (52.4%) | 5,690 (47.6%) |
Sales and Office Occupations
The most common Sales and Office occupations in Tate County are Office & Administration (1,584 | 13.3%), and Sales & Related (1,207 | 10.1%).
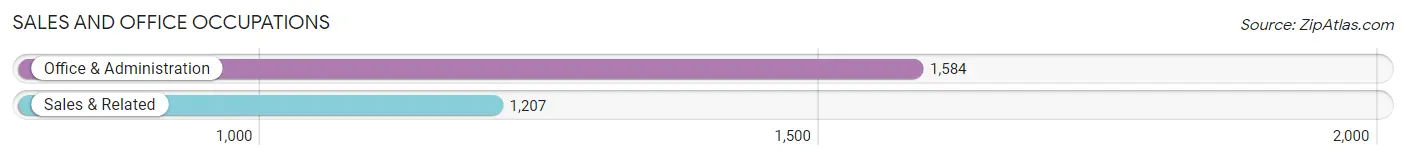
Sales and Office Occupations by Sex

| Occupation | Male | Female |
| Sales & Related | 527 (43.7%) | 680 (56.3%) |
| Office & Administration | 241 (15.2%) | 1,343 (84.8%) |
| Total (Category) | 768 (27.5%) | 2,023 (72.5%) |
| Total (Overall) | 6,263 (52.4%) | 5,690 (47.6%) |
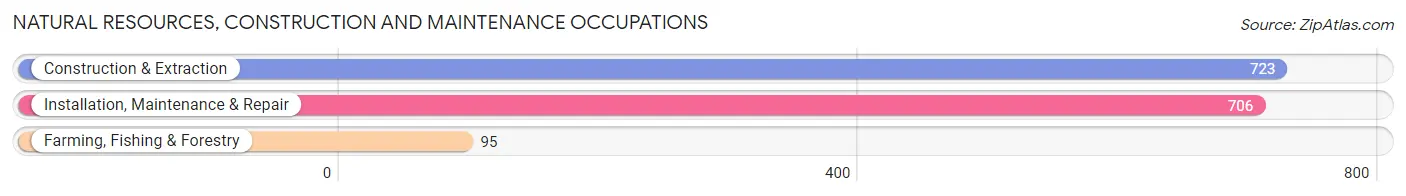
Natural Resources, Construction and Maintenance Occupations
The most common Natural Resources, Construction and Maintenance occupations in Tate County are Construction & Extraction (723 | 6.0%), Installation, Maintenance & Repair (706 | 5.9%), and Farming, Fishing & Forestry (95 | 0.8%).
Natural Resources, Construction and Maintenance Occupations by Sex
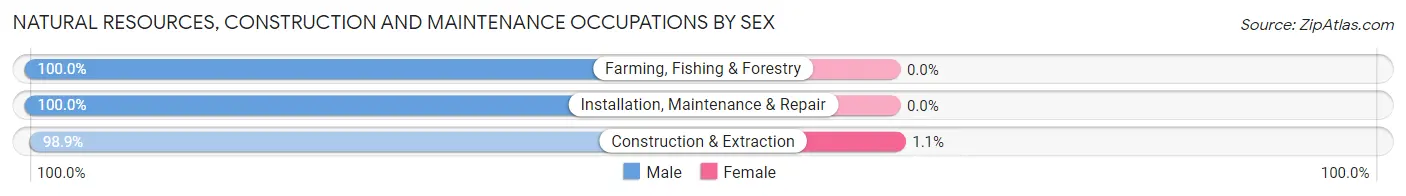
| Occupation | Male | Female |
| Farming, Fishing & Forestry | 95 (100.0%) | 0 (0.0%) |
| Construction & Extraction | 715 (98.9%) | 8 (1.1%) |
| Installation, Maintenance & Repair | 706 (100.0%) | 0 (0.0%) |
| Total (Category) | 1,516 (99.5%) | 8 (0.5%) |
| Total (Overall) | 6,263 (52.4%) | 5,690 (47.6%) |
Production, Transportation and Moving Occupations
The most common Production, Transportation and Moving occupations in Tate County are Transportation (901 | 7.5%), Production (813 | 6.8%), and Material Moving (547 | 4.6%).
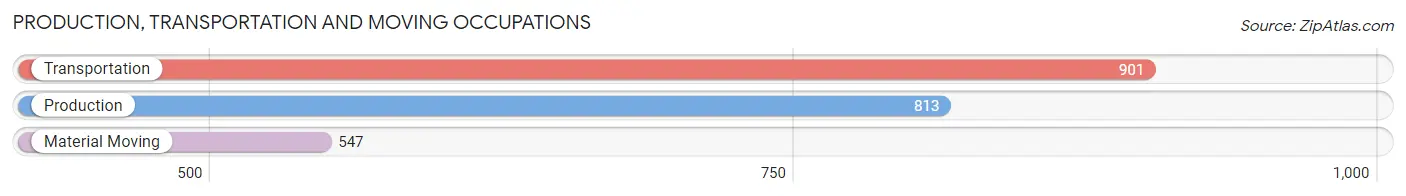
Production, Transportation and Moving Occupations by Sex
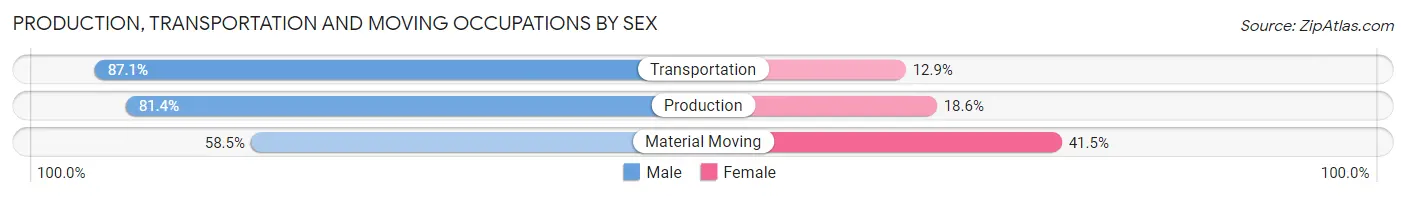
| Occupation | Male | Female |
| Production | 662 (81.4%) | 151 (18.6%) |
| Transportation | 785 (87.1%) | 116 (12.9%) |
| Material Moving | 320 (58.5%) | 227 (41.5%) |
| Total (Category) | 1,767 (78.1%) | 494 (21.8%) |
| Total (Overall) | 6,263 (52.4%) | 5,690 (47.6%) |
Employment Industries by Sex in Tate County
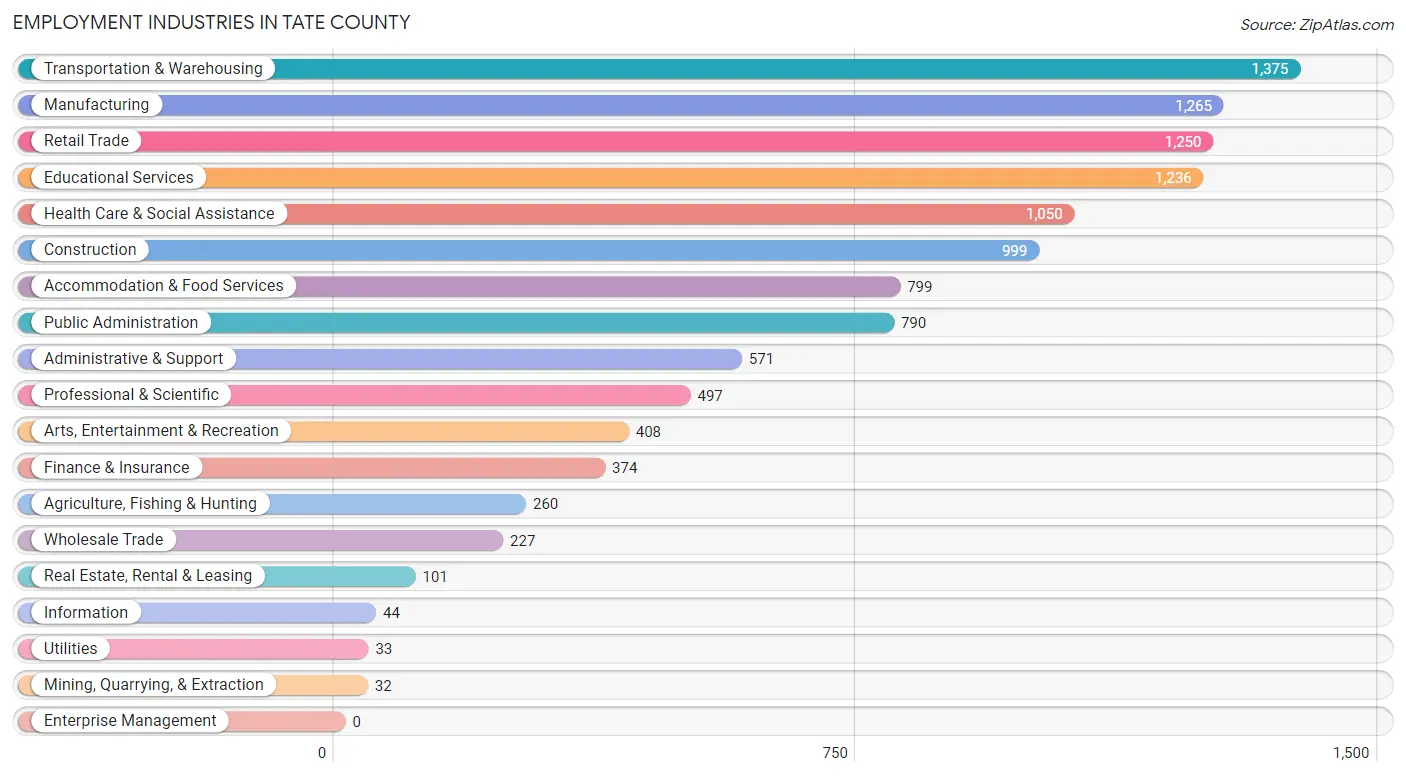
Employment Industries in Tate County
The major employment industries in Tate County include Transportation & Warehousing (1,375 | 11.5%), Manufacturing (1,265 | 10.6%), Retail Trade (1,250 | 10.5%), Educational Services (1,236 | 10.3%), and Health Care & Social Assistance (1,050 | 8.8%).
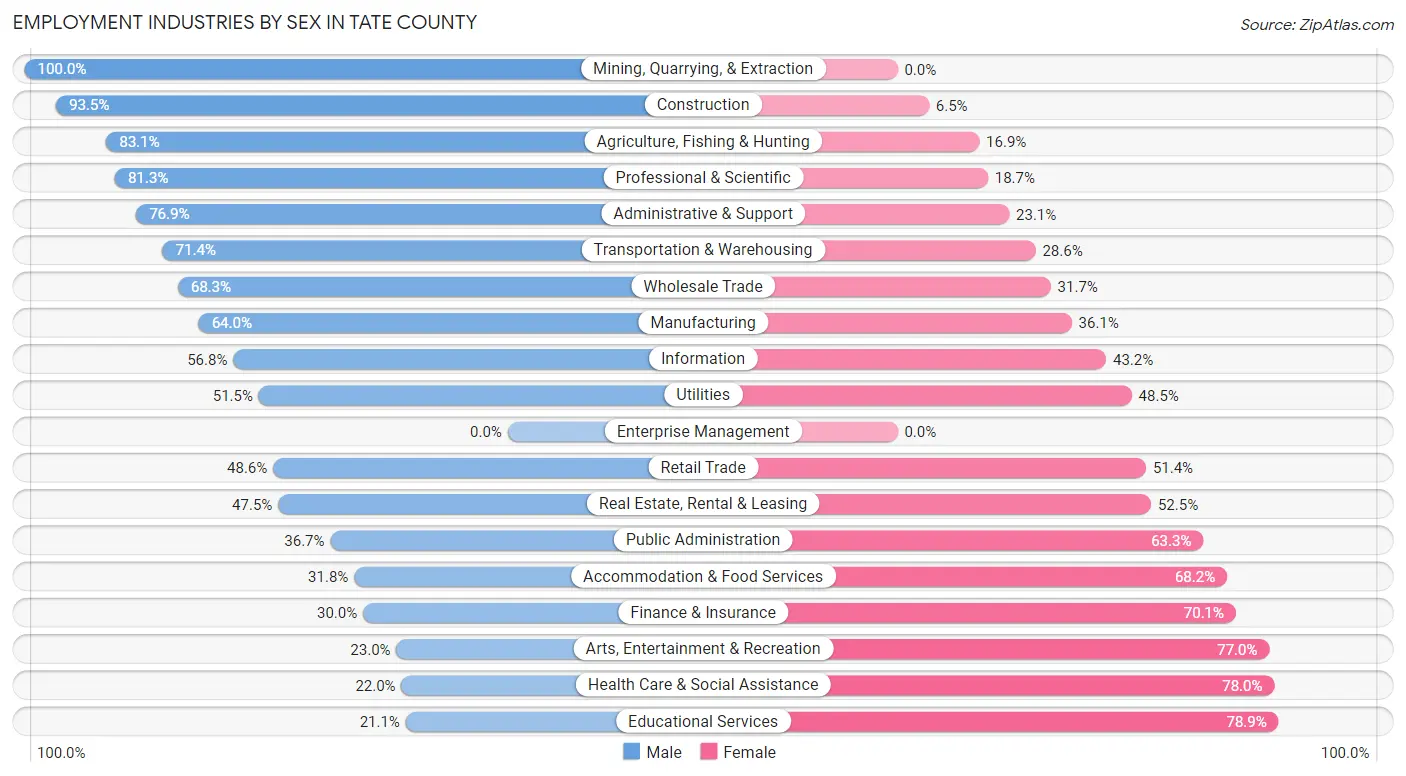
Employment Industries by Sex in Tate County
The Tate County industries that see more men than women are Mining, Quarrying, & Extraction (100.0%), Construction (93.5%), and Agriculture, Fishing & Hunting (83.1%), whereas the industries that tend to have a higher number of women are Educational Services (78.9%), Health Care & Social Assistance (78.0%), and Arts, Entertainment & Recreation (77.0%).
| Industry | Male | Female |
| Agriculture, Fishing & Hunting | 216 (83.1%) | 44 (16.9%) |
| Mining, Quarrying, & Extraction | 32 (100.0%) | 0 (0.0%) |
| Construction | 934 (93.5%) | 65 (6.5%) |
| Manufacturing | 809 (63.9%) | 456 (36.0%) |
| Wholesale Trade | 155 (68.3%) | 72 (31.7%) |
| Retail Trade | 607 (48.6%) | 643 (51.4%) |
| Transportation & Warehousing | 982 (71.4%) | 393 (28.6%) |
| Utilities | 17 (51.5%) | 16 (48.5%) |
| Information | 25 (56.8%) | 19 (43.2%) |
| Finance & Insurance | 112 (29.9%) | 262 (70.1%) |
| Real Estate, Rental & Leasing | 48 (47.5%) | 53 (52.5%) |
| Professional & Scientific | 404 (81.3%) | 93 (18.7%) |
| Enterprise Management | 0 (0.0%) | 0 (0.0%) |
| Administrative & Support | 439 (76.9%) | 132 (23.1%) |
| Educational Services | 261 (21.1%) | 975 (78.9%) |
| Health Care & Social Assistance | 231 (22.0%) | 819 (78.0%) |
| Arts, Entertainment & Recreation | 94 (23.0%) | 314 (77.0%) |
| Accommodation & Food Services | 254 (31.8%) | 545 (68.2%) |
| Public Administration | 290 (36.7%) | 500 (63.3%) |
| Total | 6,263 (52.4%) | 5,690 (47.6%) |
Education in Tate County
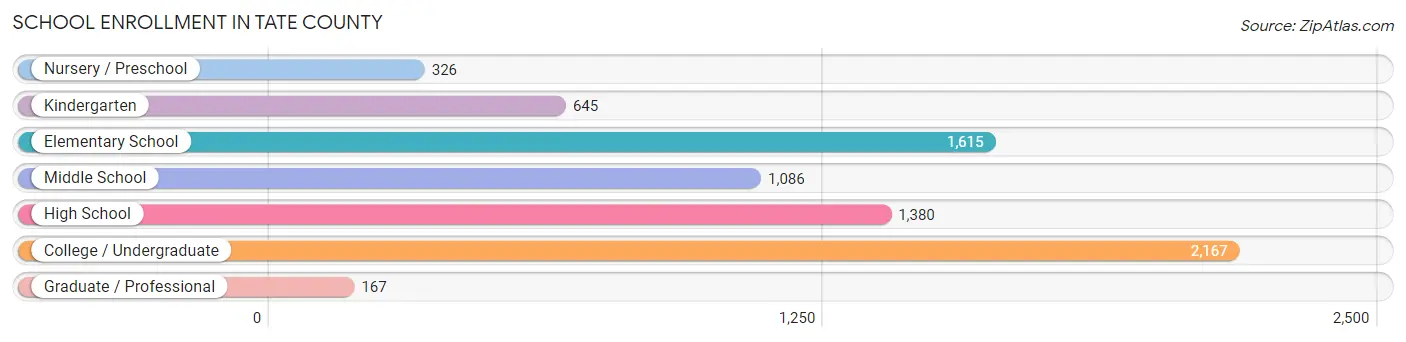
School Enrollment in Tate County
The most common levels of schooling among the 7,386 students in Tate County are college / undergraduate (2,167 | 29.3%), elementary school (1,615 | 21.9%), and high school (1,380 | 18.7%).
| School Level | # Students | % Students |
| Nursery / Preschool | 326 | 4.4% |
| Kindergarten | 645 | 8.7% |
| Elementary School | 1,615 | 21.9% |
| Middle School | 1,086 | 14.7% |
| High School | 1,380 | 18.7% |
| College / Undergraduate | 2,167 | 29.3% |
| Graduate / Professional | 167 | 2.3% |
| Total | 7,386 | 100.0% |
School Enrollment by Age by Funding Source in Tate County
Out of a total of 7,386 students who are enrolled in schools in Tate County, 879 (11.9%) attend a private institution, while the remaining 6,507 (88.1%) are enrolled in public schools. The age group of 35 years and over has the highest likelihood of being enrolled in private schools, with 61 (27.1% in the age bracket) enrolled. Conversely, the age group of 25 to 34 year olds has the lowest likelihood of being enrolled in a private school, with 183 (100.0% in the age bracket) attending a public institution.
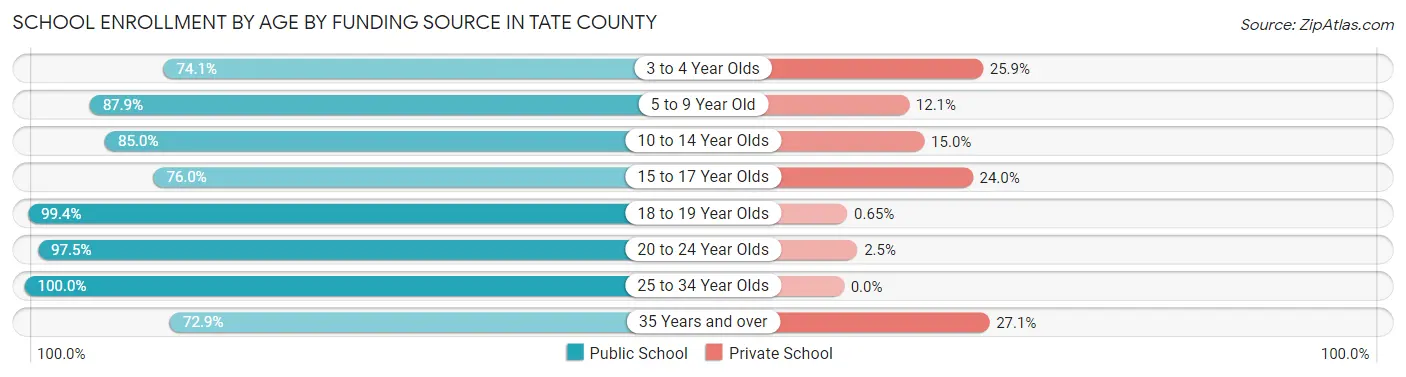
| Age Bracket | Public School | Private School |
| 3 to 4 Year Olds | 163 (74.1%) | 57 (25.9%) |
| 5 to 9 Year Old | 1,788 (87.9%) | 247 (12.1%) |
| 10 to 14 Year Olds | 1,242 (85.0%) | 219 (15.0%) |
| 15 to 17 Year Olds | 864 (76.0%) | 273 (24.0%) |
| 18 to 19 Year Olds | 1,678 (99.4%) | 11 (0.6%) |
| 20 to 24 Year Olds | 425 (97.5%) | 11 (2.5%) |
| 25 to 34 Year Olds | 183 (100.0%) | 0 (0.0%) |
| 35 Years and over | 164 (72.9%) | 61 (27.1%) |
| Total | 6,507 (88.1%) | 879 (11.9%) |
Educational Attainment by Field of Study in Tate County
Education (1,099 | 31.6%), business (736 | 21.2%), science & technology (476 | 13.7%), arts & humanities (227 | 6.5%), and bio, nature & agricultural (153 | 4.4%) are the most common fields of study among 3,478 individuals in Tate County who have obtained a bachelor's degree or higher.
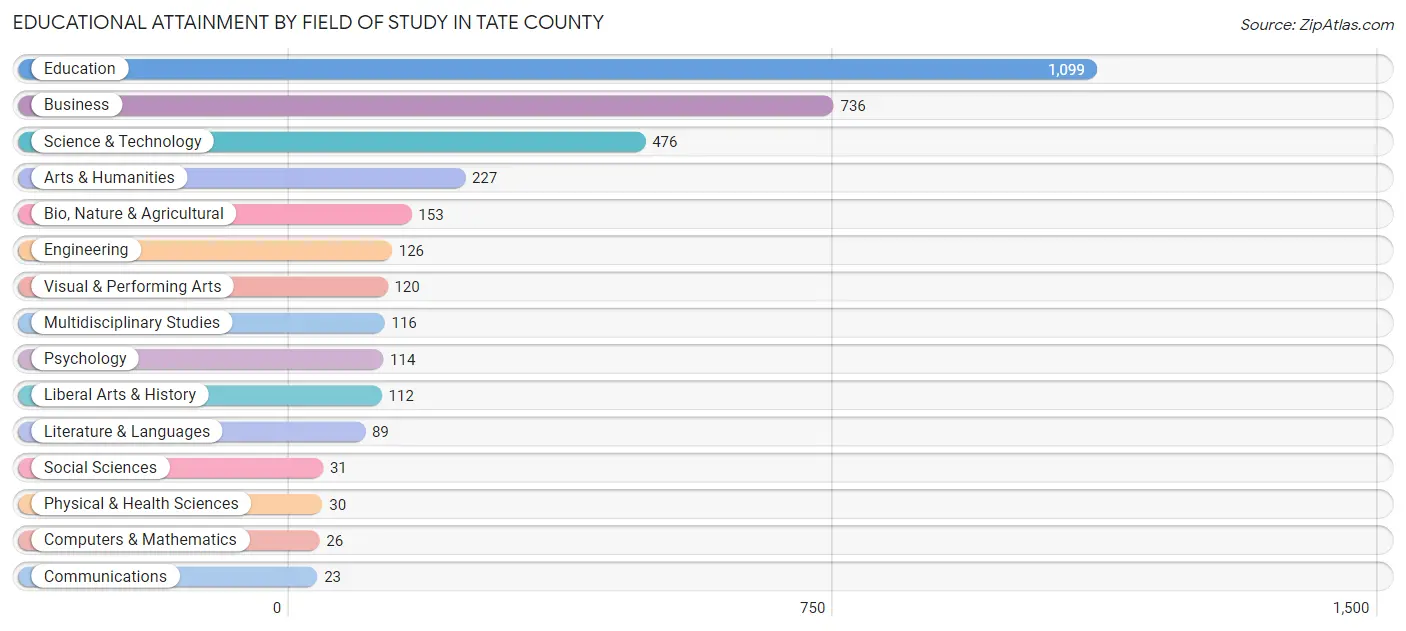
| Field of Study | # Graduates | % Graduates |
| Computers & Mathematics | 26 | 0.7% |
| Bio, Nature & Agricultural | 153 | 4.4% |
| Physical & Health Sciences | 30 | 0.9% |
| Psychology | 114 | 3.3% |
| Social Sciences | 31 | 0.9% |
| Engineering | 126 | 3.6% |
| Multidisciplinary Studies | 116 | 3.3% |
| Science & Technology | 476 | 13.7% |
| Business | 736 | 21.2% |
| Education | 1,099 | 31.6% |
| Literature & Languages | 89 | 2.6% |
| Liberal Arts & History | 112 | 3.2% |
| Visual & Performing Arts | 120 | 3.5% |
| Communications | 23 | 0.7% |
| Arts & Humanities | 227 | 6.5% |
| Total | 3,478 | 100.0% |
Transportation & Commute in Tate County
Vehicle Availability by Sex in Tate County
The most prevalent vehicle ownership categories in Tate County are males with 2 vehicles (2,391, accounting for 41.6%) and females with 2 vehicles (1,716, making up 45.6%).
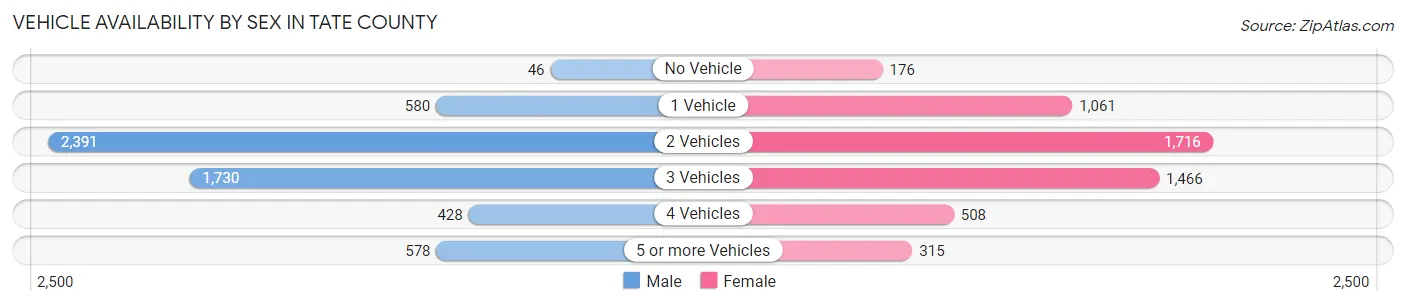
| Vehicles Available | Male | Female |
| No Vehicle | 46 (0.8%) | 176 (3.4%) |
| 1 Vehicle | 580 (10.1%) | 1,061 (20.2%) |
| 2 Vehicles | 2,391 (41.6%) | 1,716 (32.7%) |
| 3 Vehicles | 1,730 (30.1%) | 1,466 (28.0%) |
| 4 Vehicles | 428 (7.4%) | 508 (9.7%) |
| 5 or more Vehicles | 578 (10.1%) | 315 (6.0%) |
| Total | 5,753 (100.0%) | 5,242 (100.0%) |
Commute Time in Tate County
The most frequently occuring commute durations in Tate County are 45 to 59 minutes (2,509 commuters, 22.0%), 30 to 34 minutes (1,890 commuters, 16.6%), and 15 to 19 minutes (1,316 commuters, 11.5%).
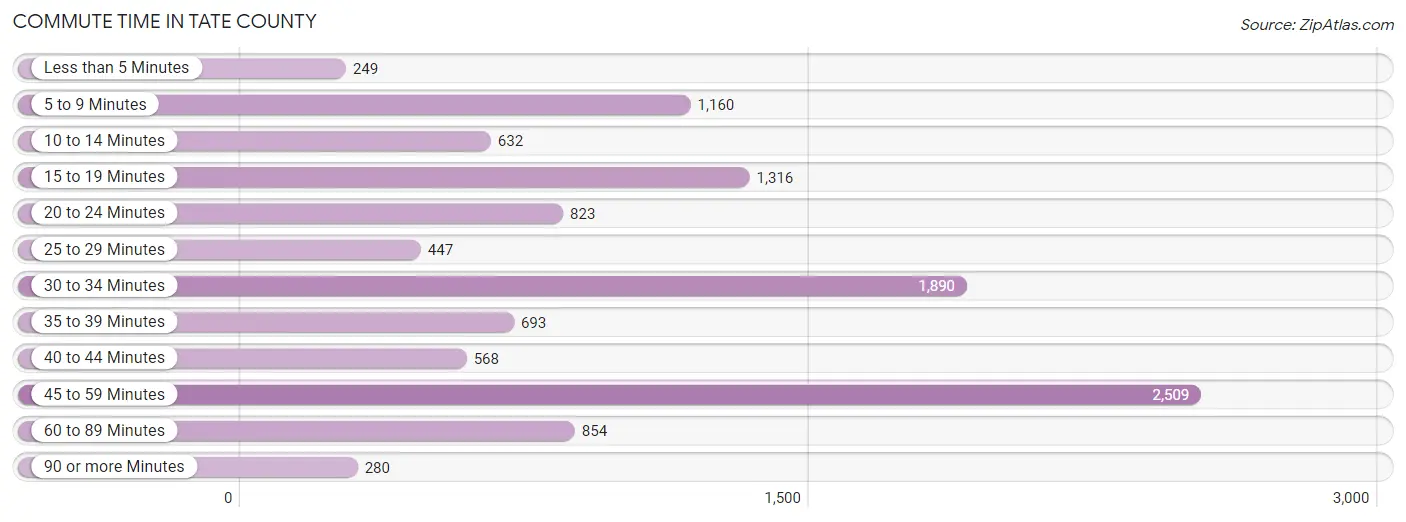
| Commute Time | # Commuters | % Commuters |
| Less than 5 Minutes | 249 | 2.2% |
| 5 to 9 Minutes | 1,160 | 10.2% |
| 10 to 14 Minutes | 632 | 5.5% |
| 15 to 19 Minutes | 1,316 | 11.5% |
| 20 to 24 Minutes | 823 | 7.2% |
| 25 to 29 Minutes | 447 | 3.9% |
| 30 to 34 Minutes | 1,890 | 16.6% |
| 35 to 39 Minutes | 693 | 6.1% |
| 40 to 44 Minutes | 568 | 5.0% |
| 45 to 59 Minutes | 2,509 | 22.0% |
| 60 to 89 Minutes | 854 | 7.5% |
| 90 or more Minutes | 280 | 2.5% |
Commute Time by Sex in Tate County
The most common commute times in Tate County are 45 to 59 minutes (1,462 commuters, 24.2%) for males and 45 to 59 minutes (1,047 commuters, 19.4%) for females.
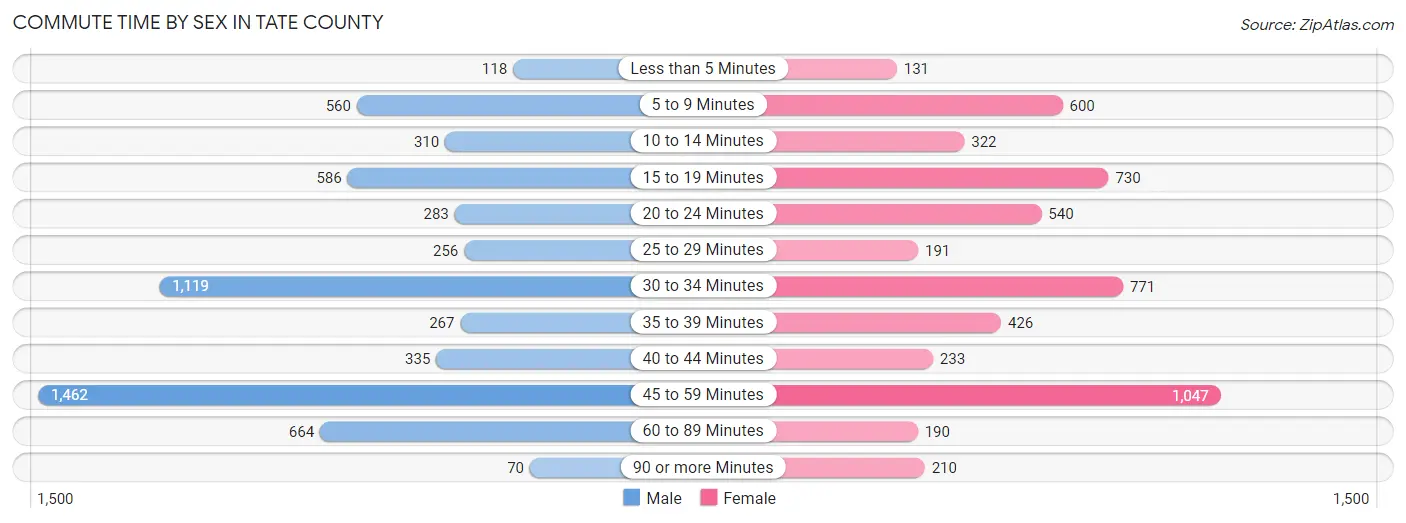
| Commute Time | Male | Female |
| Less than 5 Minutes | 118 (2.0%) | 131 (2.4%) |
| 5 to 9 Minutes | 560 (9.3%) | 600 (11.1%) |
| 10 to 14 Minutes | 310 (5.1%) | 322 (6.0%) |
| 15 to 19 Minutes | 586 (9.7%) | 730 (13.5%) |
| 20 to 24 Minutes | 283 (4.7%) | 540 (10.0%) |
| 25 to 29 Minutes | 256 (4.3%) | 191 (3.5%) |
| 30 to 34 Minutes | 1,119 (18.6%) | 771 (14.3%) |
| 35 to 39 Minutes | 267 (4.4%) | 426 (7.9%) |
| 40 to 44 Minutes | 335 (5.6%) | 233 (4.3%) |
| 45 to 59 Minutes | 1,462 (24.2%) | 1,047 (19.4%) |
| 60 to 89 Minutes | 664 (11.0%) | 190 (3.5%) |
| 90 or more Minutes | 70 (1.2%) | 210 (3.9%) |
Time of Departure to Work by Sex in Tate County
The most frequent times of departure to work in Tate County are 6:00 AM to 6:29 AM (884, 14.7%) for males and 7:00 AM to 7:29 AM (1,011, 18.8%) for females.
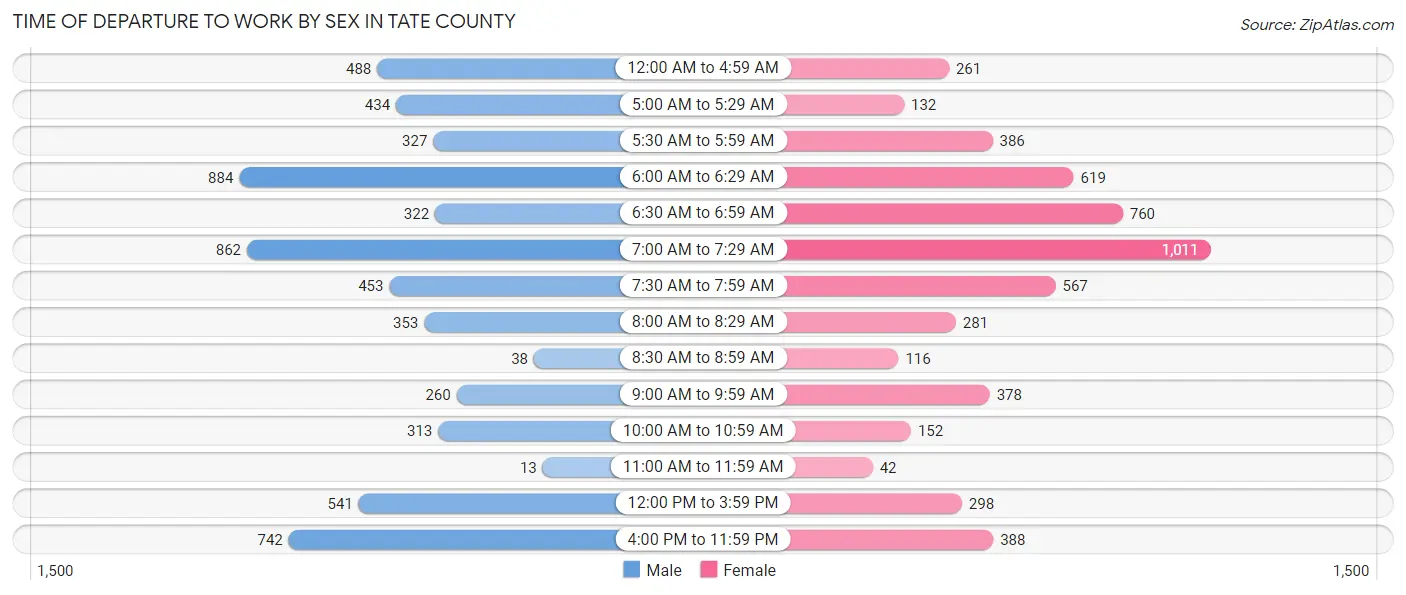
| Time of Departure | Male | Female |
| 12:00 AM to 4:59 AM | 488 (8.1%) | 261 (4.8%) |
| 5:00 AM to 5:29 AM | 434 (7.2%) | 132 (2.5%) |
| 5:30 AM to 5:59 AM | 327 (5.4%) | 386 (7.2%) |
| 6:00 AM to 6:29 AM | 884 (14.7%) | 619 (11.5%) |
| 6:30 AM to 6:59 AM | 322 (5.3%) | 760 (14.1%) |
| 7:00 AM to 7:29 AM | 862 (14.3%) | 1,011 (18.8%) |
| 7:30 AM to 7:59 AM | 453 (7.5%) | 567 (10.5%) |
| 8:00 AM to 8:29 AM | 353 (5.9%) | 281 (5.2%) |
| 8:30 AM to 8:59 AM | 38 (0.6%) | 116 (2.1%) |
| 9:00 AM to 9:59 AM | 260 (4.3%) | 378 (7.0%) |
| 10:00 AM to 10:59 AM | 313 (5.2%) | 152 (2.8%) |
| 11:00 AM to 11:59 AM | 13 (0.2%) | 42 (0.8%) |
| 12:00 PM to 3:59 PM | 541 (9.0%) | 298 (5.5%) |
| 4:00 PM to 11:59 PM | 742 (12.3%) | 388 (7.2%) |
| Total | 6,030 (100.0%) | 5,391 (100.0%) |
Housing Occupancy in Tate County
Occupancy by Ownership in Tate County
Of the total 10,496 dwellings in Tate County, owner-occupied units account for 7,735 (73.7%), while renter-occupied units make up 2,761 (26.3%).
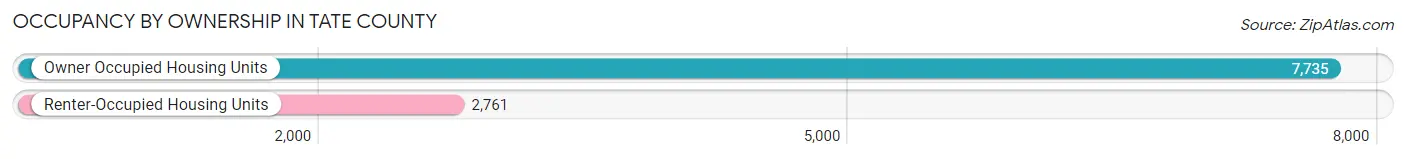
| Occupancy | # Housing Units | % Housing Units |
| Owner Occupied Housing Units | 7,735 | 73.7% |
| Renter-Occupied Housing Units | 2,761 | 26.3% |
| Total Occupied Housing Units | 10,496 | 100.0% |
Occupancy by Household Size in Tate County
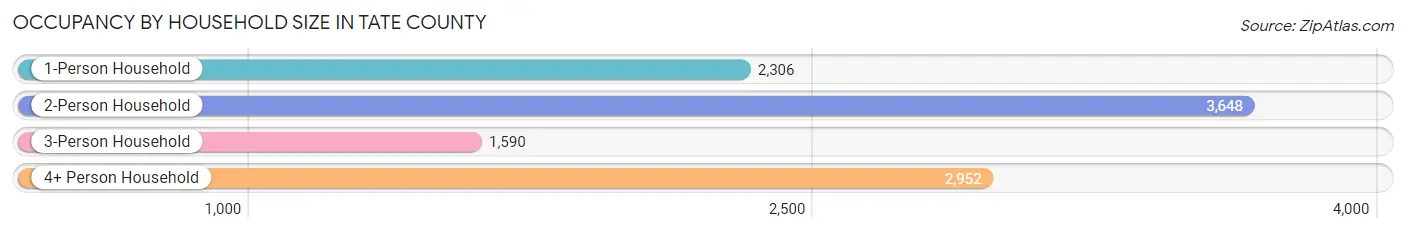
| Household Size | # Housing Units | % Housing Units |
| 1-Person Household | 2,306 | 22.0% |
| 2-Person Household | 3,648 | 34.8% |
| 3-Person Household | 1,590 | 15.1% |
| 4+ Person Household | 2,952 | 28.1% |
| Total Housing Units | 10,496 | 100.0% |
Occupancy by Ownership by Household Size in Tate County
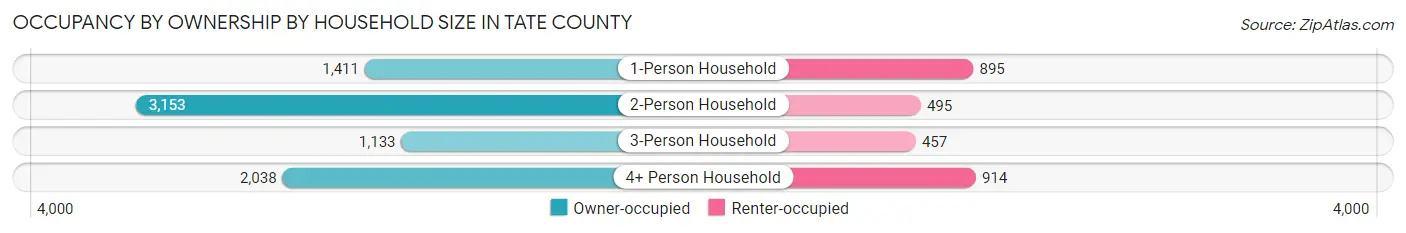
| Household Size | Owner-occupied | Renter-occupied |
| 1-Person Household | 1,411 (61.2%) | 895 (38.8%) |
| 2-Person Household | 3,153 (86.4%) | 495 (13.6%) |
| 3-Person Household | 1,133 (71.3%) | 457 (28.7%) |
| 4+ Person Household | 2,038 (69.0%) | 914 (31.0%) |
| Total Housing Units | 7,735 (73.7%) | 2,761 (26.3%) |
Occupancy by Educational Attainment in Tate County
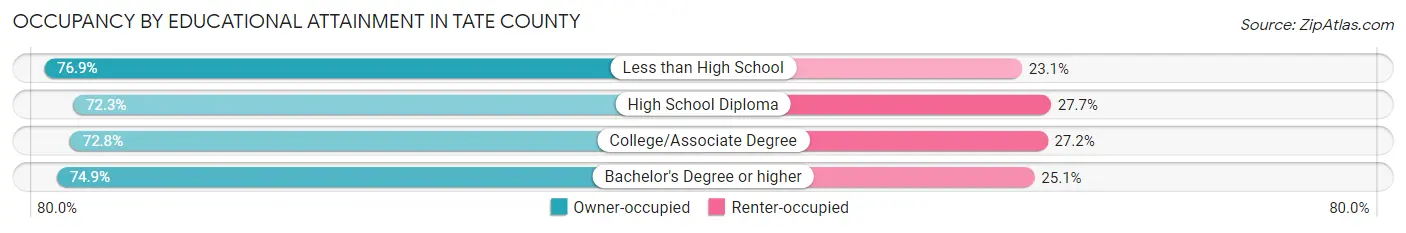
| Household Size | Owner-occupied | Renter-occupied |
| Less than High School | 1,361 (76.9%) | 409 (23.1%) |
| High School Diploma | 2,467 (72.3%) | 945 (27.7%) |
| College/Associate Degree | 2,570 (72.8%) | 959 (27.2%) |
| Bachelor's Degree or higher | 1,337 (74.9%) | 448 (25.1%) |
Occupancy by Age of Householder in Tate County
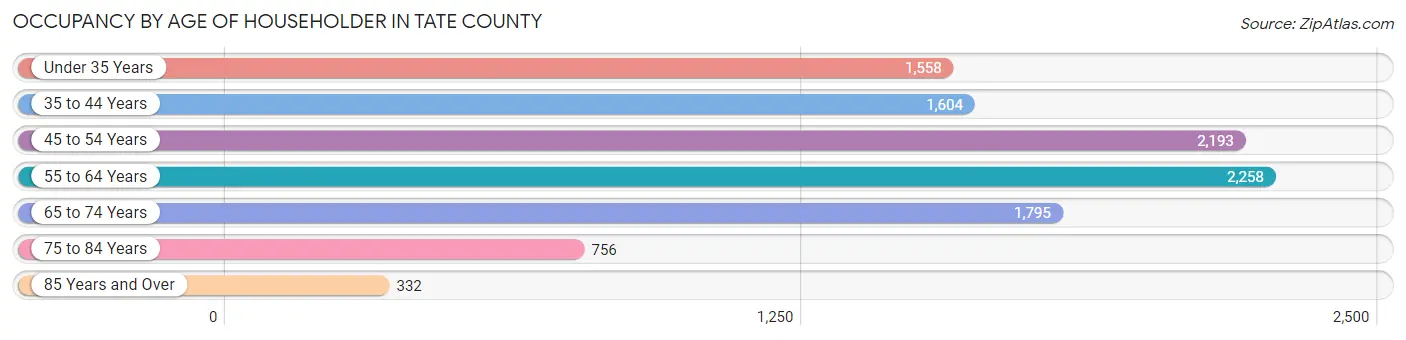
| Age Bracket | # Households | % Households |
| Under 35 Years | 1,558 | 14.8% |
| 35 to 44 Years | 1,604 | 15.3% |
| 45 to 54 Years | 2,193 | 20.9% |
| 55 to 64 Years | 2,258 | 21.5% |
| 65 to 74 Years | 1,795 | 17.1% |
| 75 to 84 Years | 756 | 7.2% |
| 85 Years and Over | 332 | 3.2% |
| Total | 10,496 | 100.0% |
Housing Finances in Tate County
Median Income by Occupancy in Tate County
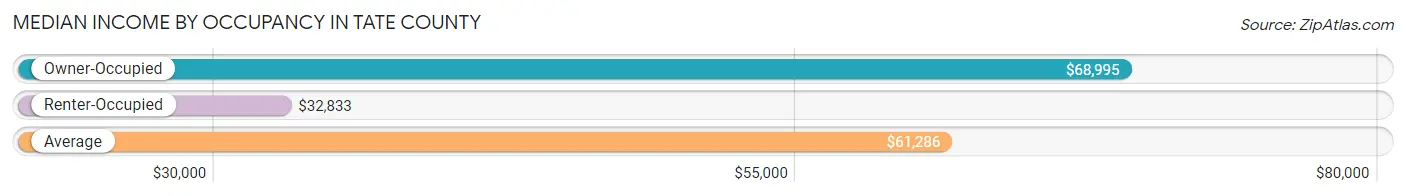
| Occupancy Type | # Households | Median Income |
| Owner-Occupied | 7,735 (73.7%) | $68,995 |
| Renter-Occupied | 2,761 (26.3%) | $32,833 |
| Average | 10,496 (100.0%) | $61,286 |
Occupancy by Householder Income Bracket in Tate County
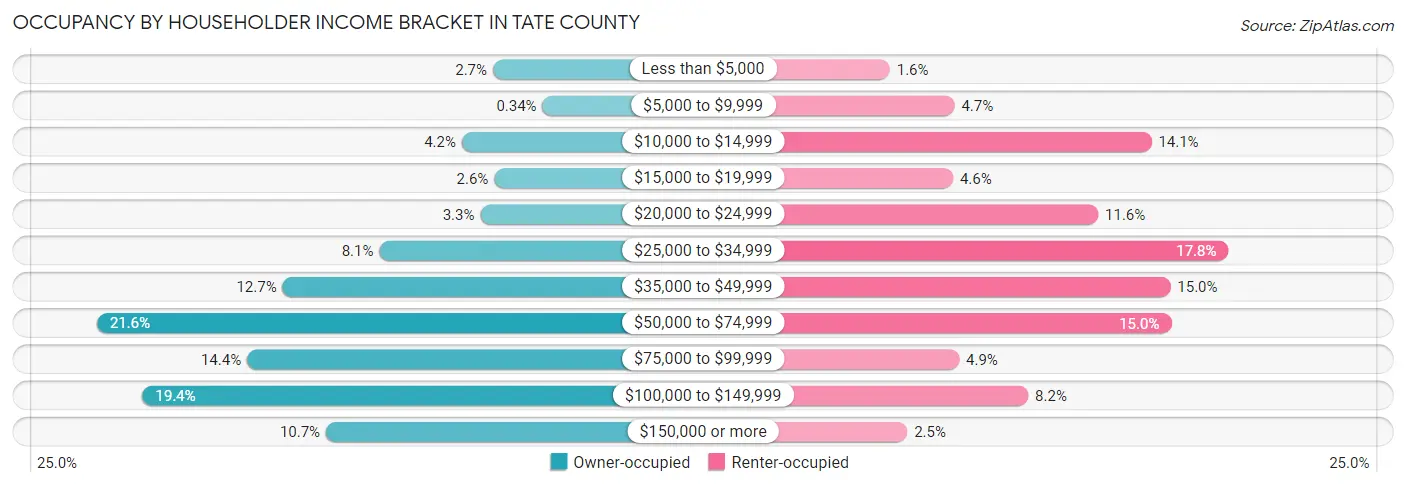
| Income Bracket | Owner-occupied | Renter-occupied |
| Less than $5,000 | 209 (2.7%) | 45 (1.6%) |
| $5,000 to $9,999 | 26 (0.3%) | 130 (4.7%) |
| $10,000 to $14,999 | 323 (4.2%) | 389 (14.1%) |
| $15,000 to $19,999 | 204 (2.6%) | 128 (4.6%) |
| $20,000 to $24,999 | 255 (3.3%) | 319 (11.6%) |
| $25,000 to $34,999 | 627 (8.1%) | 490 (17.7%) |
| $35,000 to $49,999 | 984 (12.7%) | 414 (15.0%) |
| $50,000 to $74,999 | 1,668 (21.6%) | 415 (15.0%) |
| $75,000 to $99,999 | 1,115 (14.4%) | 136 (4.9%) |
| $100,000 to $149,999 | 1,500 (19.4%) | 227 (8.2%) |
| $150,000 or more | 824 (10.6%) | 68 (2.5%) |
| Total | 7,735 (100.0%) | 2,761 (100.0%) |
Monthly Housing Cost Tiers in Tate County
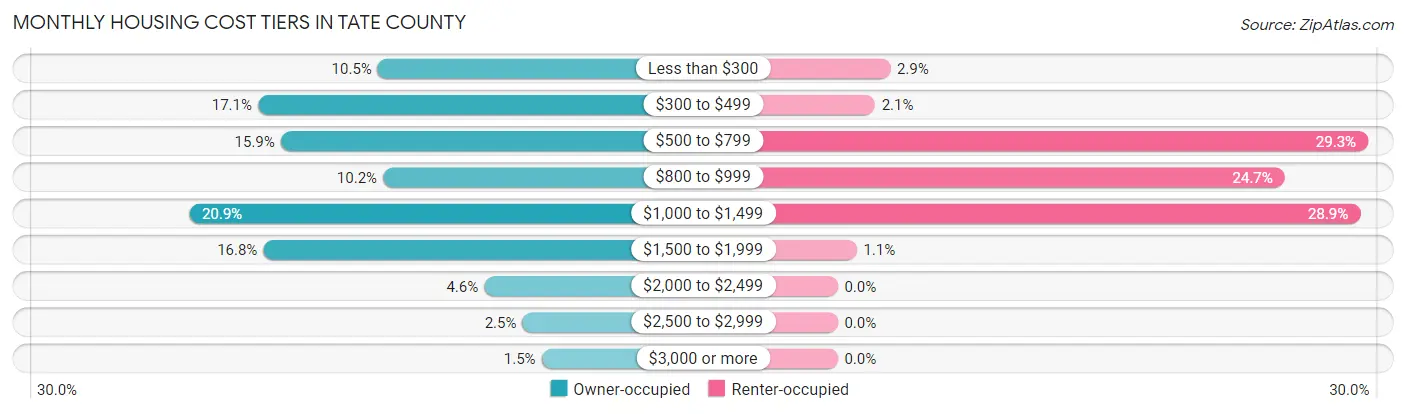
| Monthly Cost | Owner-occupied | Renter-occupied |
| Less than $300 | 812 (10.5%) | 80 (2.9%) |
| $300 to $499 | 1,324 (17.1%) | 57 (2.1%) |
| $500 to $799 | 1,227 (15.9%) | 809 (29.3%) |
| $800 to $999 | 790 (10.2%) | 682 (24.7%) |
| $1,000 to $1,499 | 1,618 (20.9%) | 797 (28.9%) |
| $1,500 to $1,999 | 1,301 (16.8%) | 29 (1.1%) |
| $2,000 to $2,499 | 357 (4.6%) | 0 (0.0%) |
| $2,500 to $2,999 | 194 (2.5%) | 0 (0.0%) |
| $3,000 or more | 112 (1.5%) | 0 (0.0%) |
| Total | 7,735 (100.0%) | 2,761 (100.0%) |
Physical Housing Characteristics in Tate County
Housing Structures in Tate County
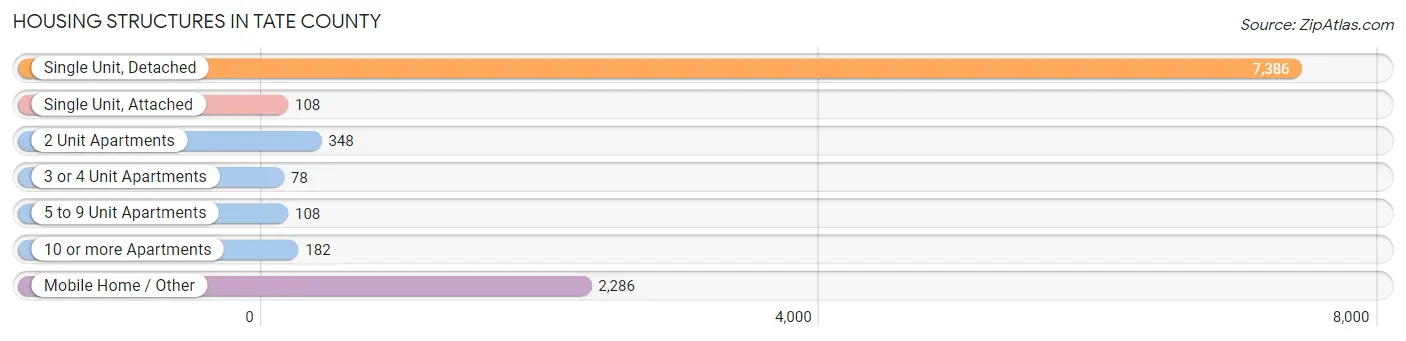
| Structure Type | # Housing Units | % Housing Units |
| Single Unit, Detached | 7,386 | 70.4% |
| Single Unit, Attached | 108 | 1.0% |
| 2 Unit Apartments | 348 | 3.3% |
| 3 or 4 Unit Apartments | 78 | 0.7% |
| 5 to 9 Unit Apartments | 108 | 1.0% |
| 10 or more Apartments | 182 | 1.7% |
| Mobile Home / Other | 2,286 | 21.8% |
| Total | 10,496 | 100.0% |
Housing Structures by Occupancy in Tate County
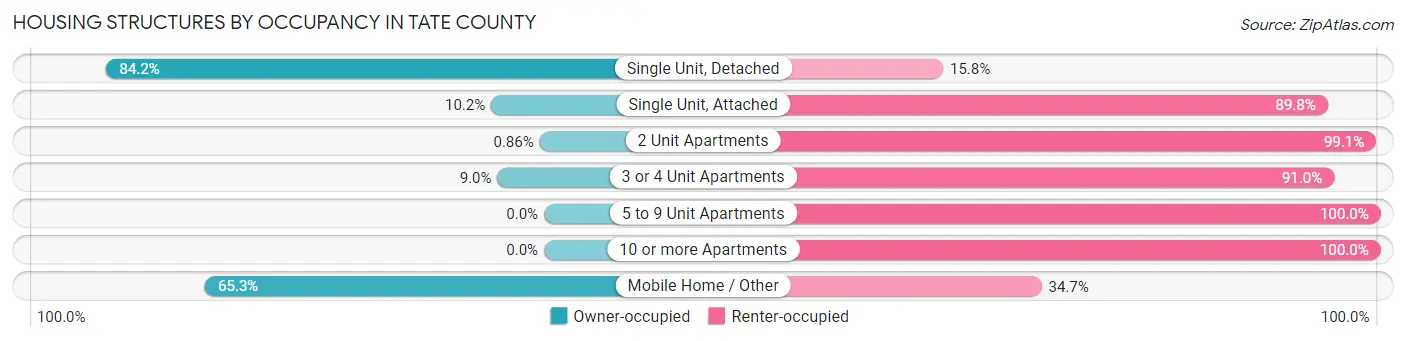
| Structure Type | Owner-occupied | Renter-occupied |
| Single Unit, Detached | 6,222 (84.2%) | 1,164 (15.8%) |
| Single Unit, Attached | 11 (10.2%) | 97 (89.8%) |
| 2 Unit Apartments | 3 (0.9%) | 345 (99.1%) |
| 3 or 4 Unit Apartments | 7 (9.0%) | 71 (91.0%) |
| 5 to 9 Unit Apartments | 0 (0.0%) | 108 (100.0%) |
| 10 or more Apartments | 0 (0.0%) | 182 (100.0%) |
| Mobile Home / Other | 1,492 (65.3%) | 794 (34.7%) |
| Total | 7,735 (73.7%) | 2,761 (26.3%) |
Housing Structures by Number of Rooms in Tate County
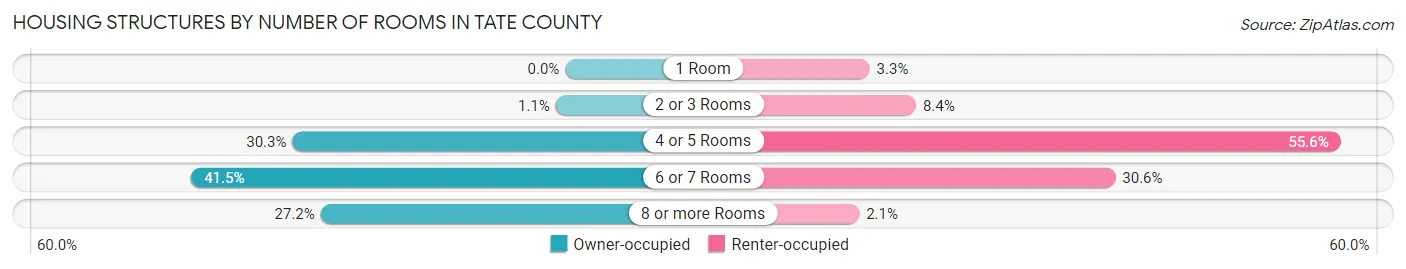
| Number of Rooms | Owner-occupied | Renter-occupied |
| 1 Room | 0 (0.0%) | 91 (3.3%) |
| 2 or 3 Rooms | 82 (1.1%) | 233 (8.4%) |
| 4 or 5 Rooms | 2,343 (30.3%) | 1,534 (55.6%) |
| 6 or 7 Rooms | 3,210 (41.5%) | 844 (30.6%) |
| 8 or more Rooms | 2,100 (27.2%) | 59 (2.1%) |
| Total | 7,735 (100.0%) | 2,761 (100.0%) |
Housing Structure by Heating Type in Tate County
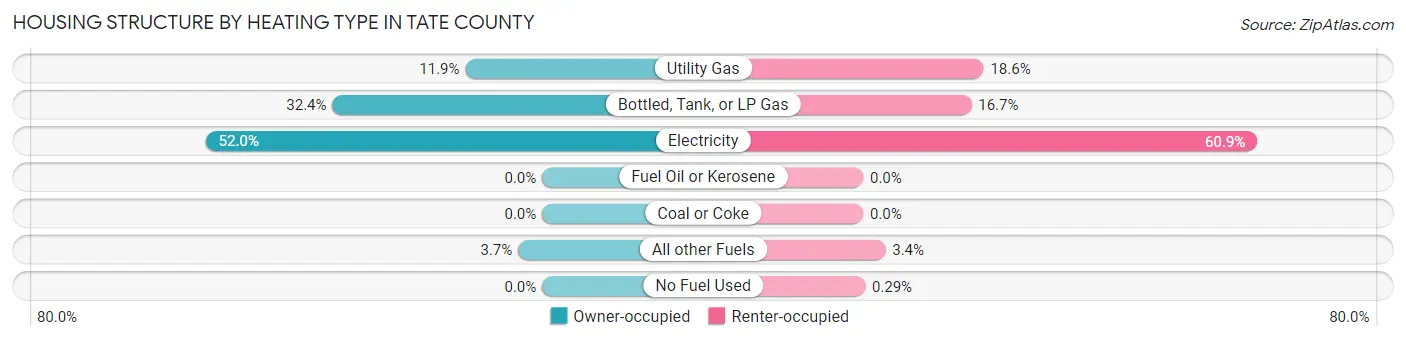
| Heating Type | Owner-occupied | Renter-occupied |
| Utility Gas | 917 (11.9%) | 514 (18.6%) |
| Bottled, Tank, or LP Gas | 2,508 (32.4%) | 462 (16.7%) |
| Electricity | 4,023 (52.0%) | 1,682 (60.9%) |
| Fuel Oil or Kerosene | 0 (0.0%) | 0 (0.0%) |
| Coal or Coke | 0 (0.0%) | 0 (0.0%) |
| All other Fuels | 287 (3.7%) | 95 (3.4%) |
| No Fuel Used | 0 (0.0%) | 8 (0.3%) |
| Total | 7,735 (100.0%) | 2,761 (100.0%) |
Household Vehicle Usage in Tate County
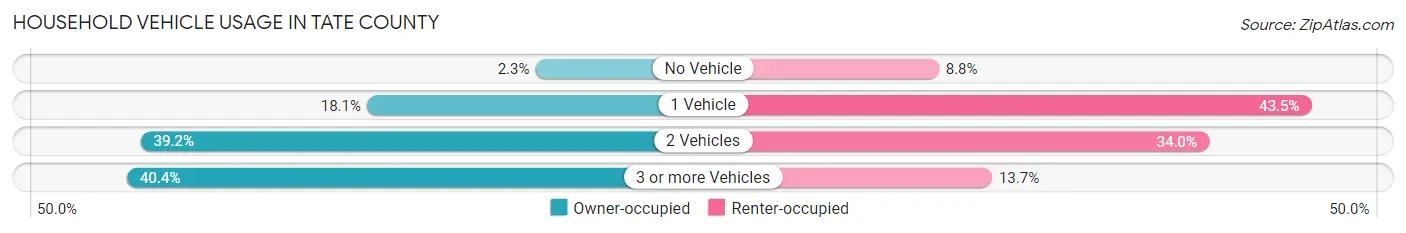
| Vehicles per Household | Owner-occupied | Renter-occupied |
| No Vehicle | 180 (2.3%) | 242 (8.8%) |
| 1 Vehicle | 1,397 (18.1%) | 1,202 (43.5%) |
| 2 Vehicles | 3,030 (39.2%) | 938 (34.0%) |
| 3 or more Vehicles | 3,128 (40.4%) | 379 (13.7%) |
| Total | 7,735 (100.0%) | 2,761 (100.0%) |
Real Estate & Mortgages in Tate County
Real Estate and Mortgage Overview in Tate County
| Characteristic | Without Mortgage | With Mortgage |
| Housing Units | 3,490 | 4,245 |
| Median Property Value | $124,500 | $182,900 |
| Median Household Income | $58,158 | $536 |
| Monthly Housing Costs | $458 | $112 |
| Real Estate Taxes | $961 | $656 |
Property Value by Mortgage Status in Tate County
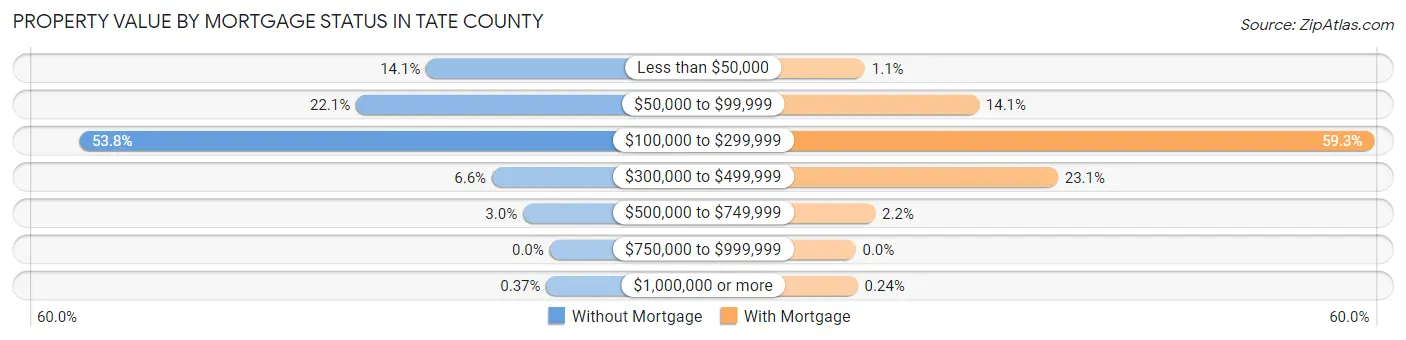
| Property Value | Without Mortgage | With Mortgage |
| Less than $50,000 | 492 (14.1%) | 45 (1.1%) |
| $50,000 to $99,999 | 772 (22.1%) | 598 (14.1%) |
| $100,000 to $299,999 | 1,877 (53.8%) | 2,516 (59.3%) |
| $300,000 to $499,999 | 230 (6.6%) | 981 (23.1%) |
| $500,000 to $749,999 | 106 (3.0%) | 95 (2.2%) |
| $750,000 to $999,999 | 0 (0.0%) | 0 (0.0%) |
| $1,000,000 or more | 13 (0.4%) | 10 (0.2%) |
| Total | 3,490 (100.0%) | 4,245 (100.0%) |
Household Income by Mortgage Status in Tate County
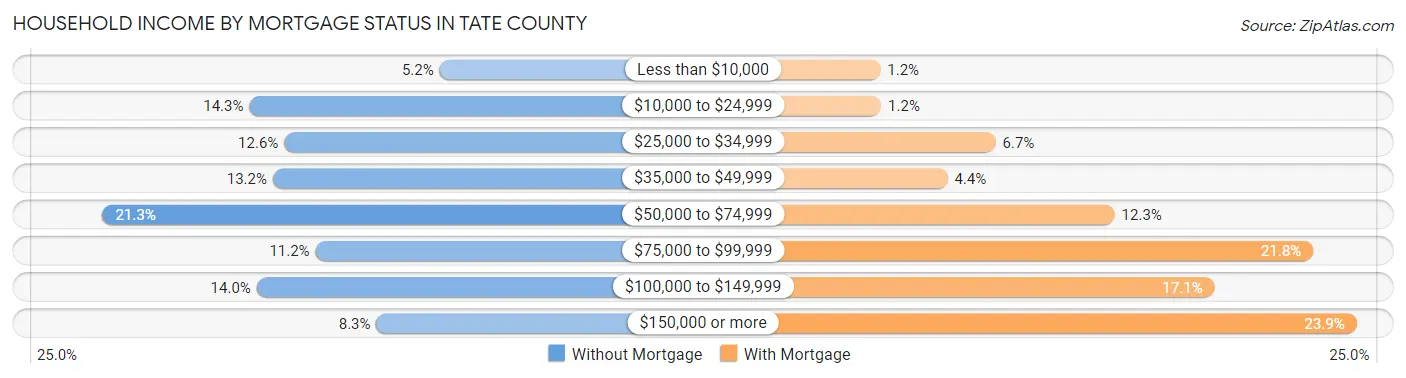
| Household Income | Without Mortgage | With Mortgage |
| Less than $10,000 | 183 (5.2%) | 50 (1.2%) |
| $10,000 to $24,999 | 499 (14.3%) | 52 (1.2%) |
| $25,000 to $34,999 | 441 (12.6%) | 283 (6.7%) |
| $35,000 to $49,999 | 460 (13.2%) | 186 (4.4%) |
| $50,000 to $74,999 | 743 (21.3%) | 524 (12.3%) |
| $75,000 to $99,999 | 389 (11.2%) | 925 (21.8%) |
| $100,000 to $149,999 | 487 (14.0%) | 726 (17.1%) |
| $150,000 or more | 288 (8.3%) | 1,013 (23.9%) |
| Total | 3,490 (100.0%) | 4,245 (100.0%) |
Property Value to Household Income Ratio in Tate County
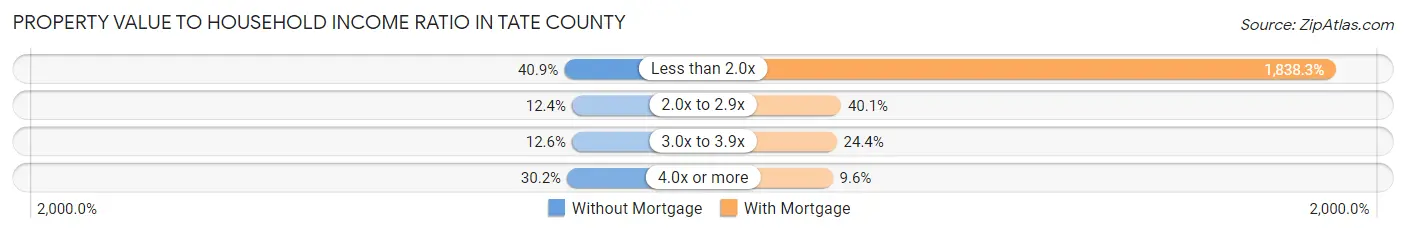
| Value-to-Income Ratio | Without Mortgage | With Mortgage |
| Less than 2.0x | 1,427 (40.9%) | 78,036 (1,838.3%) |
| 2.0x to 2.9x | 433 (12.4%) | 1,700 (40.1%) |
| 3.0x to 3.9x | 439 (12.6%) | 1,035 (24.4%) |
| 4.0x or more | 1,053 (30.2%) | 407 (9.6%) |
| Total | 3,490 (100.0%) | 4,245 (100.0%) |
Real Estate Taxes by Mortgage Status in Tate County
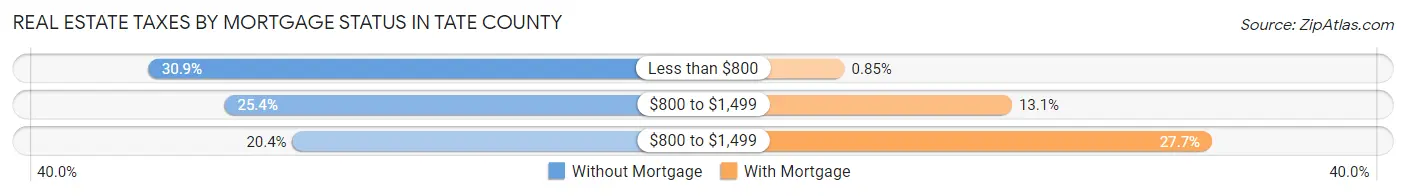
| Property Taxes | Without Mortgage | With Mortgage |
| Less than $800 | 1,079 (30.9%) | 36 (0.9%) |
| $800 to $1,499 | 886 (25.4%) | 555 (13.1%) |
| $800 to $1,499 | 713 (20.4%) | 1,175 (27.7%) |
| Total | 3,490 (100.0%) | 4,245 (100.0%) |
Health & Disability in Tate County
Health Insurance Coverage by Age in Tate County
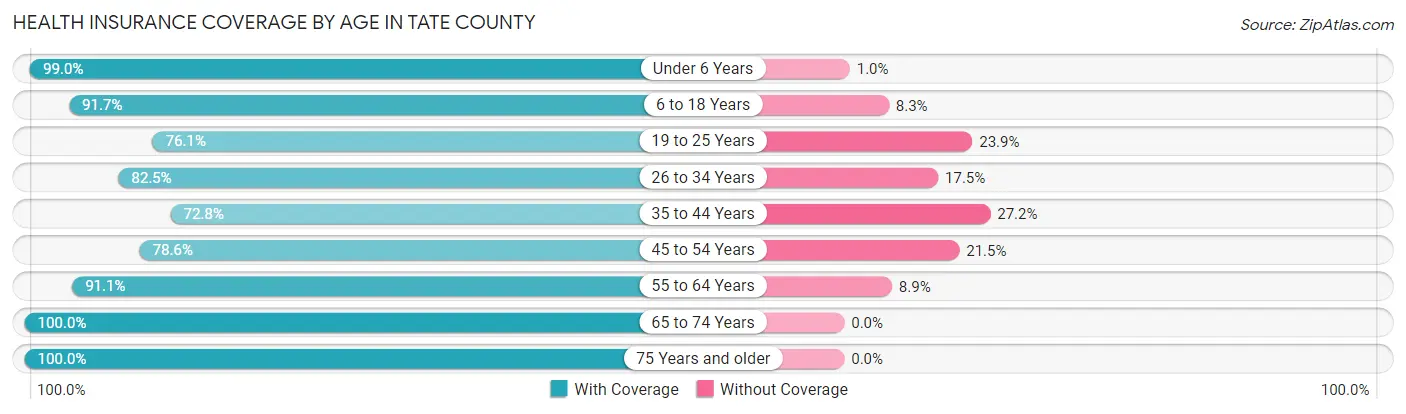
| Age Bracket | With Coverage | Without Coverage |
| Under 6 Years | 2,035 (99.0%) | 21 (1.0%) |
| 6 to 18 Years | 4,614 (91.7%) | 418 (8.3%) |
| 19 to 25 Years | 2,147 (76.1%) | 673 (23.9%) |
| 26 to 34 Years | 2,514 (82.5%) | 533 (17.5%) |
| 35 to 44 Years | 2,297 (72.8%) | 859 (27.2%) |
| 45 to 54 Years | 2,728 (78.5%) | 745 (21.4%) |
| 55 to 64 Years | 3,336 (91.1%) | 325 (8.9%) |
| 65 to 74 Years | 2,935 (100.0%) | 0 (0.0%) |
| 75 Years and older | 1,536 (100.0%) | 0 (0.0%) |
| Total | 24,142 (87.1%) | 3,574 (12.9%) |
Health Insurance Coverage by Citizenship Status in Tate County
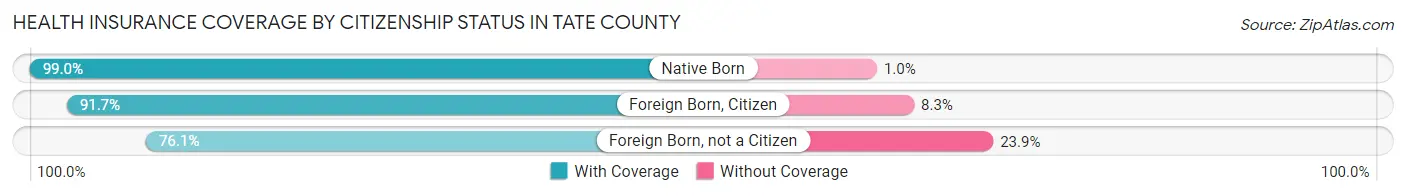
| Citizenship Status | With Coverage | Without Coverage |
| Native Born | 2,035 (99.0%) | 21 (1.0%) |
| Foreign Born, Citizen | 4,614 (91.7%) | 418 (8.3%) |
| Foreign Born, not a Citizen | 2,147 (76.1%) | 673 (23.9%) |
Health Insurance Coverage by Household Income in Tate County
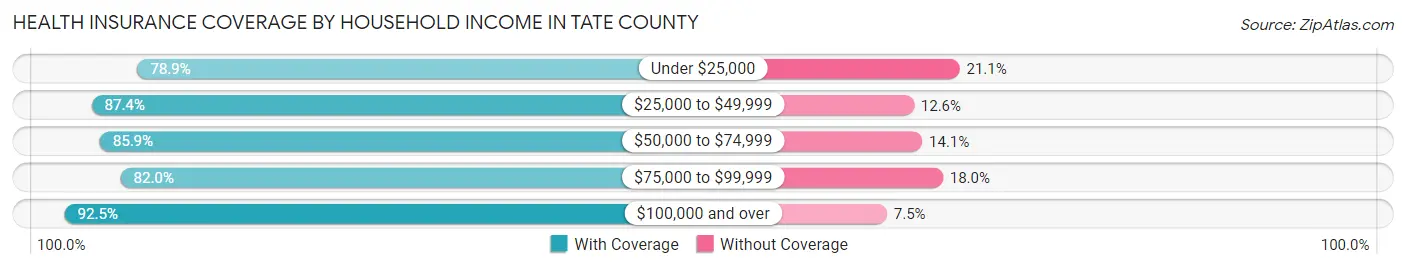
| Household Income | With Coverage | Without Coverage |
| Under $25,000 | 2,784 (78.9%) | 746 (21.1%) |
| $25,000 to $49,999 | 5,533 (87.4%) | 795 (12.6%) |
| $50,000 to $74,999 | 4,521 (85.9%) | 743 (14.1%) |
| $75,000 to $99,999 | 2,950 (82.0%) | 647 (18.0%) |
| $100,000 and over | 6,925 (92.5%) | 562 (7.5%) |
Public vs Private Health Insurance Coverage by Age in Tate County
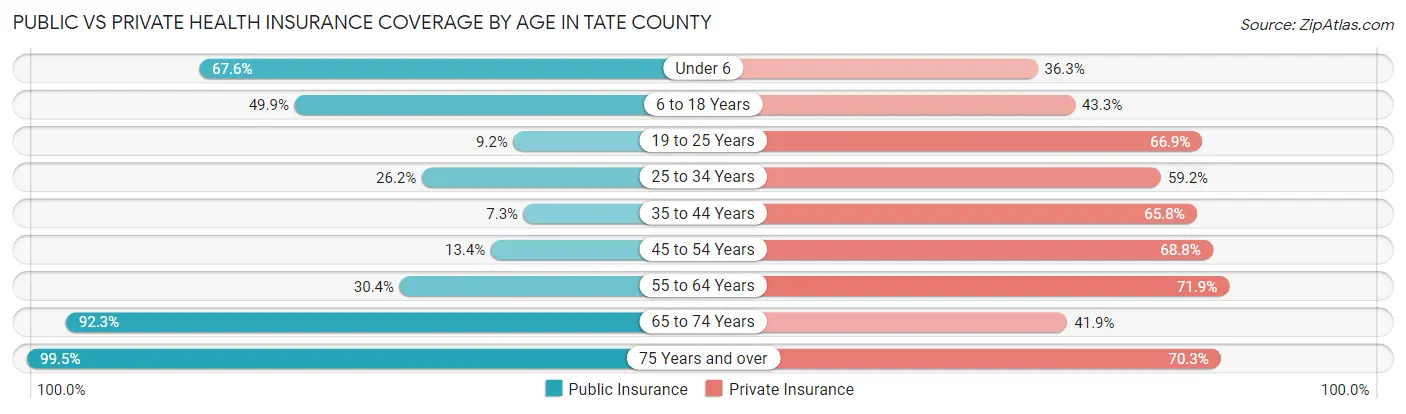
| Age Bracket | Public Insurance | Private Insurance |
| Under 6 | 1,390 (67.6%) | 747 (36.3%) |
| 6 to 18 Years | 2,509 (49.9%) | 2,178 (43.3%) |
| 19 to 25 Years | 260 (9.2%) | 1,887 (66.9%) |
| 25 to 34 Years | 799 (26.2%) | 1,805 (59.2%) |
| 35 to 44 Years | 231 (7.3%) | 2,078 (65.8%) |
| 45 to 54 Years | 466 (13.4%) | 2,390 (68.8%) |
| 55 to 64 Years | 1,111 (30.3%) | 2,631 (71.9%) |
| 65 to 74 Years | 2,710 (92.3%) | 1,229 (41.9%) |
| 75 Years and over | 1,529 (99.5%) | 1,080 (70.3%) |
| Total | 11,005 (39.7%) | 16,025 (57.8%) |
Disability Status by Sex by Age in Tate County
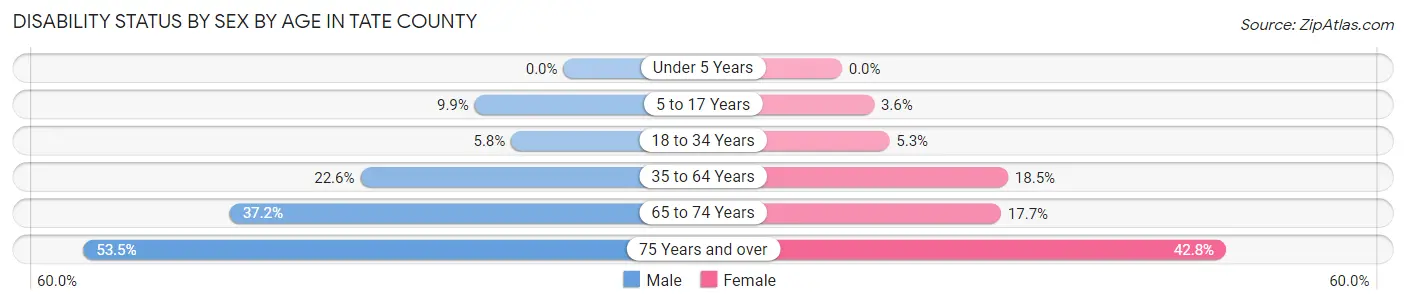
| Age Bracket | Male | Female |
| Under 5 Years | 0 (0.0%) | 0 (0.0%) |
| 5 to 17 Years | 235 (9.9%) | 82 (3.6%) |
| 18 to 34 Years | 193 (5.8%) | 176 (5.3%) |
| 35 to 64 Years | 1,103 (22.6%) | 1,001 (18.5%) |
| 65 to 74 Years | 516 (37.1%) | 274 (17.7%) |
| 75 Years and over | 340 (53.5%) | 385 (42.8%) |
Disability Class by Sex by Age in Tate County
Disability Class: Hearing Difficulty
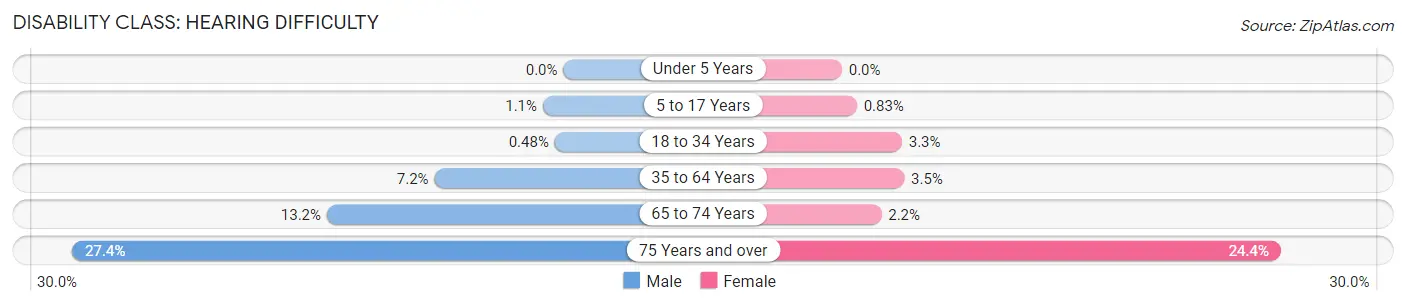
| Age Bracket | Male | Female |
| Under 5 Years | 0 (0.0%) | 0 (0.0%) |
| 5 to 17 Years | 27 (1.1%) | 19 (0.8%) |
| 18 to 34 Years | 16 (0.5%) | 111 (3.3%) |
| 35 to 64 Years | 350 (7.2%) | 188 (3.5%) |
| 65 to 74 Years | 183 (13.2%) | 34 (2.2%) |
| 75 Years and over | 174 (27.4%) | 220 (24.4%) |
Disability Class: Vision Difficulty
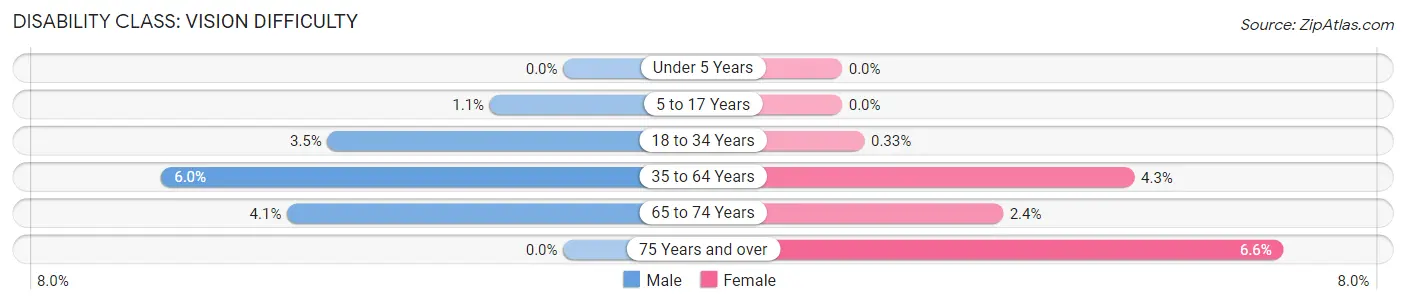
| Age Bracket | Male | Female |
| Under 5 Years | 0 (0.0%) | 0 (0.0%) |
| 5 to 17 Years | 26 (1.1%) | 0 (0.0%) |
| 18 to 34 Years | 116 (3.5%) | 11 (0.3%) |
| 35 to 64 Years | 291 (6.0%) | 235 (4.3%) |
| 65 to 74 Years | 57 (4.1%) | 37 (2.4%) |
| 75 Years and over | 0 (0.0%) | 59 (6.6%) |
Disability Class: Cognitive Difficulty
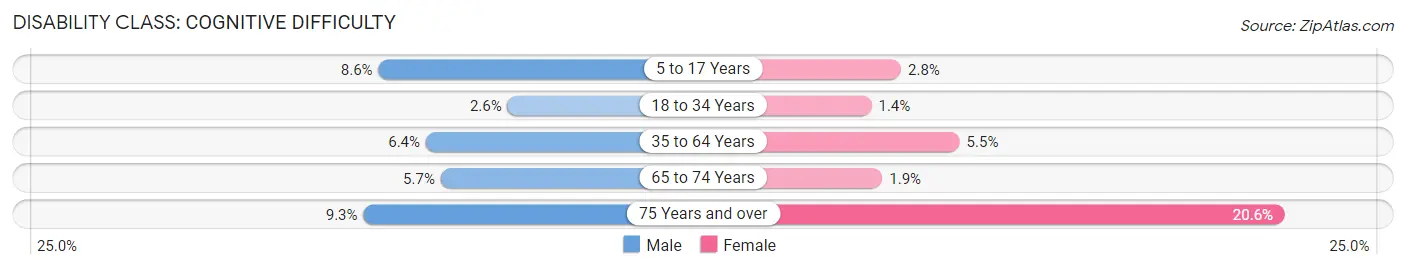
| Age Bracket | Male | Female |
| 5 to 17 Years | 204 (8.6%) | 63 (2.8%) |
| 18 to 34 Years | 86 (2.6%) | 46 (1.4%) |
| 35 to 64 Years | 311 (6.4%) | 296 (5.5%) |
| 65 to 74 Years | 79 (5.7%) | 29 (1.9%) |
| 75 Years and over | 59 (9.3%) | 185 (20.6%) |
Disability Class: Ambulatory Difficulty
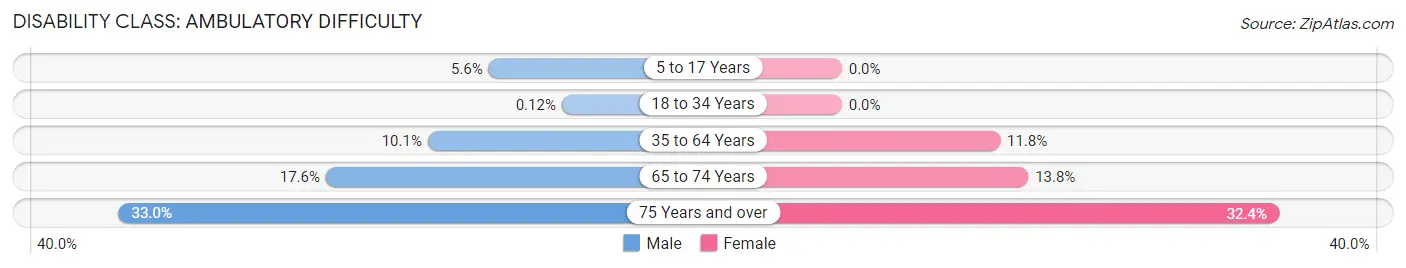
| Age Bracket | Male | Female |
| 5 to 17 Years | 132 (5.6%) | 0 (0.0%) |
| 18 to 34 Years | 4 (0.1%) | 0 (0.0%) |
| 35 to 64 Years | 491 (10.1%) | 636 (11.7%) |
| 65 to 74 Years | 245 (17.6%) | 214 (13.8%) |
| 75 Years and over | 210 (33.0%) | 292 (32.4%) |
Disability Class: Self-Care Difficulty
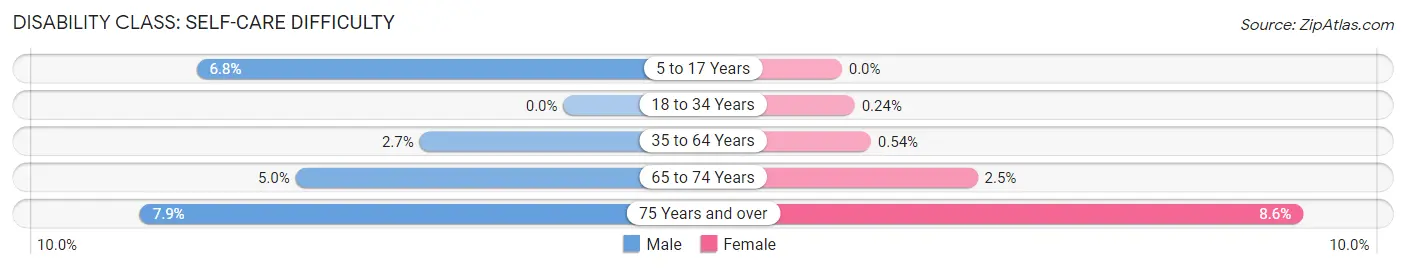
| Age Bracket | Male | Female |
| 5 to 17 Years | 162 (6.8%) | 0 (0.0%) |
| 18 to 34 Years | 0 (0.0%) | 8 (0.2%) |
| 35 to 64 Years | 130 (2.7%) | 29 (0.5%) |
| 65 to 74 Years | 69 (5.0%) | 39 (2.5%) |
| 75 Years and over | 50 (7.9%) | 77 (8.6%) |
Technology Access in Tate County
Computing Device Access in Tate County
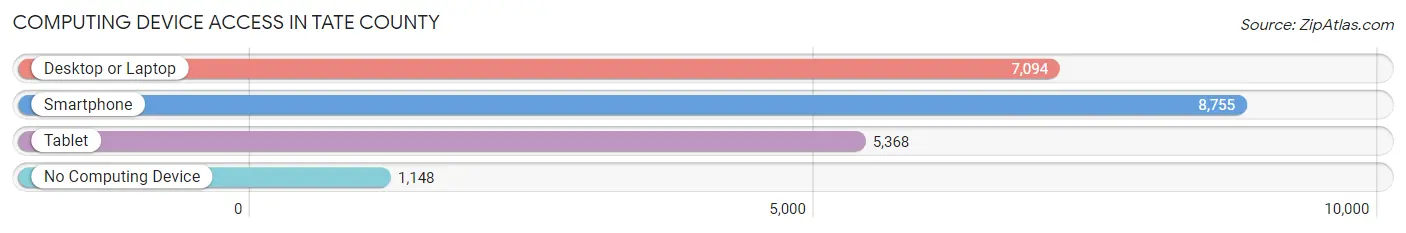
| Device Type | # Households | % Households |
| Desktop or Laptop | 7,094 | 67.6% |
| Smartphone | 8,755 | 83.4% |
| Tablet | 5,368 | 51.1% |
| No Computing Device | 1,148 | 10.9% |
| Total | 10,496 | 100.0% |
Internet Access in Tate County
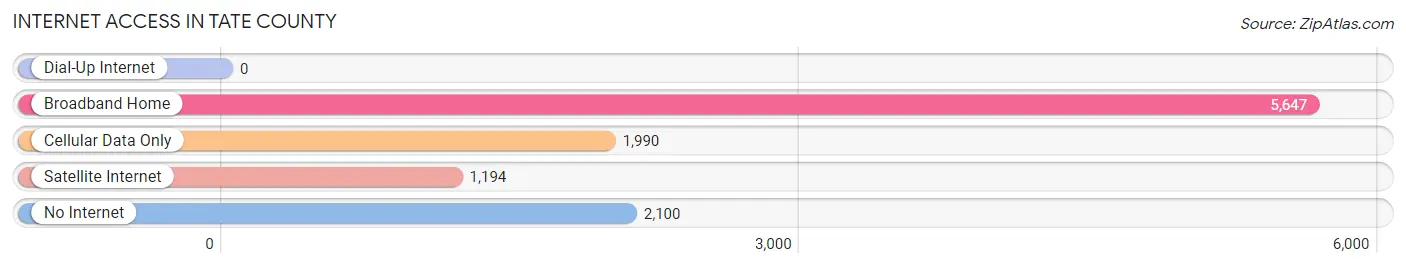
| Internet Type | # Households | % Households |
| Dial-Up Internet | 0 | 0.0% |
| Broadband Home | 5,647 | 53.8% |
| Cellular Data Only | 1,990 | 19.0% |
| Satellite Internet | 1,194 | 11.4% |
| No Internet | 2,100 | 20.0% |
| Total | 10,496 | 100.0% |
Tate County Summary
Tate County is located in the northwest corner of Mississippi, and is part of the Mississippi Delta region. It is bordered by DeSoto County to the north, Marshall County to the east, Panola County to the south, and Tunica County to the west. The county seat is Senatobia, and the county is named for Thomas Simpson Tate, a prominent early settler.
History
Tate County was established in 1873, and was originally part of DeSoto County. The county was named for Thomas Simpson Tate, a prominent early settler who was a veteran of the War of 1812. Tate County was home to several Native American tribes, including the Chickasaw, Choctaw, and Tunica.
The first settlers in Tate County were mostly farmers, and the county was largely agricultural until the early 20th century. The first railroad line was built in the county in 1884, and this led to the development of several small towns, including Senatobia, Coldwater, and Como.
In the early 20th century, the county experienced a period of rapid growth, as the timber and cotton industries began to expand. The county also became a popular destination for tourists, as the area was known for its natural beauty.
Geography
Tate County is located in the northwest corner of Mississippi, and is part of the Mississippi Delta region. It is bordered by DeSoto County to the north, Marshall County to the east, Panola County to the south, and Tunica County to the west. The county has a total area of 545 square miles, and is mostly flat, with some rolling hills in the northern part of the county. The county is drained by the Coldwater River, which flows through the county from north to south.
The county is home to several state parks, including the Coldwater River State Park, which is located in the northern part of the county. The park is known for its hiking trails, fishing, and camping.
Economy
Tate County has a diverse economy, with agriculture, manufacturing, and tourism being the main industries. The county is home to several large agricultural operations, including cotton, soybeans, corn, and wheat. The county is also home to several manufacturing companies, including furniture, automotive, and food processing.
Tourism is also an important part of the county’s economy, as the area is known for its natural beauty. The county is home to several state parks, as well as several historic sites, including the Coldwater River State Park, the Tate County Courthouse, and the Senatobia Historic District.
Demographics
As of the 2010 census, Tate County had a population of 28,886. The population was 53.3% white, 44.2% African American, 0.5% Native American, 0.3% Asian, 0.1% Pacific Islander, and 1.6% from two or more races. The median household income was $37,945, and the median family income was $45,945.
Tate County is home to several colleges and universities, including Northwest Mississippi Community College, the University of Mississippi, and Delta State University. The county is also home to several public schools, including Senatobia High School, Coldwater High School, and Como High School.
Common Questions
What is Per Capita Income in Tate County?
Per Capita income in Tate County is $28,306.
What is the Median Family Income in Tate County?
Median Family Income in Tate County is $68,494.
What is the Median Household income in Tate County?
Median Household Income in Tate County is $61,286.
What is Income or Wage Gap in Tate County?
Income or Wage Gap in Tate County is 37.9%.
Women in Tate County earn 62.1 cents for every dollar earned by a man.
What is Family Income Deficit in Tate County?
Family Income Deficit in Tate County is $8,371.
Families that are below poverty line in Tate County earn $8,371 less on average than the poverty threshold level.
What is Inequality or Gini Index in Tate County?
Inequality or Gini Index in Tate County is 0.43.
What is the Total Population of Tate County?
Total Population of Tate County is 28,094.
What is the Total Male Population of Tate County?
Total Male Population of Tate County is 13,587.
What is the Total Female Population of Tate County?
Total Female Population of Tate County is 14,507.
What is the Ratio of Males per 100 Females in Tate County?
There are 93.66 Males per 100 Females in Tate County.
What is the Ratio of Females per 100 Males in Tate County?
There are 106.77 Females per 100 Males in Tate County.
What is the Median Population Age in Tate County?
Median Population Age in Tate County is 38.3 Years.
What is the Average Family Size in Tate County
Average Family Size in Tate County is 2.9 People.
What is the Average Household Size in Tate County
Average Household Size in Tate County is 2.5 People.
How Large is the Labor Force in Tate County?
There are 12,883 People in the Labor Forcein in Tate County.
What is the Percentage of People in the Labor Force in Tate County?
57.4% of People are in the Labor Force in Tate County.
What is the Unemployment Rate in Tate County?
Unemployment Rate in Tate County is 7.2%.