Pearl River County, MS Map & Demographics
Pearl River County Map
Pearl River County Overview
$27,549
PER CAPITA INCOME
$67,832
AVG FAMILY INCOME
$54,220
AVG HOUSEHOLD INCOME
49.7%
WAGE / INCOME GAP [ % ]
50.3¢/ $1
WAGE / INCOME GAP [ $ ]
$9,905
FAMILY INCOME DEFICIT
0.44
INEQUALITY / GINI INDEX
56,351
TOTAL POPULATION
27,679
MALE POPULATION
28,672
FEMALE POPULATION
96.54
MALES / 100 FEMALES
103.59
FEMALES / 100 MALES
40.8
MEDIAN AGE
3.1
AVG FAMILY SIZE
2.6
AVG HOUSEHOLD SIZE
24,560
LABOR FORCE [ PEOPLE ]
54.5%
PERCENT IN LABOR FORCE
5.6%
UNEMPLOYMENT RATE
Income in Pearl River County
Income Overview in Pearl River County
Per Capita Income in Pearl River County is $27,549, while median incomes of families and households are $67,832 and $54,220 respectively.
| Characteristic | Number | Measure |
| Per Capita Income | 56,351 | $27,549 |
| Median Family Income | 14,805 | $67,832 |
| Mean Family Income | 14,805 | $81,601 |
| Median Household Income | 21,188 | $54,220 |
| Mean Household Income | 21,188 | $70,309 |
| Income Deficit | 14,805 | $9,905 |
| Wage / Income Gap (%) | 56,351 | 49.67% |
| Wage / Income Gap ($) | 56,351 | 50.33¢ per $1 |
| Gini / Inequality Index | 56,351 | 0.44 |
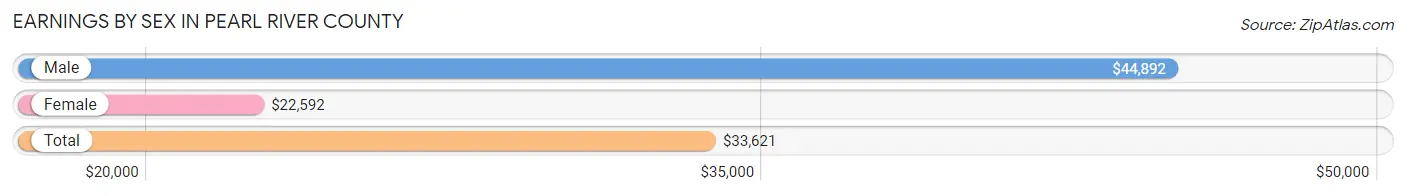
Earnings by Sex in Pearl River County
Average Earnings in Pearl River County are $33,621, $44,892 for men and $22,592 for women, a difference of 49.7%.
| Sex | Number | Average Earnings |
| Male | 13,749 (54.7%) | $44,892 |
| Female | 11,365 (45.3%) | $22,592 |
| Total | 25,114 (100.0%) | $33,621 |
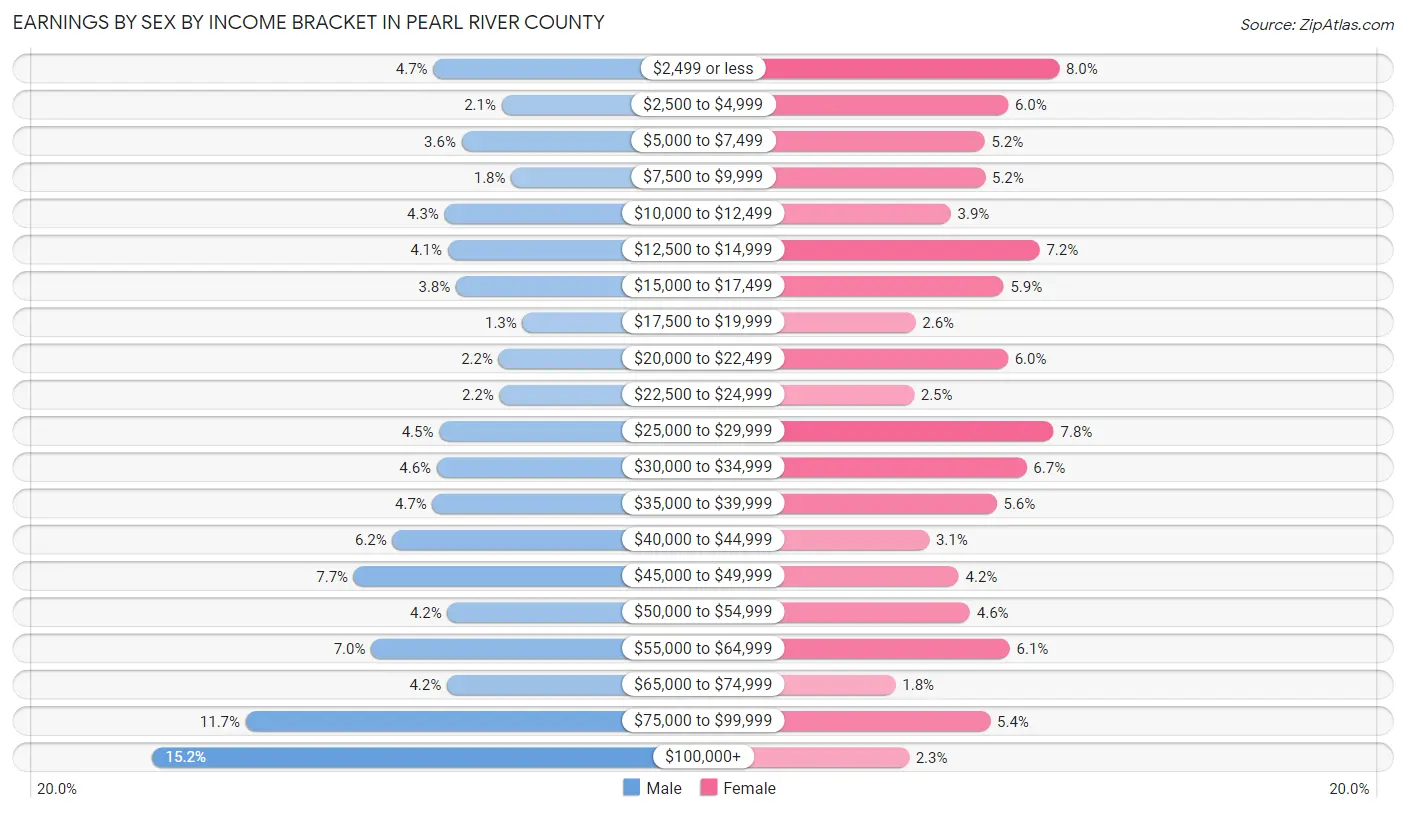
Earnings by Sex by Income Bracket in Pearl River County
The most common earnings brackets in Pearl River County are $100,000+ for men (2,090 | 15.2%) and $2,499 or less for women (904 | 8.0%).
| Income | Male | Female |
| $2,499 or less | 643 (4.7%) | 904 (8.0%) |
| $2,500 to $4,999 | 291 (2.1%) | 686 (6.0%) |
| $5,000 to $7,499 | 498 (3.6%) | 587 (5.2%) |
| $7,500 to $9,999 | 242 (1.8%) | 589 (5.2%) |
| $10,000 to $12,499 | 586 (4.3%) | 442 (3.9%) |
| $12,500 to $14,999 | 569 (4.1%) | 820 (7.2%) |
| $15,000 to $17,499 | 526 (3.8%) | 667 (5.9%) |
| $17,500 to $19,999 | 184 (1.3%) | 292 (2.6%) |
| $20,000 to $22,499 | 307 (2.2%) | 685 (6.0%) |
| $22,500 to $24,999 | 302 (2.2%) | 285 (2.5%) |
| $25,000 to $29,999 | 613 (4.5%) | 881 (7.7%) |
| $30,000 to $34,999 | 626 (4.5%) | 765 (6.7%) |
| $35,000 to $39,999 | 648 (4.7%) | 638 (5.6%) |
| $40,000 to $44,999 | 854 (6.2%) | 350 (3.1%) |
| $45,000 to $49,999 | 1,053 (7.7%) | 476 (4.2%) |
| $50,000 to $54,999 | 570 (4.2%) | 524 (4.6%) |
| $55,000 to $64,999 | 964 (7.0%) | 693 (6.1%) |
| $65,000 to $74,999 | 573 (4.2%) | 207 (1.8%) |
| $75,000 to $99,999 | 1,610 (11.7%) | 610 (5.4%) |
| $100,000+ | 2,090 (15.2%) | 264 (2.3%) |
| Total | 13,749 (100.0%) | 11,365 (100.0%) |
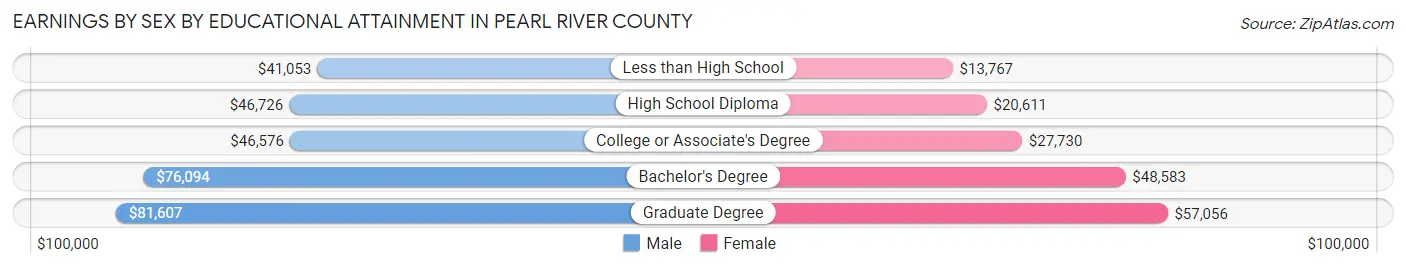
Earnings by Sex by Educational Attainment in Pearl River County
Average earnings in Pearl River County are $49,146 for men and $27,726 for women, a difference of 43.6%. Men with an educational attainment of graduate degree enjoy the highest average annual earnings of $81,607, while those with less than high school education earn the least with $41,053. Women with an educational attainment of graduate degree earn the most with the average annual earnings of $57,056, while those with less than high school education have the smallest earnings of $13,767.
| Educational Attainment | Male Income | Female Income |
| Less than High School | $41,053 | $13,767 |
| High School Diploma | $46,726 | $20,611 |
| College or Associate's Degree | $46,576 | $27,730 |
| Bachelor's Degree | $76,094 | $48,583 |
| Graduate Degree | $81,607 | $57,056 |
| Total | $49,146 | $27,726 |
Family Income in Pearl River County
Family Income Brackets in Pearl River County
According to the Pearl River County family income data, there are 2,946 families falling into the $100,000 to $149,999 income range, which is the most common income bracket and makes up 19.9% of all families. Conversely, the less than $10,000 income bracket is the least frequent group with only 474 families (3.2%) belonging to this category.
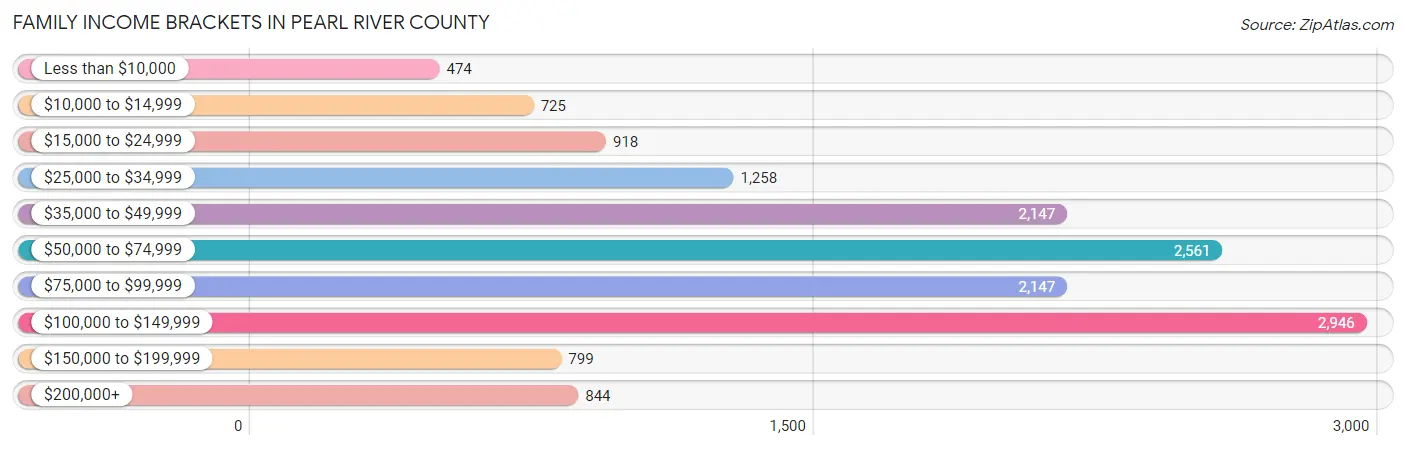
| Income Bracket | # Families | % Families |
| Less than $10,000 | 474 | 3.2% |
| $10,000 to $14,999 | 725 | 4.9% |
| $15,000 to $24,999 | 918 | 6.2% |
| $25,000 to $34,999 | 1,258 | 8.5% |
| $35,000 to $49,999 | 2,147 | 14.5% |
| $50,000 to $74,999 | 2,561 | 17.3% |
| $75,000 to $99,999 | 2,147 | 14.5% |
| $100,000 to $149,999 | 2,946 | 19.9% |
| $150,000 to $199,999 | 799 | 5.4% |
| $200,000+ | 844 | 5.7% |
Family Income by Famaliy Size in Pearl River County
4-person families (2,812 | 19.0%) account for the highest median family income in Pearl River County with $90,226 per family, while 2-person families (7,404 | 50.0%) have the highest median income of $30,121 per family member.
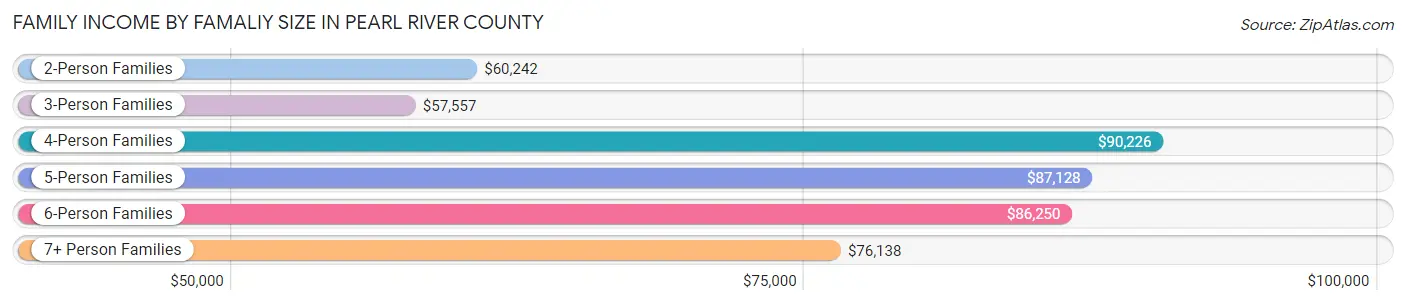
| Income Bracket | # Families | Median Income |
| 2-Person Families | 7,404 (50.0%) | $60,242 |
| 3-Person Families | 2,939 (19.9%) | $57,557 |
| 4-Person Families | 2,812 (19.0%) | $90,226 |
| 5-Person Families | 1,243 (8.4%) | $87,128 |
| 6-Person Families | 298 (2.0%) | $86,250 |
| 7+ Person Families | 109 (0.7%) | $76,138 |
| Total | 14,805 (100.0%) | $67,832 |
Family Income by Number of Earners in Pearl River County
The median family income in Pearl River County is $67,832, with families comprising 3+ earners (1,286) having the highest median family income of $107,500, while families with no earners (3,275) have the lowest median family income of $38,527, accounting for 8.7% and 22.1% of families, respectively.
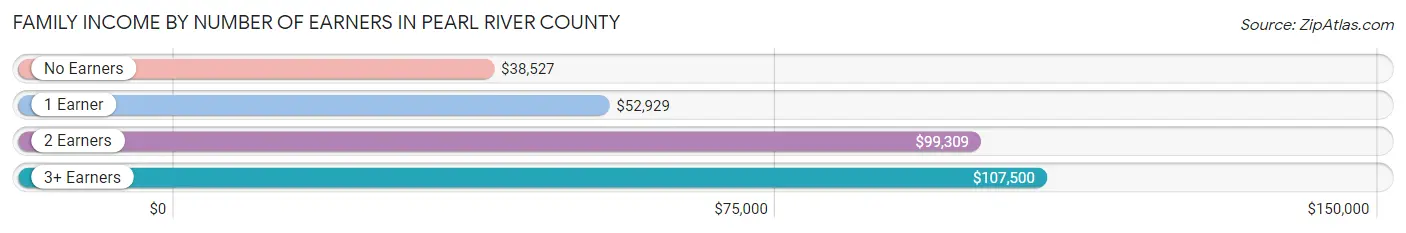
| Number of Earners | # Families | Median Income |
| No Earners | 3,275 (22.1%) | $38,527 |
| 1 Earner | 5,601 (37.8%) | $52,929 |
| 2 Earners | 4,643 (31.4%) | $99,309 |
| 3+ Earners | 1,286 (8.7%) | $107,500 |
| Total | 14,805 (100.0%) | $67,832 |
Household Income in Pearl River County
Household Income Brackets in Pearl River County
With 3,305 households falling in the category, the $50,000 to $74,999 income range is the most frequent in Pearl River County, accounting for 15.6% of all households. In contrast, only 848 households (4.0%) fall into the $150,000 to $199,999 income bracket, making it the least populous group.
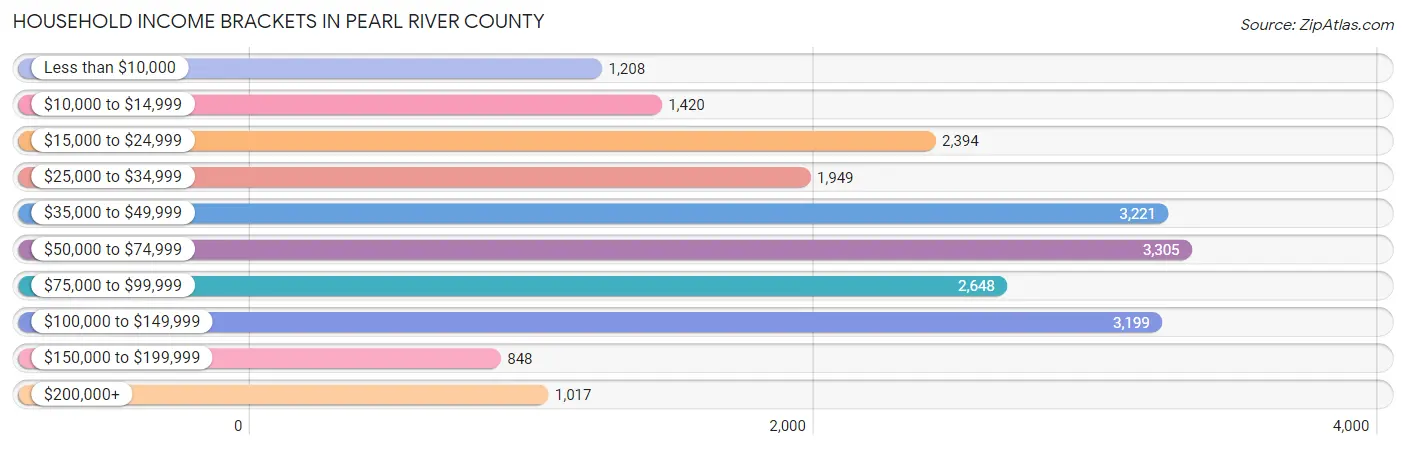
| Income Bracket | # Households | % Households |
| Less than $10,000 | 1,208 | 5.7% |
| $10,000 to $14,999 | 1,420 | 6.7% |
| $15,000 to $24,999 | 2,394 | 11.3% |
| $25,000 to $34,999 | 1,949 | 9.2% |
| $35,000 to $49,999 | 3,221 | 15.2% |
| $50,000 to $74,999 | 3,305 | 15.6% |
| $75,000 to $99,999 | 2,648 | 12.5% |
| $100,000 to $149,999 | 3,199 | 15.1% |
| $150,000 to $199,999 | 848 | 4.0% |
| $200,000+ | 1,017 | 4.8% |
Household Income by Householder Age in Pearl River County
The median household income in Pearl River County is $54,220, with the highest median household income of $73,376 found in the 25 to 44 years age bracket for the primary householder. A total of 5,776 households (27.3%) fall into this category. Meanwhile, the 15 to 24 years age bracket for the primary householder has the lowest median household income of $0, with 649 households (3.1%) in this group.
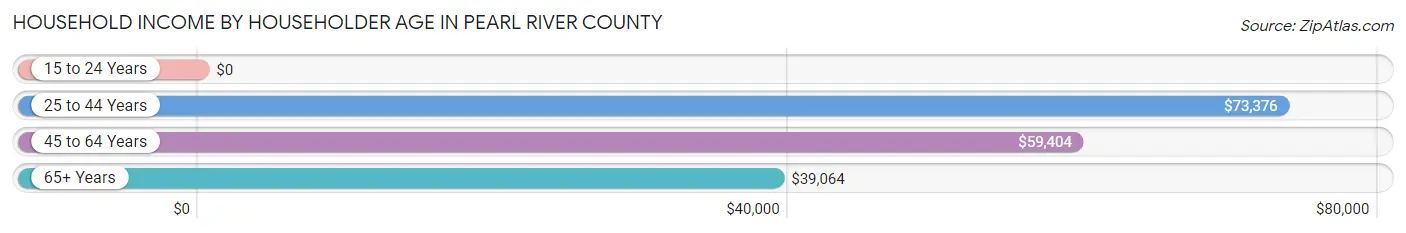
| Income Bracket | # Households | Median Income |
| 15 to 24 Years | 649 (3.1%) | $0 |
| 25 to 44 Years | 5,776 (27.3%) | $73,376 |
| 45 to 64 Years | 7,967 (37.6%) | $59,404 |
| 65+ Years | 6,796 (32.1%) | $39,064 |
| Total | 21,188 (100.0%) | $54,220 |
Poverty in Pearl River County
Income Below Poverty by Sex and Age in Pearl River County
With 13.4% poverty level for males and 18.1% for females among the residents of Pearl River County, 15 year old males and 15 year old females are the most vulnerable to poverty, with 74 males (27.6%) and 114 females (38.4%) in their respective age groups living below the poverty level.
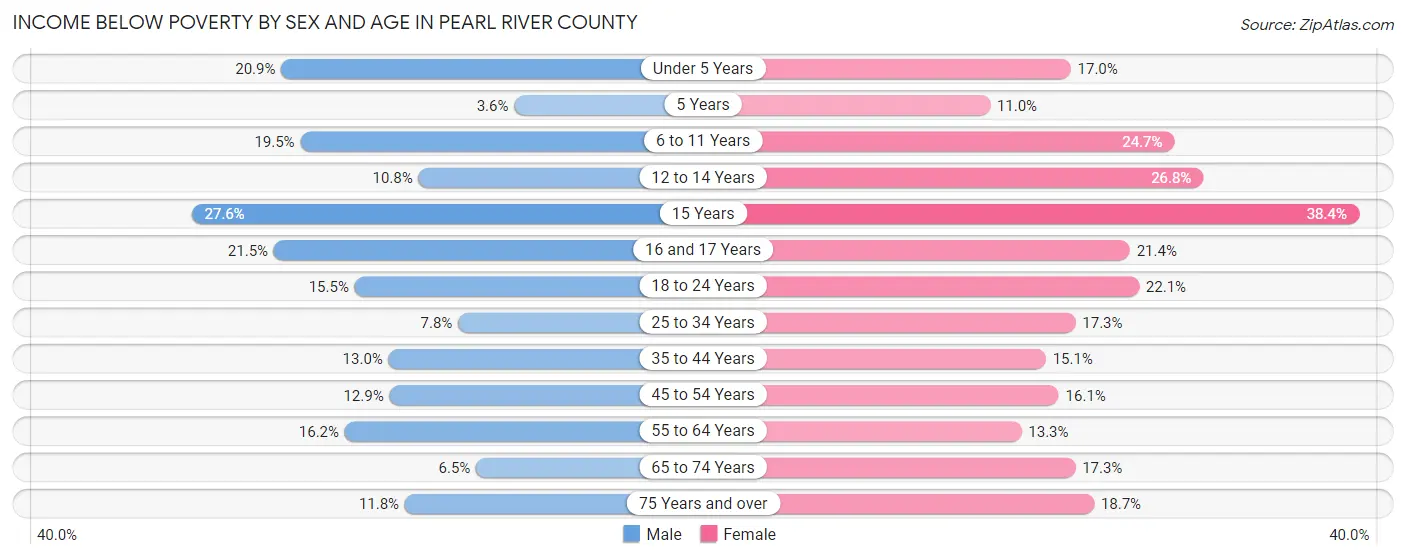
| Age Bracket | Male | Female |
| Under 5 Years | 353 (20.9%) | 252 (17.0%) |
| 5 Years | 13 (3.6%) | 23 (11.0%) |
| 6 to 11 Years | 407 (19.5%) | 582 (24.7%) |
| 12 to 14 Years | 137 (10.7%) | 322 (26.8%) |
| 15 Years | 74 (27.6%) | 114 (38.4%) |
| 16 and 17 Years | 159 (21.5%) | 139 (21.4%) |
| 18 to 24 Years | 363 (15.5%) | 435 (22.1%) |
| 25 to 34 Years | 241 (7.8%) | 562 (17.3%) |
| 35 to 44 Years | 424 (13.0%) | 507 (15.1%) |
| 45 to 54 Years | 446 (12.9%) | 568 (16.1%) |
| 55 to 64 Years | 618 (16.2%) | 522 (13.3%) |
| 65 to 74 Years | 192 (6.5%) | 583 (17.3%) |
| 75 Years and over | 221 (11.8%) | 406 (18.7%) |
| Total | 3,648 (13.4%) | 5,015 (18.1%) |
Income Above Poverty by Sex and Age in Pearl River County
According to the poverty statistics in Pearl River County, males aged 5 years and females aged 5 years are the age groups that are most secure financially, with 96.4% of males and 89.0% of females in these age groups living above the poverty line.
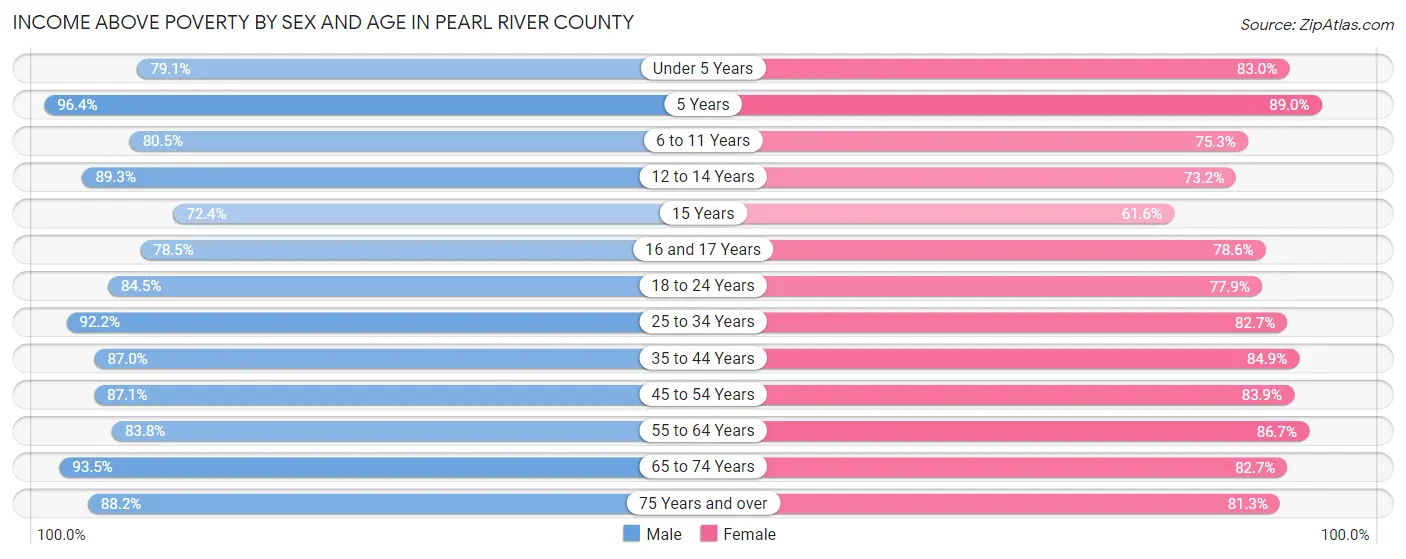
| Age Bracket | Male | Female |
| Under 5 Years | 1,333 (79.1%) | 1,231 (83.0%) |
| 5 Years | 344 (96.4%) | 186 (89.0%) |
| 6 to 11 Years | 1,678 (80.5%) | 1,775 (75.3%) |
| 12 to 14 Years | 1,138 (89.2%) | 878 (73.2%) |
| 15 Years | 194 (72.4%) | 183 (61.6%) |
| 16 and 17 Years | 581 (78.5%) | 511 (78.6%) |
| 18 to 24 Years | 1,981 (84.5%) | 1,537 (77.9%) |
| 25 to 34 Years | 2,844 (92.2%) | 2,679 (82.7%) |
| 35 to 44 Years | 2,844 (87.0%) | 2,841 (84.9%) |
| 45 to 54 Years | 3,010 (87.1%) | 2,959 (83.9%) |
| 55 to 64 Years | 3,191 (83.8%) | 3,394 (86.7%) |
| 65 to 74 Years | 2,775 (93.5%) | 2,781 (82.7%) |
| 75 Years and over | 1,659 (88.2%) | 1,763 (81.3%) |
| Total | 23,572 (86.6%) | 22,718 (81.9%) |
Income Below Poverty Among Married-Couple Families in Pearl River County
The poverty statistics for married-couple families in Pearl River County show that 4.7% or 512 of the total 10,795 families live below the poverty line. Families with 3 or 4 children have the highest poverty rate of 6.4%, comprising of 61 families. On the other hand, families with 5 or more children have the lowest poverty rate of 0.0%, which includes 0 families.
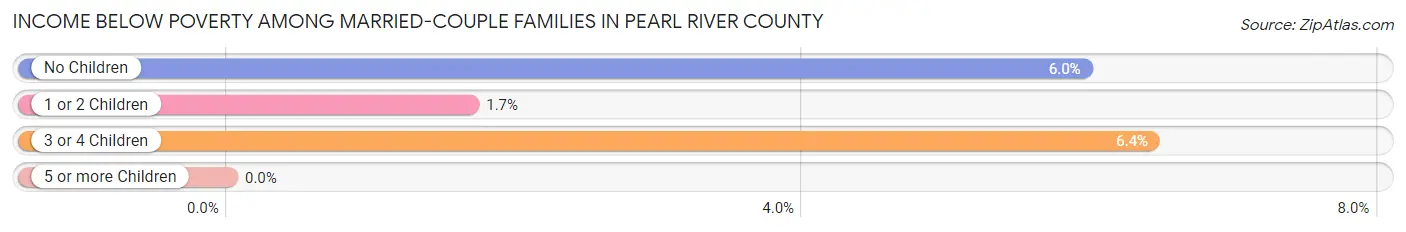
| Children | Above Poverty | Below Poverty |
| No Children | 6,287 (94.1%) | 398 (5.9%) |
| 1 or 2 Children | 3,096 (98.3%) | 53 (1.7%) |
| 3 or 4 Children | 889 (93.6%) | 61 (6.4%) |
| 5 or more Children | 11 (100.0%) | 0 (0.0%) |
| Total | 10,283 (95.3%) | 512 (4.7%) |
Income Below Poverty Among Single-Parent Households in Pearl River County
According to the poverty data in Pearl River County, 24.2% or 190 single-father households and 36.6% or 1,180 single-mother households are living below the poverty line. Among single-father households, those with 1 or 2 children have the highest poverty rate, with 171 households (34.5%) experiencing poverty. Likewise, among single-mother households, those with 3 or 4 children have the highest poverty rate, with 168 households (60.9%) falling below the poverty line.
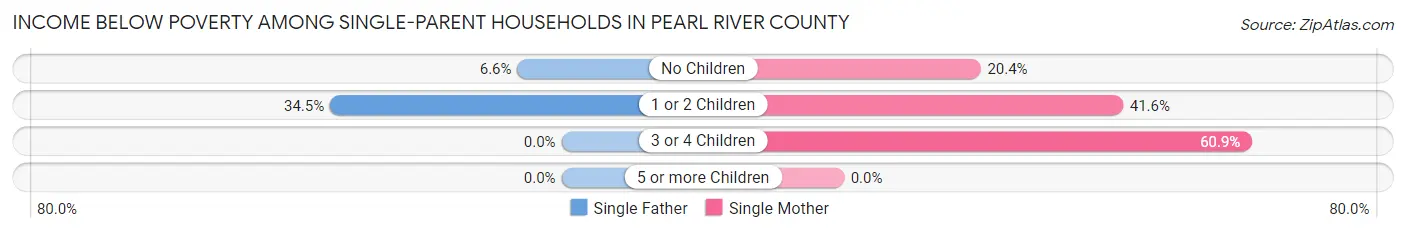
| Children | Single Father | Single Mother |
| No Children | 19 (6.6%) | 206 (20.4%) |
| 1 or 2 Children | 171 (34.5%) | 806 (41.6%) |
| 3 or 4 Children | 0 (0.0%) | 168 (60.9%) |
| 5 or more Children | 0 (0.0%) | 0 (0.0%) |
| Total | 190 (24.2%) | 1,180 (36.6%) |
Income Below Poverty Among Married-Couple vs Single-Parent Households in Pearl River County
The poverty data for Pearl River County shows that 512 of the married-couple family households (4.7%) and 1,370 of the single-parent households (34.2%) are living below the poverty level. Within the married-couple family households, those with 3 or 4 children have the highest poverty rate, with 61 households (6.4%) falling below the poverty line. Among the single-parent households, those with 3 or 4 children have the highest poverty rate, with 168 household (60.9%) living below poverty.
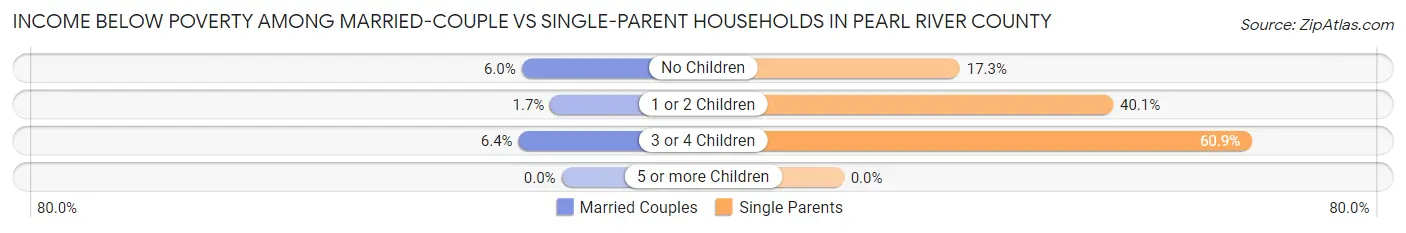
| Children | Married-Couple Families | Single-Parent Households |
| No Children | 398 (5.9%) | 225 (17.3%) |
| 1 or 2 Children | 53 (1.7%) | 977 (40.1%) |
| 3 or 4 Children | 61 (6.4%) | 168 (60.9%) |
| 5 or more Children | 0 (0.0%) | 0 (0.0%) |
| Total | 512 (4.7%) | 1,370 (34.2%) |
Race in Pearl River County
The most populous races in Pearl River County are White / Caucasian (46,047 | 81.7%), Black / African American (7,035 | 12.5%), and Two or more Races (1,951 | 3.5%).
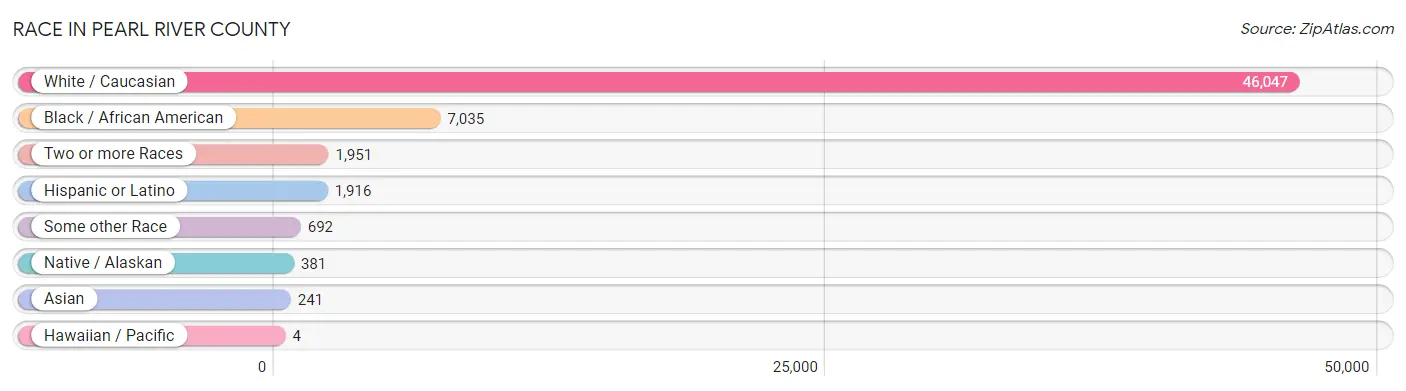
| Race | # Population | % Population |
| Asian | 241 | 0.4% |
| Black / African American | 7,035 | 12.5% |
| Hawaiian / Pacific | 4 | 0.0% |
| Hispanic or Latino | 1,916 | 3.4% |
| Native / Alaskan | 381 | 0.7% |
| White / Caucasian | 46,047 | 81.7% |
| Two or more Races | 1,951 | 3.5% |
| Some other Race | 692 | 1.2% |
| Total | 56,351 | 100.0% |
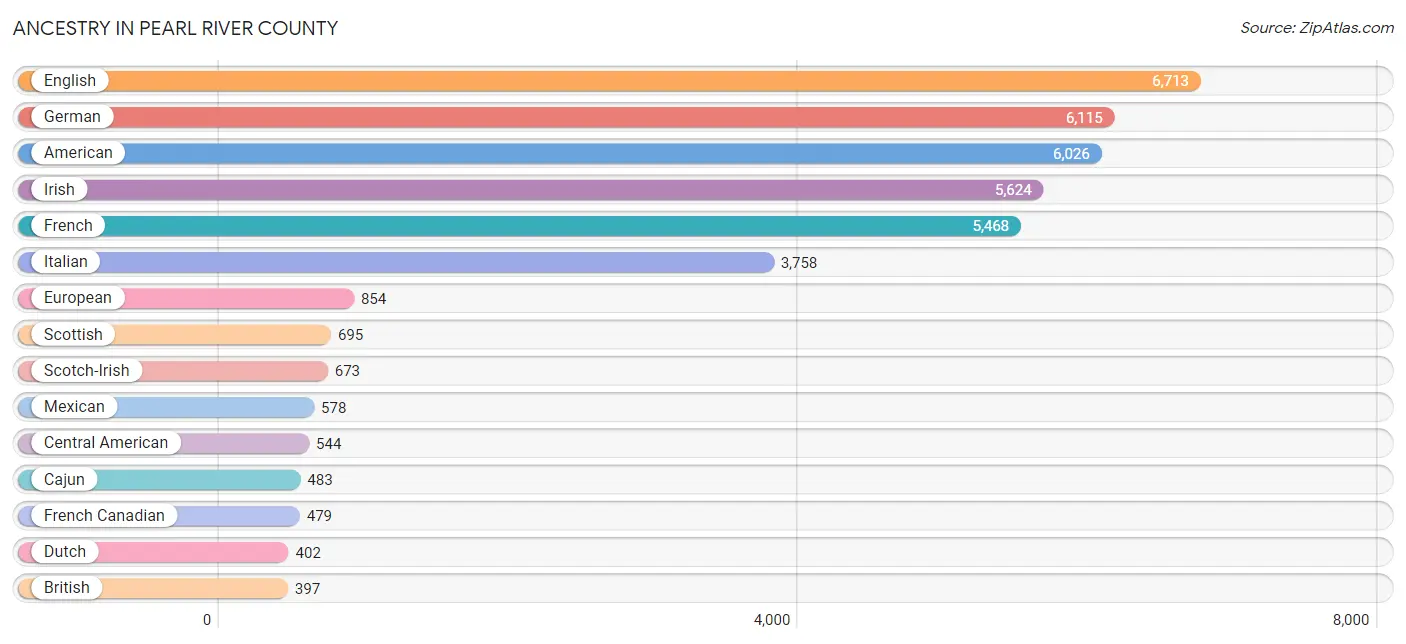
Ancestry in Pearl River County
The most populous ancestries reported in Pearl River County are English (6,713 | 11.9%), German (6,115 | 10.8%), American (6,026 | 10.7%), Irish (5,624 | 10.0%), and French (5,468 | 9.7%), together accounting for 53.1% of all Pearl River County residents.
| Ancestry | # Population | % Population |
| African | 352 | 0.6% |
| Albanian | 11 | 0.0% |
| American | 6,026 | 10.7% |
| Arab | 7 | 0.0% |
| Australian | 19 | 0.0% |
| Austrian | 33 | 0.1% |
| Basque | 45 | 0.1% |
| Belgian | 13 | 0.0% |
| Bhutanese | 42 | 0.1% |
| Brazilian | 23 | 0.0% |
| British | 397 | 0.7% |
| Cajun | 483 | 0.9% |
| Canadian | 33 | 0.1% |
| Celtic | 8 | 0.0% |
| Central American | 544 | 1.0% |
| Central American Indian | 202 | 0.4% |
| Cherokee | 158 | 0.3% |
| Chickasaw | 43 | 0.1% |
| Choctaw | 269 | 0.5% |
| Comanche | 5 | 0.0% |
| Cuban | 132 | 0.2% |
| Czech | 50 | 0.1% |
| Danish | 18 | 0.0% |
| Dutch | 402 | 0.7% |
| English | 6,713 | 11.9% |
| European | 854 | 1.5% |
| Finnish | 14 | 0.0% |
| French | 5,468 | 9.7% |
| French American Indian | 6 | 0.0% |
| French Canadian | 479 | 0.9% |
| German | 6,115 | 10.8% |
| Greek | 204 | 0.4% |
| Guatemalan | 120 | 0.2% |
| Haitian | 100 | 0.2% |
| Honduran | 281 | 0.5% |
| Houma | 38 | 0.1% |
| Indian (Asian) | 14 | 0.0% |
| Irish | 5,624 | 10.0% |
| Italian | 3,758 | 6.7% |
| Korean | 112 | 0.2% |
| Lebanese | 7 | 0.0% |
| Lithuanian | 4 | 0.0% |
| Mexican | 578 | 1.0% |
| Mexican American Indian | 27 | 0.1% |
| Native Hawaiian | 4 | 0.0% |
| Nicaraguan | 50 | 0.1% |
| Nigerian | 18 | 0.0% |
| Northern European | 26 | 0.1% |
| Norwegian | 279 | 0.5% |
| Panamanian | 87 | 0.2% |
| Pennsylvania German | 30 | 0.1% |
| Polish | 220 | 0.4% |
| Portuguese | 37 | 0.1% |
| Puerto Rican | 219 | 0.4% |
| Russian | 9 | 0.0% |
| Salvadoran | 6 | 0.0% |
| Scandinavian | 57 | 0.1% |
| Scotch-Irish | 673 | 1.2% |
| Scottish | 695 | 1.2% |
| Seminole | 6 | 0.0% |
| Serbian | 6 | 0.0% |
| Sioux | 11 | 0.0% |
| Slavic | 19 | 0.0% |
| Slovak | 11 | 0.0% |
| Spaniard | 189 | 0.3% |
| Spanish | 70 | 0.1% |
| Sri Lankan | 52 | 0.1% |
| Subsaharan African | 370 | 0.7% |
| Swedish | 238 | 0.4% |
| Swiss | 99 | 0.2% |
| Thai | 136 | 0.2% |
| Welsh | 174 | 0.3% |
| Yugoslavian | 30 | 0.1% | View All 73 Rows |
Immigrants in Pearl River County
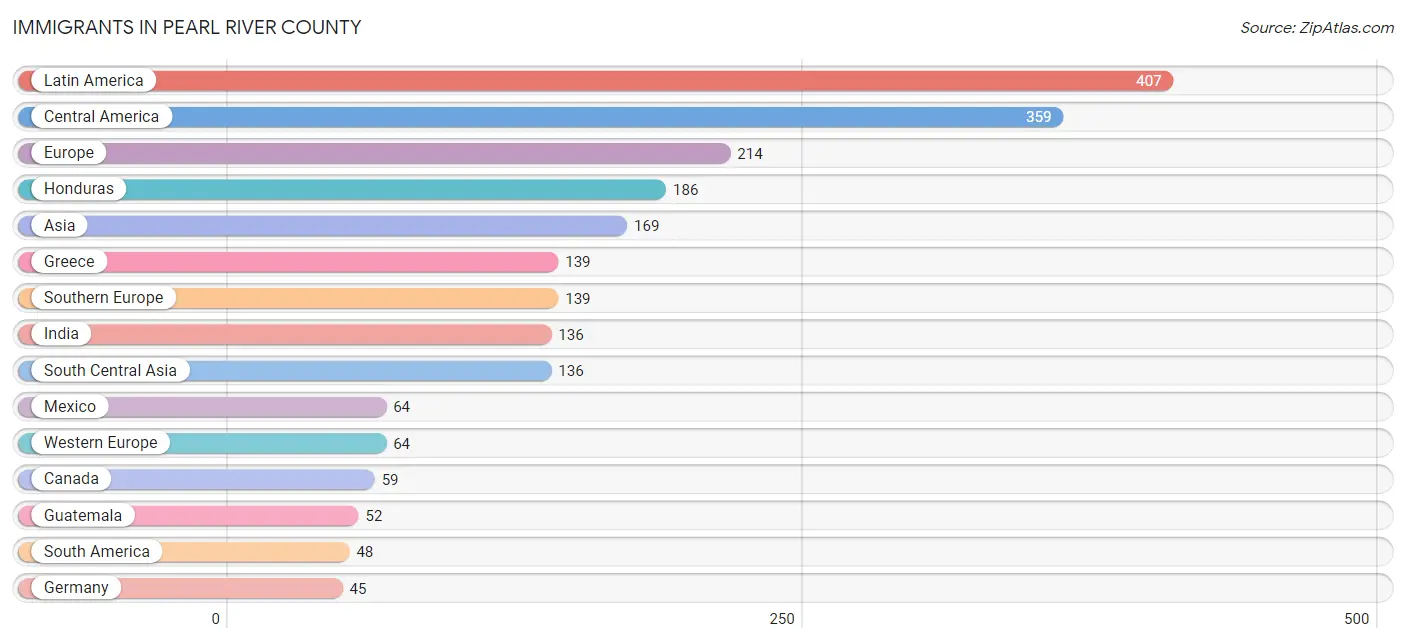
The most numerous immigrant groups reported in Pearl River County came from Latin America (407 | 0.7%), Central America (359 | 0.6%), Europe (214 | 0.4%), Honduras (186 | 0.3%), and Asia (169 | 0.3%), together accounting for 2.4% of all Pearl River County residents.
| Immigration Origin | # Population | % Population |
| Africa | 23 | 0.0% |
| Asia | 169 | 0.3% |
| Australia | 19 | 0.0% |
| Brazil | 6 | 0.0% |
| Cameroon | 23 | 0.0% |
| Canada | 59 | 0.1% |
| Central America | 359 | 0.6% |
| China | 12 | 0.0% |
| Colombia | 42 | 0.1% |
| Czechoslovakia | 4 | 0.0% |
| Eastern Asia | 12 | 0.0% |
| Eastern Europe | 4 | 0.0% |
| El Salvador | 6 | 0.0% |
| Europe | 214 | 0.4% |
| France | 7 | 0.0% |
| Germany | 45 | 0.1% |
| Greece | 139 | 0.3% |
| Guatemala | 52 | 0.1% |
| Honduras | 186 | 0.3% |
| India | 136 | 0.2% |
| Latin America | 407 | 0.7% |
| Mexico | 64 | 0.1% |
| Middle Africa | 23 | 0.0% |
| Netherlands | 12 | 0.0% |
| Nicaragua | 43 | 0.1% |
| Northern Europe | 7 | 0.0% |
| Oceania | 19 | 0.0% |
| Panama | 8 | 0.0% |
| Philippines | 21 | 0.0% |
| South America | 48 | 0.1% |
| South Central Asia | 136 | 0.2% |
| South Eastern Asia | 21 | 0.0% |
| Southern Europe | 139 | 0.3% |
| Western Europe | 64 | 0.1% | View All 34 Rows |
Sex and Age in Pearl River County
Sex and Age in Pearl River County
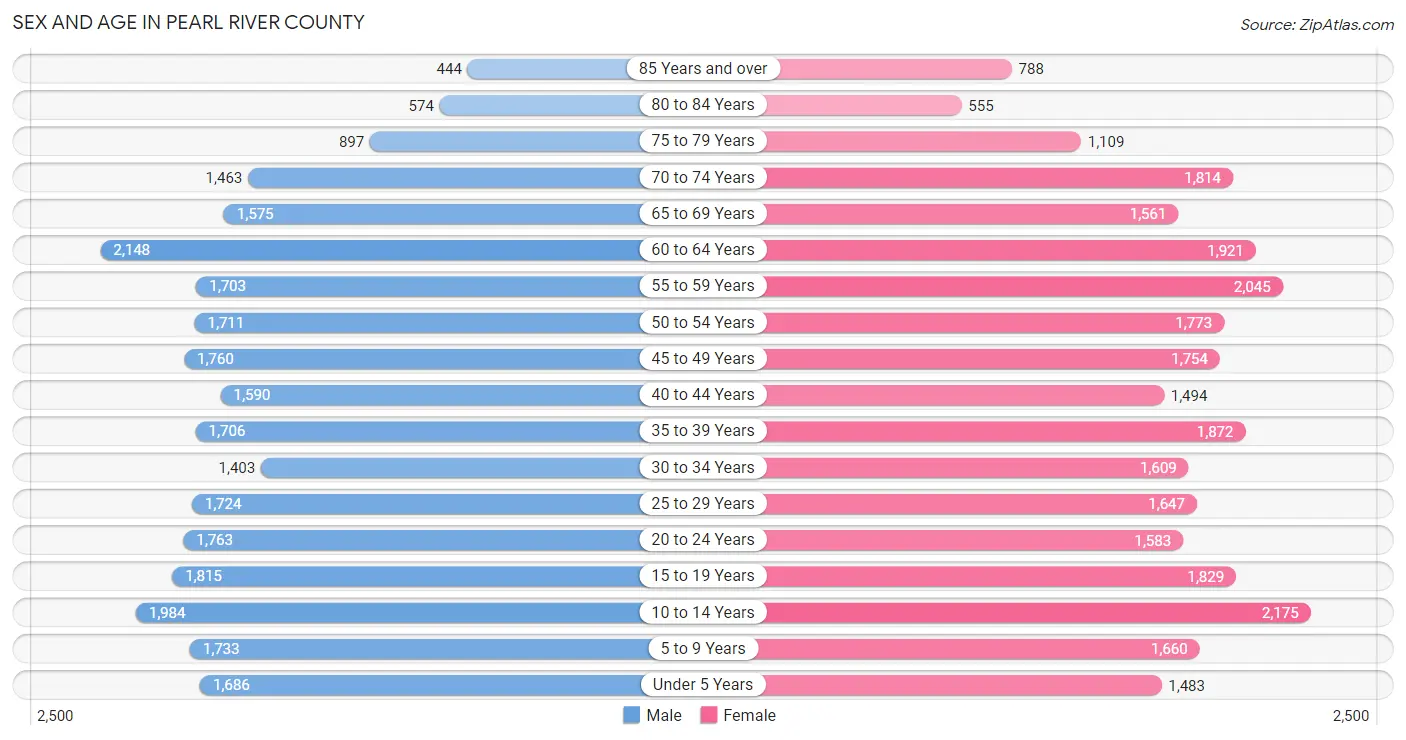
The most populous age groups in Pearl River County are 60 to 64 Years (2,148 | 7.8%) for men and 10 to 14 Years (2,175 | 7.6%) for women.
| Age Bracket | Male | Female |
| Under 5 Years | 1,686 (6.1%) | 1,483 (5.2%) |
| 5 to 9 Years | 1,733 (6.3%) | 1,660 (5.8%) |
| 10 to 14 Years | 1,984 (7.2%) | 2,175 (7.6%) |
| 15 to 19 Years | 1,815 (6.6%) | 1,829 (6.4%) |
| 20 to 24 Years | 1,763 (6.4%) | 1,583 (5.5%) |
| 25 to 29 Years | 1,724 (6.2%) | 1,647 (5.7%) |
| 30 to 34 Years | 1,403 (5.1%) | 1,609 (5.6%) |
| 35 to 39 Years | 1,706 (6.2%) | 1,872 (6.5%) |
| 40 to 44 Years | 1,590 (5.7%) | 1,494 (5.2%) |
| 45 to 49 Years | 1,760 (6.4%) | 1,754 (6.1%) |
| 50 to 54 Years | 1,711 (6.2%) | 1,773 (6.2%) |
| 55 to 59 Years | 1,703 (6.1%) | 2,045 (7.1%) |
| 60 to 64 Years | 2,148 (7.8%) | 1,921 (6.7%) |
| 65 to 69 Years | 1,575 (5.7%) | 1,561 (5.4%) |
| 70 to 74 Years | 1,463 (5.3%) | 1,814 (6.3%) |
| 75 to 79 Years | 897 (3.2%) | 1,109 (3.9%) |
| 80 to 84 Years | 574 (2.1%) | 555 (1.9%) |
| 85 Years and over | 444 (1.6%) | 788 (2.8%) |
| Total | 27,679 (100.0%) | 28,672 (100.0%) |
Families and Households in Pearl River County
Median Family Size in Pearl River County
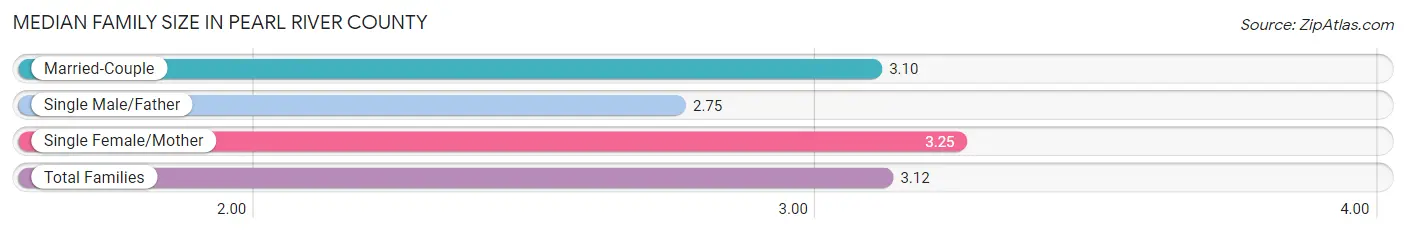
The median family size in Pearl River County is 3.12 persons per family, with single female/mother families (3,225 | 21.8%) accounting for the largest median family size of 3.25 persons per family. On the other hand, single male/father families (785 | 5.3%) represent the smallest median family size with 2.75 persons per family.
| Family Type | # Families | Family Size |
| Married-Couple | 10,795 (72.9%) | 3.10 |
| Single Male/Father | 785 (5.3%) | 2.75 |
| Single Female/Mother | 3,225 (21.8%) | 3.25 |
| Total Families | 14,805 (100.0%) | 3.12 |
Median Household Size in Pearl River County
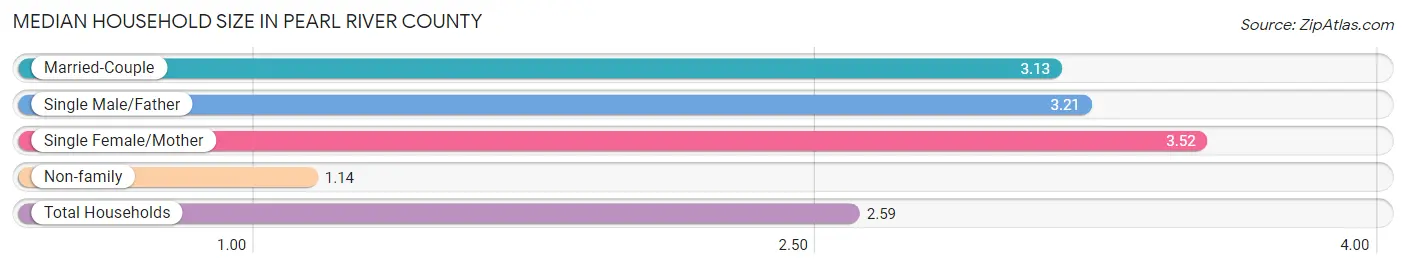
The median household size in Pearl River County is 2.59 persons per household, with single female/mother households (3,225 | 15.2%) accounting for the largest median household size of 3.52 persons per household. non-family households (6,383 | 30.1%) represent the smallest median household size with 1.14 persons per household.
| Household Type | # Households | Household Size |
| Married-Couple | 10,795 (50.9%) | 3.13 |
| Single Male/Father | 785 (3.7%) | 3.21 |
| Single Female/Mother | 3,225 (15.2%) | 3.52 |
| Non-family | 6,383 (30.1%) | 1.14 |
| Total Households | 21,188 (100.0%) | 2.59 |
Household Size by Marriage Status in Pearl River County
Out of a total of 21,188 households in Pearl River County, 14,805 (69.9%) are family households, while 6,383 (30.1%) are nonfamily households. The most numerous type of family households are 2-person households, comprising 6,982, and the most common type of nonfamily households are 1-person households, comprising 5,615.
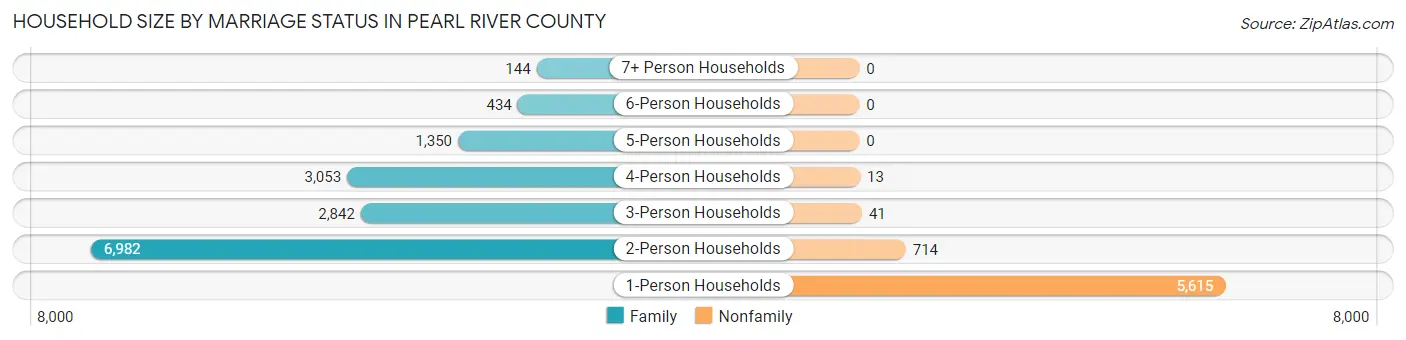
| Household Size | Family Households | Nonfamily Households |
| 1-Person Households | - | 5,615 (26.5%) |
| 2-Person Households | 6,982 (33.0%) | 714 (3.4%) |
| 3-Person Households | 2,842 (13.4%) | 41 (0.2%) |
| 4-Person Households | 3,053 (14.4%) | 13 (0.1%) |
| 5-Person Households | 1,350 (6.4%) | 0 (0.0%) |
| 6-Person Households | 434 (2.1%) | 0 (0.0%) |
| 7+ Person Households | 144 (0.7%) | 0 (0.0%) |
| Total | 14,805 (69.9%) | 6,383 (30.1%) |
Female Fertility in Pearl River County
Fertility by Age in Pearl River County
Average fertility rate in Pearl River County is 62.0 births per 1,000 women. Women in the age bracket of 20 to 34 years have the highest fertility rate with 113.0 births per 1,000 women. Women in the age bracket of 20 to 34 years acount for 72.7% of all women with births.
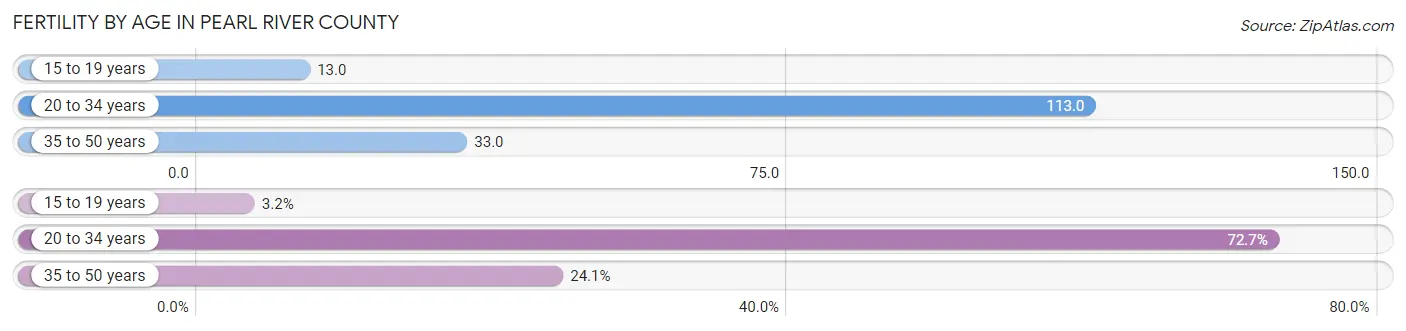
| Age Bracket | Women with Births | Births / 1,000 Women |
| 15 to 19 years | 24 (3.2%) | 13.0 |
| 20 to 34 years | 549 (72.7%) | 113.0 |
| 35 to 50 years | 182 (24.1%) | 33.0 |
| Total | 755 (100.0%) | 62.0 |
Fertility by Age by Marriage Status in Pearl River County
67.7% of women with births (755) in Pearl River County are married. The highest percentage of unmarried women with births falls into 15 to 19 years age bracket with 100.0% of them unmarried at the time of birth, while the lowest percentage of unmarried women with births belong to 35 to 50 years age bracket with 0.0% of them unmarried.
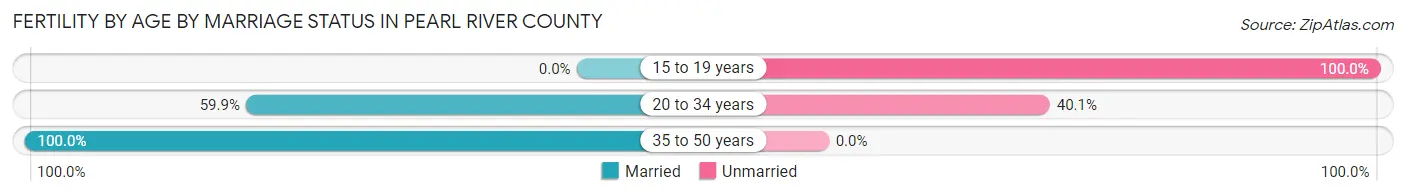
| Age Bracket | Married | Unmarried |
| 15 to 19 years | 0 (0.0%) | 24 (100.0%) |
| 20 to 34 years | 329 (59.9%) | 220 (40.1%) |
| 35 to 50 years | 182 (100.0%) | 0 (0.0%) |
| Total | 511 (67.7%) | 244 (32.3%) |
Fertility by Education in Pearl River County
Average fertility rate in Pearl River County is 62.0 births per 1,000 women. Women with the education attainment of bachelor's degree have the highest fertility rate of 100.0 births per 1,000 women, while women with the education attainment of graduate degree have the lowest fertility at 24.0 births per 1,000 women. Women with the education attainment of college or associate's degree represent 37.1% of all women with births.
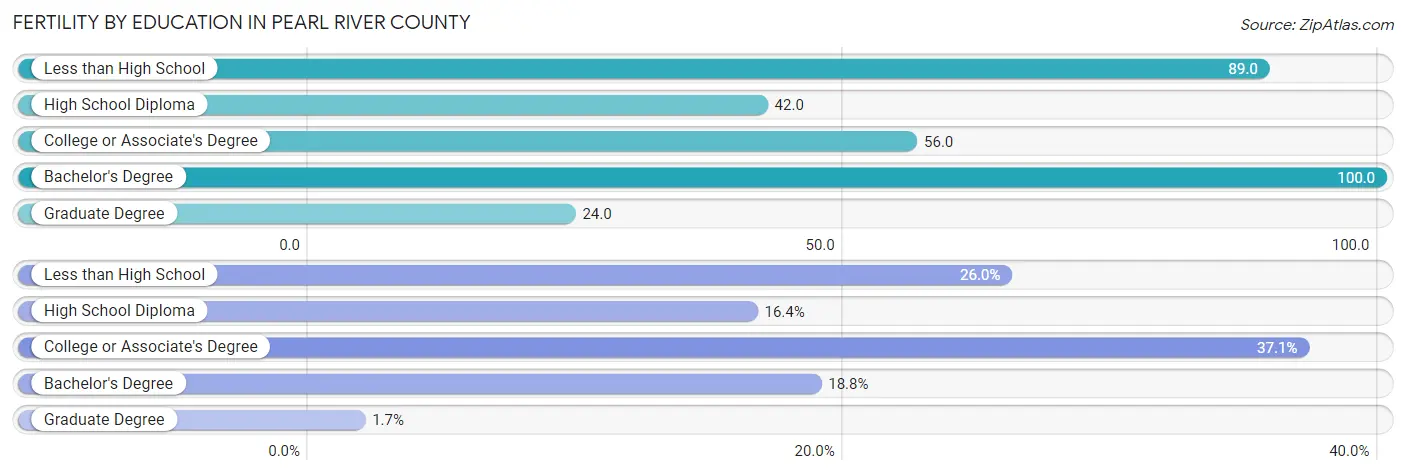
| Educational Attainment | Women with Births | Births / 1,000 Women |
| Less than High School | 196 (26.0%) | 89.0 |
| High School Diploma | 124 (16.4%) | 42.0 |
| College or Associate's Degree | 280 (37.1%) | 56.0 |
| Bachelor's Degree | 142 (18.8%) | 100.0 |
| Graduate Degree | 13 (1.7%) | 24.0 |
| Total | 755 (100.0%) | 62.0 |
Fertility by Education by Marriage Status in Pearl River County
32.3% of women with births in Pearl River County are unmarried. Women with the educational attainment of graduate degree are most likely to be married with 100.0% of them married at childbirth, while women with the educational attainment of high school diploma are least likely to be married with 51.6% of them unmarried at childbirth.
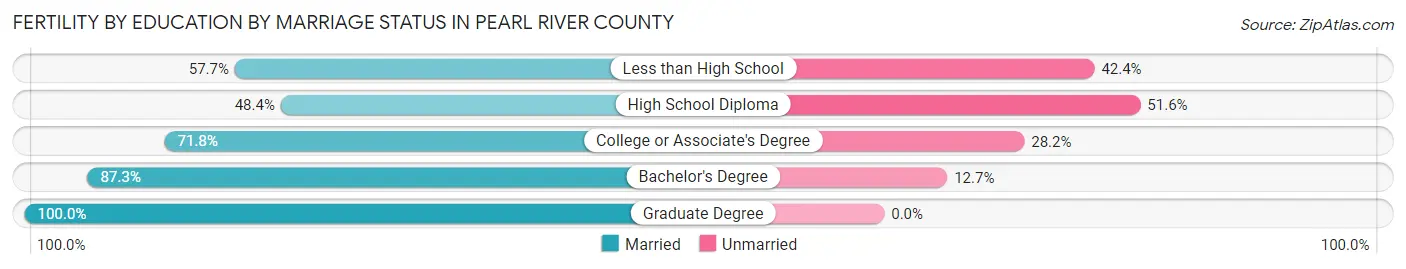
| Educational Attainment | Married | Unmarried |
| Less than High School | 113 (57.7%) | 83 (42.3%) |
| High School Diploma | 60 (48.4%) | 64 (51.6%) |
| College or Associate's Degree | 201 (71.8%) | 79 (28.2%) |
| Bachelor's Degree | 124 (87.3%) | 18 (12.7%) |
| Graduate Degree | 13 (100.0%) | 0 (0.0%) |
| Total | 511 (67.7%) | 244 (32.3%) |
Employment Characteristics in Pearl River County
Employment by Class of Employer in Pearl River County
Among the 22,433 employed individuals in Pearl River County, private company employees (15,916 | 71.0%), self-employed (not incorporated) (1,698 | 7.6%), and local government employees (1,231 | 5.5%) make up the most common classes of employment.
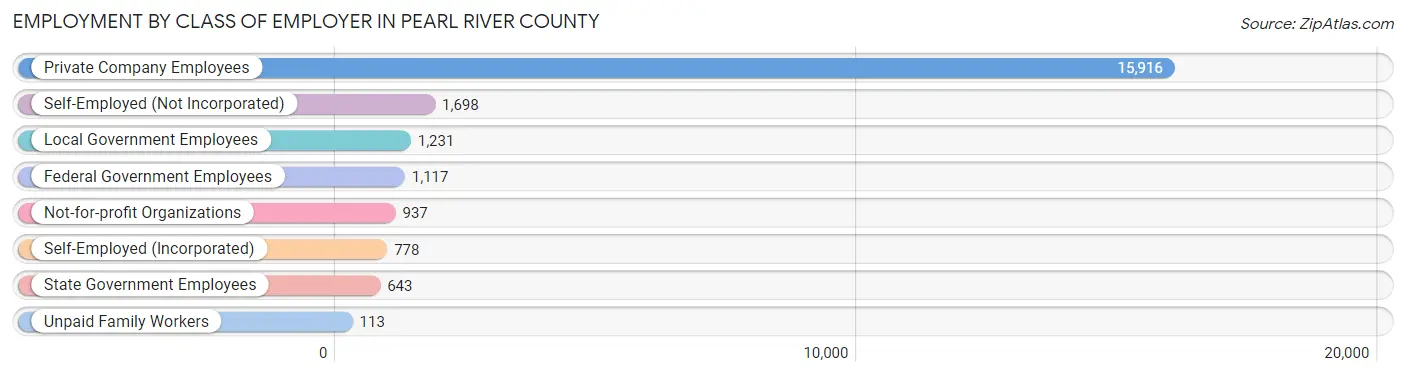
| Employer Class | # Employees | % Employees |
| Private Company Employees | 15,916 | 71.0% |
| Self-Employed (Incorporated) | 778 | 3.5% |
| Self-Employed (Not Incorporated) | 1,698 | 7.6% |
| Not-for-profit Organizations | 937 | 4.2% |
| Local Government Employees | 1,231 | 5.5% |
| State Government Employees | 643 | 2.9% |
| Federal Government Employees | 1,117 | 5.0% |
| Unpaid Family Workers | 113 | 0.5% |
| Total | 22,433 | 100.0% |
Employment Status by Age in Pearl River County
According to the labor force statistics for Pearl River County, out of the total population over 16 years of age (45,065), 54.5% or 24,560 individuals are in the labor force, with 5.6% or 1,375 of them unemployed. The age group with the highest labor force participation rate is 35 to 44 years, with 84.1% or 5,603 individuals in the labor force. Within the labor force, the 75 years and over age range has the highest percentage of unemployed individuals, with 29.0% or 79 of them being unemployed.
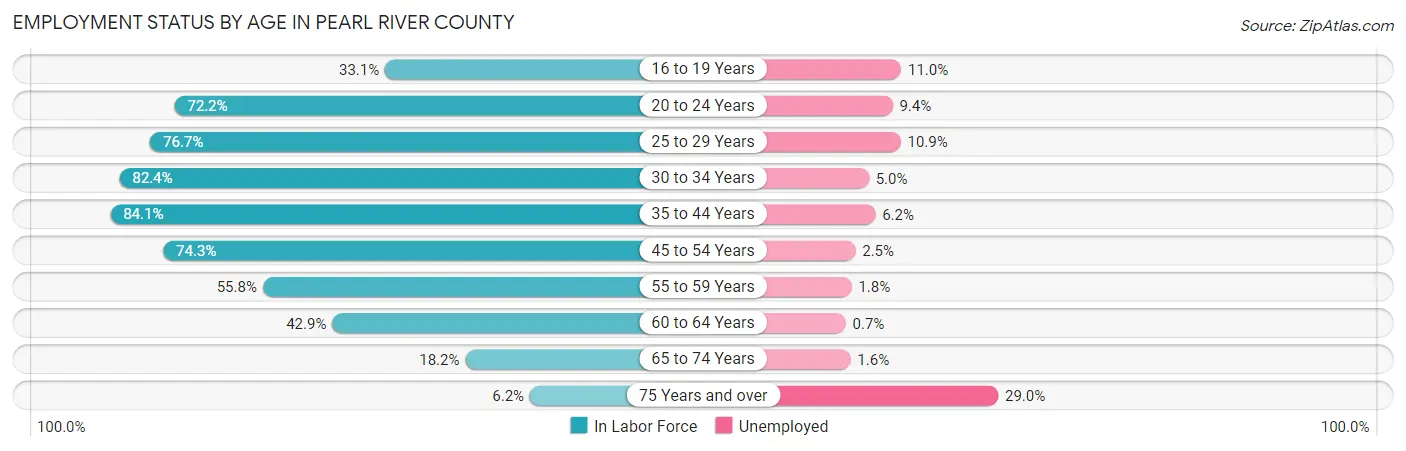
| Age Bracket | In Labor Force | Unemployed |
| 16 to 19 Years | 1,019 (33.1%) | 112 (11.0%) |
| 20 to 24 Years | 2,416 (72.2%) | 227 (9.4%) |
| 25 to 29 Years | 2,586 (76.7%) | 282 (10.9%) |
| 30 to 34 Years | 2,482 (82.4%) | 124 (5.0%) |
| 35 to 44 Years | 5,603 (84.1%) | 347 (6.2%) |
| 45 to 54 Years | 5,200 (74.3%) | 130 (2.5%) |
| 55 to 59 Years | 2,091 (55.8%) | 38 (1.8%) |
| 60 to 64 Years | 1,746 (42.9%) | 12 (0.7%) |
| 65 to 74 Years | 1,167 (18.2%) | 19 (1.6%) |
| 75 Years and over | 271 (6.2%) | 79 (29.0%) |
| Total | 24,560 (54.5%) | 1,375 (5.6%) |
Employment Status by Educational Attainment in Pearl River County
According to labor force statistics for Pearl River County, 70.8% of individuals (19,725) out of the total population between 25 and 64 years of age (27,860) are in the labor force, with 4.7% or 927 of them being unemployed. The group with the highest labor force participation rate are those with the educational attainment of bachelor's degree or higher, with 80.8% or 3,846 individuals in the labor force. Within the labor force, individuals with less than high school education have the highest percentage of unemployment, with 9.3% or 165 of them being unemployed.
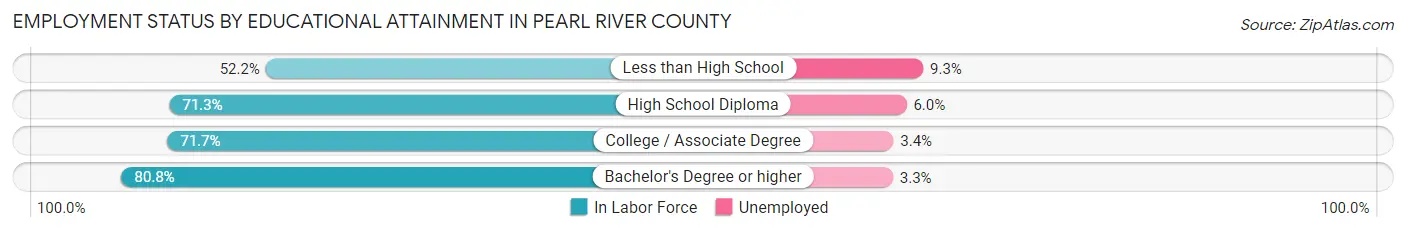
| Educational Attainment | In Labor Force | Unemployed |
| Less than High School | 1,771 (52.2%) | 316 (9.3%) |
| High School Diploma | 6,463 (71.3%) | 544 (6.0%) |
| College / Associate Degree | 7,631 (71.7%) | 362 (3.4%) |
| Bachelor's Degree or higher | 3,846 (80.8%) | 157 (3.3%) |
| Total | 19,725 (70.8%) | 1,309 (4.7%) |
Employment Occupations by Sex in Pearl River County
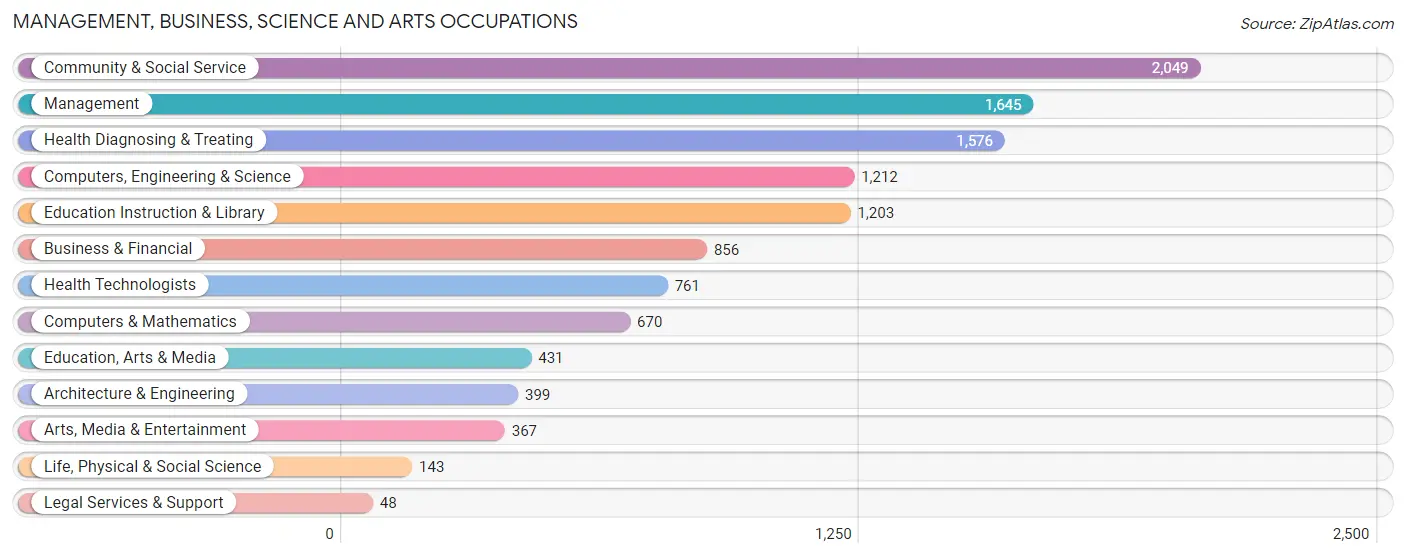
Management, Business, Science and Arts Occupations
The most common Management, Business, Science and Arts occupations in Pearl River County are Community & Social Service (2,049 | 8.8%), Management (1,645 | 7.1%), Health Diagnosing & Treating (1,576 | 6.8%), Computers, Engineering & Science (1,212 | 5.2%), and Education Instruction & Library (1,203 | 5.2%).
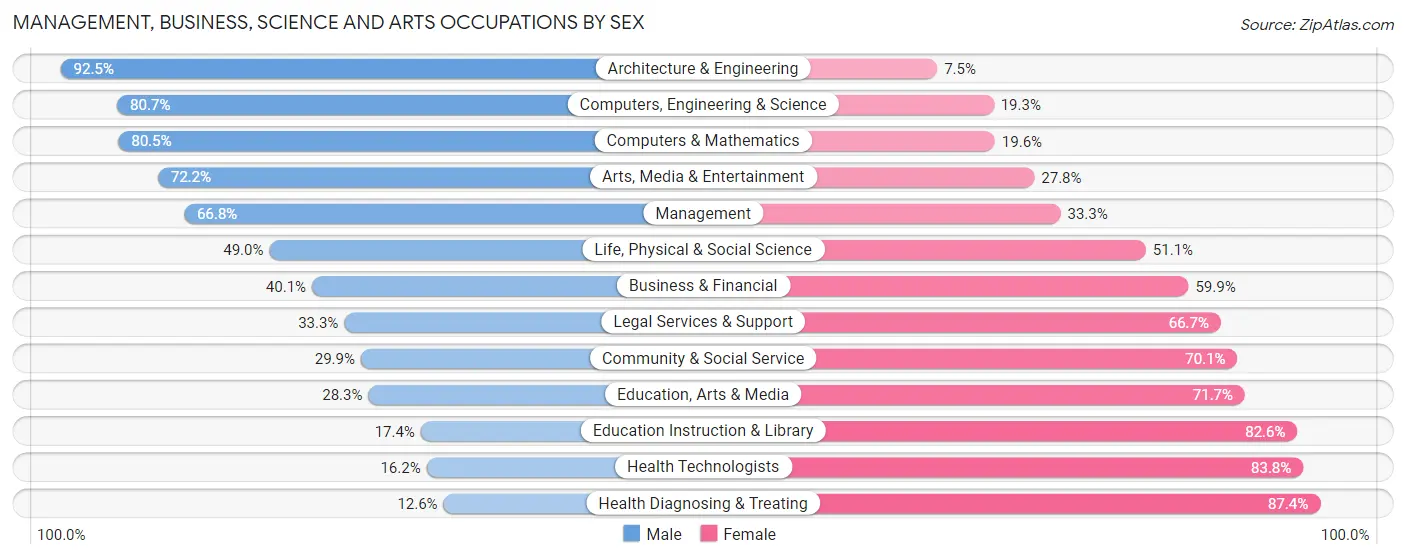
Management, Business, Science and Arts Occupations by Sex
Within the Management, Business, Science and Arts occupations in Pearl River County, the most male-oriented occupations are Architecture & Engineering (92.5%), Computers, Engineering & Science (80.7%), and Computers & Mathematics (80.4%), while the most female-oriented occupations are Health Diagnosing & Treating (87.4%), Health Technologists (83.8%), and Education Instruction & Library (82.6%).
| Occupation | Male | Female |
| Management | 1,098 (66.7%) | 547 (33.3%) |
| Business & Financial | 343 (40.1%) | 513 (59.9%) |
| Computers, Engineering & Science | 978 (80.7%) | 234 (19.3%) |
| Computers & Mathematics | 539 (80.4%) | 131 (19.6%) |
| Architecture & Engineering | 369 (92.5%) | 30 (7.5%) |
| Life, Physical & Social Science | 70 (48.9%) | 73 (51.0%) |
| Community & Social Service | 612 (29.9%) | 1,437 (70.1%) |
| Education, Arts & Media | 122 (28.3%) | 309 (71.7%) |
| Legal Services & Support | 16 (33.3%) | 32 (66.7%) |
| Education Instruction & Library | 209 (17.4%) | 994 (82.6%) |
| Arts, Media & Entertainment | 265 (72.2%) | 102 (27.8%) |
| Health Diagnosing & Treating | 199 (12.6%) | 1,377 (87.4%) |
| Health Technologists | 123 (16.2%) | 638 (83.8%) |
| Total (Category) | 3,230 (44.0%) | 4,108 (56.0%) |
| Total (Overall) | 12,986 (55.9%) | 10,224 (44.1%) |
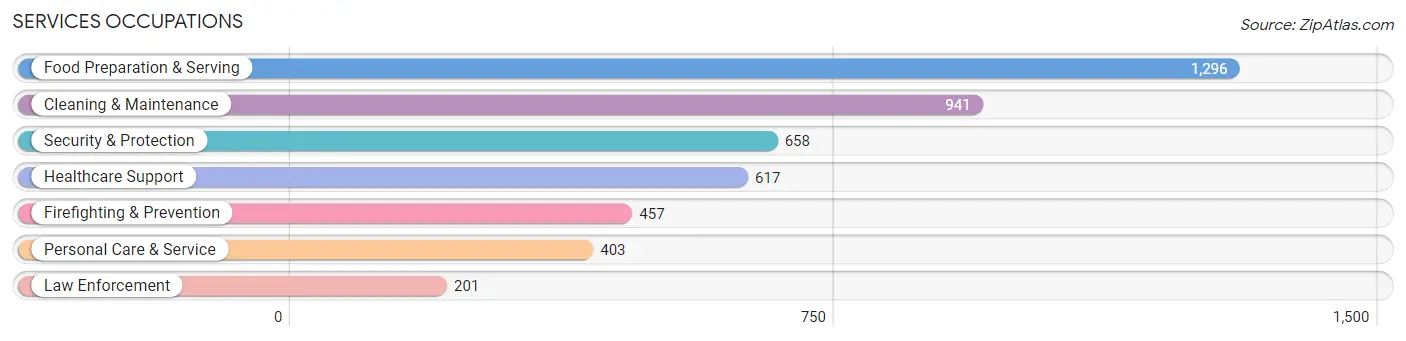
Services Occupations
The most common Services occupations in Pearl River County are Food Preparation & Serving (1,296 | 5.6%), Cleaning & Maintenance (941 | 4.1%), Security & Protection (658 | 2.8%), Healthcare Support (617 | 2.7%), and Firefighting & Prevention (457 | 2.0%).
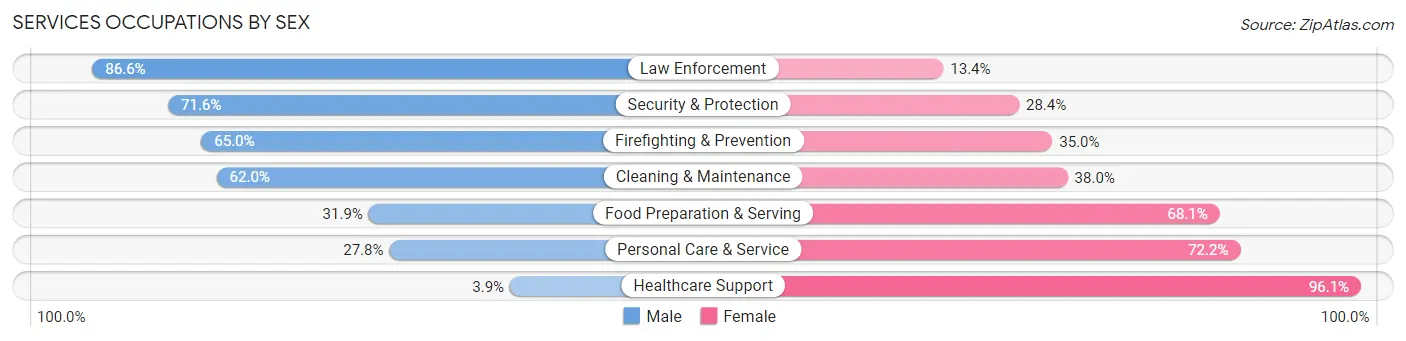
Services Occupations by Sex
Within the Services occupations in Pearl River County, the most male-oriented occupations are Law Enforcement (86.6%), Security & Protection (71.6%), and Firefighting & Prevention (65.0%), while the most female-oriented occupations are Healthcare Support (96.1%), Personal Care & Service (72.2%), and Food Preparation & Serving (68.1%).
| Occupation | Male | Female |
| Healthcare Support | 24 (3.9%) | 593 (96.1%) |
| Security & Protection | 471 (71.6%) | 187 (28.4%) |
| Firefighting & Prevention | 297 (65.0%) | 160 (35.0%) |
| Law Enforcement | 174 (86.6%) | 27 (13.4%) |
| Food Preparation & Serving | 413 (31.9%) | 883 (68.1%) |
| Cleaning & Maintenance | 583 (62.0%) | 358 (38.0%) |
| Personal Care & Service | 112 (27.8%) | 291 (72.2%) |
| Total (Category) | 1,603 (40.9%) | 2,312 (59.1%) |
| Total (Overall) | 12,986 (55.9%) | 10,224 (44.1%) |
Sales and Office Occupations
The most common Sales and Office occupations in Pearl River County are Office & Administration (2,349 | 10.1%), and Sales & Related (2,282 | 9.8%).
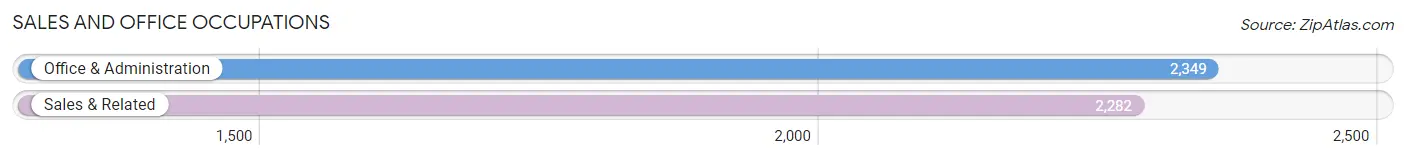
Sales and Office Occupations by Sex
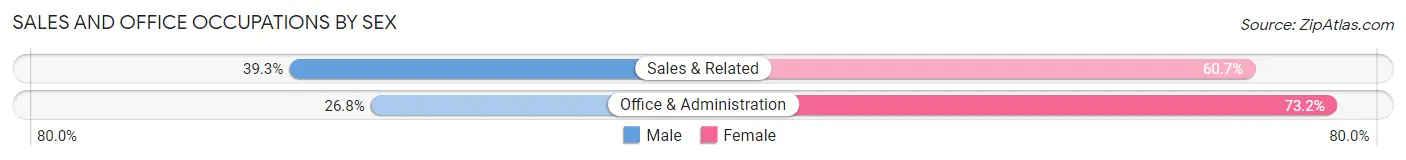
| Occupation | Male | Female |
| Sales & Related | 897 (39.3%) | 1,385 (60.7%) |
| Office & Administration | 629 (26.8%) | 1,720 (73.2%) |
| Total (Category) | 1,526 (33.0%) | 3,105 (67.0%) |
| Total (Overall) | 12,986 (55.9%) | 10,224 (44.1%) |
Natural Resources, Construction and Maintenance Occupations
The most common Natural Resources, Construction and Maintenance occupations in Pearl River County are Construction & Extraction (1,626 | 7.0%), Installation, Maintenance & Repair (1,277 | 5.5%), and Farming, Fishing & Forestry (29 | 0.1%).
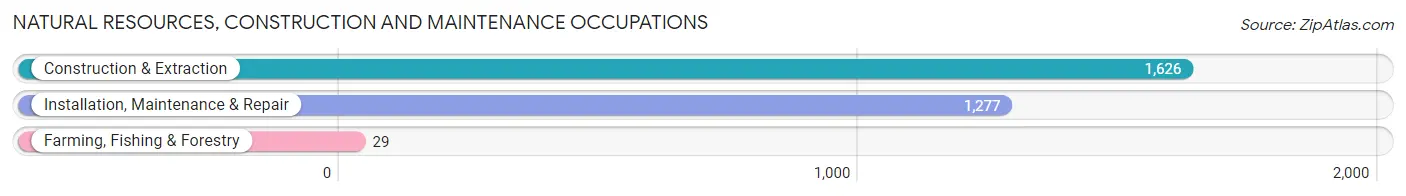
Natural Resources, Construction and Maintenance Occupations by Sex
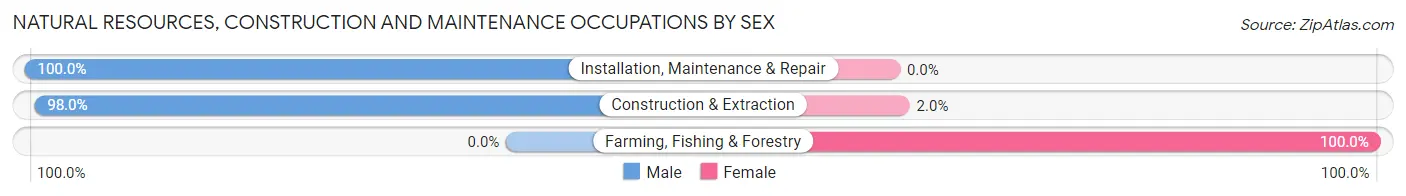
| Occupation | Male | Female |
| Farming, Fishing & Forestry | 0 (0.0%) | 29 (100.0%) |
| Construction & Extraction | 1,593 (98.0%) | 33 (2.0%) |
| Installation, Maintenance & Repair | 1,277 (100.0%) | 0 (0.0%) |
| Total (Category) | 2,870 (97.9%) | 62 (2.1%) |
| Total (Overall) | 12,986 (55.9%) | 10,224 (44.1%) |
Production, Transportation and Moving Occupations
The most common Production, Transportation and Moving occupations in Pearl River County are Production (1,520 | 6.6%), Transportation (1,459 | 6.3%), and Material Moving (1,415 | 6.1%).
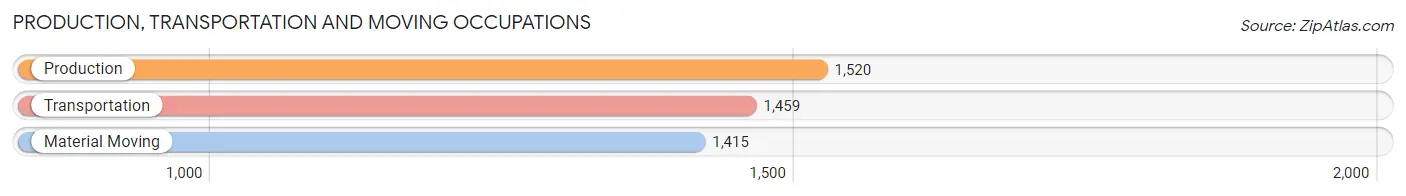
Production, Transportation and Moving Occupations by Sex
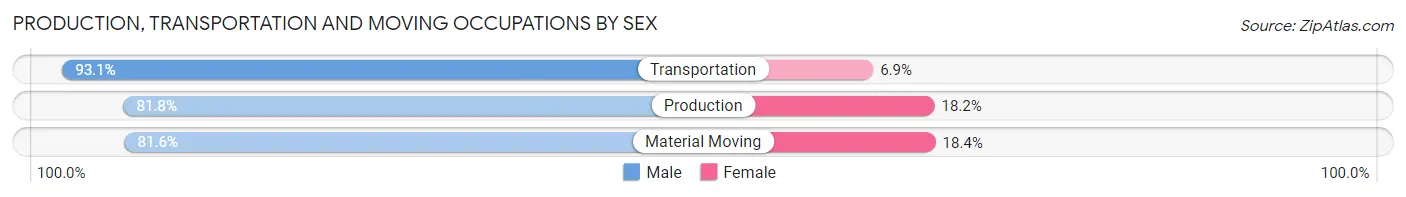
| Occupation | Male | Female |
| Production | 1,244 (81.8%) | 276 (18.2%) |
| Transportation | 1,358 (93.1%) | 101 (6.9%) |
| Material Moving | 1,155 (81.6%) | 260 (18.4%) |
| Total (Category) | 3,757 (85.5%) | 637 (14.5%) |
| Total (Overall) | 12,986 (55.9%) | 10,224 (44.1%) |
Employment Industries by Sex in Pearl River County
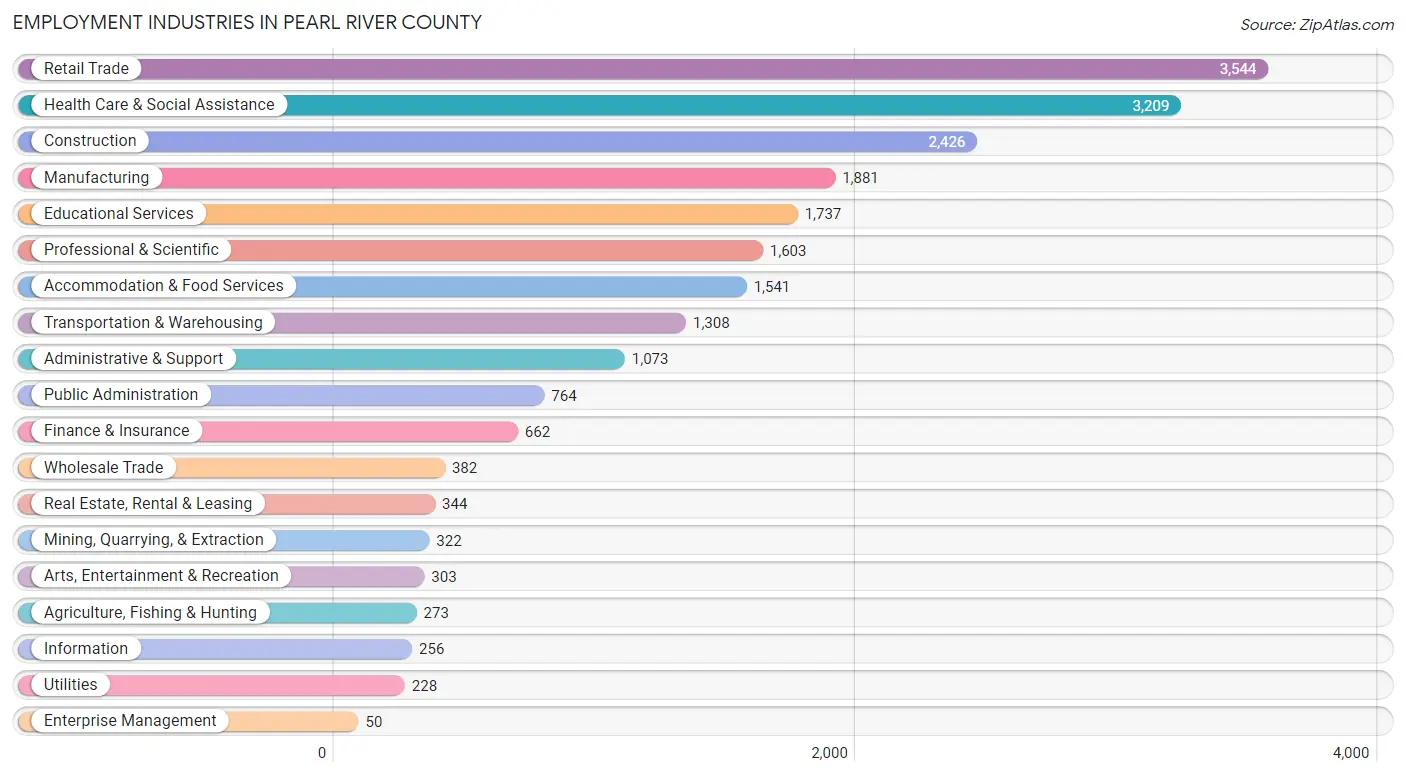
Employment Industries in Pearl River County
The major employment industries in Pearl River County include Retail Trade (3,544 | 15.3%), Health Care & Social Assistance (3,209 | 13.8%), Construction (2,426 | 10.4%), Manufacturing (1,881 | 8.1%), and Educational Services (1,737 | 7.5%).
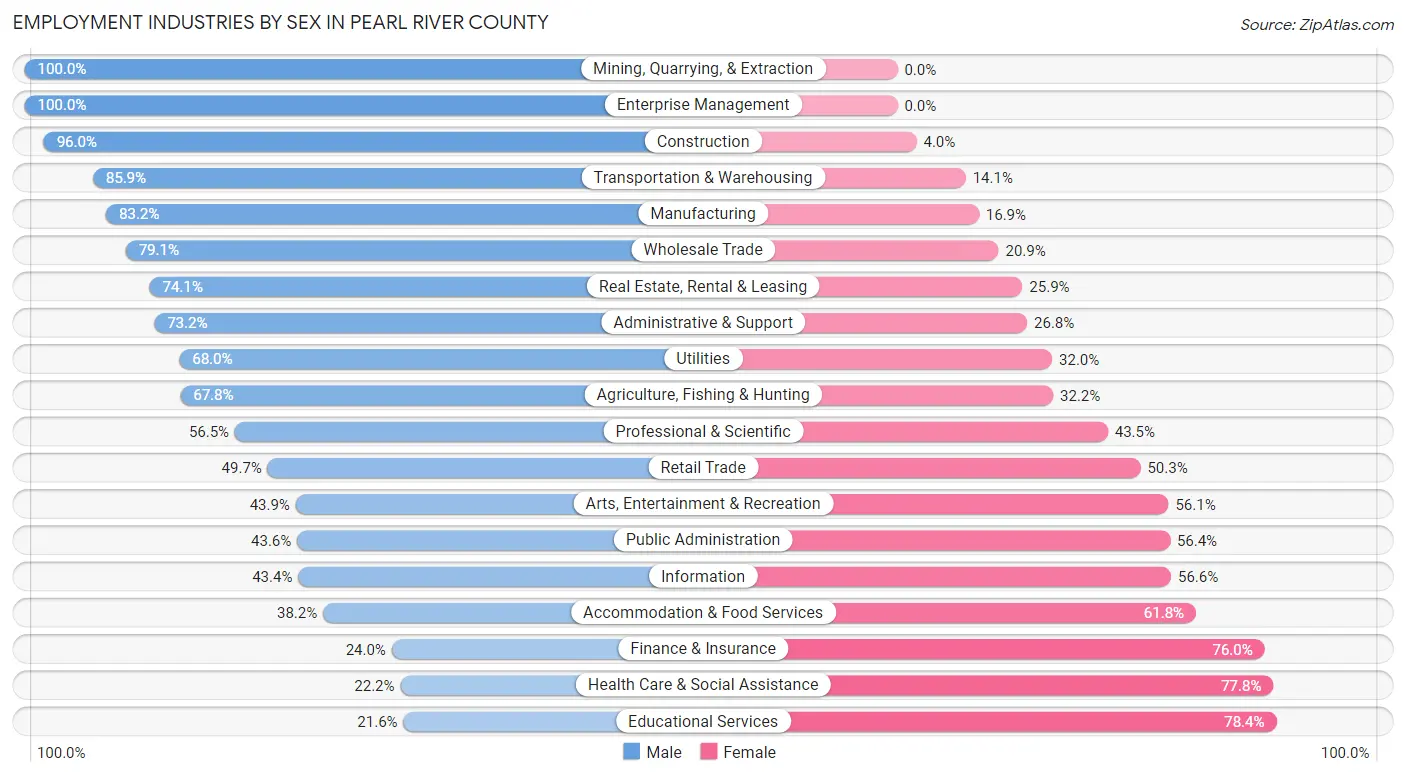
Employment Industries by Sex in Pearl River County
The Pearl River County industries that see more men than women are Mining, Quarrying, & Extraction (100.0%), Enterprise Management (100.0%), and Construction (96.0%), whereas the industries that tend to have a higher number of women are Educational Services (78.4%), Health Care & Social Assistance (77.8%), and Finance & Insurance (76.0%).
| Industry | Male | Female |
| Agriculture, Fishing & Hunting | 185 (67.8%) | 88 (32.2%) |
| Mining, Quarrying, & Extraction | 322 (100.0%) | 0 (0.0%) |
| Construction | 2,330 (96.0%) | 96 (4.0%) |
| Manufacturing | 1,564 (83.2%) | 317 (16.9%) |
| Wholesale Trade | 302 (79.1%) | 80 (20.9%) |
| Retail Trade | 1,761 (49.7%) | 1,783 (50.3%) |
| Transportation & Warehousing | 1,123 (85.9%) | 185 (14.1%) |
| Utilities | 155 (68.0%) | 73 (32.0%) |
| Information | 111 (43.4%) | 145 (56.6%) |
| Finance & Insurance | 159 (24.0%) | 503 (76.0%) |
| Real Estate, Rental & Leasing | 255 (74.1%) | 89 (25.9%) |
| Professional & Scientific | 905 (56.5%) | 698 (43.5%) |
| Enterprise Management | 50 (100.0%) | 0 (0.0%) |
| Administrative & Support | 785 (73.2%) | 288 (26.8%) |
| Educational Services | 375 (21.6%) | 1,362 (78.4%) |
| Health Care & Social Assistance | 713 (22.2%) | 2,496 (77.8%) |
| Arts, Entertainment & Recreation | 133 (43.9%) | 170 (56.1%) |
| Accommodation & Food Services | 589 (38.2%) | 952 (61.8%) |
| Public Administration | 333 (43.6%) | 431 (56.4%) |
| Total | 12,986 (55.9%) | 10,224 (44.1%) |
Education in Pearl River County
School Enrollment in Pearl River County
The most common levels of schooling among the 12,607 students in Pearl River County are middle school (3,239 | 25.7%), elementary school (2,773 | 22.0%), and high school (2,741 | 21.7%).
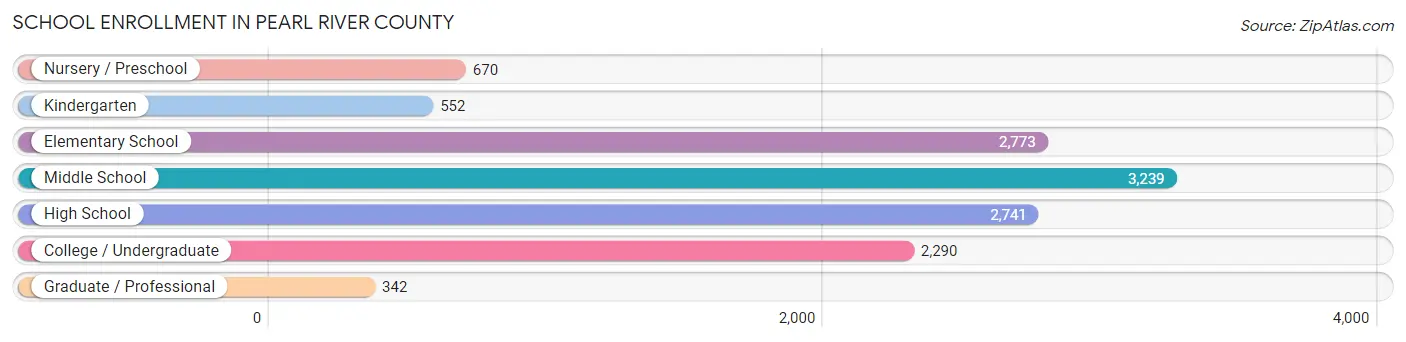
| School Level | # Students | % Students |
| Nursery / Preschool | 670 | 5.3% |
| Kindergarten | 552 | 4.4% |
| Elementary School | 2,773 | 22.0% |
| Middle School | 3,239 | 25.7% |
| High School | 2,741 | 21.7% |
| College / Undergraduate | 2,290 | 18.2% |
| Graduate / Professional | 342 | 2.7% |
| Total | 12,607 | 100.0% |
School Enrollment by Age by Funding Source in Pearl River County
Out of a total of 12,607 students who are enrolled in schools in Pearl River County, 2,345 (18.6%) attend a private institution, while the remaining 10,262 (81.4%) are enrolled in public schools. The age group of 3 to 4 year olds has the highest likelihood of being enrolled in private schools, with 306 (59.1% in the age bracket) enrolled. Conversely, the age group of 18 to 19 year olds has the lowest likelihood of being enrolled in a private school, with 1,027 (97.4% in the age bracket) attending a public institution.
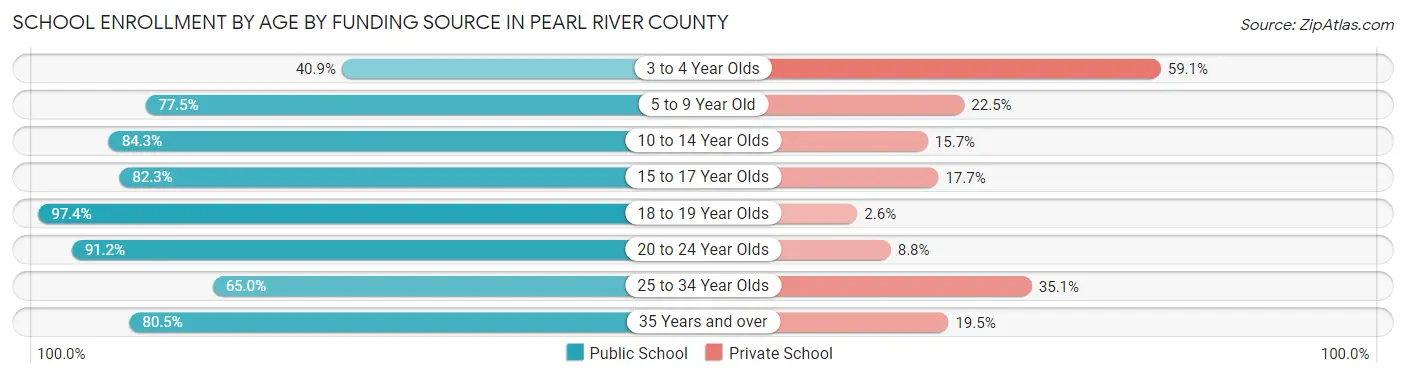
| Age Bracket | Public School | Private School |
| 3 to 4 Year Olds | 212 (40.9%) | 306 (59.1%) |
| 5 to 9 Year Old | 2,458 (77.5%) | 713 (22.5%) |
| 10 to 14 Year Olds | 3,252 (84.3%) | 605 (15.7%) |
| 15 to 17 Year Olds | 1,599 (82.3%) | 343 (17.7%) |
| 18 to 19 Year Olds | 1,027 (97.4%) | 27 (2.6%) |
| 20 to 24 Year Olds | 1,101 (91.2%) | 106 (8.8%) |
| 25 to 34 Year Olds | 341 (64.9%) | 184 (35.0%) |
| 35 Years and over | 268 (80.5%) | 65 (19.5%) |
| Total | 10,262 (81.4%) | 2,345 (18.6%) |
Educational Attainment by Field of Study in Pearl River County
Business (1,291 | 19.9%), education (1,287 | 19.8%), science & technology (670 | 10.3%), engineering (433 | 6.7%), and arts & humanities (408 | 6.3%) are the most common fields of study among 6,500 individuals in Pearl River County who have obtained a bachelor's degree or higher.
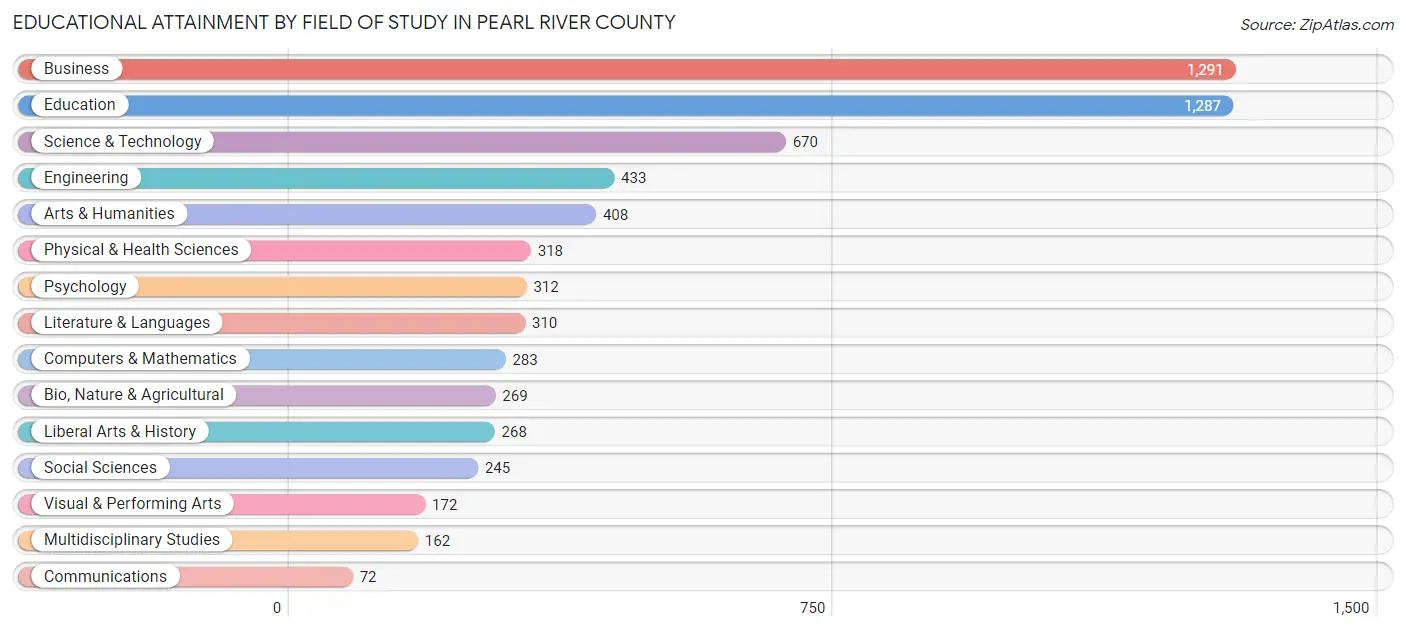
| Field of Study | # Graduates | % Graduates |
| Computers & Mathematics | 283 | 4.3% |
| Bio, Nature & Agricultural | 269 | 4.1% |
| Physical & Health Sciences | 318 | 4.9% |
| Psychology | 312 | 4.8% |
| Social Sciences | 245 | 3.8% |
| Engineering | 433 | 6.7% |
| Multidisciplinary Studies | 162 | 2.5% |
| Science & Technology | 670 | 10.3% |
| Business | 1,291 | 19.9% |
| Education | 1,287 | 19.8% |
| Literature & Languages | 310 | 4.8% |
| Liberal Arts & History | 268 | 4.1% |
| Visual & Performing Arts | 172 | 2.6% |
| Communications | 72 | 1.1% |
| Arts & Humanities | 408 | 6.3% |
| Total | 6,500 | 100.0% |
Transportation & Commute in Pearl River County
Vehicle Availability by Sex in Pearl River County
The most prevalent vehicle ownership categories in Pearl River County are males with 2 vehicles (4,944, accounting for 39.2%) and females with 2 vehicles (3,456, making up 51.4%).
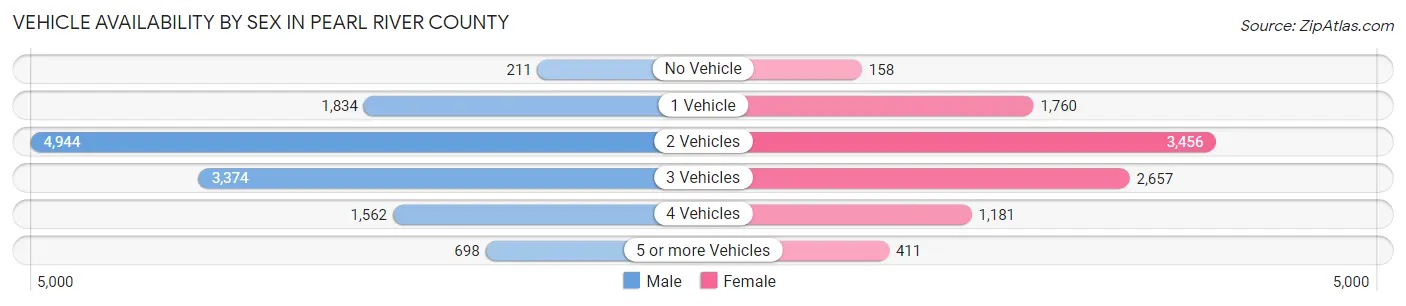
| Vehicles Available | Male | Female |
| No Vehicle | 211 (1.7%) | 158 (1.6%) |
| 1 Vehicle | 1,834 (14.5%) | 1,760 (18.3%) |
| 2 Vehicles | 4,944 (39.2%) | 3,456 (35.9%) |
| 3 Vehicles | 3,374 (26.7%) | 2,657 (27.6%) |
| 4 Vehicles | 1,562 (12.4%) | 1,181 (12.3%) |
| 5 or more Vehicles | 698 (5.5%) | 411 (4.3%) |
| Total | 12,623 (100.0%) | 9,623 (100.0%) |
Commute Time in Pearl River County
The most frequently occuring commute durations in Pearl River County are 60 to 89 minutes (3,175 commuters, 15.2%), 15 to 19 minutes (2,684 commuters, 12.8%), and 30 to 34 minutes (2,295 commuters, 11.0%).
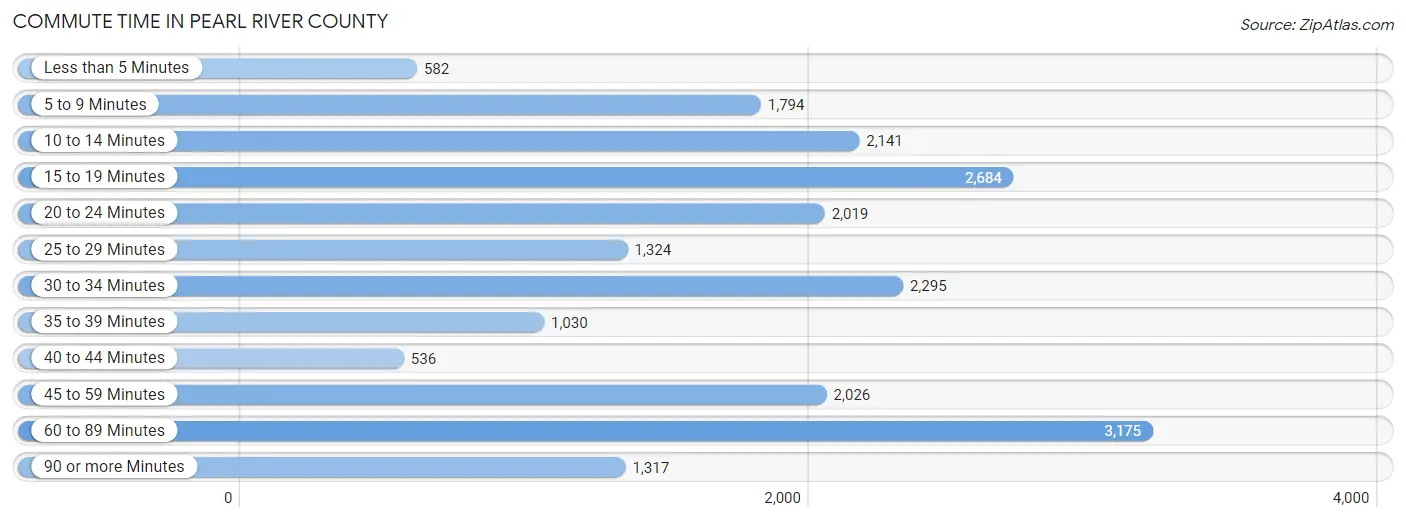
| Commute Time | # Commuters | % Commuters |
| Less than 5 Minutes | 582 | 2.8% |
| 5 to 9 Minutes | 1,794 | 8.6% |
| 10 to 14 Minutes | 2,141 | 10.2% |
| 15 to 19 Minutes | 2,684 | 12.8% |
| 20 to 24 Minutes | 2,019 | 9.7% |
| 25 to 29 Minutes | 1,324 | 6.3% |
| 30 to 34 Minutes | 2,295 | 11.0% |
| 35 to 39 Minutes | 1,030 | 4.9% |
| 40 to 44 Minutes | 536 | 2.6% |
| 45 to 59 Minutes | 2,026 | 9.7% |
| 60 to 89 Minutes | 3,175 | 15.2% |
| 90 or more Minutes | 1,317 | 6.3% |
Commute Time by Sex in Pearl River County
The most common commute times in Pearl River County are 60 to 89 minutes (2,347 commuters, 19.4%) for males and 15 to 19 minutes (1,447 commuters, 16.4%) for females.
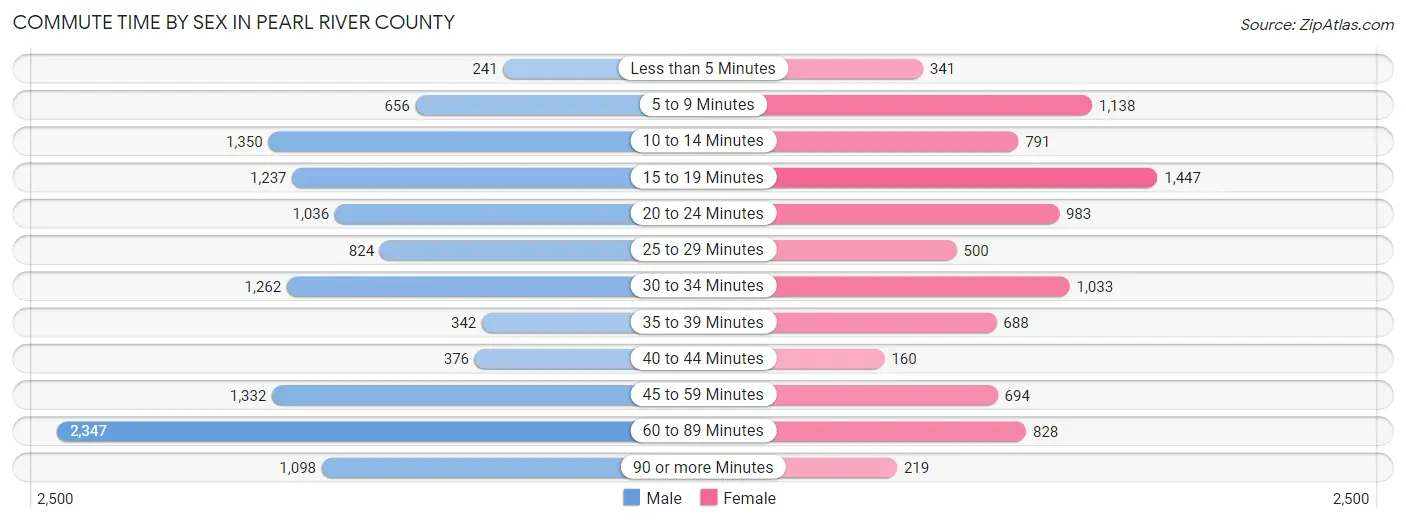
| Commute Time | Male | Female |
| Less than 5 Minutes | 241 (2.0%) | 341 (3.9%) |
| 5 to 9 Minutes | 656 (5.4%) | 1,138 (12.9%) |
| 10 to 14 Minutes | 1,350 (11.2%) | 791 (9.0%) |
| 15 to 19 Minutes | 1,237 (10.2%) | 1,447 (16.4%) |
| 20 to 24 Minutes | 1,036 (8.6%) | 983 (11.1%) |
| 25 to 29 Minutes | 824 (6.8%) | 500 (5.7%) |
| 30 to 34 Minutes | 1,262 (10.4%) | 1,033 (11.7%) |
| 35 to 39 Minutes | 342 (2.8%) | 688 (7.8%) |
| 40 to 44 Minutes | 376 (3.1%) | 160 (1.8%) |
| 45 to 59 Minutes | 1,332 (11.0%) | 694 (7.9%) |
| 60 to 89 Minutes | 2,347 (19.4%) | 828 (9.4%) |
| 90 or more Minutes | 1,098 (9.1%) | 219 (2.5%) |
Time of Departure to Work by Sex in Pearl River County
The most frequent times of departure to work in Pearl River County are 12:00 AM to 4:59 AM (2,205, 18.2%) for males and 7:00 AM to 7:29 AM (1,649, 18.7%) for females.
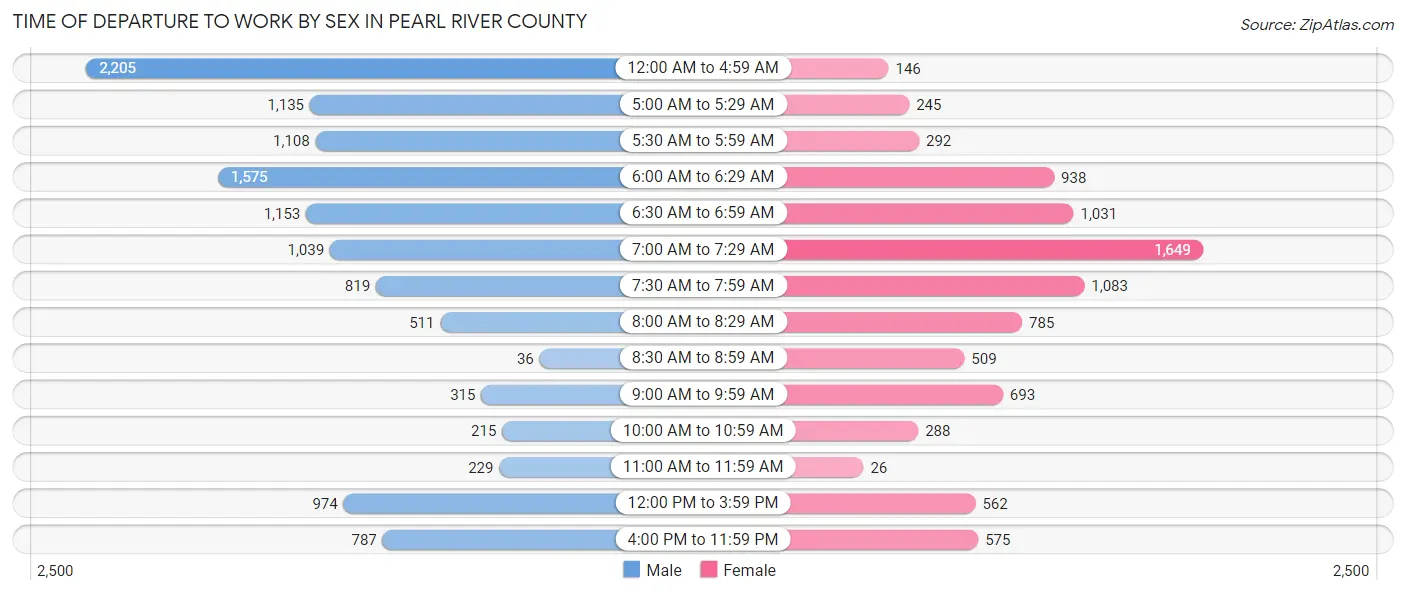
| Time of Departure | Male | Female |
| 12:00 AM to 4:59 AM | 2,205 (18.2%) | 146 (1.7%) |
| 5:00 AM to 5:29 AM | 1,135 (9.4%) | 245 (2.8%) |
| 5:30 AM to 5:59 AM | 1,108 (9.2%) | 292 (3.3%) |
| 6:00 AM to 6:29 AM | 1,575 (13.0%) | 938 (10.6%) |
| 6:30 AM to 6:59 AM | 1,153 (9.5%) | 1,031 (11.7%) |
| 7:00 AM to 7:29 AM | 1,039 (8.6%) | 1,649 (18.7%) |
| 7:30 AM to 7:59 AM | 819 (6.8%) | 1,083 (12.3%) |
| 8:00 AM to 8:29 AM | 511 (4.2%) | 785 (8.9%) |
| 8:30 AM to 8:59 AM | 36 (0.3%) | 509 (5.8%) |
| 9:00 AM to 9:59 AM | 315 (2.6%) | 693 (7.9%) |
| 10:00 AM to 10:59 AM | 215 (1.8%) | 288 (3.3%) |
| 11:00 AM to 11:59 AM | 229 (1.9%) | 26 (0.3%) |
| 12:00 PM to 3:59 PM | 974 (8.1%) | 562 (6.4%) |
| 4:00 PM to 11:59 PM | 787 (6.5%) | 575 (6.5%) |
| Total | 12,101 (100.0%) | 8,822 (100.0%) |
Housing Occupancy in Pearl River County
Occupancy by Ownership in Pearl River County
Of the total 21,188 dwellings in Pearl River County, owner-occupied units account for 17,007 (80.3%), while renter-occupied units make up 4,181 (19.7%).
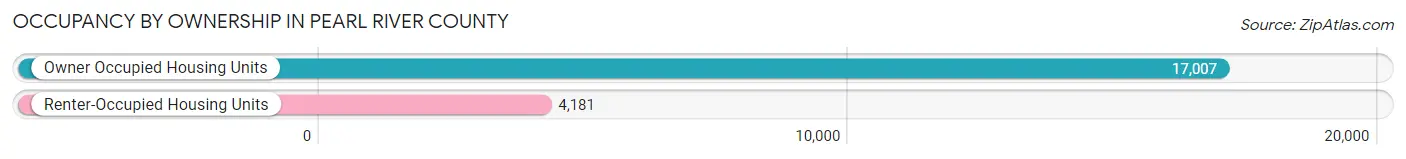
| Occupancy | # Housing Units | % Housing Units |
| Owner Occupied Housing Units | 17,007 | 80.3% |
| Renter-Occupied Housing Units | 4,181 | 19.7% |
| Total Occupied Housing Units | 21,188 | 100.0% |
Occupancy by Household Size in Pearl River County
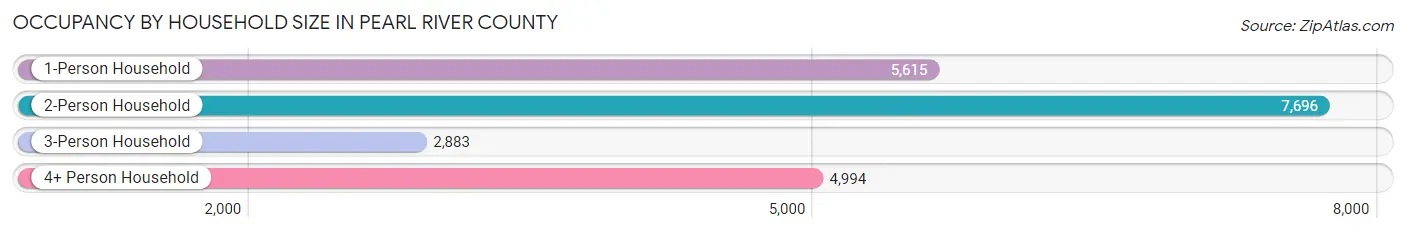
| Household Size | # Housing Units | % Housing Units |
| 1-Person Household | 5,615 | 26.5% |
| 2-Person Household | 7,696 | 36.3% |
| 3-Person Household | 2,883 | 13.6% |
| 4+ Person Household | 4,994 | 23.6% |
| Total Housing Units | 21,188 | 100.0% |
Occupancy by Ownership by Household Size in Pearl River County
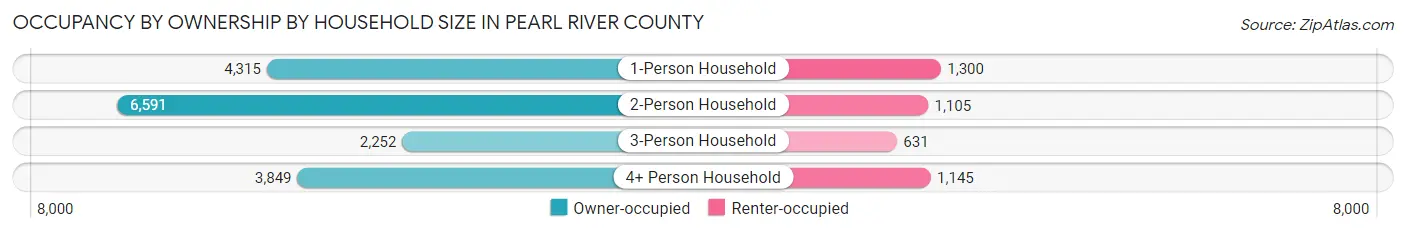
| Household Size | Owner-occupied | Renter-occupied |
| 1-Person Household | 4,315 (76.8%) | 1,300 (23.2%) |
| 2-Person Household | 6,591 (85.6%) | 1,105 (14.4%) |
| 3-Person Household | 2,252 (78.1%) | 631 (21.9%) |
| 4+ Person Household | 3,849 (77.1%) | 1,145 (22.9%) |
| Total Housing Units | 17,007 (80.3%) | 4,181 (19.7%) |
Occupancy by Educational Attainment in Pearl River County
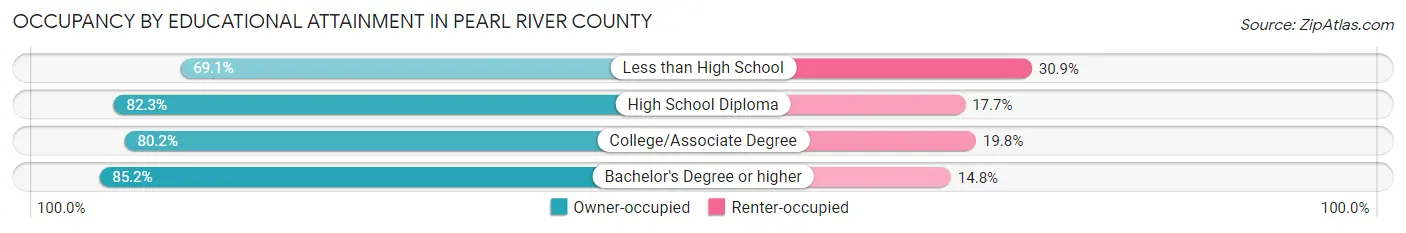
| Household Size | Owner-occupied | Renter-occupied |
| Less than High School | 1,884 (69.1%) | 841 (30.9%) |
| High School Diploma | 5,620 (82.3%) | 1,205 (17.7%) |
| College/Associate Degree | 6,600 (80.2%) | 1,630 (19.8%) |
| Bachelor's Degree or higher | 2,903 (85.2%) | 505 (14.8%) |
Occupancy by Age of Householder in Pearl River County
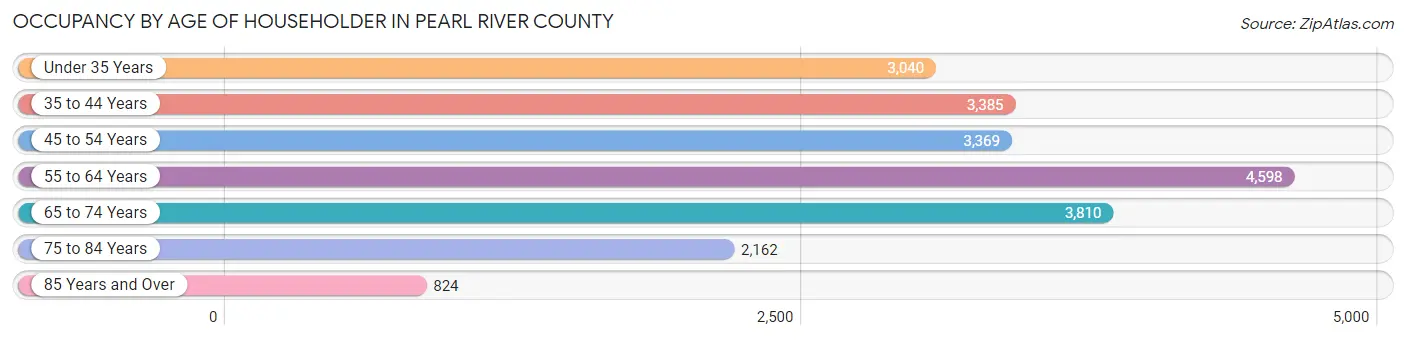
| Age Bracket | # Households | % Households |
| Under 35 Years | 3,040 | 14.3% |
| 35 to 44 Years | 3,385 | 16.0% |
| 45 to 54 Years | 3,369 | 15.9% |
| 55 to 64 Years | 4,598 | 21.7% |
| 65 to 74 Years | 3,810 | 18.0% |
| 75 to 84 Years | 2,162 | 10.2% |
| 85 Years and Over | 824 | 3.9% |
| Total | 21,188 | 100.0% |
Housing Finances in Pearl River County
Median Income by Occupancy in Pearl River County
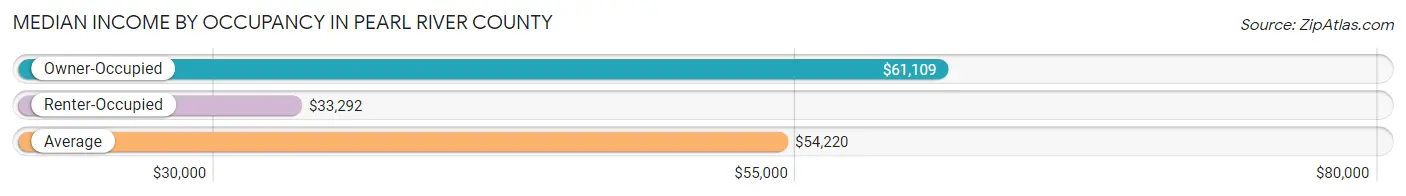
| Occupancy Type | # Households | Median Income |
| Owner-Occupied | 17,007 (80.3%) | $61,109 |
| Renter-Occupied | 4,181 (19.7%) | $33,292 |
| Average | 21,188 (100.0%) | $54,220 |
Occupancy by Householder Income Bracket in Pearl River County
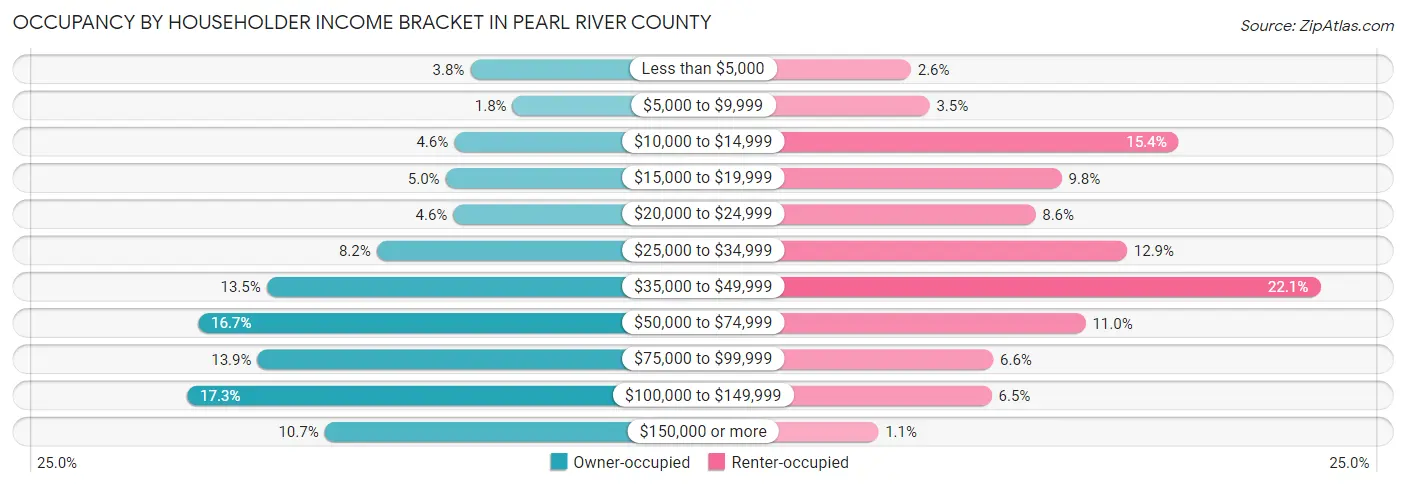
| Income Bracket | Owner-occupied | Renter-occupied |
| Less than $5,000 | 643 (3.8%) | 110 (2.6%) |
| $5,000 to $9,999 | 301 (1.8%) | 147 (3.5%) |
| $10,000 to $14,999 | 773 (4.5%) | 643 (15.4%) |
| $15,000 to $19,999 | 843 (5.0%) | 410 (9.8%) |
| $20,000 to $24,999 | 781 (4.6%) | 358 (8.6%) |
| $25,000 to $34,999 | 1,401 (8.2%) | 540 (12.9%) |
| $35,000 to $49,999 | 2,292 (13.5%) | 925 (22.1%) |
| $50,000 to $74,999 | 2,847 (16.7%) | 458 (11.0%) |
| $75,000 to $99,999 | 2,367 (13.9%) | 274 (6.6%) |
| $100,000 to $149,999 | 2,936 (17.3%) | 271 (6.5%) |
| $150,000 or more | 1,823 (10.7%) | 45 (1.1%) |
| Total | 17,007 (100.0%) | 4,181 (100.0%) |
Monthly Housing Cost Tiers in Pearl River County
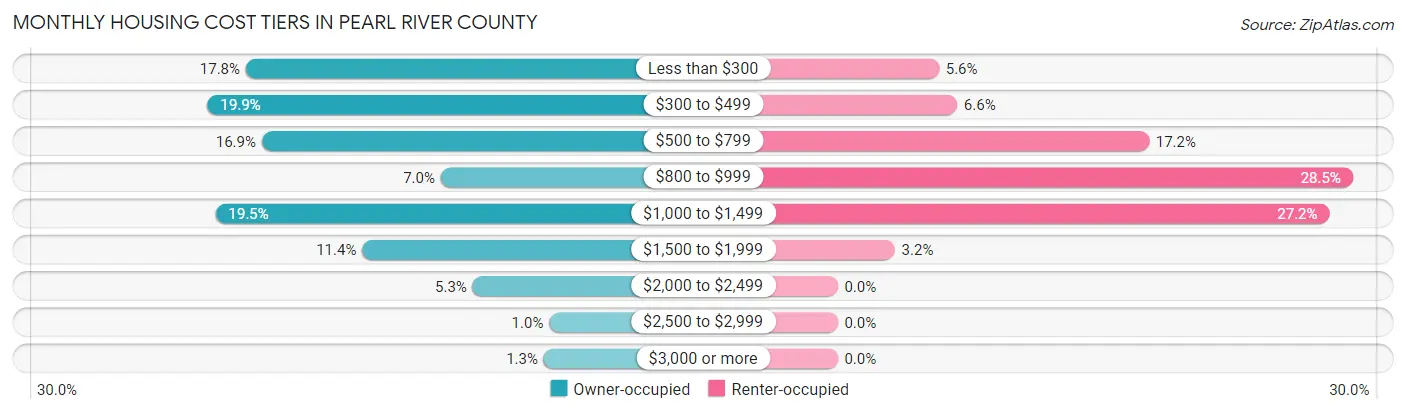
| Monthly Cost | Owner-occupied | Renter-occupied |
| Less than $300 | 3,024 (17.8%) | 234 (5.6%) |
| $300 to $499 | 3,385 (19.9%) | 276 (6.6%) |
| $500 to $799 | 2,874 (16.9%) | 719 (17.2%) |
| $800 to $999 | 1,193 (7.0%) | 1,190 (28.5%) |
| $1,000 to $1,499 | 3,310 (19.5%) | 1,136 (27.2%) |
| $1,500 to $1,999 | 1,930 (11.4%) | 132 (3.2%) |
| $2,000 to $2,499 | 893 (5.2%) | 0 (0.0%) |
| $2,500 to $2,999 | 174 (1.0%) | 0 (0.0%) |
| $3,000 or more | 224 (1.3%) | 0 (0.0%) |
| Total | 17,007 (100.0%) | 4,181 (100.0%) |
Physical Housing Characteristics in Pearl River County
Housing Structures in Pearl River County
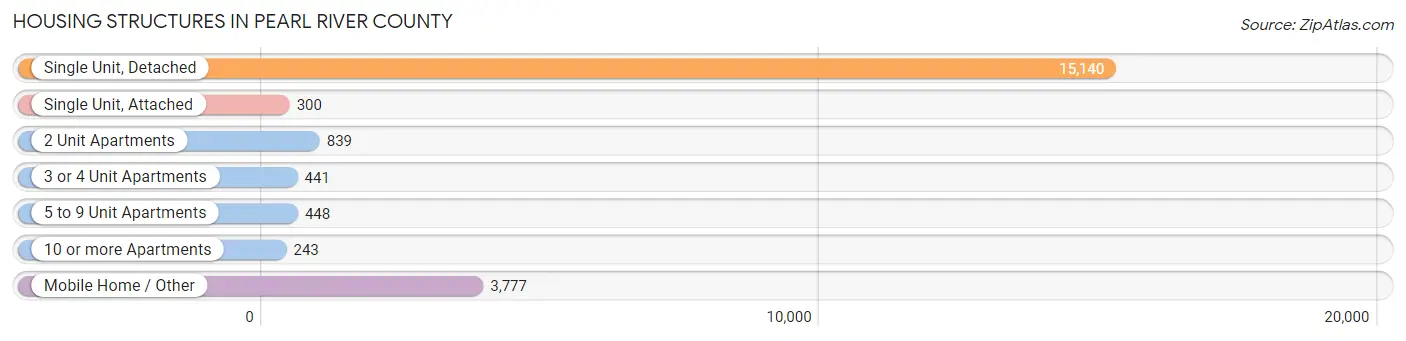
| Structure Type | # Housing Units | % Housing Units |
| Single Unit, Detached | 15,140 | 71.5% |
| Single Unit, Attached | 300 | 1.4% |
| 2 Unit Apartments | 839 | 4.0% |
| 3 or 4 Unit Apartments | 441 | 2.1% |
| 5 to 9 Unit Apartments | 448 | 2.1% |
| 10 or more Apartments | 243 | 1.1% |
| Mobile Home / Other | 3,777 | 17.8% |
| Total | 21,188 | 100.0% |
Housing Structures by Occupancy in Pearl River County
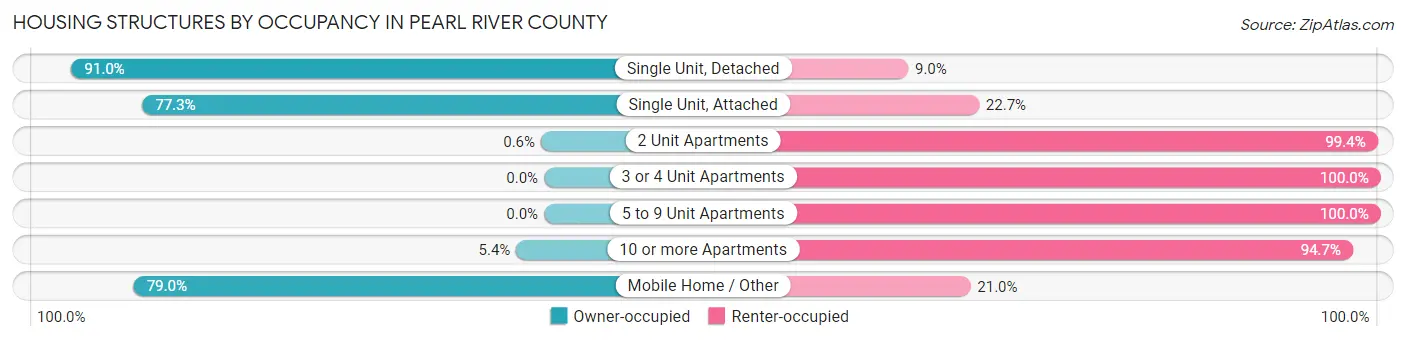
| Structure Type | Owner-occupied | Renter-occupied |
| Single Unit, Detached | 13,774 (91.0%) | 1,366 (9.0%) |
| Single Unit, Attached | 232 (77.3%) | 68 (22.7%) |
| 2 Unit Apartments | 5 (0.6%) | 834 (99.4%) |
| 3 or 4 Unit Apartments | 0 (0.0%) | 441 (100.0%) |
| 5 to 9 Unit Apartments | 0 (0.0%) | 448 (100.0%) |
| 10 or more Apartments | 13 (5.3%) | 230 (94.7%) |
| Mobile Home / Other | 2,983 (79.0%) | 794 (21.0%) |
| Total | 17,007 (80.3%) | 4,181 (19.7%) |
Housing Structures by Number of Rooms in Pearl River County
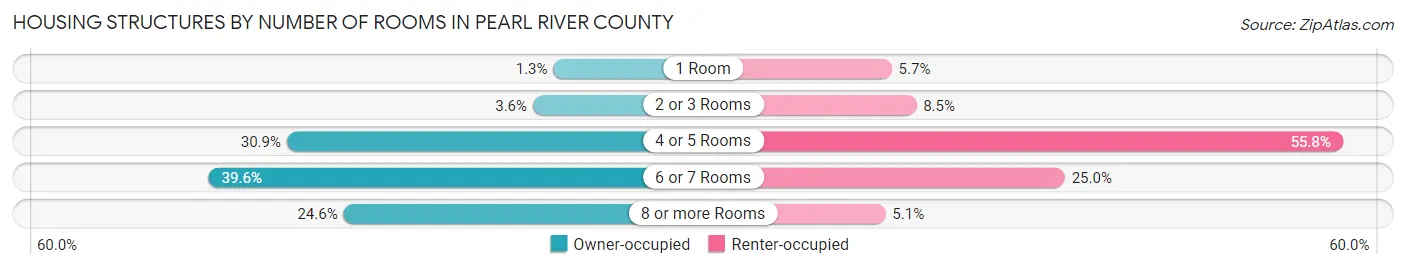
| Number of Rooms | Owner-occupied | Renter-occupied |
| 1 Room | 225 (1.3%) | 240 (5.7%) |
| 2 or 3 Rooms | 611 (3.6%) | 354 (8.5%) |
| 4 or 5 Rooms | 5,255 (30.9%) | 2,333 (55.8%) |
| 6 or 7 Rooms | 6,730 (39.6%) | 1,043 (24.9%) |
| 8 or more Rooms | 4,186 (24.6%) | 211 (5.1%) |
| Total | 17,007 (100.0%) | 4,181 (100.0%) |
Housing Structure by Heating Type in Pearl River County
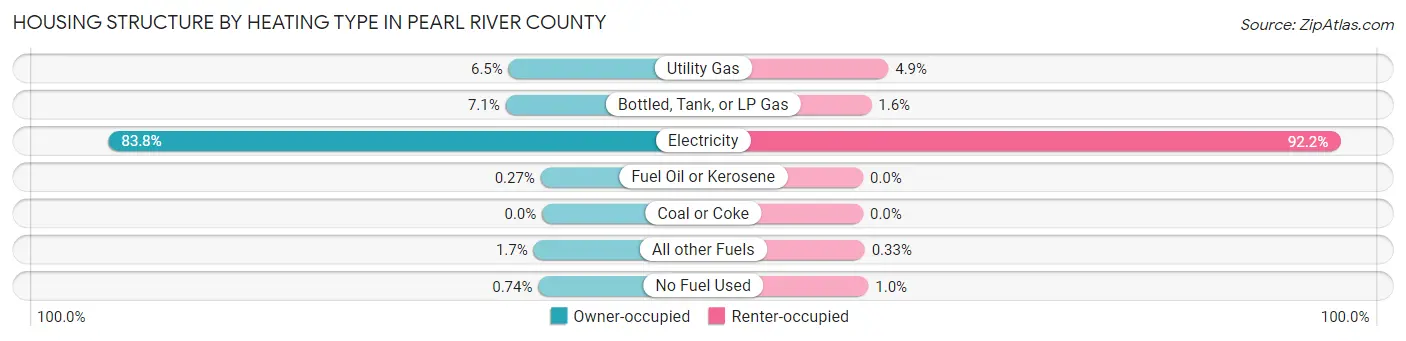
| Heating Type | Owner-occupied | Renter-occupied |
| Utility Gas | 1,100 (6.5%) | 204 (4.9%) |
| Bottled, Tank, or LP Gas | 1,200 (7.1%) | 67 (1.6%) |
| Electricity | 14,253 (83.8%) | 3,853 (92.1%) |
| Fuel Oil or Kerosene | 46 (0.3%) | 0 (0.0%) |
| Coal or Coke | 0 (0.0%) | 0 (0.0%) |
| All other Fuels | 282 (1.7%) | 14 (0.3%) |
| No Fuel Used | 126 (0.7%) | 43 (1.0%) |
| Total | 17,007 (100.0%) | 4,181 (100.0%) |
Household Vehicle Usage in Pearl River County
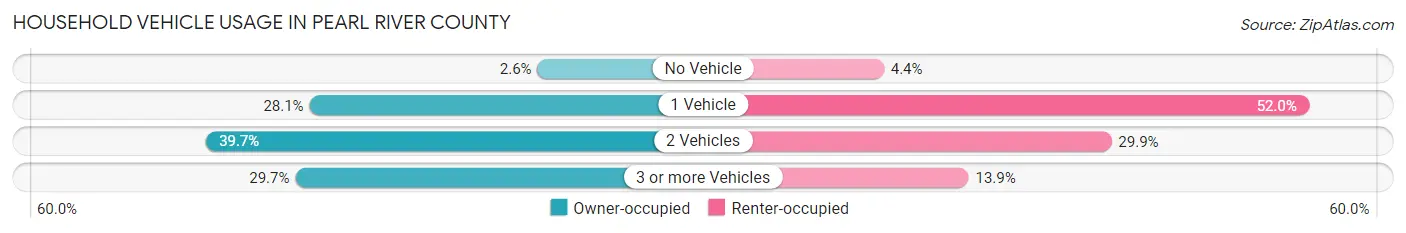
| Vehicles per Household | Owner-occupied | Renter-occupied |
| No Vehicle | 434 (2.5%) | 182 (4.3%) |
| 1 Vehicle | 4,777 (28.1%) | 2,172 (51.9%) |
| 2 Vehicles | 6,749 (39.7%) | 1,248 (29.8%) |
| 3 or more Vehicles | 5,047 (29.7%) | 579 (13.9%) |
| Total | 17,007 (100.0%) | 4,181 (100.0%) |
Real Estate & Mortgages in Pearl River County
Real Estate and Mortgage Overview in Pearl River County
| Characteristic | Without Mortgage | With Mortgage |
| Housing Units | 8,865 | 8,142 |
| Median Property Value | $133,500 | $185,700 |
| Median Household Income | $43,885 | $1,306 |
| Monthly Housing Costs | $384 | $224 |
| Real Estate Taxes | $882 | $1,091 |
Property Value by Mortgage Status in Pearl River County
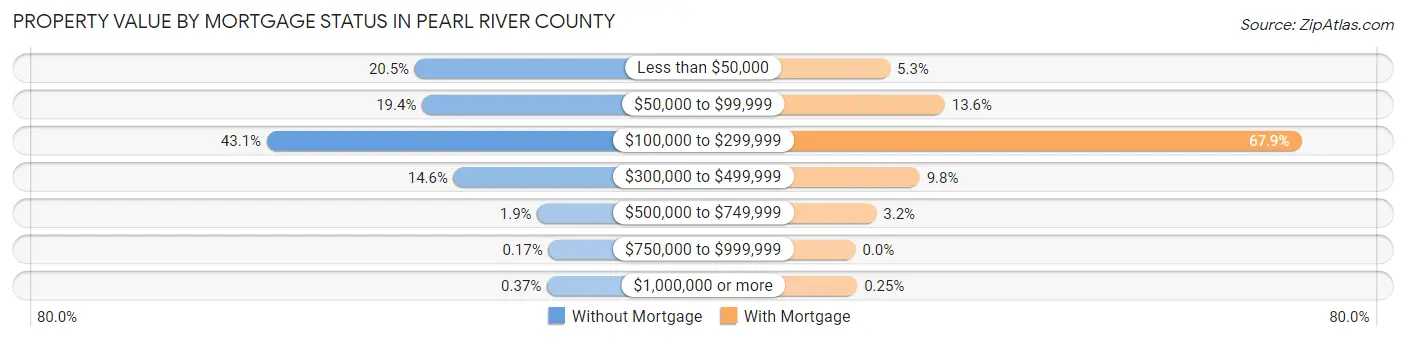
| Property Value | Without Mortgage | With Mortgage |
| Less than $50,000 | 1,819 (20.5%) | 429 (5.3%) |
| $50,000 to $99,999 | 1,721 (19.4%) | 1,108 (13.6%) |
| $100,000 to $299,999 | 3,819 (43.1%) | 5,531 (67.9%) |
| $300,000 to $499,999 | 1,294 (14.6%) | 796 (9.8%) |
| $500,000 to $749,999 | 164 (1.8%) | 258 (3.2%) |
| $750,000 to $999,999 | 15 (0.2%) | 0 (0.0%) |
| $1,000,000 or more | 33 (0.4%) | 20 (0.3%) |
| Total | 8,865 (100.0%) | 8,142 (100.0%) |
Household Income by Mortgage Status in Pearl River County
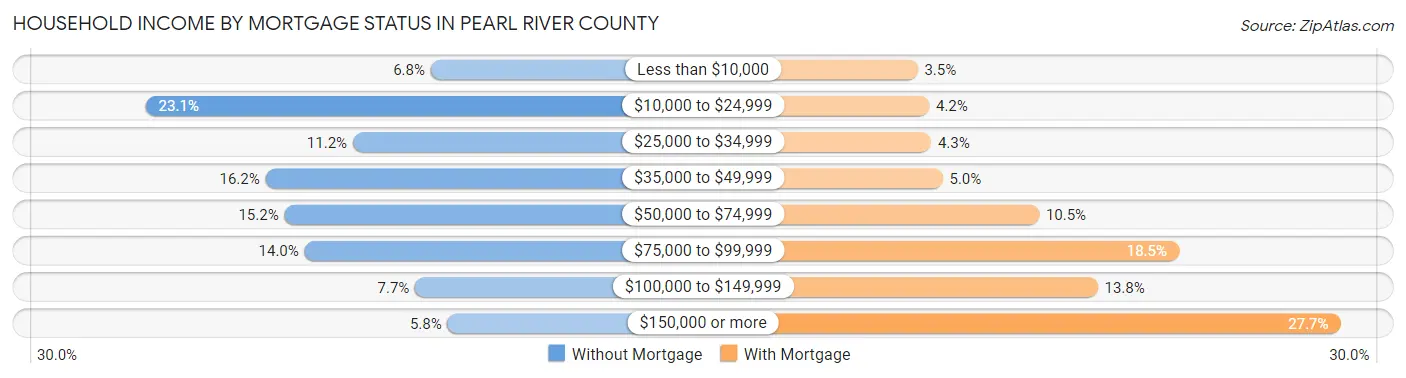
| Household Income | Without Mortgage | With Mortgage |
| Less than $10,000 | 602 (6.8%) | 288 (3.5%) |
| $10,000 to $24,999 | 2,046 (23.1%) | 342 (4.2%) |
| $25,000 to $34,999 | 996 (11.2%) | 351 (4.3%) |
| $35,000 to $49,999 | 1,439 (16.2%) | 405 (5.0%) |
| $50,000 to $74,999 | 1,343 (15.1%) | 853 (10.5%) |
| $75,000 to $99,999 | 1,241 (14.0%) | 1,504 (18.5%) |
| $100,000 to $149,999 | 681 (7.7%) | 1,126 (13.8%) |
| $150,000 or more | 517 (5.8%) | 2,255 (27.7%) |
| Total | 8,865 (100.0%) | 8,142 (100.0%) |
Property Value to Household Income Ratio in Pearl River County
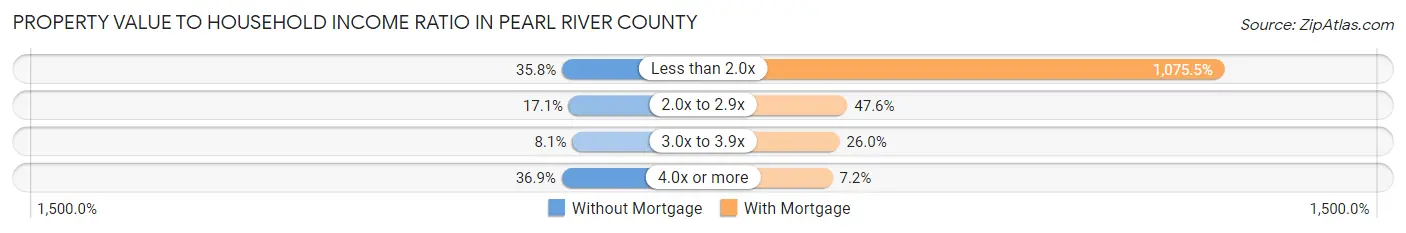
| Value-to-Income Ratio | Without Mortgage | With Mortgage |
| Less than 2.0x | 3,176 (35.8%) | 87,563 (1,075.5%) |
| 2.0x to 2.9x | 1,518 (17.1%) | 3,872 (47.6%) |
| 3.0x to 3.9x | 721 (8.1%) | 2,119 (26.0%) |
| 4.0x or more | 3,268 (36.9%) | 583 (7.2%) |
| Total | 8,865 (100.0%) | 8,142 (100.0%) |
Real Estate Taxes by Mortgage Status in Pearl River County
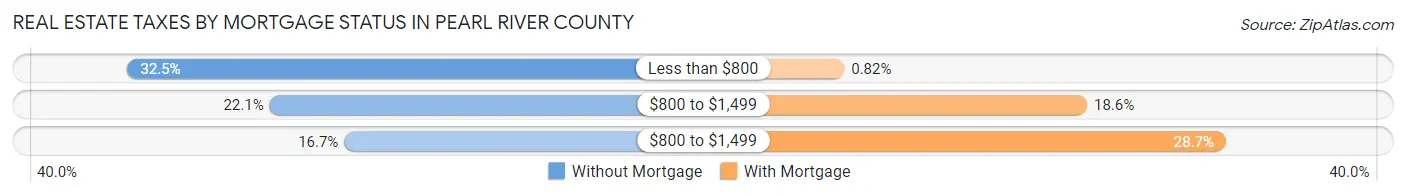
| Property Taxes | Without Mortgage | With Mortgage |
| Less than $800 | 2,880 (32.5%) | 67 (0.8%) |
| $800 to $1,499 | 1,960 (22.1%) | 1,511 (18.6%) |
| $800 to $1,499 | 1,476 (16.7%) | 2,337 (28.7%) |
| Total | 8,865 (100.0%) | 8,142 (100.0%) |
Health & Disability in Pearl River County
Health Insurance Coverage by Age in Pearl River County
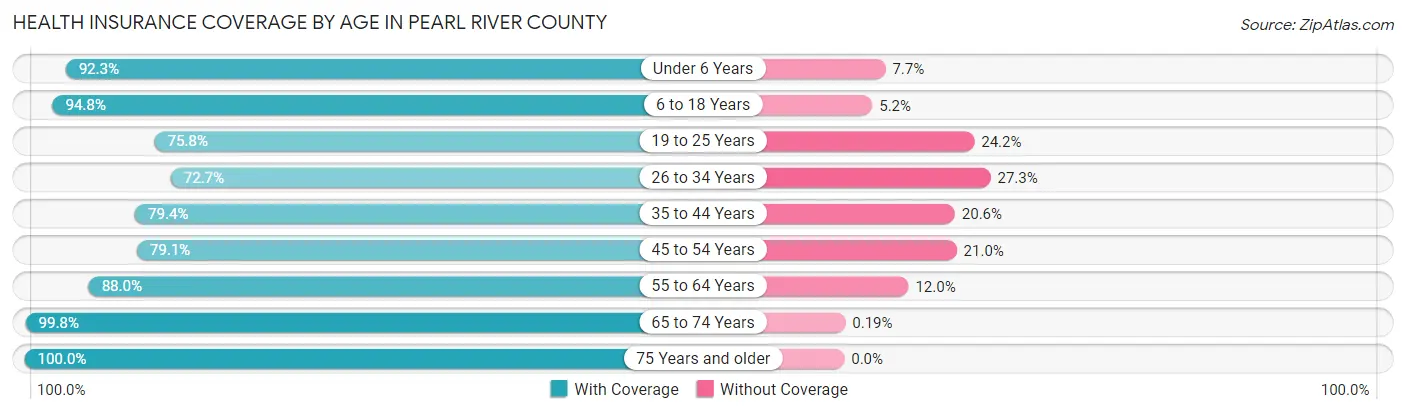
| Age Bracket | With Coverage | Without Coverage |
| Under 6 Years | 3,448 (92.3%) | 287 (7.7%) |
| 6 to 18 Years | 9,296 (94.8%) | 512 (5.2%) |
| 19 to 25 Years | 3,737 (75.8%) | 1,196 (24.2%) |
| 26 to 34 Years | 4,038 (72.7%) | 1,515 (27.3%) |
| 35 to 44 Years | 5,252 (79.4%) | 1,364 (20.6%) |
| 45 to 54 Years | 5,520 (79.0%) | 1,463 (20.9%) |
| 55 to 64 Years | 6,800 (88.0%) | 925 (12.0%) |
| 65 to 74 Years | 6,319 (99.8%) | 12 (0.2%) |
| 75 Years and older | 4,049 (100.0%) | 0 (0.0%) |
| Total | 48,459 (87.0%) | 7,274 (13.1%) |
Health Insurance Coverage by Citizenship Status in Pearl River County
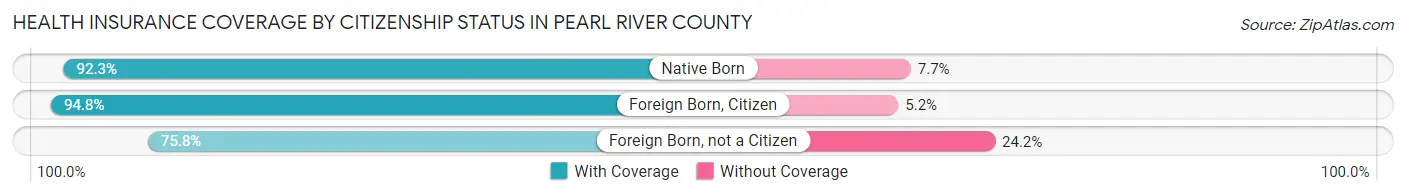
| Citizenship Status | With Coverage | Without Coverage |
| Native Born | 3,448 (92.3%) | 287 (7.7%) |
| Foreign Born, Citizen | 9,296 (94.8%) | 512 (5.2%) |
| Foreign Born, not a Citizen | 3,737 (75.8%) | 1,196 (24.2%) |
Health Insurance Coverage by Household Income in Pearl River County
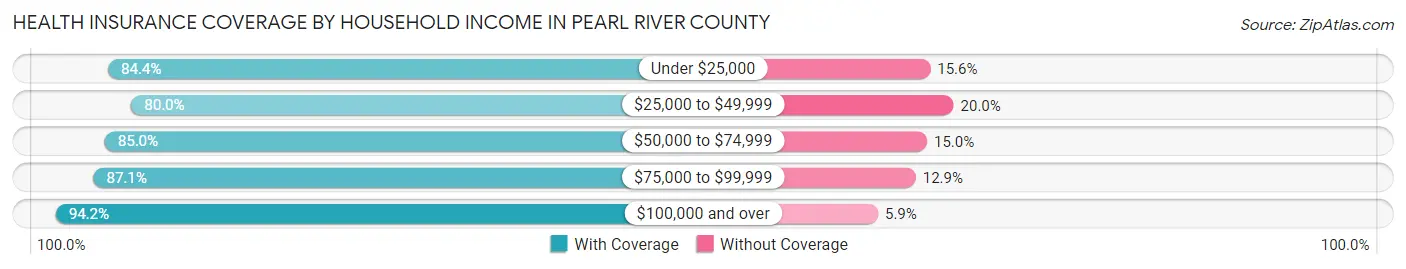
| Household Income | With Coverage | Without Coverage |
| Under $25,000 | 7,166 (84.4%) | 1,329 (15.6%) |
| $25,000 to $49,999 | 9,868 (80.0%) | 2,468 (20.0%) |
| $50,000 to $74,999 | 8,240 (85.0%) | 1,459 (15.0%) |
| $75,000 to $99,999 | 6,861 (87.1%) | 1,019 (12.9%) |
| $100,000 and over | 15,598 (94.2%) | 969 (5.9%) |
Public vs Private Health Insurance Coverage by Age in Pearl River County
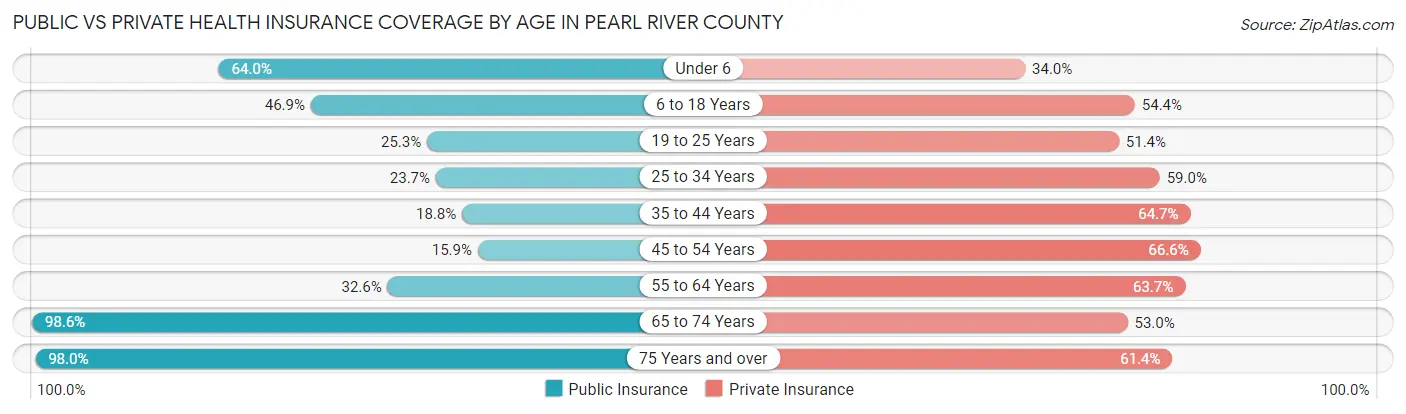
| Age Bracket | Public Insurance | Private Insurance |
| Under 6 | 2,390 (64.0%) | 1,271 (34.0%) |
| 6 to 18 Years | 4,598 (46.9%) | 5,336 (54.4%) |
| 19 to 25 Years | 1,248 (25.3%) | 2,537 (51.4%) |
| 25 to 34 Years | 1,314 (23.7%) | 3,277 (59.0%) |
| 35 to 44 Years | 1,243 (18.8%) | 4,280 (64.7%) |
| 45 to 54 Years | 1,109 (15.9%) | 4,650 (66.6%) |
| 55 to 64 Years | 2,521 (32.6%) | 4,921 (63.7%) |
| 65 to 74 Years | 6,245 (98.6%) | 3,358 (53.0%) |
| 75 Years and over | 3,969 (98.0%) | 2,484 (61.4%) |
| Total | 24,637 (44.2%) | 32,114 (57.6%) |
Disability Status by Sex by Age in Pearl River County
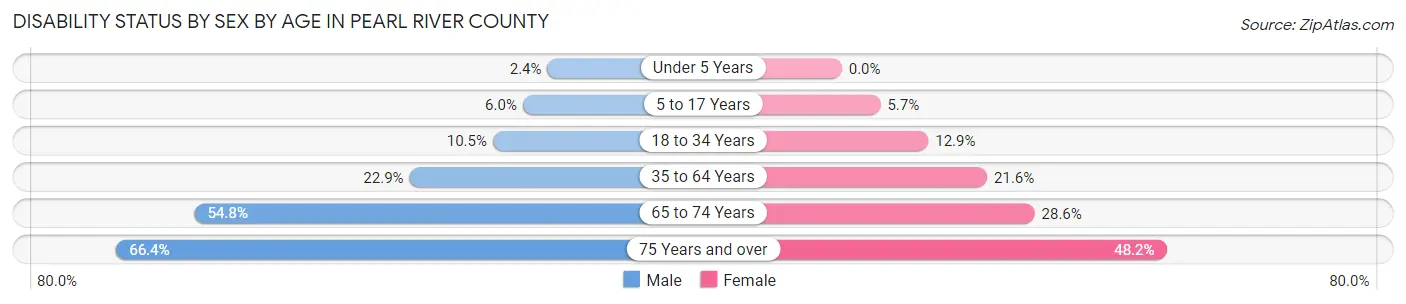
| Age Bracket | Male | Female |
| Under 5 Years | 40 (2.4%) | 0 (0.0%) |
| 5 to 17 Years | 285 (6.0%) | 275 (5.7%) |
| 18 to 34 Years | 592 (10.5%) | 732 (12.9%) |
| 35 to 64 Years | 2,408 (22.9%) | 2,329 (21.6%) |
| 65 to 74 Years | 1,625 (54.8%) | 963 (28.6%) |
| 75 Years and over | 1,248 (66.4%) | 1,045 (48.2%) |
Disability Class by Sex by Age in Pearl River County
Disability Class: Hearing Difficulty
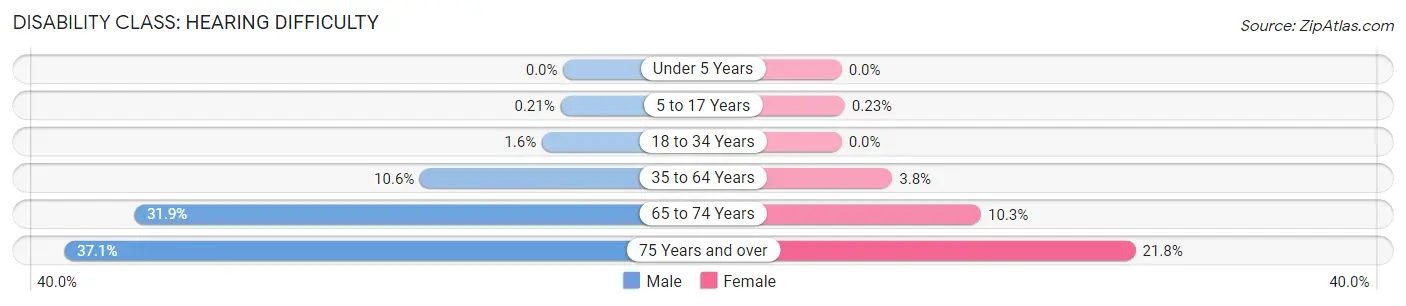
| Age Bracket | Male | Female |
| Under 5 Years | 0 (0.0%) | 0 (0.0%) |
| 5 to 17 Years | 10 (0.2%) | 11 (0.2%) |
| 18 to 34 Years | 89 (1.6%) | 0 (0.0%) |
| 35 to 64 Years | 1,120 (10.6%) | 405 (3.7%) |
| 65 to 74 Years | 946 (31.9%) | 348 (10.3%) |
| 75 Years and over | 697 (37.1%) | 473 (21.8%) |
Disability Class: Vision Difficulty
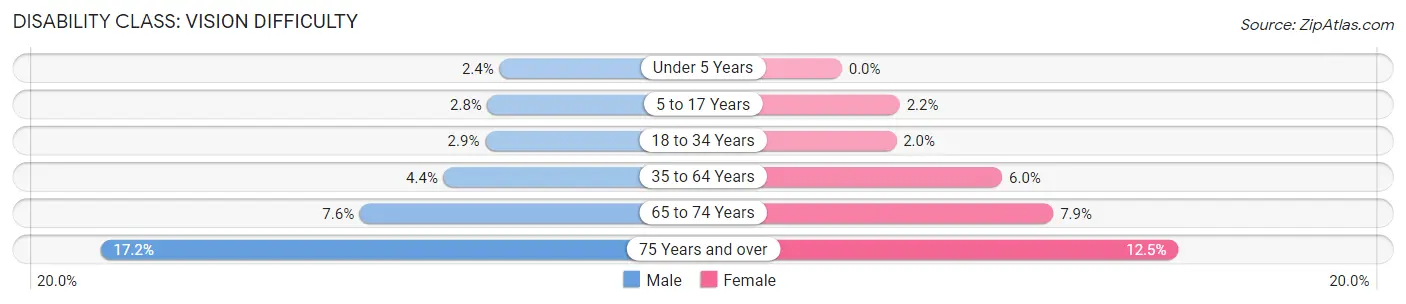
| Age Bracket | Male | Female |
| Under 5 Years | 40 (2.4%) | 0 (0.0%) |
| 5 to 17 Years | 133 (2.8%) | 103 (2.1%) |
| 18 to 34 Years | 164 (2.9%) | 115 (2.0%) |
| 35 to 64 Years | 468 (4.4%) | 642 (5.9%) |
| 65 to 74 Years | 224 (7.5%) | 264 (7.9%) |
| 75 Years and over | 323 (17.2%) | 271 (12.5%) |
Disability Class: Cognitive Difficulty
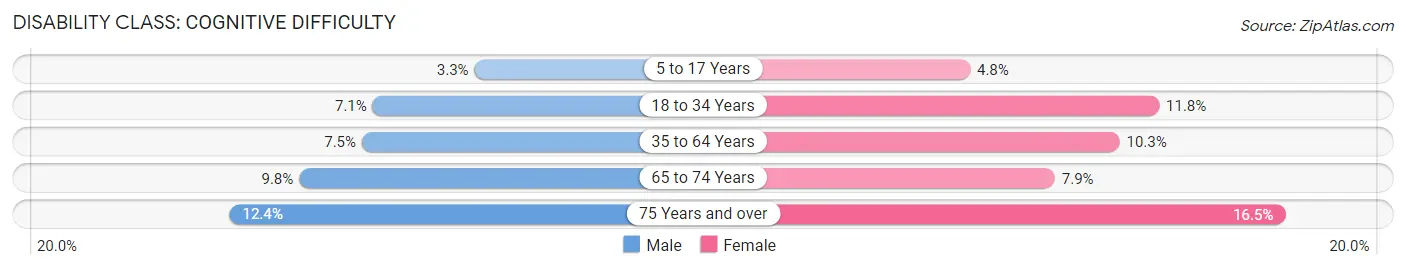
| Age Bracket | Male | Female |
| 5 to 17 Years | 156 (3.3%) | 228 (4.8%) |
| 18 to 34 Years | 400 (7.1%) | 671 (11.8%) |
| 35 to 64 Years | 788 (7.5%) | 1,113 (10.3%) |
| 65 to 74 Years | 291 (9.8%) | 266 (7.9%) |
| 75 Years and over | 233 (12.4%) | 357 (16.5%) |
Disability Class: Ambulatory Difficulty
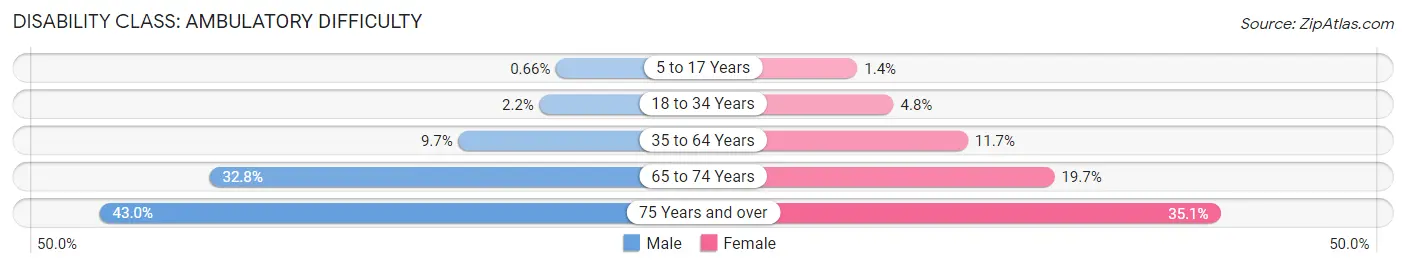
| Age Bracket | Male | Female |
| 5 to 17 Years | 31 (0.7%) | 69 (1.4%) |
| 18 to 34 Years | 124 (2.2%) | 274 (4.8%) |
| 35 to 64 Years | 1,025 (9.7%) | 1,263 (11.7%) |
| 65 to 74 Years | 974 (32.8%) | 664 (19.7%) |
| 75 Years and over | 809 (43.0%) | 762 (35.1%) |
Disability Class: Self-Care Difficulty
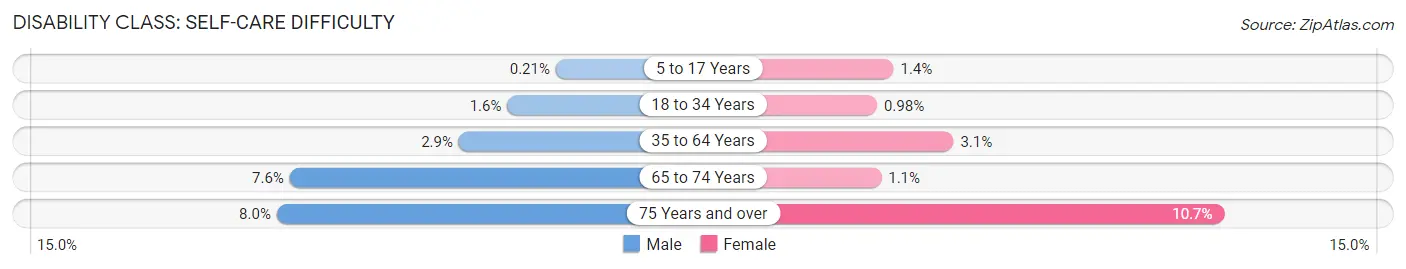
| Age Bracket | Male | Female |
| 5 to 17 Years | 10 (0.2%) | 69 (1.4%) |
| 18 to 34 Years | 88 (1.6%) | 56 (1.0%) |
| 35 to 64 Years | 307 (2.9%) | 336 (3.1%) |
| 65 to 74 Years | 226 (7.6%) | 37 (1.1%) |
| 75 Years and over | 150 (8.0%) | 231 (10.6%) |
Technology Access in Pearl River County
Computing Device Access in Pearl River County
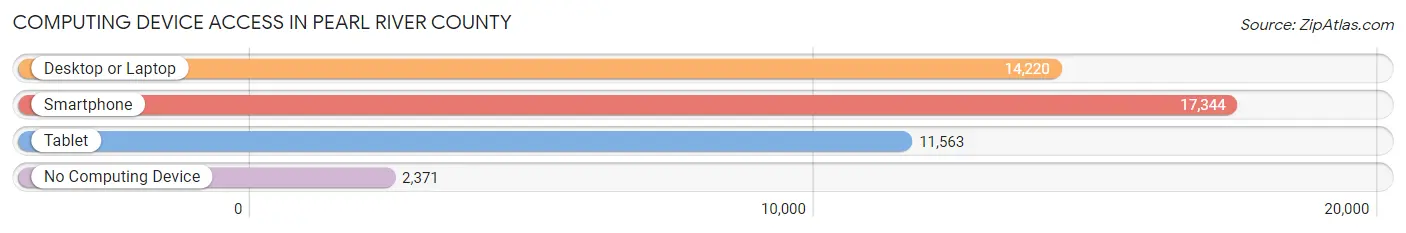
| Device Type | # Households | % Households |
| Desktop or Laptop | 14,220 | 67.1% |
| Smartphone | 17,344 | 81.9% |
| Tablet | 11,563 | 54.6% |
| No Computing Device | 2,371 | 11.2% |
| Total | 21,188 | 100.0% |
Internet Access in Pearl River County
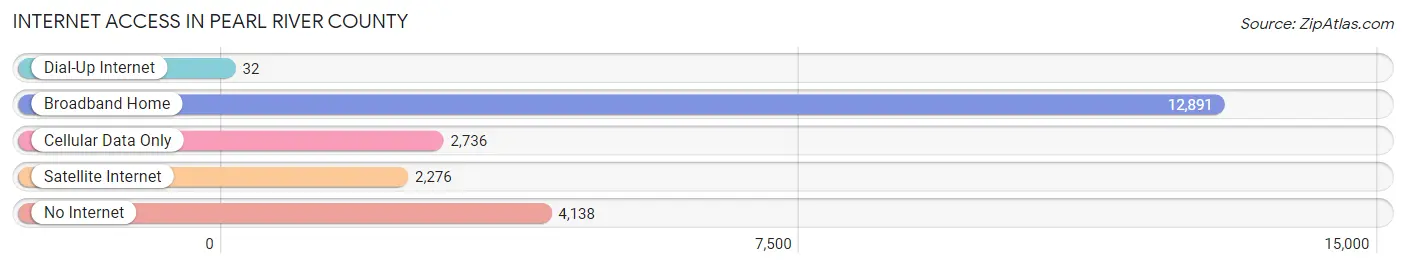
| Internet Type | # Households | % Households |
| Dial-Up Internet | 32 | 0.2% |
| Broadband Home | 12,891 | 60.8% |
| Cellular Data Only | 2,736 | 12.9% |
| Satellite Internet | 2,276 | 10.7% |
| No Internet | 4,138 | 19.5% |
| Total | 21,188 | 100.0% |
Pearl River County Summary
Pearl River County is located in the southeastern corner of Mississippi, and is bordered by the states of Louisiana and Alabama. It is part of the Gulf Coast region of the state, and is home to a population of approximately 55,000 people. The county seat is Poplarville, and the largest city is Picayune.
History
Pearl River County was established in 1890 from parts of Hancock, Marion, and Perry counties. It was named for the Pearl River, which forms its western border. The area was originally inhabited by the Choctaw Indians, who were forcibly removed in the 1830s as part of the Indian Removal Act. The county was largely rural until the late 19th century, when the lumber industry began to boom. The lumber industry was the primary economic driver for the county until the mid-20th century, when the timber industry began to decline.
Geography
Pearl River County is located in the southeastern corner of Mississippi, and is bordered by the states of Louisiana and Alabama. It is part of the Gulf Coast region of the state, and is home to a population of approximately 55,000 people. The county is mostly rural, with the majority of the population living in small towns and unincorporated communities. The terrain is mostly flat, with some rolling hills in the northern part of the county. The Pearl River forms the western border of the county, and the Bogue Chitto River forms the eastern border.
Economy
The economy of Pearl River County is largely based on agriculture and manufacturing. The county is home to several large poultry farms, as well as a number of smaller farms that produce a variety of crops, including corn, soybeans, cotton, and hay. The county is also home to several manufacturing plants, including a paper mill, a furniture factory, and a plastics plant. The county is also home to several casinos, which provide a significant source of revenue for the county.
Demographics
As of the 2010 census, the population of Pearl River County was 54,948. The racial makeup of the county was 79.3% White, 17.7% African American, 0.5% Native American, 0.5% Asian, 0.1% Pacific Islander, 0.7% from other races, and 1.8% from two or more races. Hispanic or Latino of any race were 2.2% of the population.
The median income for a household in the county was $37,945, and the median income for a family was $45,945. The per capita income for the county was $19,945. About 17.7% of families and 21.7% of the population were below the poverty line, including 28.7% of those under age 18 and 16.2% of those age 65 or over.
Common Questions
What is Per Capita Income in Pearl River County?
Per Capita income in Pearl River County is $27,549.
What is the Median Family Income in Pearl River County?
Median Family Income in Pearl River County is $67,832.
What is the Median Household income in Pearl River County?
Median Household Income in Pearl River County is $54,220.
What is Income or Wage Gap in Pearl River County?
Income or Wage Gap in Pearl River County is 49.7%.
Women in Pearl River County earn 50.3 cents for every dollar earned by a man.
What is Family Income Deficit in Pearl River County?
Family Income Deficit in Pearl River County is $9,905.
Families that are below poverty line in Pearl River County earn $9,905 less on average than the poverty threshold level.
What is Inequality or Gini Index in Pearl River County?
Inequality or Gini Index in Pearl River County is 0.44.
What is the Total Population of Pearl River County?
Total Population of Pearl River County is 56,351.
What is the Total Male Population of Pearl River County?
Total Male Population of Pearl River County is 27,679.
What is the Total Female Population of Pearl River County?
Total Female Population of Pearl River County is 28,672.
What is the Ratio of Males per 100 Females in Pearl River County?
There are 96.54 Males per 100 Females in Pearl River County.
What is the Ratio of Females per 100 Males in Pearl River County?
There are 103.59 Females per 100 Males in Pearl River County.
What is the Median Population Age in Pearl River County?
Median Population Age in Pearl River County is 40.8 Years.
What is the Average Family Size in Pearl River County
Average Family Size in Pearl River County is 3.1 People.
What is the Average Household Size in Pearl River County
Average Household Size in Pearl River County is 2.6 People.
How Large is the Labor Force in Pearl River County?
There are 24,560 People in the Labor Forcein in Pearl River County.
What is the Percentage of People in the Labor Force in Pearl River County?
54.5% of People are in the Labor Force in Pearl River County.
What is the Unemployment Rate in Pearl River County?
Unemployment Rate in Pearl River County is 5.6%.