Panola County, MS Map & Demographics
Panola County Map
Panola County Overview
$25,822
PER CAPITA INCOME
$60,911
AVG FAMILY INCOME
$47,894
AVG HOUSEHOLD INCOME
23.6%
WAGE / INCOME GAP [ % ]
76.4¢/ $1
WAGE / INCOME GAP [ $ ]
$11,803
FAMILY INCOME DEFICIT
0.48
INEQUALITY / GINI INDEX
33,157
TOTAL POPULATION
15,990
MALE POPULATION
17,167
FEMALE POPULATION
93.14
MALES / 100 FEMALES
107.36
FEMALES / 100 MALES
39.4
MEDIAN AGE
3.3
AVG FAMILY SIZE
2.6
AVG HOUSEHOLD SIZE
13,105
LABOR FORCE [ PEOPLE ]
50.8%
PERCENT IN LABOR FORCE
9.5%
UNEMPLOYMENT RATE
Panola County Area Codes
Income in Panola County
Income Overview in Panola County
Per Capita Income in Panola County is $25,822, while median incomes of families and households are $60,911 and $47,894 respectively.
| Characteristic | Number | Measure |
| Per Capita Income | 33,157 | $25,822 |
| Median Family Income | 8,287 | $60,911 |
| Mean Family Income | 8,287 | $81,839 |
| Median Household Income | 12,392 | $47,894 |
| Mean Household Income | 12,392 | $67,859 |
| Income Deficit | 8,287 | $11,803 |
| Wage / Income Gap (%) | 33,157 | 23.63% |
| Wage / Income Gap ($) | 33,157 | 76.37¢ per $1 |
| Gini / Inequality Index | 33,157 | 0.48 |
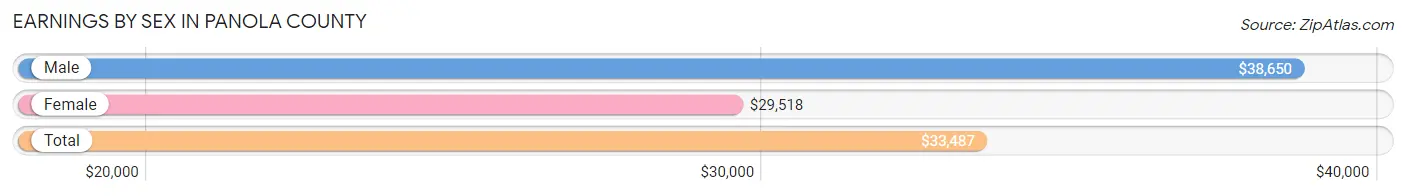
Earnings by Sex in Panola County
Average Earnings in Panola County are $33,487, $38,650 for men and $29,518 for women, a difference of 23.6%.
| Sex | Number | Average Earnings |
| Male | 6,559 (49.6%) | $38,650 |
| Female | 6,653 (50.4%) | $29,518 |
| Total | 13,212 (100.0%) | $33,487 |
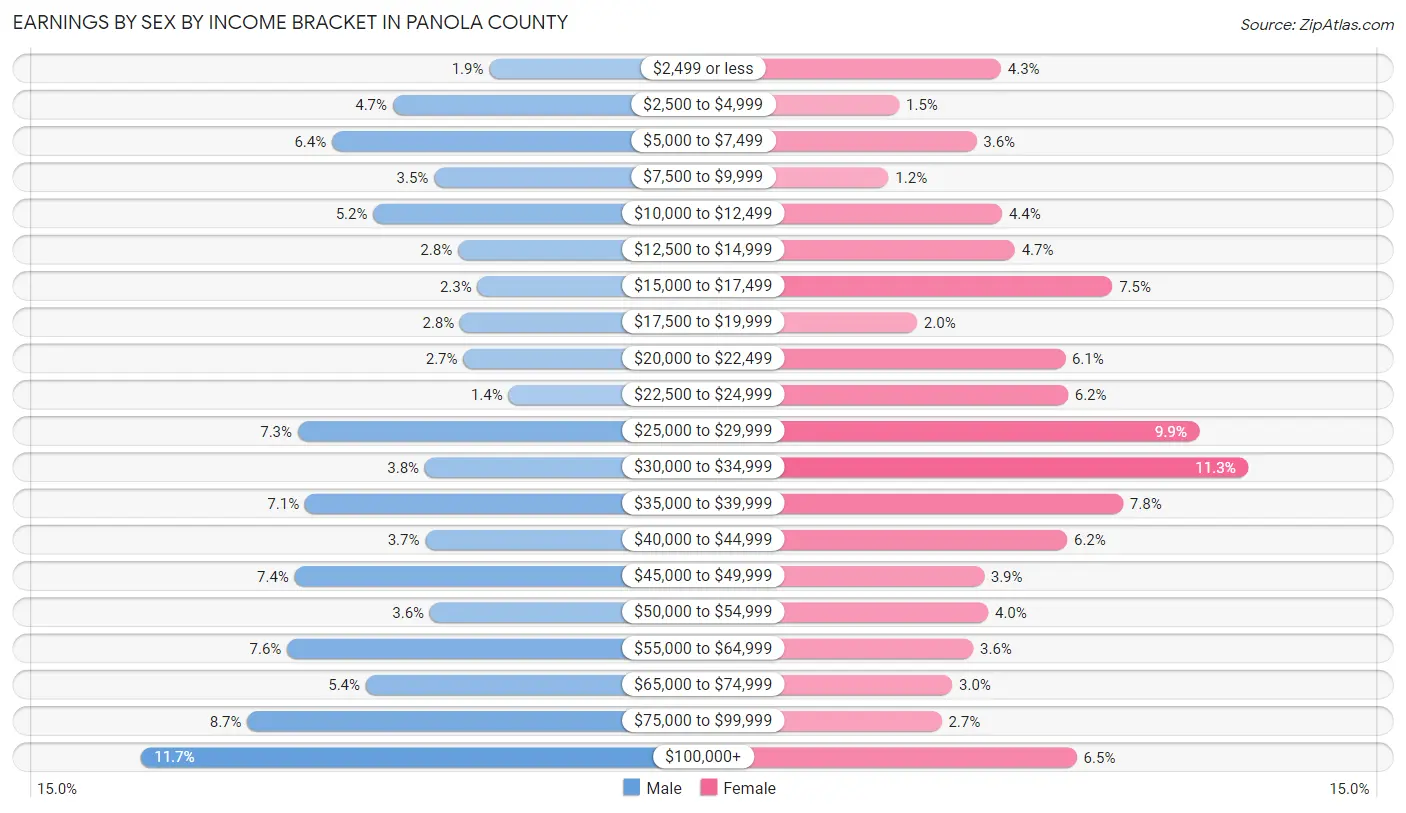
Earnings by Sex by Income Bracket in Panola County
The most common earnings brackets in Panola County are $100,000+ for men (769 | 11.7%) and $30,000 to $34,999 for women (749 | 11.3%).
| Income | Male | Female |
| $2,499 or less | 127 (1.9%) | 288 (4.3%) |
| $2,500 to $4,999 | 305 (4.6%) | 98 (1.5%) |
| $5,000 to $7,499 | 417 (6.4%) | 242 (3.6%) |
| $7,500 to $9,999 | 229 (3.5%) | 78 (1.2%) |
| $10,000 to $12,499 | 341 (5.2%) | 290 (4.4%) |
| $12,500 to $14,999 | 185 (2.8%) | 314 (4.7%) |
| $15,000 to $17,499 | 149 (2.3%) | 496 (7.5%) |
| $17,500 to $19,999 | 181 (2.8%) | 131 (2.0%) |
| $20,000 to $22,499 | 175 (2.7%) | 408 (6.1%) |
| $22,500 to $24,999 | 92 (1.4%) | 413 (6.2%) |
| $25,000 to $29,999 | 480 (7.3%) | 658 (9.9%) |
| $30,000 to $34,999 | 246 (3.7%) | 749 (11.3%) |
| $35,000 to $39,999 | 467 (7.1%) | 516 (7.8%) |
| $40,000 to $44,999 | 245 (3.7%) | 412 (6.2%) |
| $45,000 to $49,999 | 486 (7.4%) | 256 (3.8%) |
| $50,000 to $54,999 | 237 (3.6%) | 264 (4.0%) |
| $55,000 to $64,999 | 500 (7.6%) | 236 (3.5%) |
| $65,000 to $74,999 | 355 (5.4%) | 197 (3.0%) |
| $75,000 to $99,999 | 573 (8.7%) | 177 (2.7%) |
| $100,000+ | 769 (11.7%) | 430 (6.5%) |
| Total | 6,559 (100.0%) | 6,653 (100.0%) |
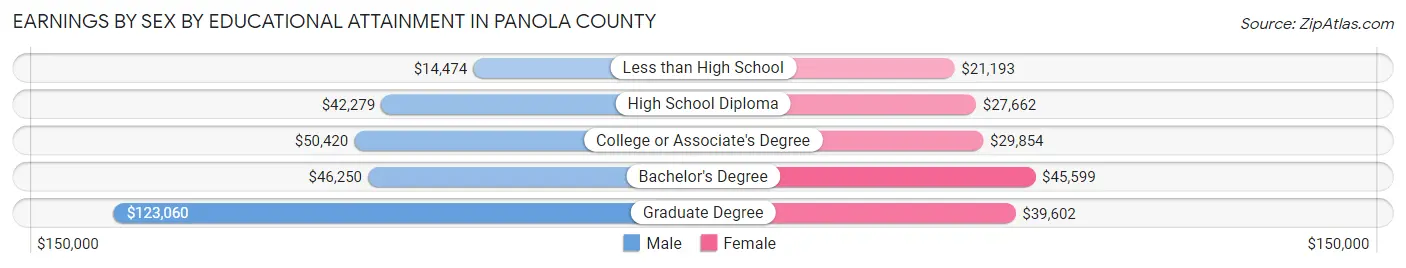
Earnings by Sex by Educational Attainment in Panola County
Average earnings in Panola County are $43,397 for men and $32,806 for women, a difference of 24.4%. Men with an educational attainment of graduate degree enjoy the highest average annual earnings of $123,060, while those with less than high school education earn the least with $14,474. Women with an educational attainment of bachelor's degree earn the most with the average annual earnings of $45,599, while those with less than high school education have the smallest earnings of $21,193.
| Educational Attainment | Male Income | Female Income |
| Less than High School | $14,474 | $21,193 |
| High School Diploma | $42,279 | $27,662 |
| College or Associate's Degree | $50,420 | $29,854 |
| Bachelor's Degree | $46,250 | $45,599 |
| Graduate Degree | $123,060 | $39,602 |
| Total | $43,397 | $32,806 |
Family Income in Panola County
Family Income Brackets in Panola County
According to the Panola County family income data, there are 1,674 families falling into the $50,000 to $74,999 income range, which is the most common income bracket and makes up 20.2% of all families. Conversely, the $10,000 to $14,999 income bracket is the least frequent group with only 307 families (3.7%) belonging to this category.
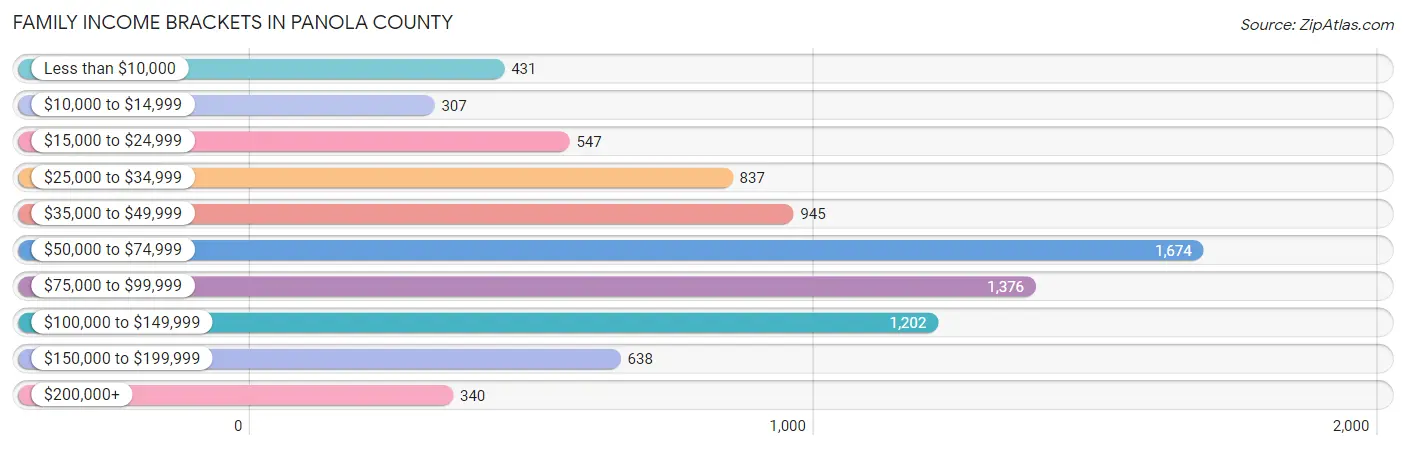
| Income Bracket | # Families | % Families |
| Less than $10,000 | 431 | 5.2% |
| $10,000 to $14,999 | 307 | 3.7% |
| $15,000 to $24,999 | 547 | 6.6% |
| $25,000 to $34,999 | 837 | 10.1% |
| $35,000 to $49,999 | 945 | 11.4% |
| $50,000 to $74,999 | 1,674 | 20.2% |
| $75,000 to $99,999 | 1,376 | 16.6% |
| $100,000 to $149,999 | 1,202 | 14.5% |
| $150,000 to $199,999 | 638 | 7.7% |
| $200,000+ | 340 | 4.1% |
Family Income by Famaliy Size in Panola County
7+ person families (112 | 1.3%) account for the highest median family income in Panola County with $94,688 per family, while 2-person families (3,827 | 46.2%) have the highest median income of $28,210 per family member.
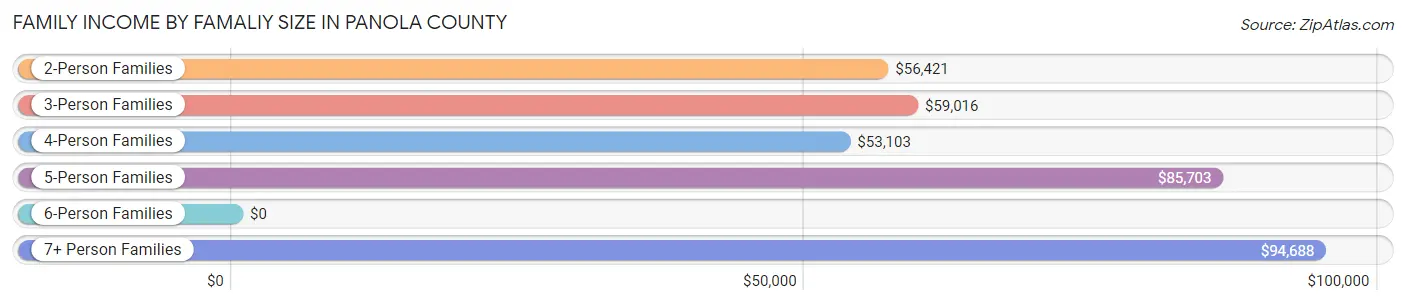
| Income Bracket | # Families | Median Income |
| 2-Person Families | 3,827 (46.2%) | $56,421 |
| 3-Person Families | 2,061 (24.9%) | $59,016 |
| 4-Person Families | 1,105 (13.3%) | $53,103 |
| 5-Person Families | 1,141 (13.8%) | $85,703 |
| 6-Person Families | 41 (0.5%) | $0 |
| 7+ Person Families | 112 (1.3%) | $94,688 |
| Total | 8,287 (100.0%) | $60,911 |
Family Income by Number of Earners in Panola County
The median family income in Panola County is $60,911, with families comprising 3+ earners (646) having the highest median family income of $134,844, while families with no earners (1,796) have the lowest median family income of $37,117, accounting for 7.8% and 21.7% of families, respectively.
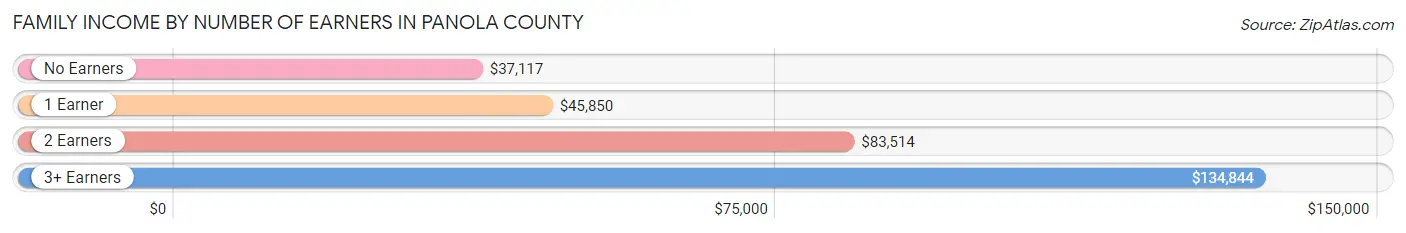
| Number of Earners | # Families | Median Income |
| No Earners | 1,796 (21.7%) | $37,117 |
| 1 Earner | 2,973 (35.9%) | $45,850 |
| 2 Earners | 2,872 (34.7%) | $83,514 |
| 3+ Earners | 646 (7.8%) | $134,844 |
| Total | 8,287 (100.0%) | $60,911 |
Household Income in Panola County
Household Income Brackets in Panola County
With 1,908 households falling in the category, the $50,000 to $74,999 income range is the most frequent in Panola County, accounting for 15.4% of all households. In contrast, only 384 households (3.1%) fall into the $200,000+ income bracket, making it the least populous group.
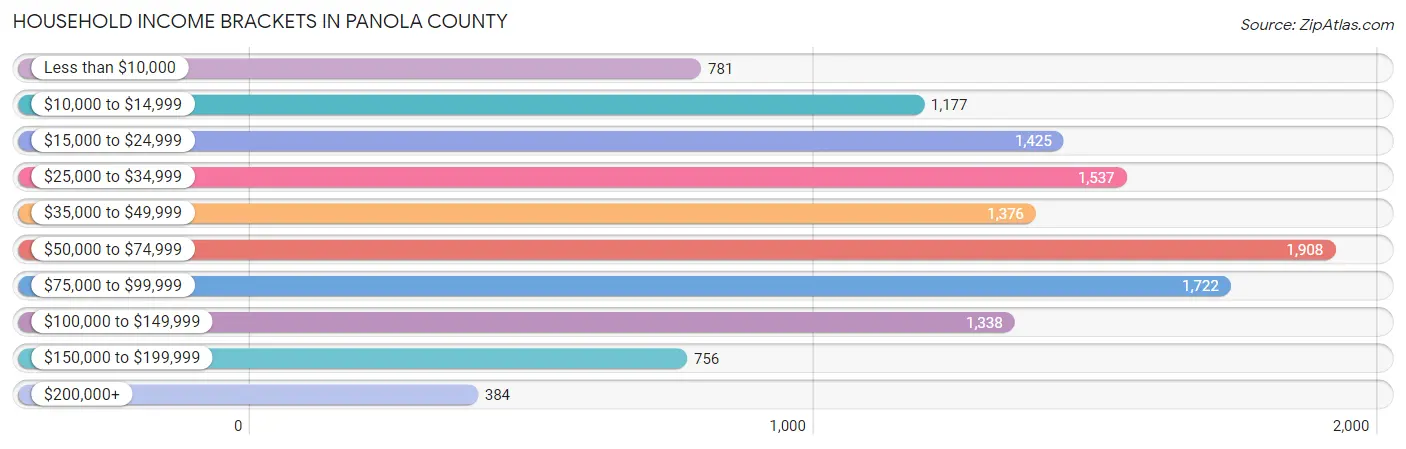
| Income Bracket | # Households | % Households |
| Less than $10,000 | 781 | 6.3% |
| $10,000 to $14,999 | 1,177 | 9.5% |
| $15,000 to $24,999 | 1,425 | 11.5% |
| $25,000 to $34,999 | 1,537 | 12.4% |
| $35,000 to $49,999 | 1,376 | 11.1% |
| $50,000 to $74,999 | 1,908 | 15.4% |
| $75,000 to $99,999 | 1,722 | 13.9% |
| $100,000 to $149,999 | 1,338 | 10.8% |
| $150,000 to $199,999 | 756 | 6.1% |
| $200,000+ | 384 | 3.1% |
Household Income by Householder Age in Panola County
The median household income in Panola County is $47,894, with the highest median household income of $56,916 found in the 25 to 44 years age bracket for the primary householder. A total of 3,439 households (27.8%) fall into this category. Meanwhile, the 15 to 24 years age bracket for the primary householder has the lowest median household income of $35,991, with 235 households (1.9%) in this group.
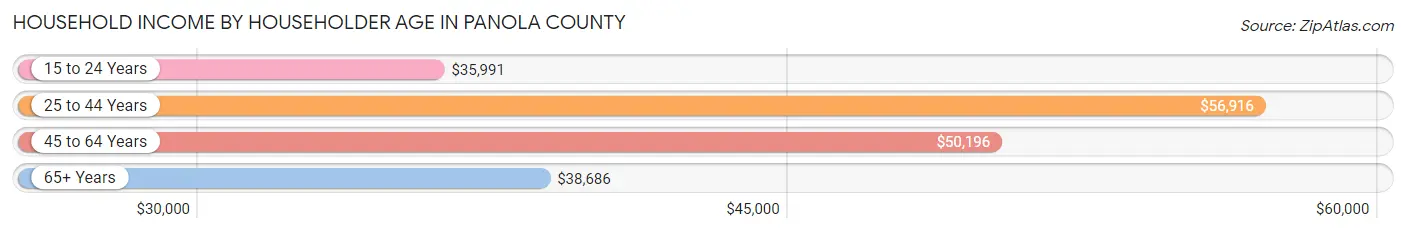
| Income Bracket | # Households | Median Income |
| 15 to 24 Years | 235 (1.9%) | $35,991 |
| 25 to 44 Years | 3,439 (27.8%) | $56,916 |
| 45 to 64 Years | 4,827 (39.0%) | $50,196 |
| 65+ Years | 3,891 (31.4%) | $38,686 |
| Total | 12,392 (100.0%) | $47,894 |
Poverty in Panola County
Income Below Poverty by Sex and Age in Panola County
With 21.9% poverty level for males and 19.1% for females among the residents of Panola County, 15 year old males and 16 and 17 year old females are the most vulnerable to poverty, with 122 males (44.2%) and 164 females (46.3%) in their respective age groups living below the poverty level.
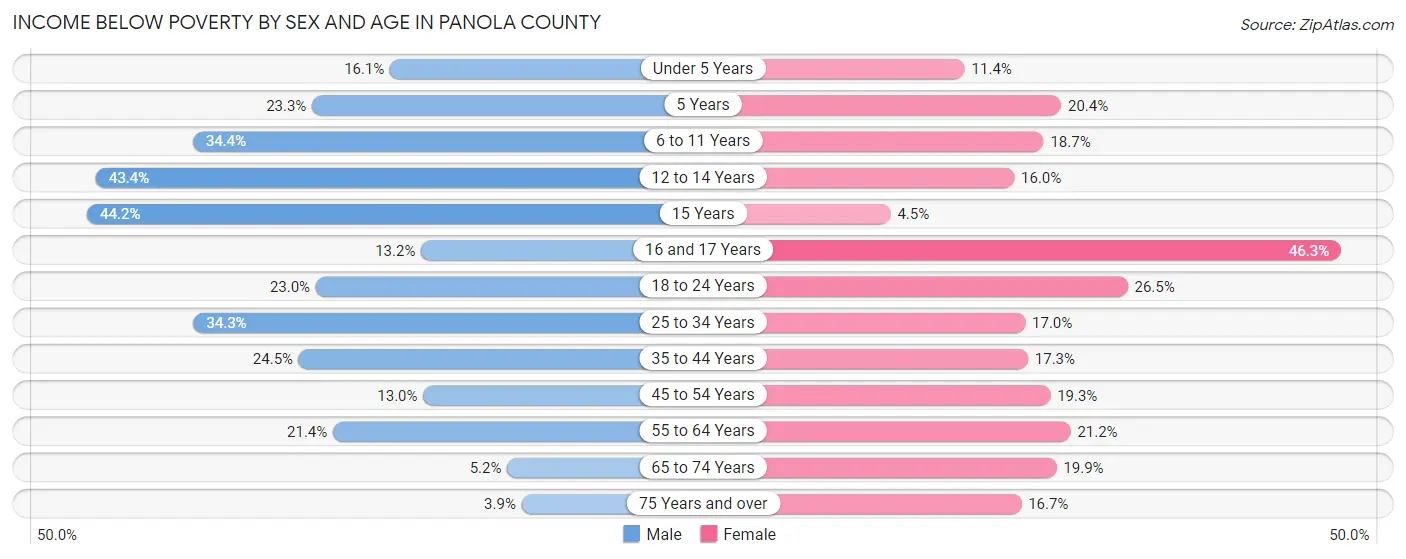
| Age Bracket | Male | Female |
| Under 5 Years | 180 (16.1%) | 127 (11.4%) |
| 5 Years | 62 (23.3%) | 23 (20.3%) |
| 6 to 11 Years | 443 (34.4%) | 261 (18.7%) |
| 12 to 14 Years | 328 (43.4%) | 107 (16.0%) |
| 15 Years | 122 (44.2%) | 15 (4.5%) |
| 16 and 17 Years | 57 (13.2%) | 164 (46.3%) |
| 18 to 24 Years | 327 (23.0%) | 380 (26.5%) |
| 25 to 34 Years | 691 (34.3%) | 372 (17.0%) |
| 35 to 44 Years | 426 (24.5%) | 347 (17.3%) |
| 45 to 54 Years | 249 (13.0%) | 404 (19.3%) |
| 55 to 64 Years | 453 (21.4%) | 495 (21.2%) |
| 65 to 74 Years | 83 (5.2%) | 350 (19.9%) |
| 75 Years and over | 33 (3.9%) | 213 (16.7%) |
| Total | 3,454 (21.9%) | 3,258 (19.1%) |
Income Above Poverty by Sex and Age in Panola County
According to the poverty statistics in Panola County, males aged 75 years and over and females aged 15 years are the age groups that are most secure financially, with 96.1% of males and 95.5% of females in these age groups living above the poverty line.
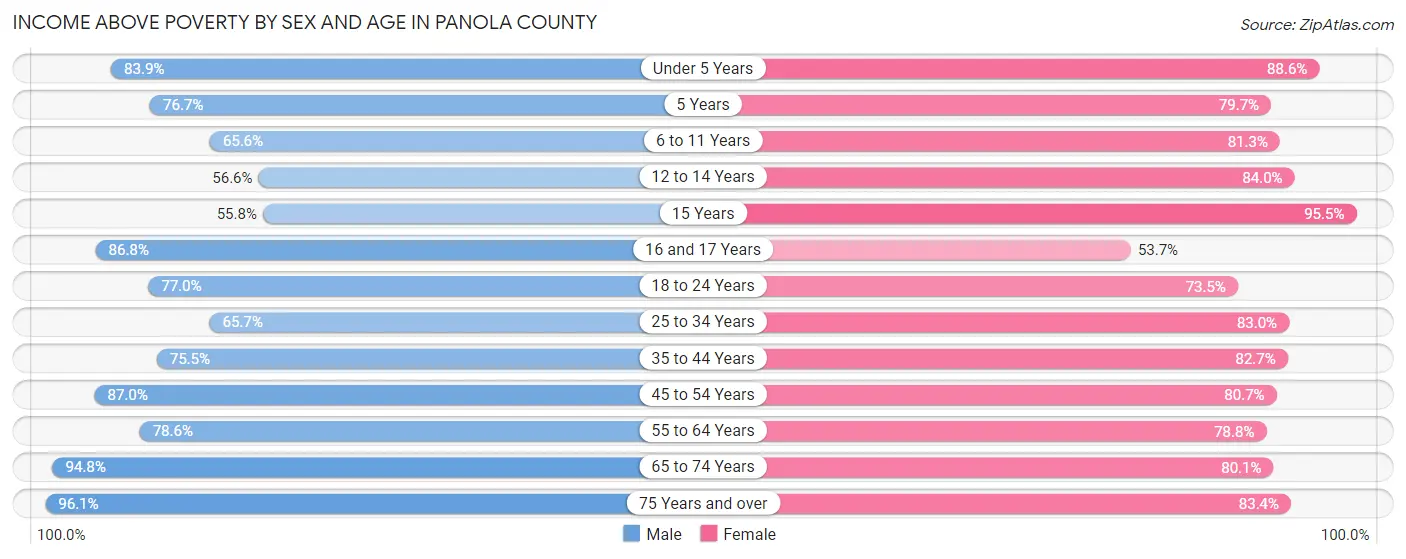
| Age Bracket | Male | Female |
| Under 5 Years | 940 (83.9%) | 987 (88.6%) |
| 5 Years | 204 (76.7%) | 90 (79.6%) |
| 6 to 11 Years | 845 (65.6%) | 1,133 (81.3%) |
| 12 to 14 Years | 428 (56.6%) | 562 (84.0%) |
| 15 Years | 154 (55.8%) | 317 (95.5%) |
| 16 and 17 Years | 375 (86.8%) | 190 (53.7%) |
| 18 to 24 Years | 1,097 (77.0%) | 1,053 (73.5%) |
| 25 to 34 Years | 1,322 (65.7%) | 1,815 (83.0%) |
| 35 to 44 Years | 1,310 (75.5%) | 1,662 (82.7%) |
| 45 to 54 Years | 1,668 (87.0%) | 1,685 (80.7%) |
| 55 to 64 Years | 1,667 (78.6%) | 1,838 (78.8%) |
| 65 to 74 Years | 1,513 (94.8%) | 1,407 (80.1%) |
| 75 Years and over | 823 (96.1%) | 1,066 (83.4%) |
| Total | 12,346 (78.1%) | 13,805 (80.9%) |
Income Below Poverty Among Married-Couple Families in Panola County
The poverty statistics for married-couple families in Panola County show that 4.6% or 244 of the total 5,346 families live below the poverty line. Families with no children have the highest poverty rate of 5.0%, comprising of 160 families. On the other hand, families with 5 or more children have the lowest poverty rate of 0.0%, which includes 0 families.
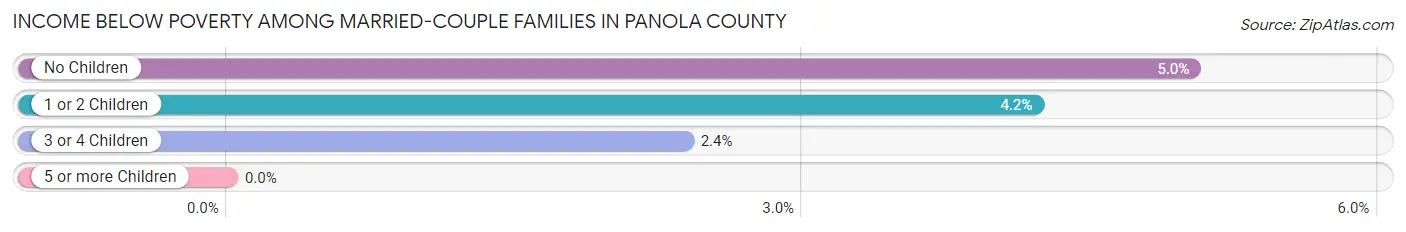
| Children | Above Poverty | Below Poverty |
| No Children | 3,018 (95.0%) | 160 (5.0%) |
| 1 or 2 Children | 1,729 (95.8%) | 76 (4.2%) |
| 3 or 4 Children | 328 (97.6%) | 8 (2.4%) |
| 5 or more Children | 27 (100.0%) | 0 (0.0%) |
| Total | 5,102 (95.4%) | 244 (4.6%) |
Income Below Poverty Among Single-Parent Households in Panola County
According to the poverty data in Panola County, 19.1% or 86 single-father households and 33.6% or 837 single-mother households are living below the poverty line. Among single-father households, those with 3 or 4 children have the highest poverty rate, with 3 households (100.0%) experiencing poverty. Likewise, among single-mother households, those with 5 or more children have the highest poverty rate, with 24 households (100.0%) falling below the poverty line.
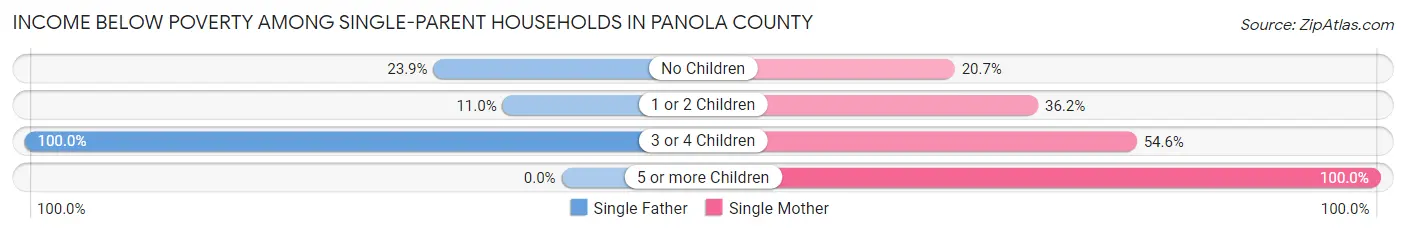
| Children | Single Father | Single Mother |
| No Children | 63 (23.9%) | 176 (20.7%) |
| 1 or 2 Children | 20 (11.0%) | 482 (36.2%) |
| 3 or 4 Children | 3 (100.0%) | 155 (54.6%) |
| 5 or more Children | 0 (0.0%) | 24 (100.0%) |
| Total | 86 (19.1%) | 837 (33.6%) |
Income Below Poverty Among Married-Couple vs Single-Parent Households in Panola County
The poverty data for Panola County shows that 244 of the married-couple family households (4.6%) and 923 of the single-parent households (31.4%) are living below the poverty level. Within the married-couple family households, those with no children have the highest poverty rate, with 160 households (5.0%) falling below the poverty line. Among the single-parent households, those with 5 or more children have the highest poverty rate, with 24 household (92.3%) living below poverty.
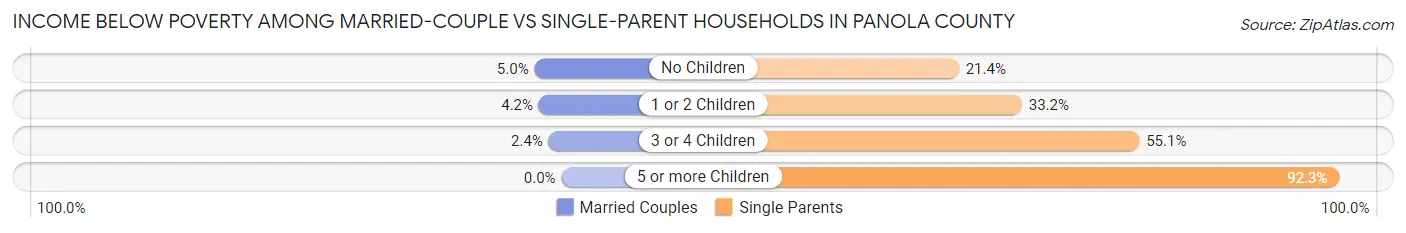
| Children | Married-Couple Families | Single-Parent Households |
| No Children | 160 (5.0%) | 239 (21.4%) |
| 1 or 2 Children | 76 (4.2%) | 502 (33.2%) |
| 3 or 4 Children | 8 (2.4%) | 158 (55.0%) |
| 5 or more Children | 0 (0.0%) | 24 (92.3%) |
| Total | 244 (4.6%) | 923 (31.4%) |
Race in Panola County
The most populous races in Panola County are Black / African American (16,465 | 49.7%), White / Caucasian (15,654 | 47.2%), and Two or more Races (696 | 2.1%).
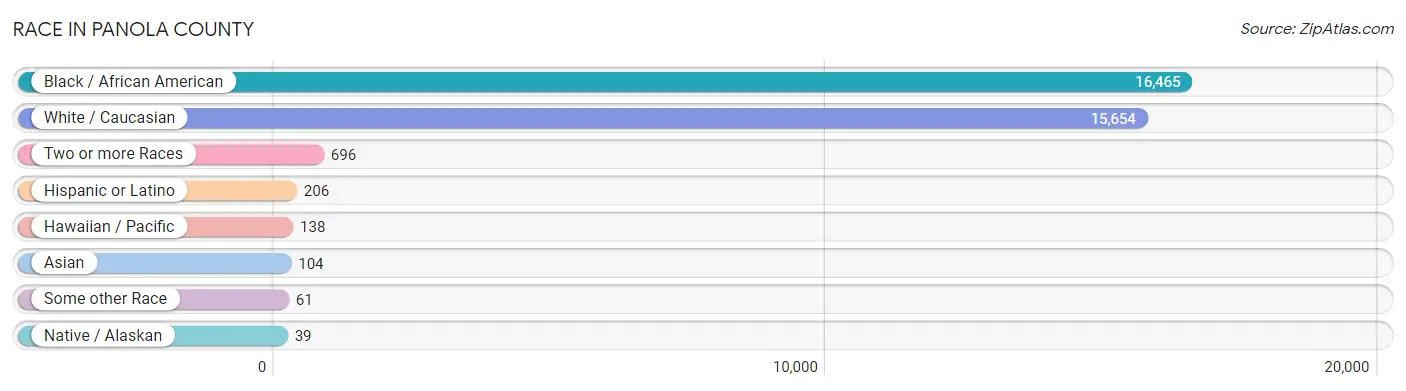
| Race | # Population | % Population |
| Asian | 104 | 0.3% |
| Black / African American | 16,465 | 49.7% |
| Hawaiian / Pacific | 138 | 0.4% |
| Hispanic or Latino | 206 | 0.6% |
| Native / Alaskan | 39 | 0.1% |
| White / Caucasian | 15,654 | 47.2% |
| Two or more Races | 696 | 2.1% |
| Some other Race | 61 | 0.2% |
| Total | 33,157 | 100.0% |
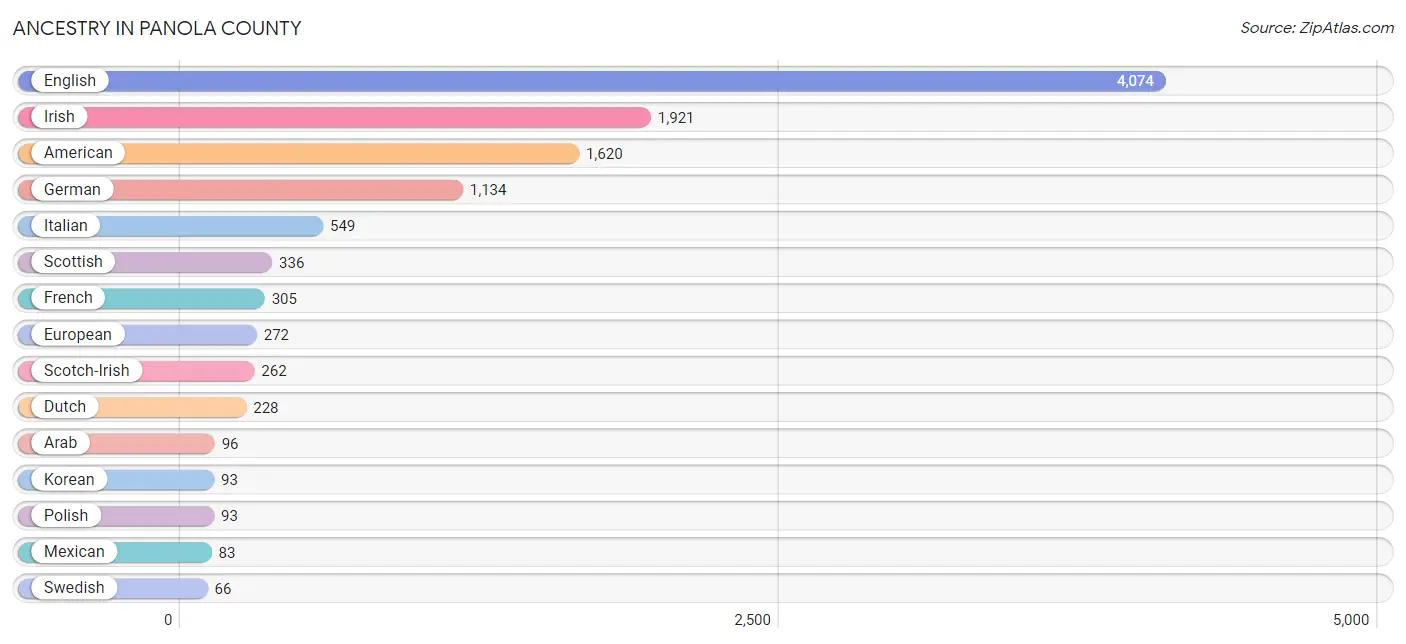
Ancestry in Panola County
The most populous ancestries reported in Panola County are English (4,074 | 12.3%), Irish (1,921 | 5.8%), American (1,620 | 4.9%), German (1,134 | 3.4%), and Italian (549 | 1.7%), together accounting for 28.0% of all Panola County residents.
| Ancestry | # Population | % Population |
| African | 20 | 0.1% |
| American | 1,620 | 4.9% |
| Arab | 96 | 0.3% |
| British | 14 | 0.0% |
| Burmese | 12 | 0.0% |
| Cajun | 3 | 0.0% |
| Cherokee | 61 | 0.2% |
| Choctaw | 35 | 0.1% |
| Cuban | 42 | 0.1% |
| Danish | 21 | 0.1% |
| Dutch | 228 | 0.7% |
| Egyptian | 1 | 0.0% |
| English | 4,074 | 12.3% |
| European | 272 | 0.8% |
| French | 305 | 0.9% |
| French American Indian | 1 | 0.0% |
| French Canadian | 2 | 0.0% |
| German | 1,134 | 3.4% |
| Hungarian | 5 | 0.0% |
| Irish | 1,921 | 5.8% |
| Italian | 549 | 1.7% |
| Jordanian | 40 | 0.1% |
| Korean | 93 | 0.3% |
| Mexican | 83 | 0.3% |
| Native Hawaiian | 11 | 0.0% |
| Northern European | 6 | 0.0% |
| Norwegian | 13 | 0.0% |
| Palestinian | 35 | 0.1% |
| Polish | 93 | 0.3% |
| Portuguese | 10 | 0.0% |
| Puerto Rican | 13 | 0.0% |
| Russian | 18 | 0.1% |
| Samoan | 18 | 0.1% |
| Scandinavian | 9 | 0.0% |
| Scotch-Irish | 262 | 0.8% |
| Scottish | 336 | 1.0% |
| Slovak | 1 | 0.0% |
| Spaniard | 60 | 0.2% |
| Subsaharan African | 20 | 0.1% |
| Swedish | 66 | 0.2% |
| Swiss | 18 | 0.1% |
| Thai | 11 | 0.0% |
| Welsh | 26 | 0.1% | View All 43 Rows |
Immigrants in Panola County
The most numerous immigrant groups reported in Panola County came from Oceania (109 | 0.3%), Asia (60 | 0.2%), Western Asia (49 | 0.2%), Jordan (40 | 0.1%), and Europe (27 | 0.1%), together accounting for 0.9% of all Panola County residents.
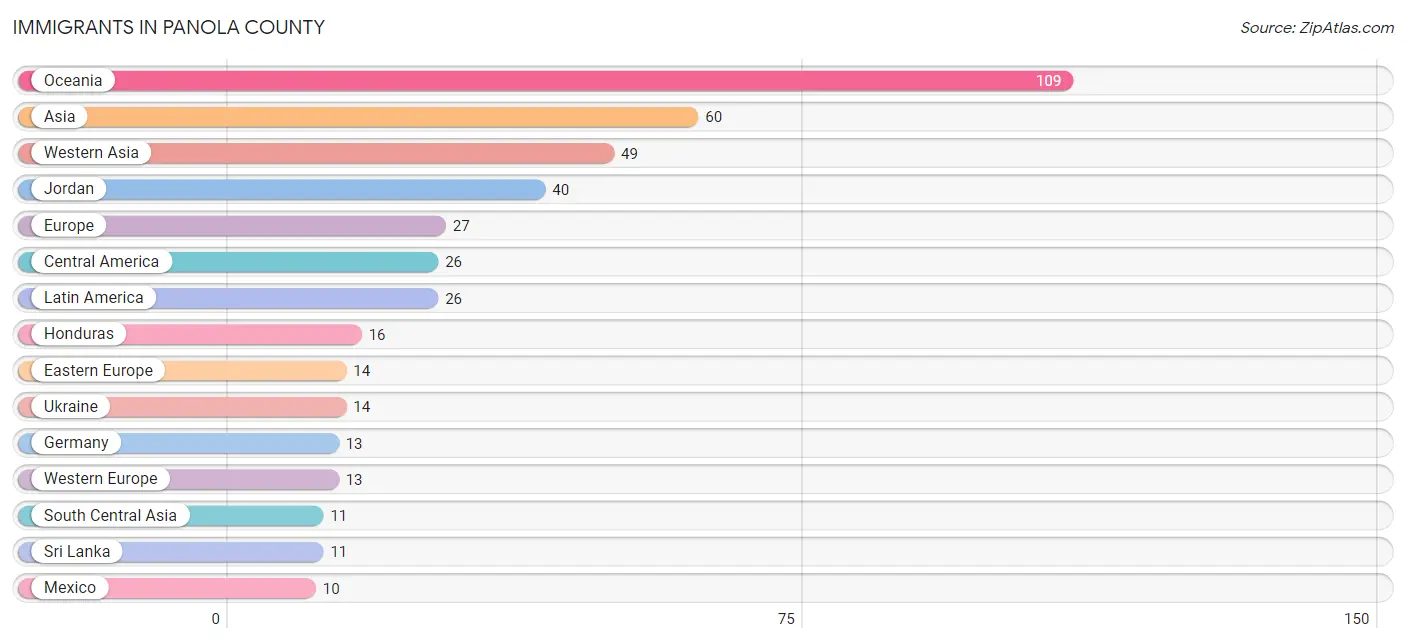
| Immigration Origin | # Population | % Population |
| Africa | 1 | 0.0% |
| Asia | 60 | 0.2% |
| Central America | 26 | 0.1% |
| Eastern Europe | 14 | 0.0% |
| Europe | 27 | 0.1% |
| Germany | 13 | 0.0% |
| Honduras | 16 | 0.1% |
| Israel | 9 | 0.0% |
| Jordan | 40 | 0.1% |
| Latin America | 26 | 0.1% |
| Mexico | 10 | 0.0% |
| Northern Africa | 1 | 0.0% |
| Oceania | 109 | 0.3% |
| South Central Asia | 11 | 0.0% |
| Sri Lanka | 11 | 0.0% |
| Sudan | 1 | 0.0% |
| Ukraine | 14 | 0.0% |
| Western Asia | 49 | 0.2% |
| Western Europe | 13 | 0.0% | View All 19 Rows |
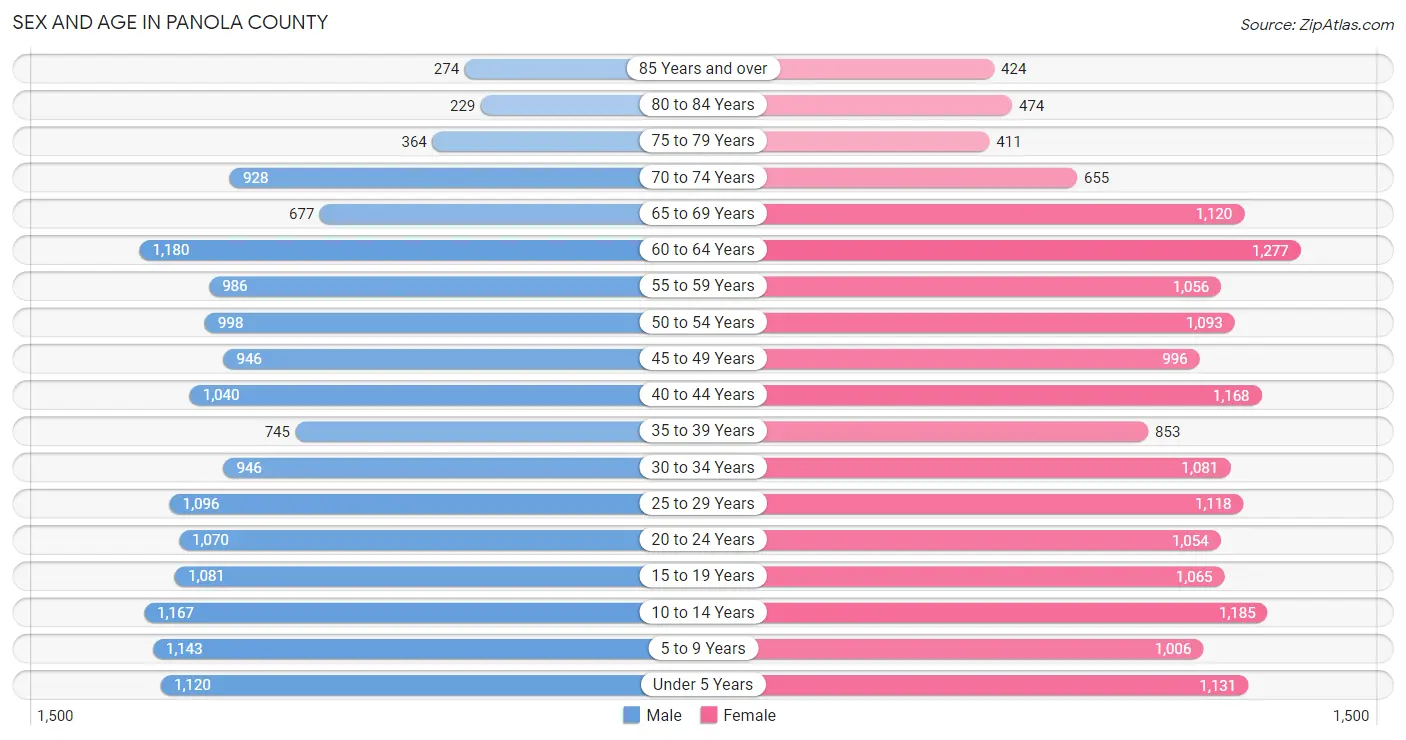
Sex and Age in Panola County
Sex and Age in Panola County
The most populous age groups in Panola County are 60 to 64 Years (1,180 | 7.4%) for men and 60 to 64 Years (1,277 | 7.4%) for women.
| Age Bracket | Male | Female |
| Under 5 Years | 1,120 (7.0%) | 1,131 (6.6%) |
| 5 to 9 Years | 1,143 (7.1%) | 1,006 (5.9%) |
| 10 to 14 Years | 1,167 (7.3%) | 1,185 (6.9%) |
| 15 to 19 Years | 1,081 (6.8%) | 1,065 (6.2%) |
| 20 to 24 Years | 1,070 (6.7%) | 1,054 (6.1%) |
| 25 to 29 Years | 1,096 (6.9%) | 1,118 (6.5%) |
| 30 to 34 Years | 946 (5.9%) | 1,081 (6.3%) |
| 35 to 39 Years | 745 (4.7%) | 853 (5.0%) |
| 40 to 44 Years | 1,040 (6.5%) | 1,168 (6.8%) |
| 45 to 49 Years | 946 (5.9%) | 996 (5.8%) |
| 50 to 54 Years | 998 (6.2%) | 1,093 (6.4%) |
| 55 to 59 Years | 986 (6.2%) | 1,056 (6.1%) |
| 60 to 64 Years | 1,180 (7.4%) | 1,277 (7.4%) |
| 65 to 69 Years | 677 (4.2%) | 1,120 (6.5%) |
| 70 to 74 Years | 928 (5.8%) | 655 (3.8%) |
| 75 to 79 Years | 364 (2.3%) | 411 (2.4%) |
| 80 to 84 Years | 229 (1.4%) | 474 (2.8%) |
| 85 Years and over | 274 (1.7%) | 424 (2.5%) |
| Total | 15,990 (100.0%) | 17,167 (100.0%) |
Families and Households in Panola County
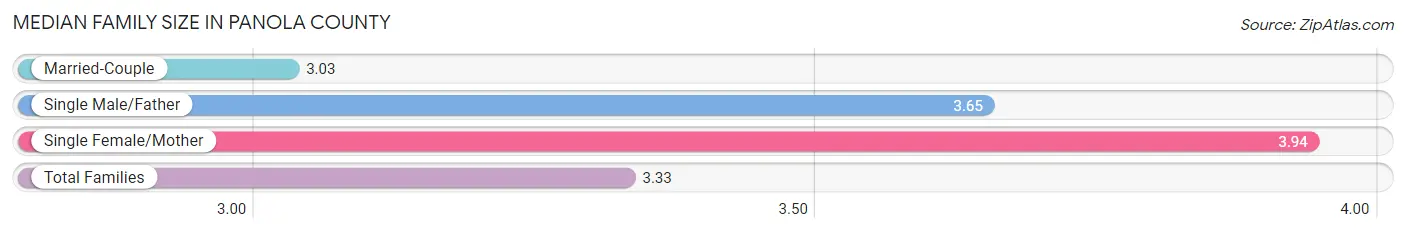
Median Family Size in Panola County
The median family size in Panola County is 3.33 persons per family, with single female/mother families (2,490 | 30.0%) accounting for the largest median family size of 3.94 persons per family. On the other hand, married-couple families (5,346 | 64.5%) represent the smallest median family size with 3.03 persons per family.
| Family Type | # Families | Family Size |
| Married-Couple | 5,346 (64.5%) | 3.03 |
| Single Male/Father | 451 (5.4%) | 3.65 |
| Single Female/Mother | 2,490 (30.0%) | 3.94 |
| Total Families | 8,287 (100.0%) | 3.33 |
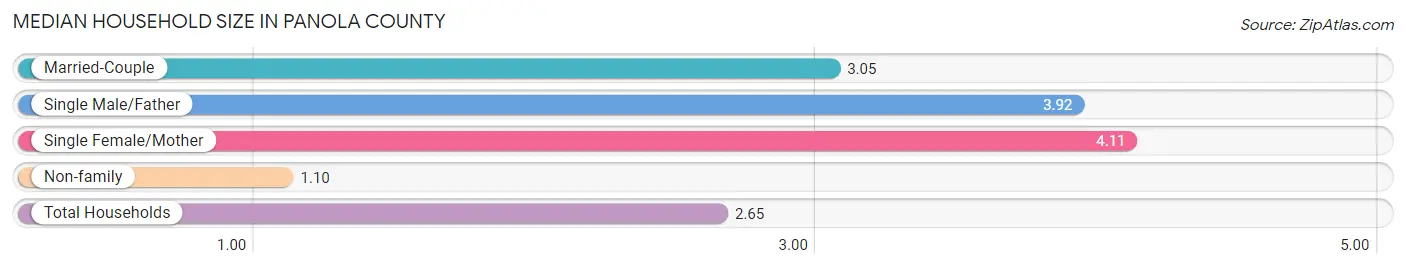
Median Household Size in Panola County
The median household size in Panola County is 2.65 persons per household, with single female/mother households (2,490 | 20.1%) accounting for the largest median household size of 4.11 persons per household. non-family households (4,105 | 33.1%) represent the smallest median household size with 1.10 persons per household.
| Household Type | # Households | Household Size |
| Married-Couple | 5,346 (43.1%) | 3.05 |
| Single Male/Father | 451 (3.6%) | 3.92 |
| Single Female/Mother | 2,490 (20.1%) | 4.11 |
| Non-family | 4,105 (33.1%) | 1.10 |
| Total Households | 12,392 (100.0%) | 2.65 |
Household Size by Marriage Status in Panola County
Out of a total of 12,392 households in Panola County, 8,287 (66.9%) are family households, while 4,105 (33.1%) are nonfamily households. The most numerous type of family households are 2-person households, comprising 3,709, and the most common type of nonfamily households are 1-person households, comprising 3,730.
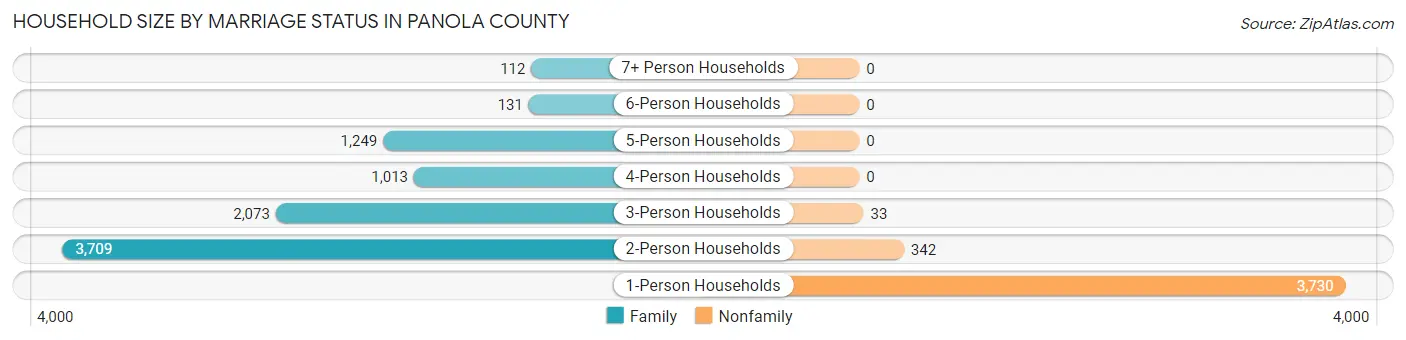
| Household Size | Family Households | Nonfamily Households |
| 1-Person Households | - | 3,730 (30.1%) |
| 2-Person Households | 3,709 (29.9%) | 342 (2.8%) |
| 3-Person Households | 2,073 (16.7%) | 33 (0.3%) |
| 4-Person Households | 1,013 (8.2%) | 0 (0.0%) |
| 5-Person Households | 1,249 (10.1%) | 0 (0.0%) |
| 6-Person Households | 131 (1.1%) | 0 (0.0%) |
| 7+ Person Households | 112 (0.9%) | 0 (0.0%) |
| Total | 8,287 (66.9%) | 4,105 (33.1%) |
Female Fertility in Panola County
Fertility by Age in Panola County
Average fertility rate in Panola County is 68.0 births per 1,000 women. Women in the age bracket of 20 to 34 years have the highest fertility rate with 98.0 births per 1,000 women. Women in the age bracket of 20 to 34 years acount for 61.7% of all women with births.
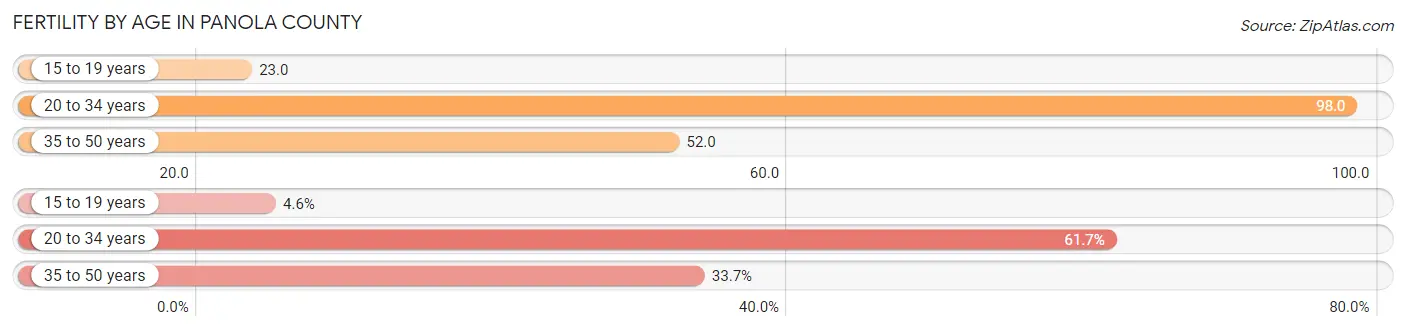
| Age Bracket | Women with Births | Births / 1,000 Women |
| 15 to 19 years | 24 (4.6%) | 23.0 |
| 20 to 34 years | 320 (61.7%) | 98.0 |
| 35 to 50 years | 175 (33.7%) | 52.0 |
| Total | 519 (100.0%) | 68.0 |
Fertility by Age by Marriage Status in Panola County
48.9% of women with births (519) in Panola County are married. The highest percentage of unmarried women with births falls into 15 to 19 years age bracket with 100.0% of them unmarried at the time of birth, while the lowest percentage of unmarried women with births belong to 35 to 50 years age bracket with 18.9% of them unmarried.
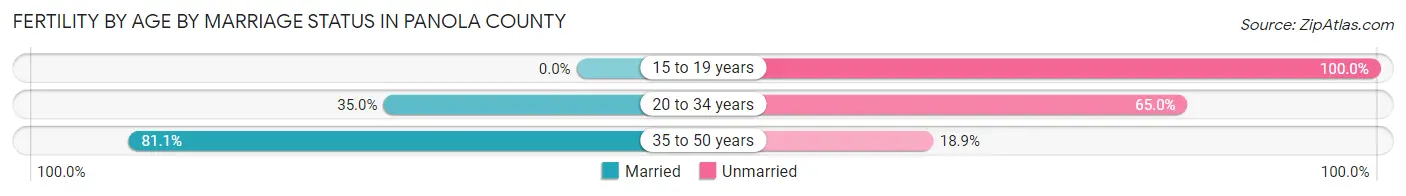
| Age Bracket | Married | Unmarried |
| 15 to 19 years | 0 (0.0%) | 24 (100.0%) |
| 20 to 34 years | 112 (35.0%) | 208 (65.0%) |
| 35 to 50 years | 142 (81.1%) | 33 (18.9%) |
| Total | 254 (48.9%) | 265 (51.1%) |
Fertility by Education in Panola County
Average fertility rate in Panola County is 68.0 births per 1,000 women. Women with the education attainment of graduate degree have the highest fertility rate of 484.0 births per 1,000 women, while women with the education attainment of bachelor's degree have the lowest fertility at 2.0 births per 1,000 women. Women with the education attainment of college or associate's degree represent 40.5% of all women with births.
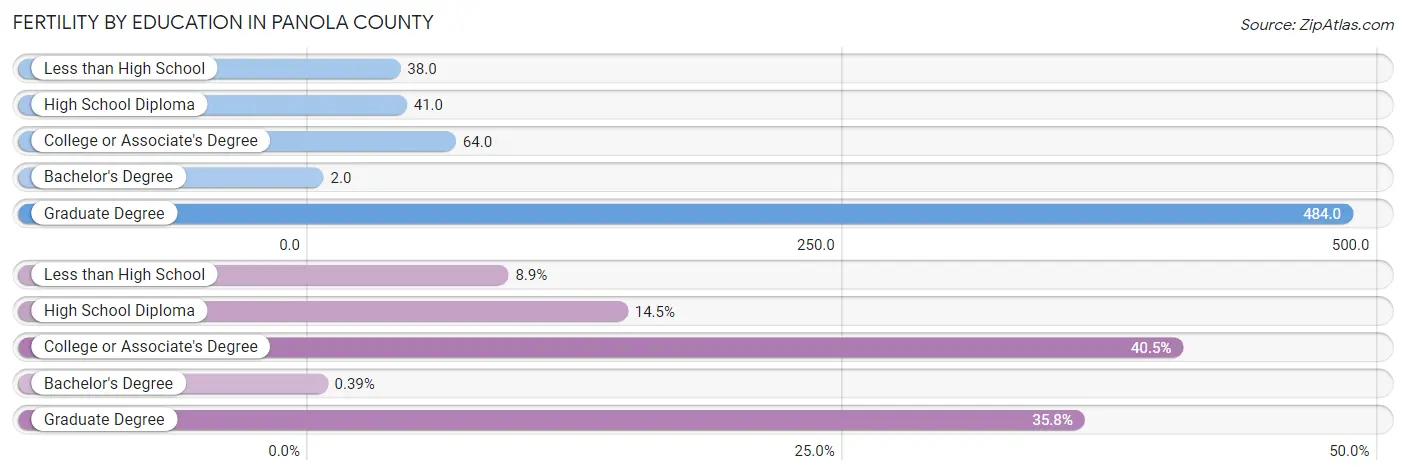
| Educational Attainment | Women with Births | Births / 1,000 Women |
| Less than High School | 46 (8.9%) | 38.0 |
| High School Diploma | 75 (14.4%) | 41.0 |
| College or Associate's Degree | 210 (40.5%) | 64.0 |
| Bachelor's Degree | 2 (0.4%) | 2.0 |
| Graduate Degree | 186 (35.8%) | 484.0 |
| Total | 519 (100.0%) | 68.0 |
Fertility by Education by Marriage Status in Panola County
51.1% of women with births in Panola County are unmarried. Women with the educational attainment of graduate degree are most likely to be married with 100.0% of them married at childbirth, while women with the educational attainment of bachelor's degree are least likely to be married with 100.0% of them unmarried at childbirth.
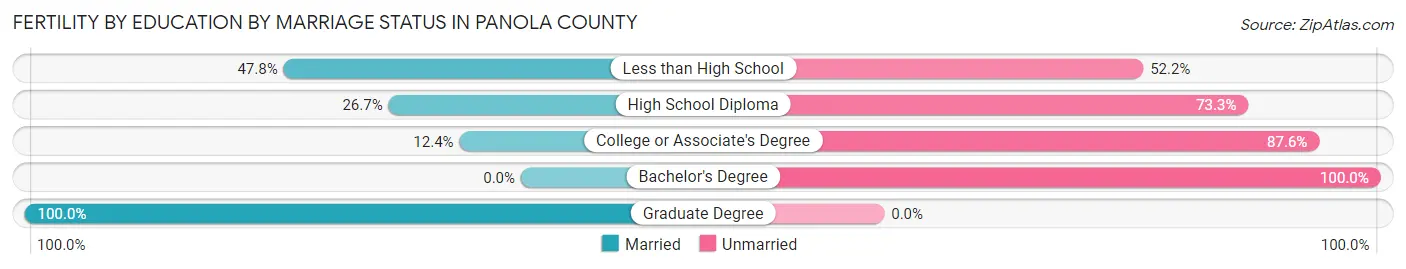
| Educational Attainment | Married | Unmarried |
| Less than High School | 22 (47.8%) | 24 (52.2%) |
| High School Diploma | 20 (26.7%) | 55 (73.3%) |
| College or Associate's Degree | 26 (12.4%) | 184 (87.6%) |
| Bachelor's Degree | 0 (0.0%) | 2 (100.0%) |
| Graduate Degree | 186 (100.0%) | 0 (0.0%) |
| Total | 254 (48.9%) | 265 (51.1%) |
Employment Characteristics in Panola County
Employment by Class of Employer in Panola County
Among the 11,587 employed individuals in Panola County, private company employees (7,889 | 68.1%), state government employees (1,375 | 11.9%), and local government employees (702 | 6.1%) make up the most common classes of employment.
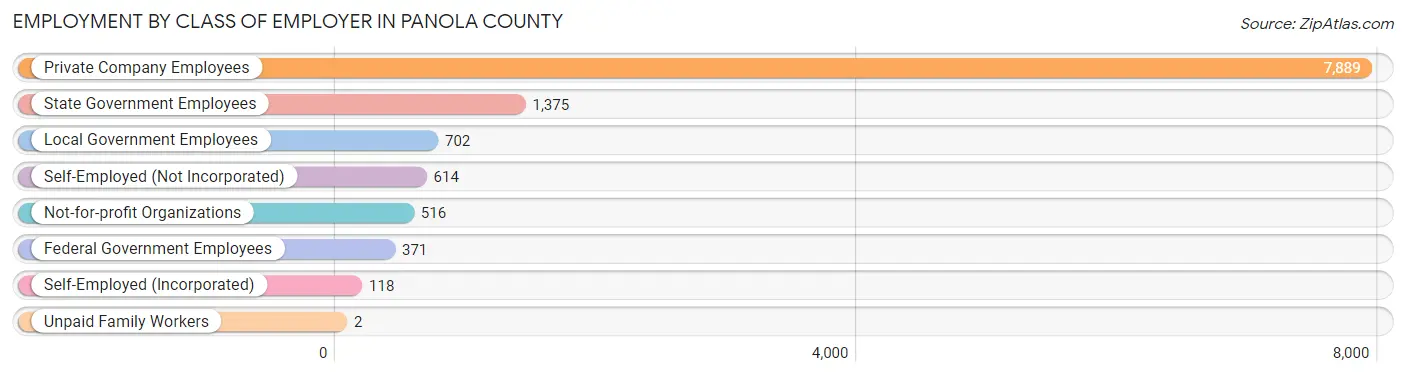
| Employer Class | # Employees | % Employees |
| Private Company Employees | 7,889 | 68.1% |
| Self-Employed (Incorporated) | 118 | 1.0% |
| Self-Employed (Not Incorporated) | 614 | 5.3% |
| Not-for-profit Organizations | 516 | 4.4% |
| Local Government Employees | 702 | 6.1% |
| State Government Employees | 1,375 | 11.9% |
| Federal Government Employees | 371 | 3.2% |
| Unpaid Family Workers | 2 | 0.0% |
| Total | 11,587 | 100.0% |
Employment Status by Age in Panola County
According to the labor force statistics for Panola County, out of the total population over 16 years of age (25,797), 50.8% or 13,105 individuals are in the labor force, with 9.5% or 1,245 of them unemployed. The age group with the highest labor force participation rate is 25 to 29 years, with 74.4% or 1,647 individuals in the labor force. Within the labor force, the 16 to 19 years age range has the highest percentage of unemployed individuals, with 47.2% or 185 of them being unemployed.
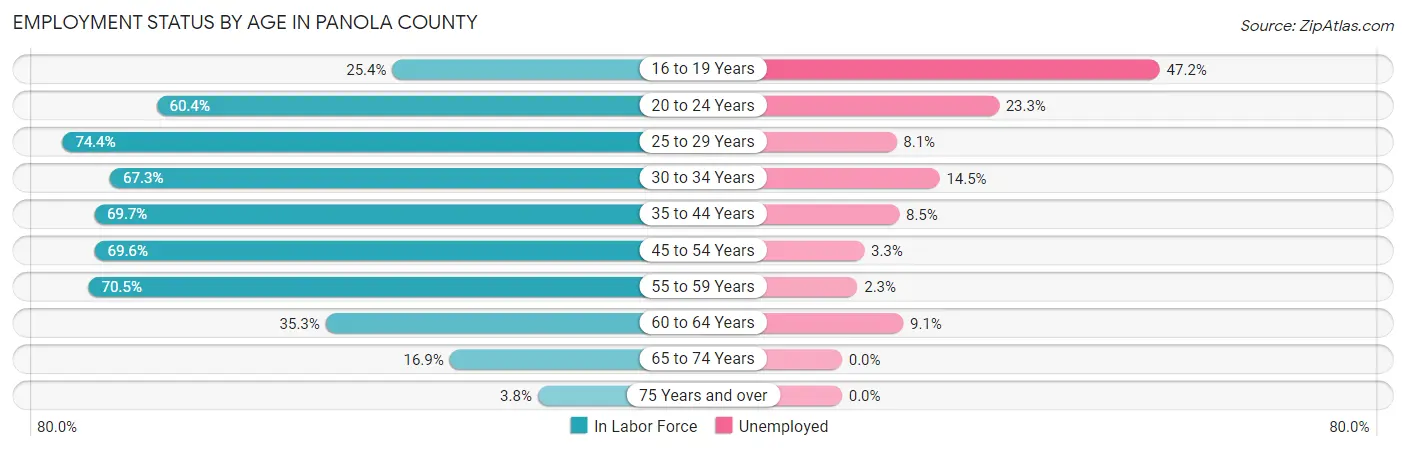
| Age Bracket | In Labor Force | Unemployed |
| 16 to 19 Years | 391 (25.4%) | 185 (47.2%) |
| 20 to 24 Years | 1,283 (60.4%) | 299 (23.3%) |
| 25 to 29 Years | 1,647 (74.4%) | 133 (8.1%) |
| 30 to 34 Years | 1,364 (67.3%) | 198 (14.5%) |
| 35 to 44 Years | 2,653 (69.7%) | 226 (8.5%) |
| 45 to 54 Years | 2,807 (69.6%) | 93 (3.3%) |
| 55 to 59 Years | 1,440 (70.5%) | 33 (2.3%) |
| 60 to 64 Years | 867 (35.3%) | 79 (9.1%) |
| 65 to 74 Years | 571 (16.9%) | 0 (0.0%) |
| 75 Years and over | 83 (3.8%) | 0 (0.0%) |
| Total | 13,105 (50.8%) | 1,245 (9.5%) |
Employment Status by Educational Attainment in Panola County
According to labor force statistics for Panola County, 65.0% of individuals (10,776) out of the total population between 25 and 64 years of age (16,579) are in the labor force, with 7.1% or 765 of them being unemployed. The group with the highest labor force participation rate are those with the educational attainment of bachelor's degree or higher, with 79.9% or 2,025 individuals in the labor force. Within the labor force, individuals with college / associate degree education have the highest percentage of unemployment, with 9.8% or 466 of them being unemployed.
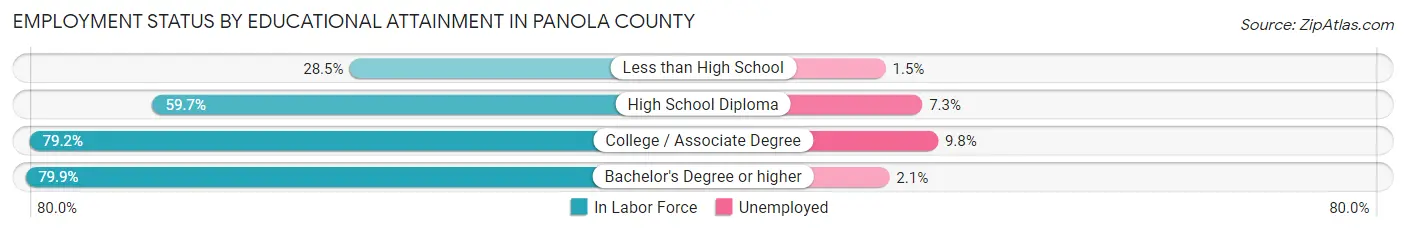
| Educational Attainment | In Labor Force | Unemployed |
| Less than High School | 732 (28.5%) | 39 (1.5%) |
| High School Diploma | 3,270 (59.7%) | 400 (7.3%) |
| College / Associate Degree | 4,752 (79.2%) | 588 (9.8%) |
| Bachelor's Degree or higher | 2,025 (79.9%) | 53 (2.1%) |
| Total | 10,776 (65.0%) | 1,177 (7.1%) |
Employment Occupations by Sex in Panola County
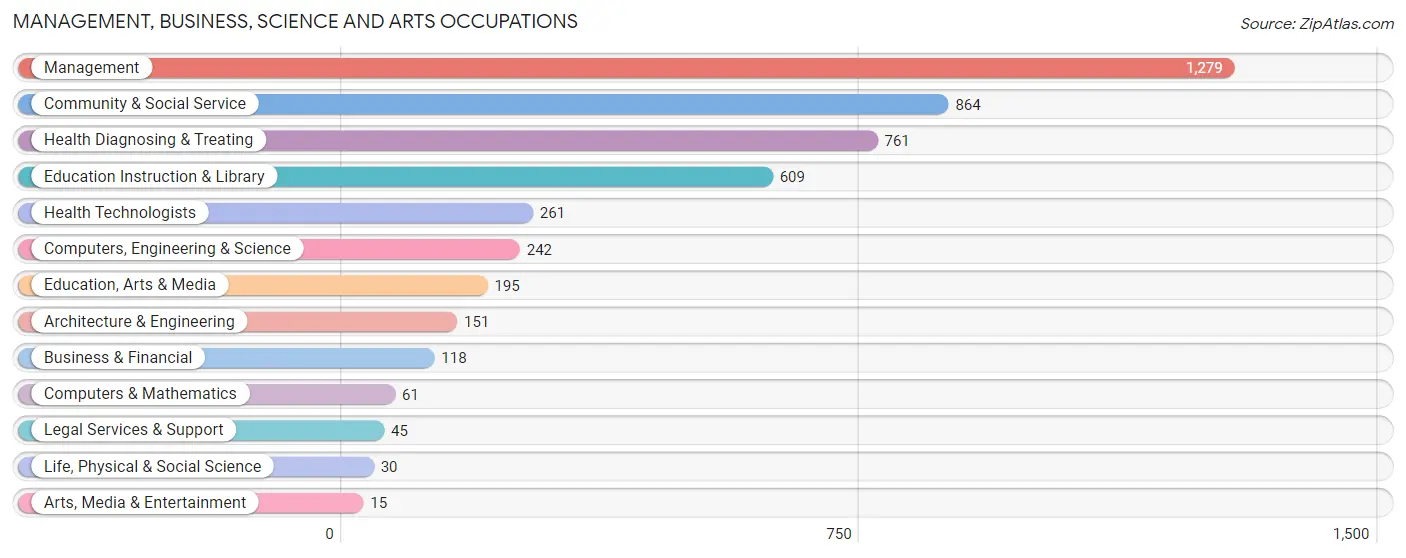
Management, Business, Science and Arts Occupations
The most common Management, Business, Science and Arts occupations in Panola County are Management (1,279 | 10.8%), Community & Social Service (864 | 7.3%), Health Diagnosing & Treating (761 | 6.4%), Education Instruction & Library (609 | 5.1%), and Health Technologists (261 | 2.2%).
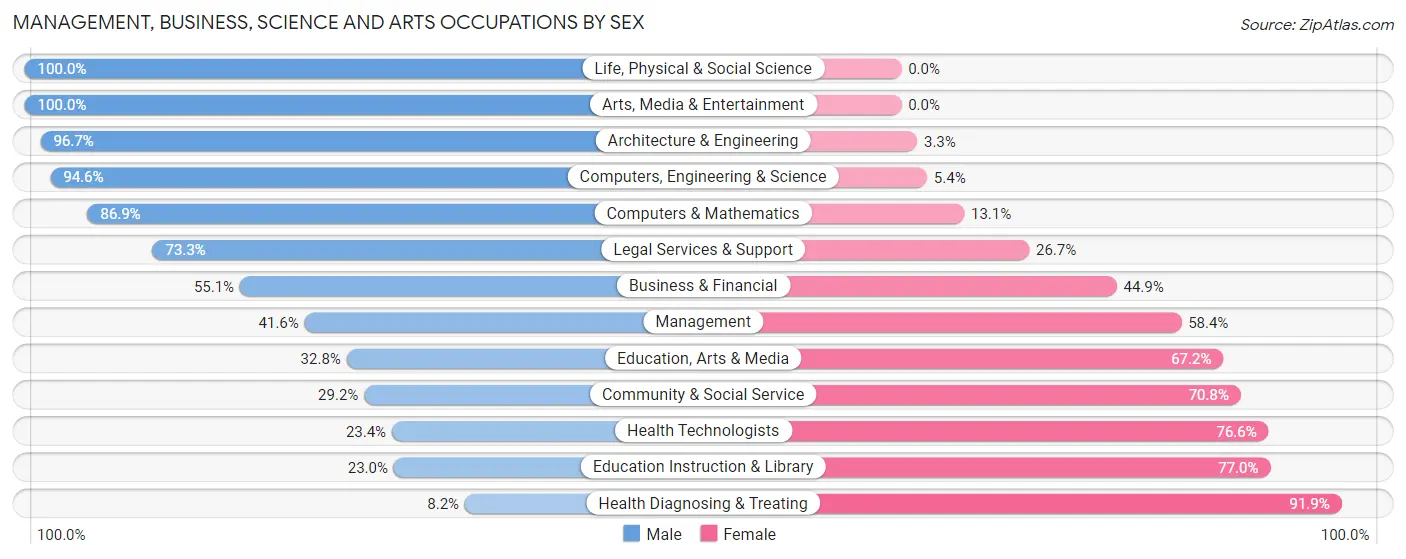
Management, Business, Science and Arts Occupations by Sex
Within the Management, Business, Science and Arts occupations in Panola County, the most male-oriented occupations are Life, Physical & Social Science (100.0%), Arts, Media & Entertainment (100.0%), and Architecture & Engineering (96.7%), while the most female-oriented occupations are Health Diagnosing & Treating (91.8%), Education Instruction & Library (77.0%), and Health Technologists (76.6%).
| Occupation | Male | Female |
| Management | 532 (41.6%) | 747 (58.4%) |
| Business & Financial | 65 (55.1%) | 53 (44.9%) |
| Computers, Engineering & Science | 229 (94.6%) | 13 (5.4%) |
| Computers & Mathematics | 53 (86.9%) | 8 (13.1%) |
| Architecture & Engineering | 146 (96.7%) | 5 (3.3%) |
| Life, Physical & Social Science | 30 (100.0%) | 0 (0.0%) |
| Community & Social Service | 252 (29.2%) | 612 (70.8%) |
| Education, Arts & Media | 64 (32.8%) | 131 (67.2%) |
| Legal Services & Support | 33 (73.3%) | 12 (26.7%) |
| Education Instruction & Library | 140 (23.0%) | 469 (77.0%) |
| Arts, Media & Entertainment | 15 (100.0%) | 0 (0.0%) |
| Health Diagnosing & Treating | 62 (8.2%) | 699 (91.8%) |
| Health Technologists | 61 (23.4%) | 200 (76.6%) |
| Total (Category) | 1,140 (34.9%) | 2,124 (65.1%) |
| Total (Overall) | 5,749 (48.6%) | 6,079 (51.4%) |
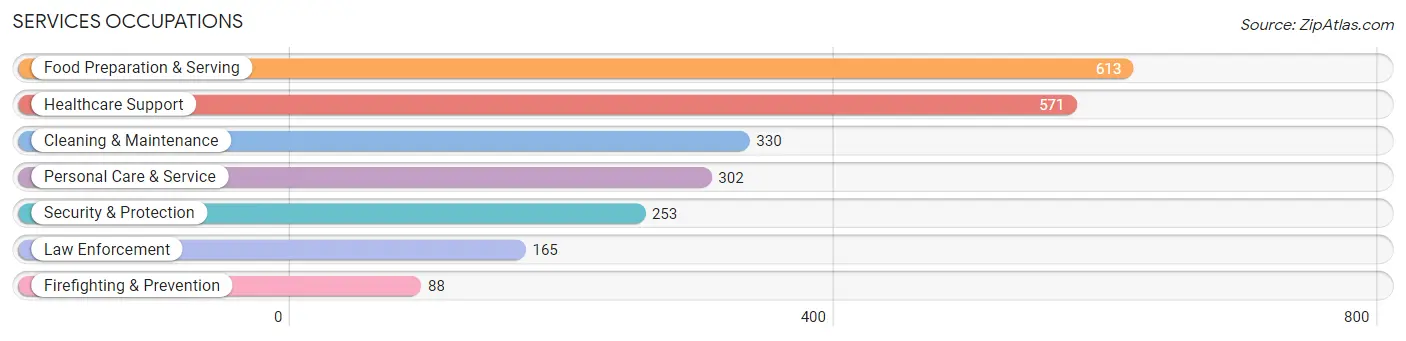
Services Occupations
The most common Services occupations in Panola County are Food Preparation & Serving (613 | 5.2%), Healthcare Support (571 | 4.8%), Cleaning & Maintenance (330 | 2.8%), Personal Care & Service (302 | 2.5%), and Security & Protection (253 | 2.1%).
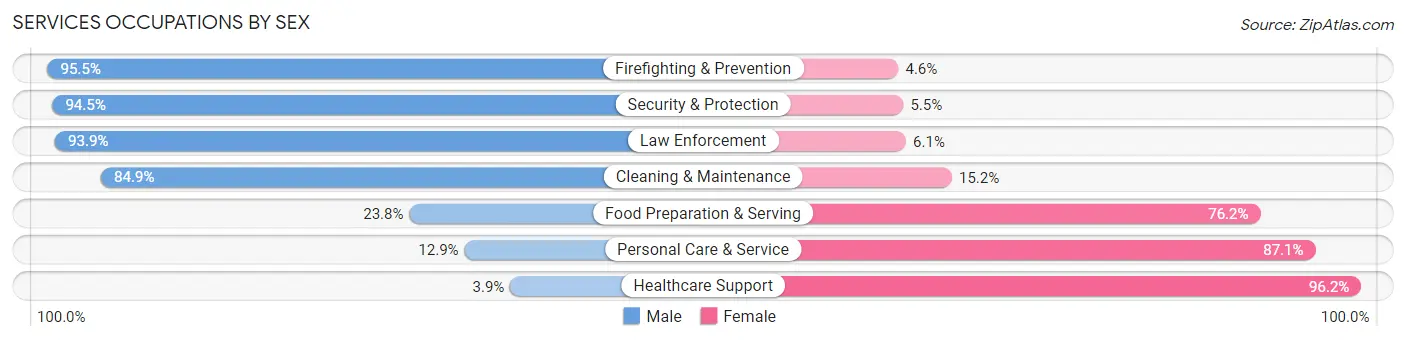
Services Occupations by Sex
Within the Services occupations in Panola County, the most male-oriented occupations are Firefighting & Prevention (95.5%), Security & Protection (94.5%), and Law Enforcement (93.9%), while the most female-oriented occupations are Healthcare Support (96.2%), Personal Care & Service (87.1%), and Food Preparation & Serving (76.2%).
| Occupation | Male | Female |
| Healthcare Support | 22 (3.8%) | 549 (96.2%) |
| Security & Protection | 239 (94.5%) | 14 (5.5%) |
| Firefighting & Prevention | 84 (95.5%) | 4 (4.5%) |
| Law Enforcement | 155 (93.9%) | 10 (6.1%) |
| Food Preparation & Serving | 146 (23.8%) | 467 (76.2%) |
| Cleaning & Maintenance | 280 (84.9%) | 50 (15.1%) |
| Personal Care & Service | 39 (12.9%) | 263 (87.1%) |
| Total (Category) | 726 (35.1%) | 1,343 (64.9%) |
| Total (Overall) | 5,749 (48.6%) | 6,079 (51.4%) |
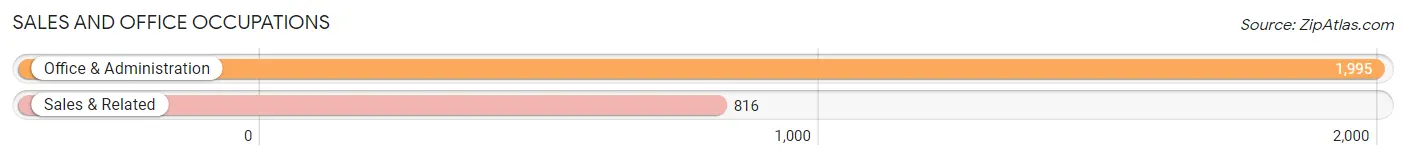
Sales and Office Occupations
The most common Sales and Office occupations in Panola County are Office & Administration (1,995 | 16.9%), and Sales & Related (816 | 6.9%).
Sales and Office Occupations by Sex

| Occupation | Male | Female |
| Sales & Related | 448 (54.9%) | 368 (45.1%) |
| Office & Administration | 544 (27.3%) | 1,451 (72.7%) |
| Total (Category) | 992 (35.3%) | 1,819 (64.7%) |
| Total (Overall) | 5,749 (48.6%) | 6,079 (51.4%) |
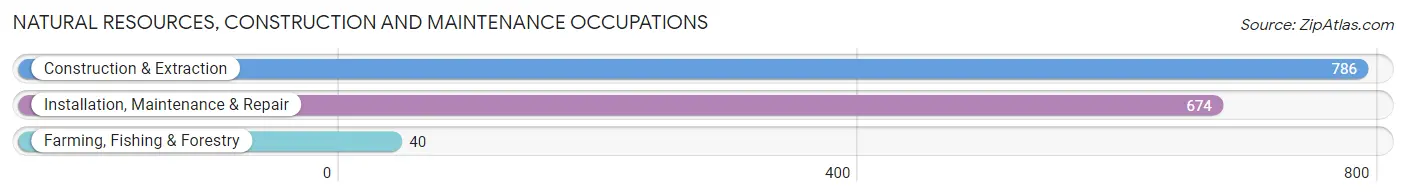
Natural Resources, Construction and Maintenance Occupations
The most common Natural Resources, Construction and Maintenance occupations in Panola County are Construction & Extraction (786 | 6.7%), Installation, Maintenance & Repair (674 | 5.7%), and Farming, Fishing & Forestry (40 | 0.3%).
Natural Resources, Construction and Maintenance Occupations by Sex
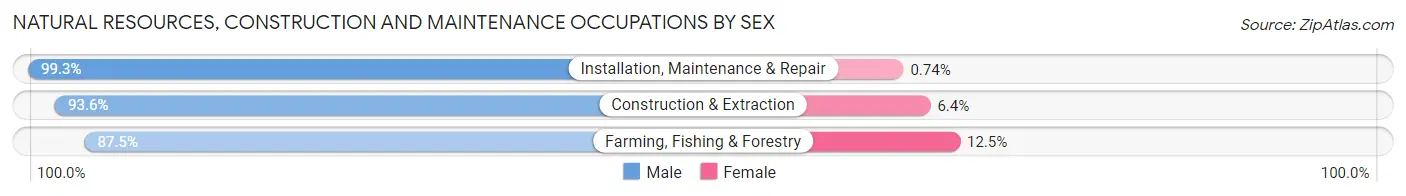
| Occupation | Male | Female |
| Farming, Fishing & Forestry | 35 (87.5%) | 5 (12.5%) |
| Construction & Extraction | 736 (93.6%) | 50 (6.4%) |
| Installation, Maintenance & Repair | 669 (99.3%) | 5 (0.7%) |
| Total (Category) | 1,440 (96.0%) | 60 (4.0%) |
| Total (Overall) | 5,749 (48.6%) | 6,079 (51.4%) |
Production, Transportation and Moving Occupations
The most common Production, Transportation and Moving occupations in Panola County are Production (1,160 | 9.8%), Transportation (572 | 4.8%), and Material Moving (452 | 3.8%).
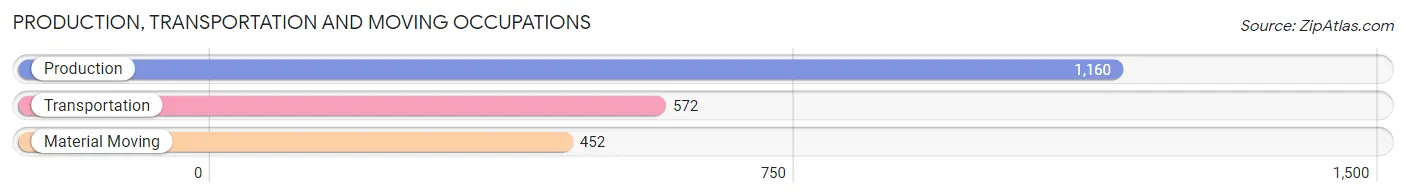
Production, Transportation and Moving Occupations by Sex
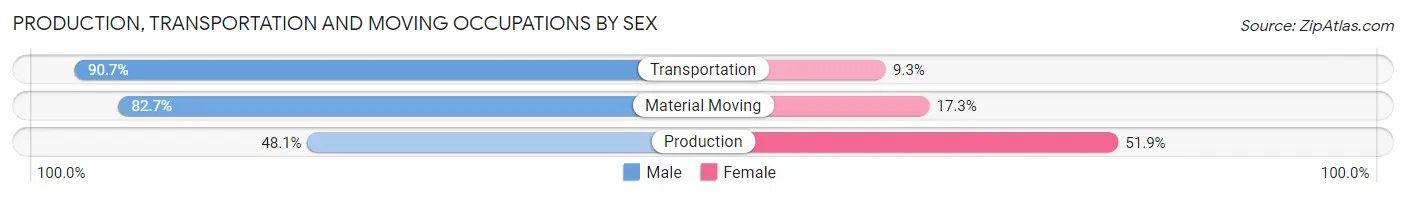
| Occupation | Male | Female |
| Production | 558 (48.1%) | 602 (51.9%) |
| Transportation | 519 (90.7%) | 53 (9.3%) |
| Material Moving | 374 (82.7%) | 78 (17.3%) |
| Total (Category) | 1,451 (66.4%) | 733 (33.6%) |
| Total (Overall) | 5,749 (48.6%) | 6,079 (51.4%) |
Employment Industries by Sex in Panola County
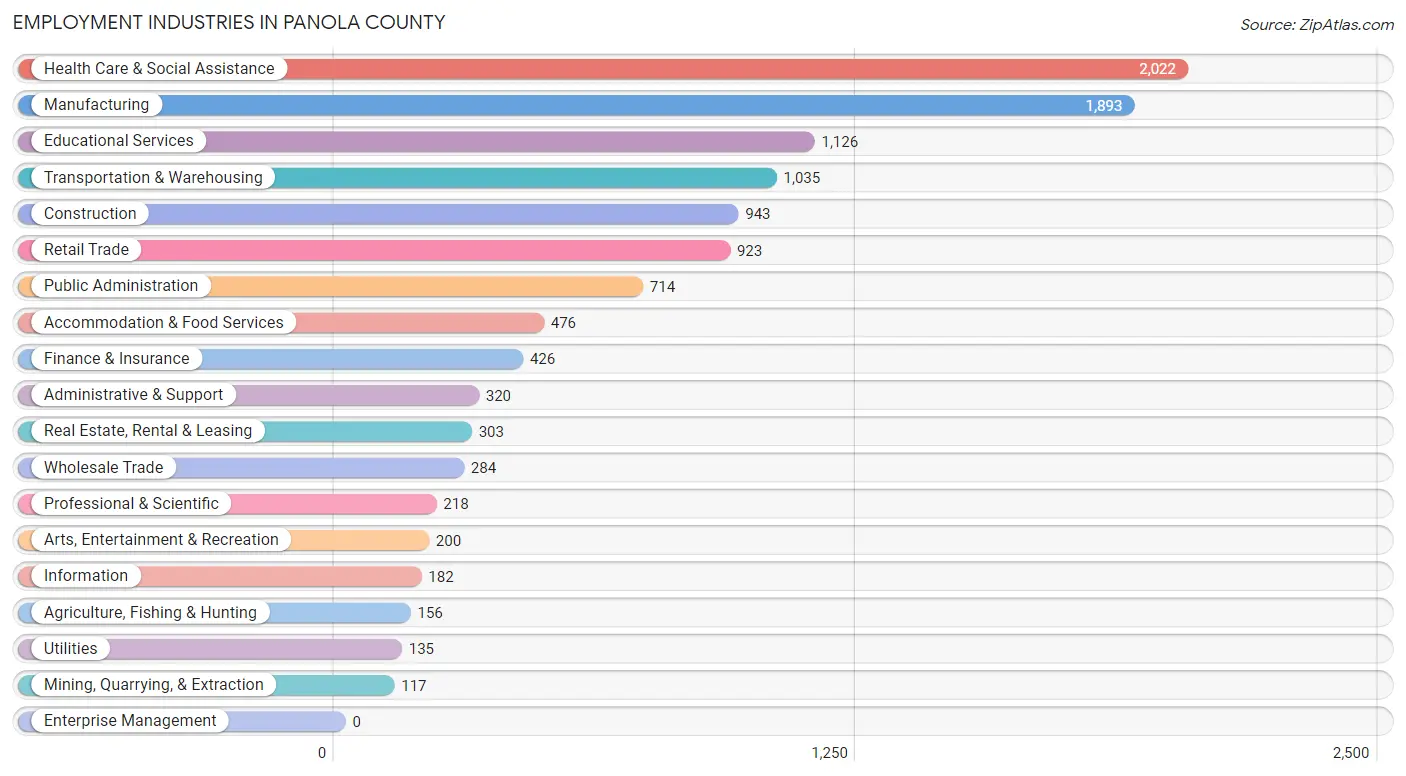
Employment Industries in Panola County
The major employment industries in Panola County include Health Care & Social Assistance (2,022 | 17.1%), Manufacturing (1,893 | 16.0%), Educational Services (1,126 | 9.5%), Transportation & Warehousing (1,035 | 8.7%), and Construction (943 | 8.0%).
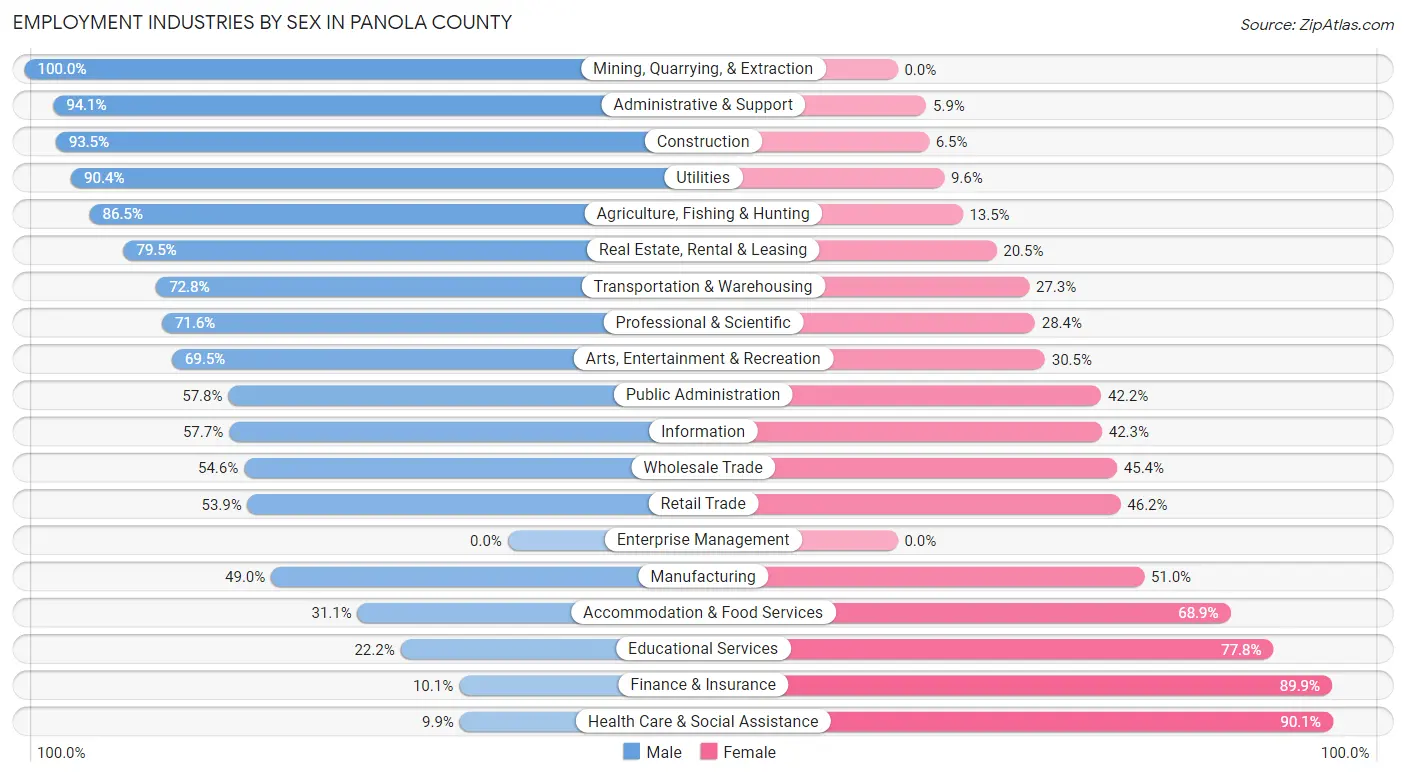
Employment Industries by Sex in Panola County
The Panola County industries that see more men than women are Mining, Quarrying, & Extraction (100.0%), Administrative & Support (94.1%), and Construction (93.5%), whereas the industries that tend to have a higher number of women are Health Care & Social Assistance (90.1%), Finance & Insurance (89.9%), and Educational Services (77.8%).
| Industry | Male | Female |
| Agriculture, Fishing & Hunting | 135 (86.5%) | 21 (13.5%) |
| Mining, Quarrying, & Extraction | 117 (100.0%) | 0 (0.0%) |
| Construction | 882 (93.5%) | 61 (6.5%) |
| Manufacturing | 927 (49.0%) | 966 (51.0%) |
| Wholesale Trade | 155 (54.6%) | 129 (45.4%) |
| Retail Trade | 497 (53.8%) | 426 (46.2%) |
| Transportation & Warehousing | 753 (72.8%) | 282 (27.3%) |
| Utilities | 122 (90.4%) | 13 (9.6%) |
| Information | 105 (57.7%) | 77 (42.3%) |
| Finance & Insurance | 43 (10.1%) | 383 (89.9%) |
| Real Estate, Rental & Leasing | 241 (79.5%) | 62 (20.5%) |
| Professional & Scientific | 156 (71.6%) | 62 (28.4%) |
| Enterprise Management | 0 (0.0%) | 0 (0.0%) |
| Administrative & Support | 301 (94.1%) | 19 (5.9%) |
| Educational Services | 250 (22.2%) | 876 (77.8%) |
| Health Care & Social Assistance | 201 (9.9%) | 1,821 (90.1%) |
| Arts, Entertainment & Recreation | 139 (69.5%) | 61 (30.5%) |
| Accommodation & Food Services | 148 (31.1%) | 328 (68.9%) |
| Public Administration | 413 (57.8%) | 301 (42.2%) |
| Total | 5,749 (48.6%) | 6,079 (51.4%) |
Education in Panola County
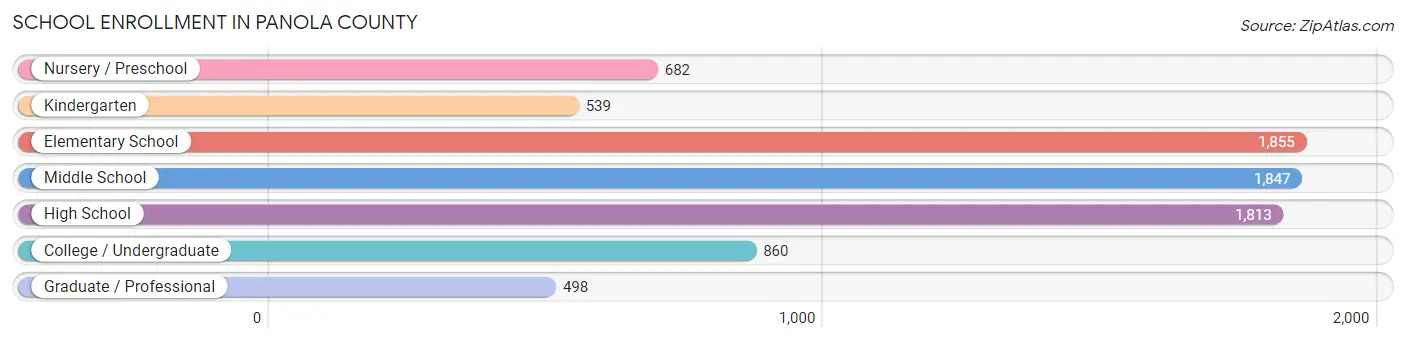
School Enrollment in Panola County
The most common levels of schooling among the 8,094 students in Panola County are elementary school (1,855 | 22.9%), middle school (1,847 | 22.8%), and high school (1,813 | 22.4%).
| School Level | # Students | % Students |
| Nursery / Preschool | 682 | 8.4% |
| Kindergarten | 539 | 6.7% |
| Elementary School | 1,855 | 22.9% |
| Middle School | 1,847 | 22.8% |
| High School | 1,813 | 22.4% |
| College / Undergraduate | 860 | 10.6% |
| Graduate / Professional | 498 | 6.1% |
| Total | 8,094 | 100.0% |
School Enrollment by Age by Funding Source in Panola County
Out of a total of 8,094 students who are enrolled in schools in Panola County, 979 (12.1%) attend a private institution, while the remaining 7,115 (87.9%) are enrolled in public schools. The age group of 25 to 34 year olds has the highest likelihood of being enrolled in private schools, with 33 (20.9% in the age bracket) enrolled. Conversely, the age group of 20 to 24 year olds has the lowest likelihood of being enrolled in a private school, with 450 (100.0% in the age bracket) attending a public institution.
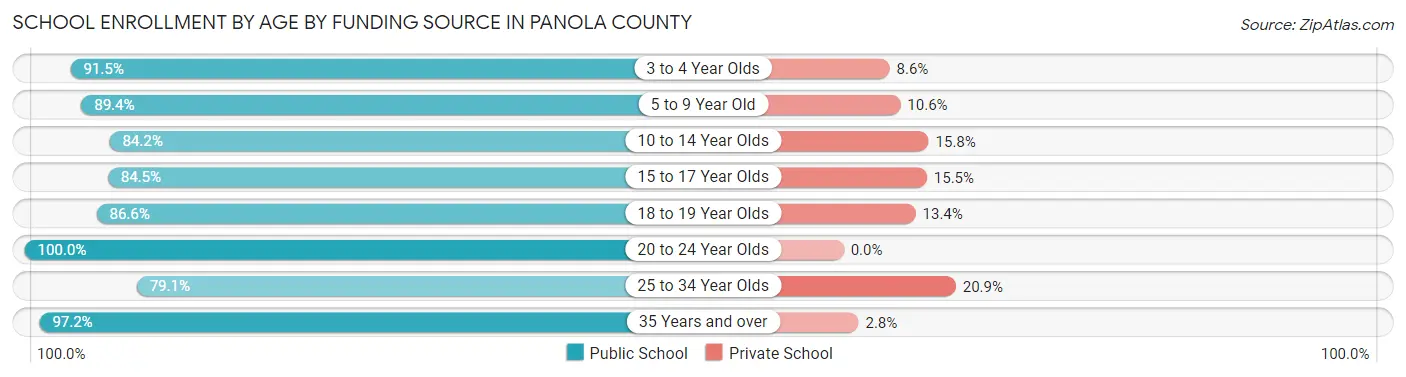
| Age Bracket | Public School | Private School |
| 3 to 4 Year Olds | 588 (91.4%) | 55 (8.6%) |
| 5 to 9 Year Old | 1,887 (89.4%) | 223 (10.6%) |
| 10 to 14 Year Olds | 1,980 (84.2%) | 372 (15.8%) |
| 15 to 17 Year Olds | 1,150 (84.5%) | 211 (15.5%) |
| 18 to 19 Year Olds | 446 (86.6%) | 69 (13.4%) |
| 20 to 24 Year Olds | 450 (100.0%) | 0 (0.0%) |
| 25 to 34 Year Olds | 125 (79.1%) | 33 (20.9%) |
| 35 Years and over | 491 (97.2%) | 14 (2.8%) |
| Total | 7,115 (87.9%) | 979 (12.1%) |
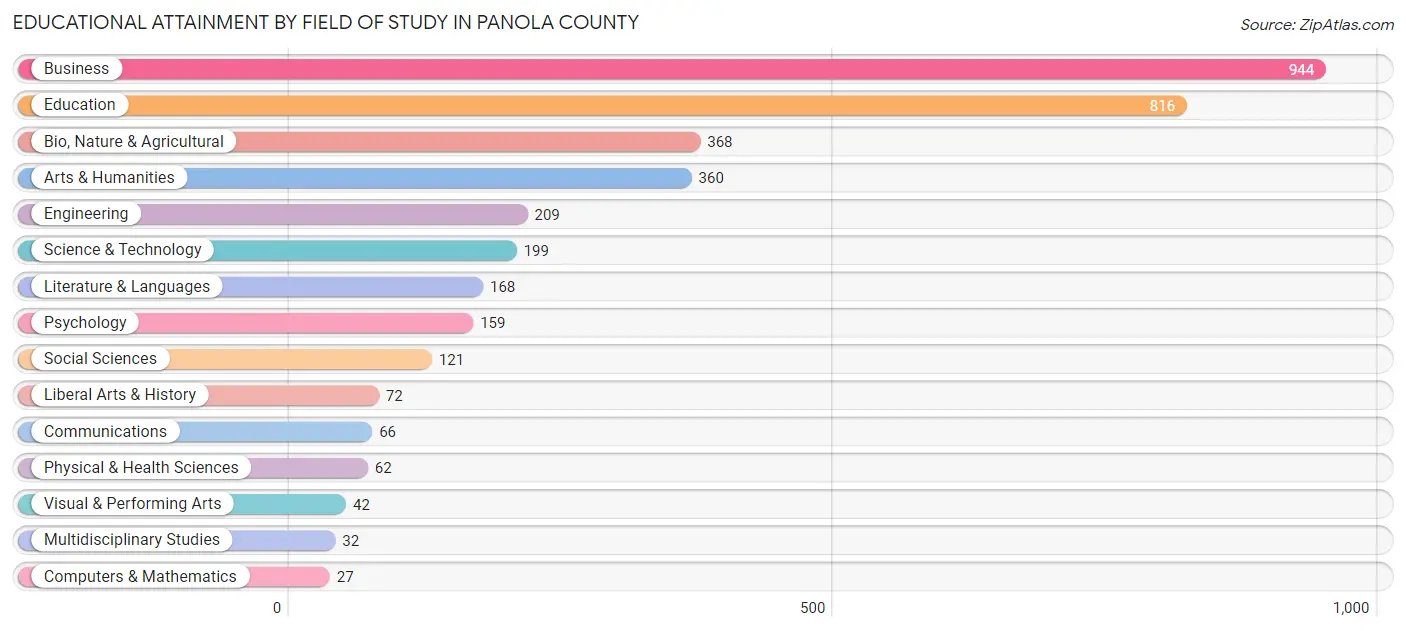
Educational Attainment by Field of Study in Panola County
Business (944 | 25.9%), education (816 | 22.4%), bio, nature & agricultural (368 | 10.1%), arts & humanities (360 | 9.9%), and engineering (209 | 5.7%) are the most common fields of study among 3,645 individuals in Panola County who have obtained a bachelor's degree or higher.
| Field of Study | # Graduates | % Graduates |
| Computers & Mathematics | 27 | 0.7% |
| Bio, Nature & Agricultural | 368 | 10.1% |
| Physical & Health Sciences | 62 | 1.7% |
| Psychology | 159 | 4.4% |
| Social Sciences | 121 | 3.3% |
| Engineering | 209 | 5.7% |
| Multidisciplinary Studies | 32 | 0.9% |
| Science & Technology | 199 | 5.5% |
| Business | 944 | 25.9% |
| Education | 816 | 22.4% |
| Literature & Languages | 168 | 4.6% |
| Liberal Arts & History | 72 | 2.0% |
| Visual & Performing Arts | 42 | 1.1% |
| Communications | 66 | 1.8% |
| Arts & Humanities | 360 | 9.9% |
| Total | 3,645 | 100.0% |
Transportation & Commute in Panola County
Vehicle Availability by Sex in Panola County
The most prevalent vehicle ownership categories in Panola County are males with 3 vehicles (2,120, accounting for 37.3%) and females with 3 vehicles (1,394, making up 36.0%).
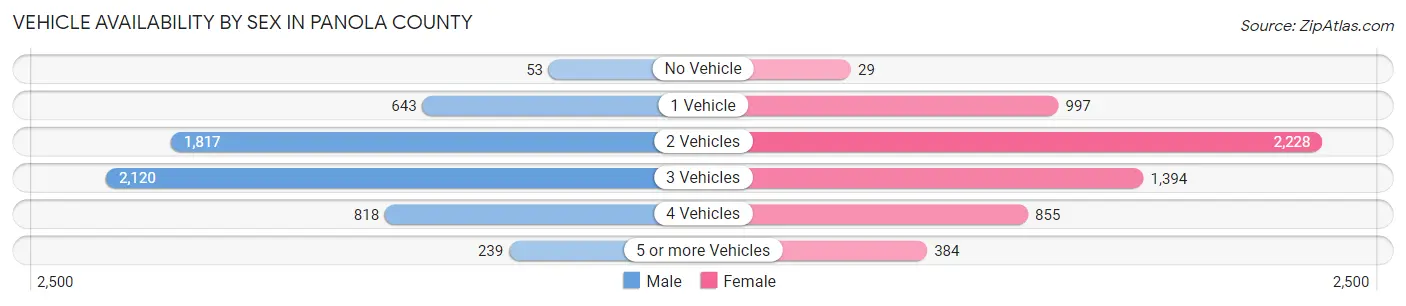
| Vehicles Available | Male | Female |
| No Vehicle | 53 (0.9%) | 29 (0.5%) |
| 1 Vehicle | 643 (11.3%) | 997 (16.9%) |
| 2 Vehicles | 1,817 (31.9%) | 2,228 (37.9%) |
| 3 Vehicles | 2,120 (37.3%) | 1,394 (23.7%) |
| 4 Vehicles | 818 (14.4%) | 855 (14.5%) |
| 5 or more Vehicles | 239 (4.2%) | 384 (6.5%) |
| Total | 5,690 (100.0%) | 5,887 (100.0%) |
Commute Time in Panola County
The most frequently occuring commute durations in Panola County are 30 to 34 minutes (2,043 commuters, 18.7%), 15 to 19 minutes (2,009 commuters, 18.4%), and 20 to 24 minutes (1,286 commuters, 11.8%).
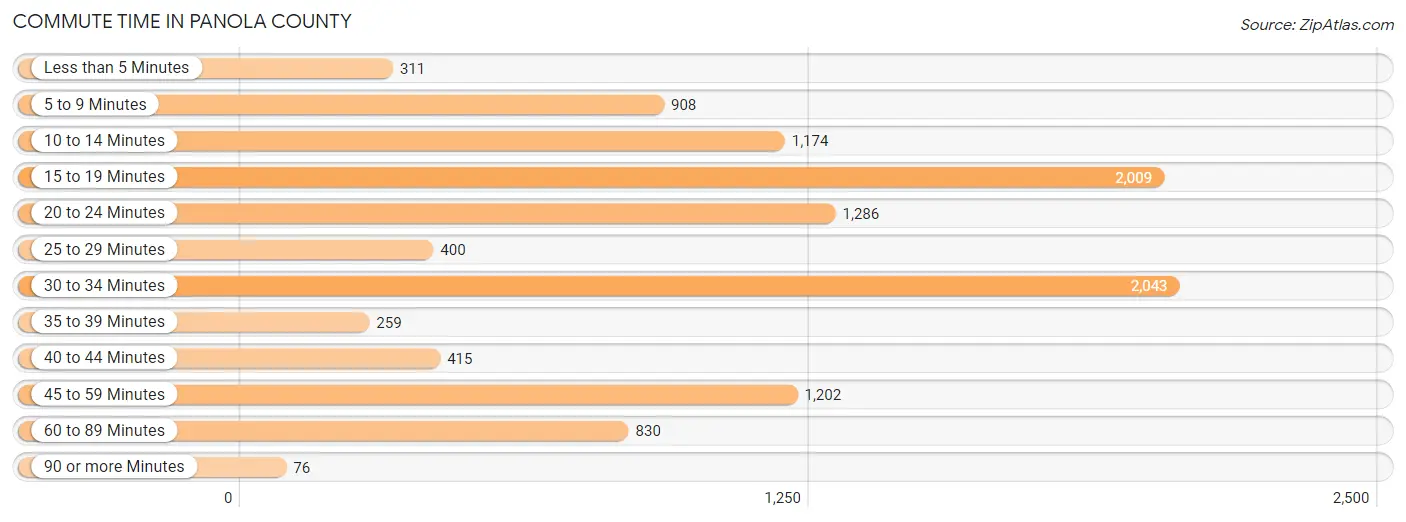
| Commute Time | # Commuters | % Commuters |
| Less than 5 Minutes | 311 | 2.9% |
| 5 to 9 Minutes | 908 | 8.3% |
| 10 to 14 Minutes | 1,174 | 10.8% |
| 15 to 19 Minutes | 2,009 | 18.4% |
| 20 to 24 Minutes | 1,286 | 11.8% |
| 25 to 29 Minutes | 400 | 3.7% |
| 30 to 34 Minutes | 2,043 | 18.7% |
| 35 to 39 Minutes | 259 | 2.4% |
| 40 to 44 Minutes | 415 | 3.8% |
| 45 to 59 Minutes | 1,202 | 11.0% |
| 60 to 89 Minutes | 830 | 7.6% |
| 90 or more Minutes | 76 | 0.7% |
Commute Time by Sex in Panola County
The most common commute times in Panola County are 30 to 34 minutes (1,026 commuters, 18.8%) for males and 30 to 34 minutes (1,017 commuters, 18.6%) for females.
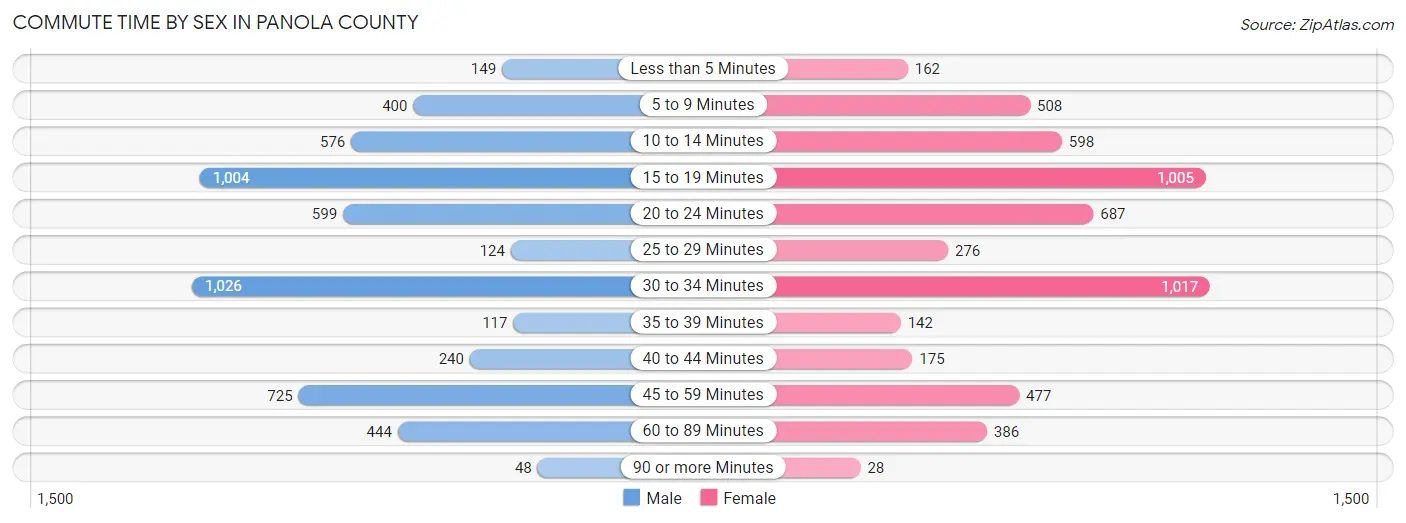
| Commute Time | Male | Female |
| Less than 5 Minutes | 149 (2.7%) | 162 (3.0%) |
| 5 to 9 Minutes | 400 (7.3%) | 508 (9.3%) |
| 10 to 14 Minutes | 576 (10.6%) | 598 (11.0%) |
| 15 to 19 Minutes | 1,004 (18.4%) | 1,005 (18.4%) |
| 20 to 24 Minutes | 599 (11.0%) | 687 (12.6%) |
| 25 to 29 Minutes | 124 (2.3%) | 276 (5.1%) |
| 30 to 34 Minutes | 1,026 (18.8%) | 1,017 (18.6%) |
| 35 to 39 Minutes | 117 (2.1%) | 142 (2.6%) |
| 40 to 44 Minutes | 240 (4.4%) | 175 (3.2%) |
| 45 to 59 Minutes | 725 (13.3%) | 477 (8.7%) |
| 60 to 89 Minutes | 444 (8.1%) | 386 (7.1%) |
| 90 or more Minutes | 48 (0.9%) | 28 (0.5%) |
Time of Departure to Work by Sex in Panola County
The most frequent times of departure to work in Panola County are 7:00 AM to 7:29 AM (911, 16.7%) for males and 6:30 AM to 6:59 AM (881, 16.1%) for females.
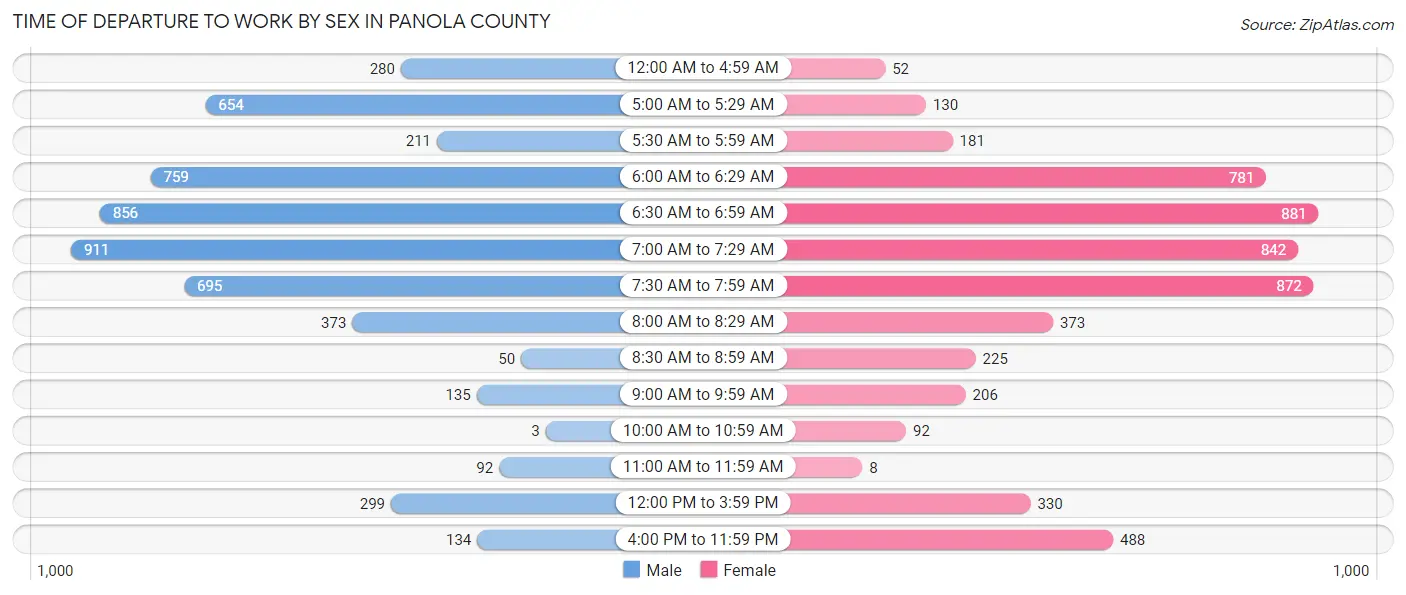
| Time of Departure | Male | Female |
| 12:00 AM to 4:59 AM | 280 (5.1%) | 52 (0.9%) |
| 5:00 AM to 5:29 AM | 654 (12.0%) | 130 (2.4%) |
| 5:30 AM to 5:59 AM | 211 (3.9%) | 181 (3.3%) |
| 6:00 AM to 6:29 AM | 759 (13.9%) | 781 (14.3%) |
| 6:30 AM to 6:59 AM | 856 (15.7%) | 881 (16.1%) |
| 7:00 AM to 7:29 AM | 911 (16.7%) | 842 (15.4%) |
| 7:30 AM to 7:59 AM | 695 (12.8%) | 872 (16.0%) |
| 8:00 AM to 8:29 AM | 373 (6.8%) | 373 (6.8%) |
| 8:30 AM to 8:59 AM | 50 (0.9%) | 225 (4.1%) |
| 9:00 AM to 9:59 AM | 135 (2.5%) | 206 (3.8%) |
| 10:00 AM to 10:59 AM | 3 (0.1%) | 92 (1.7%) |
| 11:00 AM to 11:59 AM | 92 (1.7%) | 8 (0.2%) |
| 12:00 PM to 3:59 PM | 299 (5.5%) | 330 (6.0%) |
| 4:00 PM to 11:59 PM | 134 (2.5%) | 488 (8.9%) |
| Total | 5,452 (100.0%) | 5,461 (100.0%) |
Housing Occupancy in Panola County
Occupancy by Ownership in Panola County
Of the total 12,392 dwellings in Panola County, owner-occupied units account for 8,788 (70.9%), while renter-occupied units make up 3,604 (29.1%).
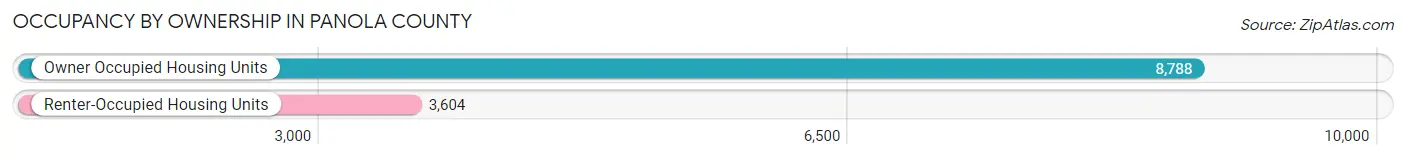
| Occupancy | # Housing Units | % Housing Units |
| Owner Occupied Housing Units | 8,788 | 70.9% |
| Renter-Occupied Housing Units | 3,604 | 29.1% |
| Total Occupied Housing Units | 12,392 | 100.0% |
Occupancy by Household Size in Panola County
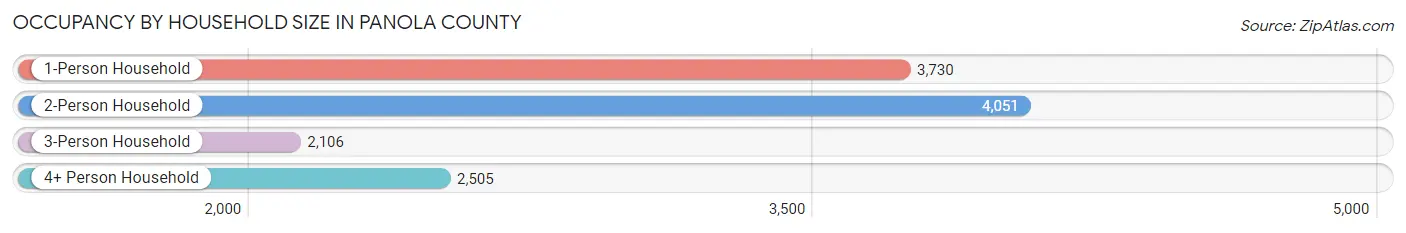
| Household Size | # Housing Units | % Housing Units |
| 1-Person Household | 3,730 | 30.1% |
| 2-Person Household | 4,051 | 32.7% |
| 3-Person Household | 2,106 | 17.0% |
| 4+ Person Household | 2,505 | 20.2% |
| Total Housing Units | 12,392 | 100.0% |
Occupancy by Ownership by Household Size in Panola County
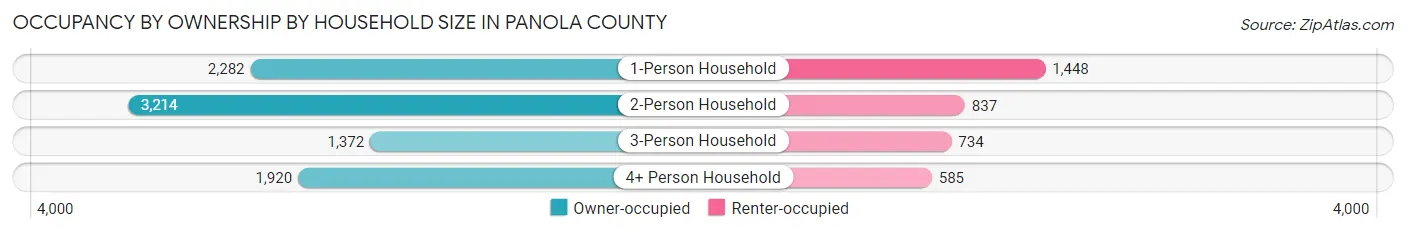
| Household Size | Owner-occupied | Renter-occupied |
| 1-Person Household | 2,282 (61.2%) | 1,448 (38.8%) |
| 2-Person Household | 3,214 (79.3%) | 837 (20.7%) |
| 3-Person Household | 1,372 (65.1%) | 734 (34.8%) |
| 4+ Person Household | 1,920 (76.6%) | 585 (23.4%) |
| Total Housing Units | 8,788 (70.9%) | 3,604 (29.1%) |
Occupancy by Educational Attainment in Panola County
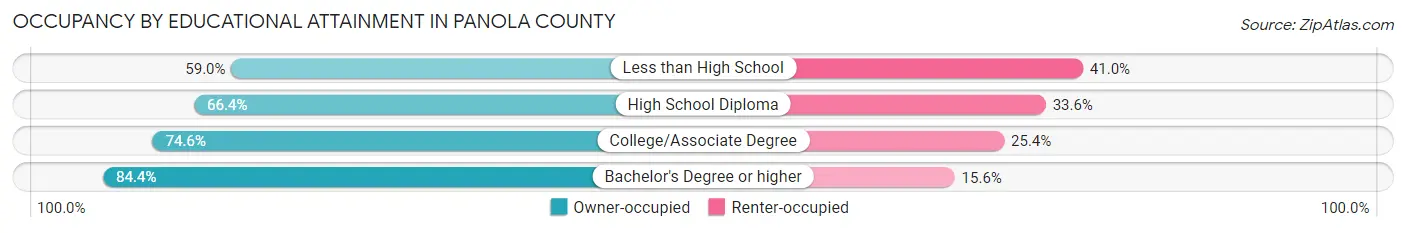
| Household Size | Owner-occupied | Renter-occupied |
| Less than High School | 1,294 (59.0%) | 899 (41.0%) |
| High School Diploma | 2,556 (66.4%) | 1,294 (33.6%) |
| College/Associate Degree | 3,218 (74.6%) | 1,094 (25.4%) |
| Bachelor's Degree or higher | 1,720 (84.4%) | 317 (15.6%) |
Occupancy by Age of Householder in Panola County
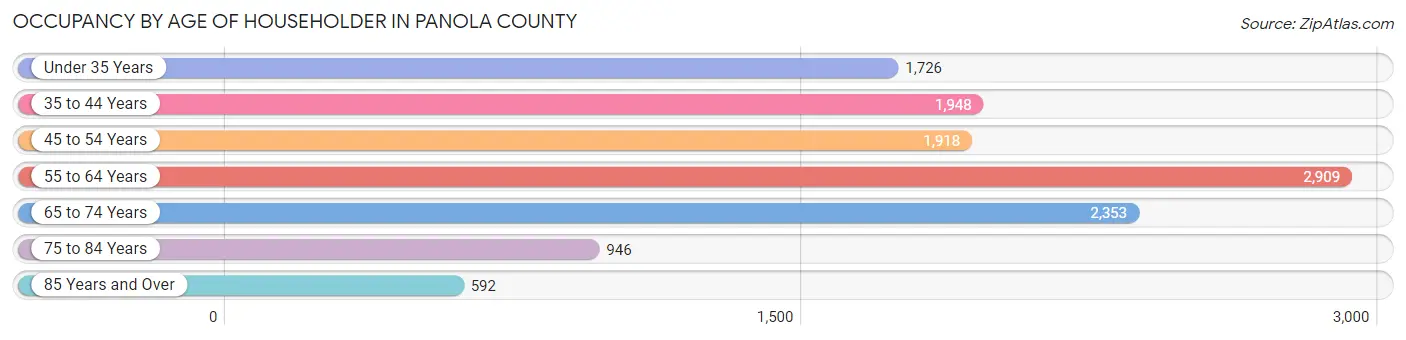
| Age Bracket | # Households | % Households |
| Under 35 Years | 1,726 | 13.9% |
| 35 to 44 Years | 1,948 | 15.7% |
| 45 to 54 Years | 1,918 | 15.5% |
| 55 to 64 Years | 2,909 | 23.5% |
| 65 to 74 Years | 2,353 | 19.0% |
| 75 to 84 Years | 946 | 7.6% |
| 85 Years and Over | 592 | 4.8% |
| Total | 12,392 | 100.0% |
Housing Finances in Panola County
Median Income by Occupancy in Panola County
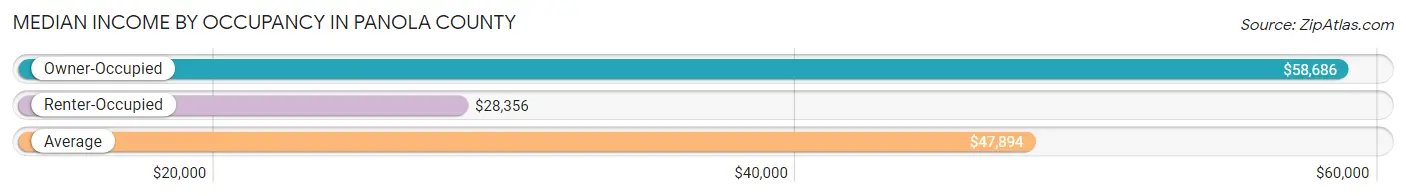
| Occupancy Type | # Households | Median Income |
| Owner-Occupied | 8,788 (70.9%) | $58,686 |
| Renter-Occupied | 3,604 (29.1%) | $28,356 |
| Average | 12,392 (100.0%) | $47,894 |
Occupancy by Householder Income Bracket in Panola County
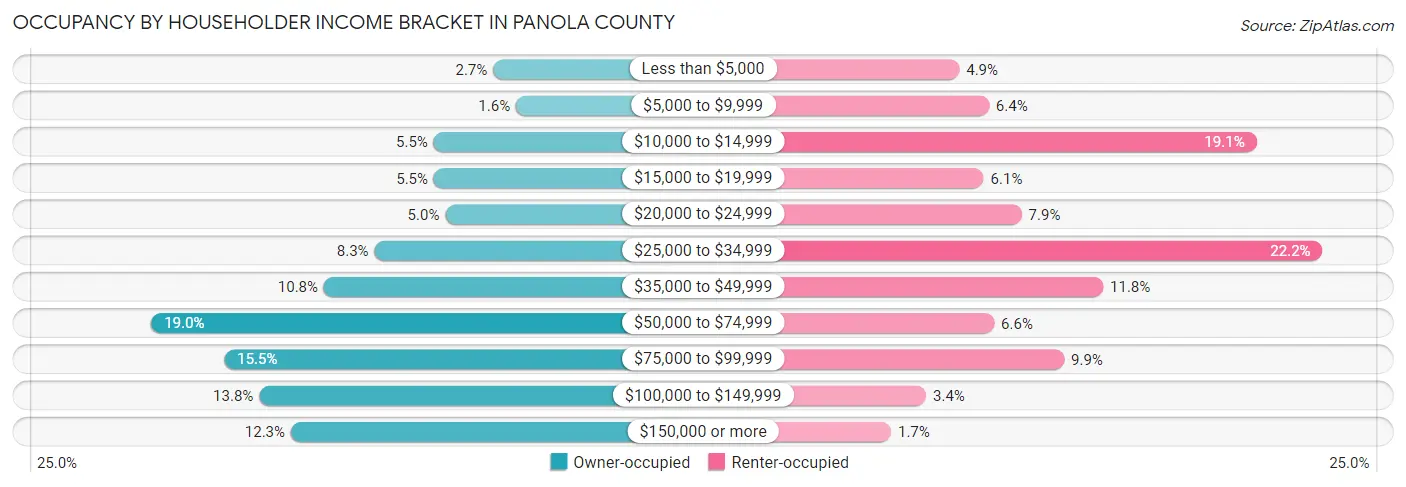
| Income Bracket | Owner-occupied | Renter-occupied |
| Less than $5,000 | 236 (2.7%) | 178 (4.9%) |
| $5,000 to $9,999 | 141 (1.6%) | 229 (6.4%) |
| $10,000 to $14,999 | 485 (5.5%) | 688 (19.1%) |
| $15,000 to $19,999 | 484 (5.5%) | 220 (6.1%) |
| $20,000 to $24,999 | 437 (5.0%) | 285 (7.9%) |
| $25,000 to $34,999 | 733 (8.3%) | 801 (22.2%) |
| $35,000 to $49,999 | 945 (10.7%) | 425 (11.8%) |
| $50,000 to $74,999 | 1,667 (19.0%) | 238 (6.6%) |
| $75,000 to $99,999 | 1,362 (15.5%) | 358 (9.9%) |
| $100,000 to $149,999 | 1,215 (13.8%) | 121 (3.4%) |
| $150,000 or more | 1,083 (12.3%) | 61 (1.7%) |
| Total | 8,788 (100.0%) | 3,604 (100.0%) |
Monthly Housing Cost Tiers in Panola County
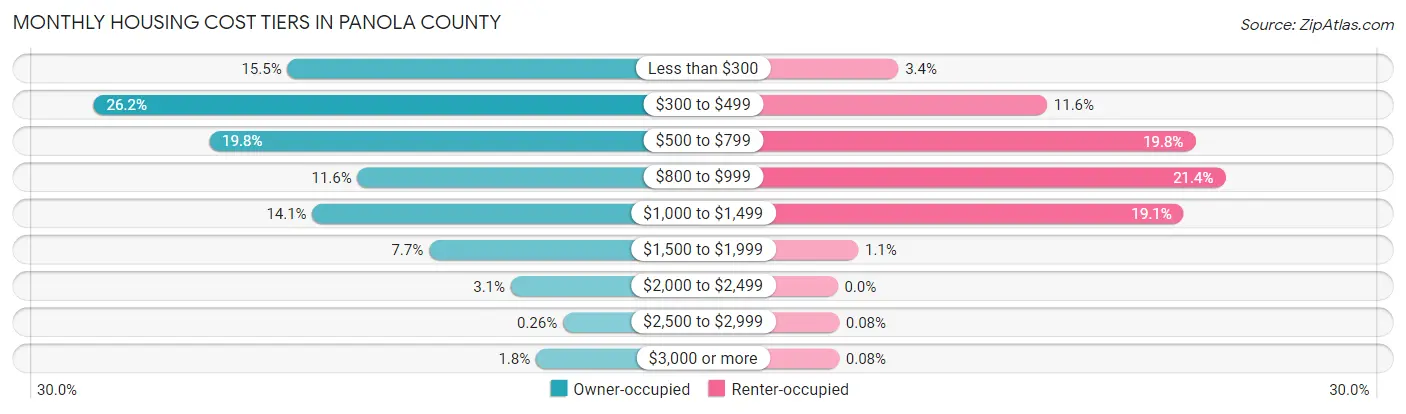
| Monthly Cost | Owner-occupied | Renter-occupied |
| Less than $300 | 1,360 (15.5%) | 121 (3.4%) |
| $300 to $499 | 2,302 (26.2%) | 417 (11.6%) |
| $500 to $799 | 1,741 (19.8%) | 712 (19.8%) |
| $800 to $999 | 1,020 (11.6%) | 772 (21.4%) |
| $1,000 to $1,499 | 1,239 (14.1%) | 689 (19.1%) |
| $1,500 to $1,999 | 673 (7.7%) | 41 (1.1%) |
| $2,000 to $2,499 | 276 (3.1%) | 0 (0.0%) |
| $2,500 to $2,999 | 23 (0.3%) | 3 (0.1%) |
| $3,000 or more | 154 (1.8%) | 3 (0.1%) |
| Total | 8,788 (100.0%) | 3,604 (100.0%) |
Physical Housing Characteristics in Panola County
Housing Structures in Panola County
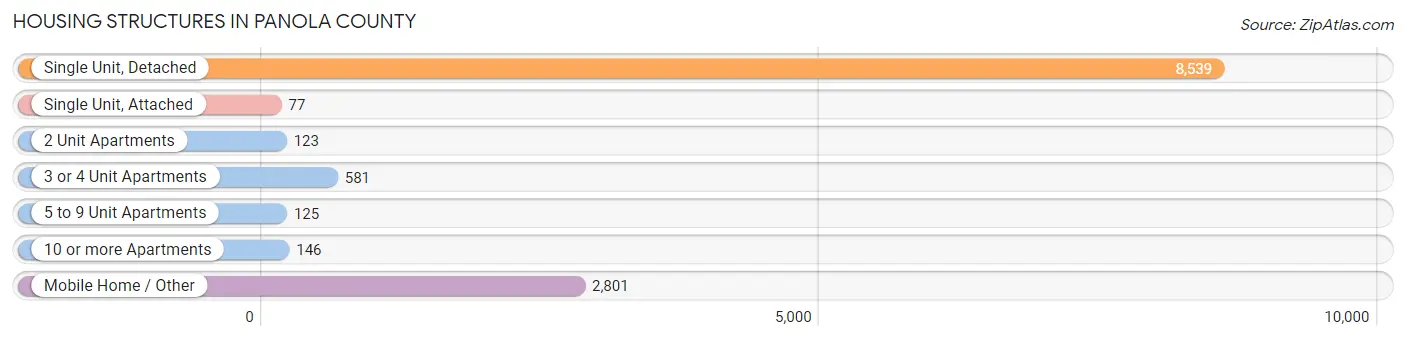
| Structure Type | # Housing Units | % Housing Units |
| Single Unit, Detached | 8,539 | 68.9% |
| Single Unit, Attached | 77 | 0.6% |
| 2 Unit Apartments | 123 | 1.0% |
| 3 or 4 Unit Apartments | 581 | 4.7% |
| 5 to 9 Unit Apartments | 125 | 1.0% |
| 10 or more Apartments | 146 | 1.2% |
| Mobile Home / Other | 2,801 | 22.6% |
| Total | 12,392 | 100.0% |
Housing Structures by Occupancy in Panola County
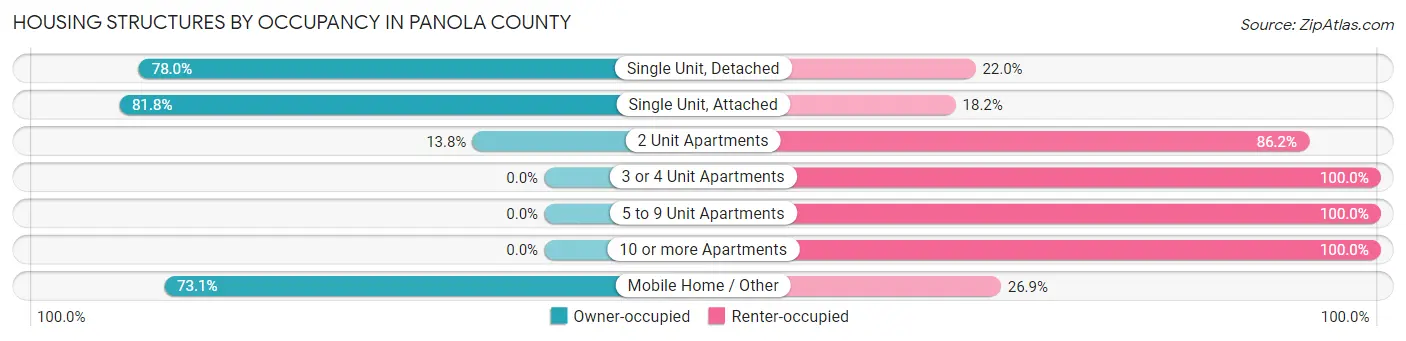
| Structure Type | Owner-occupied | Renter-occupied |
| Single Unit, Detached | 6,660 (78.0%) | 1,879 (22.0%) |
| Single Unit, Attached | 63 (81.8%) | 14 (18.2%) |
| 2 Unit Apartments | 17 (13.8%) | 106 (86.2%) |
| 3 or 4 Unit Apartments | 0 (0.0%) | 581 (100.0%) |
| 5 to 9 Unit Apartments | 0 (0.0%) | 125 (100.0%) |
| 10 or more Apartments | 0 (0.0%) | 146 (100.0%) |
| Mobile Home / Other | 2,048 (73.1%) | 753 (26.9%) |
| Total | 8,788 (70.9%) | 3,604 (29.1%) |
Housing Structures by Number of Rooms in Panola County
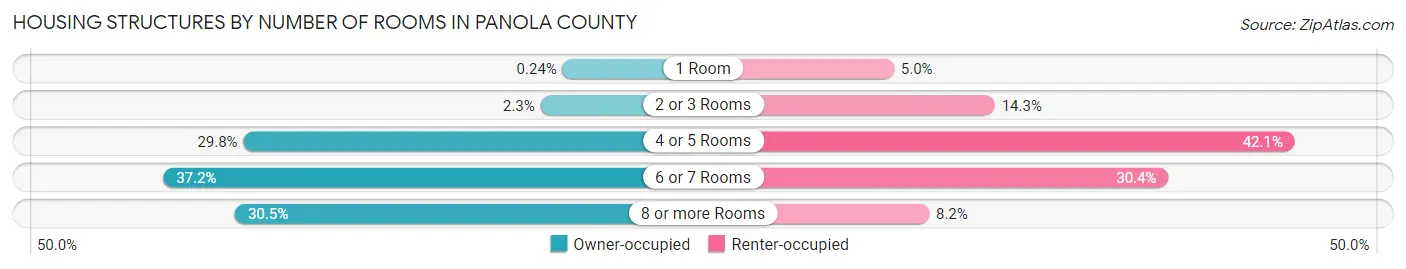
| Number of Rooms | Owner-occupied | Renter-occupied |
| 1 Room | 21 (0.2%) | 180 (5.0%) |
| 2 or 3 Rooms | 201 (2.3%) | 516 (14.3%) |
| 4 or 5 Rooms | 2,615 (29.8%) | 1,516 (42.1%) |
| 6 or 7 Rooms | 3,267 (37.2%) | 1,095 (30.4%) |
| 8 or more Rooms | 2,684 (30.5%) | 297 (8.2%) |
| Total | 8,788 (100.0%) | 3,604 (100.0%) |
Housing Structure by Heating Type in Panola County
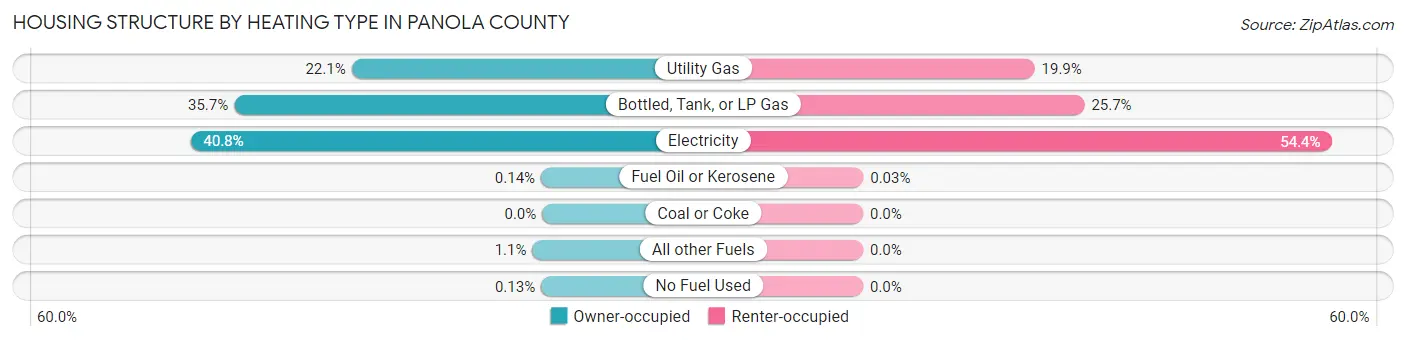
| Heating Type | Owner-occupied | Renter-occupied |
| Utility Gas | 1,942 (22.1%) | 717 (19.9%) |
| Bottled, Tank, or LP Gas | 3,139 (35.7%) | 925 (25.7%) |
| Electricity | 3,584 (40.8%) | 1,961 (54.4%) |
| Fuel Oil or Kerosene | 12 (0.1%) | 1 (0.0%) |
| Coal or Coke | 0 (0.0%) | 0 (0.0%) |
| All other Fuels | 100 (1.1%) | 0 (0.0%) |
| No Fuel Used | 11 (0.1%) | 0 (0.0%) |
| Total | 8,788 (100.0%) | 3,604 (100.0%) |
Household Vehicle Usage in Panola County
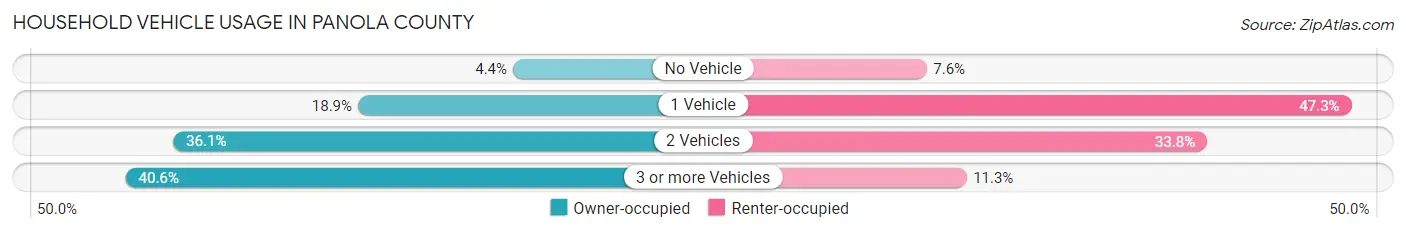
| Vehicles per Household | Owner-occupied | Renter-occupied |
| No Vehicle | 388 (4.4%) | 274 (7.6%) |
| 1 Vehicle | 1,660 (18.9%) | 1,704 (47.3%) |
| 2 Vehicles | 3,175 (36.1%) | 1,218 (33.8%) |
| 3 or more Vehicles | 3,565 (40.6%) | 408 (11.3%) |
| Total | 8,788 (100.0%) | 3,604 (100.0%) |
Real Estate & Mortgages in Panola County
Real Estate and Mortgage Overview in Panola County
| Characteristic | Without Mortgage | With Mortgage |
| Housing Units | 5,001 | 3,787 |
| Median Property Value | $98,900 | $144,500 |
| Median Household Income | $52,933 | $527 |
| Monthly Housing Costs | $396 | $148 |
| Real Estate Taxes | $534 | $677 |
Property Value by Mortgage Status in Panola County
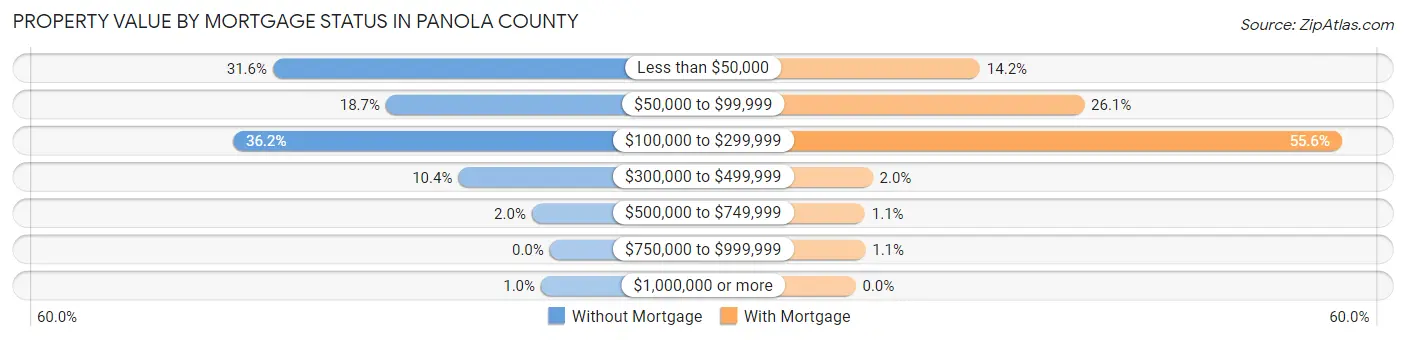
| Property Value | Without Mortgage | With Mortgage |
| Less than $50,000 | 1,582 (31.6%) | 538 (14.2%) |
| $50,000 to $99,999 | 936 (18.7%) | 989 (26.1%) |
| $100,000 to $299,999 | 1,809 (36.2%) | 2,104 (55.6%) |
| $300,000 to $499,999 | 522 (10.4%) | 74 (1.9%) |
| $500,000 to $749,999 | 102 (2.0%) | 40 (1.1%) |
| $750,000 to $999,999 | 0 (0.0%) | 42 (1.1%) |
| $1,000,000 or more | 50 (1.0%) | 0 (0.0%) |
| Total | 5,001 (100.0%) | 3,787 (100.0%) |
Household Income by Mortgage Status in Panola County
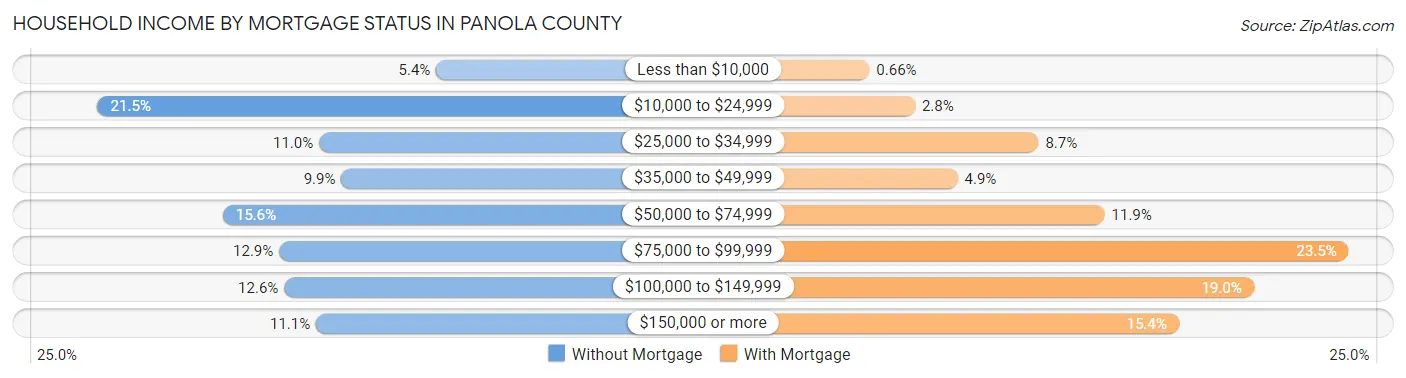
| Household Income | Without Mortgage | With Mortgage |
| Less than $10,000 | 270 (5.4%) | 25 (0.7%) |
| $10,000 to $24,999 | 1,076 (21.5%) | 107 (2.8%) |
| $25,000 to $34,999 | 549 (11.0%) | 330 (8.7%) |
| $35,000 to $49,999 | 496 (9.9%) | 184 (4.9%) |
| $50,000 to $74,999 | 778 (15.6%) | 449 (11.9%) |
| $75,000 to $99,999 | 644 (12.9%) | 889 (23.5%) |
| $100,000 to $149,999 | 632 (12.6%) | 718 (19.0%) |
| $150,000 or more | 556 (11.1%) | 583 (15.4%) |
| Total | 5,001 (100.0%) | 3,787 (100.0%) |
Property Value to Household Income Ratio in Panola County
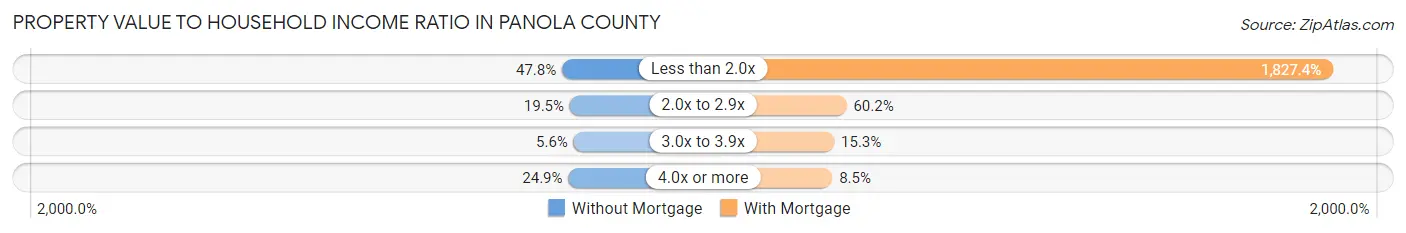
| Value-to-Income Ratio | Without Mortgage | With Mortgage |
| Less than 2.0x | 2,388 (47.7%) | 69,205 (1,827.4%) |
| 2.0x to 2.9x | 974 (19.5%) | 2,278 (60.2%) |
| 3.0x to 3.9x | 282 (5.6%) | 578 (15.3%) |
| 4.0x or more | 1,247 (24.9%) | 320 (8.5%) |
| Total | 5,001 (100.0%) | 3,787 (100.0%) |
Real Estate Taxes by Mortgage Status in Panola County
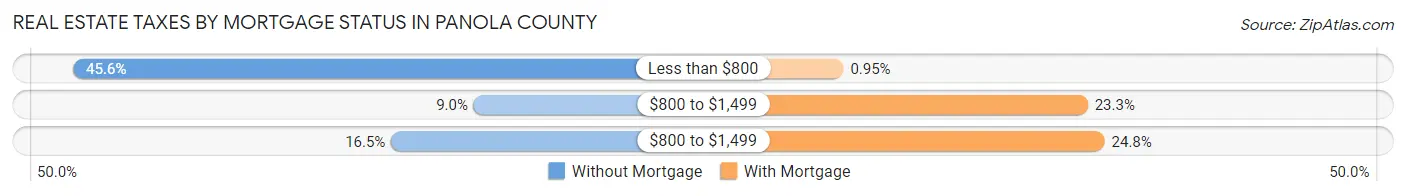
| Property Taxes | Without Mortgage | With Mortgage |
| Less than $800 | 2,279 (45.6%) | 36 (0.9%) |
| $800 to $1,499 | 449 (9.0%) | 881 (23.3%) |
| $800 to $1,499 | 826 (16.5%) | 939 (24.8%) |
| Total | 5,001 (100.0%) | 3,787 (100.0%) |
Health & Disability in Panola County
Health Insurance Coverage by Age in Panola County
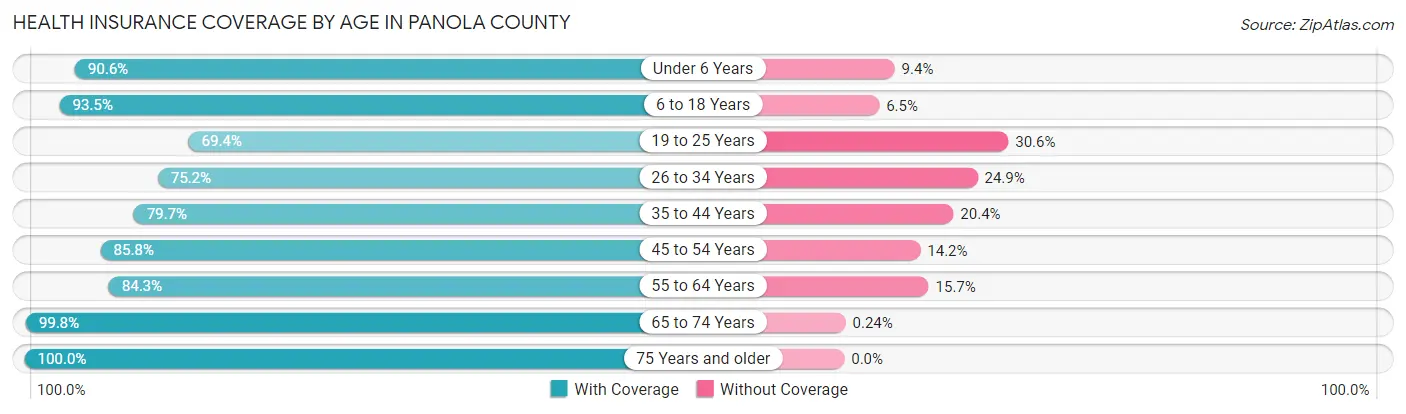
| Age Bracket | With Coverage | Without Coverage |
| Under 6 Years | 2,383 (90.6%) | 247 (9.4%) |
| 6 to 18 Years | 5,531 (93.5%) | 385 (6.5%) |
| 19 to 25 Years | 1,920 (69.4%) | 846 (30.6%) |
| 26 to 34 Years | 2,913 (75.1%) | 963 (24.8%) |
| 35 to 44 Years | 2,983 (79.6%) | 762 (20.3%) |
| 45 to 54 Years | 3,420 (85.8%) | 565 (14.2%) |
| 55 to 64 Years | 3,753 (84.3%) | 700 (15.7%) |
| 65 to 74 Years | 3,345 (99.8%) | 8 (0.2%) |
| 75 Years and older | 2,135 (100.0%) | 0 (0.0%) |
| Total | 28,383 (86.4%) | 4,476 (13.6%) |
Health Insurance Coverage by Citizenship Status in Panola County

| Citizenship Status | With Coverage | Without Coverage |
| Native Born | 2,383 (90.6%) | 247 (9.4%) |
| Foreign Born, Citizen | 5,531 (93.5%) | 385 (6.5%) |
| Foreign Born, not a Citizen | 1,920 (69.4%) | 846 (30.6%) |
Health Insurance Coverage by Household Income in Panola County
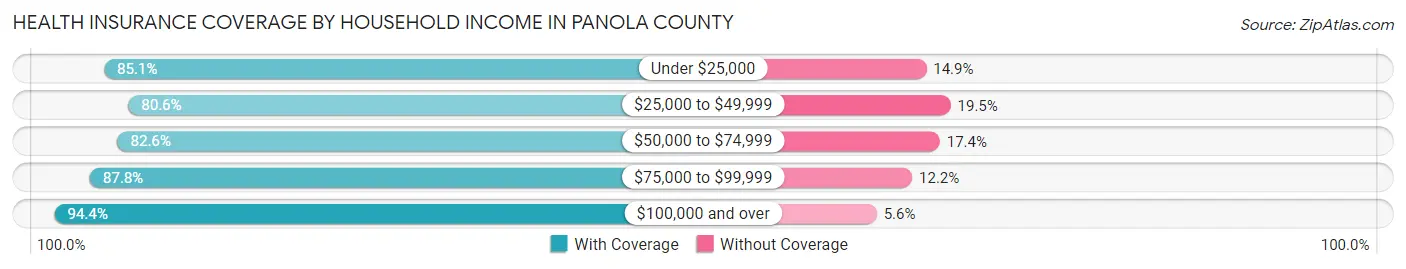
| Household Income | With Coverage | Without Coverage |
| Under $25,000 | 5,508 (85.1%) | 964 (14.9%) |
| $25,000 to $49,999 | 5,765 (80.5%) | 1,392 (19.5%) |
| $50,000 to $74,999 | 4,741 (82.6%) | 1,001 (17.4%) |
| $75,000 to $99,999 | 4,675 (87.8%) | 652 (12.2%) |
| $100,000 and over | 7,673 (94.4%) | 456 (5.6%) |
Public vs Private Health Insurance Coverage by Age in Panola County
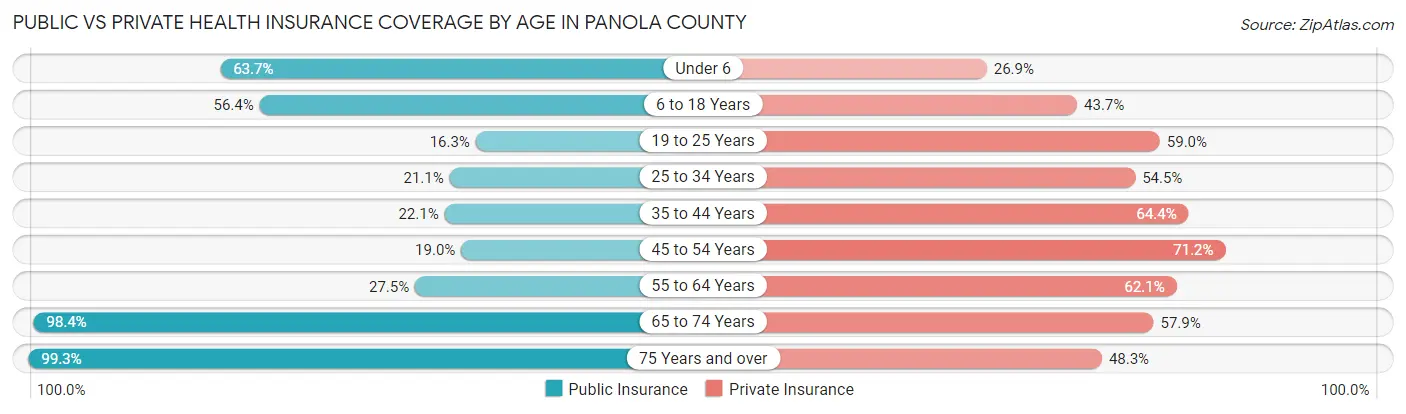
| Age Bracket | Public Insurance | Private Insurance |
| Under 6 | 1,675 (63.7%) | 708 (26.9%) |
| 6 to 18 Years | 3,336 (56.4%) | 2,584 (43.7%) |
| 19 to 25 Years | 450 (16.3%) | 1,633 (59.0%) |
| 25 to 34 Years | 819 (21.1%) | 2,111 (54.5%) |
| 35 to 44 Years | 826 (22.1%) | 2,410 (64.3%) |
| 45 to 54 Years | 756 (19.0%) | 2,837 (71.2%) |
| 55 to 64 Years | 1,226 (27.5%) | 2,766 (62.1%) |
| 65 to 74 Years | 3,298 (98.4%) | 1,940 (57.9%) |
| 75 Years and over | 2,120 (99.3%) | 1,031 (48.3%) |
| Total | 14,506 (44.2%) | 18,020 (54.8%) |
Disability Status by Sex by Age in Panola County
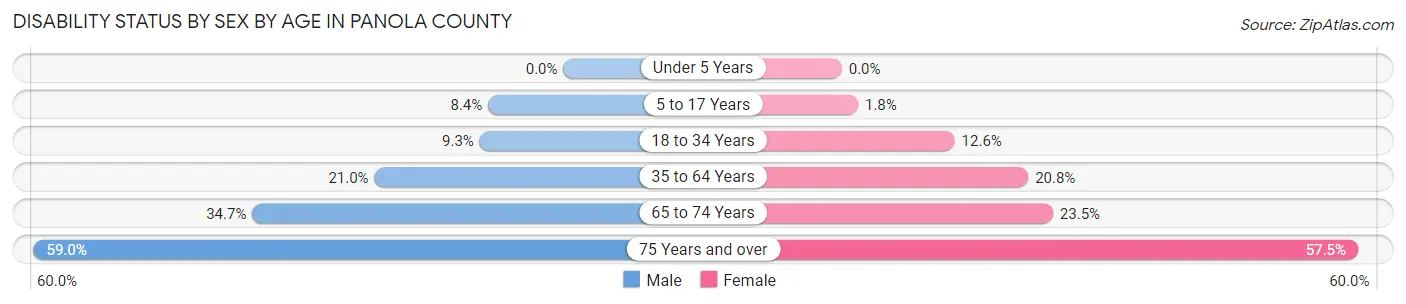
| Age Bracket | Male | Female |
| Under 5 Years | 0 (0.0%) | 0 (0.0%) |
| 5 to 17 Years | 253 (8.4%) | 52 (1.8%) |
| 18 to 34 Years | 319 (9.3%) | 455 (12.6%) |
| 35 to 64 Years | 1,210 (21.0%) | 1,335 (20.8%) |
| 65 to 74 Years | 553 (34.6%) | 413 (23.5%) |
| 75 Years and over | 505 (59.0%) | 735 (57.5%) |
Disability Class by Sex by Age in Panola County
Disability Class: Hearing Difficulty
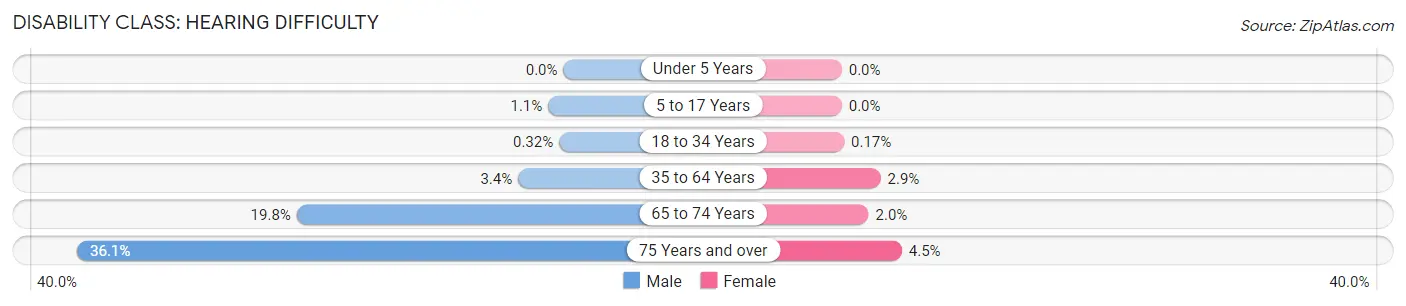
| Age Bracket | Male | Female |
| Under 5 Years | 0 (0.0%) | 0 (0.0%) |
| 5 to 17 Years | 34 (1.1%) | 0 (0.0%) |
| 18 to 34 Years | 11 (0.3%) | 6 (0.2%) |
| 35 to 64 Years | 193 (3.4%) | 185 (2.9%) |
| 65 to 74 Years | 316 (19.8%) | 35 (2.0%) |
| 75 Years and over | 309 (36.1%) | 57 (4.5%) |
Disability Class: Vision Difficulty
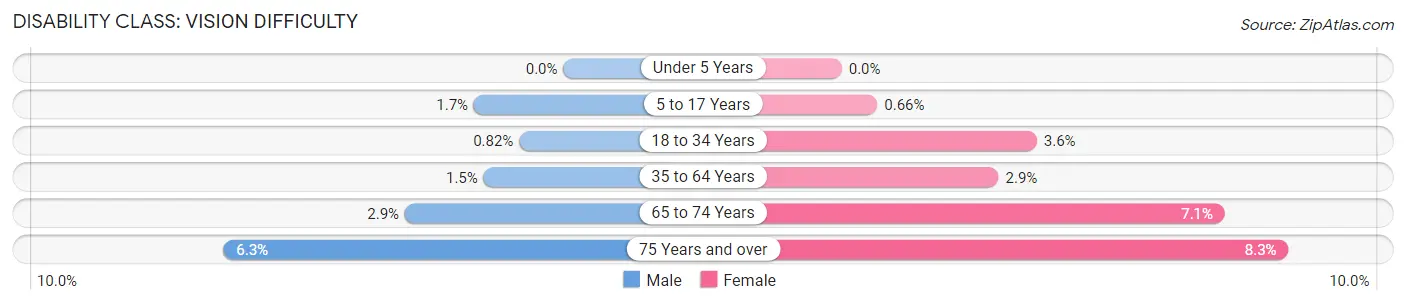
| Age Bracket | Male | Female |
| Under 5 Years | 0 (0.0%) | 0 (0.0%) |
| 5 to 17 Years | 50 (1.7%) | 19 (0.7%) |
| 18 to 34 Years | 28 (0.8%) | 131 (3.6%) |
| 35 to 64 Years | 85 (1.5%) | 187 (2.9%) |
| 65 to 74 Years | 47 (2.9%) | 125 (7.1%) |
| 75 Years and over | 54 (6.3%) | 106 (8.3%) |
Disability Class: Cognitive Difficulty
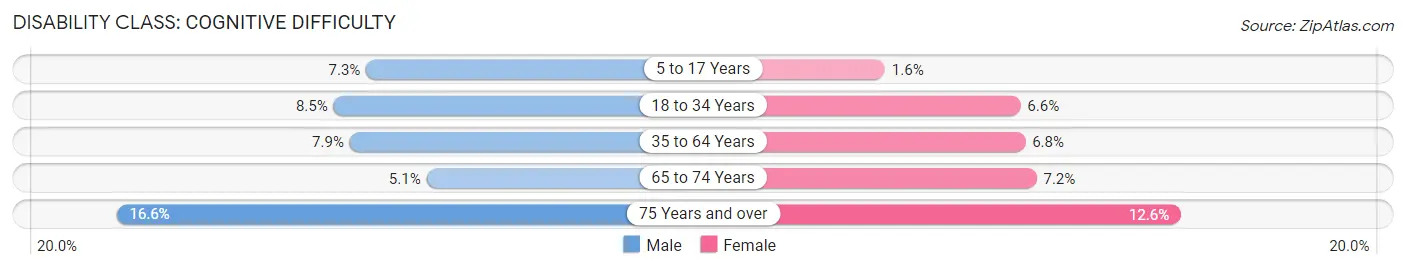
| Age Bracket | Male | Female |
| 5 to 17 Years | 221 (7.3%) | 46 (1.6%) |
| 18 to 34 Years | 292 (8.5%) | 240 (6.6%) |
| 35 to 64 Years | 456 (7.9%) | 438 (6.8%) |
| 65 to 74 Years | 81 (5.1%) | 127 (7.2%) |
| 75 Years and over | 142 (16.6%) | 161 (12.6%) |
Disability Class: Ambulatory Difficulty
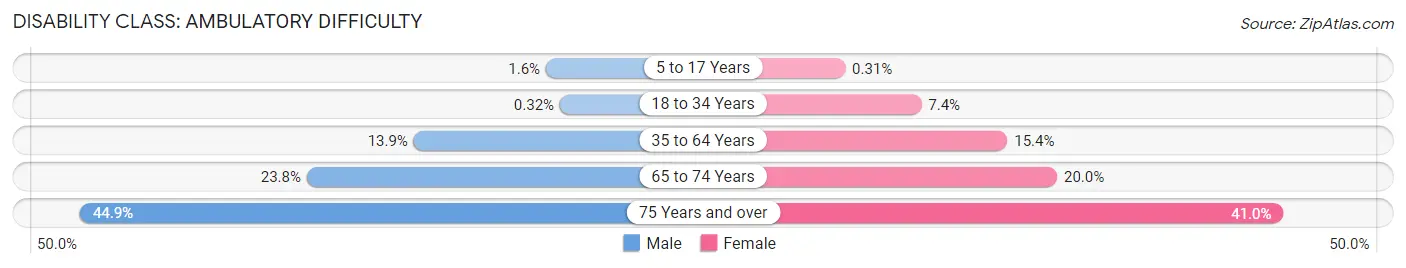
| Age Bracket | Male | Female |
| 5 to 17 Years | 49 (1.6%) | 9 (0.3%) |
| 18 to 34 Years | 11 (0.3%) | 267 (7.4%) |
| 35 to 64 Years | 799 (13.9%) | 988 (15.4%) |
| 65 to 74 Years | 380 (23.8%) | 351 (20.0%) |
| 75 Years and over | 384 (44.9%) | 524 (41.0%) |
Disability Class: Self-Care Difficulty
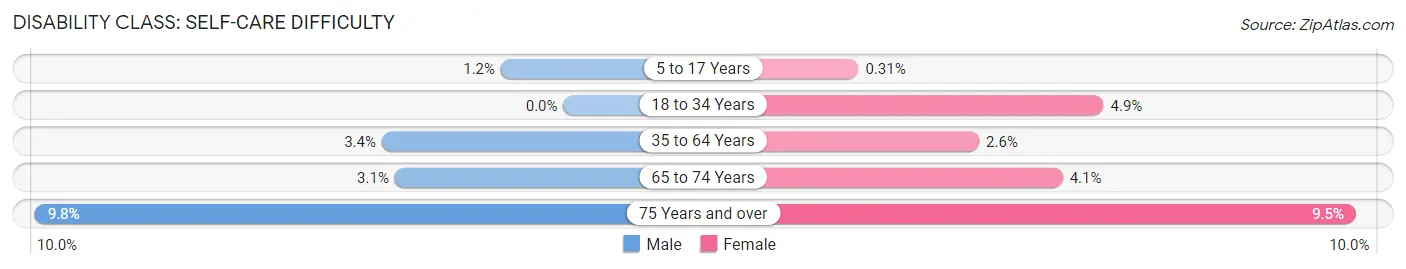
| Age Bracket | Male | Female |
| 5 to 17 Years | 35 (1.2%) | 9 (0.3%) |
| 18 to 34 Years | 0 (0.0%) | 176 (4.9%) |
| 35 to 64 Years | 194 (3.4%) | 164 (2.5%) |
| 65 to 74 Years | 50 (3.1%) | 72 (4.1%) |
| 75 Years and over | 84 (9.8%) | 122 (9.5%) |
Technology Access in Panola County
Computing Device Access in Panola County
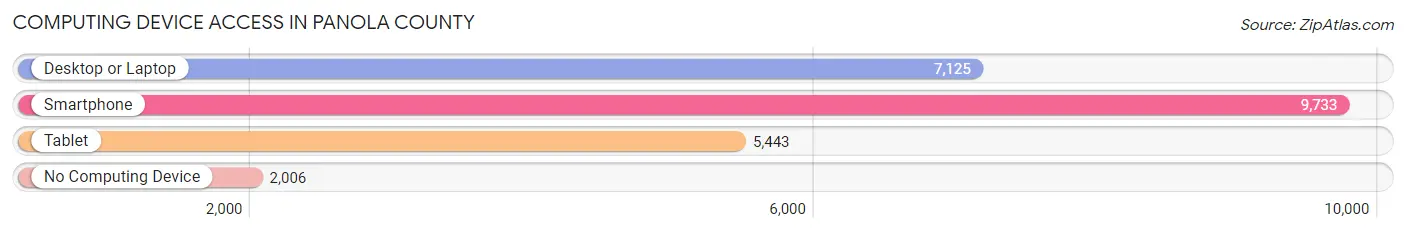
| Device Type | # Households | % Households |
| Desktop or Laptop | 7,125 | 57.5% |
| Smartphone | 9,733 | 78.5% |
| Tablet | 5,443 | 43.9% |
| No Computing Device | 2,006 | 16.2% |
| Total | 12,392 | 100.0% |
Internet Access in Panola County
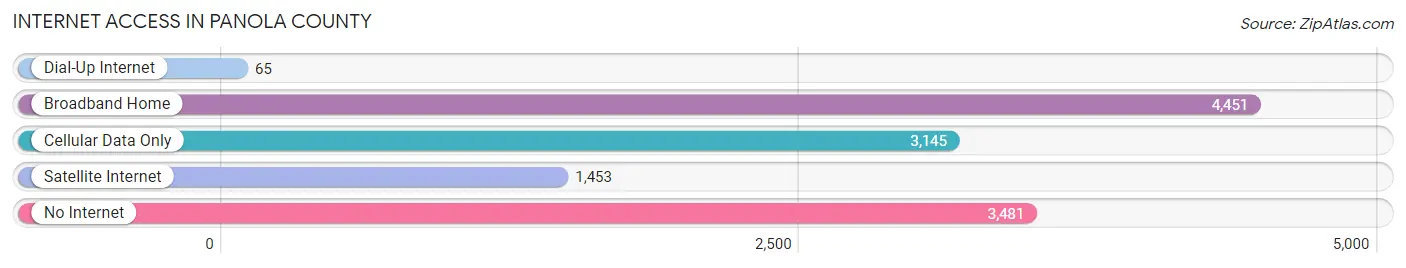
| Internet Type | # Households | % Households |
| Dial-Up Internet | 65 | 0.5% |
| Broadband Home | 4,451 | 35.9% |
| Cellular Data Only | 3,145 | 25.4% |
| Satellite Internet | 1,453 | 11.7% |
| No Internet | 3,481 | 28.1% |
| Total | 12,392 | 100.0% |
Panola County Summary
Panola County, Mississippi is located in the northwest corner of the state, bordered by the states of Arkansas and Tennessee. It is part of the Delta region of Mississippi, and is known for its rich agricultural heritage. The county was established in 1836 and named after a Choctaw word meaning “cotton.” The county seat is Batesville, and the population was 34,707 at the 2010 census.
Geography
Panola County is located in the northwest corner of Mississippi, bordered by the states of Arkansas and Tennessee. It is part of the Delta region of Mississippi, and is known for its rich agricultural heritage. The county is mostly flat, with some rolling hills in the northern part. The terrain is mostly covered in forests and farmland. The county is drained by the Tallahatchie River, which flows through the county from north to south.
The county has a total area of 576 square miles, of which 574 square miles is land and 2 square miles is water. The county is divided into two distinct regions: the Delta region in the south and the Hill Country in the north. The Delta region is characterized by flat, fertile land, while the Hill Country is characterized by rolling hills and forests.
Economy
Panola County’s economy is largely based on agriculture. The county is known for its cotton production, and is one of the top cotton-producing counties in the state. Other crops grown in the county include soybeans, corn, wheat, and hay. The county also has a thriving timber industry, and is home to several lumber mills.
In addition to agriculture, Panola County is home to several manufacturing companies. The county is home to a number of automotive parts manufacturers, as well as a number of food processing plants. The county is also home to a number of retail stores, including several large chain stores.
Demographics
As of the 2010 census, Panola County had a population of 34,707. The population was spread out with 24.3% under the age of 18, 10.2% from 18 to 24, 25.2% from 25 to 44, 24.3% from 45 to 64, and 15.9% who were 65 years of age or older. The median age was 37.4 years.
The racial makeup of the county was 68.2% White, 28.7% African American, 0.3% Native American, 0.3% Asian, 0.1% Pacific Islander, 0.7% from other races, and 1.5% from two or more races. Hispanic or Latino of any race were 2.2% of the population.
The median income for a household in the county was $35,945, and the median income for a family was $43,945. Males had a median income of $35,945 versus $25,945 for females. The per capita income for the county was $17,945. About 17.2% of families and 21.2% of the population were below the poverty line, including 28.2% of those under age 18 and 16.2% of those age 65 or over.
Conclusion
Panola County, Mississippi is a rural county located in the northwest corner of the state. It is part of the Delta region of Mississippi, and is known for its rich agricultural heritage. The county is mostly flat, with some rolling hills in the northern part. The economy is largely based on agriculture, with cotton being the main crop. The county also has a thriving timber industry, and is home to several manufacturing companies. The population of the county was 34,707 at the 2010 census, and the median income for a household was $35,945.
Common Questions
What is Per Capita Income in Panola County?
Per Capita income in Panola County is $25,822.
What is the Median Family Income in Panola County?
Median Family Income in Panola County is $60,911.
What is the Median Household income in Panola County?
Median Household Income in Panola County is $47,894.
What is Income or Wage Gap in Panola County?
Income or Wage Gap in Panola County is 23.6%.
Women in Panola County earn 76.4 cents for every dollar earned by a man.
What is Family Income Deficit in Panola County?
Family Income Deficit in Panola County is $11,803.
Families that are below poverty line in Panola County earn $11,803 less on average than the poverty threshold level.
What is Inequality or Gini Index in Panola County?
Inequality or Gini Index in Panola County is 0.48.
What is the Total Population of Panola County?
Total Population of Panola County is 33,157.
What is the Total Male Population of Panola County?
Total Male Population of Panola County is 15,990.
What is the Total Female Population of Panola County?
Total Female Population of Panola County is 17,167.
What is the Ratio of Males per 100 Females in Panola County?
There are 93.14 Males per 100 Females in Panola County.
What is the Ratio of Females per 100 Males in Panola County?
There are 107.36 Females per 100 Males in Panola County.
What is the Median Population Age in Panola County?
Median Population Age in Panola County is 39.4 Years.
What is the Average Family Size in Panola County
Average Family Size in Panola County is 3.3 People.
What is the Average Household Size in Panola County
Average Household Size in Panola County is 2.6 People.
How Large is the Labor Force in Panola County?
There are 13,105 People in the Labor Forcein in Panola County.
What is the Percentage of People in the Labor Force in Panola County?
50.8% of People are in the Labor Force in Panola County.
What is the Unemployment Rate in Panola County?
Unemployment Rate in Panola County is 9.5%.