Oktibbeha County, MS Map & Demographics
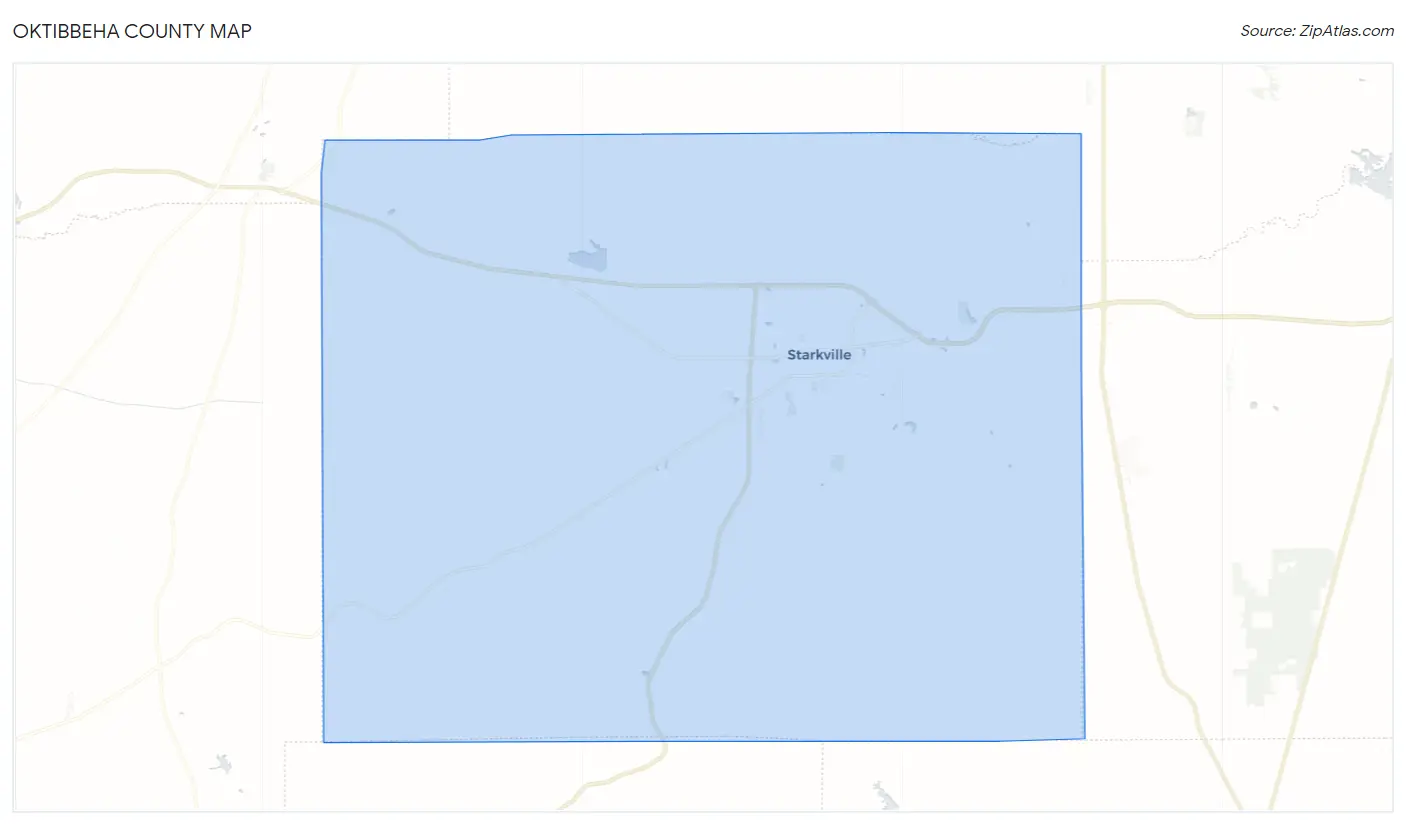
Oktibbeha County Map
Oktibbeha County Overview
$28,221
PER CAPITA INCOME
$76,076
AVG FAMILY INCOME
$42,953
AVG HOUSEHOLD INCOME
15.7%
WAGE / INCOME GAP [ % ]
84.3¢/ $1
WAGE / INCOME GAP [ $ ]
0.55
INEQUALITY / GINI INDEX
51,388
TOTAL POPULATION
25,696
MALE POPULATION
25,692
FEMALE POPULATION
100.02
MALES / 100 FEMALES
99.98
FEMALES / 100 MALES
25.4
MEDIAN AGE
2.8
AVG FAMILY SIZE
2.2
AVG HOUSEHOLD SIZE
24,561
LABOR FORCE [ PEOPLE ]
56.3%
PERCENT IN LABOR FORCE
6.8%
UNEMPLOYMENT RATE
Oktibbeha County Area Codes
Income in Oktibbeha County
Income Overview in Oktibbeha County
Per Capita Income in Oktibbeha County is $28,221, while median incomes of families and households are $76,076 and $42,953 respectively.
| Characteristic | Number | Measure |
| Per Capita Income | 51,388 | $28,221 |
| Median Family Income | 10,519 | $76,076 |
| Mean Family Income | 10,519 | $94,485 |
| Median Household Income | 21,165 | $42,953 |
| Mean Household Income | 21,165 | $67,684 |
| Income Deficit | 10,519 | $0 |
| Wage / Income Gap (%) | 51,388 | 15.72% |
| Wage / Income Gap ($) | 51,388 | 84.28¢ per $1 |
| Gini / Inequality Index | 51,388 | 0.55 |
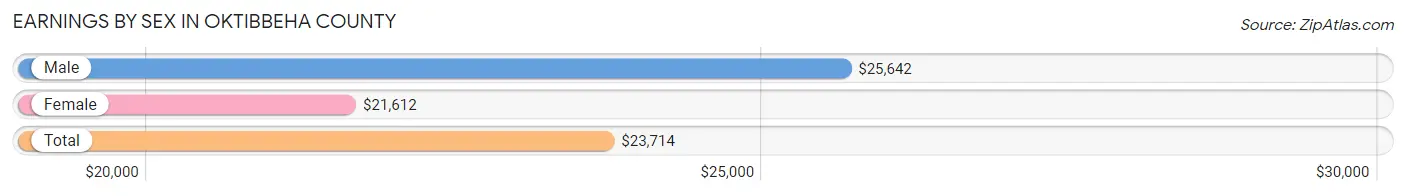
Earnings by Sex in Oktibbeha County
Average Earnings in Oktibbeha County are $23,714, $25,642 for men and $21,612 for women, a difference of 15.7%.
| Sex | Number | Average Earnings |
| Male | 15,153 (53.2%) | $25,642 |
| Female | 13,342 (46.8%) | $21,612 |
| Total | 28,495 (100.0%) | $23,714 |
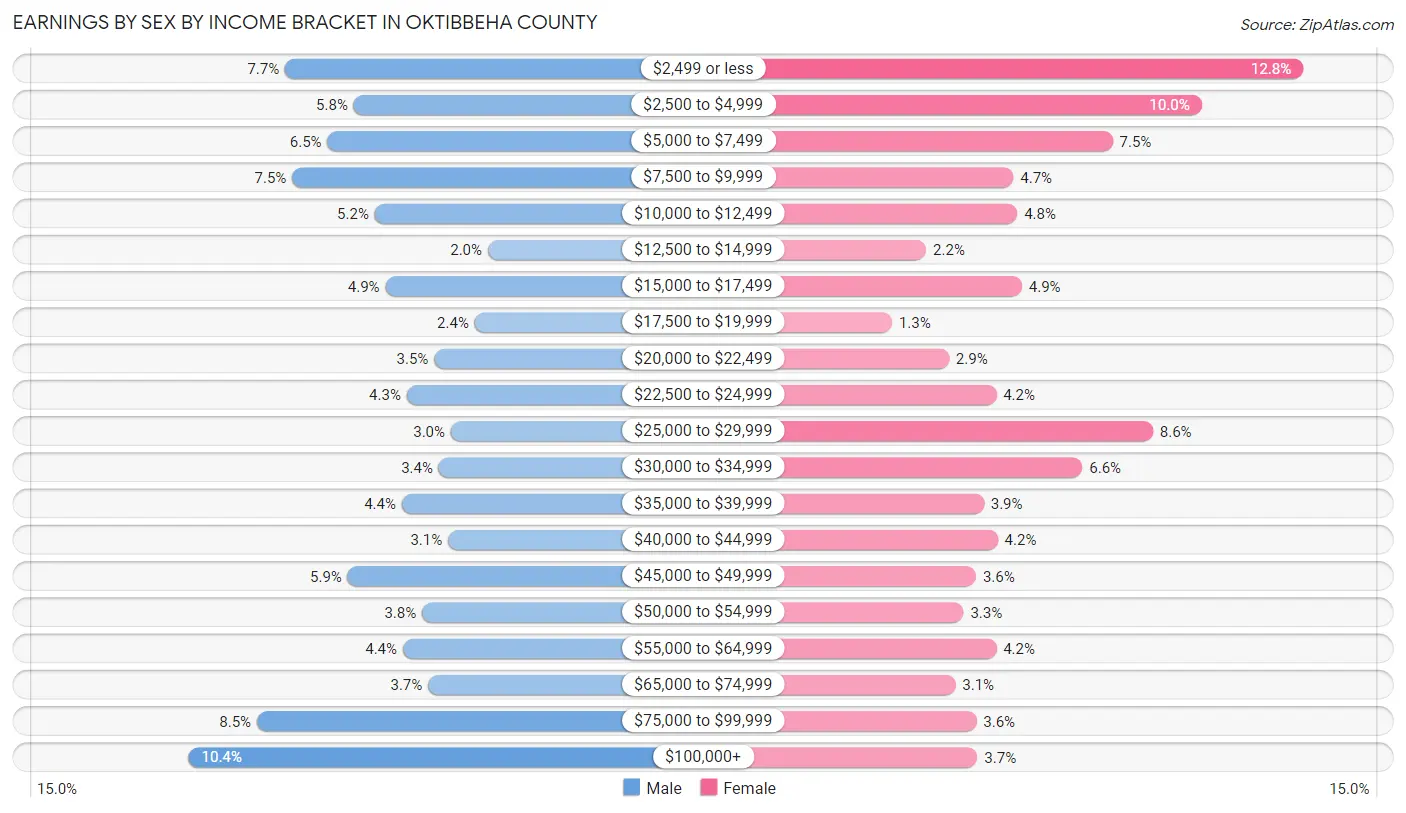
Earnings by Sex by Income Bracket in Oktibbeha County
The most common earnings brackets in Oktibbeha County are $100,000+ for men (1,574 | 10.4%) and $2,499 or less for women (1,710 | 12.8%).
| Income | Male | Female |
| $2,499 or less | 1,164 (7.7%) | 1,710 (12.8%) |
| $2,500 to $4,999 | 871 (5.8%) | 1,330 (10.0%) |
| $5,000 to $7,499 | 984 (6.5%) | 997 (7.5%) |
| $7,500 to $9,999 | 1,133 (7.5%) | 625 (4.7%) |
| $10,000 to $12,499 | 782 (5.2%) | 639 (4.8%) |
| $12,500 to $14,999 | 300 (2.0%) | 297 (2.2%) |
| $15,000 to $17,499 | 736 (4.9%) | 657 (4.9%) |
| $17,500 to $19,999 | 356 (2.4%) | 169 (1.3%) |
| $20,000 to $22,499 | 529 (3.5%) | 383 (2.9%) |
| $22,500 to $24,999 | 645 (4.3%) | 561 (4.2%) |
| $25,000 to $29,999 | 457 (3.0%) | 1,148 (8.6%) |
| $30,000 to $34,999 | 509 (3.4%) | 883 (6.6%) |
| $35,000 to $39,999 | 666 (4.4%) | 514 (3.8%) |
| $40,000 to $44,999 | 470 (3.1%) | 566 (4.2%) |
| $45,000 to $49,999 | 897 (5.9%) | 484 (3.6%) |
| $50,000 to $54,999 | 581 (3.8%) | 437 (3.3%) |
| $55,000 to $64,999 | 662 (4.4%) | 561 (4.2%) |
| $65,000 to $74,999 | 554 (3.7%) | 407 (3.0%) |
| $75,000 to $99,999 | 1,283 (8.5%) | 485 (3.6%) |
| $100,000+ | 1,574 (10.4%) | 489 (3.7%) |
| Total | 15,153 (100.0%) | 13,342 (100.0%) |
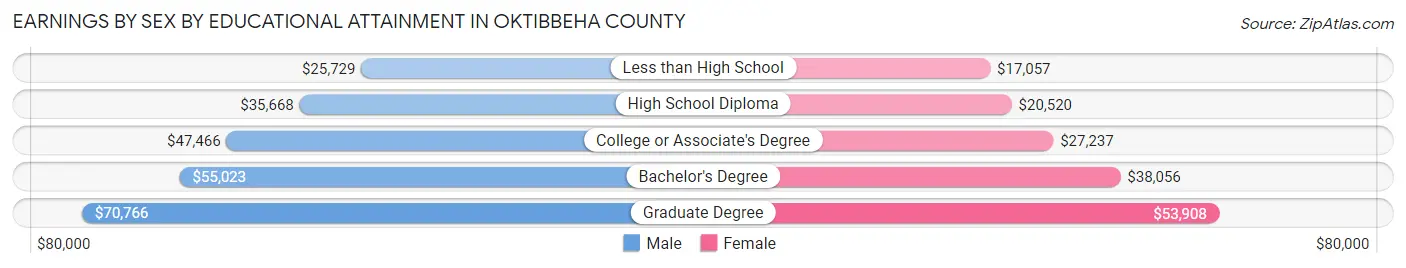
Earnings by Sex by Educational Attainment in Oktibbeha County
Average earnings in Oktibbeha County are $48,498 for men and $33,899 for women, a difference of 30.1%. Men with an educational attainment of graduate degree enjoy the highest average annual earnings of $70,766, while those with less than high school education earn the least with $25,729. Women with an educational attainment of graduate degree earn the most with the average annual earnings of $53,908, while those with less than high school education have the smallest earnings of $17,057.
| Educational Attainment | Male Income | Female Income |
| Less than High School | $25,729 | $17,057 |
| High School Diploma | $35,668 | $20,520 |
| College or Associate's Degree | $47,466 | $27,237 |
| Bachelor's Degree | $55,023 | $38,056 |
| Graduate Degree | $70,766 | $53,908 |
| Total | $48,498 | $33,899 |
Family Income in Oktibbeha County
Family Income Brackets in Oktibbeha County
According to the Oktibbeha County family income data, there are 1,715 families falling into the $100,000 to $149,999 income range, which is the most common income bracket and makes up 16.3% of all families. Conversely, the $10,000 to $14,999 income bracket is the least frequent group with only 358 families (3.4%) belonging to this category.
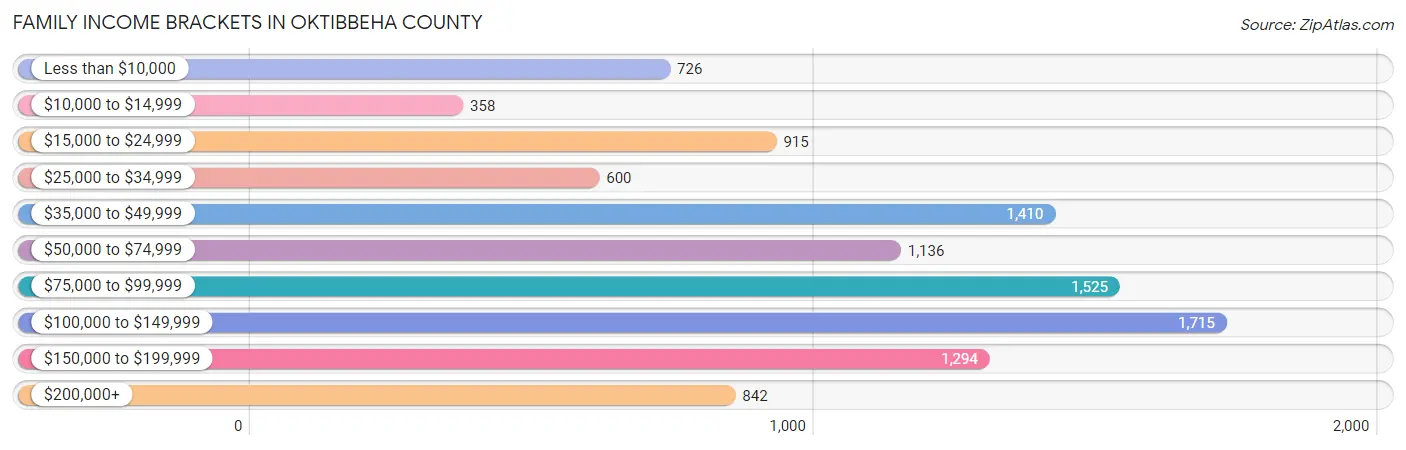
| Income Bracket | # Families | % Families |
| Less than $10,000 | 726 | 6.9% |
| $10,000 to $14,999 | 358 | 3.4% |
| $15,000 to $24,999 | 915 | 8.7% |
| $25,000 to $34,999 | 600 | 5.7% |
| $35,000 to $49,999 | 1,410 | 13.4% |
| $50,000 to $74,999 | 1,136 | 10.8% |
| $75,000 to $99,999 | 1,525 | 14.5% |
| $100,000 to $149,999 | 1,715 | 16.3% |
| $150,000 to $199,999 | 1,294 | 12.3% |
| $200,000+ | 842 | 8.0% |
Family Income by Famaliy Size in Oktibbeha County
4-person families (1,400 | 13.3%) account for the highest median family income in Oktibbeha County with $116,354 per family, while 4-person families (1,400 | 13.3%) have the highest median income of $29,088 per family member.
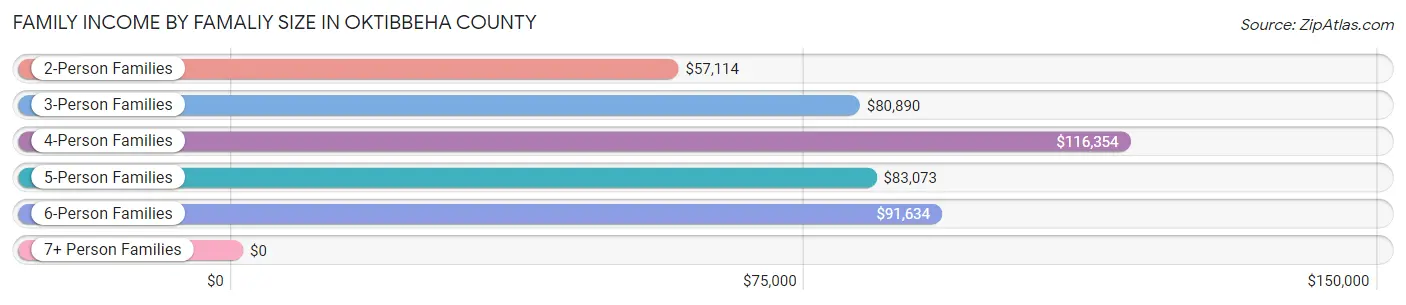
| Income Bracket | # Families | Median Income |
| 2-Person Families | 5,601 (53.2%) | $57,114 |
| 3-Person Families | 2,522 (24.0%) | $80,890 |
| 4-Person Families | 1,400 (13.3%) | $116,354 |
| 5-Person Families | 607 (5.8%) | $83,073 |
| 6-Person Families | 247 (2.4%) | $91,634 |
| 7+ Person Families | 142 (1.3%) | $0 |
| Total | 10,519 (100.0%) | $76,076 |
Family Income by Number of Earners in Oktibbeha County
The median family income in Oktibbeha County is $76,076, with families comprising 3+ earners (862) having the highest median family income of $125,922, while families with 1 earner (3,492) have the lowest median family income of $45,570, accounting for 8.2% and 33.2% of families, respectively.
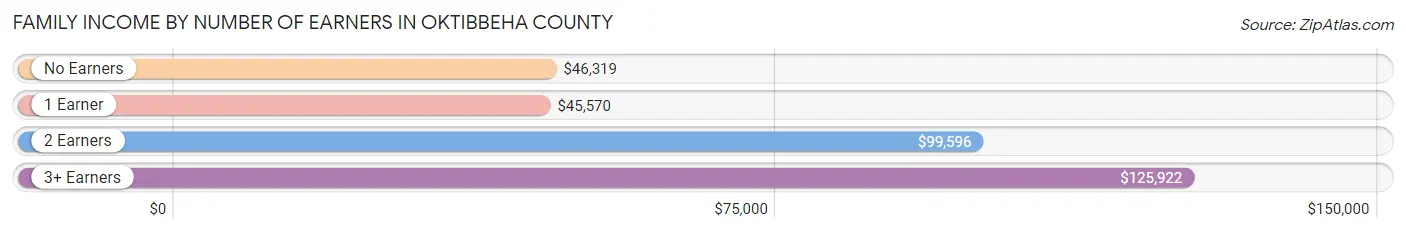
| Number of Earners | # Families | Median Income |
| No Earners | 1,966 (18.7%) | $46,319 |
| 1 Earner | 3,492 (33.2%) | $45,570 |
| 2 Earners | 4,199 (39.9%) | $99,596 |
| 3+ Earners | 862 (8.2%) | $125,922 |
| Total | 10,519 (100.0%) | $76,076 |
Household Income in Oktibbeha County
Household Income Brackets in Oktibbeha County
With 3,492 households falling in the category, the less than $10,000 income range is the most frequent in Oktibbeha County, accounting for 16.5% of all households. In contrast, only 974 households (4.6%) fall into the $200,000+ income bracket, making it the least populous group.
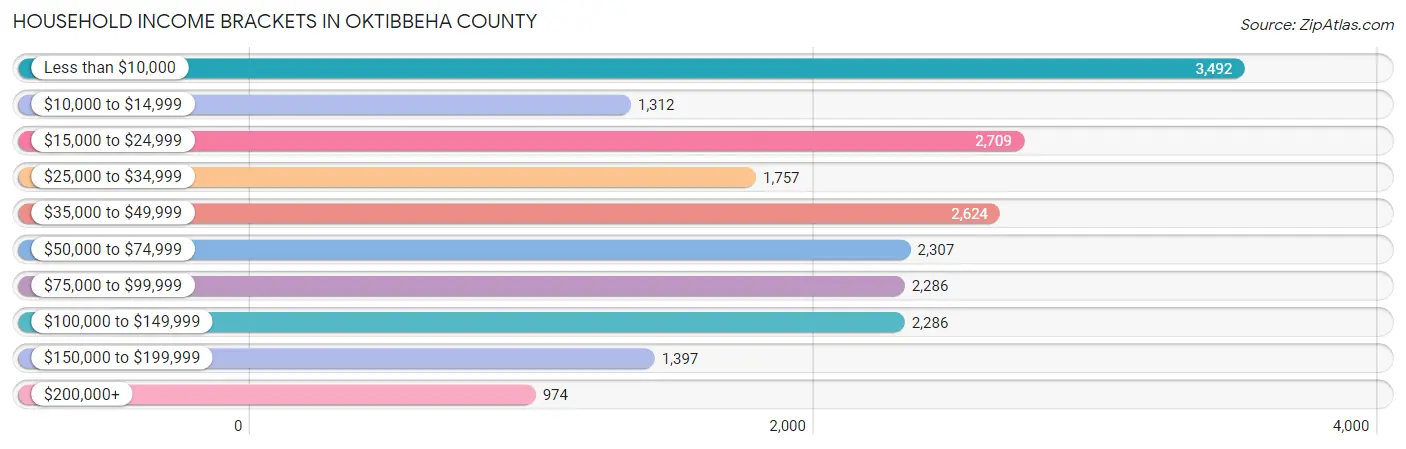
| Income Bracket | # Households | % Households |
| Less than $10,000 | 3,492 | 16.5% |
| $10,000 to $14,999 | 1,312 | 6.2% |
| $15,000 to $24,999 | 2,709 | 12.8% |
| $25,000 to $34,999 | 1,757 | 8.3% |
| $35,000 to $49,999 | 2,624 | 12.4% |
| $50,000 to $74,999 | 2,307 | 10.9% |
| $75,000 to $99,999 | 2,286 | 10.8% |
| $100,000 to $149,999 | 2,286 | 10.8% |
| $150,000 to $199,999 | 1,397 | 6.6% |
| $200,000+ | 974 | 4.6% |
Household Income by Householder Age in Oktibbeha County
The median household income in Oktibbeha County is $42,953, with the highest median household income of $76,693 found in the 45 to 64 years age bracket for the primary householder. A total of 4,979 households (23.5%) fall into this category. Meanwhile, the 15 to 24 years age bracket for the primary householder has the lowest median household income of $16,683, with 5,709 households (27.0%) in this group.
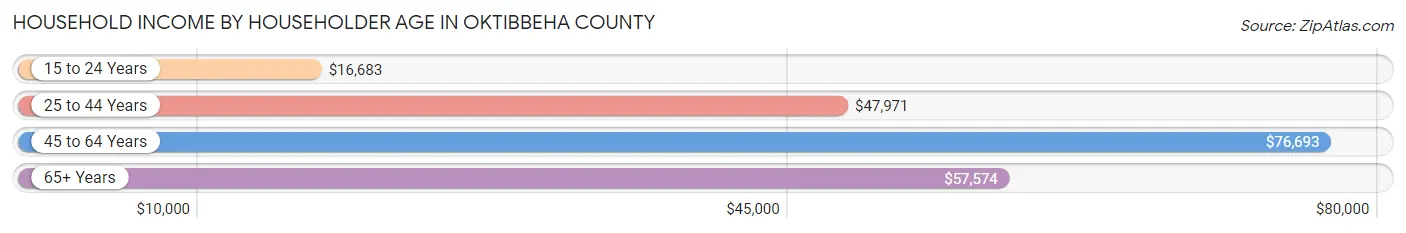
| Income Bracket | # Households | Median Income |
| 15 to 24 Years | 5,709 (27.0%) | $16,683 |
| 25 to 44 Years | 6,658 (31.5%) | $47,971 |
| 45 to 64 Years | 4,979 (23.5%) | $76,693 |
| 65+ Years | 3,819 (18.0%) | $57,574 |
| Total | 21,165 (100.0%) | $42,953 |
Poverty in Oktibbeha County
Income Below Poverty by Sex and Age in Oktibbeha County
With 28.9% poverty level for males and 28.0% for females among the residents of Oktibbeha County, 18 to 24 year old males and 18 to 24 year old females are the most vulnerable to poverty, with 4,364 males (61.9%) and 2,962 females (63.5%) in their respective age groups living below the poverty level.
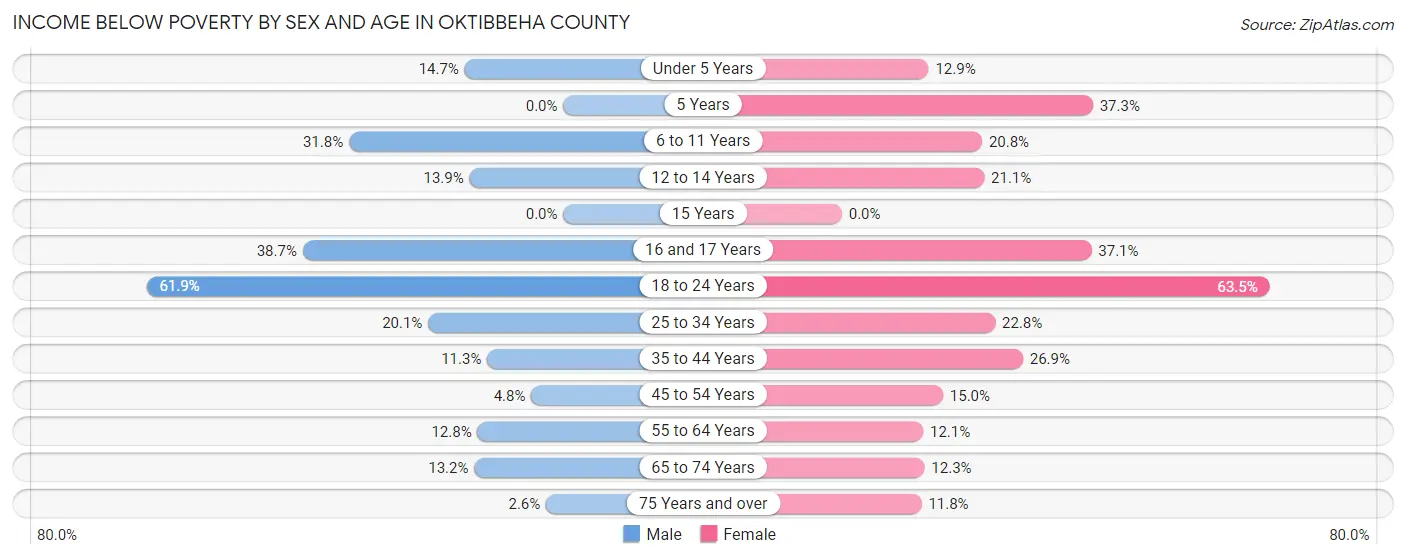
| Age Bracket | Male | Female |
| Under 5 Years | 191 (14.6%) | 159 (12.9%) |
| 5 Years | 0 (0.0%) | 136 (37.3%) |
| 6 to 11 Years | 452 (31.8%) | 261 (20.8%) |
| 12 to 14 Years | 113 (13.9%) | 153 (21.1%) |
| 15 Years | 0 (0.0%) | 0 (0.0%) |
| 16 and 17 Years | 190 (38.7%) | 229 (37.1%) |
| 18 to 24 Years | 4,364 (61.9%) | 2,962 (63.5%) |
| 25 to 34 Years | 695 (20.1%) | 746 (22.8%) |
| 35 to 44 Years | 269 (11.3%) | 651 (26.9%) |
| 45 to 54 Years | 85 (4.8%) | 314 (15.0%) |
| 55 to 64 Years | 258 (12.8%) | 281 (12.1%) |
| 65 to 74 Years | 199 (13.2%) | 216 (12.3%) |
| 75 Years and over | 25 (2.6%) | 184 (11.8%) |
| Total | 6,841 (28.9%) | 6,292 (28.0%) |
Income Above Poverty by Sex and Age in Oktibbeha County
According to the poverty statistics in Oktibbeha County, males aged 5 years and females aged 15 years are the age groups that are most secure financially, with 100.0% of males and 100.0% of females in these age groups living above the poverty line.
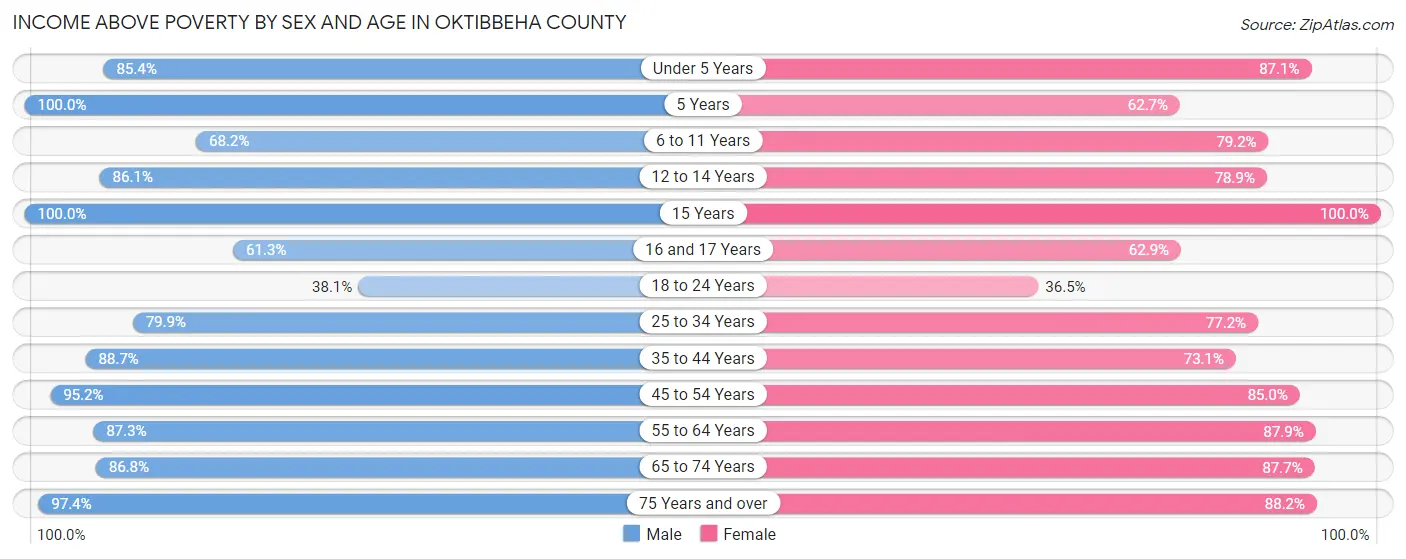
| Age Bracket | Male | Female |
| Under 5 Years | 1,113 (85.4%) | 1,076 (87.1%) |
| 5 Years | 247 (100.0%) | 229 (62.7%) |
| 6 to 11 Years | 968 (68.2%) | 993 (79.2%) |
| 12 to 14 Years | 698 (86.1%) | 571 (78.9%) |
| 15 Years | 201 (100.0%) | 156 (100.0%) |
| 16 and 17 Years | 301 (61.3%) | 389 (62.9%) |
| 18 to 24 Years | 2,686 (38.1%) | 1,702 (36.5%) |
| 25 to 34 Years | 2,768 (79.9%) | 2,532 (77.2%) |
| 35 to 44 Years | 2,112 (88.7%) | 1,771 (73.1%) |
| 45 to 54 Years | 1,702 (95.2%) | 1,778 (85.0%) |
| 55 to 64 Years | 1,766 (87.3%) | 2,047 (87.9%) |
| 65 to 74 Years | 1,306 (86.8%) | 1,545 (87.7%) |
| 75 Years and over | 952 (97.4%) | 1,372 (88.2%) |
| Total | 16,820 (71.1%) | 16,161 (72.0%) |
Income Below Poverty Among Married-Couple Families in Oktibbeha County
The poverty statistics for married-couple families in Oktibbeha County show that 4.4% or 325 of the total 7,443 families live below the poverty line. Families with 3 or 4 children have the highest poverty rate of 5.8%, comprising of 36 families. On the other hand, families with 5 or more children have the lowest poverty rate of 0.0%, which includes 0 families.
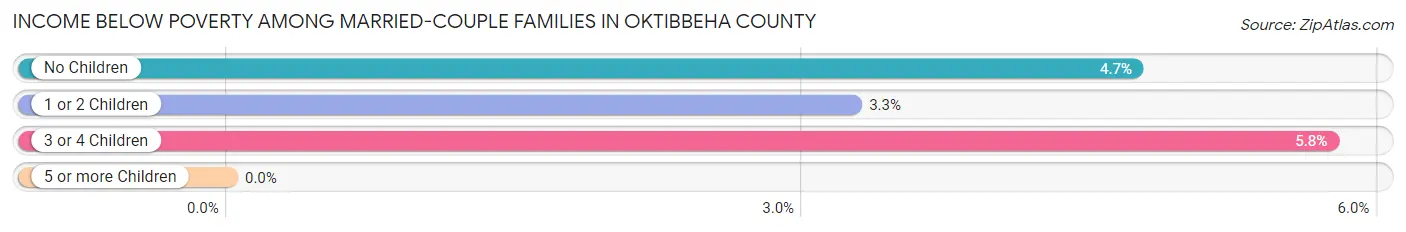
| Children | Above Poverty | Below Poverty |
| No Children | 4,348 (95.3%) | 216 (4.7%) |
| 1 or 2 Children | 2,167 (96.7%) | 73 (3.3%) |
| 3 or 4 Children | 590 (94.3%) | 36 (5.8%) |
| 5 or more Children | 13 (100.0%) | 0 (0.0%) |
| Total | 7,118 (95.6%) | 325 (4.4%) |
Income Below Poverty Among Single-Parent Households in Oktibbeha County
According to the poverty data in Oktibbeha County, 14.6% or 68 single-father households and 42.7% or 1,116 single-mother households are living below the poverty line. Among single-father households, those with 1 or 2 children have the highest poverty rate, with 61 households (25.6%) experiencing poverty. Likewise, among single-mother households, those with 1 or 2 children have the highest poverty rate, with 908 households (58.4%) falling below the poverty line.
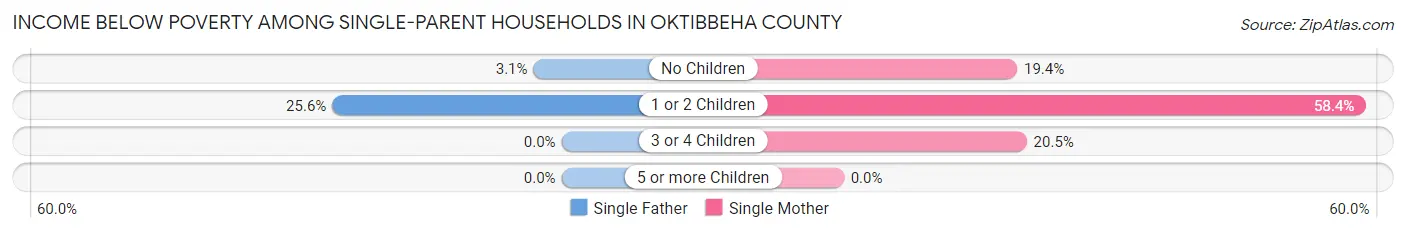
| Children | Single Father | Single Mother |
| No Children | 7 (3.1%) | 144 (19.4%) |
| 1 or 2 Children | 61 (25.6%) | 908 (58.4%) |
| 3 or 4 Children | 0 (0.0%) | 64 (20.4%) |
| 5 or more Children | 0 (0.0%) | 0 (0.0%) |
| Total | 68 (14.6%) | 1,116 (42.7%) |
Income Below Poverty Among Married-Couple vs Single-Parent Households in Oktibbeha County
The poverty data for Oktibbeha County shows that 325 of the married-couple family households (4.4%) and 1,184 of the single-parent households (38.5%) are living below the poverty level. Within the married-couple family households, those with 3 or 4 children have the highest poverty rate, with 36 households (5.8%) falling below the poverty line. Among the single-parent households, those with 1 or 2 children have the highest poverty rate, with 969 household (54.0%) living below poverty.
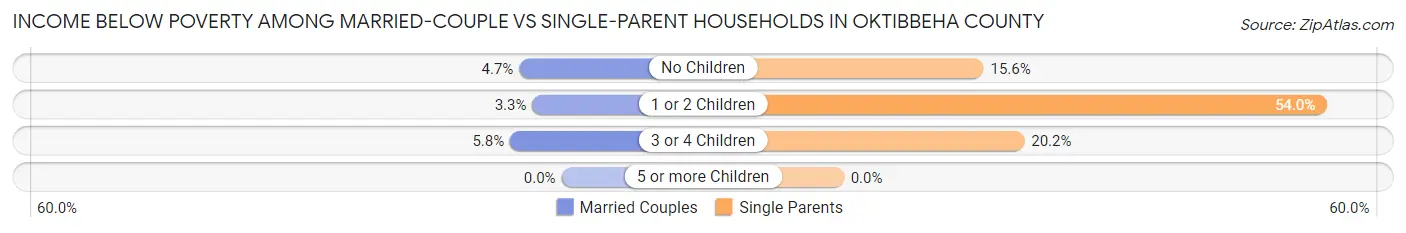
| Children | Married-Couple Families | Single-Parent Households |
| No Children | 216 (4.7%) | 151 (15.6%) |
| 1 or 2 Children | 73 (3.3%) | 969 (54.0%) |
| 3 or 4 Children | 36 (5.8%) | 64 (20.2%) |
| 5 or more Children | 0 (0.0%) | 0 (0.0%) |
| Total | 325 (4.4%) | 1,184 (38.5%) |
Race in Oktibbeha County
The most populous races in Oktibbeha County are White / Caucasian (29,026 | 56.5%), Black / African American (18,883 | 36.7%), and Two or more Races (1,609 | 3.1%).
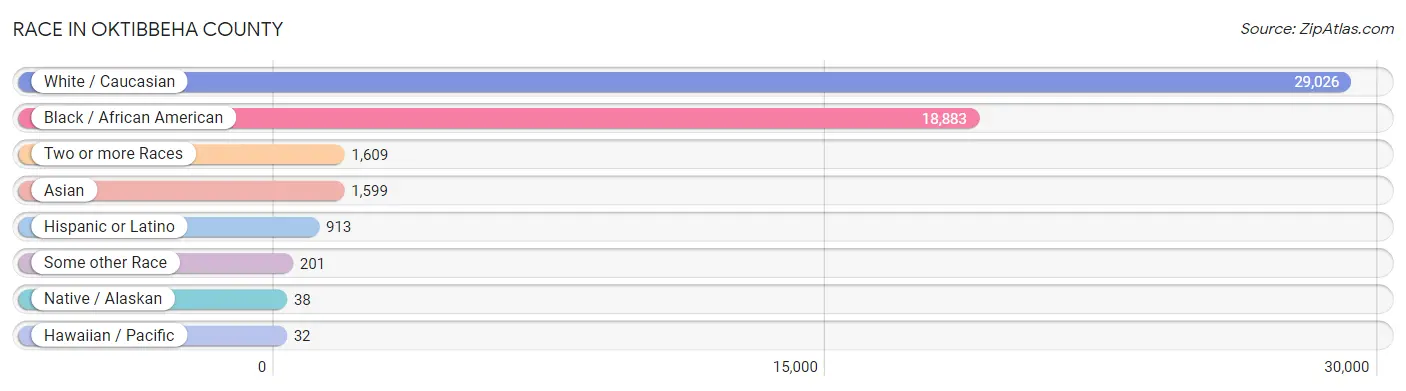
| Race | # Population | % Population |
| Asian | 1,599 | 3.1% |
| Black / African American | 18,883 | 36.7% |
| Hawaiian / Pacific | 32 | 0.1% |
| Hispanic or Latino | 913 | 1.8% |
| Native / Alaskan | 38 | 0.1% |
| White / Caucasian | 29,026 | 56.5% |
| Two or more Races | 1,609 | 3.1% |
| Some other Race | 201 | 0.4% |
| Total | 51,388 | 100.0% |
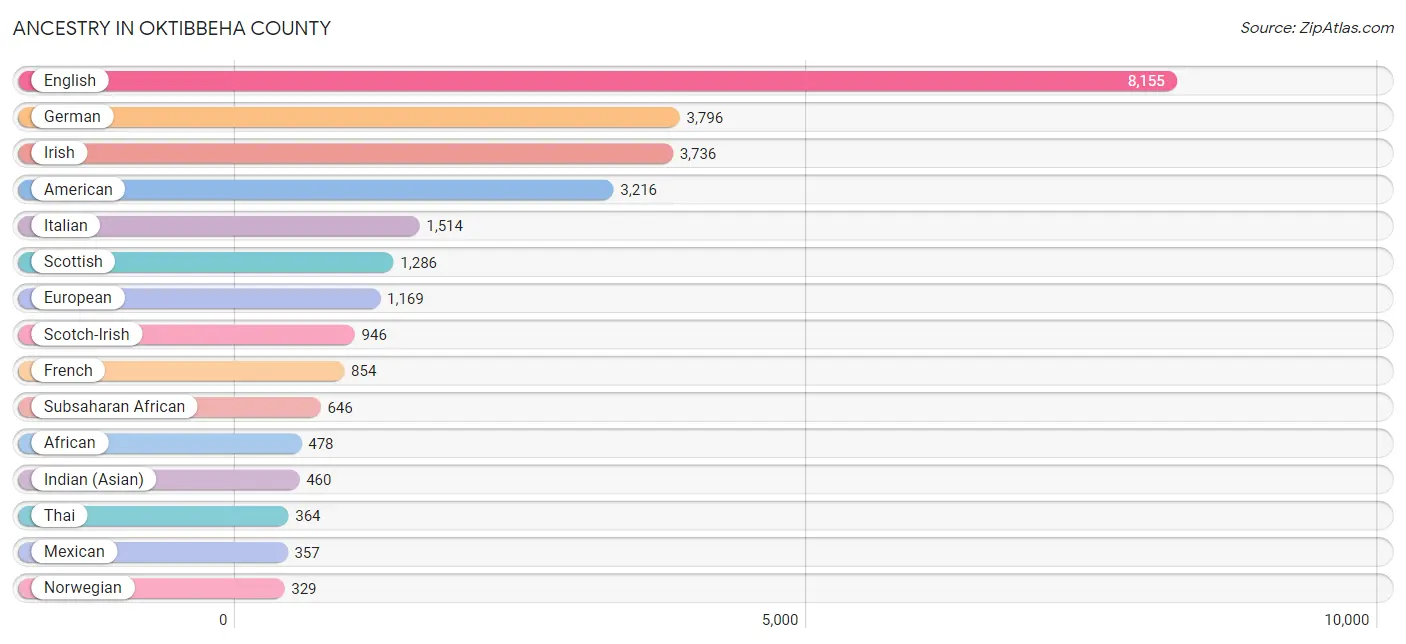
Ancestry in Oktibbeha County
The most populous ancestries reported in Oktibbeha County are English (8,155 | 15.9%), German (3,796 | 7.4%), Irish (3,736 | 7.3%), American (3,216 | 6.3%), and Italian (1,514 | 2.9%), together accounting for 39.7% of all Oktibbeha County residents.
| Ancestry | # Population | % Population |
| African | 478 | 0.9% |
| Alsatian | 19 | 0.0% |
| American | 3,216 | 6.3% |
| Apache | 7 | 0.0% |
| Arab | 214 | 0.4% |
| Austrian | 33 | 0.1% |
| Bhutanese | 21 | 0.0% |
| Brazilian | 12 | 0.0% |
| British | 251 | 0.5% |
| Burmese | 112 | 0.2% |
| Canadian | 41 | 0.1% |
| Celtic | 8 | 0.0% |
| Central American | 125 | 0.2% |
| Cherokee | 79 | 0.2% |
| Choctaw | 105 | 0.2% |
| Colombian | 66 | 0.1% |
| Comanche | 9 | 0.0% |
| Cree | 7 | 0.0% |
| Croatian | 34 | 0.1% |
| Cuban | 57 | 0.1% |
| Czech | 47 | 0.1% |
| Czechoslovakian | 12 | 0.0% |
| Danish | 23 | 0.0% |
| Dominican | 9 | 0.0% |
| Dutch | 170 | 0.3% |
| Ecuadorian | 10 | 0.0% |
| English | 8,155 | 15.9% |
| Ethiopian | 32 | 0.1% |
| European | 1,169 | 2.3% |
| Fijian | 16 | 0.0% |
| Filipino | 143 | 0.3% |
| French | 854 | 1.7% |
| French Canadian | 47 | 0.1% |
| German | 3,796 | 7.4% |
| Greek | 131 | 0.3% |
| Guatemalan | 27 | 0.1% |
| Honduran | 61 | 0.1% |
| Hungarian | 90 | 0.2% |
| Icelander | 12 | 0.0% |
| Indian (Asian) | 460 | 0.9% |
| Iranian | 10 | 0.0% |
| Irish | 3,736 | 7.3% |
| Italian | 1,514 | 2.9% |
| Jamaican | 9 | 0.0% |
| Korean | 120 | 0.2% |
| Laotian | 52 | 0.1% |
| Latvian | 10 | 0.0% |
| Lebanese | 184 | 0.4% |
| Mexican | 357 | 0.7% |
| Mexican American Indian | 5 | 0.0% |
| Mongolian | 43 | 0.1% |
| Moroccan | 23 | 0.0% |
| Native Hawaiian | 33 | 0.1% |
| Nigerian | 89 | 0.2% |
| Northern European | 43 | 0.1% |
| Norwegian | 329 | 0.6% |
| Pakistani | 141 | 0.3% |
| Panamanian | 37 | 0.1% |
| Pennsylvania German | 15 | 0.0% |
| Peruvian | 30 | 0.1% |
| Polish | 258 | 0.5% |
| Portuguese | 12 | 0.0% |
| Puerto Rican | 42 | 0.1% |
| Russian | 152 | 0.3% |
| Samoan | 31 | 0.1% |
| Scandinavian | 146 | 0.3% |
| Scotch-Irish | 946 | 1.8% |
| Scottish | 1,286 | 2.5% |
| Slovak | 23 | 0.0% |
| South American | 157 | 0.3% |
| Spaniard | 37 | 0.1% |
| Spanish | 20 | 0.0% |
| Sri Lankan | 222 | 0.4% |
| Subsaharan African | 646 | 1.3% |
| Swedish | 249 | 0.5% |
| Swiss | 7 | 0.0% |
| Thai | 364 | 0.7% |
| Turkish | 17 | 0.0% |
| Ukrainian | 63 | 0.1% |
| Venezuelan | 51 | 0.1% |
| Vietnamese | 71 | 0.1% |
| Welsh | 133 | 0.3% | View All 82 Rows |
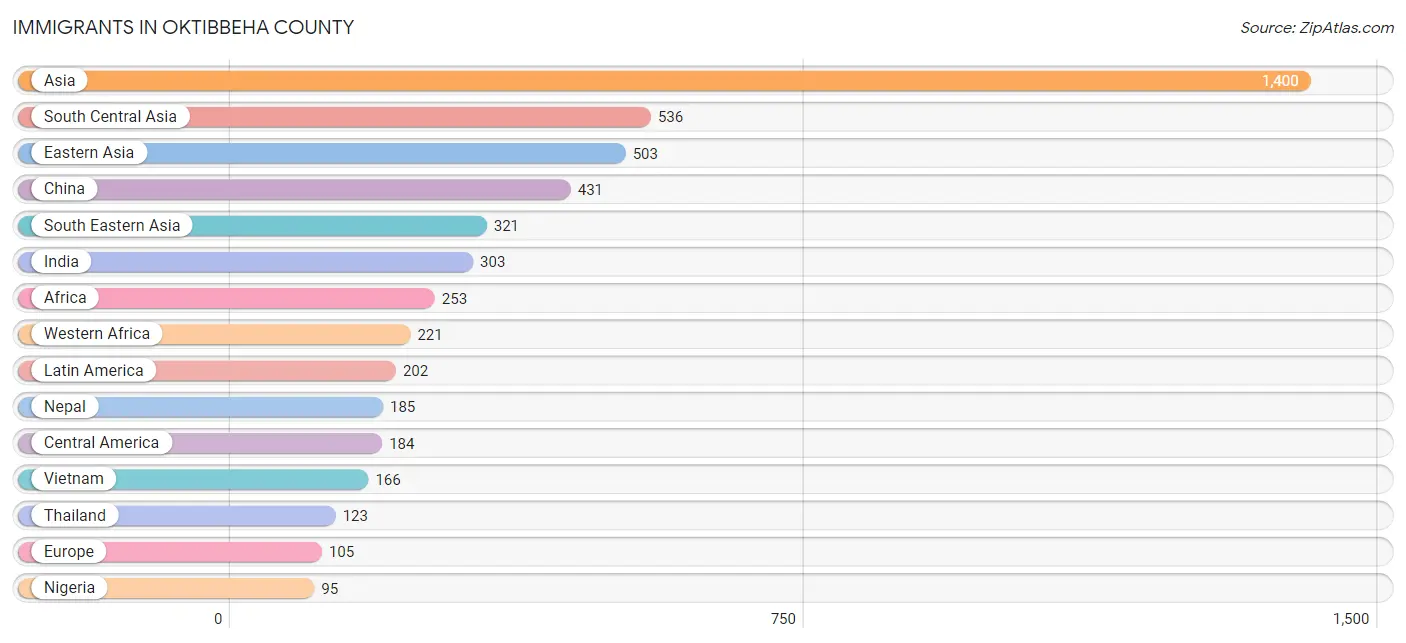
Immigrants in Oktibbeha County
The most numerous immigrant groups reported in Oktibbeha County came from Asia (1,400 | 2.7%), South Central Asia (536 | 1.0%), Eastern Asia (503 | 1.0%), China (431 | 0.8%), and South Eastern Asia (321 | 0.6%), together accounting for 6.2% of all Oktibbeha County residents.
| Immigration Origin | # Population | % Population |
| Africa | 253 | 0.5% |
| Asia | 1,400 | 2.7% |
| Bangladesh | 29 | 0.1% |
| Brazil | 4 | 0.0% |
| Canada | 35 | 0.1% |
| Caribbean | 9 | 0.0% |
| Central America | 184 | 0.4% |
| China | 431 | 0.8% |
| Czechoslovakia | 30 | 0.1% |
| Eastern Africa | 32 | 0.1% |
| Eastern Asia | 503 | 1.0% |
| Eastern Europe | 83 | 0.2% |
| Ethiopia | 32 | 0.1% |
| Europe | 105 | 0.2% |
| Germany | 22 | 0.0% |
| Ghana | 49 | 0.1% |
| Guatemala | 33 | 0.1% |
| Guyana | 5 | 0.0% |
| Honduras | 46 | 0.1% |
| India | 303 | 0.6% |
| Iran | 10 | 0.0% |
| Jamaica | 9 | 0.0% |
| Japan | 11 | 0.0% |
| Kazakhstan | 9 | 0.0% |
| Korea | 61 | 0.1% |
| Latin America | 202 | 0.4% |
| Liberia | 77 | 0.2% |
| Mexico | 74 | 0.1% |
| Nepal | 185 | 0.4% |
| Nicaragua | 7 | 0.0% |
| Nigeria | 95 | 0.2% |
| Oceania | 49 | 0.1% |
| Panama | 24 | 0.1% |
| Philippines | 32 | 0.1% |
| Poland | 15 | 0.0% |
| Russia | 19 | 0.0% |
| Saudi Arabia | 23 | 0.0% |
| South America | 9 | 0.0% |
| South Central Asia | 536 | 1.0% |
| South Eastern Asia | 321 | 0.6% |
| Taiwan | 47 | 0.1% |
| Thailand | 123 | 0.2% |
| Turkey | 17 | 0.0% |
| Ukraine | 19 | 0.0% |
| Vietnam | 166 | 0.3% |
| Western Africa | 221 | 0.4% |
| Western Asia | 40 | 0.1% |
| Western Europe | 22 | 0.0% | View All 48 Rows |
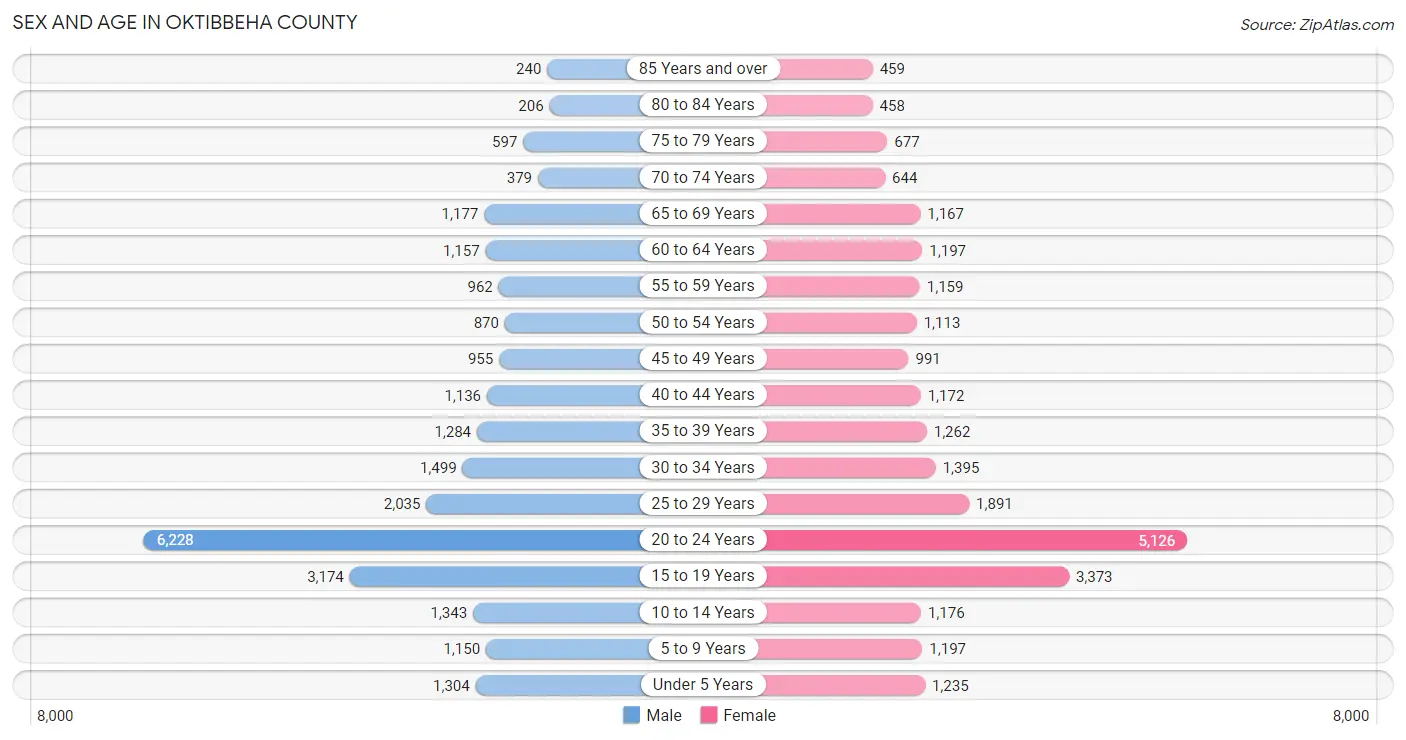
Sex and Age in Oktibbeha County
Sex and Age in Oktibbeha County
The most populous age groups in Oktibbeha County are 20 to 24 Years (6,228 | 24.2%) for men and 20 to 24 Years (5,126 | 20.0%) for women.
| Age Bracket | Male | Female |
| Under 5 Years | 1,304 (5.1%) | 1,235 (4.8%) |
| 5 to 9 Years | 1,150 (4.5%) | 1,197 (4.7%) |
| 10 to 14 Years | 1,343 (5.2%) | 1,176 (4.6%) |
| 15 to 19 Years | 3,174 (12.3%) | 3,373 (13.1%) |
| 20 to 24 Years | 6,228 (24.2%) | 5,126 (20.0%) |
| 25 to 29 Years | 2,035 (7.9%) | 1,891 (7.4%) |
| 30 to 34 Years | 1,499 (5.8%) | 1,395 (5.4%) |
| 35 to 39 Years | 1,284 (5.0%) | 1,262 (4.9%) |
| 40 to 44 Years | 1,136 (4.4%) | 1,172 (4.6%) |
| 45 to 49 Years | 955 (3.7%) | 991 (3.9%) |
| 50 to 54 Years | 870 (3.4%) | 1,113 (4.3%) |
| 55 to 59 Years | 962 (3.7%) | 1,159 (4.5%) |
| 60 to 64 Years | 1,157 (4.5%) | 1,197 (4.7%) |
| 65 to 69 Years | 1,177 (4.6%) | 1,167 (4.5%) |
| 70 to 74 Years | 379 (1.5%) | 644 (2.5%) |
| 75 to 79 Years | 597 (2.3%) | 677 (2.6%) |
| 80 to 84 Years | 206 (0.8%) | 458 (1.8%) |
| 85 Years and over | 240 (0.9%) | 459 (1.8%) |
| Total | 25,696 (100.0%) | 25,692 (100.0%) |
Families and Households in Oktibbeha County
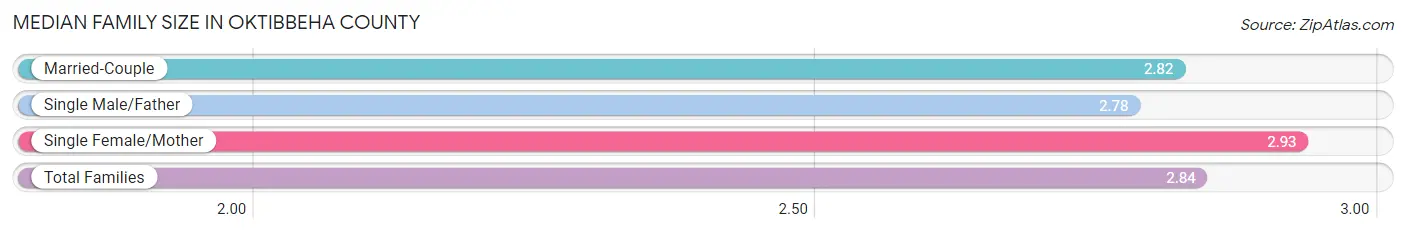
Median Family Size in Oktibbeha County
The median family size in Oktibbeha County is 2.84 persons per family, with single female/mother families (2,611 | 24.8%) accounting for the largest median family size of 2.93 persons per family. On the other hand, single male/father families (465 | 4.4%) represent the smallest median family size with 2.78 persons per family.
| Family Type | # Families | Family Size |
| Married-Couple | 7,443 (70.8%) | 2.82 |
| Single Male/Father | 465 (4.4%) | 2.78 |
| Single Female/Mother | 2,611 (24.8%) | 2.93 |
| Total Families | 10,519 (100.0%) | 2.84 |
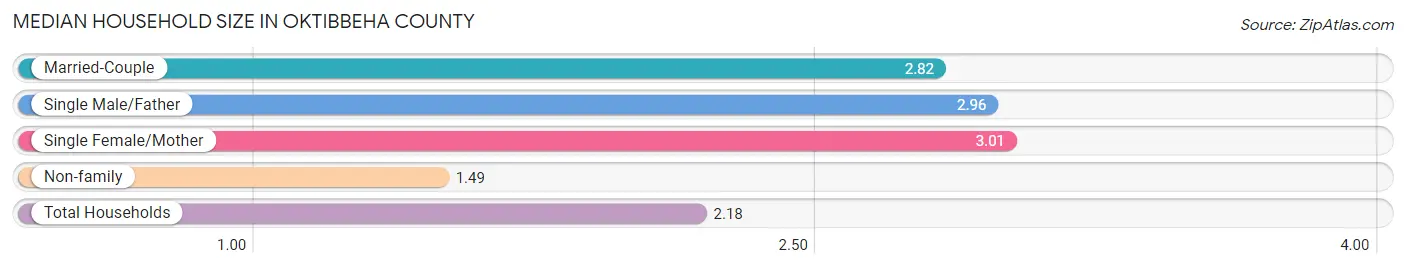
Median Household Size in Oktibbeha County
The median household size in Oktibbeha County is 2.18 persons per household, with single female/mother households (2,611 | 12.3%) accounting for the largest median household size of 3.01 persons per household. non-family households (10,646 | 50.3%) represent the smallest median household size with 1.49 persons per household.
| Household Type | # Households | Household Size |
| Married-Couple | 7,443 (35.2%) | 2.82 |
| Single Male/Father | 465 (2.2%) | 2.96 |
| Single Female/Mother | 2,611 (12.3%) | 3.01 |
| Non-family | 10,646 (50.3%) | 1.49 |
| Total Households | 21,165 (100.0%) | 2.18 |
Household Size by Marriage Status in Oktibbeha County
Out of a total of 21,165 households in Oktibbeha County, 10,519 (49.7%) are family households, while 10,646 (50.3%) are nonfamily households. The most numerous type of family households are 2-person households, comprising 5,440, and the most common type of nonfamily households are 1-person households, comprising 6,238.
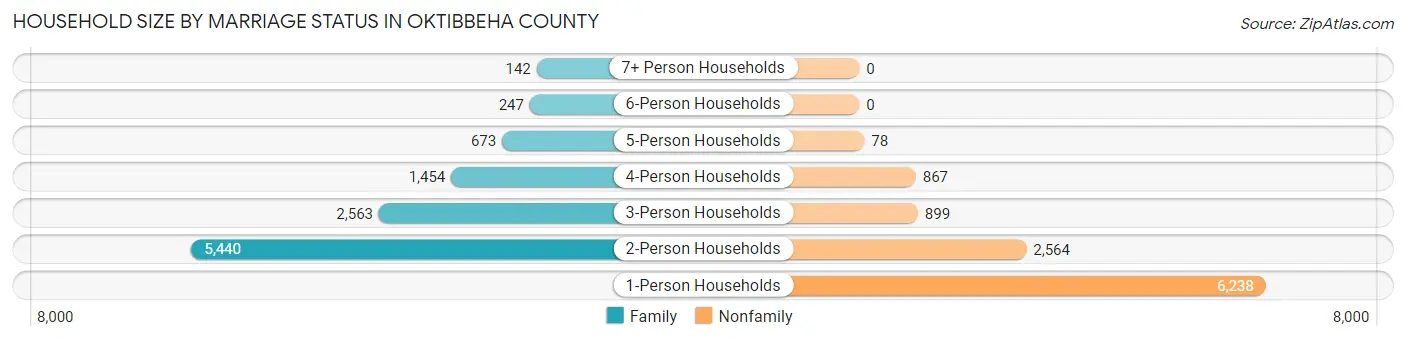
| Household Size | Family Households | Nonfamily Households |
| 1-Person Households | - | 6,238 (29.5%) |
| 2-Person Households | 5,440 (25.7%) | 2,564 (12.1%) |
| 3-Person Households | 2,563 (12.1%) | 899 (4.3%) |
| 4-Person Households | 1,454 (6.9%) | 867 (4.1%) |
| 5-Person Households | 673 (3.2%) | 78 (0.4%) |
| 6-Person Households | 247 (1.2%) | 0 (0.0%) |
| 7+ Person Households | 142 (0.7%) | 0 (0.0%) |
| Total | 10,519 (49.7%) | 10,646 (50.3%) |
Female Fertility in Oktibbeha County
Fertility by Age in Oktibbeha County
Average fertility rate in Oktibbeha County is 35.0 births per 1,000 women. Women in the age bracket of 20 to 34 years have the highest fertility rate with 45.0 births per 1,000 women. Women in the age bracket of 20 to 34 years acount for 69.7% of all women with births.
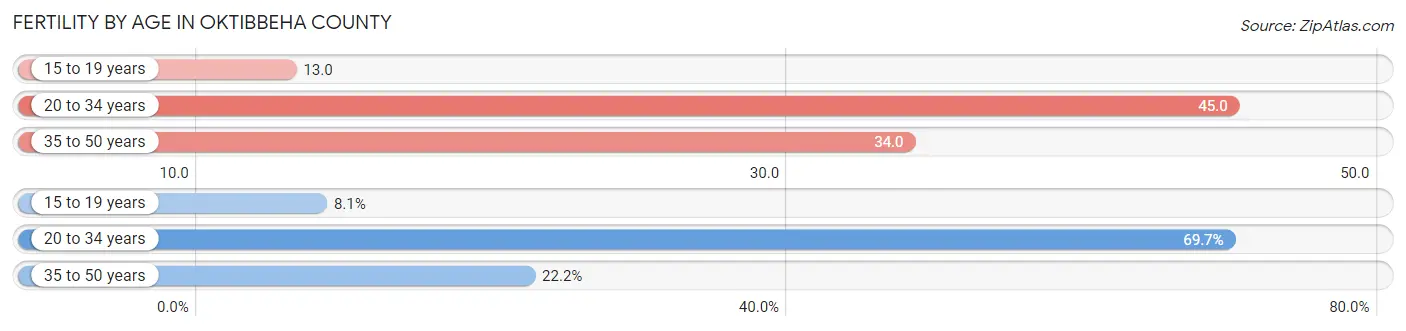
| Age Bracket | Women with Births | Births / 1,000 Women |
| 15 to 19 years | 44 (8.1%) | 13.0 |
| 20 to 34 years | 380 (69.7%) | 45.0 |
| 35 to 50 years | 121 (22.2%) | 34.0 |
| Total | 545 (100.0%) | 35.0 |
Fertility by Age by Marriage Status in Oktibbeha County
38.0% of women with births (545) in Oktibbeha County are married. The highest percentage of unmarried women with births falls into 15 to 19 years age bracket with 100.0% of them unmarried at the time of birth, while the lowest percentage of unmarried women with births belong to 35 to 50 years age bracket with 5.8% of them unmarried.
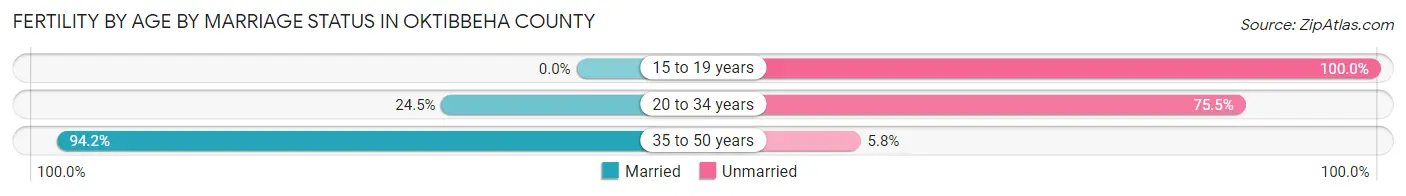
| Age Bracket | Married | Unmarried |
| 15 to 19 years | 0 (0.0%) | 44 (100.0%) |
| 20 to 34 years | 93 (24.5%) | 287 (75.5%) |
| 35 to 50 years | 114 (94.2%) | 7 (5.8%) |
| Total | 207 (38.0%) | 338 (62.0%) |
Fertility by Education in Oktibbeha County
Average fertility rate in Oktibbeha County is 35.0 births per 1,000 women. Women with the education attainment of graduate degree have the highest fertility rate of 64.0 births per 1,000 women, while women with the education attainment of less than high school have the lowest fertility at 11.0 births per 1,000 women. Women with the education attainment of college or associate's degree represent 41.1% of all women with births.
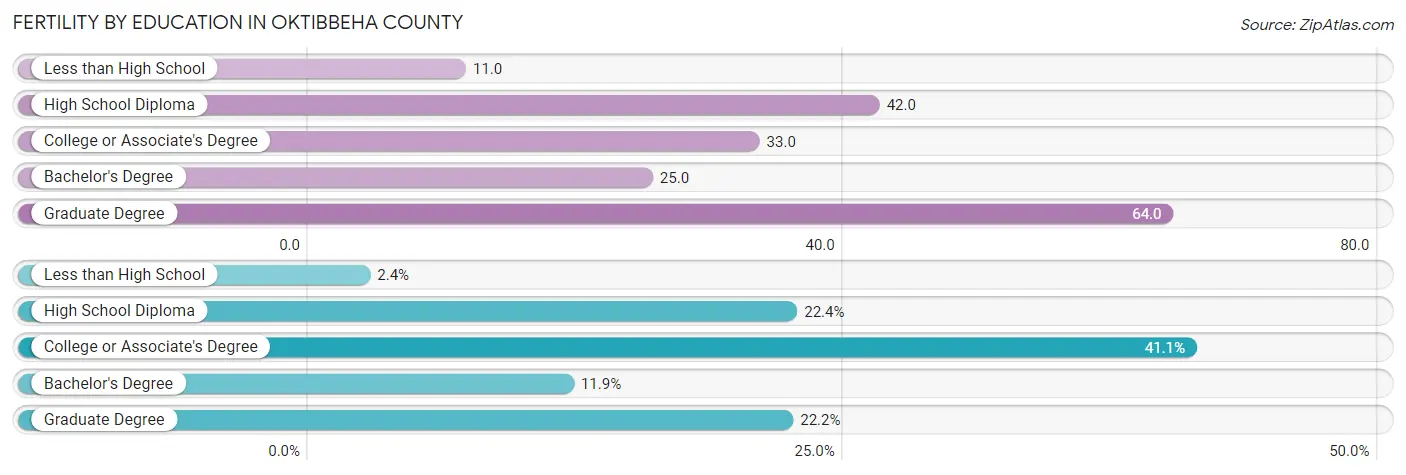
| Educational Attainment | Women with Births | Births / 1,000 Women |
| Less than High School | 13 (2.4%) | 11.0 |
| High School Diploma | 122 (22.4%) | 42.0 |
| College or Associate's Degree | 224 (41.1%) | 33.0 |
| Bachelor's Degree | 65 (11.9%) | 25.0 |
| Graduate Degree | 121 (22.2%) | 64.0 |
| Total | 545 (100.0%) | 35.0 |
Fertility by Education by Marriage Status in Oktibbeha County
62.0% of women with births in Oktibbeha County are unmarried. Women with the educational attainment of bachelor's degree are most likely to be married with 100.0% of them married at childbirth, while women with the educational attainment of less than high school are least likely to be married with 100.0% of them unmarried at childbirth.
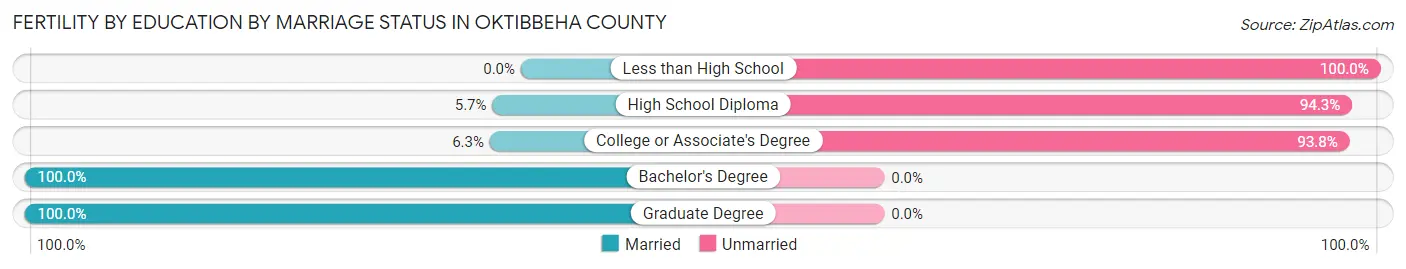
| Educational Attainment | Married | Unmarried |
| Less than High School | 0 (0.0%) | 13 (100.0%) |
| High School Diploma | 7 (5.7%) | 115 (94.3%) |
| College or Associate's Degree | 14 (6.2%) | 210 (93.8%) |
| Bachelor's Degree | 65 (100.0%) | 0 (0.0%) |
| Graduate Degree | 121 (100.0%) | 0 (0.0%) |
| Total | 207 (38.0%) | 338 (62.0%) |
Employment Characteristics in Oktibbeha County
Employment by Class of Employer in Oktibbeha County
Among the 21,814 employed individuals in Oktibbeha County, private company employees (11,971 | 54.9%), state government employees (5,203 | 23.8%), and local government employees (1,354 | 6.2%) make up the most common classes of employment.
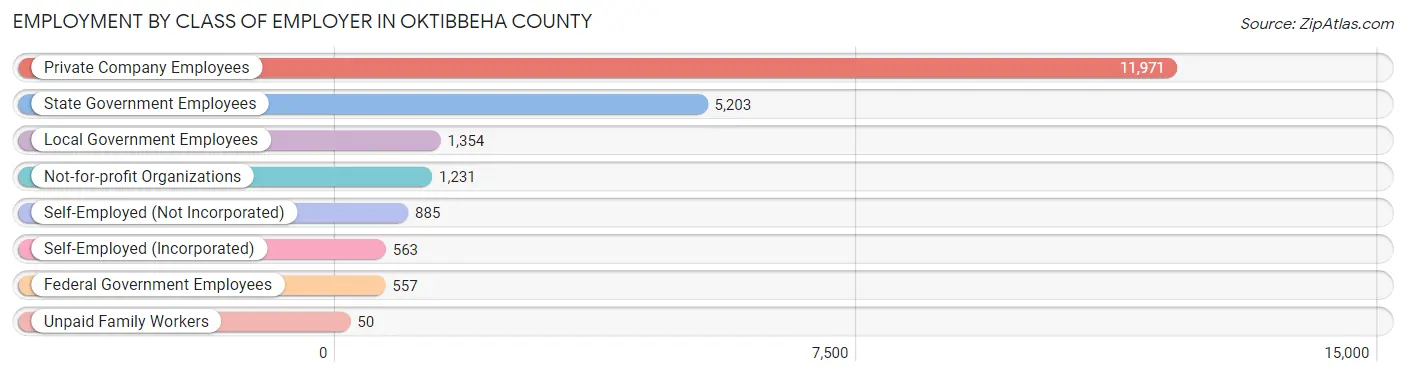
| Employer Class | # Employees | % Employees |
| Private Company Employees | 11,971 | 54.9% |
| Self-Employed (Incorporated) | 563 | 2.6% |
| Self-Employed (Not Incorporated) | 885 | 4.1% |
| Not-for-profit Organizations | 1,231 | 5.6% |
| Local Government Employees | 1,354 | 6.2% |
| State Government Employees | 5,203 | 23.8% |
| Federal Government Employees | 557 | 2.5% |
| Unpaid Family Workers | 50 | 0.2% |
| Total | 21,814 | 100.0% |
Employment Status by Age in Oktibbeha County
According to the labor force statistics for Oktibbeha County, out of the total population over 16 years of age (43,626), 56.3% or 24,561 individuals are in the labor force, with 6.8% or 1,670 of them unemployed. The age group with the highest labor force participation rate is 30 to 34 years, with 90.8% or 2,628 individuals in the labor force. Within the labor force, the 16 to 19 years age range has the highest percentage of unemployed individuals, with 17.1% or 268 of them being unemployed.
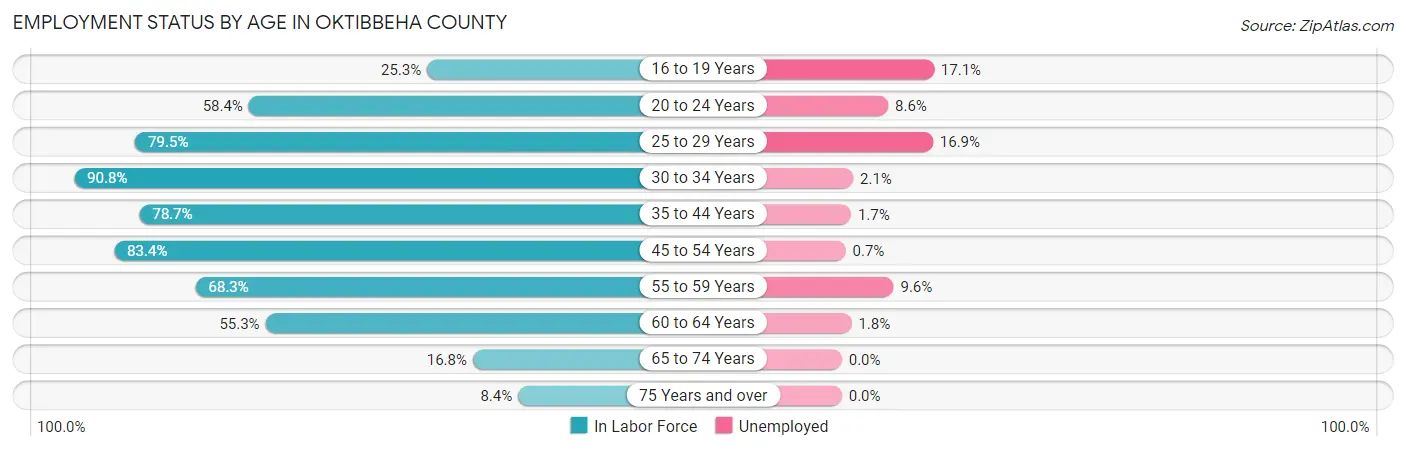
| Age Bracket | In Labor Force | Unemployed |
| 16 to 19 Years | 1,566 (25.3%) | 268 (17.1%) |
| 20 to 24 Years | 6,631 (58.4%) | 570 (8.6%) |
| 25 to 29 Years | 3,121 (79.5%) | 527 (16.9%) |
| 30 to 34 Years | 2,628 (90.8%) | 55 (2.1%) |
| 35 to 44 Years | 3,820 (78.7%) | 65 (1.7%) |
| 45 to 54 Years | 3,277 (83.4%) | 23 (0.7%) |
| 55 to 59 Years | 1,449 (68.3%) | 139 (9.6%) |
| 60 to 64 Years | 1,302 (55.3%) | 23 (1.8%) |
| 65 to 74 Years | 566 (16.8%) | 0 (0.0%) |
| 75 Years and over | 222 (8.4%) | 0 (0.0%) |
| Total | 24,561 (56.3%) | 1,670 (6.8%) |
Employment Status by Educational Attainment in Oktibbeha County
According to labor force statistics for Oktibbeha County, 77.7% of individuals (15,601) out of the total population between 25 and 64 years of age (20,078) are in the labor force, with 5.3% or 827 of them being unemployed. The group with the highest labor force participation rate are those with the educational attainment of bachelor's degree or higher, with 87.7% or 8,214 individuals in the labor force. Within the labor force, individuals with less than high school education have the highest percentage of unemployment, with 8.8% or 54 of them being unemployed.
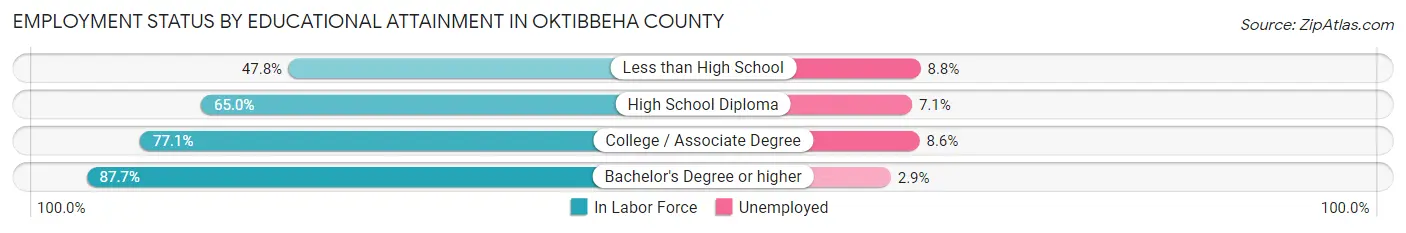
| Educational Attainment | In Labor Force | Unemployed |
| Less than High School | 614 (47.8%) | 113 (8.8%) |
| High School Diploma | 2,668 (65.0%) | 291 (7.1%) |
| College / Associate Degree | 4,104 (77.1%) | 458 (8.6%) |
| Bachelor's Degree or higher | 8,214 (87.7%) | 272 (2.9%) |
| Total | 15,601 (77.7%) | 1,064 (5.3%) |
Employment Occupations by Sex in Oktibbeha County
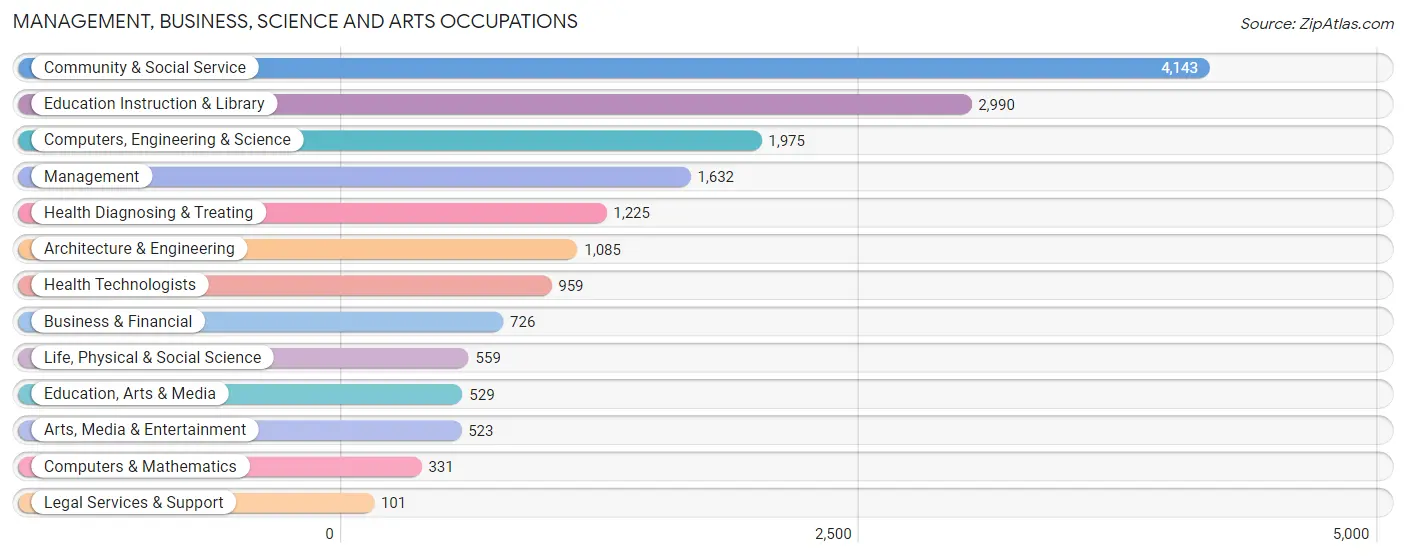
Management, Business, Science and Arts Occupations
The most common Management, Business, Science and Arts occupations in Oktibbeha County are Community & Social Service (4,143 | 18.1%), Education Instruction & Library (2,990 | 13.1%), Computers, Engineering & Science (1,975 | 8.6%), Management (1,632 | 7.1%), and Health Diagnosing & Treating (1,225 | 5.3%).
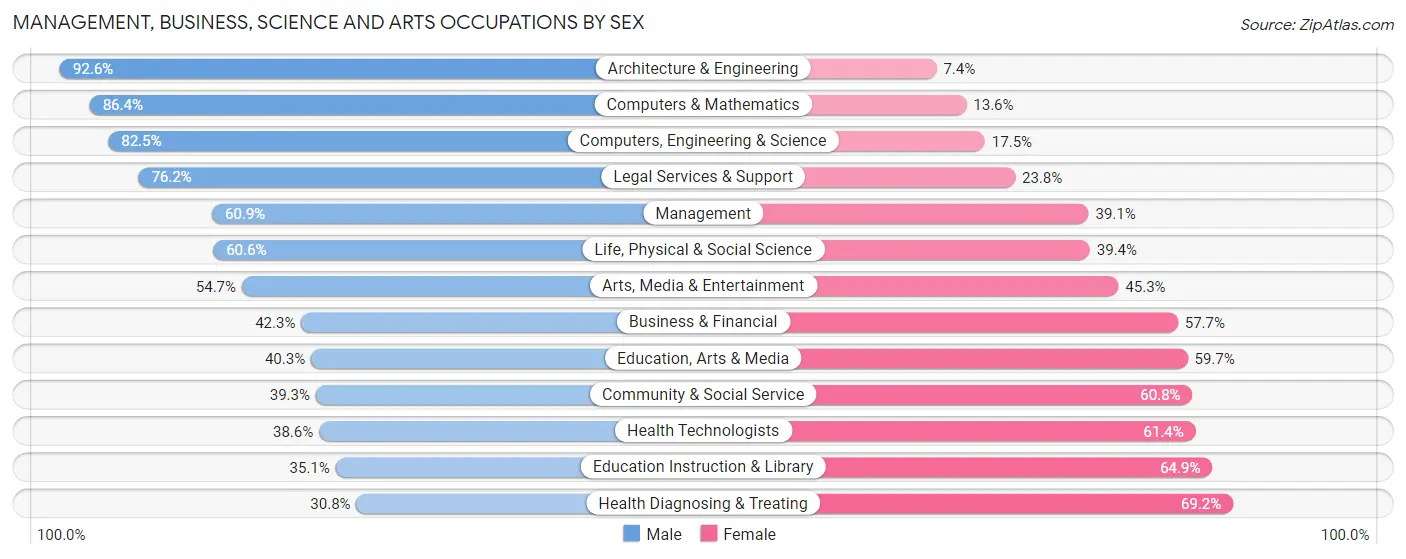
Management, Business, Science and Arts Occupations by Sex
Within the Management, Business, Science and Arts occupations in Oktibbeha County, the most male-oriented occupations are Architecture & Engineering (92.6%), Computers & Mathematics (86.4%), and Computers, Engineering & Science (82.5%), while the most female-oriented occupations are Health Diagnosing & Treating (69.2%), Education Instruction & Library (64.9%), and Health Technologists (61.4%).
| Occupation | Male | Female |
| Management | 994 (60.9%) | 638 (39.1%) |
| Business & Financial | 307 (42.3%) | 419 (57.7%) |
| Computers, Engineering & Science | 1,630 (82.5%) | 345 (17.5%) |
| Computers & Mathematics | 286 (86.4%) | 45 (13.6%) |
| Architecture & Engineering | 1,005 (92.6%) | 80 (7.4%) |
| Life, Physical & Social Science | 339 (60.6%) | 220 (39.4%) |
| Community & Social Service | 1,626 (39.3%) | 2,517 (60.8%) |
| Education, Arts & Media | 213 (40.3%) | 316 (59.7%) |
| Legal Services & Support | 77 (76.2%) | 24 (23.8%) |
| Education Instruction & Library | 1,050 (35.1%) | 1,940 (64.9%) |
| Arts, Media & Entertainment | 286 (54.7%) | 237 (45.3%) |
| Health Diagnosing & Treating | 377 (30.8%) | 848 (69.2%) |
| Health Technologists | 370 (38.6%) | 589 (61.4%) |
| Total (Category) | 4,934 (50.9%) | 4,767 (49.1%) |
| Total (Overall) | 12,611 (55.1%) | 10,293 (44.9%) |
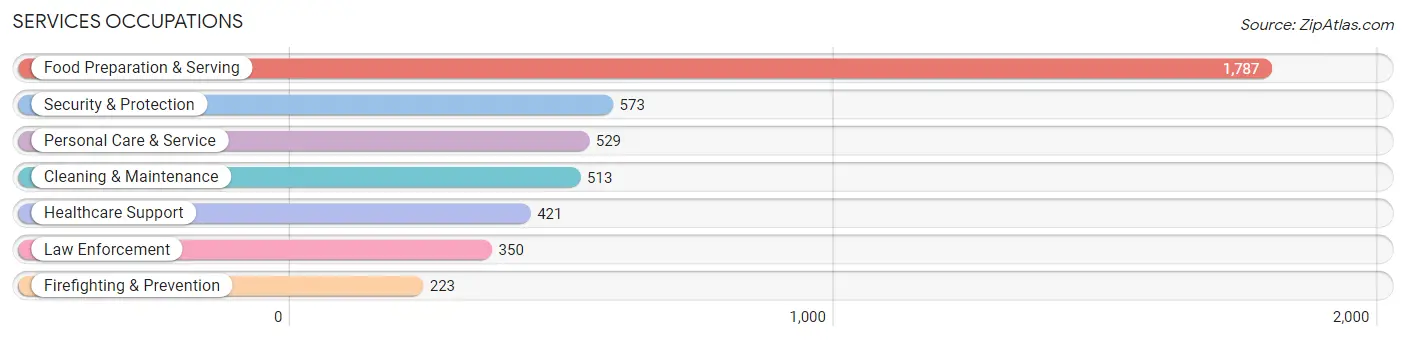
Services Occupations
The most common Services occupations in Oktibbeha County are Food Preparation & Serving (1,787 | 7.8%), Security & Protection (573 | 2.5%), Personal Care & Service (529 | 2.3%), Cleaning & Maintenance (513 | 2.2%), and Healthcare Support (421 | 1.8%).
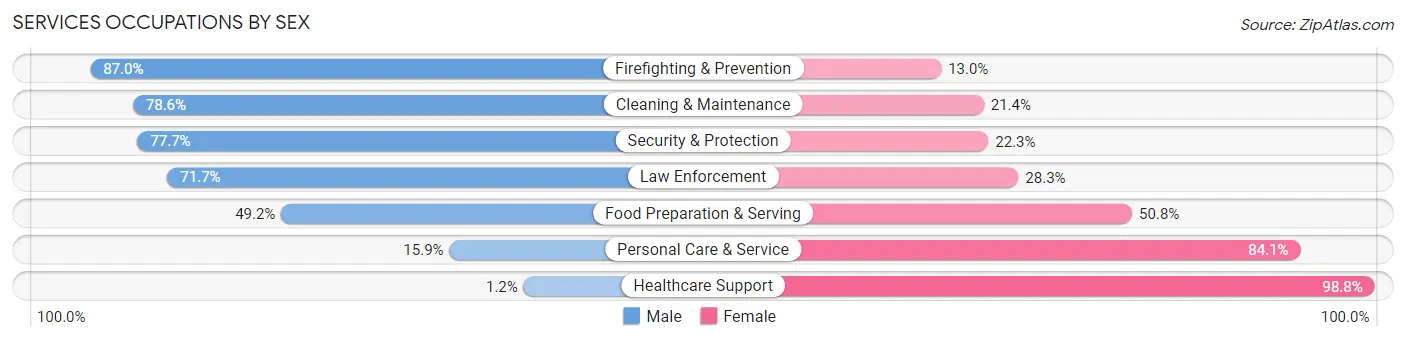
Services Occupations by Sex
Within the Services occupations in Oktibbeha County, the most male-oriented occupations are Firefighting & Prevention (87.0%), Cleaning & Maintenance (78.6%), and Security & Protection (77.7%), while the most female-oriented occupations are Healthcare Support (98.8%), Personal Care & Service (84.1%), and Food Preparation & Serving (50.8%).
| Occupation | Male | Female |
| Healthcare Support | 5 (1.2%) | 416 (98.8%) |
| Security & Protection | 445 (77.7%) | 128 (22.3%) |
| Firefighting & Prevention | 194 (87.0%) | 29 (13.0%) |
| Law Enforcement | 251 (71.7%) | 99 (28.3%) |
| Food Preparation & Serving | 879 (49.2%) | 908 (50.8%) |
| Cleaning & Maintenance | 403 (78.6%) | 110 (21.4%) |
| Personal Care & Service | 84 (15.9%) | 445 (84.1%) |
| Total (Category) | 1,816 (47.5%) | 2,007 (52.5%) |
| Total (Overall) | 12,611 (55.1%) | 10,293 (44.9%) |
Sales and Office Occupations
The most common Sales and Office occupations in Oktibbeha County are Sales & Related (2,538 | 11.1%), and Office & Administration (2,083 | 9.1%).
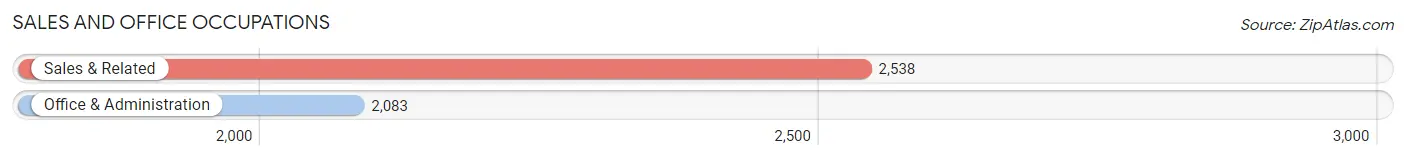
Sales and Office Occupations by Sex
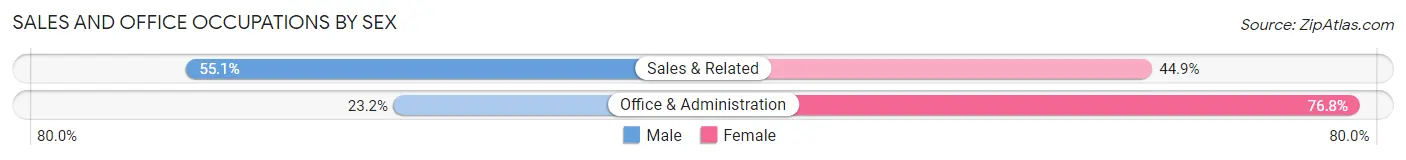
| Occupation | Male | Female |
| Sales & Related | 1,399 (55.1%) | 1,139 (44.9%) |
| Office & Administration | 483 (23.2%) | 1,600 (76.8%) |
| Total (Category) | 1,882 (40.7%) | 2,739 (59.3%) |
| Total (Overall) | 12,611 (55.1%) | 10,293 (44.9%) |
Natural Resources, Construction and Maintenance Occupations
The most common Natural Resources, Construction and Maintenance occupations in Oktibbeha County are Installation, Maintenance & Repair (744 | 3.3%), Construction & Extraction (696 | 3.0%), and Farming, Fishing & Forestry (98 | 0.4%).
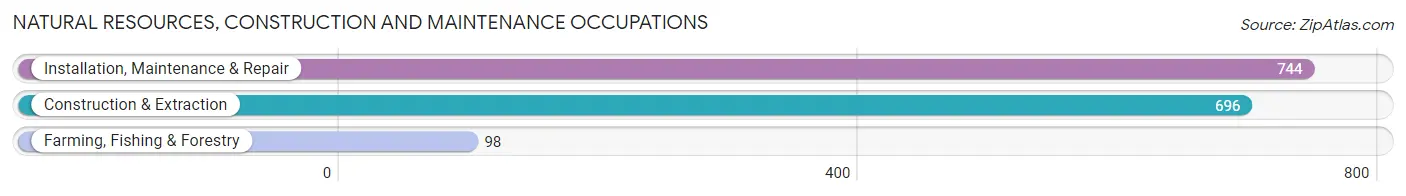
Natural Resources, Construction and Maintenance Occupations by Sex
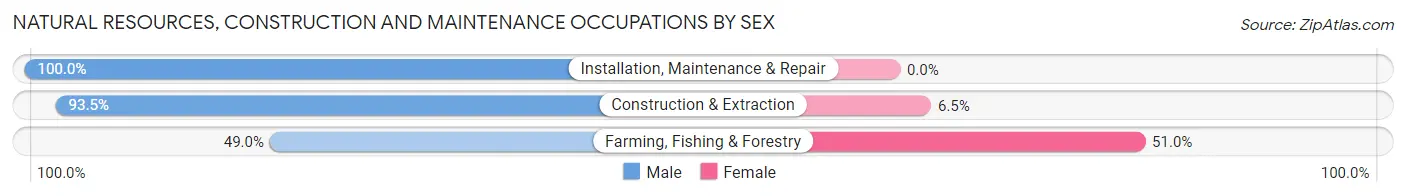
| Occupation | Male | Female |
| Farming, Fishing & Forestry | 48 (49.0%) | 50 (51.0%) |
| Construction & Extraction | 651 (93.5%) | 45 (6.5%) |
| Installation, Maintenance & Repair | 744 (100.0%) | 0 (0.0%) |
| Total (Category) | 1,443 (93.8%) | 95 (6.2%) |
| Total (Overall) | 12,611 (55.1%) | 10,293 (44.9%) |
Production, Transportation and Moving Occupations
The most common Production, Transportation and Moving occupations in Oktibbeha County are Production (1,794 | 7.8%), Transportation (760 | 3.3%), and Material Moving (667 | 2.9%).

Production, Transportation and Moving Occupations by Sex
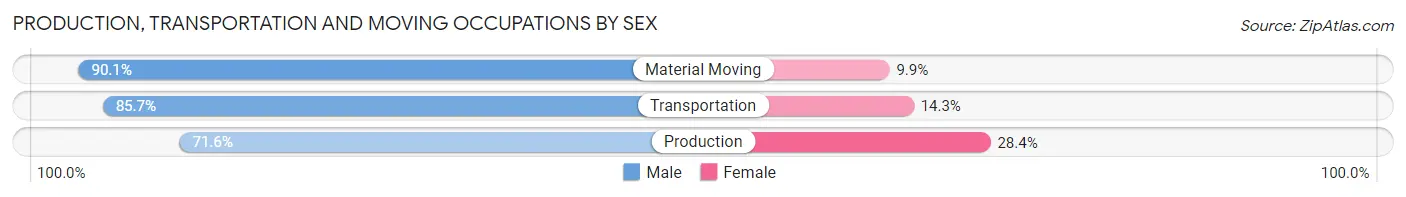
| Occupation | Male | Female |
| Production | 1,284 (71.6%) | 510 (28.4%) |
| Transportation | 651 (85.7%) | 109 (14.3%) |
| Material Moving | 601 (90.1%) | 66 (9.9%) |
| Total (Category) | 2,536 (78.7%) | 685 (21.3%) |
| Total (Overall) | 12,611 (55.1%) | 10,293 (44.9%) |
Employment Industries by Sex in Oktibbeha County
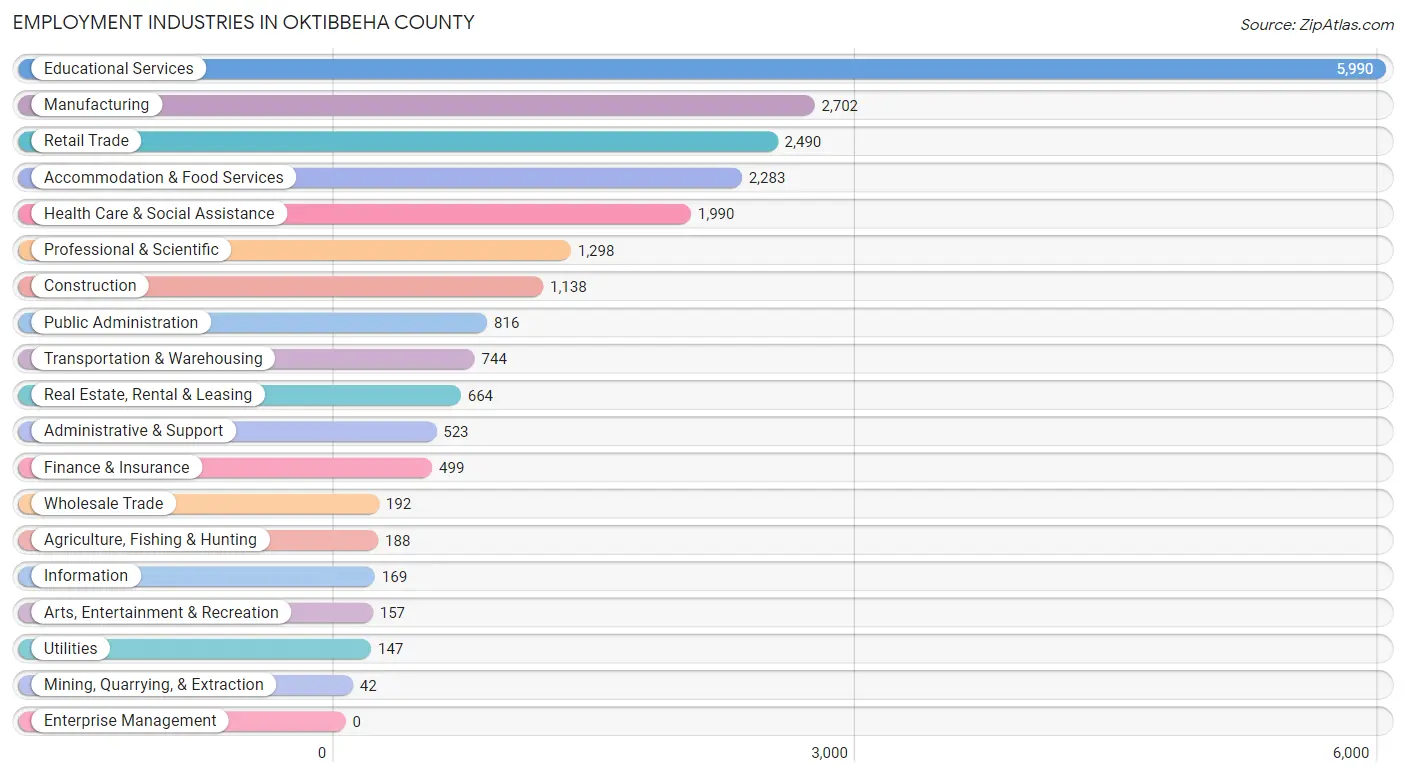
Employment Industries in Oktibbeha County
The major employment industries in Oktibbeha County include Educational Services (5,990 | 26.2%), Manufacturing (2,702 | 11.8%), Retail Trade (2,490 | 10.9%), Accommodation & Food Services (2,283 | 10.0%), and Health Care & Social Assistance (1,990 | 8.7%).
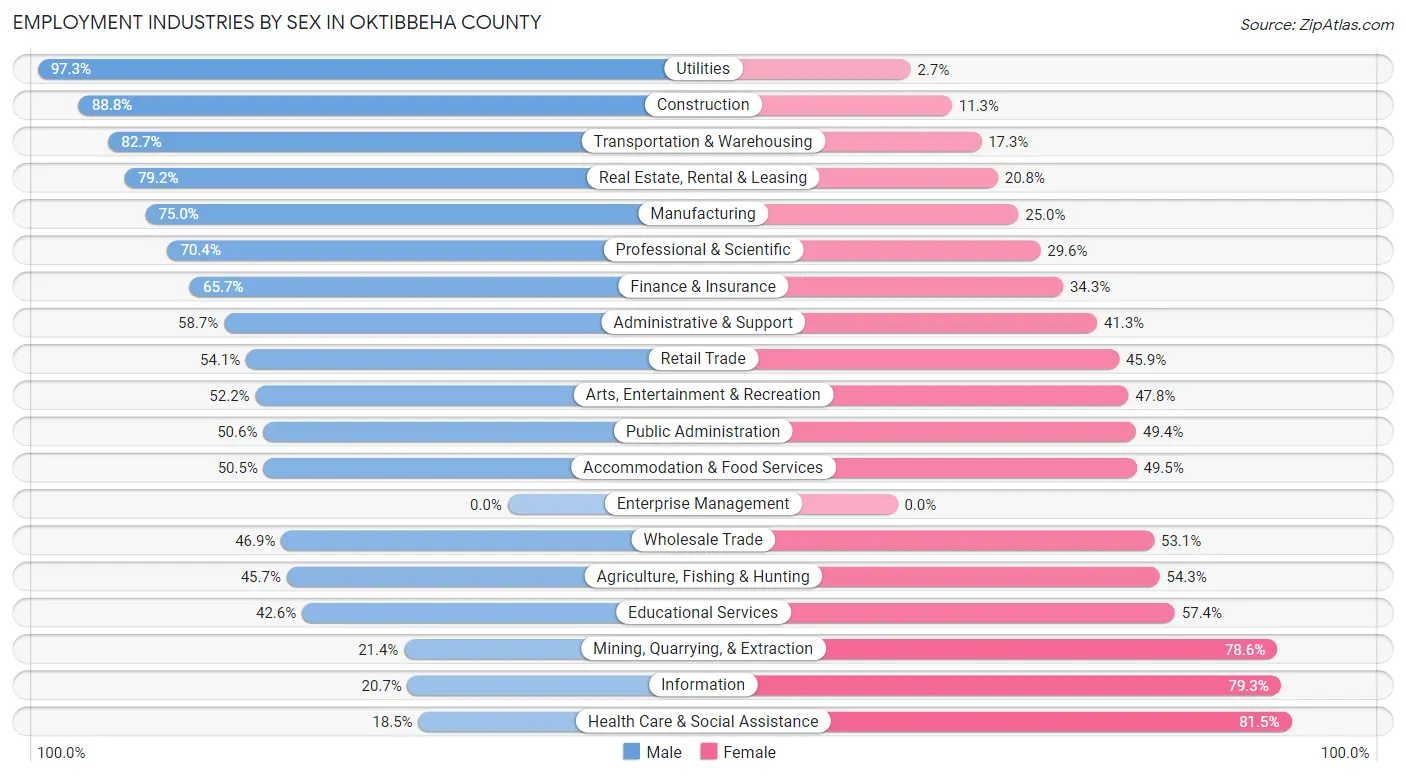
Employment Industries by Sex in Oktibbeha County
The Oktibbeha County industries that see more men than women are Utilities (97.3%), Construction (88.7%), and Transportation & Warehousing (82.7%), whereas the industries that tend to have a higher number of women are Health Care & Social Assistance (81.5%), Information (79.3%), and Mining, Quarrying, & Extraction (78.6%).
| Industry | Male | Female |
| Agriculture, Fishing & Hunting | 86 (45.7%) | 102 (54.3%) |
| Mining, Quarrying, & Extraction | 9 (21.4%) | 33 (78.6%) |
| Construction | 1,010 (88.7%) | 128 (11.3%) |
| Manufacturing | 2,026 (75.0%) | 676 (25.0%) |
| Wholesale Trade | 90 (46.9%) | 102 (53.1%) |
| Retail Trade | 1,348 (54.1%) | 1,142 (45.9%) |
| Transportation & Warehousing | 615 (82.7%) | 129 (17.3%) |
| Utilities | 143 (97.3%) | 4 (2.7%) |
| Information | 35 (20.7%) | 134 (79.3%) |
| Finance & Insurance | 328 (65.7%) | 171 (34.3%) |
| Real Estate, Rental & Leasing | 526 (79.2%) | 138 (20.8%) |
| Professional & Scientific | 914 (70.4%) | 384 (29.6%) |
| Enterprise Management | 0 (0.0%) | 0 (0.0%) |
| Administrative & Support | 307 (58.7%) | 216 (41.3%) |
| Educational Services | 2,550 (42.6%) | 3,440 (57.4%) |
| Health Care & Social Assistance | 368 (18.5%) | 1,622 (81.5%) |
| Arts, Entertainment & Recreation | 82 (52.2%) | 75 (47.8%) |
| Accommodation & Food Services | 1,153 (50.5%) | 1,130 (49.5%) |
| Public Administration | 413 (50.6%) | 403 (49.4%) |
| Total | 12,611 (55.1%) | 10,293 (44.9%) |
Education in Oktibbeha County
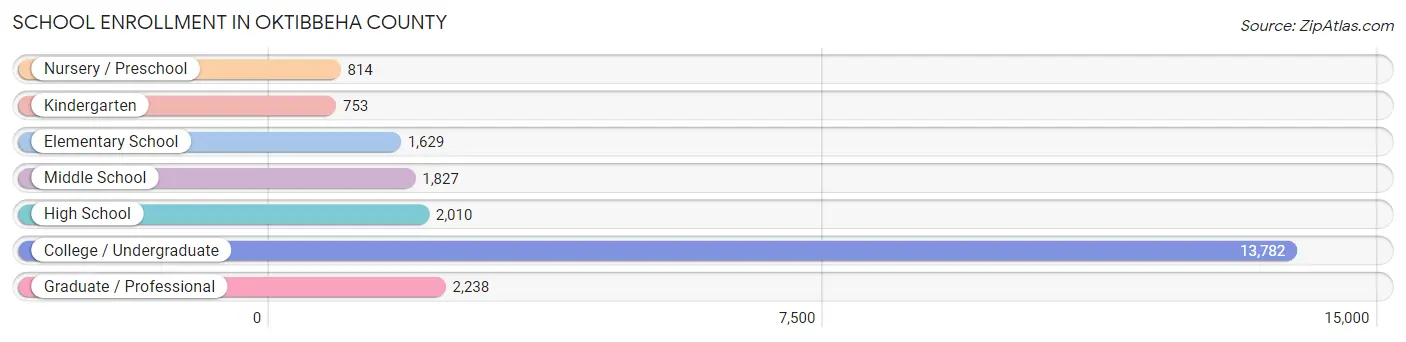
School Enrollment in Oktibbeha County
The most common levels of schooling among the 23,053 students in Oktibbeha County are college / undergraduate (13,782 | 59.8%), graduate / professional (2,238 | 9.7%), and high school (2,010 | 8.7%).
| School Level | # Students | % Students |
| Nursery / Preschool | 814 | 3.5% |
| Kindergarten | 753 | 3.3% |
| Elementary School | 1,629 | 7.1% |
| Middle School | 1,827 | 7.9% |
| High School | 2,010 | 8.7% |
| College / Undergraduate | 13,782 | 59.8% |
| Graduate / Professional | 2,238 | 9.7% |
| Total | 23,053 | 100.0% |
School Enrollment by Age by Funding Source in Oktibbeha County
Out of a total of 23,053 students who are enrolled in schools in Oktibbeha County, 1,936 (8.4%) attend a private institution, while the remaining 21,117 (91.6%) are enrolled in public schools. The age group of 3 to 4 year olds has the highest likelihood of being enrolled in private schools, with 289 (45.0% in the age bracket) enrolled. Conversely, the age group of 20 to 24 year olds has the lowest likelihood of being enrolled in a private school, with 8,857 (98.6% in the age bracket) attending a public institution.
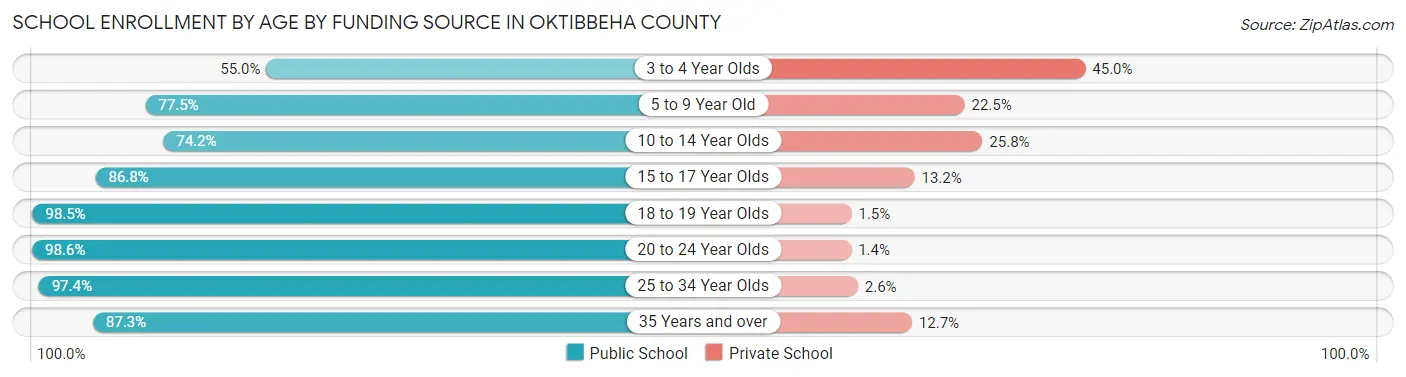
| Age Bracket | Public School | Private School |
| 3 to 4 Year Olds | 353 (55.0%) | 289 (45.0%) |
| 5 to 9 Year Old | 1,773 (77.5%) | 515 (22.5%) |
| 10 to 14 Year Olds | 1,828 (74.2%) | 637 (25.8%) |
| 15 to 17 Year Olds | 1,203 (86.8%) | 183 (13.2%) |
| 18 to 19 Year Olds | 4,784 (98.5%) | 71 (1.5%) |
| 20 to 24 Year Olds | 8,857 (98.6%) | 126 (1.4%) |
| 25 to 34 Year Olds | 1,773 (97.4%) | 48 (2.6%) |
| 35 Years and over | 535 (87.3%) | 78 (12.7%) |
| Total | 21,117 (91.6%) | 1,936 (8.4%) |
Educational Attainment by Field of Study in Oktibbeha County
Business (2,523 | 20.4%), education (1,985 | 16.1%), bio, nature & agricultural (1,603 | 13.0%), engineering (848 | 6.9%), and science & technology (842 | 6.8%) are the most common fields of study among 12,351 individuals in Oktibbeha County who have obtained a bachelor's degree or higher.
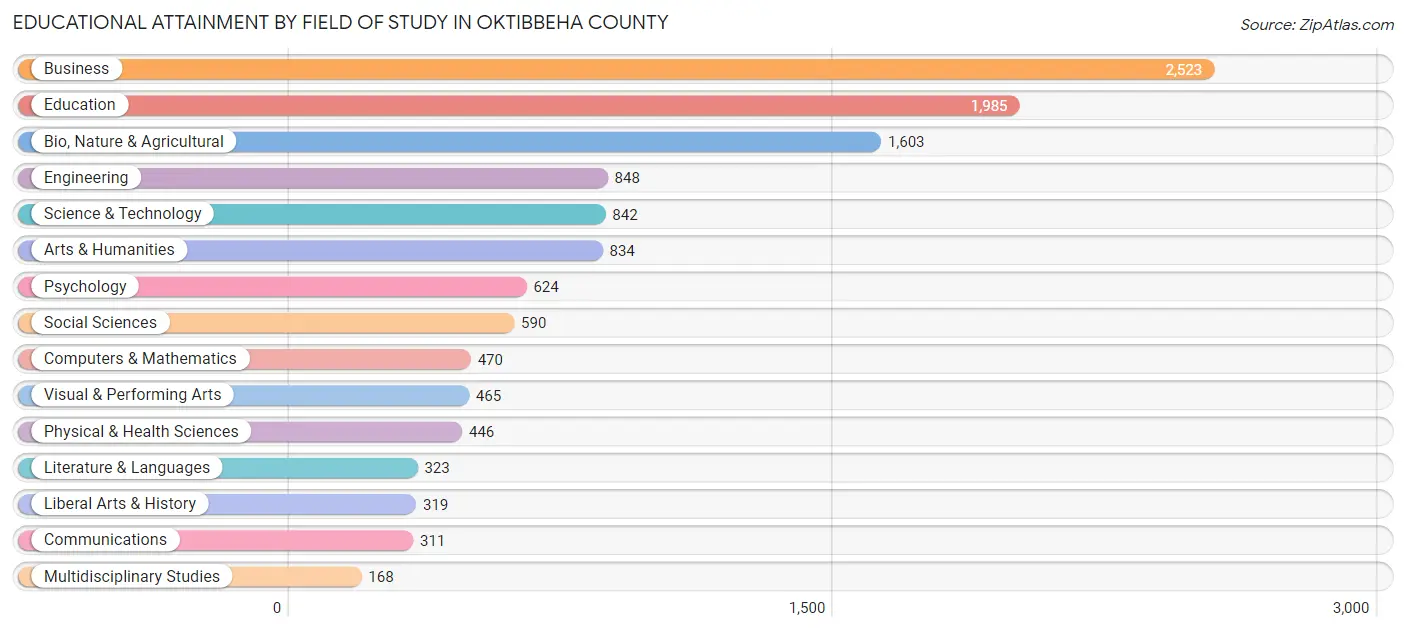
| Field of Study | # Graduates | % Graduates |
| Computers & Mathematics | 470 | 3.8% |
| Bio, Nature & Agricultural | 1,603 | 13.0% |
| Physical & Health Sciences | 446 | 3.6% |
| Psychology | 624 | 5.1% |
| Social Sciences | 590 | 4.8% |
| Engineering | 848 | 6.9% |
| Multidisciplinary Studies | 168 | 1.4% |
| Science & Technology | 842 | 6.8% |
| Business | 2,523 | 20.4% |
| Education | 1,985 | 16.1% |
| Literature & Languages | 323 | 2.6% |
| Liberal Arts & History | 319 | 2.6% |
| Visual & Performing Arts | 465 | 3.8% |
| Communications | 311 | 2.5% |
| Arts & Humanities | 834 | 6.8% |
| Total | 12,351 | 100.0% |
Transportation & Commute in Oktibbeha County
Vehicle Availability by Sex in Oktibbeha County
The most prevalent vehicle ownership categories in Oktibbeha County are males with 2 vehicles (5,430, accounting for 46.4%) and females with 2 vehicles (3,614, making up 59.5%).
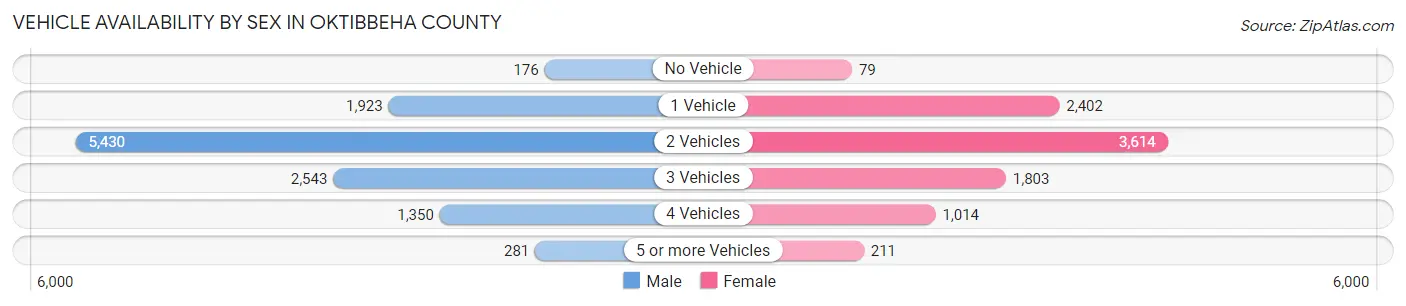
| Vehicles Available | Male | Female |
| No Vehicle | 176 (1.5%) | 79 (0.9%) |
| 1 Vehicle | 1,923 (16.4%) | 2,402 (26.3%) |
| 2 Vehicles | 5,430 (46.4%) | 3,614 (39.6%) |
| 3 Vehicles | 2,543 (21.7%) | 1,803 (19.8%) |
| 4 Vehicles | 1,350 (11.5%) | 1,014 (11.1%) |
| 5 or more Vehicles | 281 (2.4%) | 211 (2.3%) |
| Total | 11,703 (100.0%) | 9,123 (100.0%) |
Commute Time in Oktibbeha County
The most frequently occuring commute durations in Oktibbeha County are 10 to 14 minutes (5,028 commuters, 24.8%), 15 to 19 minutes (4,447 commuters, 21.9%), and 5 to 9 minutes (3,213 commuters, 15.8%).
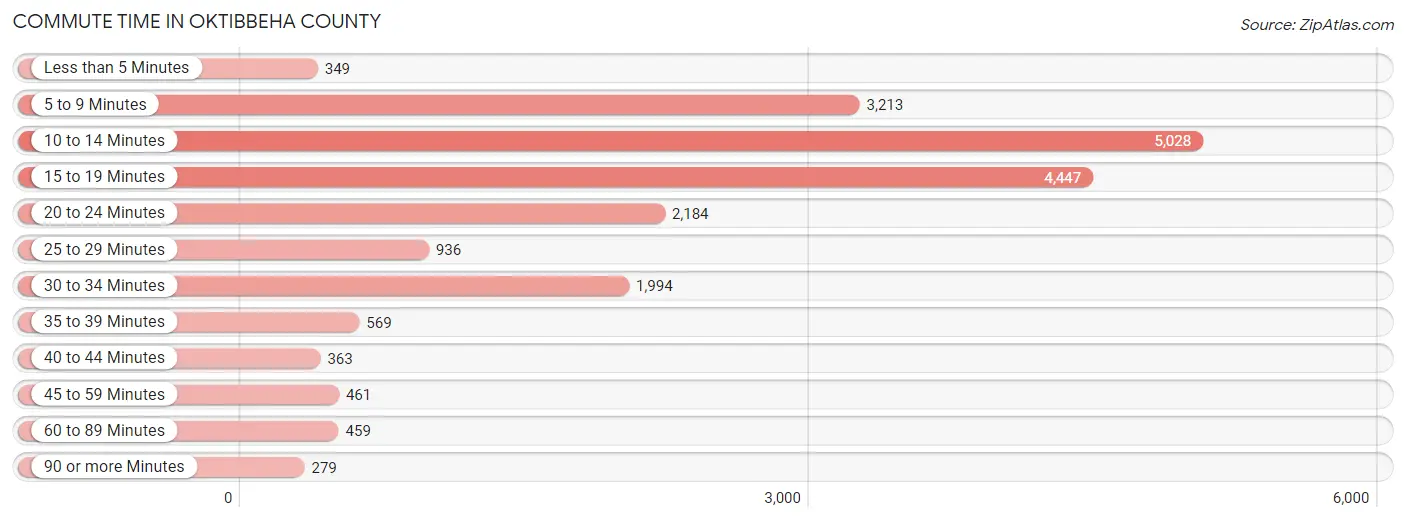
| Commute Time | # Commuters | % Commuters |
| Less than 5 Minutes | 349 | 1.7% |
| 5 to 9 Minutes | 3,213 | 15.8% |
| 10 to 14 Minutes | 5,028 | 24.8% |
| 15 to 19 Minutes | 4,447 | 21.9% |
| 20 to 24 Minutes | 2,184 | 10.8% |
| 25 to 29 Minutes | 936 | 4.6% |
| 30 to 34 Minutes | 1,994 | 9.8% |
| 35 to 39 Minutes | 569 | 2.8% |
| 40 to 44 Minutes | 363 | 1.8% |
| 45 to 59 Minutes | 461 | 2.3% |
| 60 to 89 Minutes | 459 | 2.3% |
| 90 or more Minutes | 279 | 1.4% |
Commute Time by Sex in Oktibbeha County
The most common commute times in Oktibbeha County are 10 to 14 minutes (2,601 commuters, 23.2%) for males and 10 to 14 minutes (2,427 commuters, 26.8%) for females.
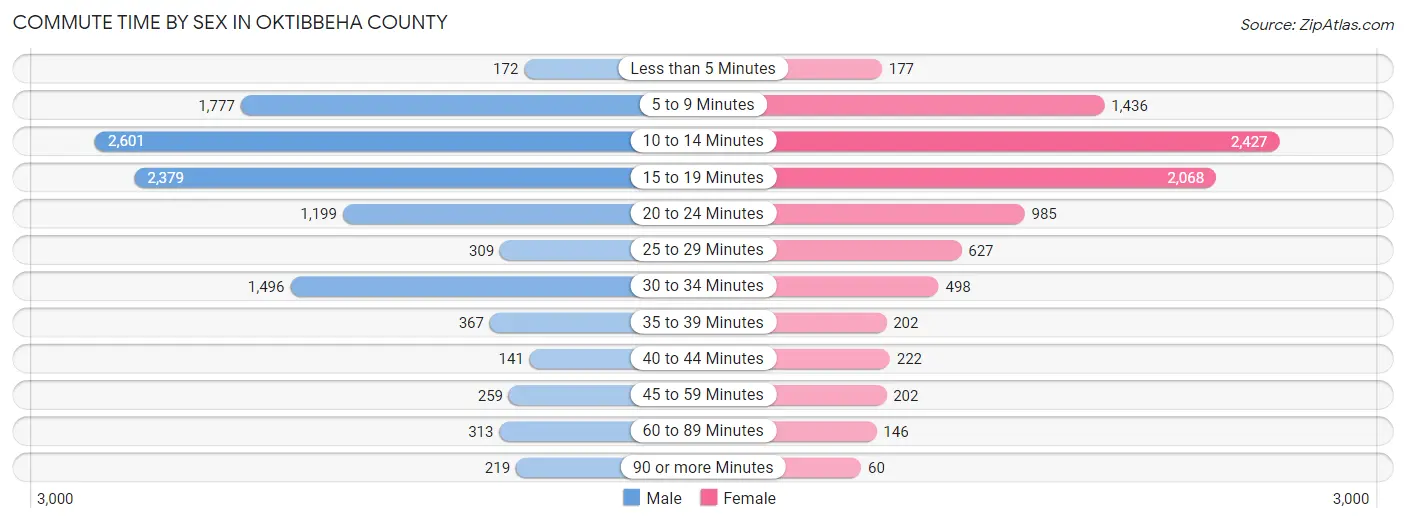
| Commute Time | Male | Female |
| Less than 5 Minutes | 172 (1.5%) | 177 (2.0%) |
| 5 to 9 Minutes | 1,777 (15.8%) | 1,436 (15.9%) |
| 10 to 14 Minutes | 2,601 (23.2%) | 2,427 (26.8%) |
| 15 to 19 Minutes | 2,379 (21.2%) | 2,068 (22.9%) |
| 20 to 24 Minutes | 1,199 (10.7%) | 985 (10.9%) |
| 25 to 29 Minutes | 309 (2.8%) | 627 (6.9%) |
| 30 to 34 Minutes | 1,496 (13.3%) | 498 (5.5%) |
| 35 to 39 Minutes | 367 (3.3%) | 202 (2.2%) |
| 40 to 44 Minutes | 141 (1.3%) | 222 (2.5%) |
| 45 to 59 Minutes | 259 (2.3%) | 202 (2.2%) |
| 60 to 89 Minutes | 313 (2.8%) | 146 (1.6%) |
| 90 or more Minutes | 219 (1.9%) | 60 (0.7%) |
Time of Departure to Work by Sex in Oktibbeha County
The most frequent times of departure to work in Oktibbeha County are 7:30 AM to 7:59 AM (2,074, 18.5%) for males and 7:30 AM to 7:59 AM (1,873, 20.7%) for females.
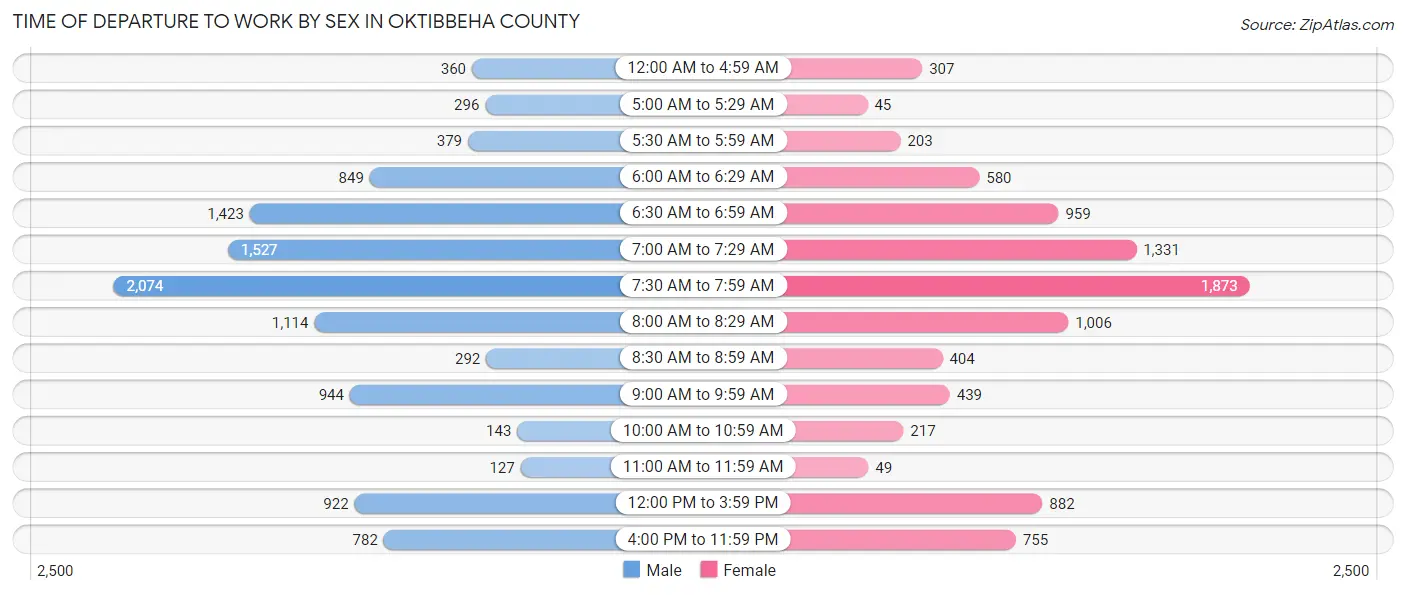
| Time of Departure | Male | Female |
| 12:00 AM to 4:59 AM | 360 (3.2%) | 307 (3.4%) |
| 5:00 AM to 5:29 AM | 296 (2.6%) | 45 (0.5%) |
| 5:30 AM to 5:59 AM | 379 (3.4%) | 203 (2.2%) |
| 6:00 AM to 6:29 AM | 849 (7.6%) | 580 (6.4%) |
| 6:30 AM to 6:59 AM | 1,423 (12.7%) | 959 (10.6%) |
| 7:00 AM to 7:29 AM | 1,527 (13.6%) | 1,331 (14.7%) |
| 7:30 AM to 7:59 AM | 2,074 (18.5%) | 1,873 (20.7%) |
| 8:00 AM to 8:29 AM | 1,114 (9.9%) | 1,006 (11.1%) |
| 8:30 AM to 8:59 AM | 292 (2.6%) | 404 (4.5%) |
| 9:00 AM to 9:59 AM | 944 (8.4%) | 439 (4.9%) |
| 10:00 AM to 10:59 AM | 143 (1.3%) | 217 (2.4%) |
| 11:00 AM to 11:59 AM | 127 (1.1%) | 49 (0.5%) |
| 12:00 PM to 3:59 PM | 922 (8.2%) | 882 (9.8%) |
| 4:00 PM to 11:59 PM | 782 (7.0%) | 755 (8.3%) |
| Total | 11,232 (100.0%) | 9,050 (100.0%) |
Housing Occupancy in Oktibbeha County
Occupancy by Ownership in Oktibbeha County
Of the total 21,165 dwellings in Oktibbeha County, owner-occupied units account for 10,052 (47.5%), while renter-occupied units make up 11,113 (52.5%).
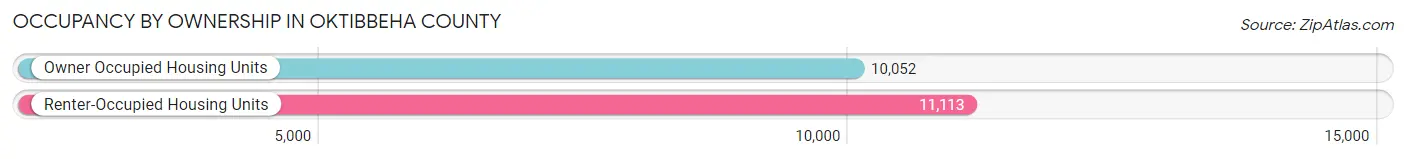
| Occupancy | # Housing Units | % Housing Units |
| Owner Occupied Housing Units | 10,052 | 47.5% |
| Renter-Occupied Housing Units | 11,113 | 52.5% |
| Total Occupied Housing Units | 21,165 | 100.0% |
Occupancy by Household Size in Oktibbeha County
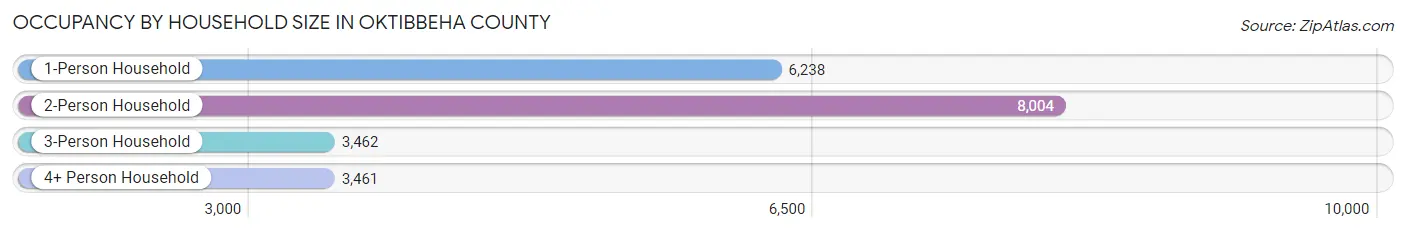
| Household Size | # Housing Units | % Housing Units |
| 1-Person Household | 6,238 | 29.5% |
| 2-Person Household | 8,004 | 37.8% |
| 3-Person Household | 3,462 | 16.4% |
| 4+ Person Household | 3,461 | 16.4% |
| Total Housing Units | 21,165 | 100.0% |
Occupancy by Ownership by Household Size in Oktibbeha County
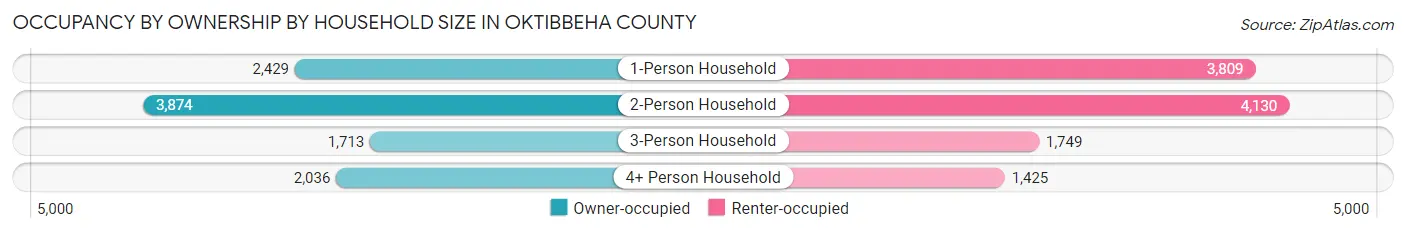
| Household Size | Owner-occupied | Renter-occupied |
| 1-Person Household | 2,429 (38.9%) | 3,809 (61.1%) |
| 2-Person Household | 3,874 (48.4%) | 4,130 (51.6%) |
| 3-Person Household | 1,713 (49.5%) | 1,749 (50.5%) |
| 4+ Person Household | 2,036 (58.8%) | 1,425 (41.2%) |
| Total Housing Units | 10,052 (47.5%) | 11,113 (52.5%) |
Occupancy by Educational Attainment in Oktibbeha County
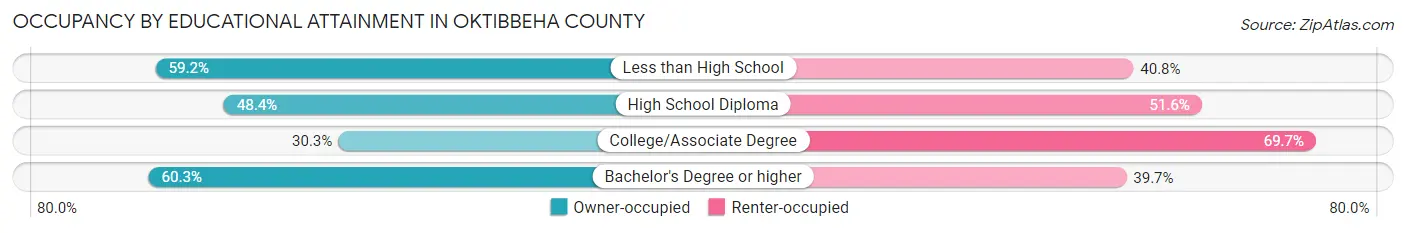
| Household Size | Owner-occupied | Renter-occupied |
| Less than High School | 739 (59.2%) | 509 (40.8%) |
| High School Diploma | 2,203 (48.4%) | 2,351 (51.6%) |
| College/Associate Degree | 2,172 (30.3%) | 5,004 (69.7%) |
| Bachelor's Degree or higher | 4,938 (60.3%) | 3,249 (39.7%) |
Occupancy by Age of Householder in Oktibbeha County
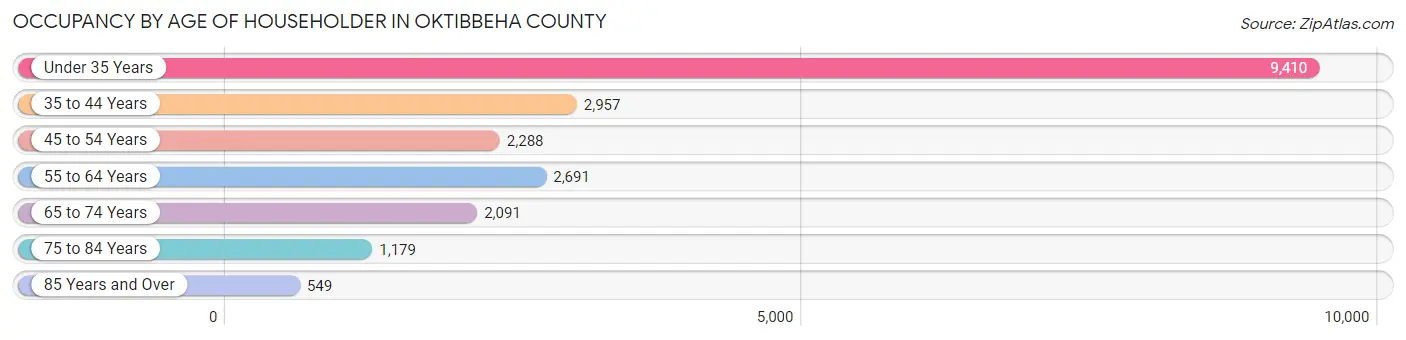
| Age Bracket | # Households | % Households |
| Under 35 Years | 9,410 | 44.5% |
| 35 to 44 Years | 2,957 | 14.0% |
| 45 to 54 Years | 2,288 | 10.8% |
| 55 to 64 Years | 2,691 | 12.7% |
| 65 to 74 Years | 2,091 | 9.9% |
| 75 to 84 Years | 1,179 | 5.6% |
| 85 Years and Over | 549 | 2.6% |
| Total | 21,165 | 100.0% |
Housing Finances in Oktibbeha County
Median Income by Occupancy in Oktibbeha County
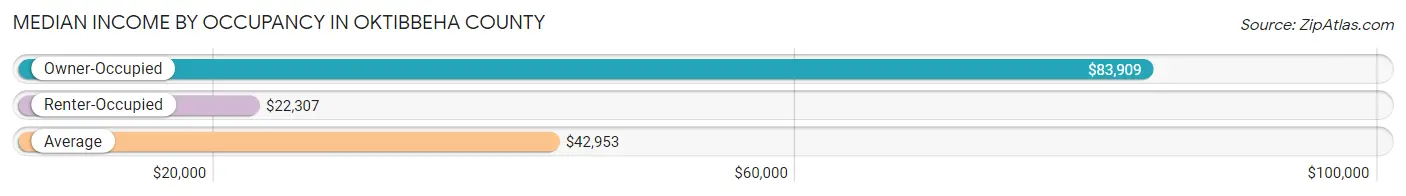
| Occupancy Type | # Households | Median Income |
| Owner-Occupied | 10,052 (47.5%) | $83,909 |
| Renter-Occupied | 11,113 (52.5%) | $22,307 |
| Average | 21,165 (100.0%) | $42,953 |
Occupancy by Householder Income Bracket in Oktibbeha County
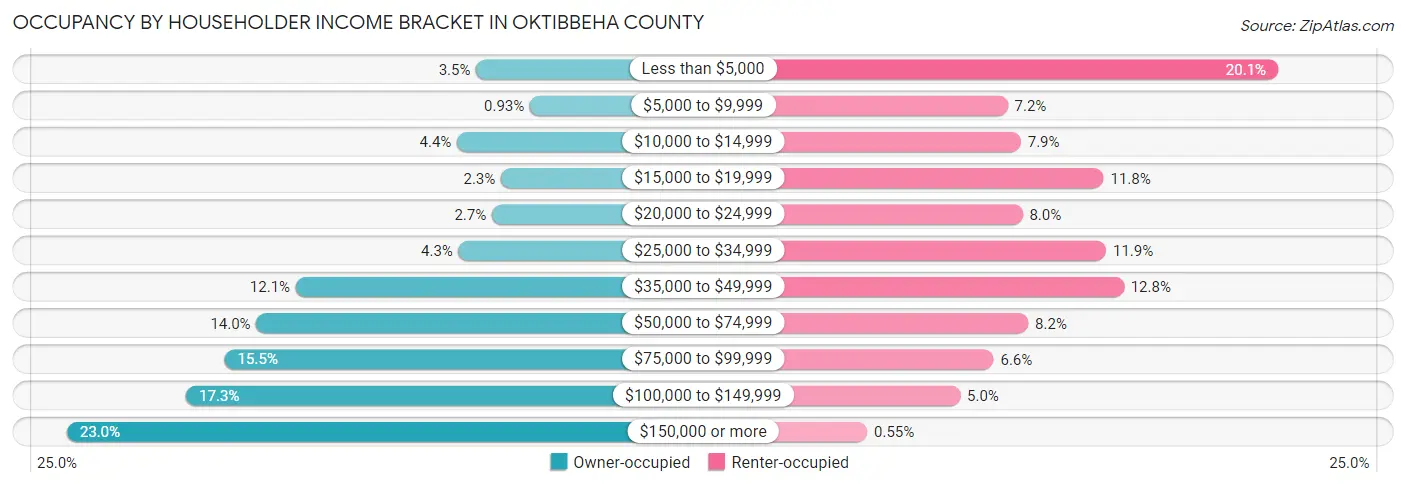
| Income Bracket | Owner-occupied | Renter-occupied |
| Less than $5,000 | 351 (3.5%) | 2,235 (20.1%) |
| $5,000 to $9,999 | 93 (0.9%) | 805 (7.2%) |
| $10,000 to $14,999 | 442 (4.4%) | 875 (7.9%) |
| $15,000 to $19,999 | 232 (2.3%) | 1,312 (11.8%) |
| $20,000 to $24,999 | 275 (2.7%) | 883 (8.0%) |
| $25,000 to $34,999 | 435 (4.3%) | 1,326 (11.9%) |
| $35,000 to $49,999 | 1,214 (12.1%) | 1,419 (12.8%) |
| $50,000 to $74,999 | 1,403 (14.0%) | 914 (8.2%) |
| $75,000 to $99,999 | 1,556 (15.5%) | 730 (6.6%) |
| $100,000 to $149,999 | 1,740 (17.3%) | 553 (5.0%) |
| $150,000 or more | 2,311 (23.0%) | 61 (0.5%) |
| Total | 10,052 (100.0%) | 11,113 (100.0%) |
Monthly Housing Cost Tiers in Oktibbeha County
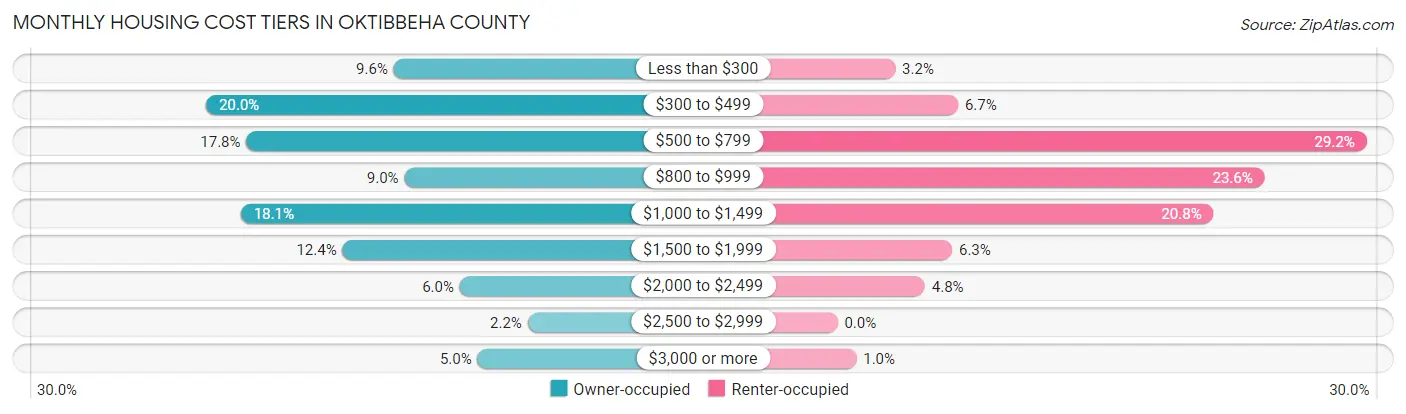
| Monthly Cost | Owner-occupied | Renter-occupied |
| Less than $300 | 966 (9.6%) | 355 (3.2%) |
| $300 to $499 | 2,008 (20.0%) | 740 (6.7%) |
| $500 to $799 | 1,784 (17.7%) | 3,248 (29.2%) |
| $800 to $999 | 907 (9.0%) | 2,623 (23.6%) |
| $1,000 to $1,499 | 1,815 (18.1%) | 2,308 (20.8%) |
| $1,500 to $1,999 | 1,250 (12.4%) | 704 (6.3%) |
| $2,000 to $2,499 | 599 (6.0%) | 537 (4.8%) |
| $2,500 to $2,999 | 222 (2.2%) | 0 (0.0%) |
| $3,000 or more | 501 (5.0%) | 116 (1.0%) |
| Total | 10,052 (100.0%) | 11,113 (100.0%) |
Physical Housing Characteristics in Oktibbeha County
Housing Structures in Oktibbeha County
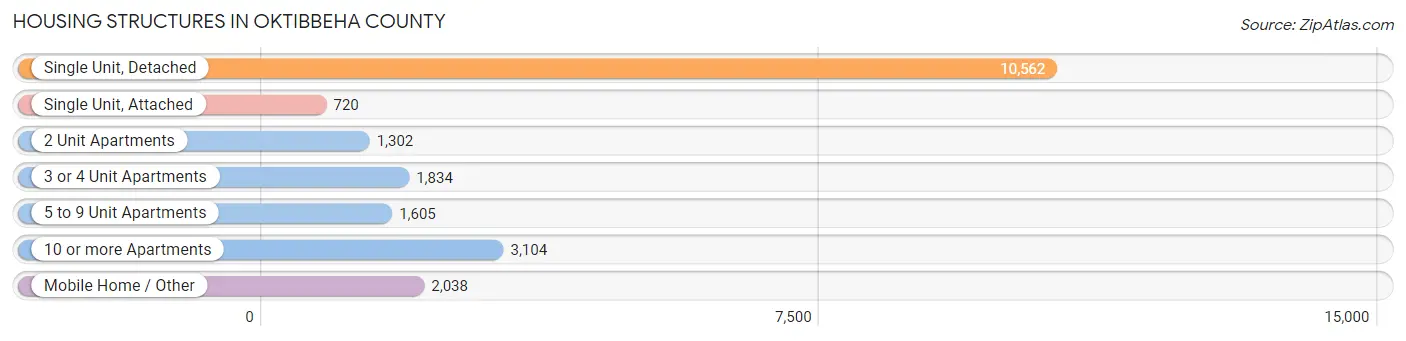
| Structure Type | # Housing Units | % Housing Units |
| Single Unit, Detached | 10,562 | 49.9% |
| Single Unit, Attached | 720 | 3.4% |
| 2 Unit Apartments | 1,302 | 6.1% |
| 3 or 4 Unit Apartments | 1,834 | 8.7% |
| 5 to 9 Unit Apartments | 1,605 | 7.6% |
| 10 or more Apartments | 3,104 | 14.7% |
| Mobile Home / Other | 2,038 | 9.6% |
| Total | 21,165 | 100.0% |
Housing Structures by Occupancy in Oktibbeha County
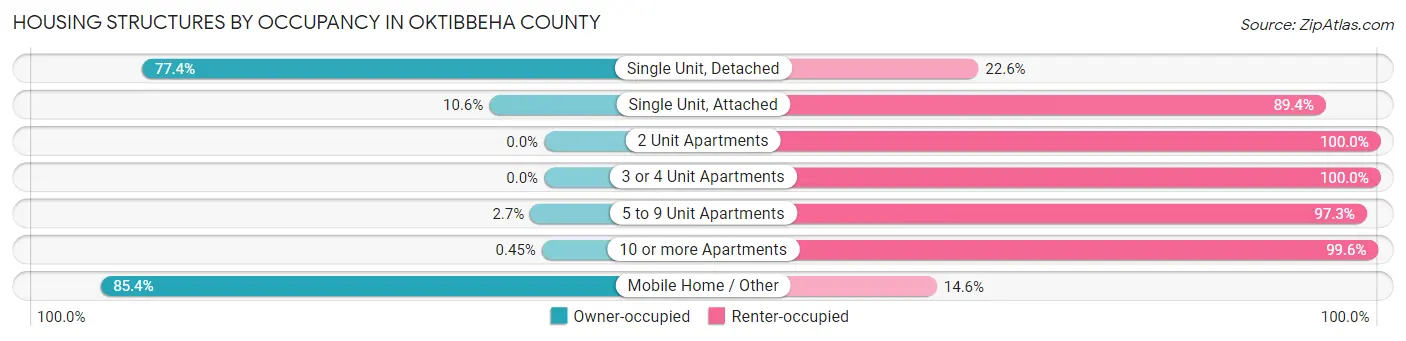
| Structure Type | Owner-occupied | Renter-occupied |
| Single Unit, Detached | 8,178 (77.4%) | 2,384 (22.6%) |
| Single Unit, Attached | 76 (10.6%) | 644 (89.4%) |
| 2 Unit Apartments | 0 (0.0%) | 1,302 (100.0%) |
| 3 or 4 Unit Apartments | 0 (0.0%) | 1,834 (100.0%) |
| 5 to 9 Unit Apartments | 43 (2.7%) | 1,562 (97.3%) |
| 10 or more Apartments | 14 (0.4%) | 3,090 (99.6%) |
| Mobile Home / Other | 1,741 (85.4%) | 297 (14.6%) |
| Total | 10,052 (47.5%) | 11,113 (52.5%) |
Housing Structures by Number of Rooms in Oktibbeha County
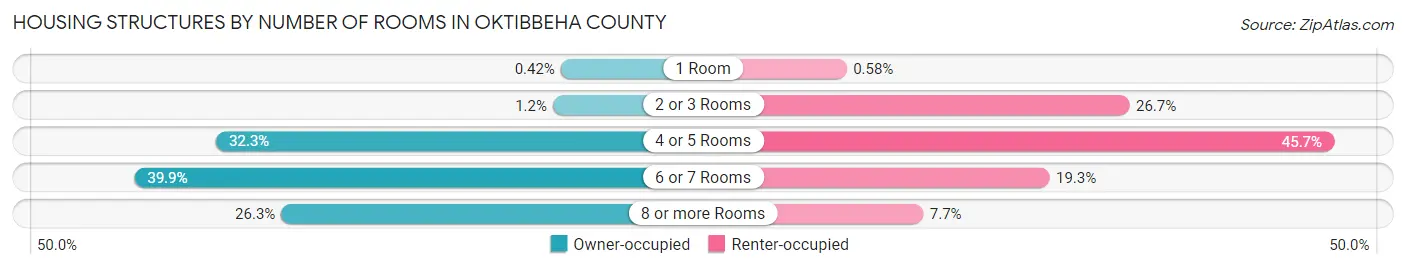
| Number of Rooms | Owner-occupied | Renter-occupied |
| 1 Room | 42 (0.4%) | 64 (0.6%) |
| 2 or 3 Rooms | 116 (1.1%) | 2,972 (26.7%) |
| 4 or 5 Rooms | 3,247 (32.3%) | 5,076 (45.7%) |
| 6 or 7 Rooms | 4,006 (39.9%) | 2,149 (19.3%) |
| 8 or more Rooms | 2,641 (26.3%) | 852 (7.7%) |
| Total | 10,052 (100.0%) | 11,113 (100.0%) |
Housing Structure by Heating Type in Oktibbeha County
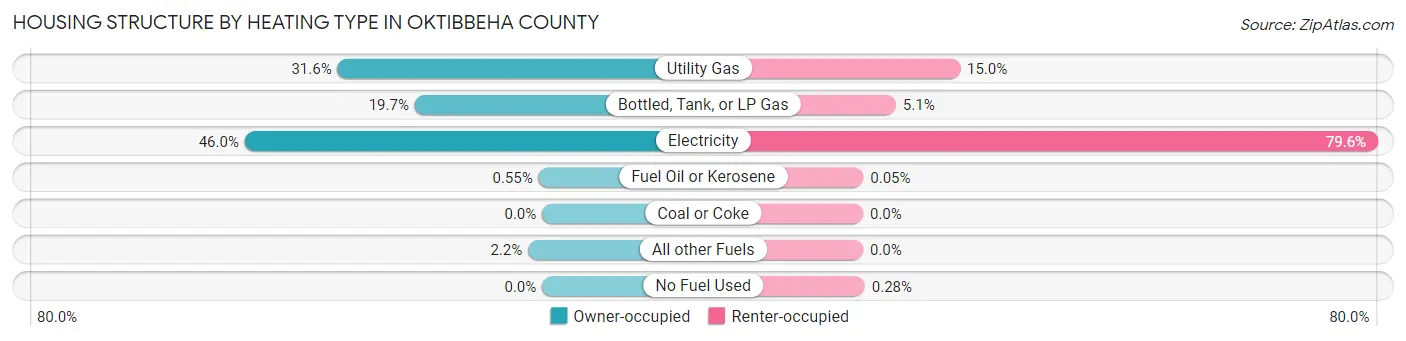
| Heating Type | Owner-occupied | Renter-occupied |
| Utility Gas | 3,179 (31.6%) | 1,666 (15.0%) |
| Bottled, Tank, or LP Gas | 1,979 (19.7%) | 565 (5.1%) |
| Electricity | 4,621 (46.0%) | 8,845 (79.6%) |
| Fuel Oil or Kerosene | 55 (0.5%) | 6 (0.1%) |
| Coal or Coke | 0 (0.0%) | 0 (0.0%) |
| All other Fuels | 218 (2.2%) | 0 (0.0%) |
| No Fuel Used | 0 (0.0%) | 31 (0.3%) |
| Total | 10,052 (100.0%) | 11,113 (100.0%) |
Household Vehicle Usage in Oktibbeha County
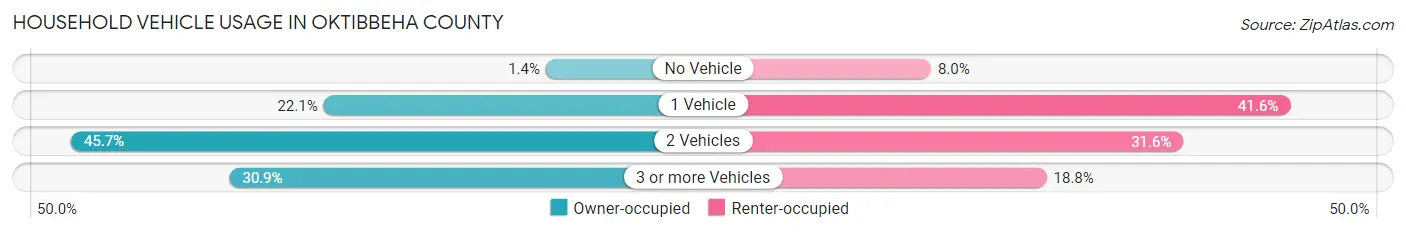
| Vehicles per Household | Owner-occupied | Renter-occupied |
| No Vehicle | 136 (1.3%) | 892 (8.0%) |
| 1 Vehicle | 2,221 (22.1%) | 4,619 (41.6%) |
| 2 Vehicles | 4,591 (45.7%) | 3,509 (31.6%) |
| 3 or more Vehicles | 3,104 (30.9%) | 2,093 (18.8%) |
| Total | 10,052 (100.0%) | 11,113 (100.0%) |
Real Estate & Mortgages in Oktibbeha County
Real Estate and Mortgage Overview in Oktibbeha County
| Characteristic | Without Mortgage | With Mortgage |
| Housing Units | 4,718 | 5,334 |
| Median Property Value | $162,300 | $240,600 |
| Median Household Income | $53,774 | $1,340 |
| Monthly Housing Costs | $421 | $487 |
| Real Estate Taxes | $1,055 | $464 |
Property Value by Mortgage Status in Oktibbeha County
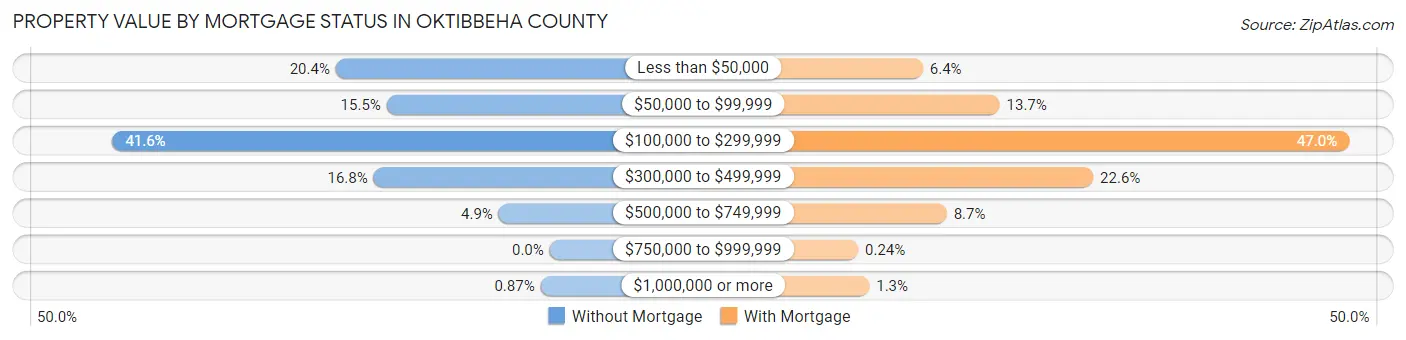
| Property Value | Without Mortgage | With Mortgage |
| Less than $50,000 | 961 (20.4%) | 342 (6.4%) |
| $50,000 to $99,999 | 732 (15.5%) | 732 (13.7%) |
| $100,000 to $299,999 | 1,964 (41.6%) | 2,507 (47.0%) |
| $300,000 to $499,999 | 791 (16.8%) | 1,207 (22.6%) |
| $500,000 to $749,999 | 229 (4.9%) | 463 (8.7%) |
| $750,000 to $999,999 | 0 (0.0%) | 13 (0.2%) |
| $1,000,000 or more | 41 (0.9%) | 70 (1.3%) |
| Total | 4,718 (100.0%) | 5,334 (100.0%) |
Household Income by Mortgage Status in Oktibbeha County
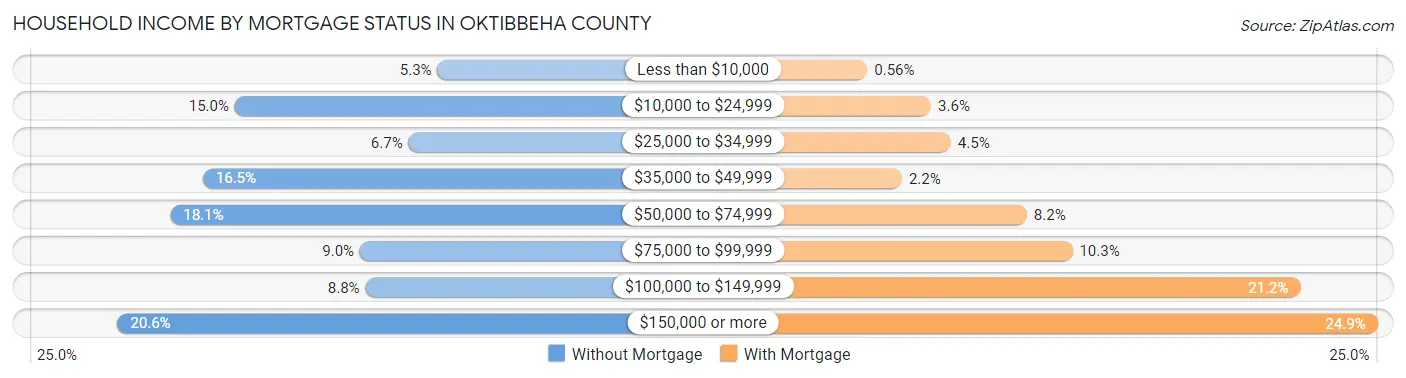
| Household Income | Without Mortgage | With Mortgage |
| Less than $10,000 | 252 (5.3%) | 30 (0.6%) |
| $10,000 to $24,999 | 707 (15.0%) | 192 (3.6%) |
| $25,000 to $34,999 | 317 (6.7%) | 242 (4.5%) |
| $35,000 to $49,999 | 779 (16.5%) | 118 (2.2%) |
| $50,000 to $74,999 | 852 (18.1%) | 435 (8.2%) |
| $75,000 to $99,999 | 426 (9.0%) | 551 (10.3%) |
| $100,000 to $149,999 | 414 (8.8%) | 1,130 (21.2%) |
| $150,000 or more | 971 (20.6%) | 1,326 (24.9%) |
| Total | 4,718 (100.0%) | 5,334 (100.0%) |
Property Value to Household Income Ratio in Oktibbeha County
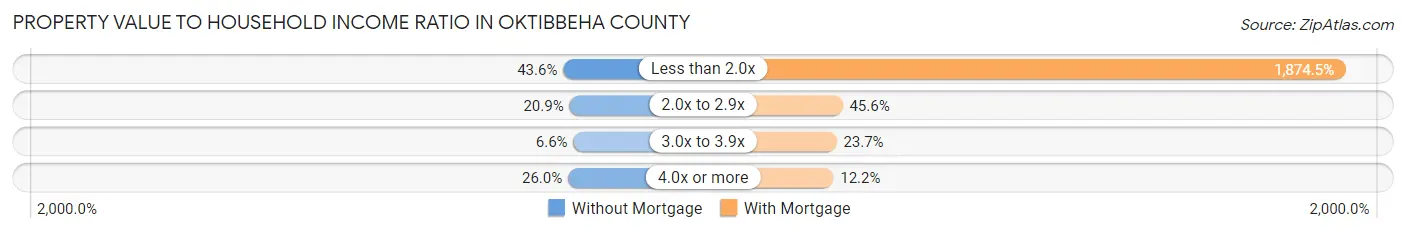
| Value-to-Income Ratio | Without Mortgage | With Mortgage |
| Less than 2.0x | 2,057 (43.6%) | 99,986 (1,874.5%) |
| 2.0x to 2.9x | 986 (20.9%) | 2,431 (45.6%) |
| 3.0x to 3.9x | 312 (6.6%) | 1,266 (23.7%) |
| 4.0x or more | 1,226 (26.0%) | 650 (12.2%) |
| Total | 4,718 (100.0%) | 5,334 (100.0%) |
Real Estate Taxes by Mortgage Status in Oktibbeha County
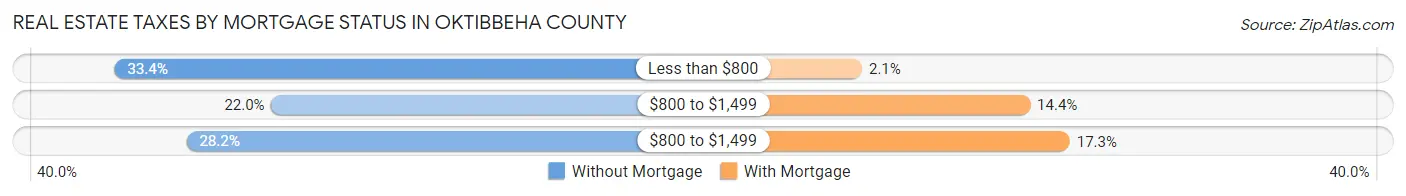
| Property Taxes | Without Mortgage | With Mortgage |
| Less than $800 | 1,577 (33.4%) | 113 (2.1%) |
| $800 to $1,499 | 1,040 (22.0%) | 768 (14.4%) |
| $800 to $1,499 | 1,329 (28.2%) | 923 (17.3%) |
| Total | 4,718 (100.0%) | 5,334 (100.0%) |
Health & Disability in Oktibbeha County
Health Insurance Coverage by Age in Oktibbeha County
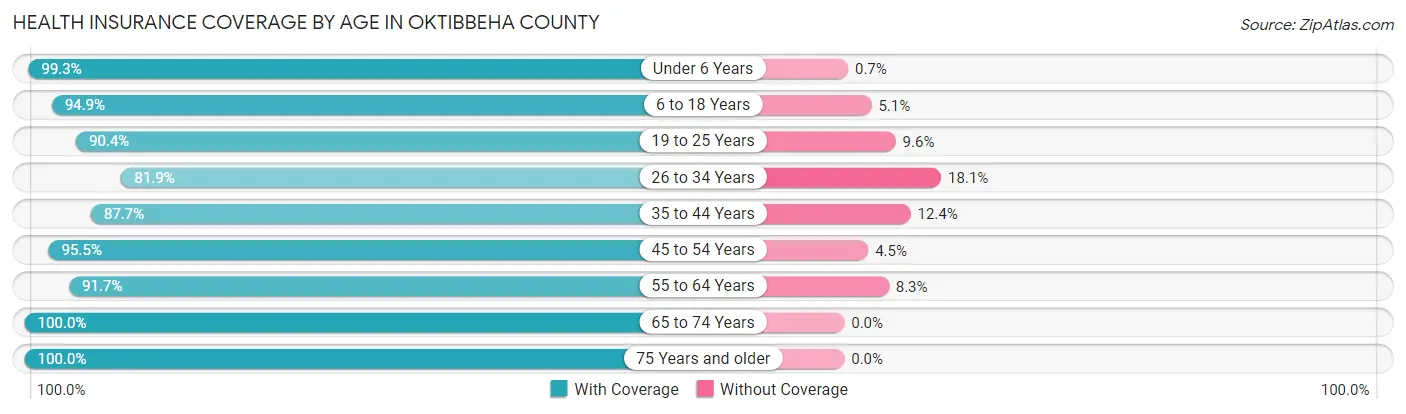
| Age Bracket | With Coverage | Without Coverage |
| Under 6 Years | 3,129 (99.3%) | 22 (0.7%) |
| 6 to 18 Years | 7,752 (94.9%) | 413 (5.1%) |
| 19 to 25 Years | 13,626 (90.4%) | 1,443 (9.6%) |
| 26 to 34 Years | 4,646 (81.9%) | 1,024 (18.1%) |
| 35 to 44 Years | 4,210 (87.6%) | 593 (12.3%) |
| 45 to 54 Years | 3,706 (95.5%) | 173 (4.5%) |
| 55 to 64 Years | 3,991 (91.7%) | 361 (8.3%) |
| 65 to 74 Years | 3,266 (100.0%) | 0 (0.0%) |
| 75 Years and older | 2,533 (100.0%) | 0 (0.0%) |
| Total | 46,859 (92.1%) | 4,029 (7.9%) |
Health Insurance Coverage by Citizenship Status in Oktibbeha County
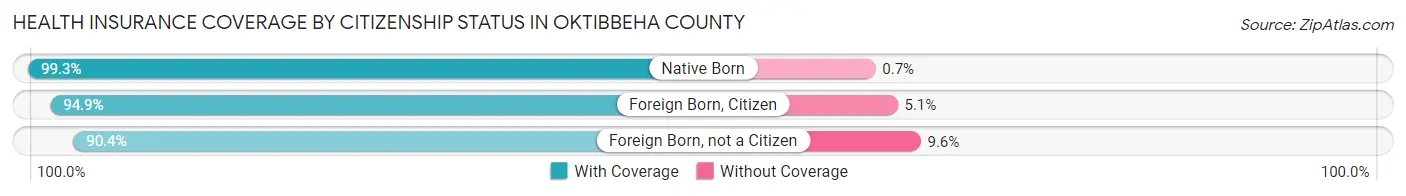
| Citizenship Status | With Coverage | Without Coverage |
| Native Born | 3,129 (99.3%) | 22 (0.7%) |
| Foreign Born, Citizen | 7,752 (94.9%) | 413 (5.1%) |
| Foreign Born, not a Citizen | 13,626 (90.4%) | 1,443 (9.6%) |
Health Insurance Coverage by Household Income in Oktibbeha County
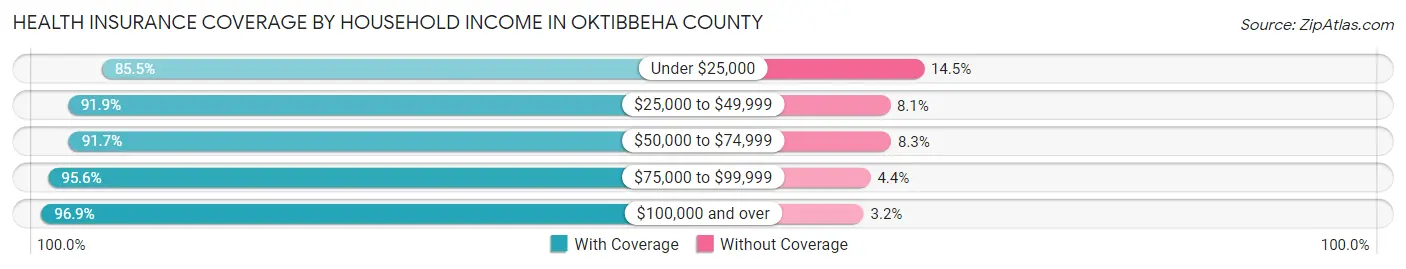
| Household Income | With Coverage | Without Coverage |
| Under $25,000 | 10,938 (85.5%) | 1,849 (14.5%) |
| $25,000 to $49,999 | 9,076 (91.9%) | 799 (8.1%) |
| $50,000 to $74,999 | 4,799 (91.7%) | 434 (8.3%) |
| $75,000 to $99,999 | 5,338 (95.6%) | 248 (4.4%) |
| $100,000 and over | 12,251 (96.9%) | 399 (3.2%) |
Public vs Private Health Insurance Coverage by Age in Oktibbeha County
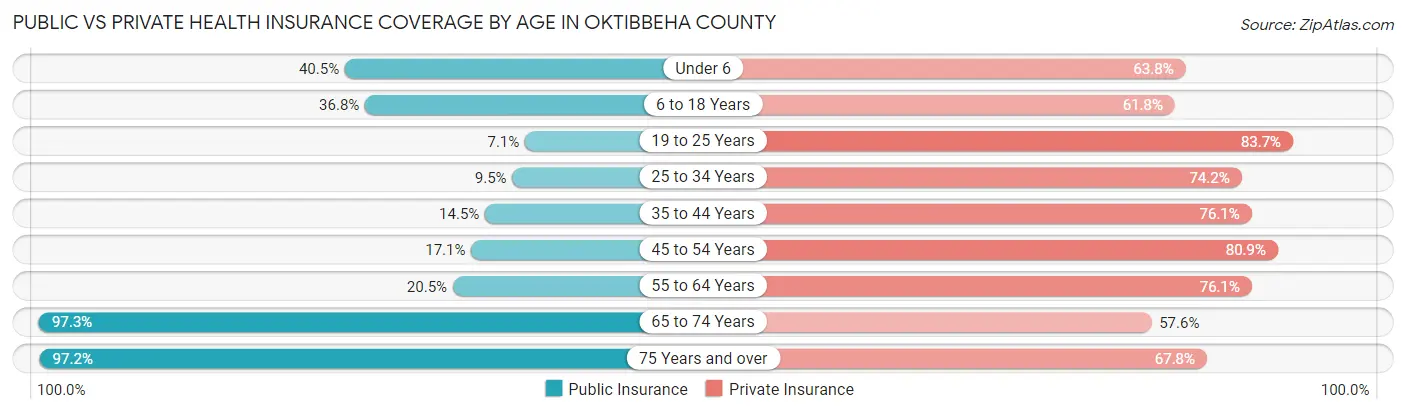
| Age Bracket | Public Insurance | Private Insurance |
| Under 6 | 1,277 (40.5%) | 2,010 (63.8%) |
| 6 to 18 Years | 3,004 (36.8%) | 5,047 (61.8%) |
| 19 to 25 Years | 1,070 (7.1%) | 12,617 (83.7%) |
| 25 to 34 Years | 536 (9.5%) | 4,206 (74.2%) |
| 35 to 44 Years | 697 (14.5%) | 3,653 (76.1%) |
| 45 to 54 Years | 663 (17.1%) | 3,139 (80.9%) |
| 55 to 64 Years | 892 (20.5%) | 3,312 (76.1%) |
| 65 to 74 Years | 3,179 (97.3%) | 1,882 (57.6%) |
| 75 Years and over | 2,462 (97.2%) | 1,716 (67.7%) |
| Total | 13,780 (27.1%) | 37,582 (73.9%) |
Disability Status by Sex by Age in Oktibbeha County
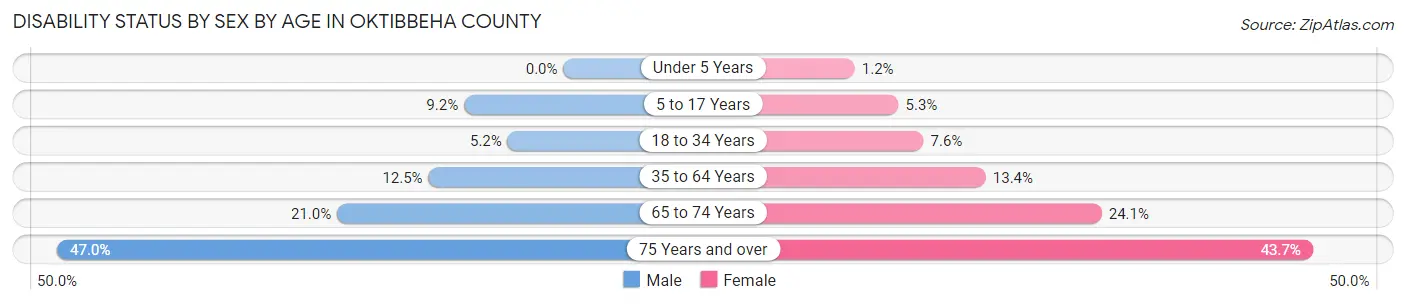
| Age Bracket | Male | Female |
| Under 5 Years | 0 (0.0%) | 15 (1.2%) |
| 5 to 17 Years | 297 (9.2%) | 167 (5.3%) |
| 18 to 34 Years | 628 (5.2%) | 833 (7.6%) |
| 35 to 64 Years | 775 (12.5%) | 915 (13.4%) |
| 65 to 74 Years | 316 (21.0%) | 425 (24.1%) |
| 75 Years and over | 459 (47.0%) | 680 (43.7%) |
Disability Class by Sex by Age in Oktibbeha County
Disability Class: Hearing Difficulty
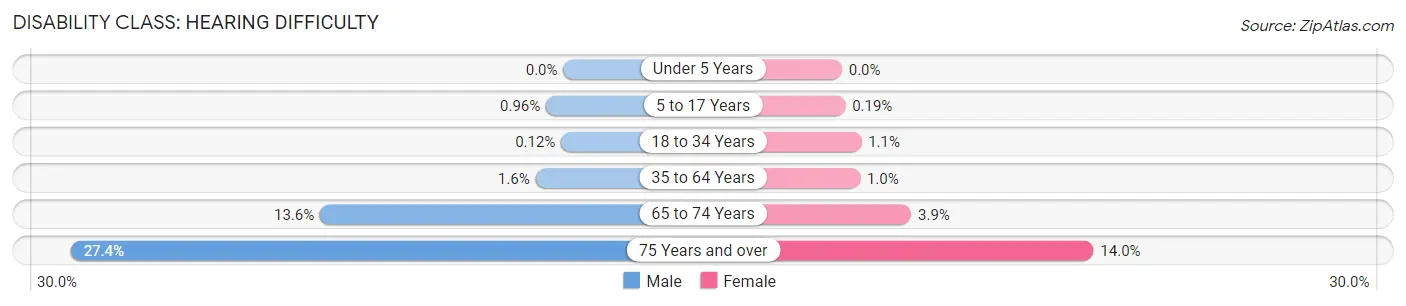
| Age Bracket | Male | Female |
| Under 5 Years | 0 (0.0%) | 0 (0.0%) |
| 5 to 17 Years | 31 (1.0%) | 6 (0.2%) |
| 18 to 34 Years | 15 (0.1%) | 119 (1.1%) |
| 35 to 64 Years | 96 (1.5%) | 69 (1.0%) |
| 65 to 74 Years | 204 (13.6%) | 68 (3.9%) |
| 75 Years and over | 268 (27.4%) | 218 (14.0%) |
Disability Class: Vision Difficulty
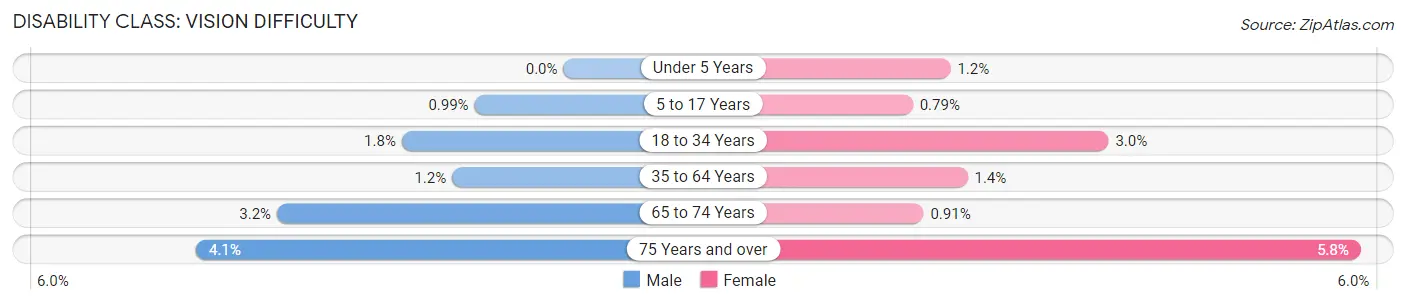
| Age Bracket | Male | Female |
| Under 5 Years | 0 (0.0%) | 15 (1.2%) |
| 5 to 17 Years | 32 (1.0%) | 25 (0.8%) |
| 18 to 34 Years | 218 (1.8%) | 326 (3.0%) |
| 35 to 64 Years | 77 (1.2%) | 96 (1.4%) |
| 65 to 74 Years | 48 (3.2%) | 16 (0.9%) |
| 75 Years and over | 40 (4.1%) | 90 (5.8%) |
Disability Class: Cognitive Difficulty
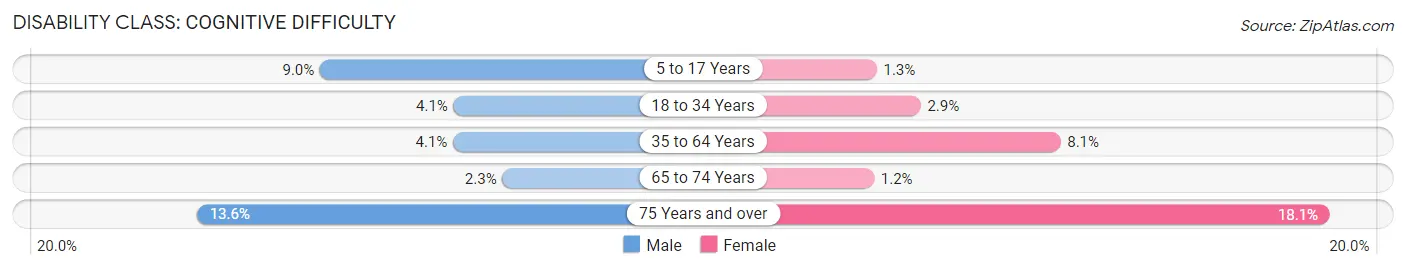
| Age Bracket | Male | Female |
| 5 to 17 Years | 291 (9.0%) | 41 (1.3%) |
| 18 to 34 Years | 494 (4.1%) | 321 (2.9%) |
| 35 to 64 Years | 253 (4.1%) | 555 (8.1%) |
| 65 to 74 Years | 34 (2.3%) | 21 (1.2%) |
| 75 Years and over | 133 (13.6%) | 282 (18.1%) |
Disability Class: Ambulatory Difficulty
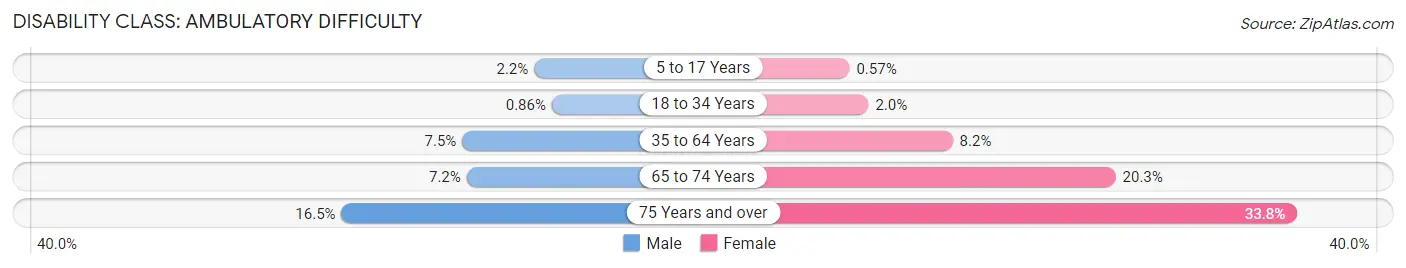
| Age Bracket | Male | Female |
| 5 to 17 Years | 70 (2.2%) | 18 (0.6%) |
| 18 to 34 Years | 105 (0.9%) | 217 (2.0%) |
| 35 to 64 Years | 465 (7.5%) | 563 (8.2%) |
| 65 to 74 Years | 108 (7.2%) | 358 (20.3%) |
| 75 Years and over | 161 (16.5%) | 526 (33.8%) |
Disability Class: Self-Care Difficulty
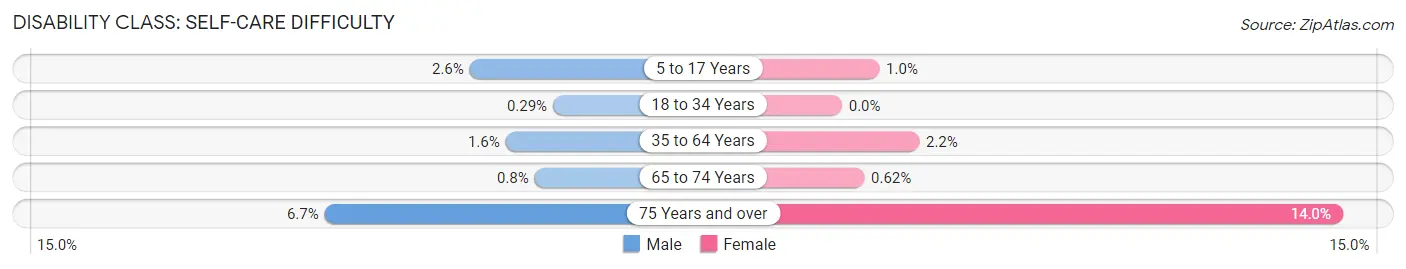
| Age Bracket | Male | Female |
| 5 to 17 Years | 84 (2.6%) | 33 (1.0%) |
| 18 to 34 Years | 35 (0.3%) | 0 (0.0%) |
| 35 to 64 Years | 100 (1.6%) | 147 (2.1%) |
| 65 to 74 Years | 12 (0.8%) | 11 (0.6%) |
| 75 Years and over | 65 (6.7%) | 217 (14.0%) |
Technology Access in Oktibbeha County
Computing Device Access in Oktibbeha County
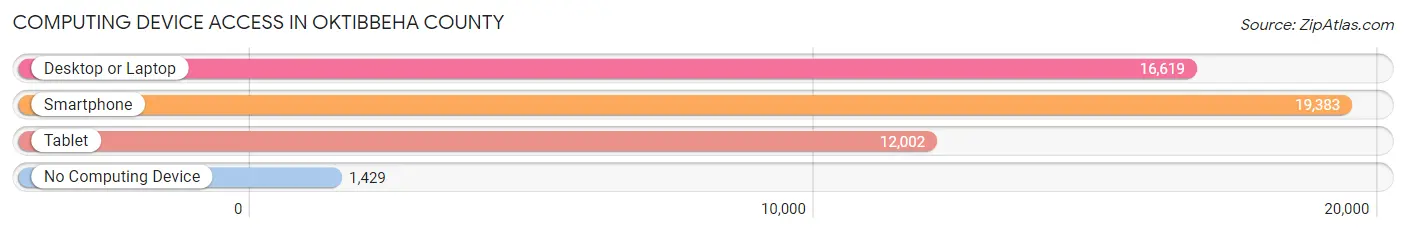
| Device Type | # Households | % Households |
| Desktop or Laptop | 16,619 | 78.5% |
| Smartphone | 19,383 | 91.6% |
| Tablet | 12,002 | 56.7% |
| No Computing Device | 1,429 | 6.8% |
| Total | 21,165 | 100.0% |
Internet Access in Oktibbeha County
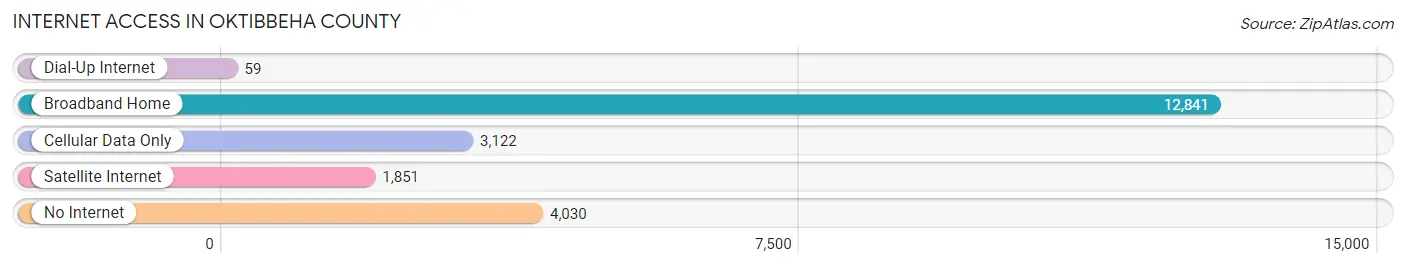
| Internet Type | # Households | % Households |
| Dial-Up Internet | 59 | 0.3% |
| Broadband Home | 12,841 | 60.7% |
| Cellular Data Only | 3,122 | 14.7% |
| Satellite Internet | 1,851 | 8.7% |
| No Internet | 4,030 | 19.0% |
| Total | 21,165 | 100.0% |
Oktibbeha County Summary
Oktibbeha County is located in the northeastern part of Mississippi, in the heart of the state’s Golden Triangle region. It is bordered by Clay, Lowndes, Noxubee, and Winston counties. The county seat is Starkville, which is also home to Mississippi State University. The county is named after the Choctaw chief Oktibbeha, who lived in the area in the early 19th century.
History
Oktibbeha County was established in 1833, and was originally part of the Choctaw Nation. The county was named after the Choctaw chief Oktibbeha, who lived in the area in the early 19th century. The county was originally part of the Chickasaw Cession of 1832, and was later divided into two counties, Oktibbeha and Noxubee.
The county was home to several Native American tribes, including the Choctaw, Chickasaw, and Creek. The area was also home to a large population of African Americans, who were brought to the area as slaves. After the Civil War, many African Americans stayed in the area and established their own communities.
In the late 19th century, the county was home to several large plantations, and the economy was largely based on cotton production. The county was also home to several small towns, including Starkville, which was established in 1835.
Geography
Oktibbeha County is located in the northeastern part of Mississippi, in the heart of the state’s Golden Triangle region. It is bordered by Clay, Lowndes, Noxubee, and Winston counties. The county has a total area of 545 square miles, of which 543 square miles is land and 2 square miles is water.
The county is mostly flat, with some rolling hills in the northern part of the county. The county is drained by the Tombigbee River and its tributaries, including the Oktibbeha River, which flows through the county. The county is also home to several small lakes, including Lake Oktibbeha and Lake Lamar Bruce.
Economy
The economy of Oktibbeha County is largely based on agriculture, manufacturing, and education. The county is home to several large farms, which produce cotton, soybeans, corn, and other crops. The county is also home to several manufacturing companies, which produce a variety of products, including furniture, textiles, and automotive parts.
The county is also home to Mississippi State University, which is the largest employer in the county. The university provides a variety of educational and research opportunities, and is a major economic driver in the county.
Demographics
As of the 2010 census, there were 47,671 people, 17,845 households, and 11,845 families living in the county. The population density was 87.7 people per square mile. The racial makeup of the county was 68.3% White, 28.2% African American, 0.3% Native American, 1.2% Asian, 0.1% Pacific Islander, 0.7% from other races, and 1.4% from two or more races. Hispanic or Latino of any race were 2.2% of the population.
The median income for a household in the county was $35,945, and the median income for a family was $45,945. The per capita income for the county was $19,945. About 17.2% of families and 22.2% of the population were below the poverty line, including 28.2% of those under age 18 and 14.2% of those age 65 or over.
Common Questions
What is Per Capita Income in Oktibbeha County?
Per Capita income in Oktibbeha County is $28,221.
What is the Median Family Income in Oktibbeha County?
Median Family Income in Oktibbeha County is $76,076.
What is the Median Household income in Oktibbeha County?
Median Household Income in Oktibbeha County is $42,953.
What is Income or Wage Gap in Oktibbeha County?
Income or Wage Gap in Oktibbeha County is 15.7%.
Women in Oktibbeha County earn 84.3 cents for every dollar earned by a man.
What is Inequality or Gini Index in Oktibbeha County?
Inequality or Gini Index in Oktibbeha County is 0.55.
What is the Total Population of Oktibbeha County?
Total Population of Oktibbeha County is 51,388.
What is the Total Male Population of Oktibbeha County?
Total Male Population of Oktibbeha County is 25,696.
What is the Total Female Population of Oktibbeha County?
Total Female Population of Oktibbeha County is 25,692.
What is the Ratio of Males per 100 Females in Oktibbeha County?
There are 100.02 Males per 100 Females in Oktibbeha County.
What is the Ratio of Females per 100 Males in Oktibbeha County?
There are 99.98 Females per 100 Males in Oktibbeha County.
What is the Median Population Age in Oktibbeha County?
Median Population Age in Oktibbeha County is 25.4 Years.
What is the Average Family Size in Oktibbeha County
Average Family Size in Oktibbeha County is 2.8 People.
What is the Average Household Size in Oktibbeha County
Average Household Size in Oktibbeha County is 2.2 People.
How Large is the Labor Force in Oktibbeha County?
There are 24,561 People in the Labor Forcein in Oktibbeha County.
What is the Percentage of People in the Labor Force in Oktibbeha County?
56.3% of People are in the Labor Force in Oktibbeha County.
What is the Unemployment Rate in Oktibbeha County?
Unemployment Rate in Oktibbeha County is 6.8%.