Neshoba County, MS Map & Demographics
Neshoba County Map
Neshoba County Overview
$23,538
PER CAPITA INCOME
$56,221
AVG FAMILY INCOME
$47,400
AVG HOUSEHOLD INCOME
33.6%
WAGE / INCOME GAP [ % ]
66.4¢/ $1
WAGE / INCOME GAP [ $ ]
$12,511
FAMILY INCOME DEFICIT
0.47
INEQUALITY / GINI INDEX
28,970
TOTAL POPULATION
13,754
MALE POPULATION
15,216
FEMALE POPULATION
90.39
MALES / 100 FEMALES
110.63
FEMALES / 100 MALES
37.0
MEDIAN AGE
3.4
AVG FAMILY SIZE
2.8
AVG HOUSEHOLD SIZE
12,238
LABOR FORCE [ PEOPLE ]
55.5%
PERCENT IN LABOR FORCE
9.3%
UNEMPLOYMENT RATE
Income in Neshoba County
Income Overview in Neshoba County
Per Capita Income in Neshoba County is $23,538, while median incomes of families and households are $56,221 and $47,400 respectively.
| Characteristic | Number | Measure |
| Per Capita Income | 28,970 | $23,538 |
| Median Family Income | 6,917 | $56,221 |
| Mean Family Income | 6,917 | $73,179 |
| Median Household Income | 10,199 | $47,400 |
| Mean Household Income | 10,199 | $64,183 |
| Income Deficit | 6,917 | $12,511 |
| Wage / Income Gap (%) | 28,970 | 33.58% |
| Wage / Income Gap ($) | 28,970 | 66.42¢ per $1 |
| Gini / Inequality Index | 28,970 | 0.47 |
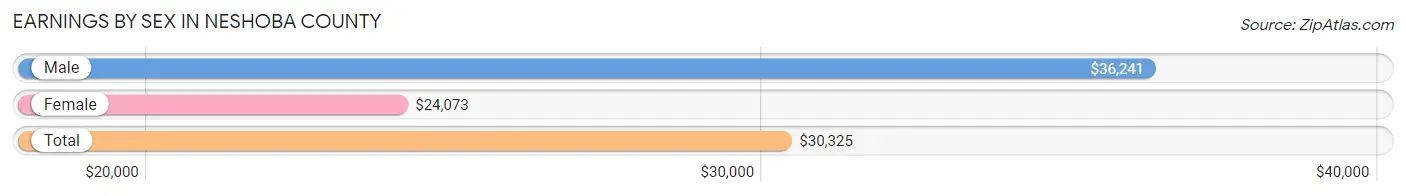
Earnings by Sex in Neshoba County
Average Earnings in Neshoba County are $30,325, $36,241 for men and $24,073 for women, a difference of 33.6%.
| Sex | Number | Average Earnings |
| Male | 6,272 (51.3%) | $36,241 |
| Female | 5,945 (48.7%) | $24,073 |
| Total | 12,217 (100.0%) | $30,325 |
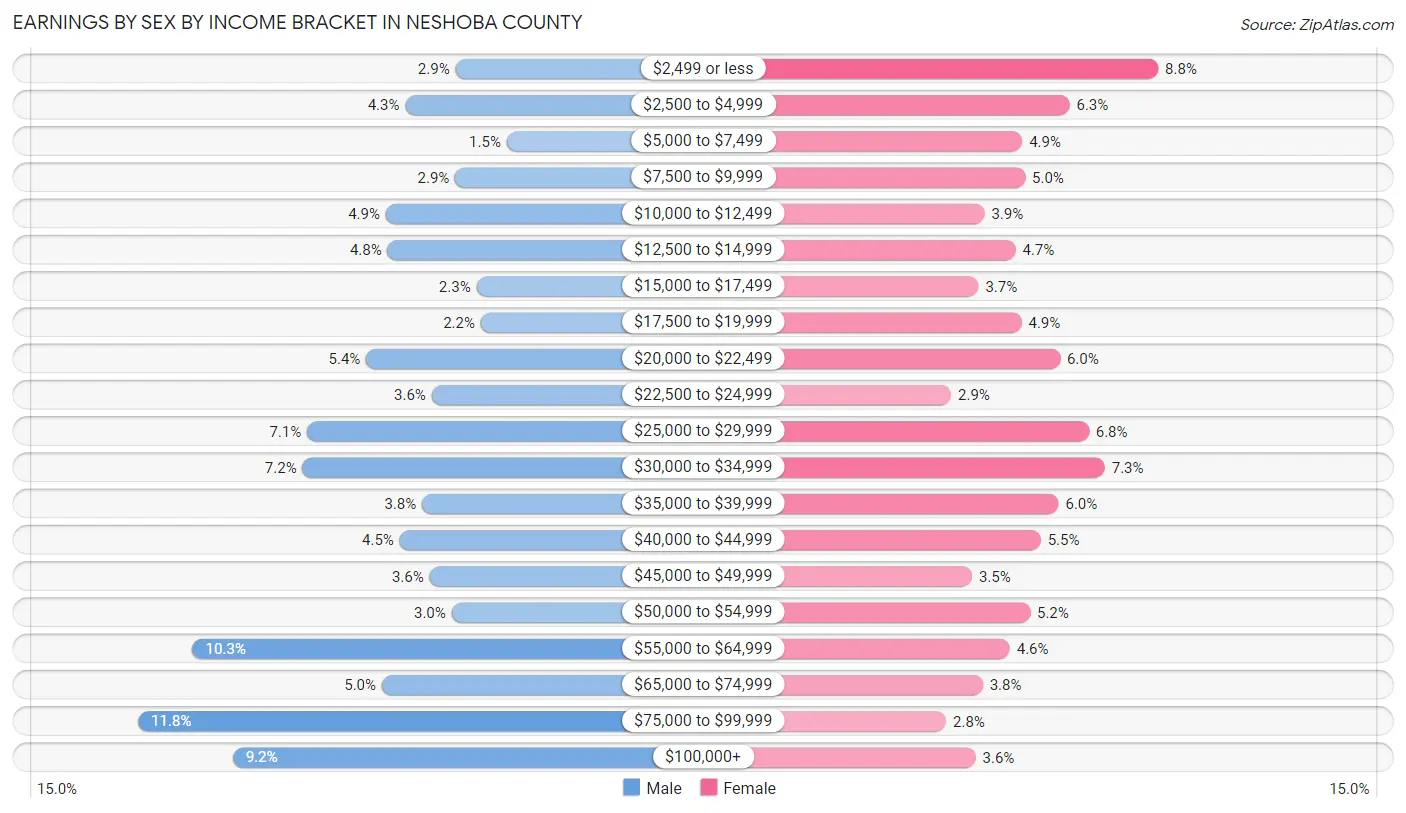
Earnings by Sex by Income Bracket in Neshoba County
The most common earnings brackets in Neshoba County are $75,000 to $99,999 for men (741 | 11.8%) and $2,499 or less for women (520 | 8.7%).
| Income | Male | Female |
| $2,499 or less | 181 (2.9%) | 520 (8.7%) |
| $2,500 to $4,999 | 270 (4.3%) | 372 (6.3%) |
| $5,000 to $7,499 | 91 (1.5%) | 293 (4.9%) |
| $7,500 to $9,999 | 182 (2.9%) | 298 (5.0%) |
| $10,000 to $12,499 | 304 (4.9%) | 230 (3.9%) |
| $12,500 to $14,999 | 301 (4.8%) | 282 (4.7%) |
| $15,000 to $17,499 | 144 (2.3%) | 220 (3.7%) |
| $17,500 to $19,999 | 137 (2.2%) | 292 (4.9%) |
| $20,000 to $22,499 | 339 (5.4%) | 356 (6.0%) |
| $22,500 to $24,999 | 223 (3.6%) | 174 (2.9%) |
| $25,000 to $29,999 | 443 (7.1%) | 404 (6.8%) |
| $30,000 to $34,999 | 451 (7.2%) | 431 (7.2%) |
| $35,000 to $39,999 | 240 (3.8%) | 354 (5.9%) |
| $40,000 to $44,999 | 280 (4.5%) | 324 (5.4%) |
| $45,000 to $49,999 | 227 (3.6%) | 209 (3.5%) |
| $50,000 to $54,999 | 188 (3.0%) | 306 (5.1%) |
| $55,000 to $64,999 | 645 (10.3%) | 272 (4.6%) |
| $65,000 to $74,999 | 311 (5.0%) | 227 (3.8%) |
| $75,000 to $99,999 | 741 (11.8%) | 166 (2.8%) |
| $100,000+ | 574 (9.1%) | 215 (3.6%) |
| Total | 6,272 (100.0%) | 5,945 (100.0%) |
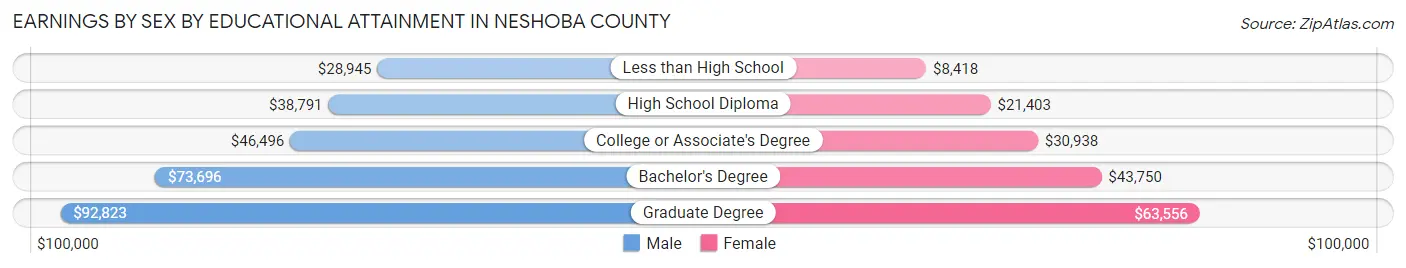
Earnings by Sex by Educational Attainment in Neshoba County
Average earnings in Neshoba County are $42,342 for men and $29,058 for women, a difference of 31.4%. Men with an educational attainment of graduate degree enjoy the highest average annual earnings of $92,823, while those with less than high school education earn the least with $28,945. Women with an educational attainment of graduate degree earn the most with the average annual earnings of $63,556, while those with less than high school education have the smallest earnings of $8,418.
| Educational Attainment | Male Income | Female Income |
| Less than High School | $28,945 | $8,418 |
| High School Diploma | $38,791 | $21,403 |
| College or Associate's Degree | $46,496 | $30,938 |
| Bachelor's Degree | $73,696 | $43,750 |
| Graduate Degree | $92,823 | $63,556 |
| Total | $42,342 | $29,058 |
Family Income in Neshoba County
Family Income Brackets in Neshoba County
According to the Neshoba County family income data, there are 1,266 families falling into the $100,000 to $149,999 income range, which is the most common income bracket and makes up 18.3% of all families. Conversely, the $200,000+ income bracket is the least frequent group with only 221 families (3.2%) belonging to this category.
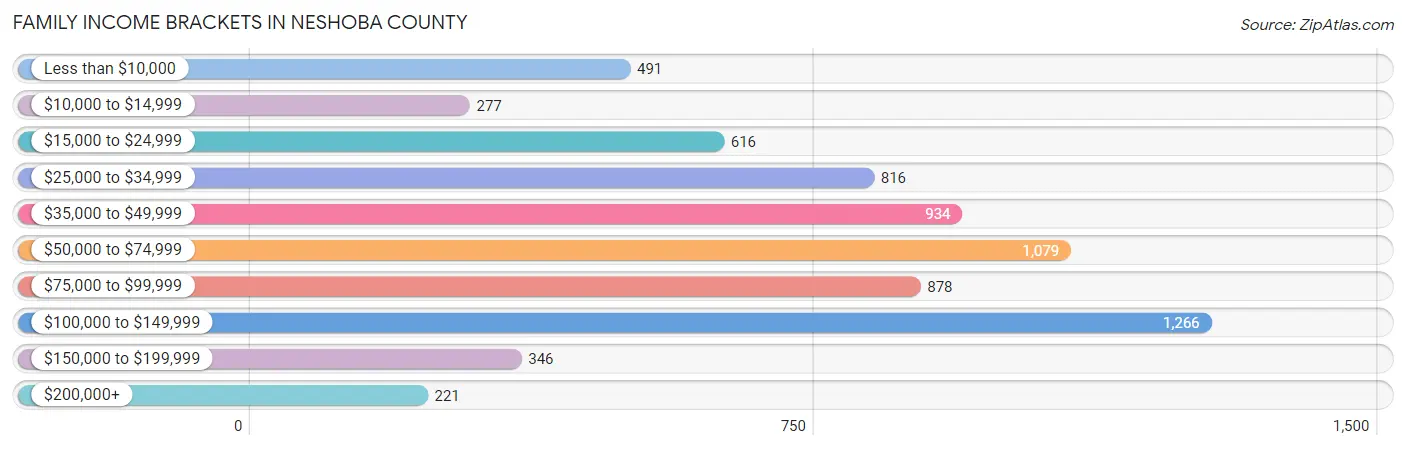
| Income Bracket | # Families | % Families |
| Less than $10,000 | 491 | 7.1% |
| $10,000 to $14,999 | 277 | 4.0% |
| $15,000 to $24,999 | 616 | 8.9% |
| $25,000 to $34,999 | 816 | 11.8% |
| $35,000 to $49,999 | 934 | 13.5% |
| $50,000 to $74,999 | 1,079 | 15.6% |
| $75,000 to $99,999 | 878 | 12.7% |
| $100,000 to $149,999 | 1,266 | 18.3% |
| $150,000 to $199,999 | 346 | 5.0% |
| $200,000+ | 221 | 3.2% |
Family Income by Famaliy Size in Neshoba County
4-person families (1,195 | 17.3%) account for the highest median family income in Neshoba County with $77,137 per family, while 2-person families (3,435 | 49.7%) have the highest median income of $25,694 per family member.
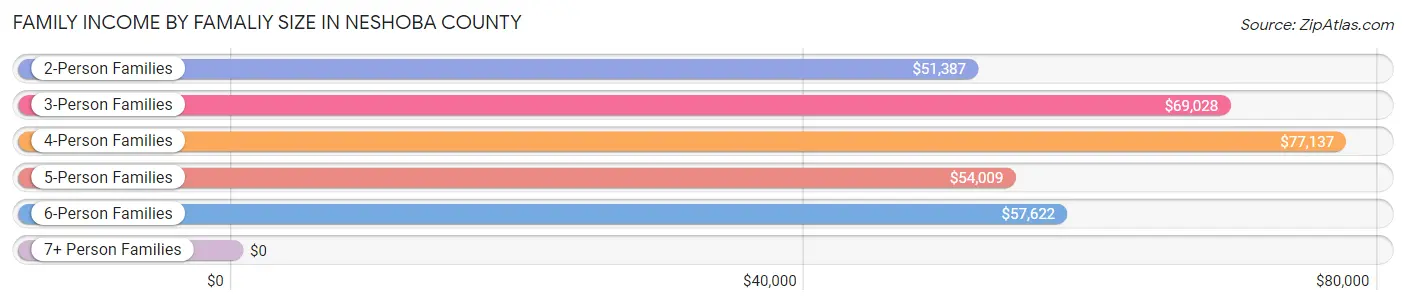
| Income Bracket | # Families | Median Income |
| 2-Person Families | 3,435 (49.7%) | $51,387 |
| 3-Person Families | 1,259 (18.2%) | $69,028 |
| 4-Person Families | 1,195 (17.3%) | $77,137 |
| 5-Person Families | 633 (9.1%) | $54,009 |
| 6-Person Families | 218 (3.2%) | $57,622 |
| 7+ Person Families | 177 (2.6%) | $0 |
| Total | 6,917 (100.0%) | $56,221 |
Family Income by Number of Earners in Neshoba County
The median family income in Neshoba County is $56,221, with families comprising 3+ earners (530) having the highest median family income of $116,316, while families with no earners (1,391) have the lowest median family income of $29,844, accounting for 7.7% and 20.1% of families, respectively.
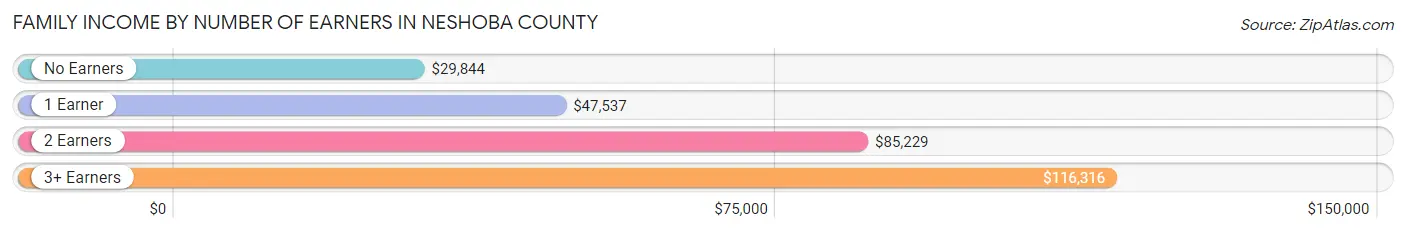
| Number of Earners | # Families | Median Income |
| No Earners | 1,391 (20.1%) | $29,844 |
| 1 Earner | 2,597 (37.6%) | $47,537 |
| 2 Earners | 2,399 (34.7%) | $85,229 |
| 3+ Earners | 530 (7.7%) | $116,316 |
| Total | 6,917 (100.0%) | $56,221 |
Household Income in Neshoba County
Household Income Brackets in Neshoba County
With 1,591 households falling in the category, the $50,000 to $74,999 income range is the most frequent in Neshoba County, accounting for 15.6% of all households. In contrast, only 255 households (2.5%) fall into the $200,000+ income bracket, making it the least populous group.
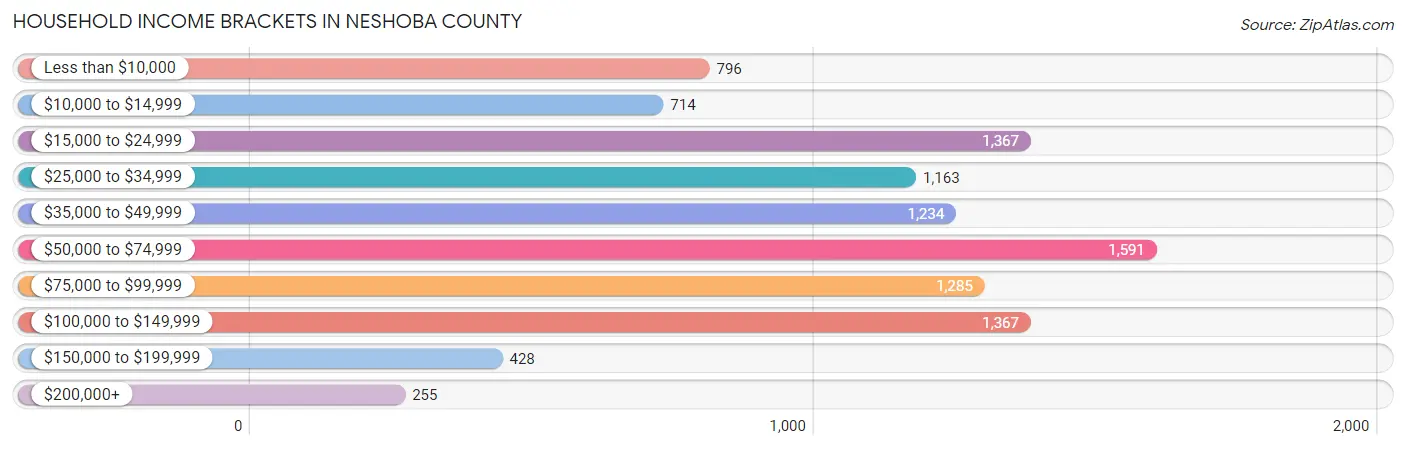
| Income Bracket | # Households | % Households |
| Less than $10,000 | 796 | 7.8% |
| $10,000 to $14,999 | 714 | 7.0% |
| $15,000 to $24,999 | 1,367 | 13.4% |
| $25,000 to $34,999 | 1,163 | 11.4% |
| $35,000 to $49,999 | 1,234 | 12.1% |
| $50,000 to $74,999 | 1,591 | 15.6% |
| $75,000 to $99,999 | 1,285 | 12.6% |
| $100,000 to $149,999 | 1,367 | 13.4% |
| $150,000 to $199,999 | 428 | 4.2% |
| $200,000+ | 255 | 2.5% |
Household Income by Householder Age in Neshoba County
The median household income in Neshoba County is $47,400, with the highest median household income of $53,465 found in the 25 to 44 years age bracket for the primary householder. A total of 3,014 households (29.5%) fall into this category. Meanwhile, the 15 to 24 years age bracket for the primary householder has the lowest median household income of $0, with 511 households (5.0%) in this group.
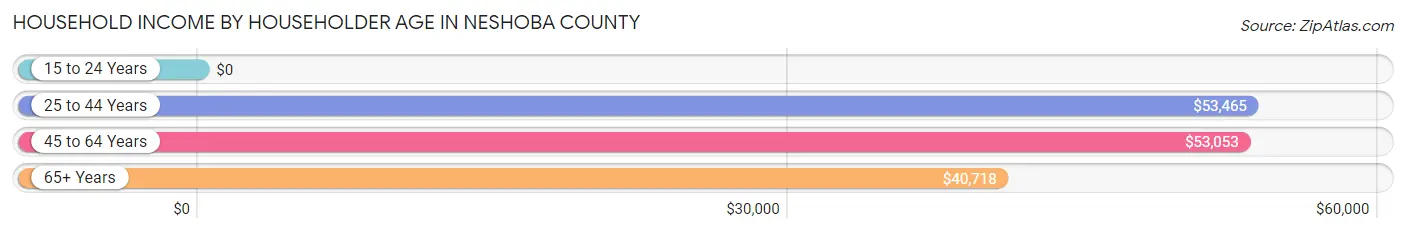
| Income Bracket | # Households | Median Income |
| 15 to 24 Years | 511 (5.0%) | $0 |
| 25 to 44 Years | 3,014 (29.5%) | $53,465 |
| 45 to 64 Years | 3,796 (37.2%) | $53,053 |
| 65+ Years | 2,878 (28.2%) | $40,718 |
| Total | 10,199 (100.0%) | $47,400 |
Poverty in Neshoba County
Income Below Poverty by Sex and Age in Neshoba County
With 27.0% poverty level for males and 28.9% for females among the residents of Neshoba County, under 5 year old males and under 5 year old females are the most vulnerable to poverty, with 525 males (58.5%) and 677 females (57.2%) in their respective age groups living below the poverty level.
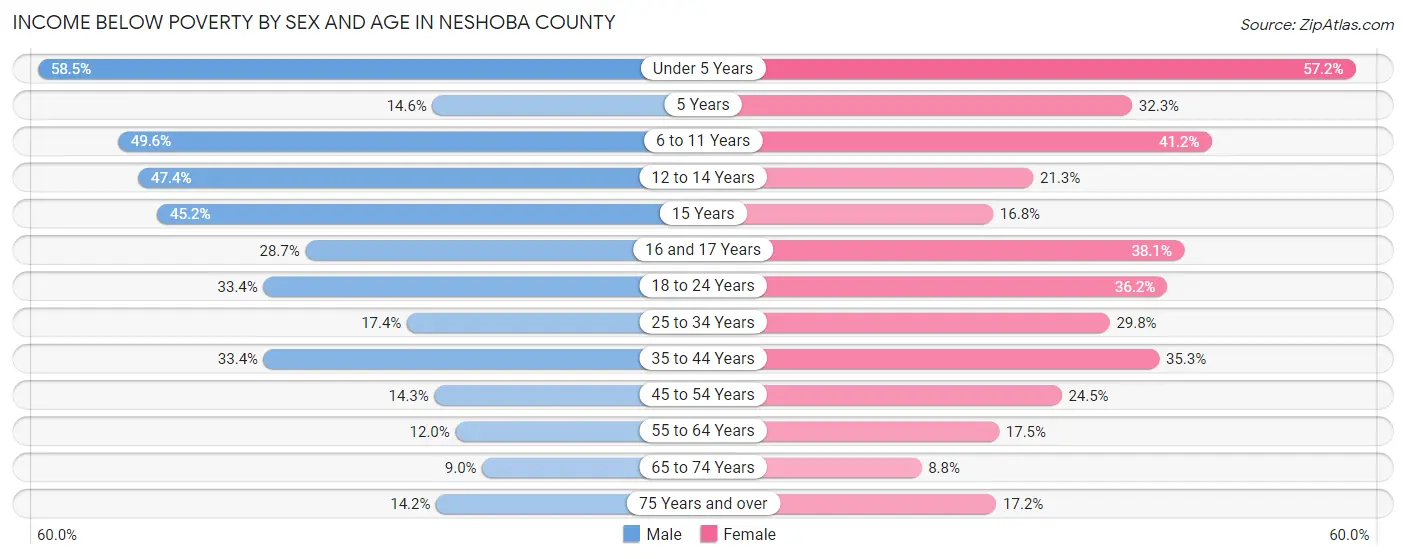
| Age Bracket | Male | Female |
| Under 5 Years | 525 (58.5%) | 677 (57.2%) |
| 5 Years | 32 (14.5%) | 74 (32.3%) |
| 6 to 11 Years | 575 (49.6%) | 500 (41.1%) |
| 12 to 14 Years | 340 (47.3%) | 169 (21.3%) |
| 15 Years | 76 (45.2%) | 35 (16.8%) |
| 16 and 17 Years | 178 (28.7%) | 171 (38.1%) |
| 18 to 24 Years | 447 (33.4%) | 533 (36.2%) |
| 25 to 34 Years | 278 (17.4%) | 463 (29.8%) |
| 35 to 44 Years | 554 (33.4%) | 665 (35.3%) |
| 45 to 54 Years | 214 (14.3%) | 429 (24.5%) |
| 55 to 64 Years | 194 (12.0%) | 297 (17.5%) |
| 65 to 74 Years | 116 (9.0%) | 132 (8.8%) |
| 75 Years and over | 90 (14.1%) | 174 (17.2%) |
| Total | 3,619 (27.0%) | 4,319 (28.9%) |
Income Above Poverty by Sex and Age in Neshoba County
According to the poverty statistics in Neshoba County, males aged 65 to 74 years and females aged 65 to 74 years are the age groups that are most secure financially, with 91.0% of males and 91.2% of females in these age groups living above the poverty line.
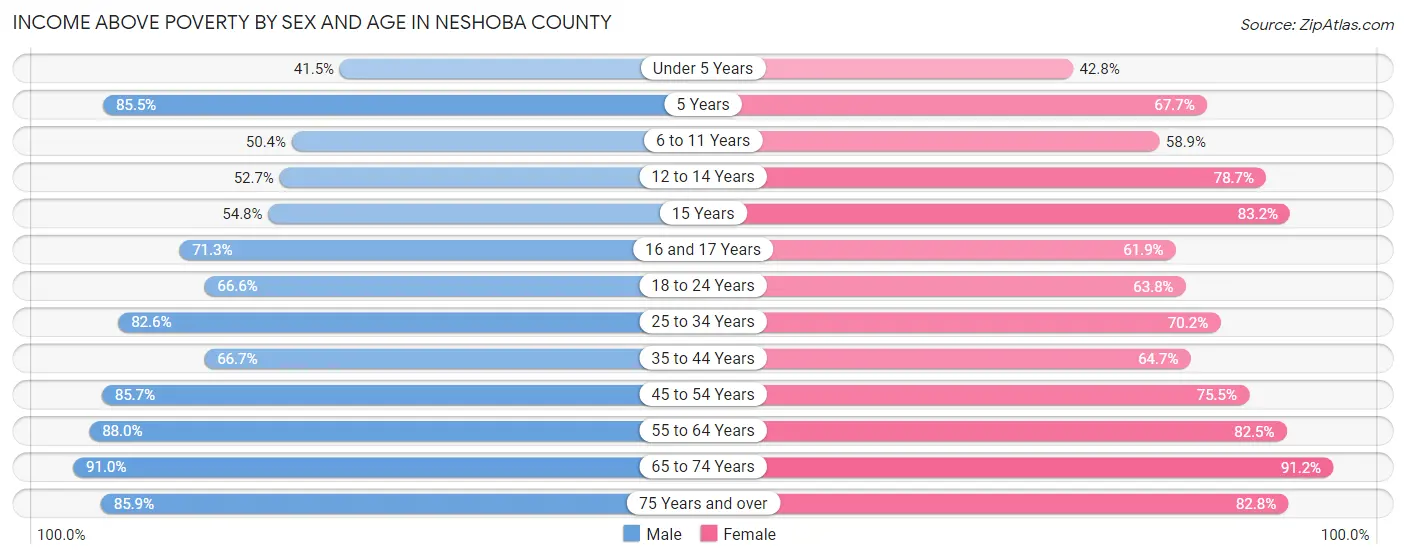
| Age Bracket | Male | Female |
| Under 5 Years | 372 (41.5%) | 507 (42.8%) |
| 5 Years | 188 (85.5%) | 155 (67.7%) |
| 6 to 11 Years | 584 (50.4%) | 715 (58.9%) |
| 12 to 14 Years | 378 (52.6%) | 624 (78.7%) |
| 15 Years | 92 (54.8%) | 173 (83.2%) |
| 16 and 17 Years | 442 (71.3%) | 278 (61.9%) |
| 18 to 24 Years | 892 (66.6%) | 938 (63.8%) |
| 25 to 34 Years | 1,321 (82.6%) | 1,090 (70.2%) |
| 35 to 44 Years | 1,107 (66.6%) | 1,217 (64.7%) |
| 45 to 54 Years | 1,278 (85.7%) | 1,325 (75.5%) |
| 55 to 64 Years | 1,422 (88.0%) | 1,401 (82.5%) |
| 65 to 74 Years | 1,171 (91.0%) | 1,361 (91.2%) |
| 75 Years and over | 546 (85.9%) | 838 (82.8%) |
| Total | 9,793 (73.0%) | 10,622 (71.1%) |
Income Below Poverty Among Married-Couple Families in Neshoba County
The poverty statistics for married-couple families in Neshoba County show that 11.1% or 494 of the total 4,470 families live below the poverty line. Families with 5 or more children have the highest poverty rate of 76.4%, comprising of 42 families. On the other hand, families with no children have the lowest poverty rate of 4.8%, which includes 125 families.
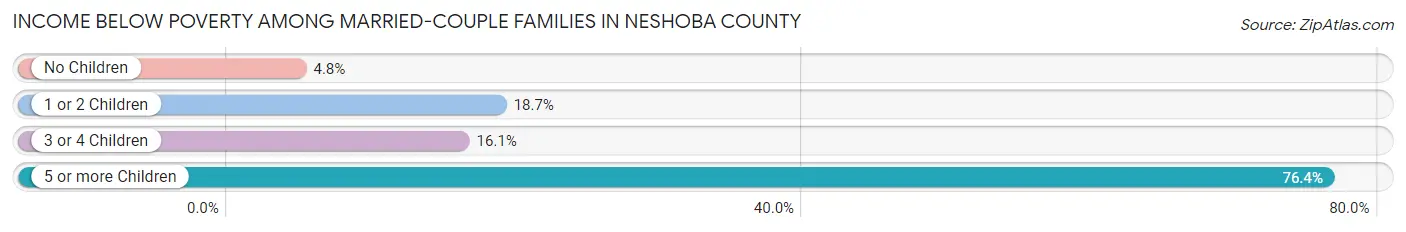
| Children | Above Poverty | Below Poverty |
| No Children | 2,495 (95.2%) | 125 (4.8%) |
| 1 or 2 Children | 1,182 (81.3%) | 272 (18.7%) |
| 3 or 4 Children | 286 (83.9%) | 55 (16.1%) |
| 5 or more Children | 13 (23.6%) | 42 (76.4%) |
| Total | 3,976 (88.9%) | 494 (11.1%) |
Income Below Poverty Among Single-Parent Households in Neshoba County
According to the poverty data in Neshoba County, 23.1% or 137 single-father households and 44.5% or 825 single-mother households are living below the poverty line. Among single-father households, those with 3 or 4 children have the highest poverty rate, with 52 households (74.3%) experiencing poverty. Likewise, among single-mother households, those with 5 or more children have the highest poverty rate, with 53 households (100.0%) falling below the poverty line.
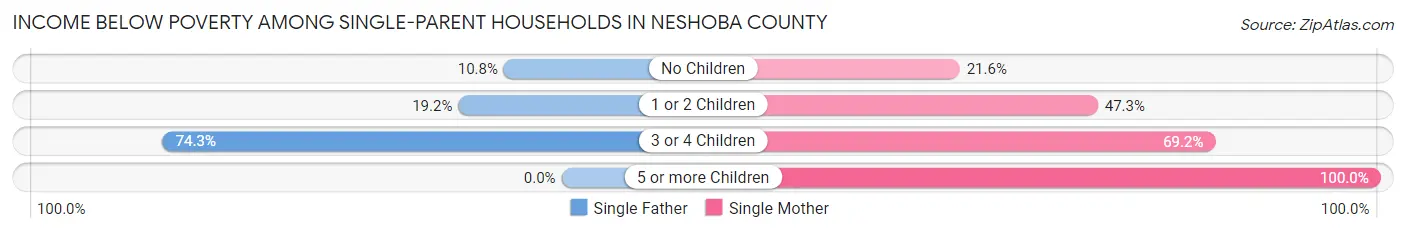
| Children | Single Father | Single Mother |
| No Children | 20 (10.7%) | 152 (21.6%) |
| 1 or 2 Children | 65 (19.2%) | 301 (47.3%) |
| 3 or 4 Children | 52 (74.3%) | 319 (69.2%) |
| 5 or more Children | 0 (0.0%) | 53 (100.0%) |
| Total | 137 (23.1%) | 825 (44.5%) |
Income Below Poverty Among Married-Couple vs Single-Parent Households in Neshoba County
The poverty data for Neshoba County shows that 494 of the married-couple family households (11.1%) and 962 of the single-parent households (39.3%) are living below the poverty level. Within the married-couple family households, those with 5 or more children have the highest poverty rate, with 42 households (76.4%) falling below the poverty line. Among the single-parent households, those with 5 or more children have the highest poverty rate, with 53 household (100.0%) living below poverty.
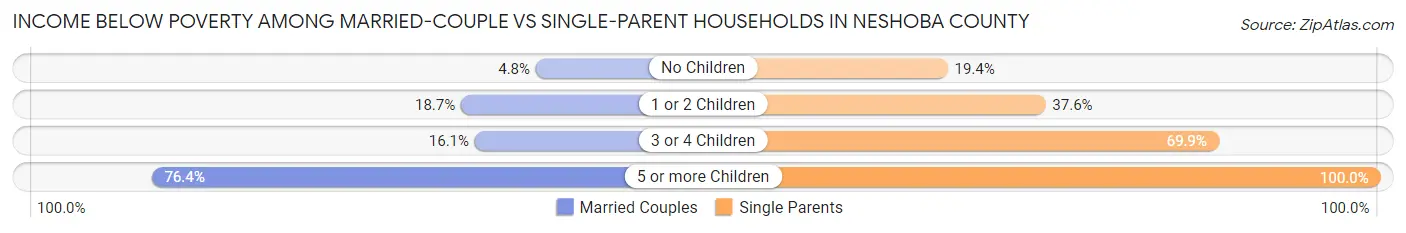
| Children | Married-Couple Families | Single-Parent Households |
| No Children | 125 (4.8%) | 172 (19.4%) |
| 1 or 2 Children | 272 (18.7%) | 366 (37.6%) |
| 3 or 4 Children | 55 (16.1%) | 371 (69.9%) |
| 5 or more Children | 42 (76.4%) | 53 (100.0%) |
| Total | 494 (11.1%) | 962 (39.3%) |
Race in Neshoba County
The most populous races in Neshoba County are White / Caucasian (16,755 | 57.8%), Black / African American (6,596 | 22.8%), and Native / Alaskan (4,631 | 16.0%).
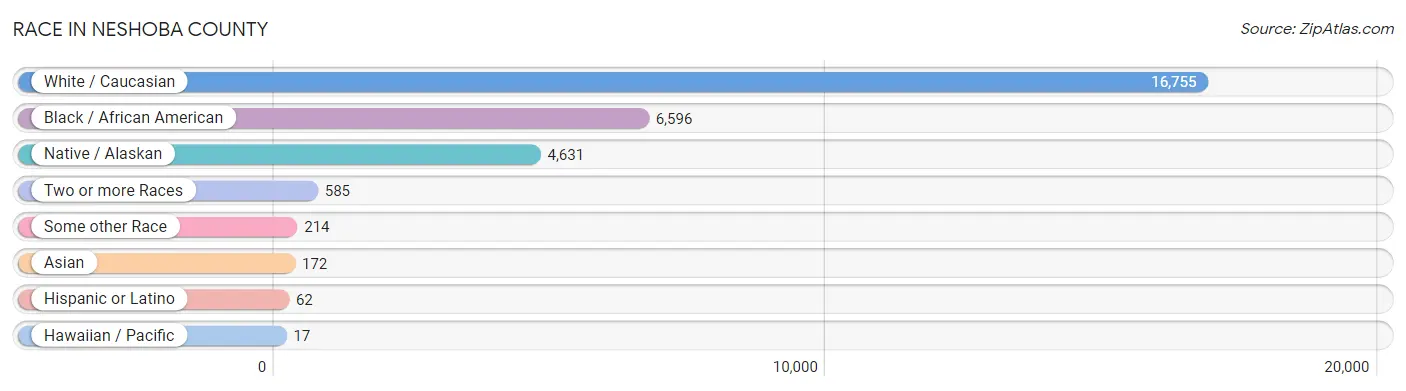
| Race | # Population | % Population |
| Asian | 172 | 0.6% |
| Black / African American | 6,596 | 22.8% |
| Hawaiian / Pacific | 17 | 0.1% |
| Hispanic or Latino | 62 | 0.2% |
| Native / Alaskan | 4,631 | 16.0% |
| White / Caucasian | 16,755 | 57.8% |
| Two or more Races | 585 | 2.0% |
| Some other Race | 214 | 0.7% |
| Total | 28,970 | 100.0% |
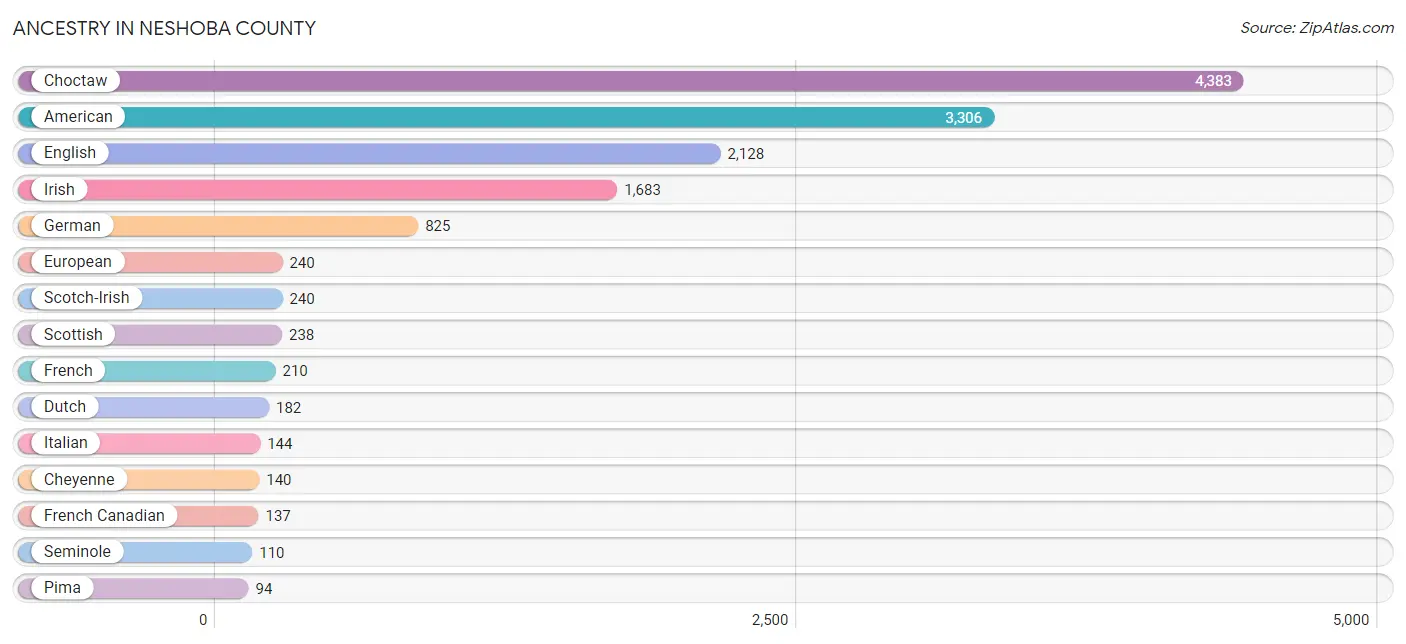
Ancestry in Neshoba County
The most populous ancestries reported in Neshoba County are Choctaw (4,383 | 15.1%), American (3,306 | 11.4%), English (2,128 | 7.3%), Irish (1,683 | 5.8%), and German (825 | 2.9%), together accounting for 42.5% of all Neshoba County residents.
| Ancestry | # Population | % Population |
| African | 38 | 0.1% |
| American | 3,306 | 11.4% |
| Apache | 71 | 0.3% |
| Austrian | 5 | 0.0% |
| Bhutanese | 12 | 0.0% |
| British | 23 | 0.1% |
| Cherokee | 45 | 0.2% |
| Cheyenne | 140 | 0.5% |
| Choctaw | 4,383 | 15.1% |
| Czech | 3 | 0.0% |
| Dutch | 182 | 0.6% |
| Eastern European | 8 | 0.0% |
| English | 2,128 | 7.3% |
| European | 240 | 0.8% |
| French | 210 | 0.7% |
| French Canadian | 137 | 0.5% |
| German | 825 | 2.9% |
| Indian (Asian) | 13 | 0.0% |
| Irish | 1,683 | 5.8% |
| Italian | 144 | 0.5% |
| Korean | 72 | 0.3% |
| Mexican | 27 | 0.1% |
| Native Hawaiian | 25 | 0.1% |
| Northern European | 23 | 0.1% |
| Norwegian | 56 | 0.2% |
| Pakistani | 33 | 0.1% |
| Pima | 94 | 0.3% |
| Polish | 45 | 0.2% |
| Puerto Rican | 21 | 0.1% |
| Russian | 20 | 0.1% |
| Scotch-Irish | 240 | 0.8% |
| Scottish | 238 | 0.8% |
| Seminole | 110 | 0.4% |
| Spanish | 14 | 0.1% |
| Sri Lankan | 83 | 0.3% |
| Subsaharan African | 38 | 0.1% |
| Swedish | 9 | 0.0% |
| Thai | 32 | 0.1% |
| Welsh | 36 | 0.1% | View All 39 Rows |
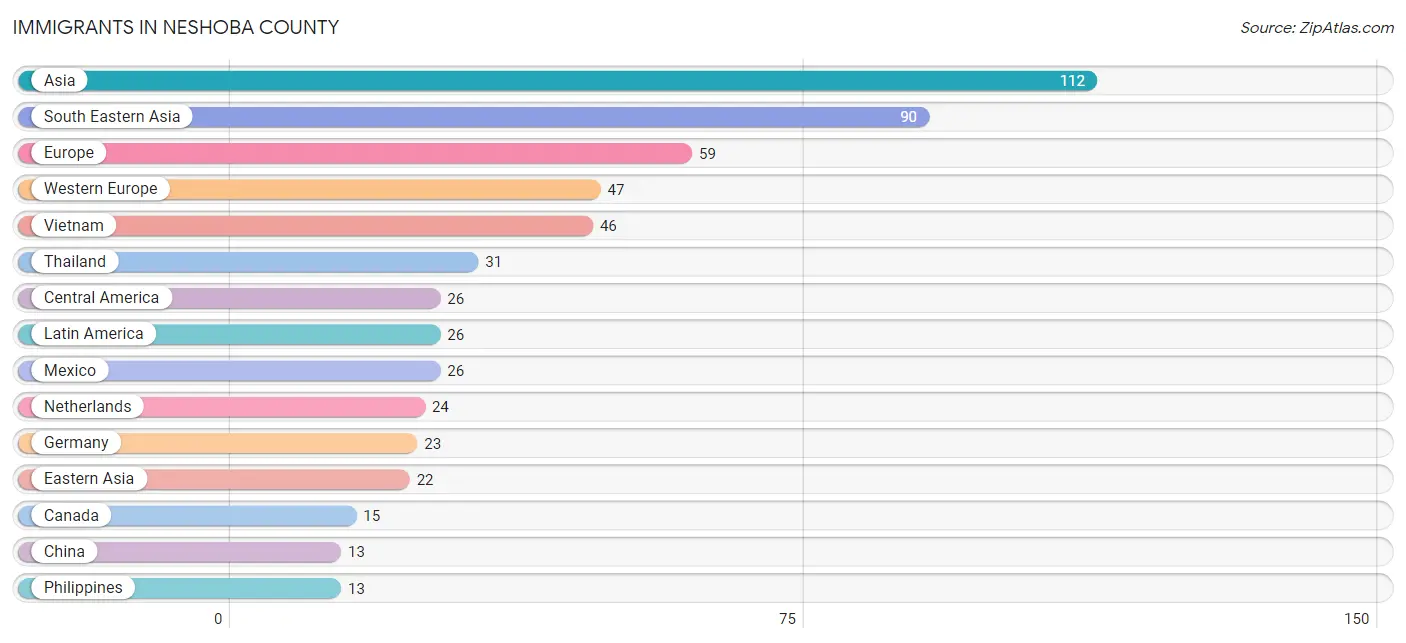
Immigrants in Neshoba County
The most numerous immigrant groups reported in Neshoba County came from Asia (112 | 0.4%), South Eastern Asia (90 | 0.3%), Europe (59 | 0.2%), Western Europe (47 | 0.2%), and Vietnam (46 | 0.2%), together accounting for 1.2% of all Neshoba County residents.
| Immigration Origin | # Population | % Population |
| Asia | 112 | 0.4% |
| Canada | 15 | 0.1% |
| Central America | 26 | 0.1% |
| China | 13 | 0.0% |
| Eastern Asia | 22 | 0.1% |
| Eastern Europe | 12 | 0.0% |
| Europe | 59 | 0.2% |
| Germany | 23 | 0.1% |
| Japan | 9 | 0.0% |
| Latin America | 26 | 0.1% |
| Mexico | 26 | 0.1% |
| Netherlands | 24 | 0.1% |
| Philippines | 13 | 0.0% |
| Russia | 12 | 0.0% |
| South Eastern Asia | 90 | 0.3% |
| Thailand | 31 | 0.1% |
| Vietnam | 46 | 0.2% |
| Western Europe | 47 | 0.2% | View All 18 Rows |
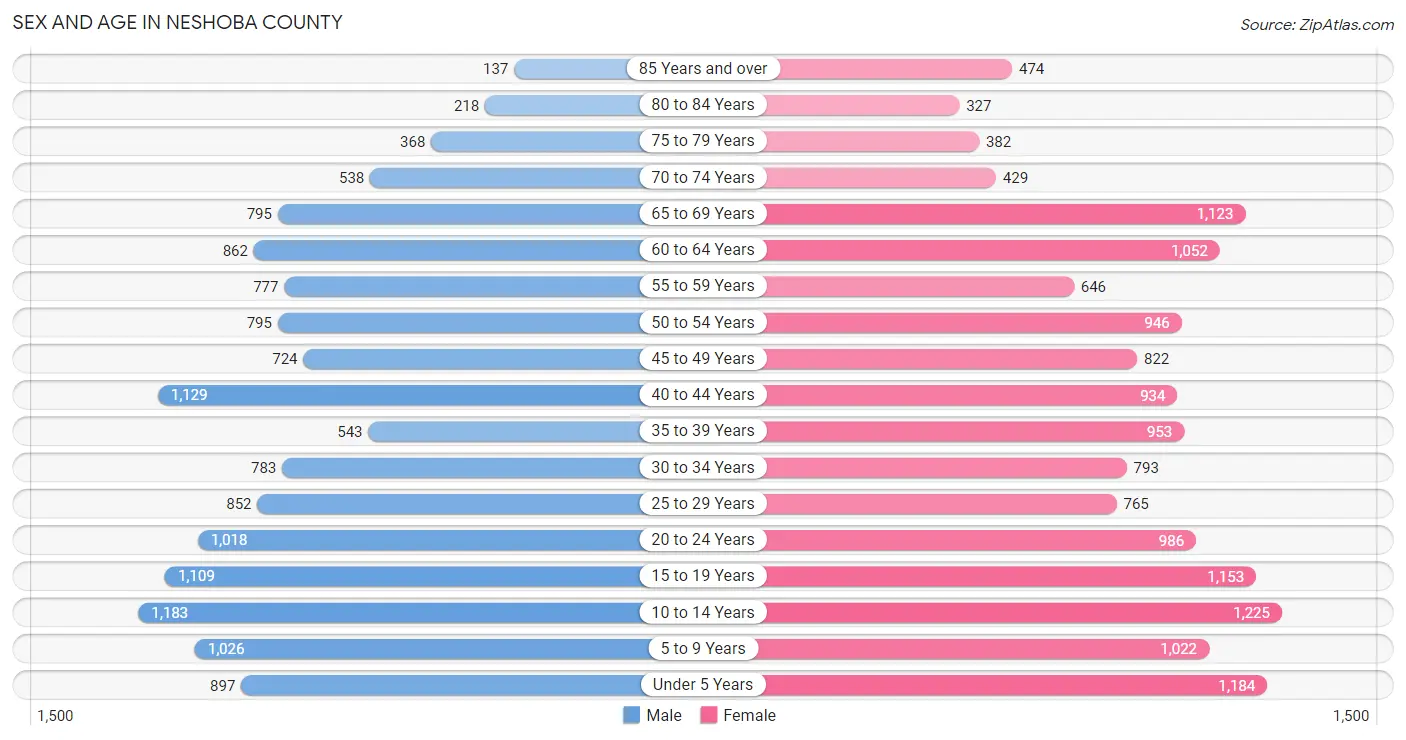
Sex and Age in Neshoba County
Sex and Age in Neshoba County
The most populous age groups in Neshoba County are 10 to 14 Years (1,183 | 8.6%) for men and 10 to 14 Years (1,225 | 8.1%) for women.
| Age Bracket | Male | Female |
| Under 5 Years | 897 (6.5%) | 1,184 (7.8%) |
| 5 to 9 Years | 1,026 (7.5%) | 1,022 (6.7%) |
| 10 to 14 Years | 1,183 (8.6%) | 1,225 (8.1%) |
| 15 to 19 Years | 1,109 (8.1%) | 1,153 (7.6%) |
| 20 to 24 Years | 1,018 (7.4%) | 986 (6.5%) |
| 25 to 29 Years | 852 (6.2%) | 765 (5.0%) |
| 30 to 34 Years | 783 (5.7%) | 793 (5.2%) |
| 35 to 39 Years | 543 (4.0%) | 953 (6.3%) |
| 40 to 44 Years | 1,129 (8.2%) | 934 (6.1%) |
| 45 to 49 Years | 724 (5.3%) | 822 (5.4%) |
| 50 to 54 Years | 795 (5.8%) | 946 (6.2%) |
| 55 to 59 Years | 777 (5.7%) | 646 (4.3%) |
| 60 to 64 Years | 862 (6.3%) | 1,052 (6.9%) |
| 65 to 69 Years | 795 (5.8%) | 1,123 (7.4%) |
| 70 to 74 Years | 538 (3.9%) | 429 (2.8%) |
| 75 to 79 Years | 368 (2.7%) | 382 (2.5%) |
| 80 to 84 Years | 218 (1.6%) | 327 (2.1%) |
| 85 Years and over | 137 (1.0%) | 474 (3.1%) |
| Total | 13,754 (100.0%) | 15,216 (100.0%) |
Families and Households in Neshoba County
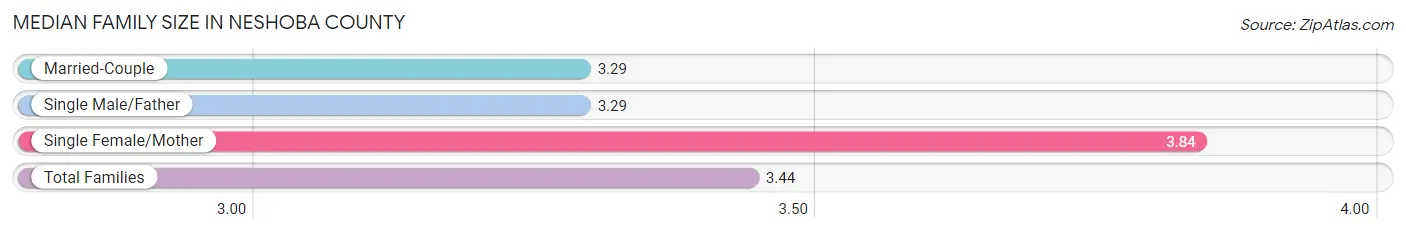
Median Family Size in Neshoba County
The median family size in Neshoba County is 3.44 persons per family, with single female/mother families (1,853 | 26.8%) accounting for the largest median family size of 3.84 persons per family. On the other hand, married-couple families (4,470 | 64.6%) represent the smallest median family size with 3.29 persons per family.
| Family Type | # Families | Family Size |
| Married-Couple | 4,470 (64.6%) | 3.29 |
| Single Male/Father | 594 (8.6%) | 3.29 |
| Single Female/Mother | 1,853 (26.8%) | 3.84 |
| Total Families | 6,917 (100.0%) | 3.44 |
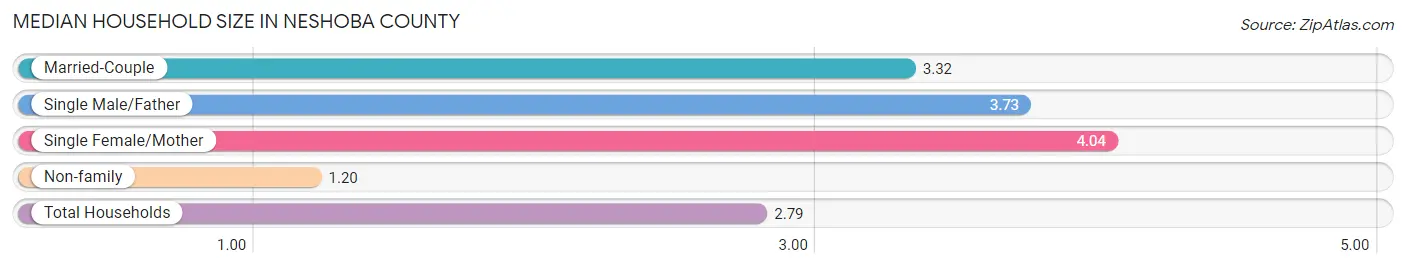
Median Household Size in Neshoba County
The median household size in Neshoba County is 2.79 persons per household, with single female/mother households (1,853 | 18.2%) accounting for the largest median household size of 4.04 persons per household. non-family households (3,282 | 32.2%) represent the smallest median household size with 1.20 persons per household.
| Household Type | # Households | Household Size |
| Married-Couple | 4,470 (43.8%) | 3.32 |
| Single Male/Father | 594 (5.8%) | 3.73 |
| Single Female/Mother | 1,853 (18.2%) | 4.04 |
| Non-family | 3,282 (32.2%) | 1.20 |
| Total Households | 10,199 (100.0%) | 2.79 |
Household Size by Marriage Status in Neshoba County
Out of a total of 10,199 households in Neshoba County, 6,917 (67.8%) are family households, while 3,282 (32.2%) are nonfamily households. The most numerous type of family households are 2-person households, comprising 3,100, and the most common type of nonfamily households are 1-person households, comprising 2,895.
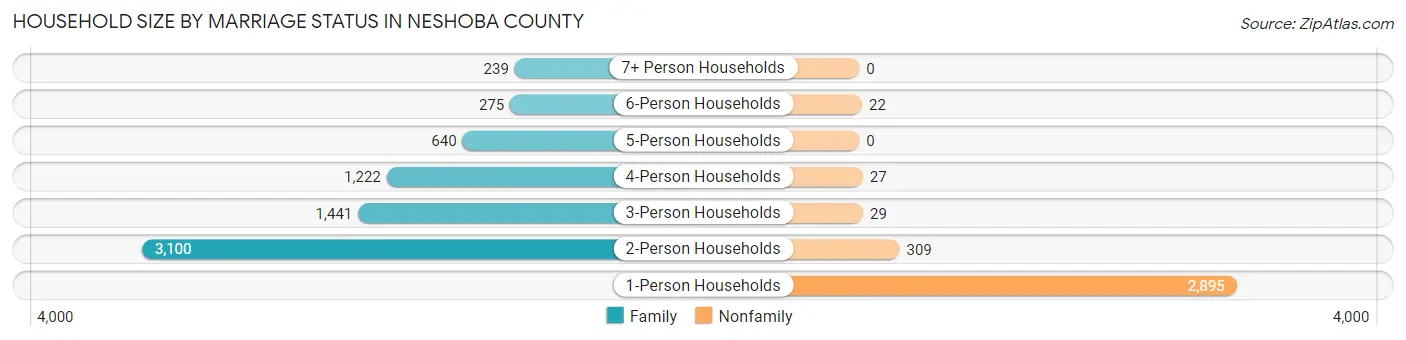
| Household Size | Family Households | Nonfamily Households |
| 1-Person Households | - | 2,895 (28.4%) |
| 2-Person Households | 3,100 (30.4%) | 309 (3.0%) |
| 3-Person Households | 1,441 (14.1%) | 29 (0.3%) |
| 4-Person Households | 1,222 (12.0%) | 27 (0.3%) |
| 5-Person Households | 640 (6.3%) | 0 (0.0%) |
| 6-Person Households | 275 (2.7%) | 22 (0.2%) |
| 7+ Person Households | 239 (2.3%) | 0 (0.0%) |
| Total | 6,917 (67.8%) | 3,282 (32.2%) |
Female Fertility in Neshoba County
Fertility by Age in Neshoba County
Average fertility rate in Neshoba County is 81.0 births per 1,000 women. Women in the age bracket of 20 to 34 years have the highest fertility rate with 144.0 births per 1,000 women. Women in the age bracket of 20 to 34 years acount for 68.8% of all women with births.
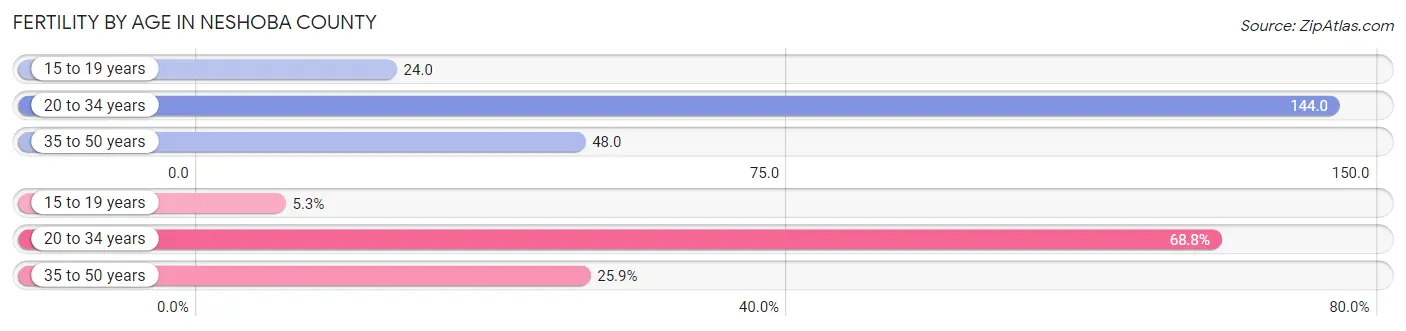
| Age Bracket | Women with Births | Births / 1,000 Women |
| 15 to 19 years | 28 (5.3%) | 24.0 |
| 20 to 34 years | 366 (68.8%) | 144.0 |
| 35 to 50 years | 138 (25.9%) | 48.0 |
| Total | 532 (100.0%) | 81.0 |
Fertility by Age by Marriage Status in Neshoba County
50.9% of women with births (532) in Neshoba County are married. The highest percentage of unmarried women with births falls into 15 to 19 years age bracket with 100.0% of them unmarried at the time of birth, while the lowest percentage of unmarried women with births belong to 20 to 34 years age bracket with 39.3% of them unmarried.
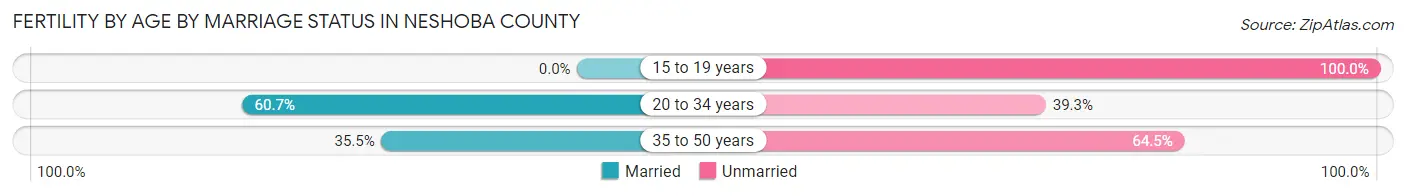
| Age Bracket | Married | Unmarried |
| 15 to 19 years | 0 (0.0%) | 28 (100.0%) |
| 20 to 34 years | 222 (60.7%) | 144 (39.3%) |
| 35 to 50 years | 49 (35.5%) | 89 (64.5%) |
| Total | 271 (50.9%) | 261 (49.1%) |
Fertility by Education in Neshoba County
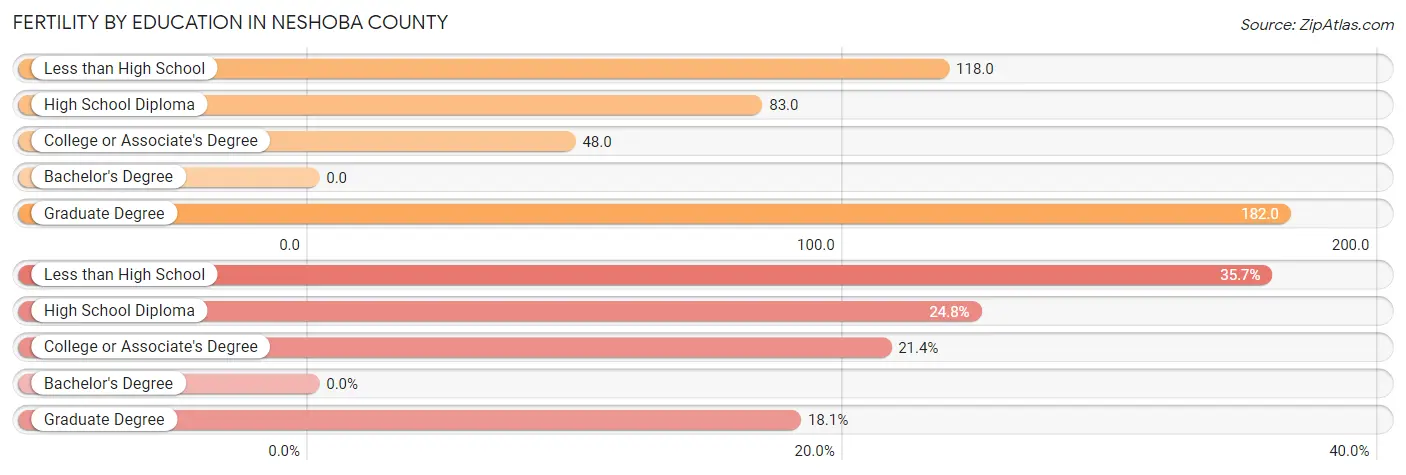
| Educational Attainment | Women with Births | Births / 1,000 Women |
| Less than High School | 190 (35.7%) | 118.0 |
| High School Diploma | 132 (24.8%) | 83.0 |
| College or Associate's Degree | 114 (21.4%) | 48.0 |
| Bachelor's Degree | 0 (0.0%) | 0.0 |
| Graduate Degree | 96 (18.0%) | 182.0 |
| Total | 532 (100.0%) | 81.0 |
Fertility by Education by Marriage Status in Neshoba County
49.1% of women with births in Neshoba County are unmarried. Women with the educational attainment of graduate degree are most likely to be married with 100.0% of them married at childbirth, while women with the educational attainment of high school diploma are least likely to be married with 100.0% of them unmarried at childbirth.
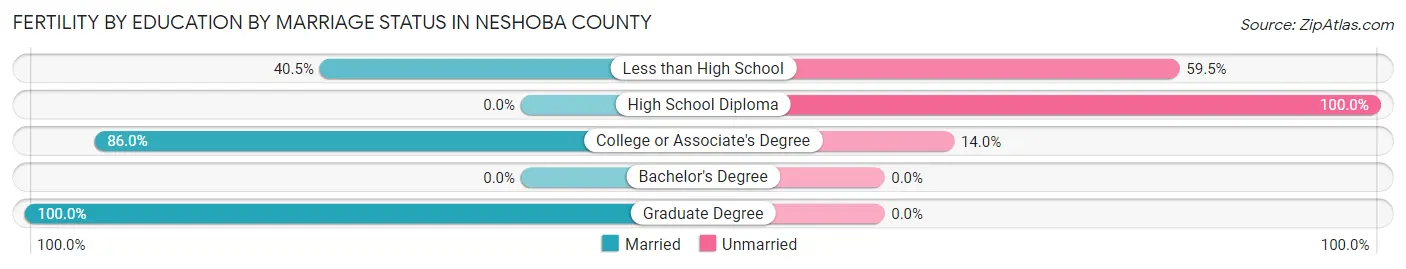
| Educational Attainment | Married | Unmarried |
| Less than High School | 77 (40.5%) | 113 (59.5%) |
| High School Diploma | 0 (0.0%) | 132 (100.0%) |
| College or Associate's Degree | 98 (86.0%) | 16 (14.0%) |
| Bachelor's Degree | 0 (0.0%) | 0 (0.0%) |
| Graduate Degree | 96 (100.0%) | 0 (0.0%) |
| Total | 271 (50.9%) | 261 (49.1%) |
Employment Characteristics in Neshoba County
Employment by Class of Employer in Neshoba County
Among the 10,776 employed individuals in Neshoba County, private company employees (6,381 | 59.2%), federal government employees (1,281 | 11.9%), and local government employees (913 | 8.5%) make up the most common classes of employment.
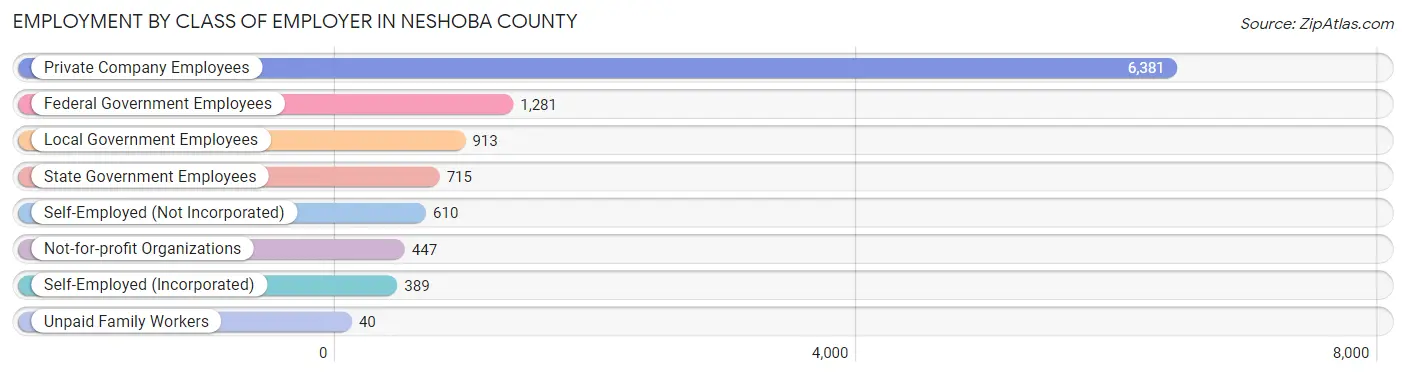
| Employer Class | # Employees | % Employees |
| Private Company Employees | 6,381 | 59.2% |
| Self-Employed (Incorporated) | 389 | 3.6% |
| Self-Employed (Not Incorporated) | 610 | 5.7% |
| Not-for-profit Organizations | 447 | 4.2% |
| Local Government Employees | 913 | 8.5% |
| State Government Employees | 715 | 6.6% |
| Federal Government Employees | 1,281 | 11.9% |
| Unpaid Family Workers | 40 | 0.4% |
| Total | 10,776 | 100.0% |
Employment Status by Age in Neshoba County
According to the labor force statistics for Neshoba County, out of the total population over 16 years of age (22,051), 55.5% or 12,238 individuals are in the labor force, with 9.3% or 1,138 of them unemployed. The age group with the highest labor force participation rate is 30 to 34 years, with 85.0% or 1,340 individuals in the labor force. Within the labor force, the 16 to 19 years age range has the highest percentage of unemployed individuals, with 21.2% or 109 of them being unemployed.
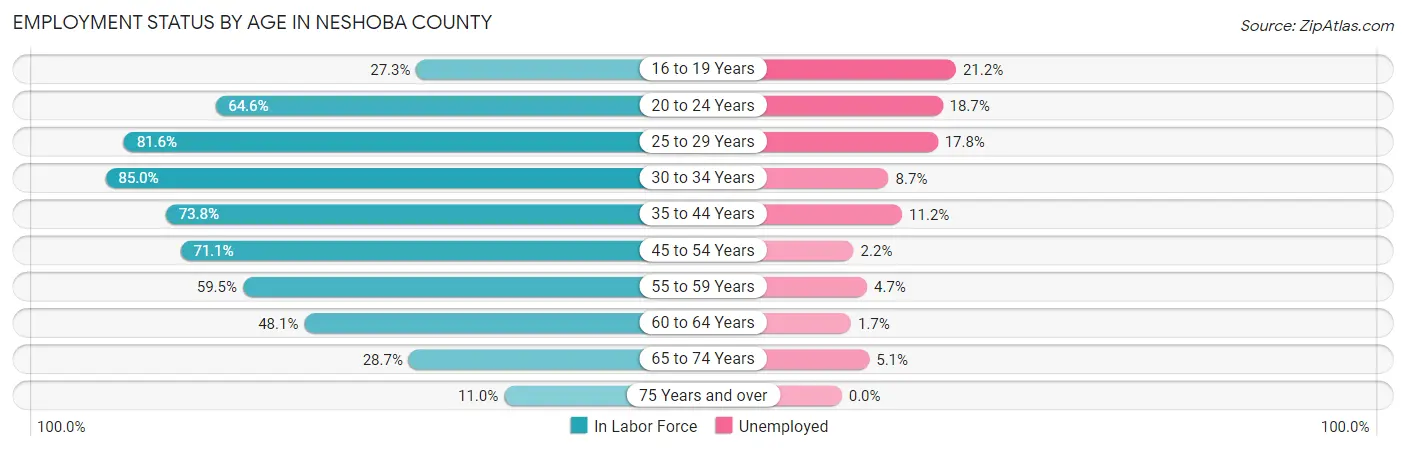
| Age Bracket | In Labor Force | Unemployed |
| 16 to 19 Years | 513 (27.3%) | 109 (21.2%) |
| 20 to 24 Years | 1,295 (64.6%) | 242 (18.7%) |
| 25 to 29 Years | 1,319 (81.6%) | 235 (17.8%) |
| 30 to 34 Years | 1,340 (85.0%) | 117 (8.7%) |
| 35 to 44 Years | 2,627 (73.8%) | 294 (11.2%) |
| 45 to 54 Years | 2,337 (71.1%) | 51 (2.2%) |
| 55 to 59 Years | 847 (59.5%) | 40 (4.7%) |
| 60 to 64 Years | 921 (48.1%) | 16 (1.7%) |
| 65 to 74 Years | 828 (28.7%) | 42 (5.1%) |
| 75 Years and over | 210 (11.0%) | 0 (0.0%) |
| Total | 12,238 (55.5%) | 1,138 (9.3%) |
Employment Status by Educational Attainment in Neshoba County
According to labor force statistics for Neshoba County, 70.2% of individuals (9,390) out of the total population between 25 and 64 years of age (13,376) are in the labor force, with 8.0% or 751 of them being unemployed. The group with the highest labor force participation rate are those with the educational attainment of bachelor's degree or higher, with 79.9% or 1,660 individuals in the labor force. Within the labor force, individuals with high school diploma education have the highest percentage of unemployment, with 12.1% or 353 of them being unemployed.
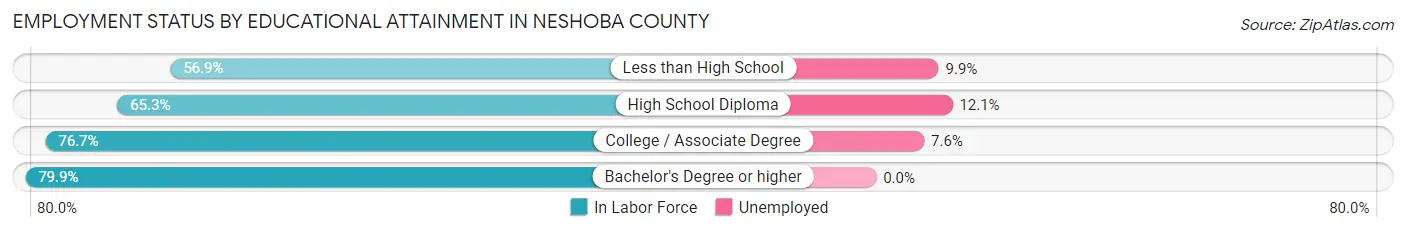
| Educational Attainment | In Labor Force | Unemployed |
| Less than High School | 1,239 (56.9%) | 216 (9.9%) |
| High School Diploma | 2,916 (65.3%) | 540 (12.1%) |
| College / Associate Degree | 3,570 (76.7%) | 354 (7.6%) |
| Bachelor's Degree or higher | 1,660 (79.9%) | 0 (0.0%) |
| Total | 9,390 (70.2%) | 1,070 (8.0%) |
Employment Occupations by Sex in Neshoba County
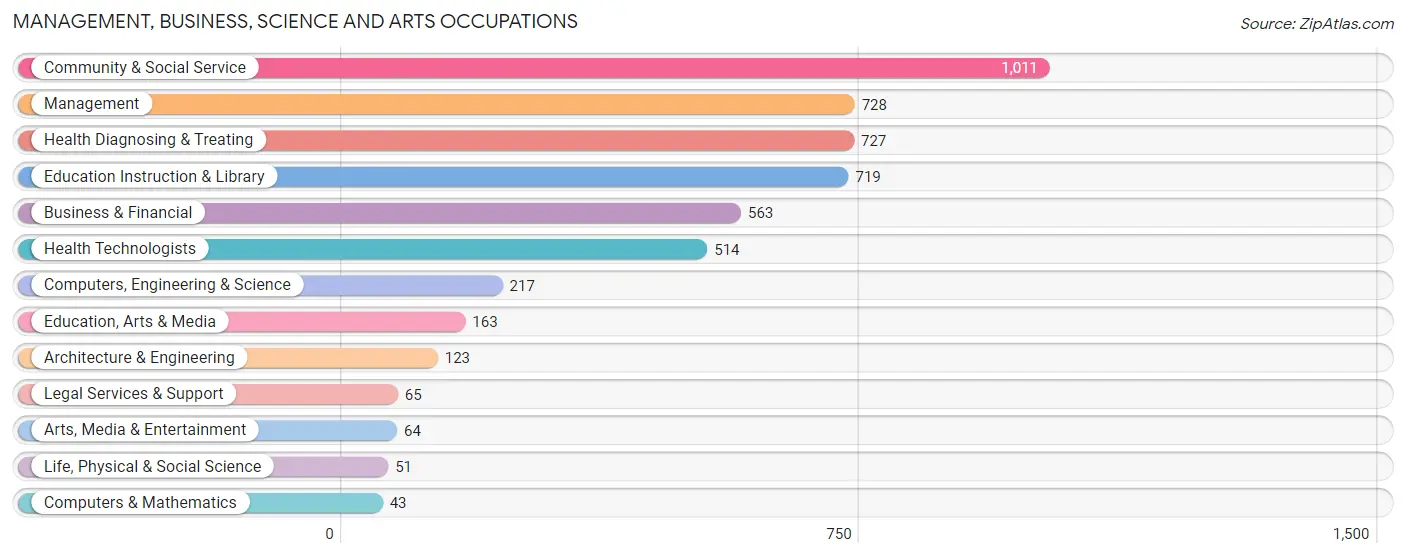
Management, Business, Science and Arts Occupations
The most common Management, Business, Science and Arts occupations in Neshoba County are Community & Social Service (1,011 | 9.2%), Management (728 | 6.6%), Health Diagnosing & Treating (727 | 6.6%), Education Instruction & Library (719 | 6.5%), and Business & Financial (563 | 5.1%).
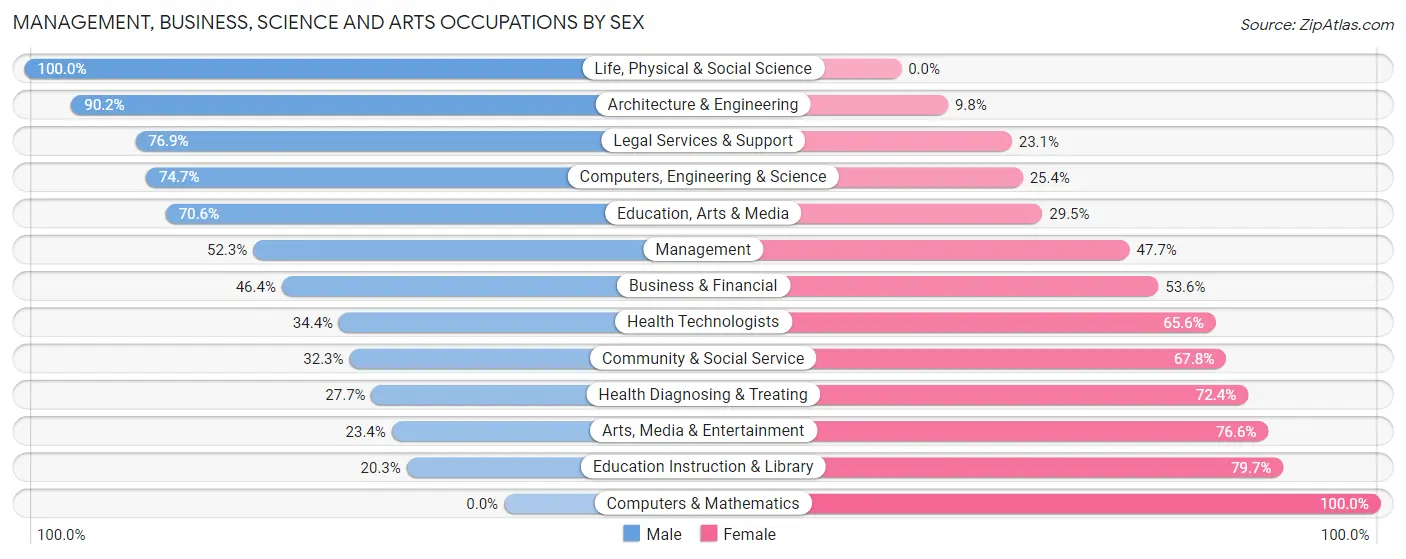
Management, Business, Science and Arts Occupations by Sex
Within the Management, Business, Science and Arts occupations in Neshoba County, the most male-oriented occupations are Life, Physical & Social Science (100.0%), Architecture & Engineering (90.2%), and Legal Services & Support (76.9%), while the most female-oriented occupations are Computers & Mathematics (100.0%), Education Instruction & Library (79.7%), and Arts, Media & Entertainment (76.6%).
| Occupation | Male | Female |
| Management | 381 (52.3%) | 347 (47.7%) |
| Business & Financial | 261 (46.4%) | 302 (53.6%) |
| Computers, Engineering & Science | 162 (74.7%) | 55 (25.4%) |
| Computers & Mathematics | 0 (0.0%) | 43 (100.0%) |
| Architecture & Engineering | 111 (90.2%) | 12 (9.8%) |
| Life, Physical & Social Science | 51 (100.0%) | 0 (0.0%) |
| Community & Social Service | 326 (32.3%) | 685 (67.7%) |
| Education, Arts & Media | 115 (70.6%) | 48 (29.4%) |
| Legal Services & Support | 50 (76.9%) | 15 (23.1%) |
| Education Instruction & Library | 146 (20.3%) | 573 (79.7%) |
| Arts, Media & Entertainment | 15 (23.4%) | 49 (76.6%) |
| Health Diagnosing & Treating | 201 (27.7%) | 526 (72.4%) |
| Health Technologists | 177 (34.4%) | 337 (65.6%) |
| Total (Category) | 1,331 (41.0%) | 1,915 (59.0%) |
| Total (Overall) | 5,597 (50.8%) | 5,417 (49.2%) |
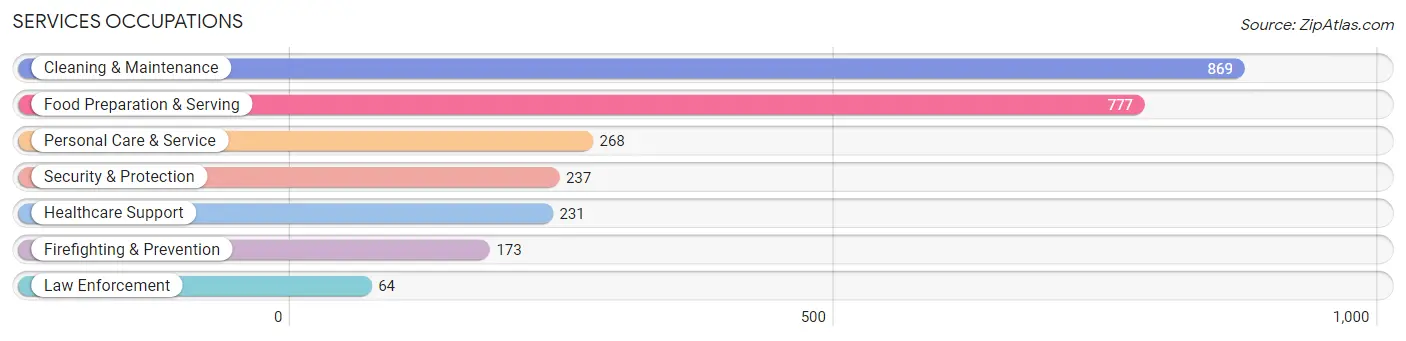
Services Occupations
The most common Services occupations in Neshoba County are Cleaning & Maintenance (869 | 7.9%), Food Preparation & Serving (777 | 7.0%), Personal Care & Service (268 | 2.4%), Security & Protection (237 | 2.1%), and Healthcare Support (231 | 2.1%).
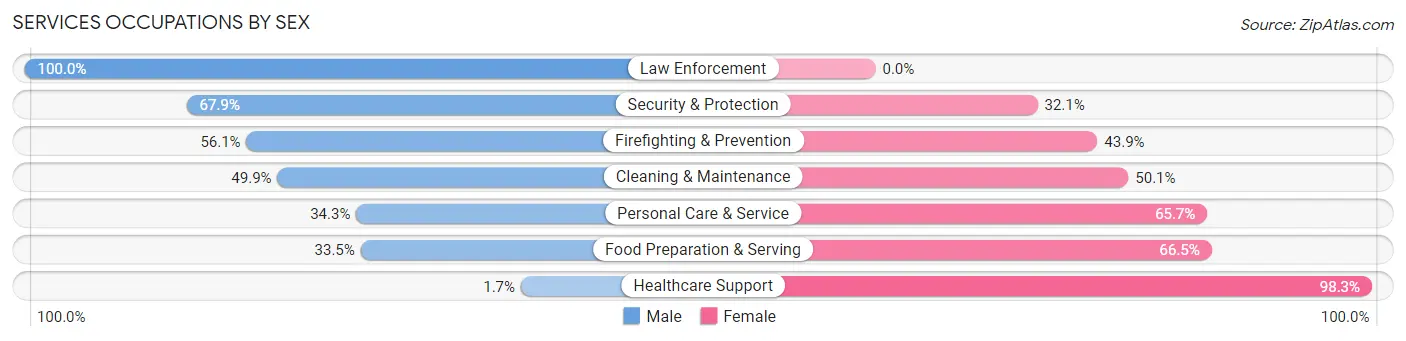
Services Occupations by Sex
Within the Services occupations in Neshoba County, the most male-oriented occupations are Law Enforcement (100.0%), Security & Protection (67.9%), and Firefighting & Prevention (56.1%), while the most female-oriented occupations are Healthcare Support (98.3%), Food Preparation & Serving (66.5%), and Personal Care & Service (65.7%).
| Occupation | Male | Female |
| Healthcare Support | 4 (1.7%) | 227 (98.3%) |
| Security & Protection | 161 (67.9%) | 76 (32.1%) |
| Firefighting & Prevention | 97 (56.1%) | 76 (43.9%) |
| Law Enforcement | 64 (100.0%) | 0 (0.0%) |
| Food Preparation & Serving | 260 (33.5%) | 517 (66.5%) |
| Cleaning & Maintenance | 434 (49.9%) | 435 (50.1%) |
| Personal Care & Service | 92 (34.3%) | 176 (65.7%) |
| Total (Category) | 951 (39.9%) | 1,431 (60.1%) |
| Total (Overall) | 5,597 (50.8%) | 5,417 (49.2%) |
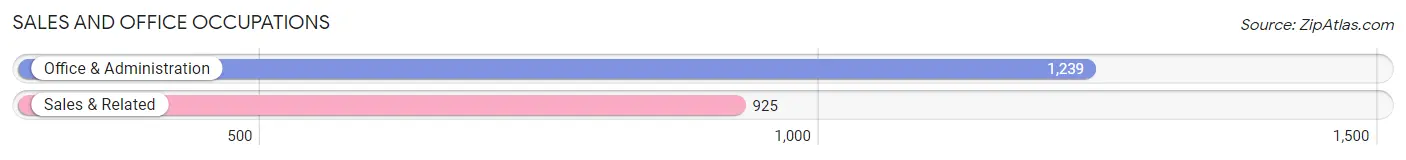
Sales and Office Occupations
The most common Sales and Office occupations in Neshoba County are Office & Administration (1,239 | 11.3%), and Sales & Related (925 | 8.4%).
Sales and Office Occupations by Sex
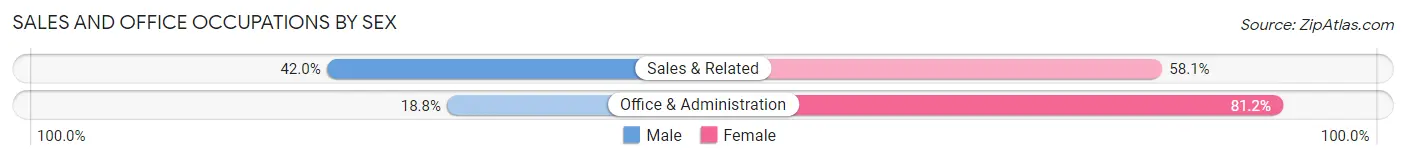
| Occupation | Male | Female |
| Sales & Related | 388 (41.9%) | 537 (58.1%) |
| Office & Administration | 233 (18.8%) | 1,006 (81.2%) |
| Total (Category) | 621 (28.7%) | 1,543 (71.3%) |
| Total (Overall) | 5,597 (50.8%) | 5,417 (49.2%) |
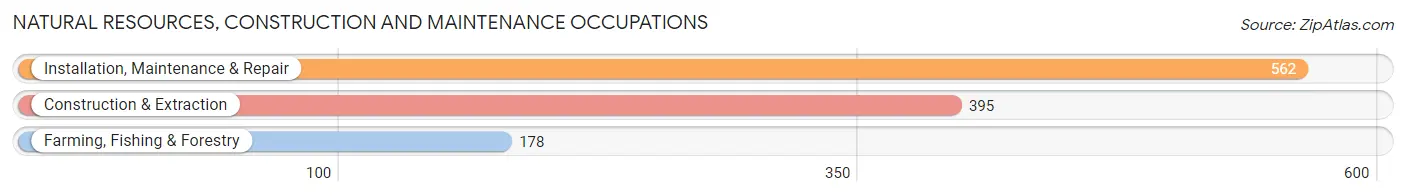
Natural Resources, Construction and Maintenance Occupations
The most common Natural Resources, Construction and Maintenance occupations in Neshoba County are Installation, Maintenance & Repair (562 | 5.1%), Construction & Extraction (395 | 3.6%), and Farming, Fishing & Forestry (178 | 1.6%).
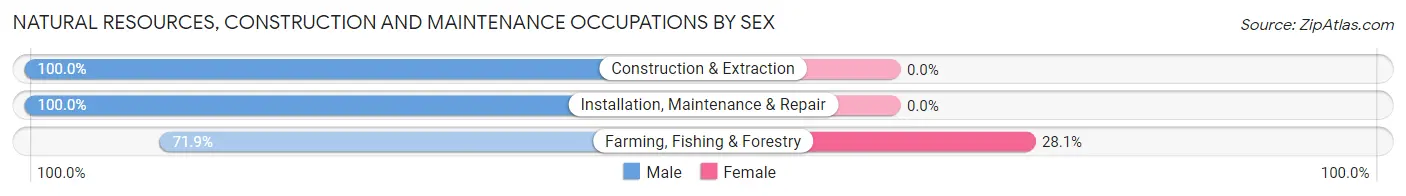
Natural Resources, Construction and Maintenance Occupations by Sex
| Occupation | Male | Female |
| Farming, Fishing & Forestry | 128 (71.9%) | 50 (28.1%) |
| Construction & Extraction | 395 (100.0%) | 0 (0.0%) |
| Installation, Maintenance & Repair | 562 (100.0%) | 0 (0.0%) |
| Total (Category) | 1,085 (95.6%) | 50 (4.4%) |
| Total (Overall) | 5,597 (50.8%) | 5,417 (49.2%) |
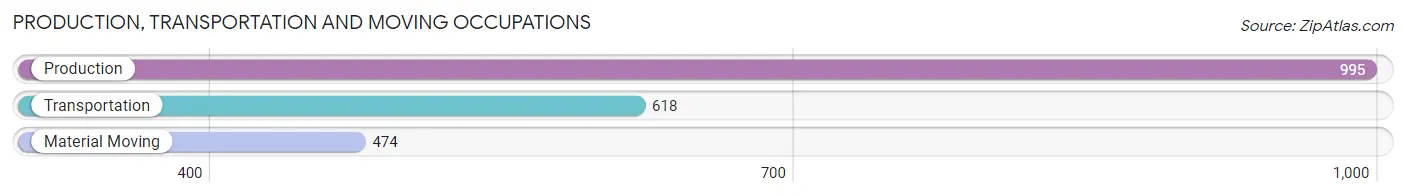
Production, Transportation and Moving Occupations
The most common Production, Transportation and Moving occupations in Neshoba County are Production (995 | 9.0%), Transportation (618 | 5.6%), and Material Moving (474 | 4.3%).
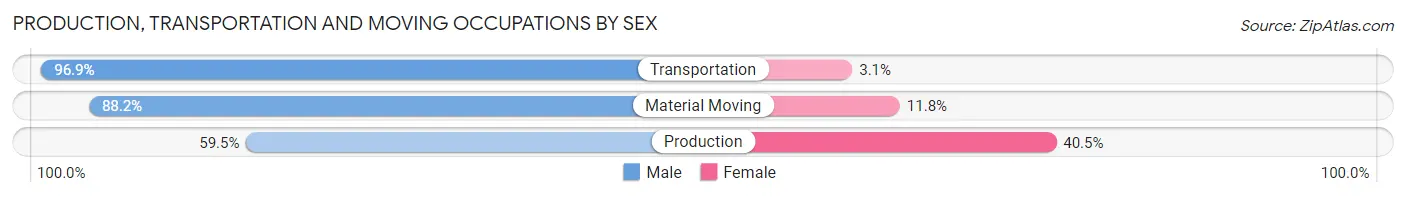
Production, Transportation and Moving Occupations by Sex
| Occupation | Male | Female |
| Production | 592 (59.5%) | 403 (40.5%) |
| Transportation | 599 (96.9%) | 19 (3.1%) |
| Material Moving | 418 (88.2%) | 56 (11.8%) |
| Total (Category) | 1,609 (77.1%) | 478 (22.9%) |
| Total (Overall) | 5,597 (50.8%) | 5,417 (49.2%) |
Employment Industries by Sex in Neshoba County
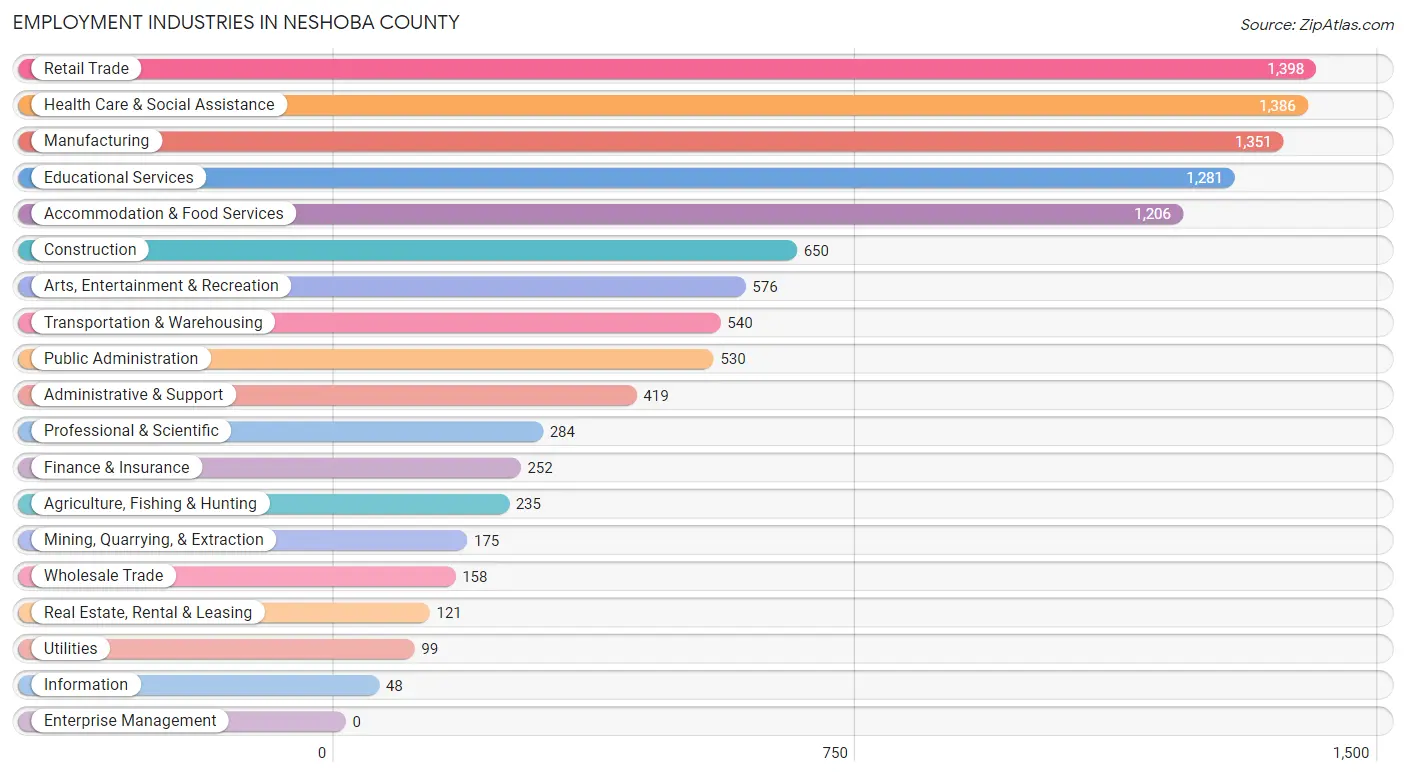
Employment Industries in Neshoba County
The major employment industries in Neshoba County include Retail Trade (1,398 | 12.7%), Health Care & Social Assistance (1,386 | 12.6%), Manufacturing (1,351 | 12.3%), Educational Services (1,281 | 11.6%), and Accommodation & Food Services (1,206 | 11.0%).
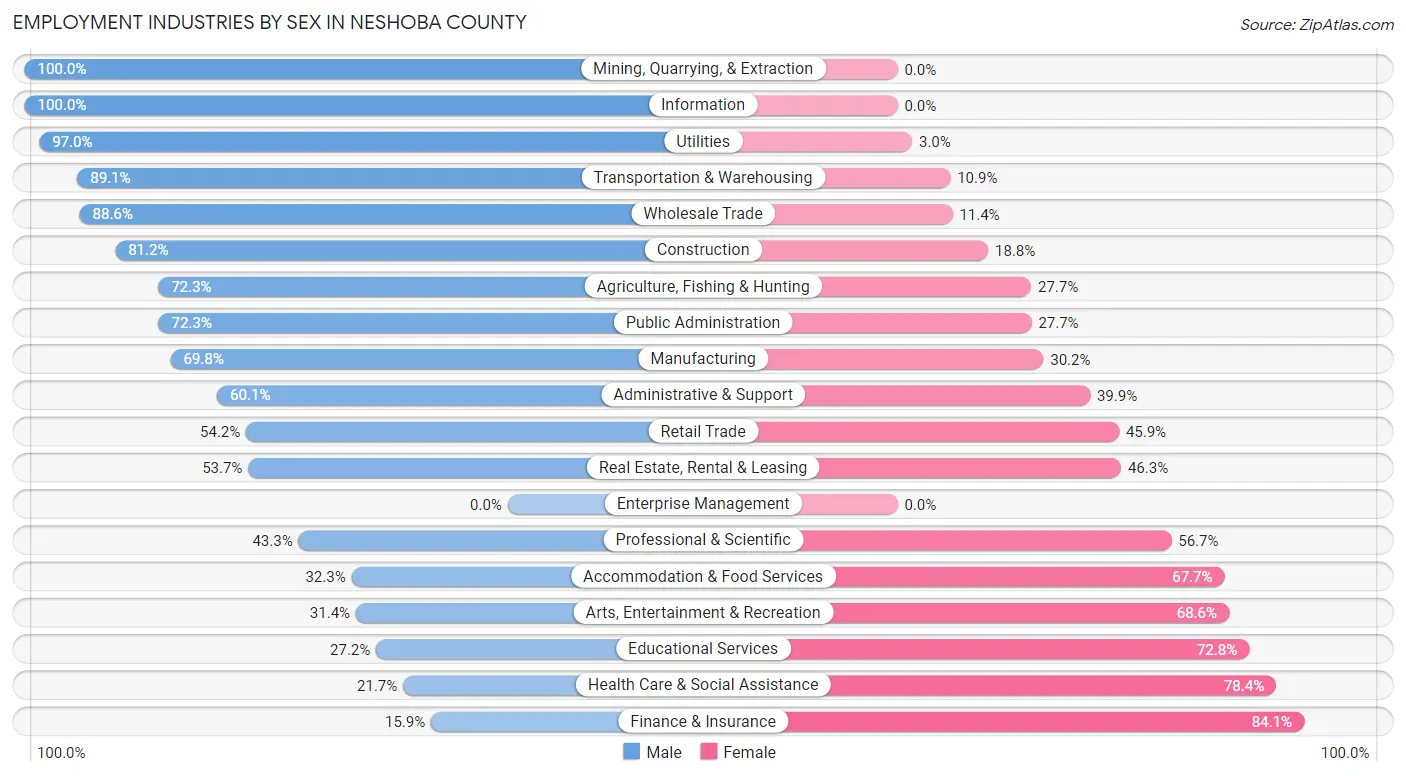
Employment Industries by Sex in Neshoba County
The Neshoba County industries that see more men than women are Mining, Quarrying, & Extraction (100.0%), Information (100.0%), and Utilities (97.0%), whereas the industries that tend to have a higher number of women are Finance & Insurance (84.1%), Health Care & Social Assistance (78.3%), and Educational Services (72.8%).
| Industry | Male | Female |
| Agriculture, Fishing & Hunting | 170 (72.3%) | 65 (27.7%) |
| Mining, Quarrying, & Extraction | 175 (100.0%) | 0 (0.0%) |
| Construction | 528 (81.2%) | 122 (18.8%) |
| Manufacturing | 943 (69.8%) | 408 (30.2%) |
| Wholesale Trade | 140 (88.6%) | 18 (11.4%) |
| Retail Trade | 757 (54.1%) | 641 (45.9%) |
| Transportation & Warehousing | 481 (89.1%) | 59 (10.9%) |
| Utilities | 96 (97.0%) | 3 (3.0%) |
| Information | 48 (100.0%) | 0 (0.0%) |
| Finance & Insurance | 40 (15.9%) | 212 (84.1%) |
| Real Estate, Rental & Leasing | 65 (53.7%) | 56 (46.3%) |
| Professional & Scientific | 123 (43.3%) | 161 (56.7%) |
| Enterprise Management | 0 (0.0%) | 0 (0.0%) |
| Administrative & Support | 252 (60.1%) | 167 (39.9%) |
| Educational Services | 349 (27.2%) | 932 (72.8%) |
| Health Care & Social Assistance | 300 (21.6%) | 1,086 (78.3%) |
| Arts, Entertainment & Recreation | 181 (31.4%) | 395 (68.6%) |
| Accommodation & Food Services | 390 (32.3%) | 816 (67.7%) |
| Public Administration | 383 (72.3%) | 147 (27.7%) |
| Total | 5,597 (50.8%) | 5,417 (49.2%) |
Education in Neshoba County
School Enrollment in Neshoba County
The most common levels of schooling among the 7,500 students in Neshoba County are high school (2,100 | 28.0%), middle school (1,893 | 25.2%), and elementary school (1,700 | 22.7%).
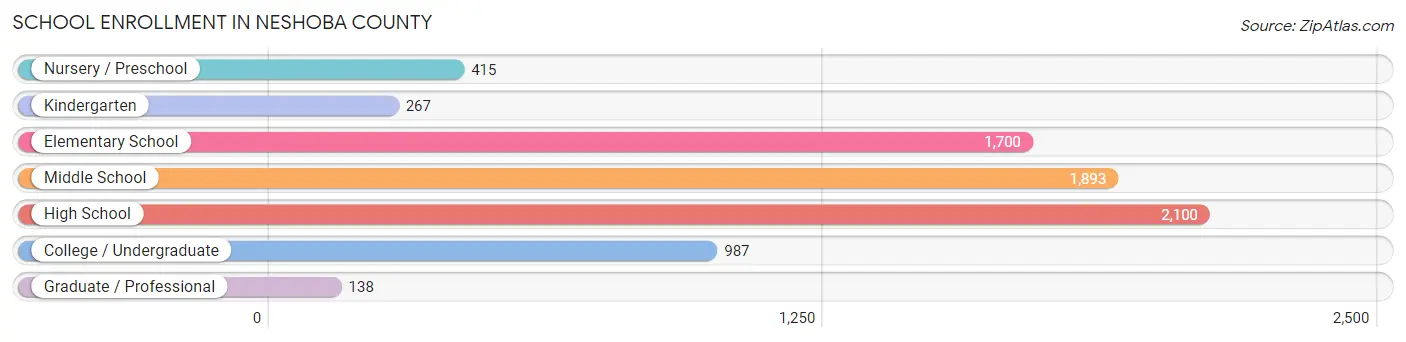
| School Level | # Students | % Students |
| Nursery / Preschool | 415 | 5.5% |
| Kindergarten | 267 | 3.6% |
| Elementary School | 1,700 | 22.7% |
| Middle School | 1,893 | 25.2% |
| High School | 2,100 | 28.0% |
| College / Undergraduate | 987 | 13.2% |
| Graduate / Professional | 138 | 1.8% |
| Total | 7,500 | 100.0% |
School Enrollment by Age by Funding Source in Neshoba County
Out of a total of 7,500 students who are enrolled in schools in Neshoba County, 900 (12.0%) attend a private institution, while the remaining 6,600 (88.0%) are enrolled in public schools. The age group of 35 years and over has the highest likelihood of being enrolled in private schools, with 45 (16.3% in the age bracket) enrolled. Conversely, the age group of 25 to 34 year olds has the lowest likelihood of being enrolled in a private school, with 220 (100.0% in the age bracket) attending a public institution.
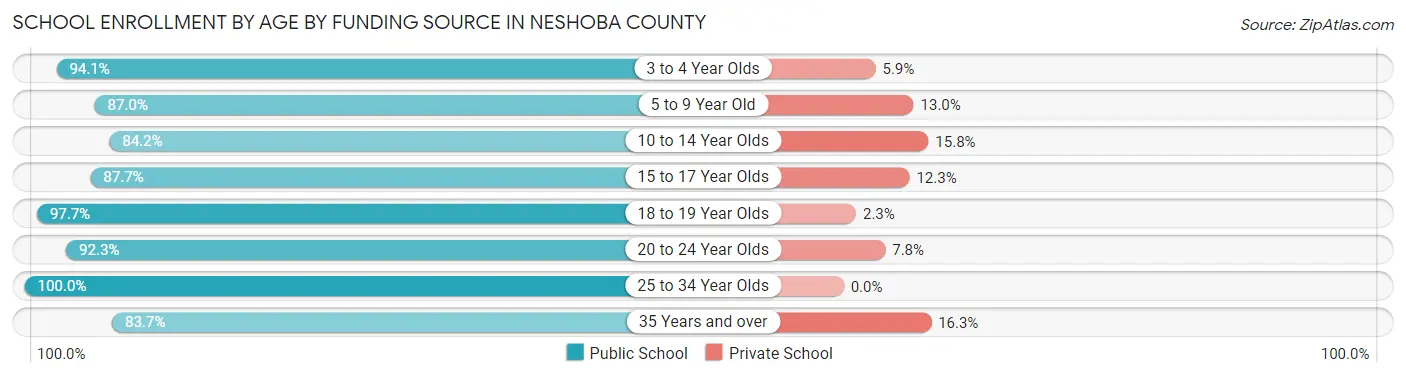
| Age Bracket | Public School | Private School |
| 3 to 4 Year Olds | 269 (94.1%) | 17 (5.9%) |
| 5 to 9 Year Old | 1,555 (87.0%) | 233 (13.0%) |
| 10 to 14 Year Olds | 1,985 (84.2%) | 372 (15.8%) |
| 15 to 17 Year Olds | 1,259 (87.7%) | 176 (12.3%) |
| 18 to 19 Year Olds | 595 (97.7%) | 14 (2.3%) |
| 20 to 24 Year Olds | 488 (92.2%) | 41 (7.7%) |
| 25 to 34 Year Olds | 220 (100.0%) | 0 (0.0%) |
| 35 Years and over | 231 (83.7%) | 45 (16.3%) |
| Total | 6,600 (88.0%) | 900 (12.0%) |
Educational Attainment by Field of Study in Neshoba County
Education (1,022 | 34.4%), business (677 | 22.8%), science & technology (393 | 13.2%), engineering (206 | 6.9%), and bio, nature & agricultural (143 | 4.8%) are the most common fields of study among 2,974 individuals in Neshoba County who have obtained a bachelor's degree or higher.
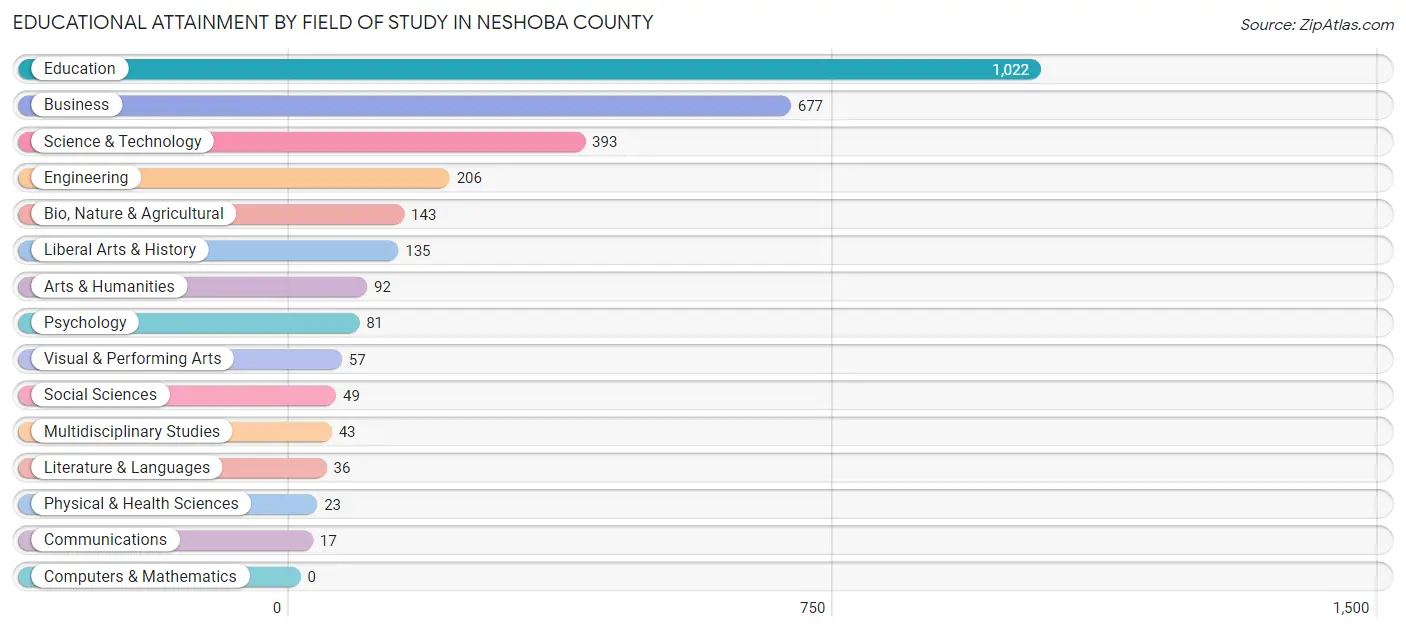
| Field of Study | # Graduates | % Graduates |
| Computers & Mathematics | 0 | 0.0% |
| Bio, Nature & Agricultural | 143 | 4.8% |
| Physical & Health Sciences | 23 | 0.8% |
| Psychology | 81 | 2.7% |
| Social Sciences | 49 | 1.7% |
| Engineering | 206 | 6.9% |
| Multidisciplinary Studies | 43 | 1.5% |
| Science & Technology | 393 | 13.2% |
| Business | 677 | 22.8% |
| Education | 1,022 | 34.4% |
| Literature & Languages | 36 | 1.2% |
| Liberal Arts & History | 135 | 4.5% |
| Visual & Performing Arts | 57 | 1.9% |
| Communications | 17 | 0.6% |
| Arts & Humanities | 92 | 3.1% |
| Total | 2,974 | 100.0% |
Transportation & Commute in Neshoba County
Vehicle Availability by Sex in Neshoba County
The most prevalent vehicle ownership categories in Neshoba County are males with 2 vehicles (1,808, accounting for 32.4%) and females with 2 vehicles (1,803, making up 34.8%).
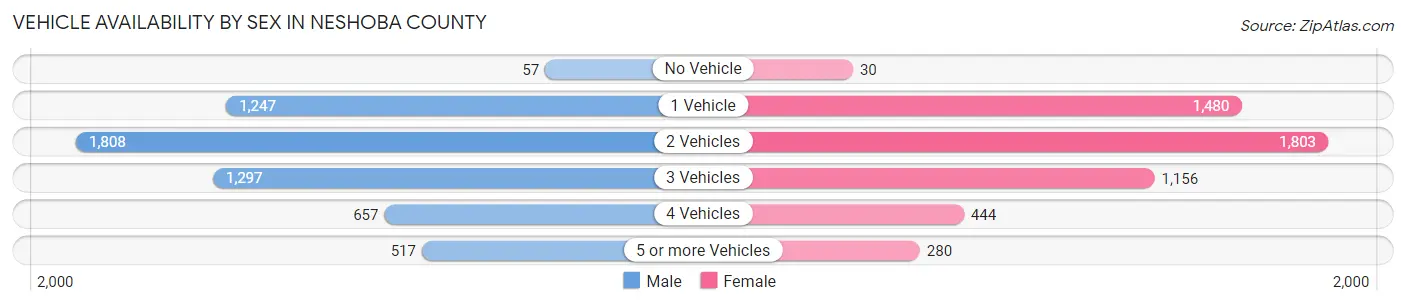
| Vehicles Available | Male | Female |
| No Vehicle | 57 (1.0%) | 30 (0.6%) |
| 1 Vehicle | 1,247 (22.3%) | 1,480 (28.5%) |
| 2 Vehicles | 1,808 (32.4%) | 1,803 (34.7%) |
| 3 Vehicles | 1,297 (23.2%) | 1,156 (22.3%) |
| 4 Vehicles | 657 (11.8%) | 444 (8.6%) |
| 5 or more Vehicles | 517 (9.3%) | 280 (5.4%) |
| Total | 5,583 (100.0%) | 5,193 (100.0%) |
Commute Time in Neshoba County
The most frequently occuring commute durations in Neshoba County are 5 to 9 minutes (2,297 commuters, 21.7%), 10 to 14 minutes (1,403 commuters, 13.3%), and 20 to 24 minutes (1,265 commuters, 12.0%).
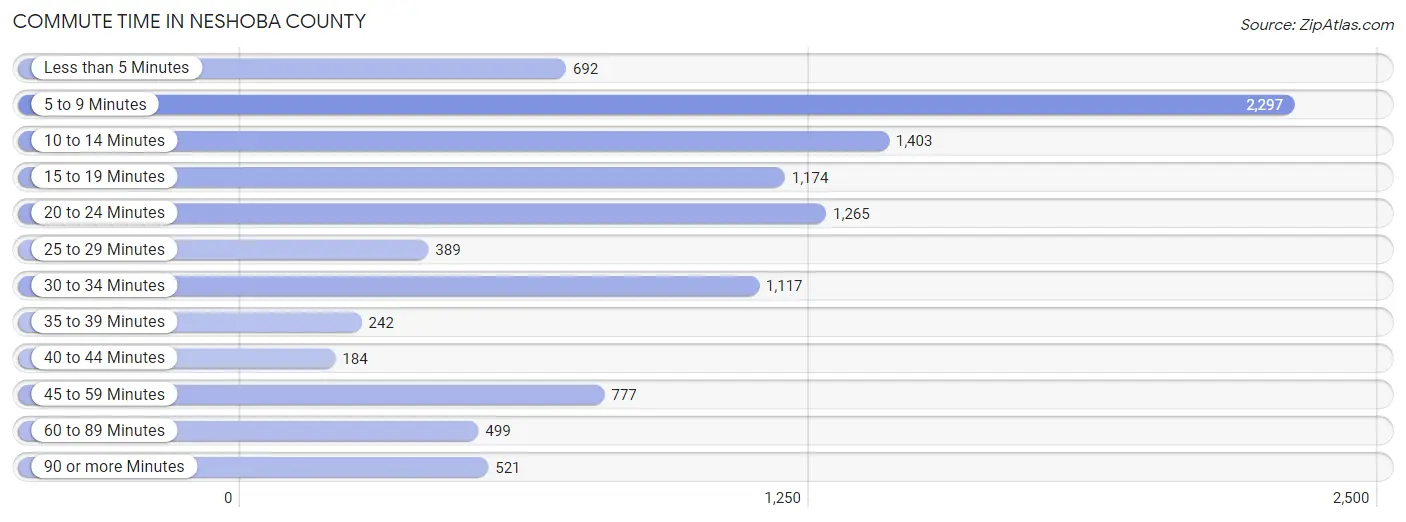
| Commute Time | # Commuters | % Commuters |
| Less than 5 Minutes | 692 | 6.6% |
| 5 to 9 Minutes | 2,297 | 21.7% |
| 10 to 14 Minutes | 1,403 | 13.3% |
| 15 to 19 Minutes | 1,174 | 11.1% |
| 20 to 24 Minutes | 1,265 | 12.0% |
| 25 to 29 Minutes | 389 | 3.7% |
| 30 to 34 Minutes | 1,117 | 10.6% |
| 35 to 39 Minutes | 242 | 2.3% |
| 40 to 44 Minutes | 184 | 1.7% |
| 45 to 59 Minutes | 777 | 7.4% |
| 60 to 89 Minutes | 499 | 4.7% |
| 90 or more Minutes | 521 | 4.9% |
Commute Time by Sex in Neshoba County
The most common commute times in Neshoba County are 5 to 9 minutes (1,056 commuters, 19.3%) for males and 5 to 9 minutes (1,241 commuters, 24.4%) for females.
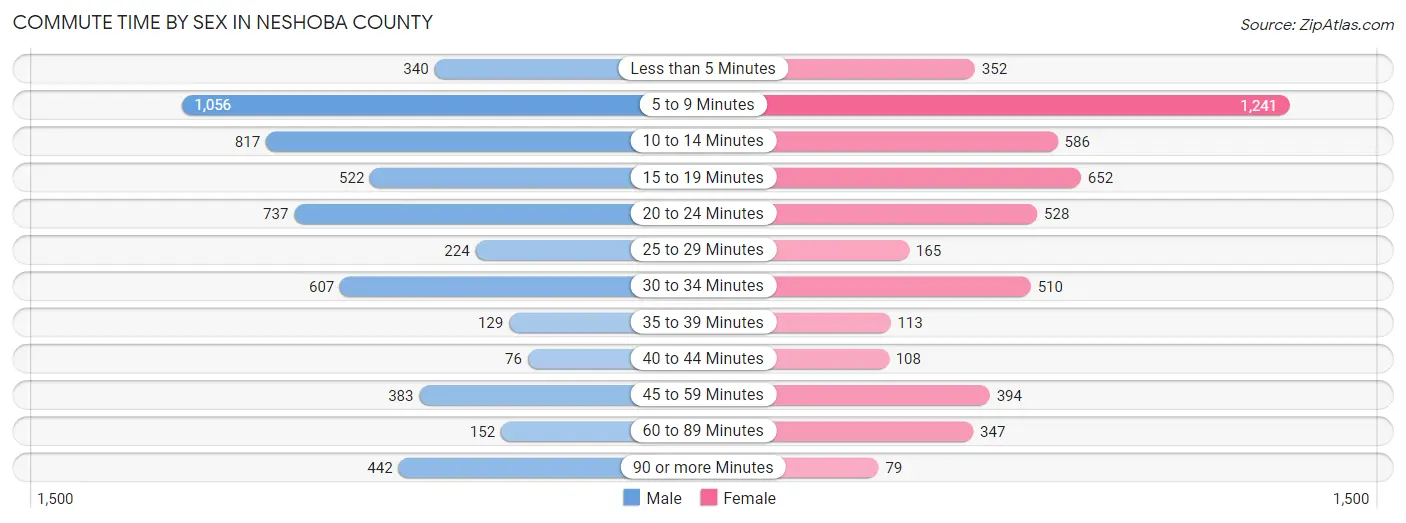
| Commute Time | Male | Female |
| Less than 5 Minutes | 340 (6.2%) | 352 (6.9%) |
| 5 to 9 Minutes | 1,056 (19.3%) | 1,241 (24.4%) |
| 10 to 14 Minutes | 817 (14.9%) | 586 (11.6%) |
| 15 to 19 Minutes | 522 (9.5%) | 652 (12.9%) |
| 20 to 24 Minutes | 737 (13.4%) | 528 (10.4%) |
| 25 to 29 Minutes | 224 (4.1%) | 165 (3.3%) |
| 30 to 34 Minutes | 607 (11.1%) | 510 (10.1%) |
| 35 to 39 Minutes | 129 (2.4%) | 113 (2.2%) |
| 40 to 44 Minutes | 76 (1.4%) | 108 (2.1%) |
| 45 to 59 Minutes | 383 (7.0%) | 394 (7.8%) |
| 60 to 89 Minutes | 152 (2.8%) | 347 (6.8%) |
| 90 or more Minutes | 442 (8.1%) | 79 (1.6%) |
Time of Departure to Work by Sex in Neshoba County
The most frequent times of departure to work in Neshoba County are 6:30 AM to 6:59 AM (886, 16.2%) for males and 7:30 AM to 7:59 AM (930, 18.3%) for females.
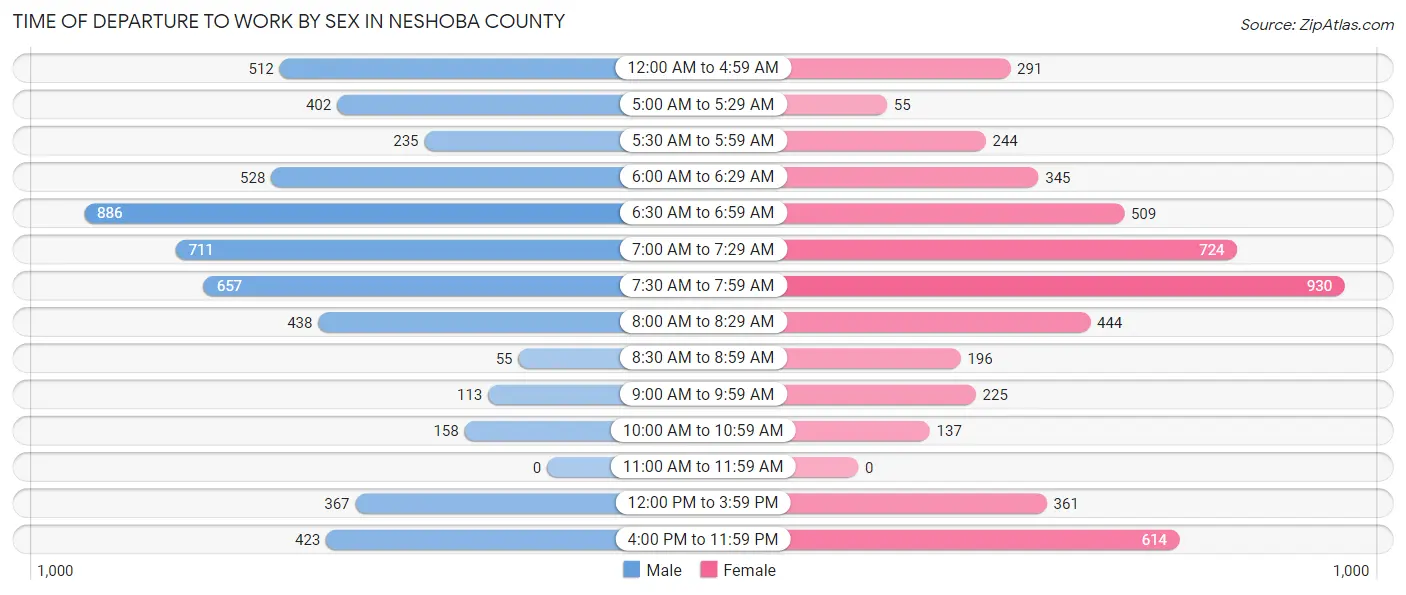
| Time of Departure | Male | Female |
| 12:00 AM to 4:59 AM | 512 (9.3%) | 291 (5.7%) |
| 5:00 AM to 5:29 AM | 402 (7.3%) | 55 (1.1%) |
| 5:30 AM to 5:59 AM | 235 (4.3%) | 244 (4.8%) |
| 6:00 AM to 6:29 AM | 528 (9.6%) | 345 (6.8%) |
| 6:30 AM to 6:59 AM | 886 (16.2%) | 509 (10.0%) |
| 7:00 AM to 7:29 AM | 711 (13.0%) | 724 (14.3%) |
| 7:30 AM to 7:59 AM | 657 (12.0%) | 930 (18.3%) |
| 8:00 AM to 8:29 AM | 438 (8.0%) | 444 (8.7%) |
| 8:30 AM to 8:59 AM | 55 (1.0%) | 196 (3.9%) |
| 9:00 AM to 9:59 AM | 113 (2.1%) | 225 (4.4%) |
| 10:00 AM to 10:59 AM | 158 (2.9%) | 137 (2.7%) |
| 11:00 AM to 11:59 AM | 0 (0.0%) | 0 (0.0%) |
| 12:00 PM to 3:59 PM | 367 (6.7%) | 361 (7.1%) |
| 4:00 PM to 11:59 PM | 423 (7.7%) | 614 (12.1%) |
| Total | 5,485 (100.0%) | 5,075 (100.0%) |
Housing Occupancy in Neshoba County
Occupancy by Ownership in Neshoba County
Of the total 10,199 dwellings in Neshoba County, owner-occupied units account for 7,348 (72.1%), while renter-occupied units make up 2,851 (28.0%).
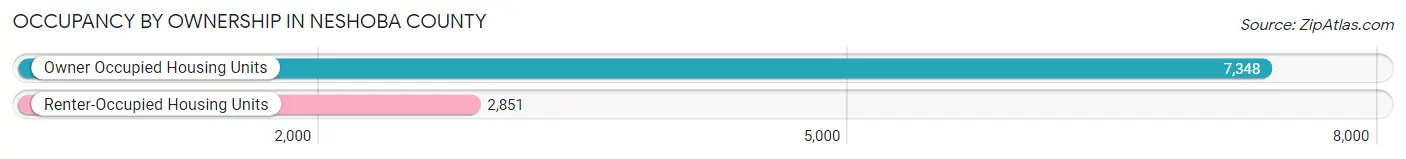
| Occupancy | # Housing Units | % Housing Units |
| Owner Occupied Housing Units | 7,348 | 72.1% |
| Renter-Occupied Housing Units | 2,851 | 28.0% |
| Total Occupied Housing Units | 10,199 | 100.0% |
Occupancy by Household Size in Neshoba County
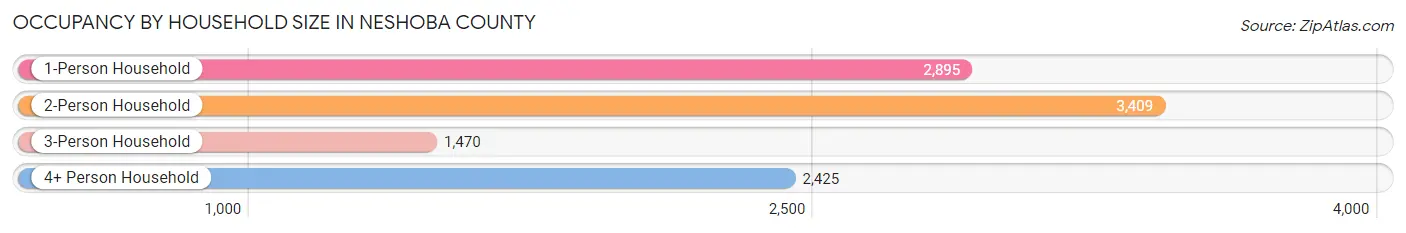
| Household Size | # Housing Units | % Housing Units |
| 1-Person Household | 2,895 | 28.4% |
| 2-Person Household | 3,409 | 33.4% |
| 3-Person Household | 1,470 | 14.4% |
| 4+ Person Household | 2,425 | 23.8% |
| Total Housing Units | 10,199 | 100.0% |
Occupancy by Ownership by Household Size in Neshoba County
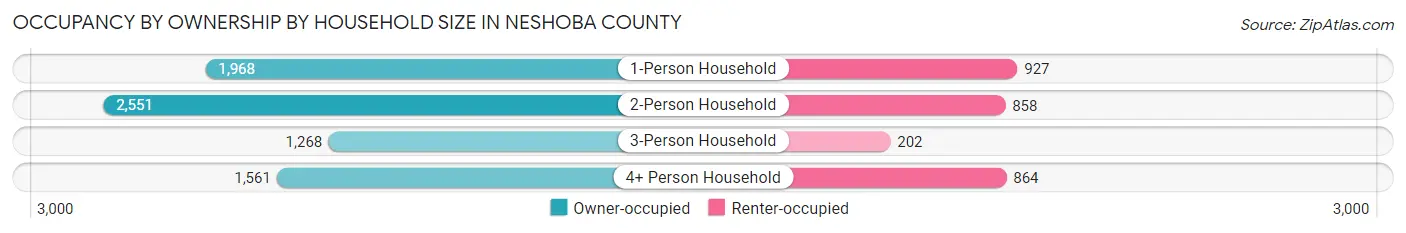
| Household Size | Owner-occupied | Renter-occupied |
| 1-Person Household | 1,968 (68.0%) | 927 (32.0%) |
| 2-Person Household | 2,551 (74.8%) | 858 (25.2%) |
| 3-Person Household | 1,268 (86.3%) | 202 (13.7%) |
| 4+ Person Household | 1,561 (64.4%) | 864 (35.6%) |
| Total Housing Units | 7,348 (72.1%) | 2,851 (28.0%) |
Occupancy by Educational Attainment in Neshoba County
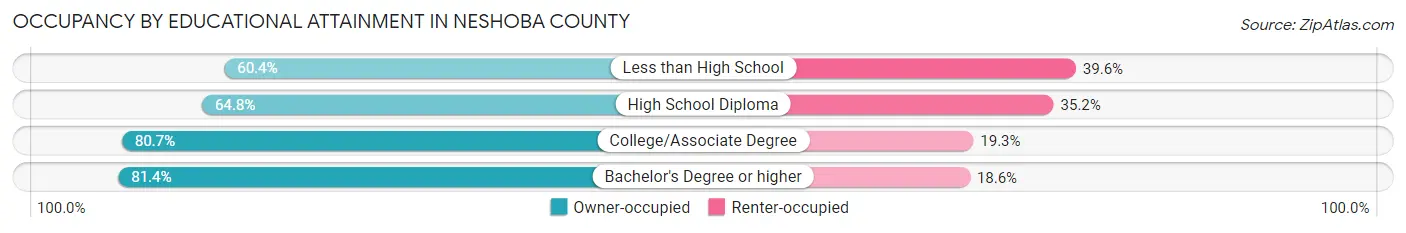
| Household Size | Owner-occupied | Renter-occupied |
| Less than High School | 1,092 (60.4%) | 716 (39.6%) |
| High School Diploma | 2,158 (64.8%) | 1,171 (35.2%) |
| College/Associate Degree | 2,714 (80.7%) | 648 (19.3%) |
| Bachelor's Degree or higher | 1,384 (81.4%) | 316 (18.6%) |
Occupancy by Age of Householder in Neshoba County
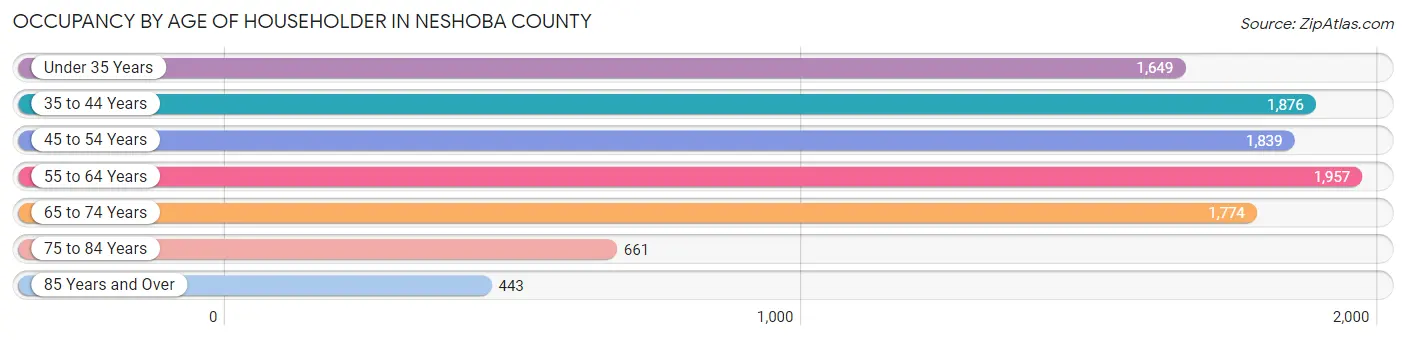
| Age Bracket | # Households | % Households |
| Under 35 Years | 1,649 | 16.2% |
| 35 to 44 Years | 1,876 | 18.4% |
| 45 to 54 Years | 1,839 | 18.0% |
| 55 to 64 Years | 1,957 | 19.2% |
| 65 to 74 Years | 1,774 | 17.4% |
| 75 to 84 Years | 661 | 6.5% |
| 85 Years and Over | 443 | 4.3% |
| Total | 10,199 | 100.0% |
Housing Finances in Neshoba County
Median Income by Occupancy in Neshoba County
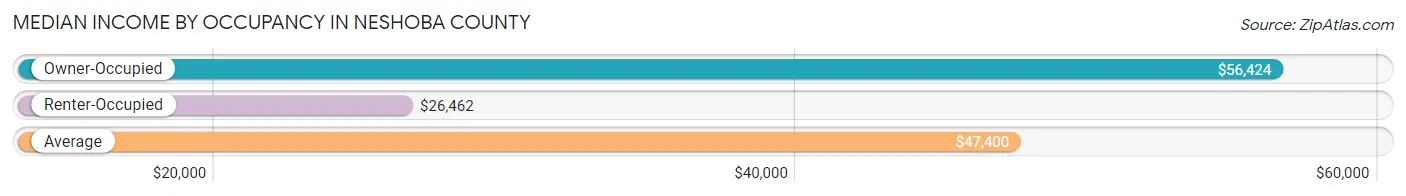
| Occupancy Type | # Households | Median Income |
| Owner-Occupied | 7,348 (72.1%) | $56,424 |
| Renter-Occupied | 2,851 (28.0%) | $26,462 |
| Average | 10,199 (100.0%) | $47,400 |
Occupancy by Householder Income Bracket in Neshoba County
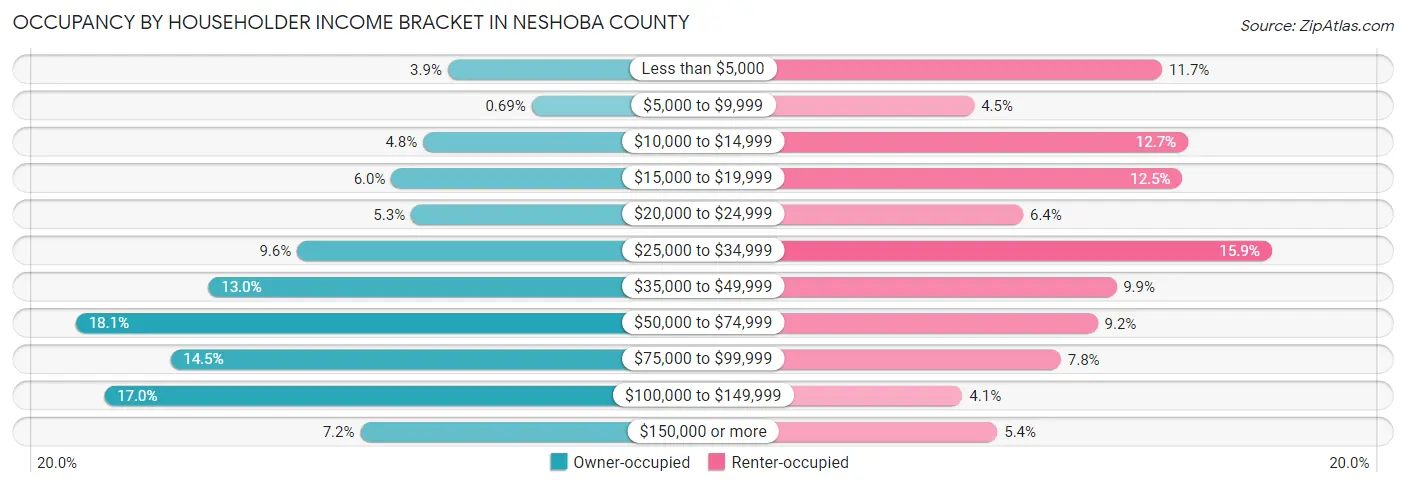
| Income Bracket | Owner-occupied | Renter-occupied |
| Less than $5,000 | 285 (3.9%) | 333 (11.7%) |
| $5,000 to $9,999 | 51 (0.7%) | 129 (4.5%) |
| $10,000 to $14,999 | 354 (4.8%) | 361 (12.7%) |
| $15,000 to $19,999 | 443 (6.0%) | 355 (12.4%) |
| $20,000 to $24,999 | 388 (5.3%) | 182 (6.4%) |
| $25,000 to $34,999 | 707 (9.6%) | 452 (15.9%) |
| $35,000 to $49,999 | 955 (13.0%) | 283 (9.9%) |
| $50,000 to $74,999 | 1,326 (18.0%) | 263 (9.2%) |
| $75,000 to $99,999 | 1,062 (14.4%) | 223 (7.8%) |
| $100,000 to $149,999 | 1,247 (17.0%) | 116 (4.1%) |
| $150,000 or more | 530 (7.2%) | 154 (5.4%) |
| Total | 7,348 (100.0%) | 2,851 (100.0%) |
Monthly Housing Cost Tiers in Neshoba County
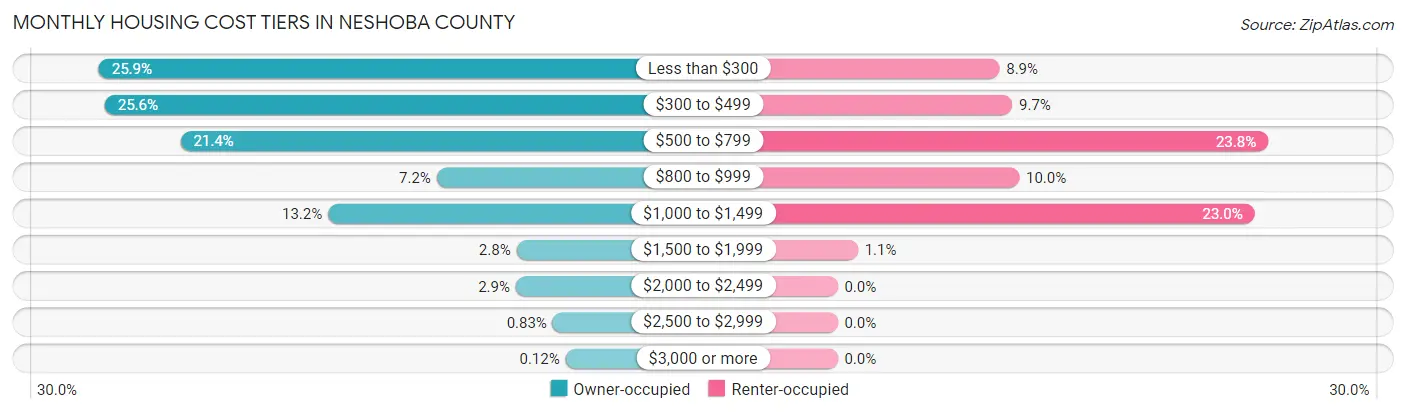
| Monthly Cost | Owner-occupied | Renter-occupied |
| Less than $300 | 1,903 (25.9%) | 255 (8.9%) |
| $300 to $499 | 1,879 (25.6%) | 275 (9.7%) |
| $500 to $799 | 1,572 (21.4%) | 678 (23.8%) |
| $800 to $999 | 532 (7.2%) | 286 (10.0%) |
| $1,000 to $1,499 | 973 (13.2%) | 657 (23.0%) |
| $1,500 to $1,999 | 208 (2.8%) | 32 (1.1%) |
| $2,000 to $2,499 | 211 (2.9%) | 0 (0.0%) |
| $2,500 to $2,999 | 61 (0.8%) | 0 (0.0%) |
| $3,000 or more | 9 (0.1%) | 0 (0.0%) |
| Total | 7,348 (100.0%) | 2,851 (100.0%) |
Physical Housing Characteristics in Neshoba County
Housing Structures in Neshoba County
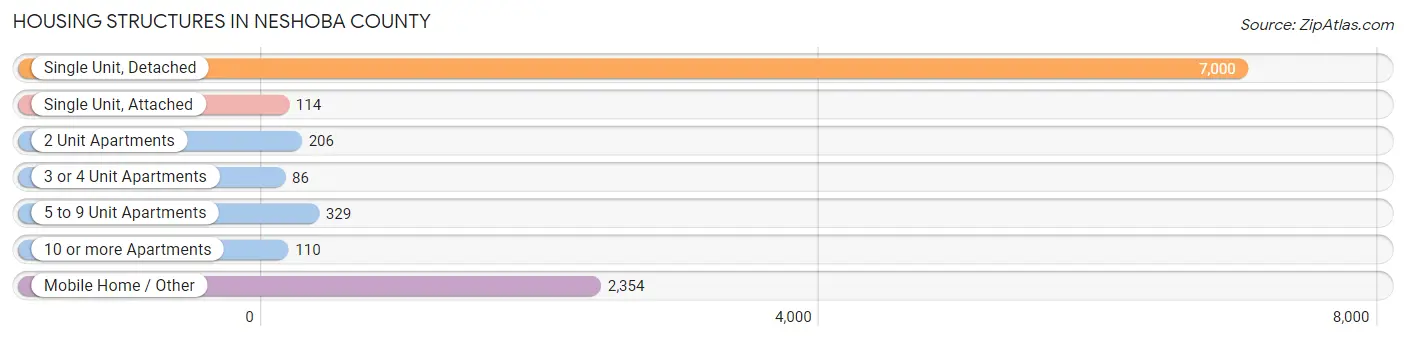
| Structure Type | # Housing Units | % Housing Units |
| Single Unit, Detached | 7,000 | 68.6% |
| Single Unit, Attached | 114 | 1.1% |
| 2 Unit Apartments | 206 | 2.0% |
| 3 or 4 Unit Apartments | 86 | 0.8% |
| 5 to 9 Unit Apartments | 329 | 3.2% |
| 10 or more Apartments | 110 | 1.1% |
| Mobile Home / Other | 2,354 | 23.1% |
| Total | 10,199 | 100.0% |
Housing Structures by Occupancy in Neshoba County
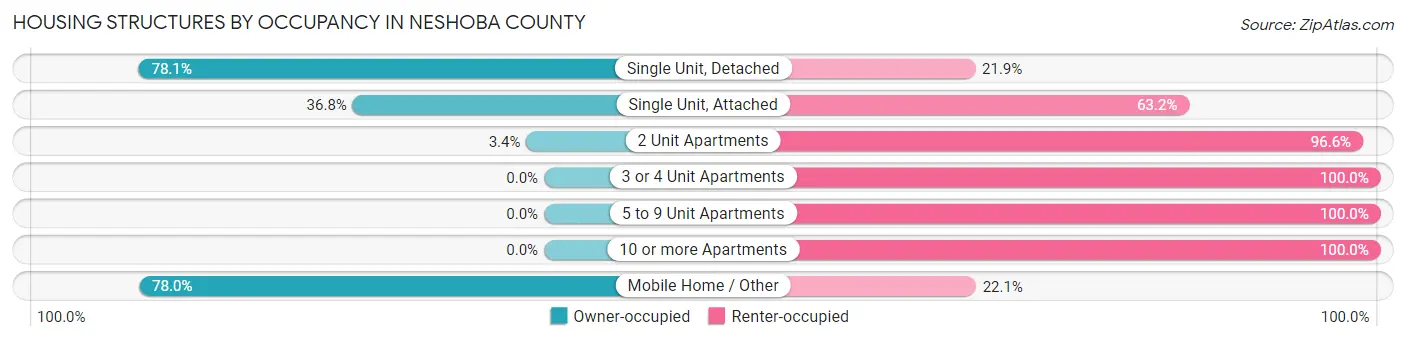
| Structure Type | Owner-occupied | Renter-occupied |
| Single Unit, Detached | 5,464 (78.1%) | 1,536 (21.9%) |
| Single Unit, Attached | 42 (36.8%) | 72 (63.2%) |
| 2 Unit Apartments | 7 (3.4%) | 199 (96.6%) |
| 3 or 4 Unit Apartments | 0 (0.0%) | 86 (100.0%) |
| 5 to 9 Unit Apartments | 0 (0.0%) | 329 (100.0%) |
| 10 or more Apartments | 0 (0.0%) | 110 (100.0%) |
| Mobile Home / Other | 1,835 (77.9%) | 519 (22.1%) |
| Total | 7,348 (72.1%) | 2,851 (28.0%) |
Housing Structures by Number of Rooms in Neshoba County
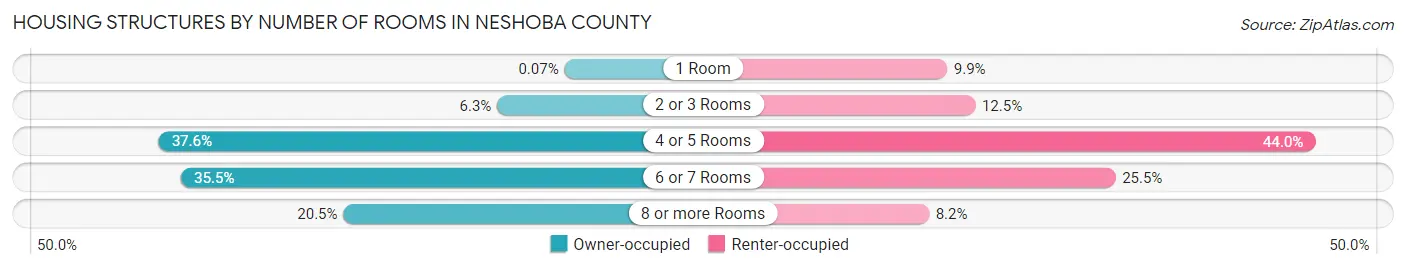
| Number of Rooms | Owner-occupied | Renter-occupied |
| 1 Room | 5 (0.1%) | 282 (9.9%) |
| 2 or 3 Rooms | 462 (6.3%) | 356 (12.5%) |
| 4 or 5 Rooms | 2,762 (37.6%) | 1,253 (44.0%) |
| 6 or 7 Rooms | 2,611 (35.5%) | 726 (25.5%) |
| 8 or more Rooms | 1,508 (20.5%) | 234 (8.2%) |
| Total | 7,348 (100.0%) | 2,851 (100.0%) |
Housing Structure by Heating Type in Neshoba County
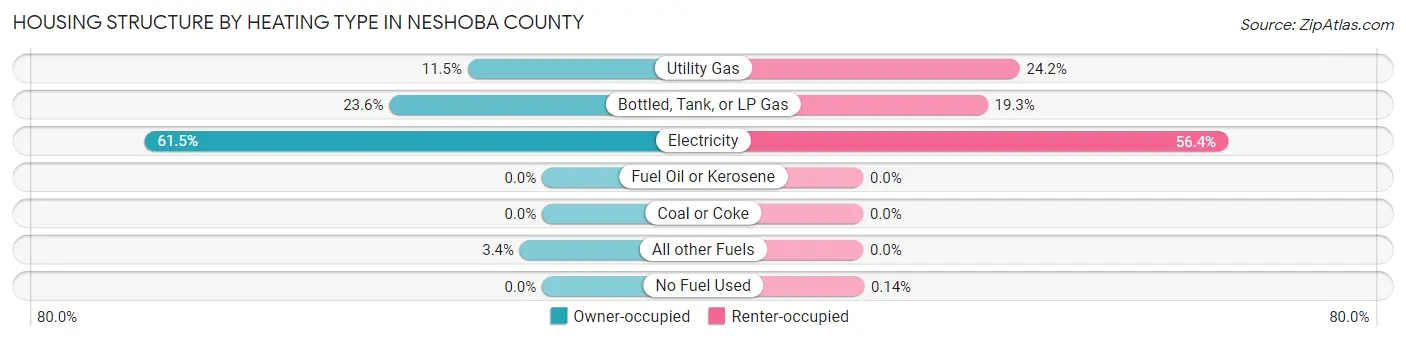
| Heating Type | Owner-occupied | Renter-occupied |
| Utility Gas | 844 (11.5%) | 690 (24.2%) |
| Bottled, Tank, or LP Gas | 1,736 (23.6%) | 549 (19.3%) |
| Electricity | 4,515 (61.5%) | 1,608 (56.4%) |
| Fuel Oil or Kerosene | 0 (0.0%) | 0 (0.0%) |
| Coal or Coke | 0 (0.0%) | 0 (0.0%) |
| All other Fuels | 253 (3.4%) | 0 (0.0%) |
| No Fuel Used | 0 (0.0%) | 4 (0.1%) |
| Total | 7,348 (100.0%) | 2,851 (100.0%) |
Household Vehicle Usage in Neshoba County
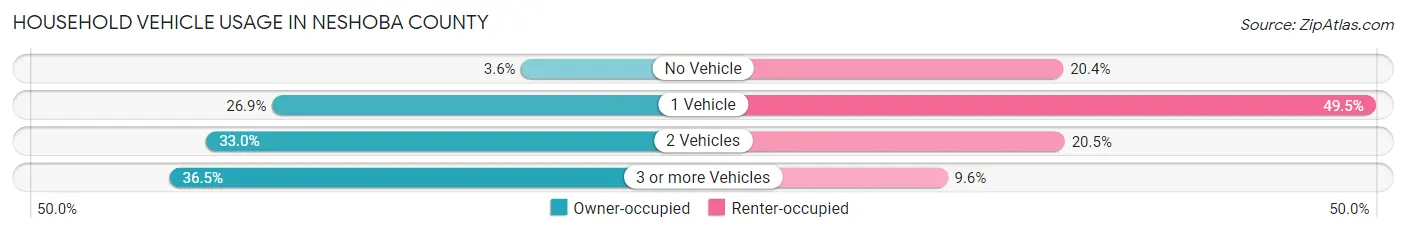
| Vehicles per Household | Owner-occupied | Renter-occupied |
| No Vehicle | 266 (3.6%) | 581 (20.4%) |
| 1 Vehicle | 1,975 (26.9%) | 1,412 (49.5%) |
| 2 Vehicles | 2,428 (33.0%) | 585 (20.5%) |
| 3 or more Vehicles | 2,679 (36.5%) | 273 (9.6%) |
| Total | 7,348 (100.0%) | 2,851 (100.0%) |
Real Estate & Mortgages in Neshoba County
Real Estate and Mortgage Overview in Neshoba County
| Characteristic | Without Mortgage | With Mortgage |
| Housing Units | 4,709 | 2,639 |
| Median Property Value | $87,500 | $116,900 |
| Median Household Income | $50,988 | $183 |
| Monthly Housing Costs | $343 | $1 |
| Real Estate Taxes | $620 | $550 |
Property Value by Mortgage Status in Neshoba County
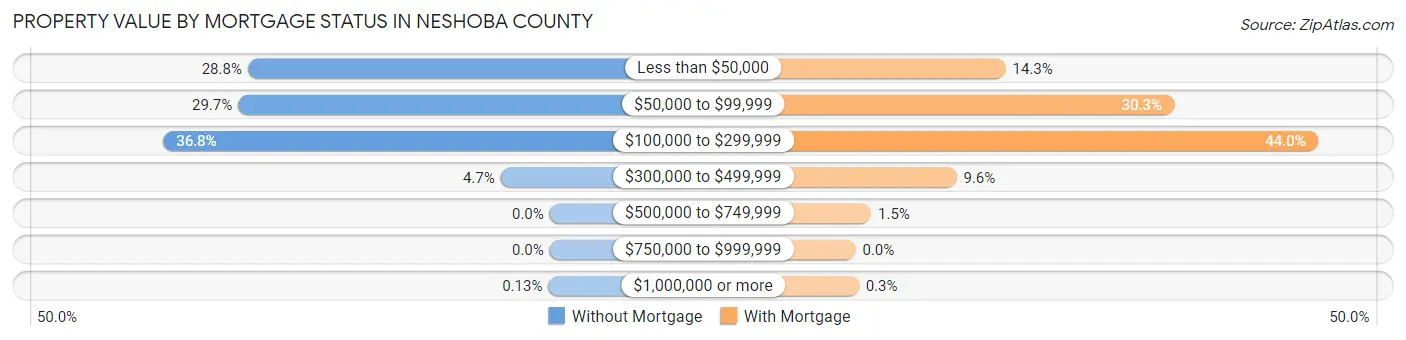
| Property Value | Without Mortgage | With Mortgage |
| Less than $50,000 | 1,354 (28.7%) | 377 (14.3%) |
| $50,000 to $99,999 | 1,397 (29.7%) | 800 (30.3%) |
| $100,000 to $299,999 | 1,732 (36.8%) | 1,161 (44.0%) |
| $300,000 to $499,999 | 220 (4.7%) | 254 (9.6%) |
| $500,000 to $749,999 | 0 (0.0%) | 39 (1.5%) |
| $750,000 to $999,999 | 0 (0.0%) | 0 (0.0%) |
| $1,000,000 or more | 6 (0.1%) | 8 (0.3%) |
| Total | 4,709 (100.0%) | 2,639 (100.0%) |
Household Income by Mortgage Status in Neshoba County
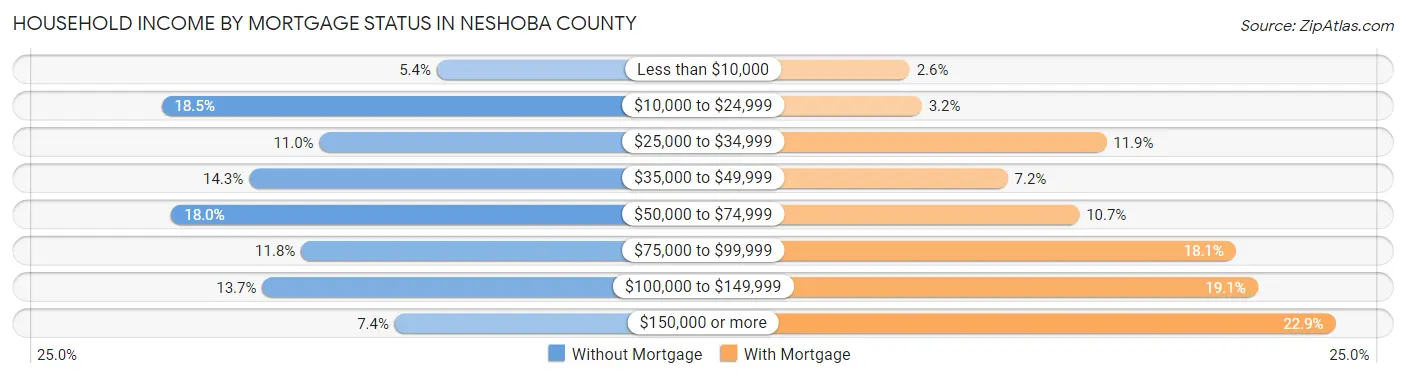
| Household Income | Without Mortgage | With Mortgage |
| Less than $10,000 | 253 (5.4%) | 68 (2.6%) |
| $10,000 to $24,999 | 870 (18.5%) | 83 (3.2%) |
| $25,000 to $34,999 | 516 (11.0%) | 315 (11.9%) |
| $35,000 to $49,999 | 674 (14.3%) | 191 (7.2%) |
| $50,000 to $74,999 | 848 (18.0%) | 281 (10.6%) |
| $75,000 to $99,999 | 557 (11.8%) | 478 (18.1%) |
| $100,000 to $149,999 | 644 (13.7%) | 505 (19.1%) |
| $150,000 or more | 347 (7.4%) | 603 (22.9%) |
| Total | 4,709 (100.0%) | 2,639 (100.0%) |
Property Value to Household Income Ratio in Neshoba County
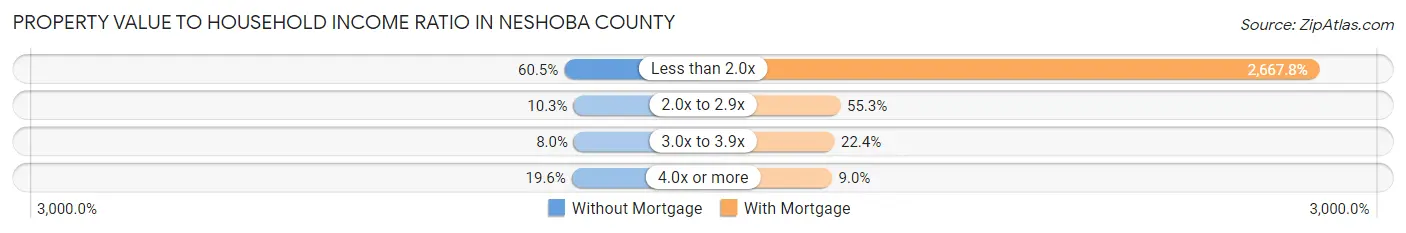
| Value-to-Income Ratio | Without Mortgage | With Mortgage |
| Less than 2.0x | 2,847 (60.5%) | 70,404 (2,667.8%) |
| 2.0x to 2.9x | 484 (10.3%) | 1,458 (55.2%) |
| 3.0x to 3.9x | 375 (8.0%) | 590 (22.4%) |
| 4.0x or more | 922 (19.6%) | 237 (9.0%) |
| Total | 4,709 (100.0%) | 2,639 (100.0%) |
Real Estate Taxes by Mortgage Status in Neshoba County
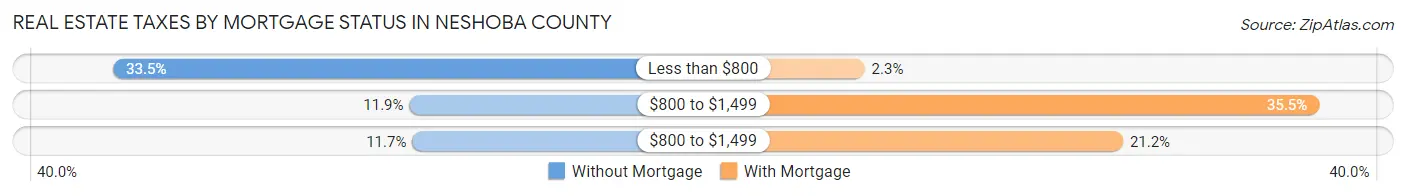
| Property Taxes | Without Mortgage | With Mortgage |
| Less than $800 | 1,579 (33.5%) | 61 (2.3%) |
| $800 to $1,499 | 560 (11.9%) | 937 (35.5%) |
| $800 to $1,499 | 550 (11.7%) | 559 (21.2%) |
| Total | 4,709 (100.0%) | 2,639 (100.0%) |
Health & Disability in Neshoba County
Health Insurance Coverage by Age in Neshoba County
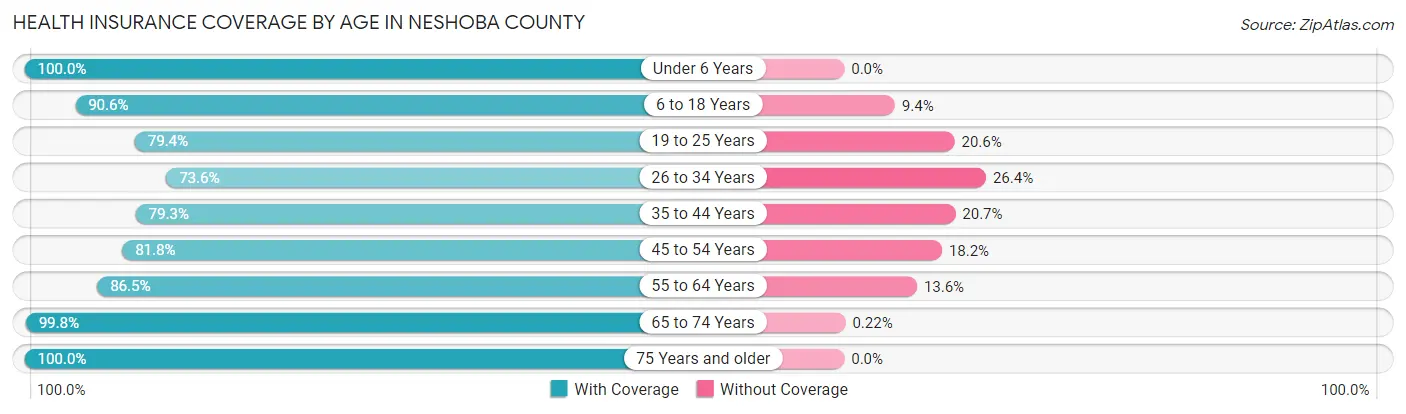
| Age Bracket | With Coverage | Without Coverage |
| Under 6 Years | 2,530 (100.0%) | 0 (0.0%) |
| 6 to 18 Years | 5,351 (90.6%) | 558 (9.4%) |
| 19 to 25 Years | 2,145 (79.4%) | 555 (20.6%) |
| 26 to 34 Years | 2,008 (73.6%) | 721 (26.4%) |
| 35 to 44 Years | 2,803 (79.3%) | 732 (20.7%) |
| 45 to 54 Years | 2,655 (81.8%) | 591 (18.2%) |
| 55 to 64 Years | 2,865 (86.5%) | 449 (13.6%) |
| 65 to 74 Years | 2,774 (99.8%) | 6 (0.2%) |
| 75 Years and older | 1,648 (100.0%) | 0 (0.0%) |
| Total | 24,779 (87.3%) | 3,612 (12.7%) |
Health Insurance Coverage by Citizenship Status in Neshoba County
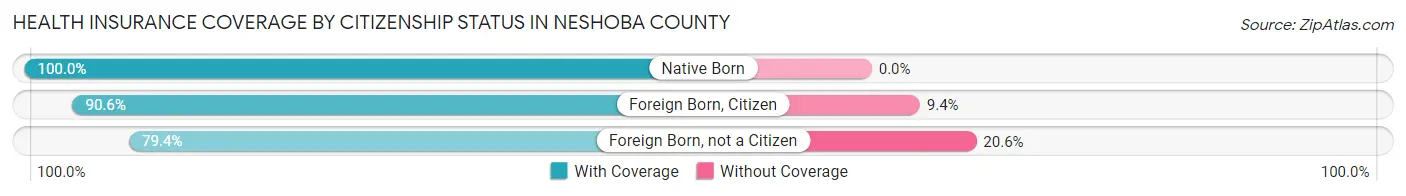
| Citizenship Status | With Coverage | Without Coverage |
| Native Born | 2,530 (100.0%) | 0 (0.0%) |
| Foreign Born, Citizen | 5,351 (90.6%) | 558 (9.4%) |
| Foreign Born, not a Citizen | 2,145 (79.4%) | 555 (20.6%) |
Health Insurance Coverage by Household Income in Neshoba County
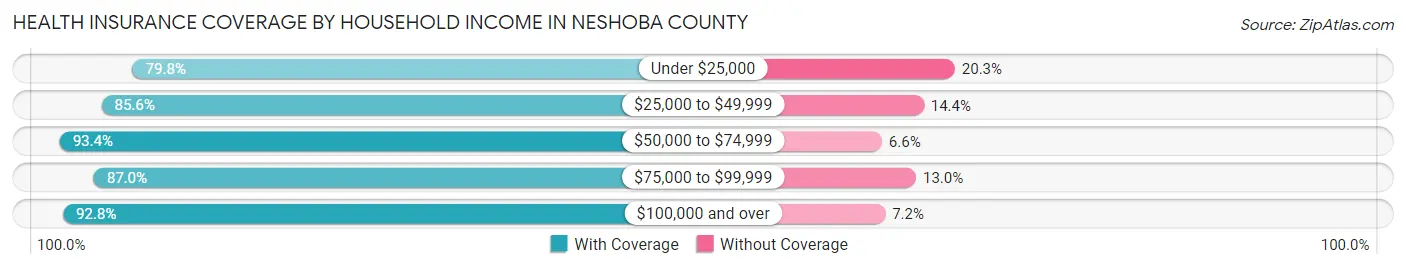
| Household Income | With Coverage | Without Coverage |
| Under $25,000 | 5,509 (79.7%) | 1,399 (20.3%) |
| $25,000 to $49,999 | 5,559 (85.6%) | 937 (14.4%) |
| $50,000 to $74,999 | 4,002 (93.4%) | 282 (6.6%) |
| $75,000 to $99,999 | 3,368 (87.0%) | 502 (13.0%) |
| $100,000 and over | 6,341 (92.8%) | 492 (7.2%) |
Public vs Private Health Insurance Coverage by Age in Neshoba County
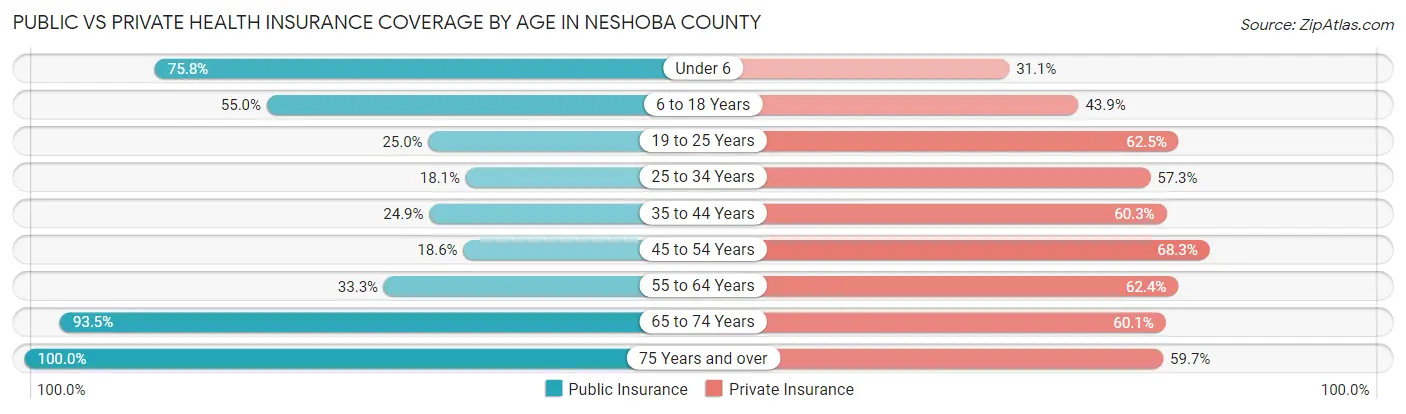
| Age Bracket | Public Insurance | Private Insurance |
| Under 6 | 1,918 (75.8%) | 786 (31.1%) |
| 6 to 18 Years | 3,252 (55.0%) | 2,596 (43.9%) |
| 19 to 25 Years | 676 (25.0%) | 1,688 (62.5%) |
| 25 to 34 Years | 494 (18.1%) | 1,563 (57.3%) |
| 35 to 44 Years | 879 (24.9%) | 2,130 (60.3%) |
| 45 to 54 Years | 602 (18.5%) | 2,216 (68.3%) |
| 55 to 64 Years | 1,104 (33.3%) | 2,069 (62.4%) |
| 65 to 74 Years | 2,598 (93.4%) | 1,671 (60.1%) |
| 75 Years and over | 1,648 (100.0%) | 983 (59.7%) |
| Total | 13,171 (46.4%) | 15,702 (55.3%) |
Disability Status by Sex by Age in Neshoba County
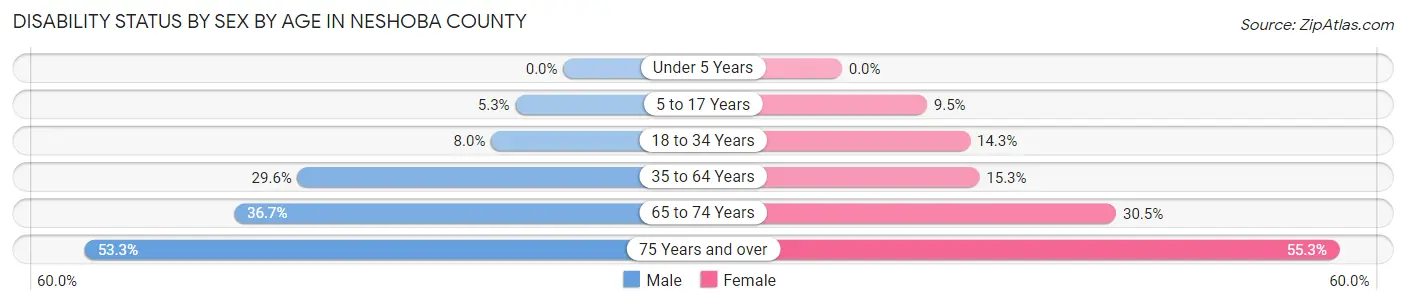
| Age Bracket | Male | Female |
| Under 5 Years | 0 (0.0%) | 0 (0.0%) |
| 5 to 17 Years | 160 (5.3%) | 275 (9.5%) |
| 18 to 34 Years | 231 (8.0%) | 430 (14.3%) |
| 35 to 64 Years | 1,409 (29.6%) | 817 (15.3%) |
| 65 to 74 Years | 472 (36.7%) | 456 (30.5%) |
| 75 Years and over | 339 (53.3%) | 560 (55.3%) |
Disability Class by Sex by Age in Neshoba County
Disability Class: Hearing Difficulty
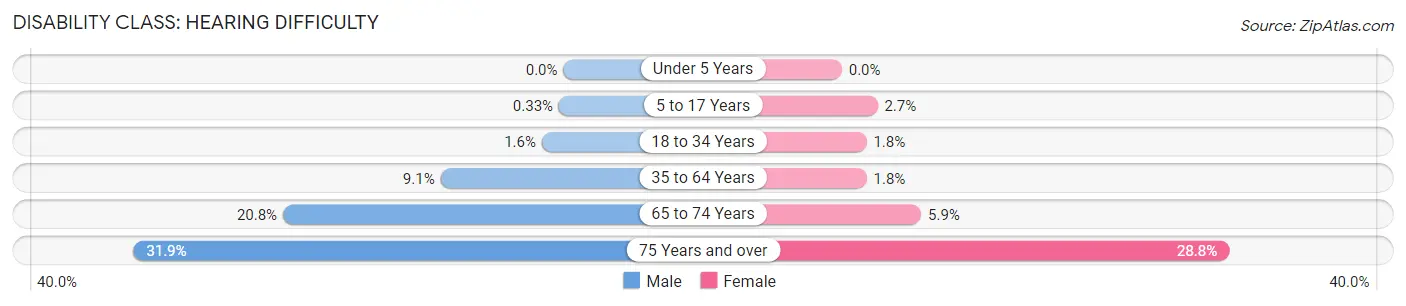
| Age Bracket | Male | Female |
| Under 5 Years | 0 (0.0%) | 0 (0.0%) |
| 5 to 17 Years | 10 (0.3%) | 77 (2.6%) |
| 18 to 34 Years | 46 (1.6%) | 55 (1.8%) |
| 35 to 64 Years | 434 (9.1%) | 98 (1.8%) |
| 65 to 74 Years | 268 (20.8%) | 88 (5.9%) |
| 75 Years and over | 203 (31.9%) | 291 (28.7%) |
Disability Class: Vision Difficulty
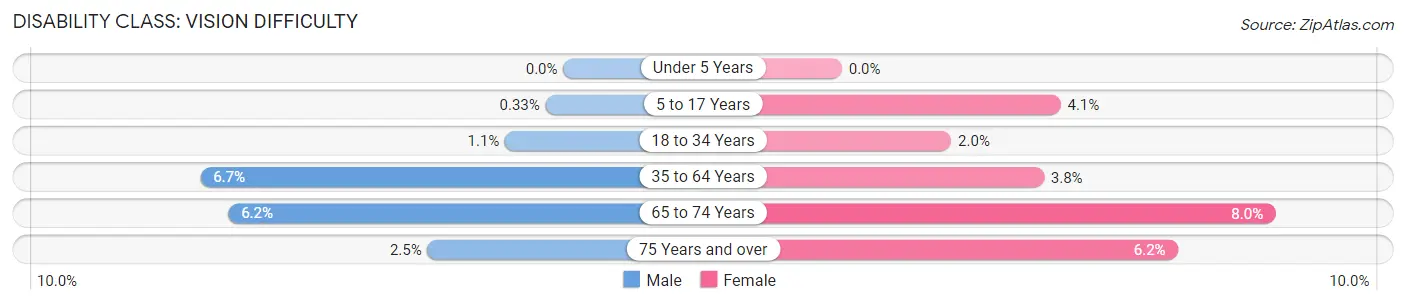
| Age Bracket | Male | Female |
| Under 5 Years | 0 (0.0%) | 0 (0.0%) |
| 5 to 17 Years | 10 (0.3%) | 118 (4.1%) |
| 18 to 34 Years | 31 (1.1%) | 61 (2.0%) |
| 35 to 64 Years | 321 (6.7%) | 200 (3.7%) |
| 65 to 74 Years | 80 (6.2%) | 120 (8.0%) |
| 75 Years and over | 16 (2.5%) | 63 (6.2%) |
Disability Class: Cognitive Difficulty
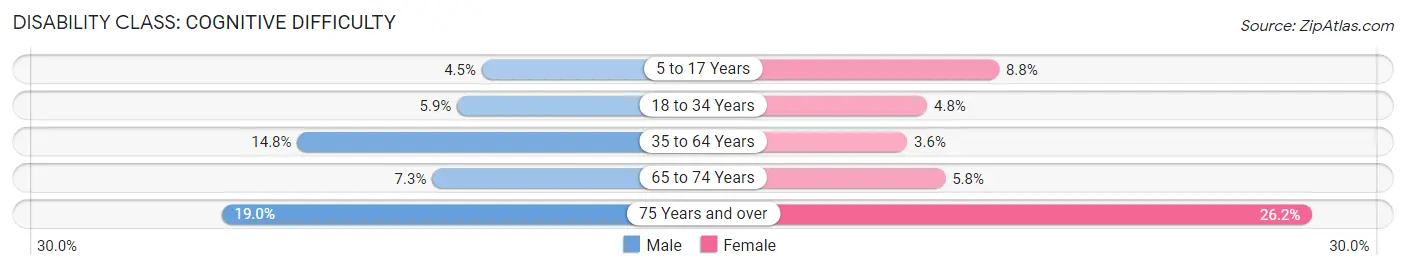
| Age Bracket | Male | Female |
| 5 to 17 Years | 136 (4.5%) | 254 (8.7%) |
| 18 to 34 Years | 170 (5.9%) | 143 (4.8%) |
| 35 to 64 Years | 705 (14.8%) | 194 (3.6%) |
| 65 to 74 Years | 94 (7.3%) | 86 (5.8%) |
| 75 Years and over | 121 (19.0%) | 265 (26.2%) |
Disability Class: Ambulatory Difficulty
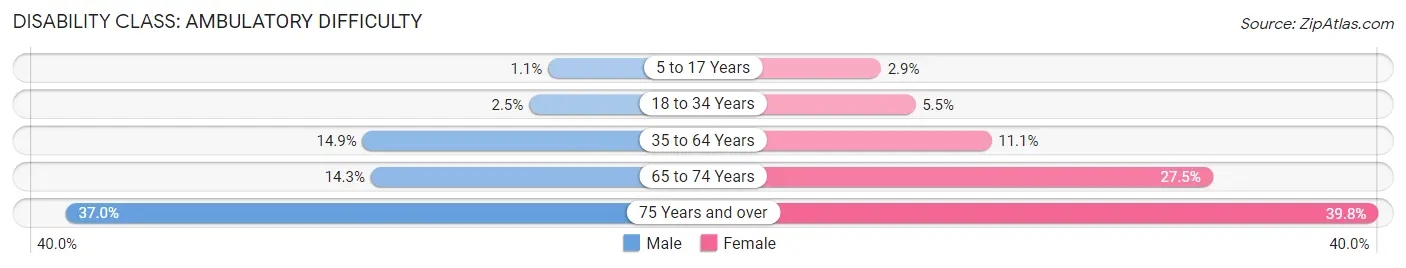
| Age Bracket | Male | Female |
| 5 to 17 Years | 34 (1.1%) | 84 (2.9%) |
| 18 to 34 Years | 73 (2.5%) | 164 (5.4%) |
| 35 to 64 Years | 710 (14.9%) | 592 (11.1%) |
| 65 to 74 Years | 184 (14.3%) | 411 (27.5%) |
| 75 Years and over | 235 (36.9%) | 403 (39.8%) |
Disability Class: Self-Care Difficulty
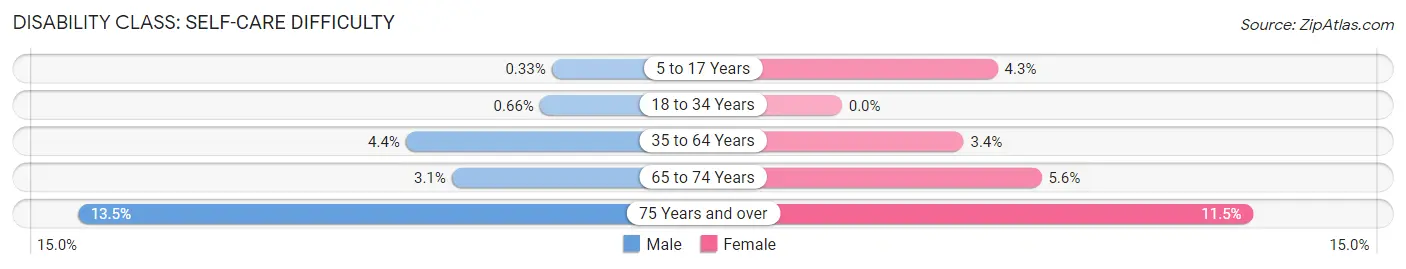
| Age Bracket | Male | Female |
| 5 to 17 Years | 10 (0.3%) | 126 (4.3%) |
| 18 to 34 Years | 19 (0.7%) | 0 (0.0%) |
| 35 to 64 Years | 209 (4.4%) | 181 (3.4%) |
| 65 to 74 Years | 40 (3.1%) | 83 (5.6%) |
| 75 Years and over | 86 (13.5%) | 116 (11.5%) |
Technology Access in Neshoba County
Computing Device Access in Neshoba County
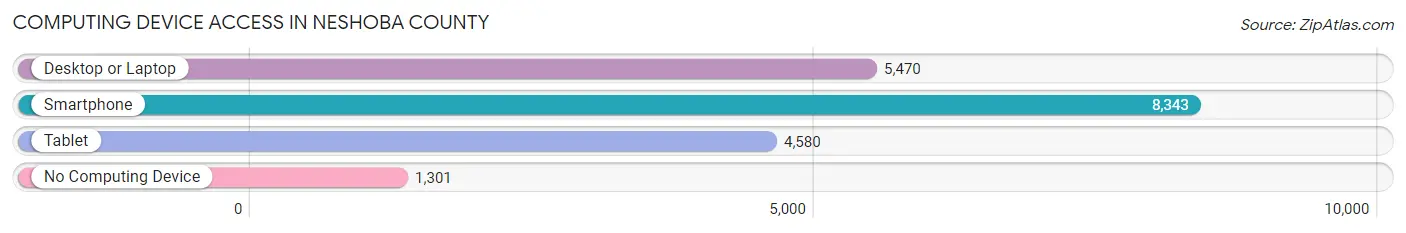
| Device Type | # Households | % Households |
| Desktop or Laptop | 5,470 | 53.6% |
| Smartphone | 8,343 | 81.8% |
| Tablet | 4,580 | 44.9% |
| No Computing Device | 1,301 | 12.8% |
| Total | 10,199 | 100.0% |
Internet Access in Neshoba County
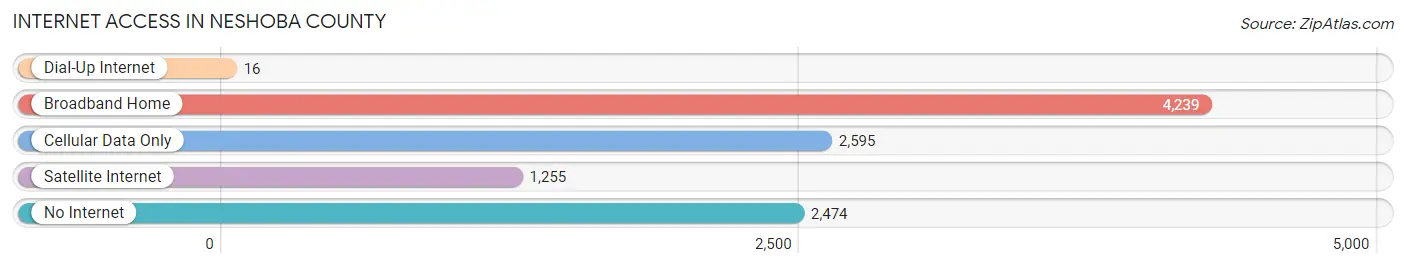
| Internet Type | # Households | % Households |
| Dial-Up Internet | 16 | 0.2% |
| Broadband Home | 4,239 | 41.6% |
| Cellular Data Only | 2,595 | 25.4% |
| Satellite Internet | 1,255 | 12.3% |
| No Internet | 2,474 | 24.3% |
| Total | 10,199 | 100.0% |
Neshoba County Summary
Neshoba County, Mississippi is located in the east-central part of the state, and is part of the larger region known as the Golden Triangle. It is bordered by Leake County to the north, Winston County to the east, Kemper County to the south, and Lauderdale County to the west. The county seat is Philadelphia, and the county is home to a population of 29,676 people, as of the 2010 census.
Neshoba County was established in 1833, and was named after the Choctaw word for “wolf”. The county was originally part of the Choctaw Nation, and was home to many Native American tribes prior to the arrival of European settlers. The county was home to the Choctaw Agency, which was established in 1820 and served as the headquarters for the Choctaw Nation.
Neshoba County is located in the heart of the Mississippi Delta, and is known for its rich agricultural heritage. The county is home to a variety of crops, including cotton, corn, soybeans, and wheat. The county is also home to a number of timber and lumber operations, as well as a number of manufacturing plants.
The economy of Neshoba County is largely based on agriculture and manufacturing. The county is home to a number of large employers, including the Neshoba County School District, the Neshoba County Hospital, and the Neshoba County Courthouse. The county is also home to a number of small businesses, including restaurants, retail stores, and service providers.
Neshoba County is home to a number of historic sites, including the Neshoba County Courthouse, the Neshoba County Hospital, and the Choctaw Agency. The county is also home to a number of museums, including the Neshoba County Museum, the Neshoba County Historical Society, and the Neshoba County Library.
The demographics of Neshoba County are largely reflective of the state of Mississippi as a whole. The population is predominantly white, with African Americans making up the second largest racial group. The median household income in the county is $37,845, and the median age is 38.7 years.
Neshoba County is a rural county, and is home to a number of small towns and communities. The largest city in the county is Philadelphia, which is home to a population of 7,477 people, as of the 2010 census. Other notable towns in the county include Union, Choctaw, and Pearl River.
Neshoba County is a beautiful and diverse county, with a rich history and a vibrant economy. The county is home to a number of historic sites, museums, and other attractions, and is a great place to live, work, and play.
Common Questions
What is Per Capita Income in Neshoba County?
Per Capita income in Neshoba County is $23,538.
What is the Median Family Income in Neshoba County?
Median Family Income in Neshoba County is $56,221.
What is the Median Household income in Neshoba County?
Median Household Income in Neshoba County is $47,400.
What is Income or Wage Gap in Neshoba County?
Income or Wage Gap in Neshoba County is 33.6%.
Women in Neshoba County earn 66.4 cents for every dollar earned by a man.
What is Family Income Deficit in Neshoba County?
Family Income Deficit in Neshoba County is $12,511.
Families that are below poverty line in Neshoba County earn $12,511 less on average than the poverty threshold level.
What is Inequality or Gini Index in Neshoba County?
Inequality or Gini Index in Neshoba County is 0.47.
What is the Total Population of Neshoba County?
Total Population of Neshoba County is 28,970.
What is the Total Male Population of Neshoba County?
Total Male Population of Neshoba County is 13,754.
What is the Total Female Population of Neshoba County?
Total Female Population of Neshoba County is 15,216.
What is the Ratio of Males per 100 Females in Neshoba County?
There are 90.39 Males per 100 Females in Neshoba County.
What is the Ratio of Females per 100 Males in Neshoba County?
There are 110.63 Females per 100 Males in Neshoba County.
What is the Median Population Age in Neshoba County?
Median Population Age in Neshoba County is 37.0 Years.
What is the Average Family Size in Neshoba County
Average Family Size in Neshoba County is 3.4 People.
What is the Average Household Size in Neshoba County
Average Household Size in Neshoba County is 2.8 People.
How Large is the Labor Force in Neshoba County?
There are 12,238 People in the Labor Forcein in Neshoba County.
What is the Percentage of People in the Labor Force in Neshoba County?
55.5% of People are in the Labor Force in Neshoba County.
What is the Unemployment Rate in Neshoba County?
Unemployment Rate in Neshoba County is 9.3%.