Lowndes County, MS Map & Demographics
Lowndes County Map
Lowndes County Overview
$29,750
PER CAPITA INCOME
$75,009
AVG FAMILY INCOME
$53,687
AVG HOUSEHOLD INCOME
34.6%
WAGE / INCOME GAP [ % ]
65.4¢/ $1
WAGE / INCOME GAP [ $ ]
$12,578
FAMILY INCOME DEFICIT
0.49
INEQUALITY / GINI INDEX
58,547
TOTAL POPULATION
27,946
MALE POPULATION
30,601
FEMALE POPULATION
91.32
MALES / 100 FEMALES
109.50
FEMALES / 100 MALES
37.1
MEDIAN AGE
3.2
AVG FAMILY SIZE
2.5
AVG HOUSEHOLD SIZE
26,735
LABOR FORCE [ PEOPLE ]
57.8%
PERCENT IN LABOR FORCE
6.2%
UNEMPLOYMENT RATE
Lowndes County Area Codes
Income in Lowndes County
Income Overview in Lowndes County
Per Capita Income in Lowndes County is $29,750, while median incomes of families and households are $75,009 and $53,687 respectively.
| Characteristic | Number | Measure |
| Per Capita Income | 58,547 | $29,750 |
| Median Family Income | 14,092 | $75,009 |
| Mean Family Income | 14,092 | $90,222 |
| Median Household Income | 22,651 | $53,687 |
| Mean Household Income | 22,651 | $72,963 |
| Income Deficit | 14,092 | $12,578 |
| Wage / Income Gap (%) | 58,547 | 34.64% |
| Wage / Income Gap ($) | 58,547 | 65.36¢ per $1 |
| Gini / Inequality Index | 58,547 | 0.49 |
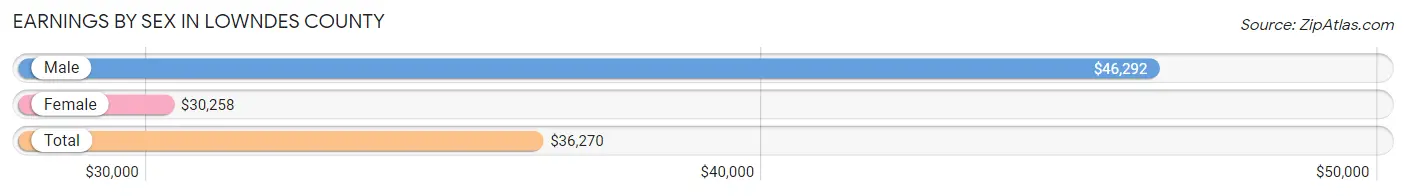
Earnings by Sex in Lowndes County
Average Earnings in Lowndes County are $36,270, $46,292 for men and $30,258 for women, a difference of 34.6%.
| Sex | Number | Average Earnings |
| Male | 14,043 (51.5%) | $46,292 |
| Female | 13,224 (48.5%) | $30,258 |
| Total | 27,267 (100.0%) | $36,270 |
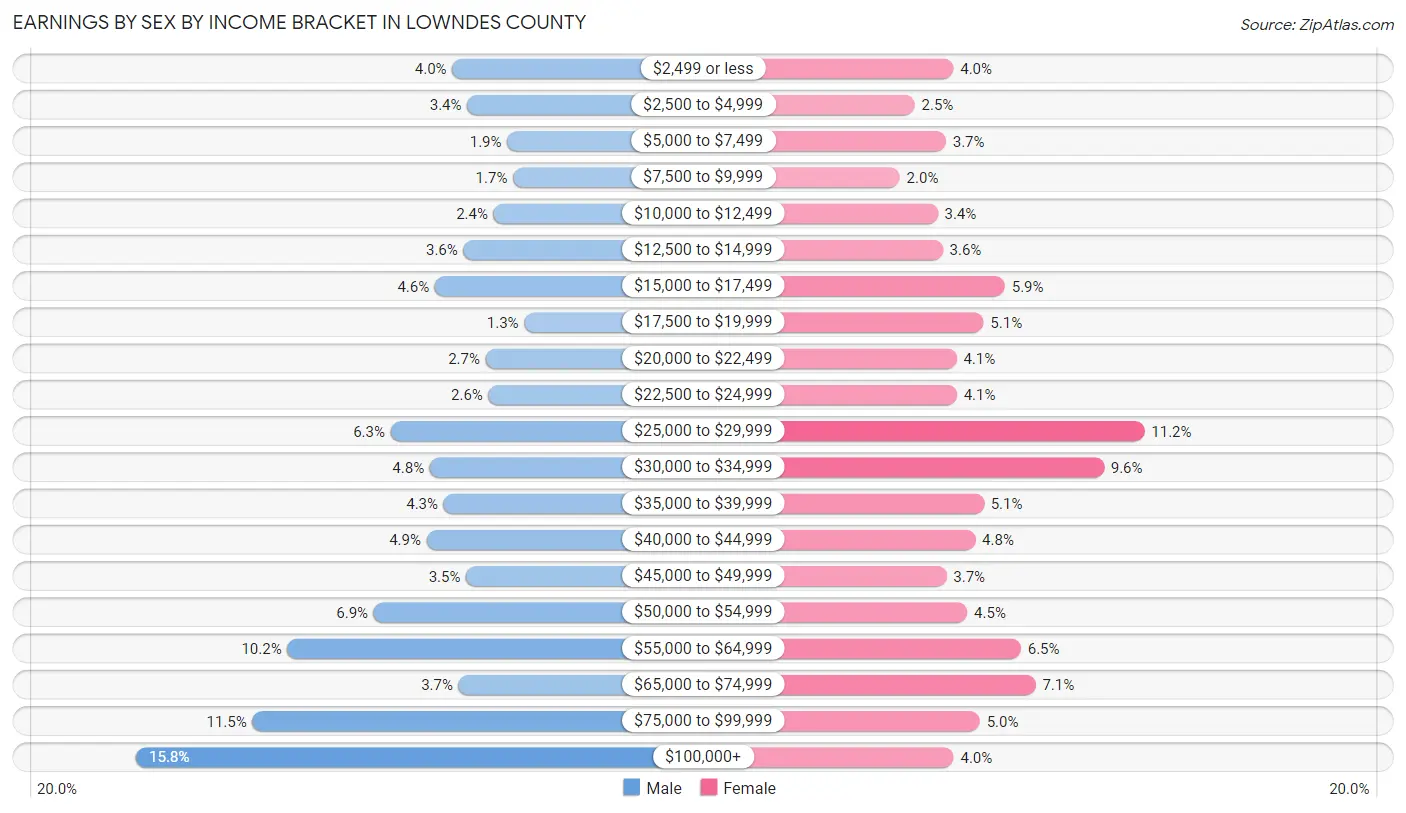
Earnings by Sex by Income Bracket in Lowndes County
The most common earnings brackets in Lowndes County are $100,000+ for men (2,221 | 15.8%) and $25,000 to $29,999 for women (1,474 | 11.2%).
| Income | Male | Female |
| $2,499 or less | 557 (4.0%) | 528 (4.0%) |
| $2,500 to $4,999 | 479 (3.4%) | 336 (2.5%) |
| $5,000 to $7,499 | 268 (1.9%) | 491 (3.7%) |
| $7,500 to $9,999 | 237 (1.7%) | 262 (2.0%) |
| $10,000 to $12,499 | 340 (2.4%) | 450 (3.4%) |
| $12,500 to $14,999 | 499 (3.5%) | 475 (3.6%) |
| $15,000 to $17,499 | 649 (4.6%) | 783 (5.9%) |
| $17,500 to $19,999 | 179 (1.3%) | 677 (5.1%) |
| $20,000 to $22,499 | 382 (2.7%) | 543 (4.1%) |
| $22,500 to $24,999 | 366 (2.6%) | 545 (4.1%) |
| $25,000 to $29,999 | 882 (6.3%) | 1,474 (11.2%) |
| $30,000 to $34,999 | 675 (4.8%) | 1,273 (9.6%) |
| $35,000 to $39,999 | 602 (4.3%) | 678 (5.1%) |
| $40,000 to $44,999 | 693 (4.9%) | 636 (4.8%) |
| $45,000 to $49,999 | 485 (3.5%) | 493 (3.7%) |
| $50,000 to $54,999 | 970 (6.9%) | 596 (4.5%) |
| $55,000 to $64,999 | 1,426 (10.2%) | 862 (6.5%) |
| $65,000 to $74,999 | 524 (3.7%) | 935 (7.1%) |
| $75,000 to $99,999 | 1,609 (11.5%) | 658 (5.0%) |
| $100,000+ | 2,221 (15.8%) | 529 (4.0%) |
| Total | 14,043 (100.0%) | 13,224 (100.0%) |
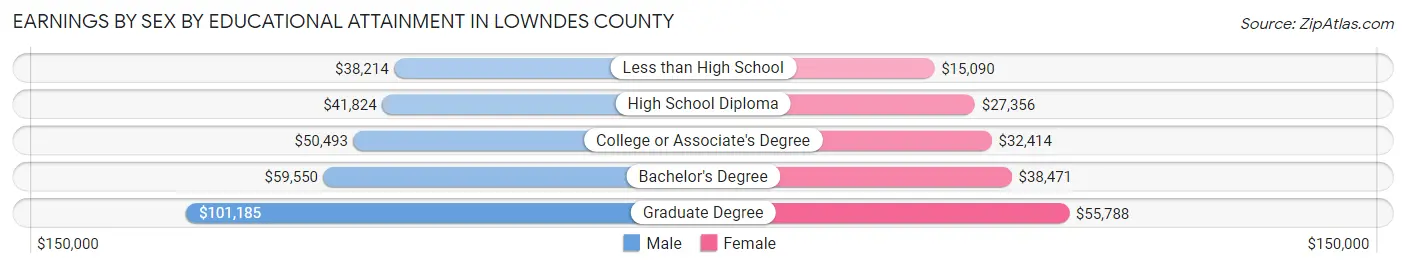
Earnings by Sex by Educational Attainment in Lowndes County
Average earnings in Lowndes County are $52,601 for men and $33,417 for women, a difference of 36.5%. Men with an educational attainment of graduate degree enjoy the highest average annual earnings of $101,185, while those with less than high school education earn the least with $38,214. Women with an educational attainment of graduate degree earn the most with the average annual earnings of $55,788, while those with less than high school education have the smallest earnings of $15,090.
| Educational Attainment | Male Income | Female Income |
| Less than High School | $38,214 | $15,090 |
| High School Diploma | $41,824 | $27,356 |
| College or Associate's Degree | $50,493 | $32,414 |
| Bachelor's Degree | $59,550 | $38,471 |
| Graduate Degree | $101,185 | $55,788 |
| Total | $52,601 | $33,417 |
Family Income in Lowndes County
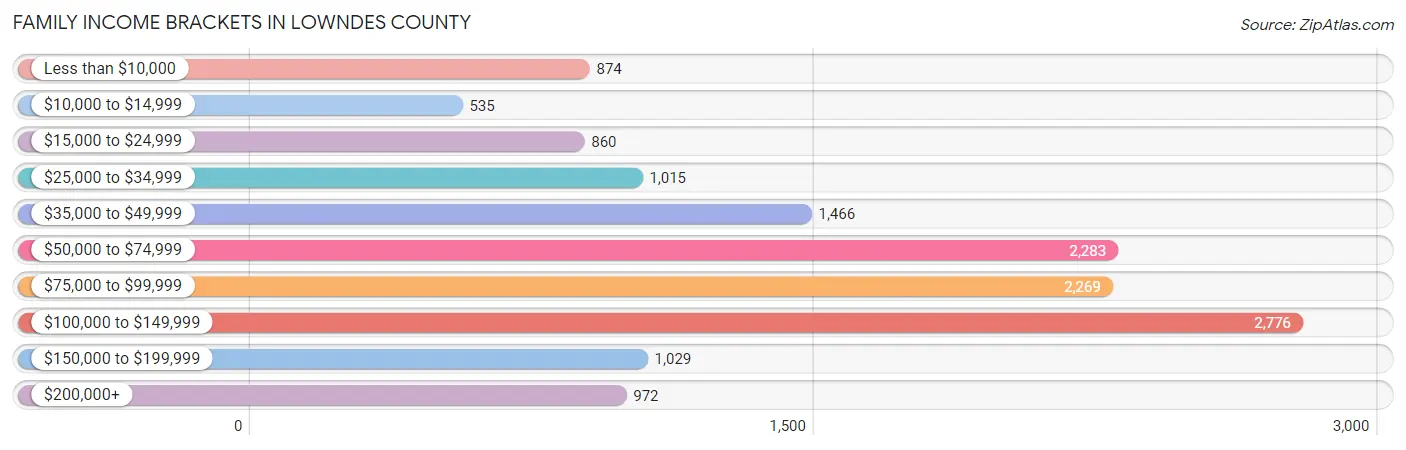
Family Income Brackets in Lowndes County
According to the Lowndes County family income data, there are 2,776 families falling into the $100,000 to $149,999 income range, which is the most common income bracket and makes up 19.7% of all families. Conversely, the $10,000 to $14,999 income bracket is the least frequent group with only 535 families (3.8%) belonging to this category.
| Income Bracket | # Families | % Families |
| Less than $10,000 | 874 | 6.2% |
| $10,000 to $14,999 | 535 | 3.8% |
| $15,000 to $24,999 | 860 | 6.1% |
| $25,000 to $34,999 | 1,015 | 7.2% |
| $35,000 to $49,999 | 1,466 | 10.4% |
| $50,000 to $74,999 | 2,283 | 16.2% |
| $75,000 to $99,999 | 2,269 | 16.1% |
| $100,000 to $149,999 | 2,776 | 19.7% |
| $150,000 to $199,999 | 1,029 | 7.3% |
| $200,000+ | 972 | 6.9% |
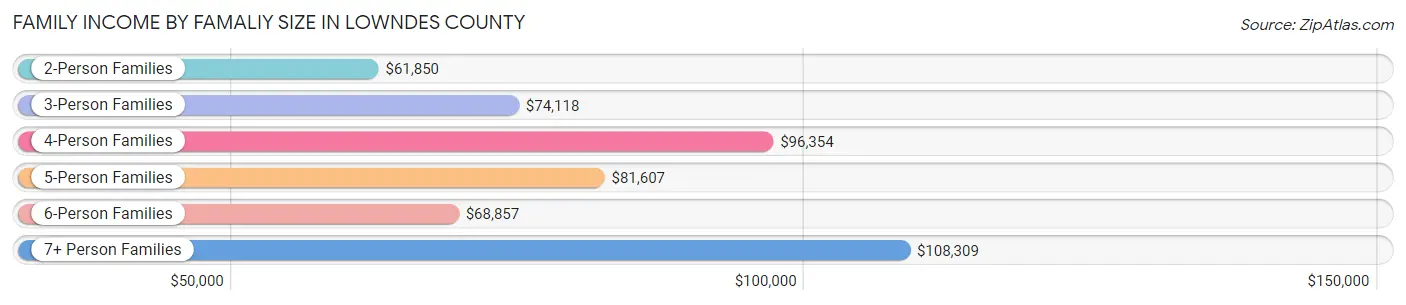
Family Income by Famaliy Size in Lowndes County
7+ person families (180 | 1.3%) account for the highest median family income in Lowndes County with $108,309 per family, while 2-person families (6,874 | 48.8%) have the highest median income of $30,925 per family member.
| Income Bracket | # Families | Median Income |
| 2-Person Families | 6,874 (48.8%) | $61,850 |
| 3-Person Families | 3,282 (23.3%) | $74,118 |
| 4-Person Families | 2,642 (18.8%) | $96,354 |
| 5-Person Families | 843 (6.0%) | $81,607 |
| 6-Person Families | 271 (1.9%) | $68,857 |
| 7+ Person Families | 180 (1.3%) | $108,309 |
| Total | 14,092 (100.0%) | $75,009 |
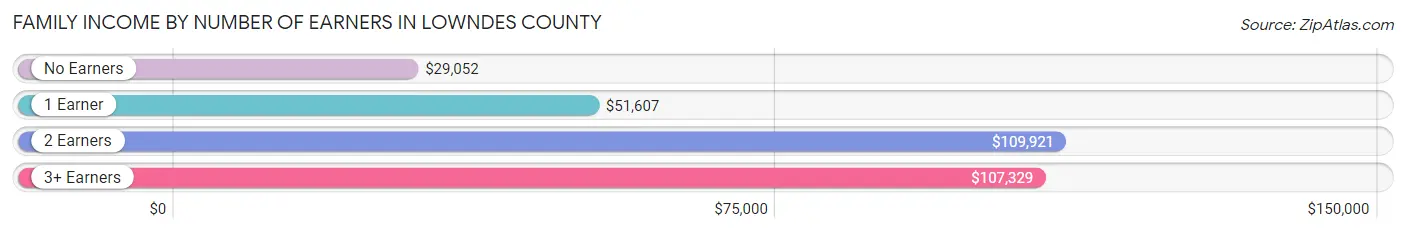
Family Income by Number of Earners in Lowndes County
The median family income in Lowndes County is $75,009, with families comprising 2 earners (5,158) having the highest median family income of $109,921, while families with no earners (2,394) have the lowest median family income of $29,052, accounting for 36.6% and 17.0% of families, respectively.
| Number of Earners | # Families | Median Income |
| No Earners | 2,394 (17.0%) | $29,052 |
| 1 Earner | 5,482 (38.9%) | $51,607 |
| 2 Earners | 5,158 (36.6%) | $109,921 |
| 3+ Earners | 1,058 (7.5%) | $107,329 |
| Total | 14,092 (100.0%) | $75,009 |
Household Income in Lowndes County
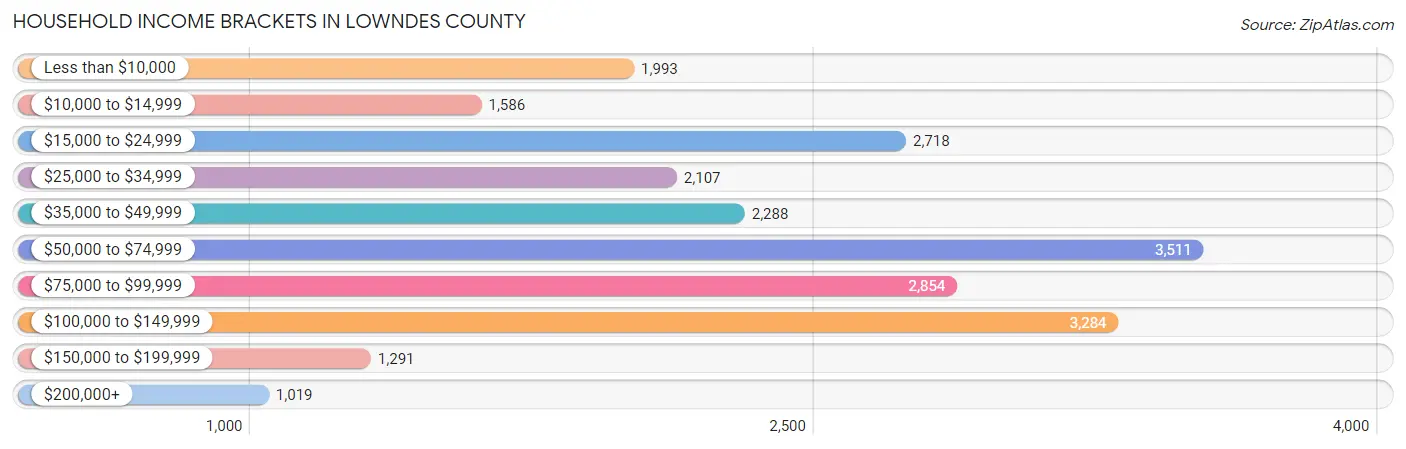
Household Income Brackets in Lowndes County
With 3,511 households falling in the category, the $50,000 to $74,999 income range is the most frequent in Lowndes County, accounting for 15.5% of all households. In contrast, only 1,019 households (4.5%) fall into the $200,000+ income bracket, making it the least populous group.
| Income Bracket | # Households | % Households |
| Less than $10,000 | 1,993 | 8.8% |
| $10,000 to $14,999 | 1,586 | 7.0% |
| $15,000 to $24,999 | 2,718 | 12.0% |
| $25,000 to $34,999 | 2,107 | 9.3% |
| $35,000 to $49,999 | 2,288 | 10.1% |
| $50,000 to $74,999 | 3,511 | 15.5% |
| $75,000 to $99,999 | 2,854 | 12.6% |
| $100,000 to $149,999 | 3,284 | 14.5% |
| $150,000 to $199,999 | 1,291 | 5.7% |
| $200,000+ | 1,019 | 4.5% |
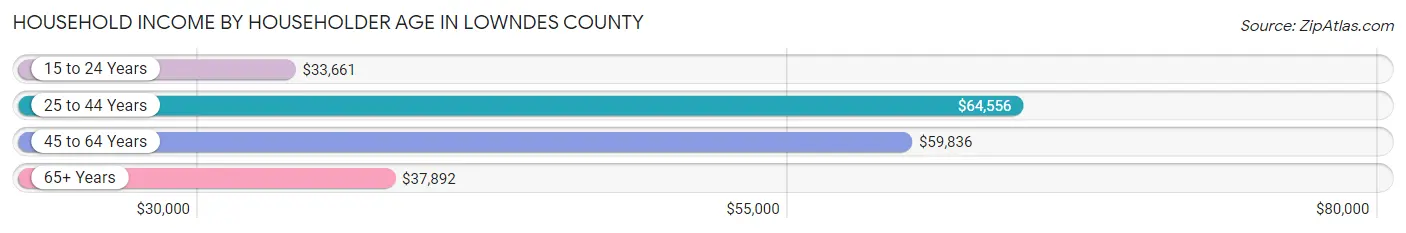
Household Income by Householder Age in Lowndes County
The median household income in Lowndes County is $53,687, with the highest median household income of $64,556 found in the 25 to 44 years age bracket for the primary householder. A total of 7,141 households (31.5%) fall into this category. Meanwhile, the 15 to 24 years age bracket for the primary householder has the lowest median household income of $33,661, with 826 households (3.6%) in this group.
| Income Bracket | # Households | Median Income |
| 15 to 24 Years | 826 (3.6%) | $33,661 |
| 25 to 44 Years | 7,141 (31.5%) | $64,556 |
| 45 to 64 Years | 8,328 (36.8%) | $59,836 |
| 65+ Years | 6,356 (28.1%) | $37,892 |
| Total | 22,651 (100.0%) | $53,687 |
Poverty in Lowndes County
Income Below Poverty by Sex and Age in Lowndes County
With 15.6% poverty level for males and 20.4% for females among the residents of Lowndes County, 16 and 17 year old males and under 5 year old females are the most vulnerable to poverty, with 338 males (44.3%) and 554 females (30.1%) in their respective age groups living below the poverty level.
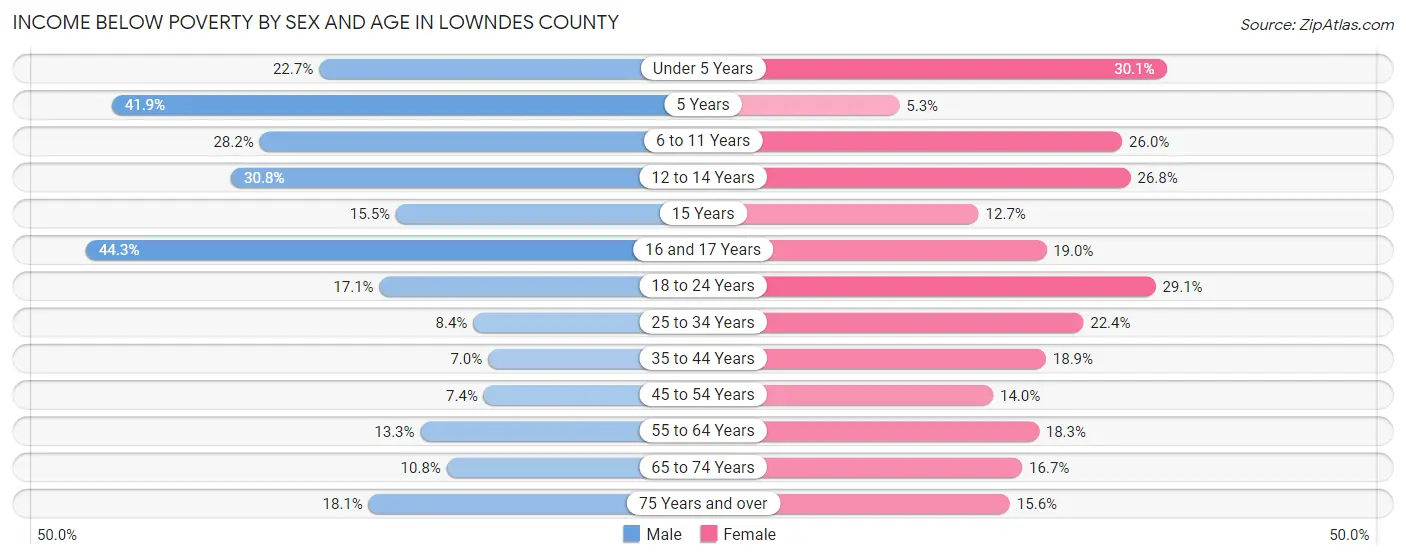
| Age Bracket | Male | Female |
| Under 5 Years | 428 (22.7%) | 554 (30.1%) |
| 5 Years | 194 (41.9%) | 19 (5.3%) |
| 6 to 11 Years | 619 (28.2%) | 567 (26.0%) |
| 12 to 14 Years | 377 (30.8%) | 275 (26.8%) |
| 15 Years | 55 (15.5%) | 48 (12.7%) |
| 16 and 17 Years | 338 (44.3%) | 143 (19.0%) |
| 18 to 24 Years | 441 (17.1%) | 726 (29.1%) |
| 25 to 34 Years | 314 (8.4%) | 915 (22.4%) |
| 35 to 44 Years | 232 (7.0%) | 681 (18.9%) |
| 45 to 54 Years | 219 (7.4%) | 487 (14.0%) |
| 55 to 64 Years | 477 (13.3%) | 721 (18.3%) |
| 65 to 74 Years | 283 (10.8%) | 509 (16.7%) |
| 75 Years and over | 243 (18.1%) | 370 (15.6%) |
| Total | 4,220 (15.6%) | 6,015 (20.4%) |
Income Above Poverty by Sex and Age in Lowndes County
According to the poverty statistics in Lowndes County, males aged 35 to 44 years and females aged 5 years are the age groups that are most secure financially, with 93.0% of males and 94.7% of females in these age groups living above the poverty line.
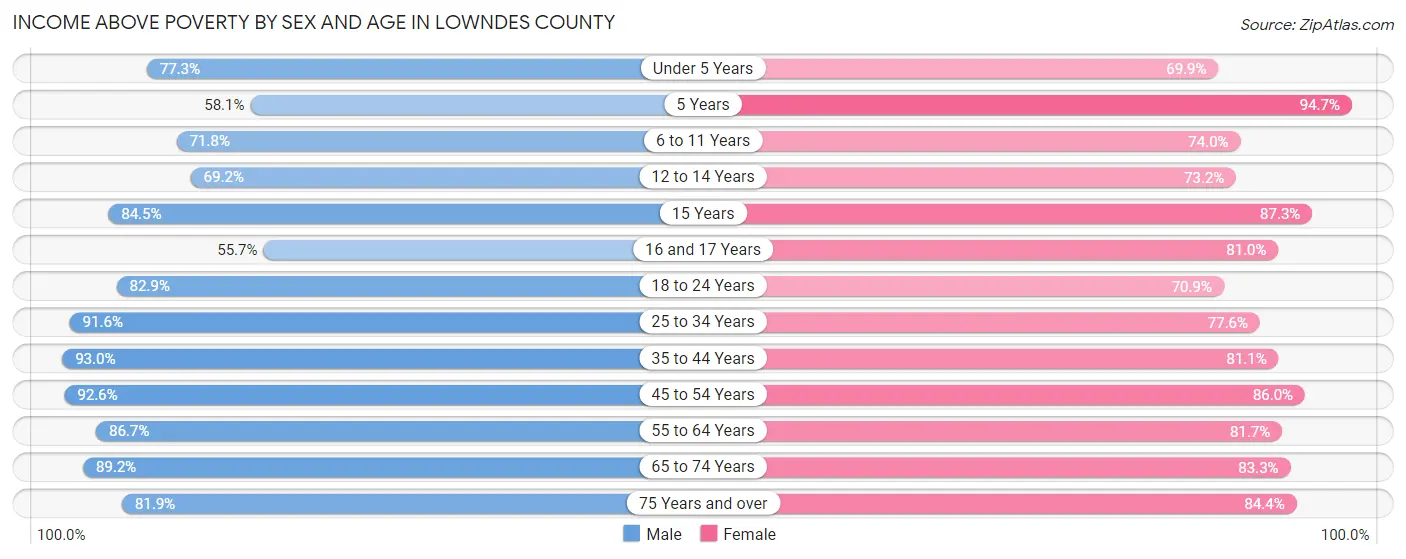
| Age Bracket | Male | Female |
| Under 5 Years | 1,459 (77.3%) | 1,286 (69.9%) |
| 5 Years | 269 (58.1%) | 337 (94.7%) |
| 6 to 11 Years | 1,576 (71.8%) | 1,612 (74.0%) |
| 12 to 14 Years | 846 (69.2%) | 751 (73.2%) |
| 15 Years | 299 (84.5%) | 330 (87.3%) |
| 16 and 17 Years | 425 (55.7%) | 611 (81.0%) |
| 18 to 24 Years | 2,142 (82.9%) | 1,768 (70.9%) |
| 25 to 34 Years | 3,436 (91.6%) | 3,168 (77.6%) |
| 35 to 44 Years | 3,088 (93.0%) | 2,915 (81.1%) |
| 45 to 54 Years | 2,746 (92.6%) | 2,981 (86.0%) |
| 55 to 64 Years | 3,117 (86.7%) | 3,224 (81.7%) |
| 65 to 74 Years | 2,331 (89.2%) | 2,532 (83.3%) |
| 75 Years and over | 1,102 (81.9%) | 2,002 (84.4%) |
| Total | 22,836 (84.4%) | 23,517 (79.6%) |
Income Below Poverty Among Married-Couple Families in Lowndes County
The poverty statistics for married-couple families in Lowndes County show that 4.2% or 392 of the total 9,449 families live below the poverty line. Families with 5 or more children have the highest poverty rate of 10.4%, comprising of 7 families. On the other hand, families with 1 or 2 children have the lowest poverty rate of 2.2%, which includes 73 families.
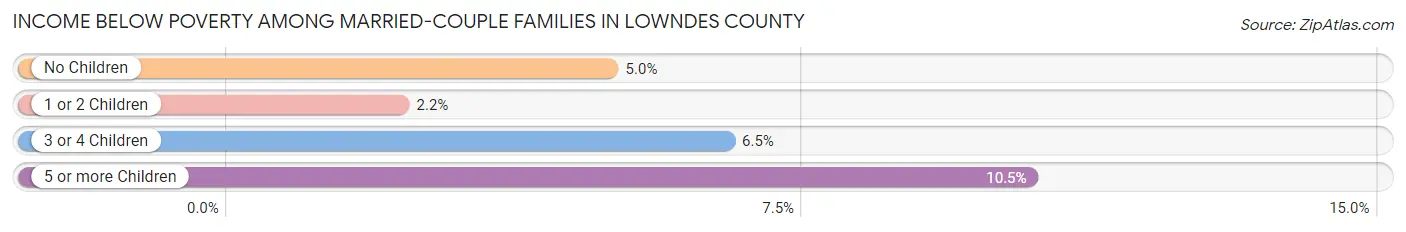
| Children | Above Poverty | Below Poverty |
| No Children | 5,319 (95.0%) | 278 (5.0%) |
| 1 or 2 Children | 3,188 (97.8%) | 73 (2.2%) |
| 3 or 4 Children | 490 (93.5%) | 34 (6.5%) |
| 5 or more Children | 60 (89.5%) | 7 (10.4%) |
| Total | 9,057 (95.9%) | 392 (4.2%) |
Income Below Poverty Among Single-Parent Households in Lowndes County
According to the poverty data in Lowndes County, 11.0% or 106 single-father households and 44.7% or 1,647 single-mother households are living below the poverty line. Among single-father households, those with 5 or more children have the highest poverty rate, with 12 households (100.0%) experiencing poverty. Likewise, among single-mother households, those with 3 or 4 children have the highest poverty rate, with 390 households (81.8%) falling below the poverty line.
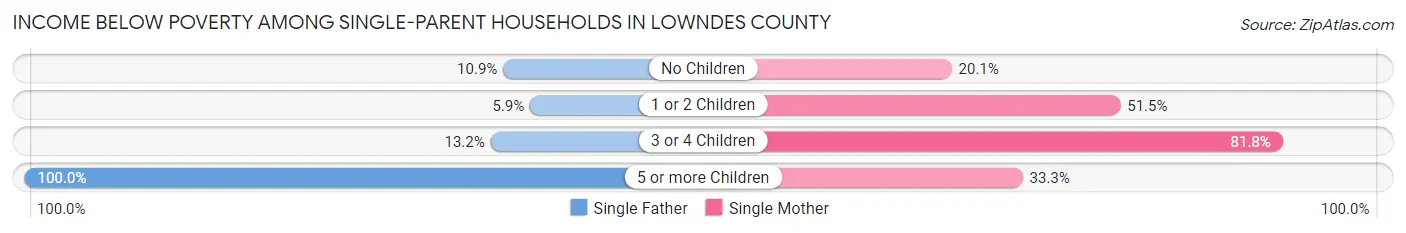
| Children | Single Father | Single Mother |
| No Children | 58 (10.9%) | 238 (20.1%) |
| 1 or 2 Children | 15 (5.9%) | 978 (51.5%) |
| 3 or 4 Children | 21 (13.2%) | 390 (81.8%) |
| 5 or more Children | 12 (100.0%) | 41 (33.3%) |
| Total | 106 (11.0%) | 1,647 (44.7%) |
Income Below Poverty Among Married-Couple vs Single-Parent Households in Lowndes County
The poverty data for Lowndes County shows that 392 of the married-couple family households (4.2%) and 1,753 of the single-parent households (37.8%) are living below the poverty level. Within the married-couple family households, those with 5 or more children have the highest poverty rate, with 7 households (10.4%) falling below the poverty line. Among the single-parent households, those with 3 or 4 children have the highest poverty rate, with 411 household (64.6%) living below poverty.
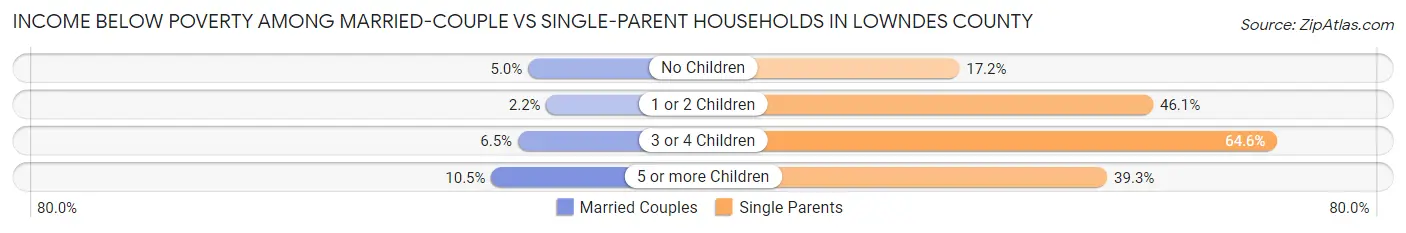
| Children | Married-Couple Families | Single-Parent Households |
| No Children | 278 (5.0%) | 296 (17.2%) |
| 1 or 2 Children | 73 (2.2%) | 993 (46.1%) |
| 3 or 4 Children | 34 (6.5%) | 411 (64.6%) |
| 5 or more Children | 7 (10.4%) | 53 (39.3%) |
| Total | 392 (4.2%) | 1,753 (37.8%) |
Race in Lowndes County
The most populous races in Lowndes County are White / Caucasian (29,678 | 50.7%), Black / African American (26,124 | 44.6%), and Hispanic or Latino (1,415 | 2.4%).
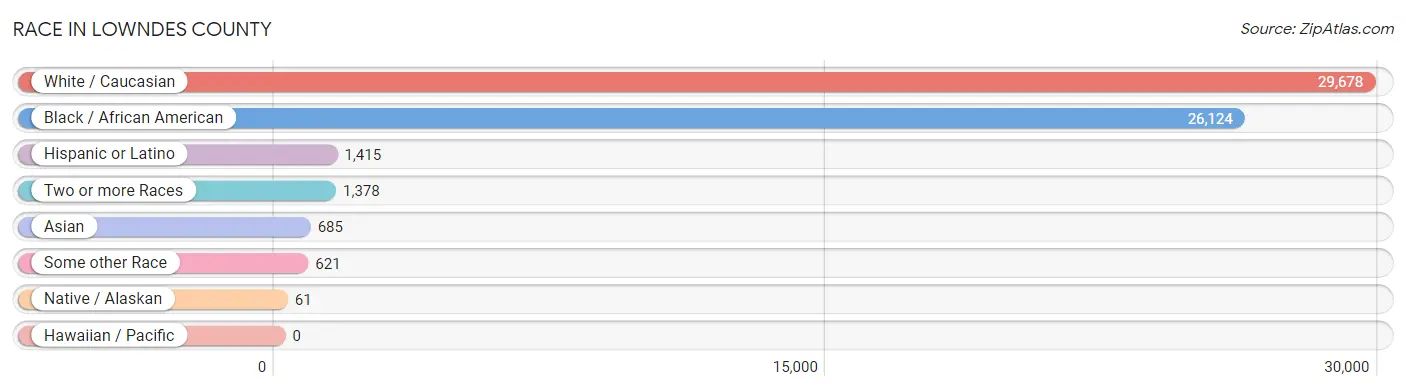
| Race | # Population | % Population |
| Asian | 685 | 1.2% |
| Black / African American | 26,124 | 44.6% |
| Hawaiian / Pacific | 0 | 0.0% |
| Hispanic or Latino | 1,415 | 2.4% |
| Native / Alaskan | 61 | 0.1% |
| White / Caucasian | 29,678 | 50.7% |
| Two or more Races | 1,378 | 2.4% |
| Some other Race | 621 | 1.1% |
| Total | 58,547 | 100.0% |
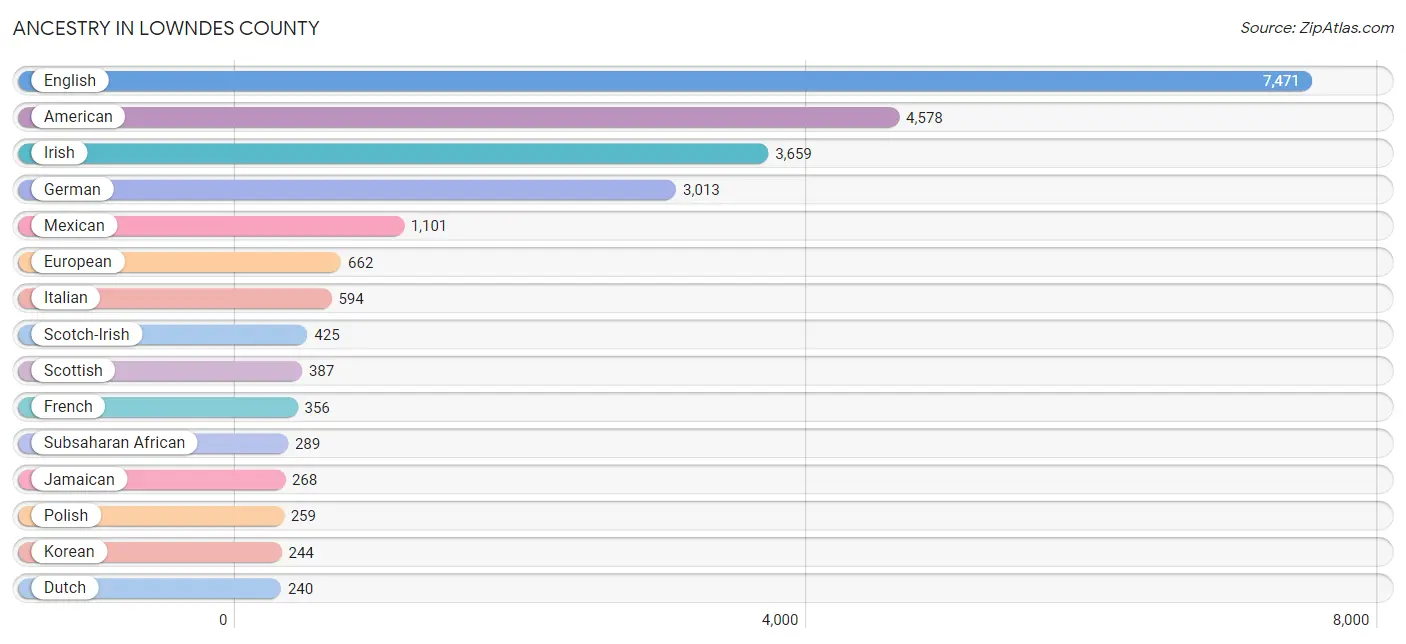
Ancestry in Lowndes County
The most populous ancestries reported in Lowndes County are English (7,471 | 12.8%), American (4,578 | 7.8%), Irish (3,659 | 6.2%), German (3,013 | 5.1%), and Mexican (1,101 | 1.9%), together accounting for 33.9% of all Lowndes County residents.
| Ancestry | # Population | % Population |
| African | 58 | 0.1% |
| American | 4,578 | 7.8% |
| Apache | 1 | 0.0% |
| Arab | 15 | 0.0% |
| Argentinean | 46 | 0.1% |
| Australian | 5 | 0.0% |
| Austrian | 11 | 0.0% |
| Belgian | 10 | 0.0% |
| Bhutanese | 47 | 0.1% |
| Bolivian | 11 | 0.0% |
| Brazilian | 11 | 0.0% |
| British | 208 | 0.4% |
| Burmese | 103 | 0.2% |
| Cambodian | 1 | 0.0% |
| Central American | 28 | 0.1% |
| Cherokee | 97 | 0.2% |
| Chickasaw | 2 | 0.0% |
| Chilean | 29 | 0.1% |
| Chippewa | 5 | 0.0% |
| Choctaw | 52 | 0.1% |
| Costa Rican | 22 | 0.0% |
| Creek | 46 | 0.1% |
| Croatian | 2 | 0.0% |
| Cuban | 14 | 0.0% |
| Czech | 140 | 0.2% |
| Czechoslovakian | 6 | 0.0% |
| Danish | 97 | 0.2% |
| Dutch | 240 | 0.4% |
| Eastern European | 5 | 0.0% |
| English | 7,471 | 12.8% |
| European | 662 | 1.1% |
| Finnish | 23 | 0.0% |
| French | 356 | 0.6% |
| French Canadian | 26 | 0.0% |
| German | 3,013 | 5.1% |
| Greek | 20 | 0.0% |
| Hungarian | 5 | 0.0% |
| Indian (Asian) | 119 | 0.2% |
| Irish | 3,659 | 6.2% |
| Italian | 594 | 1.0% |
| Jamaican | 268 | 0.5% |
| Korean | 244 | 0.4% |
| Mexican | 1,101 | 1.9% |
| Mexican American Indian | 12 | 0.0% |
| Navajo | 3 | 0.0% |
| Nigerian | 46 | 0.1% |
| Northern European | 28 | 0.1% |
| Norwegian | 77 | 0.1% |
| Pakistani | 7 | 0.0% |
| Panamanian | 6 | 0.0% |
| Polish | 259 | 0.4% |
| Portuguese | 4 | 0.0% |
| Puerto Rican | 53 | 0.1% |
| Russian | 46 | 0.1% |
| Scandinavian | 29 | 0.1% |
| Scotch-Irish | 425 | 0.7% |
| Scottish | 387 | 0.7% |
| Seminole | 19 | 0.0% |
| Slovak | 7 | 0.0% |
| South African | 185 | 0.3% |
| South American | 86 | 0.2% |
| Spaniard | 7 | 0.0% |
| Spanish | 50 | 0.1% |
| Sri Lankan | 52 | 0.1% |
| Subsaharan African | 289 | 0.5% |
| Swedish | 202 | 0.4% |
| Swiss | 69 | 0.1% |
| Syrian | 15 | 0.0% |
| Thai | 234 | 0.4% |
| Ukrainian | 16 | 0.0% |
| Welsh | 53 | 0.1% | View All 71 Rows |
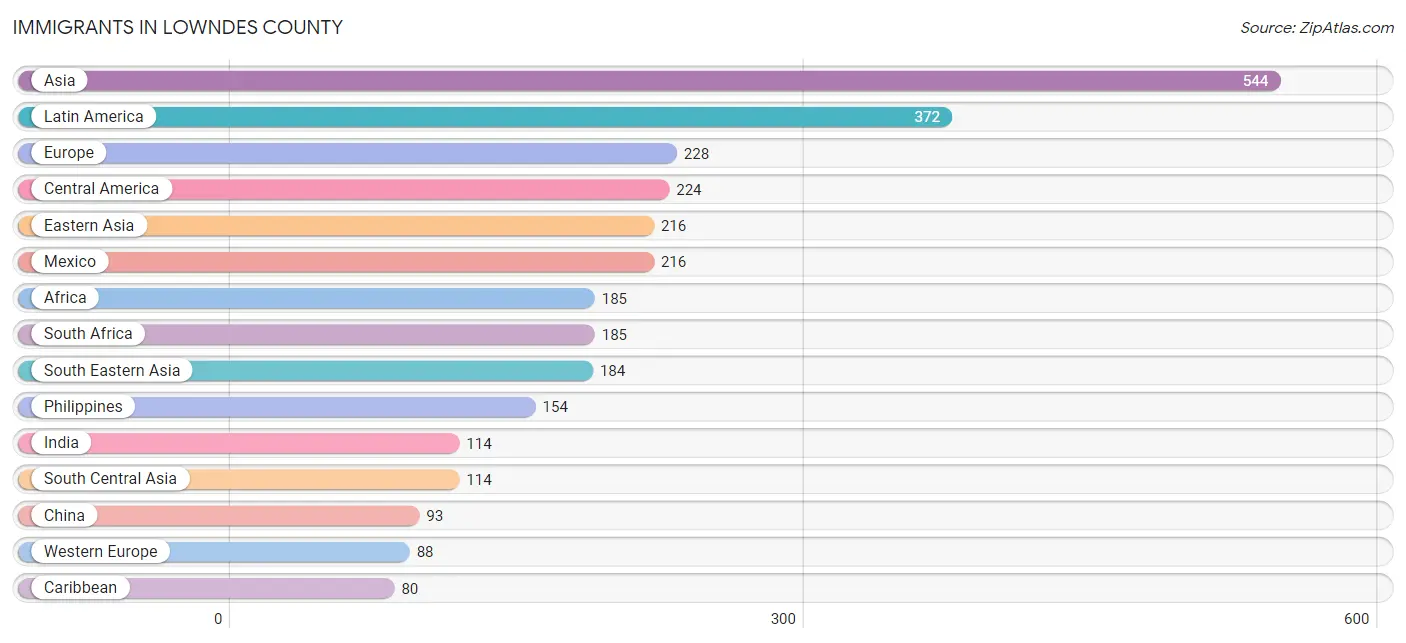
Immigrants in Lowndes County
The most numerous immigrant groups reported in Lowndes County came from Asia (544 | 0.9%), Latin America (372 | 0.6%), Europe (228 | 0.4%), Central America (224 | 0.4%), and Eastern Asia (216 | 0.4%), together accounting for 2.7% of all Lowndes County residents.
| Immigration Origin | # Population | % Population |
| Africa | 185 | 0.3% |
| Argentina | 46 | 0.1% |
| Asia | 544 | 0.9% |
| Bolivia | 11 | 0.0% |
| Brazil | 11 | 0.0% |
| Canada | 16 | 0.0% |
| Caribbean | 80 | 0.1% |
| Central America | 224 | 0.4% |
| China | 93 | 0.2% |
| Costa Rica | 8 | 0.0% |
| Eastern Asia | 216 | 0.4% |
| Eastern Europe | 42 | 0.1% |
| England | 20 | 0.0% |
| Europe | 228 | 0.4% |
| France | 14 | 0.0% |
| Germany | 74 | 0.1% |
| Greece | 9 | 0.0% |
| Haiti | 5 | 0.0% |
| Hong Kong | 17 | 0.0% |
| India | 114 | 0.2% |
| Ireland | 11 | 0.0% |
| Italy | 27 | 0.1% |
| Jamaica | 75 | 0.1% |
| Japan | 57 | 0.1% |
| Korea | 66 | 0.1% |
| Latin America | 372 | 0.6% |
| Mexico | 216 | 0.4% |
| Northern Europe | 62 | 0.1% |
| Oceania | 10 | 0.0% |
| Philippines | 154 | 0.3% |
| Russia | 42 | 0.1% |
| South Africa | 185 | 0.3% |
| South America | 68 | 0.1% |
| South Central Asia | 114 | 0.2% |
| South Eastern Asia | 184 | 0.3% |
| Southern Europe | 36 | 0.1% |
| Taiwan | 53 | 0.1% |
| Thailand | 7 | 0.0% |
| Turkey | 30 | 0.1% |
| Vietnam | 23 | 0.0% |
| Western Asia | 30 | 0.1% |
| Western Europe | 88 | 0.2% | View All 42 Rows |
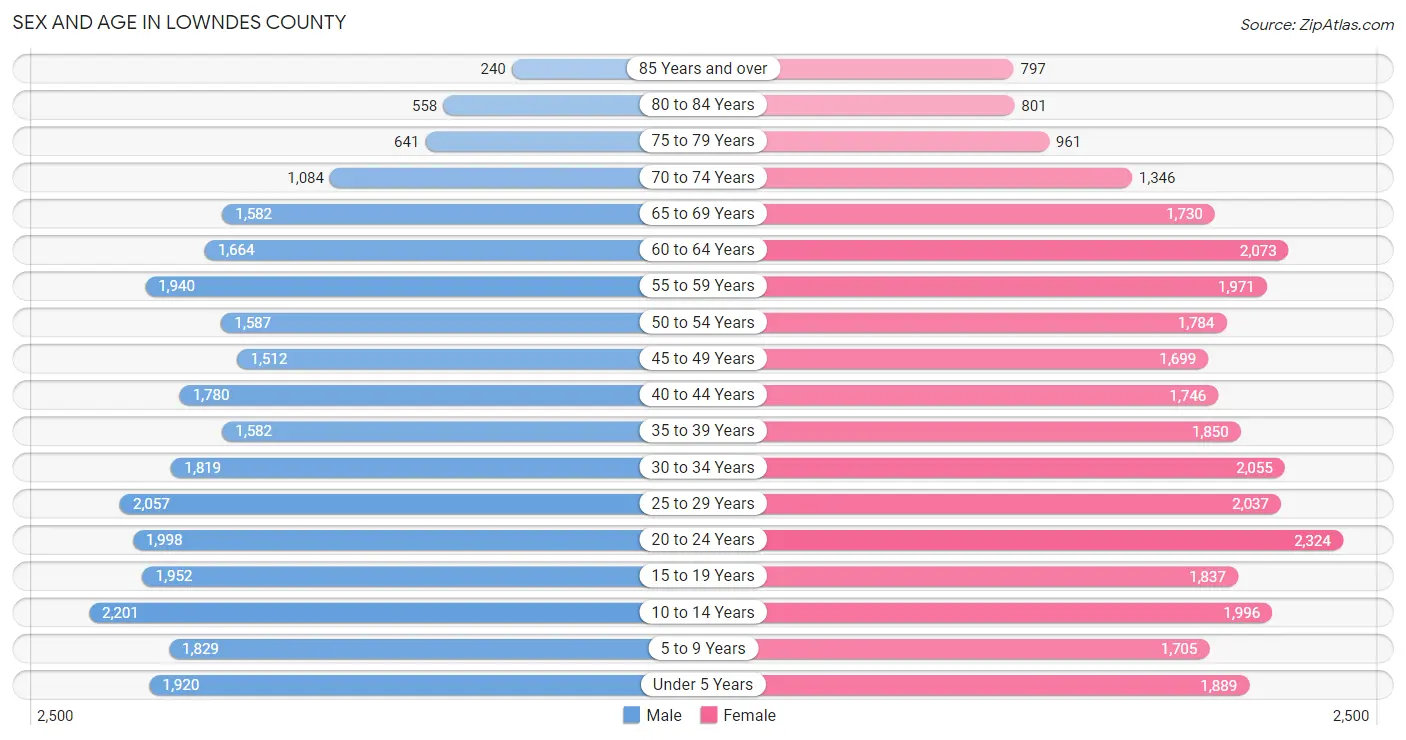
Sex and Age in Lowndes County
Sex and Age in Lowndes County
The most populous age groups in Lowndes County are 10 to 14 Years (2,201 | 7.9%) for men and 20 to 24 Years (2,324 | 7.6%) for women.
| Age Bracket | Male | Female |
| Under 5 Years | 1,920 (6.9%) | 1,889 (6.2%) |
| 5 to 9 Years | 1,829 (6.5%) | 1,705 (5.6%) |
| 10 to 14 Years | 2,201 (7.9%) | 1,996 (6.5%) |
| 15 to 19 Years | 1,952 (7.0%) | 1,837 (6.0%) |
| 20 to 24 Years | 1,998 (7.1%) | 2,324 (7.6%) |
| 25 to 29 Years | 2,057 (7.4%) | 2,037 (6.7%) |
| 30 to 34 Years | 1,819 (6.5%) | 2,055 (6.7%) |
| 35 to 39 Years | 1,582 (5.7%) | 1,850 (6.0%) |
| 40 to 44 Years | 1,780 (6.4%) | 1,746 (5.7%) |
| 45 to 49 Years | 1,512 (5.4%) | 1,699 (5.6%) |
| 50 to 54 Years | 1,587 (5.7%) | 1,784 (5.8%) |
| 55 to 59 Years | 1,940 (6.9%) | 1,971 (6.4%) |
| 60 to 64 Years | 1,664 (5.9%) | 2,073 (6.8%) |
| 65 to 69 Years | 1,582 (5.7%) | 1,730 (5.7%) |
| 70 to 74 Years | 1,084 (3.9%) | 1,346 (4.4%) |
| 75 to 79 Years | 641 (2.3%) | 961 (3.1%) |
| 80 to 84 Years | 558 (2.0%) | 801 (2.6%) |
| 85 Years and over | 240 (0.9%) | 797 (2.6%) |
| Total | 27,946 (100.0%) | 30,601 (100.0%) |
Families and Households in Lowndes County
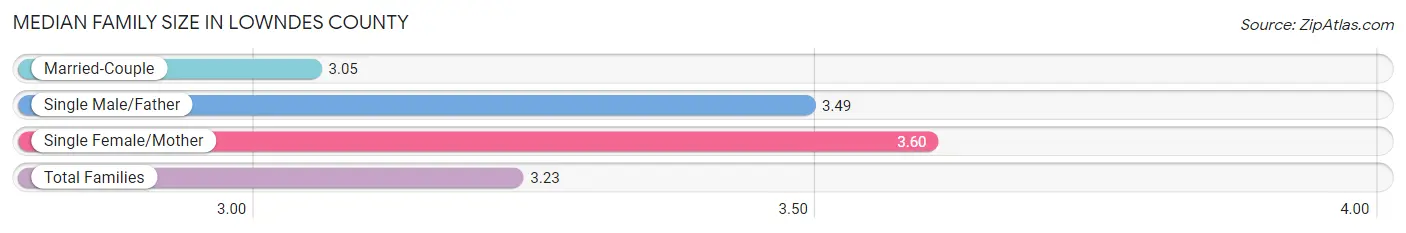
Median Family Size in Lowndes County
The median family size in Lowndes County is 3.23 persons per family, with single female/mother families (3,682 | 26.1%) accounting for the largest median family size of 3.6 persons per family. On the other hand, married-couple families (9,449 | 67.0%) represent the smallest median family size with 3.05 persons per family.
| Family Type | # Families | Family Size |
| Married-Couple | 9,449 (67.0%) | 3.05 |
| Single Male/Father | 961 (6.8%) | 3.49 |
| Single Female/Mother | 3,682 (26.1%) | 3.60 |
| Total Families | 14,092 (100.0%) | 3.23 |
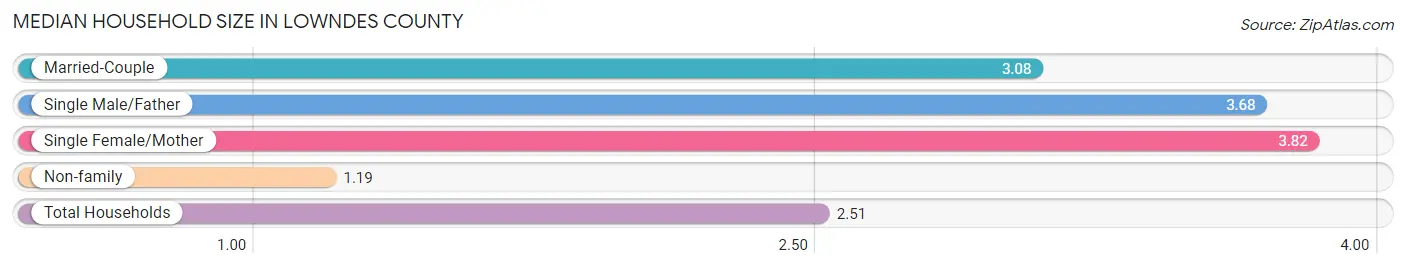
Median Household Size in Lowndes County
The median household size in Lowndes County is 2.51 persons per household, with single female/mother households (3,682 | 16.3%) accounting for the largest median household size of 3.82 persons per household. non-family households (8,559 | 37.8%) represent the smallest median household size with 1.19 persons per household.
| Household Type | # Households | Household Size |
| Married-Couple | 9,449 (41.7%) | 3.08 |
| Single Male/Father | 961 (4.2%) | 3.68 |
| Single Female/Mother | 3,682 (16.3%) | 3.82 |
| Non-family | 8,559 (37.8%) | 1.19 |
| Total Households | 22,651 (100.0%) | 2.51 |
Household Size by Marriage Status in Lowndes County
Out of a total of 22,651 households in Lowndes County, 14,092 (62.2%) are family households, while 8,559 (37.8%) are nonfamily households. The most numerous type of family households are 2-person households, comprising 6,348, and the most common type of nonfamily households are 1-person households, comprising 7,592.
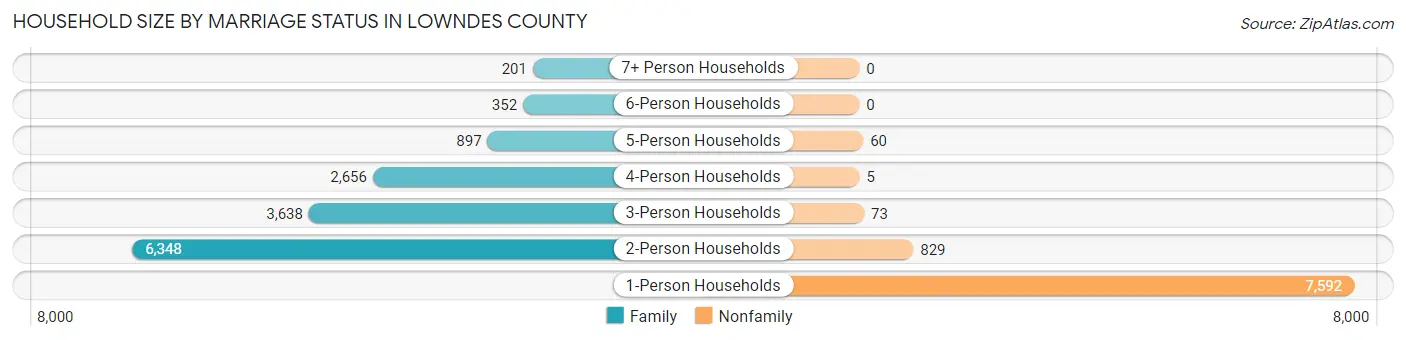
| Household Size | Family Households | Nonfamily Households |
| 1-Person Households | - | 7,592 (33.5%) |
| 2-Person Households | 6,348 (28.0%) | 829 (3.7%) |
| 3-Person Households | 3,638 (16.1%) | 73 (0.3%) |
| 4-Person Households | 2,656 (11.7%) | 5 (0.0%) |
| 5-Person Households | 897 (4.0%) | 60 (0.3%) |
| 6-Person Households | 352 (1.5%) | 0 (0.0%) |
| 7+ Person Households | 201 (0.9%) | 0 (0.0%) |
| Total | 14,092 (62.2%) | 8,559 (37.8%) |
Female Fertility in Lowndes County
Fertility by Age in Lowndes County
Average fertility rate in Lowndes County is 62.0 births per 1,000 women. Women in the age bracket of 20 to 34 years have the highest fertility rate with 95.0 births per 1,000 women. Women in the age bracket of 20 to 34 years acount for 72.0% of all women with births.
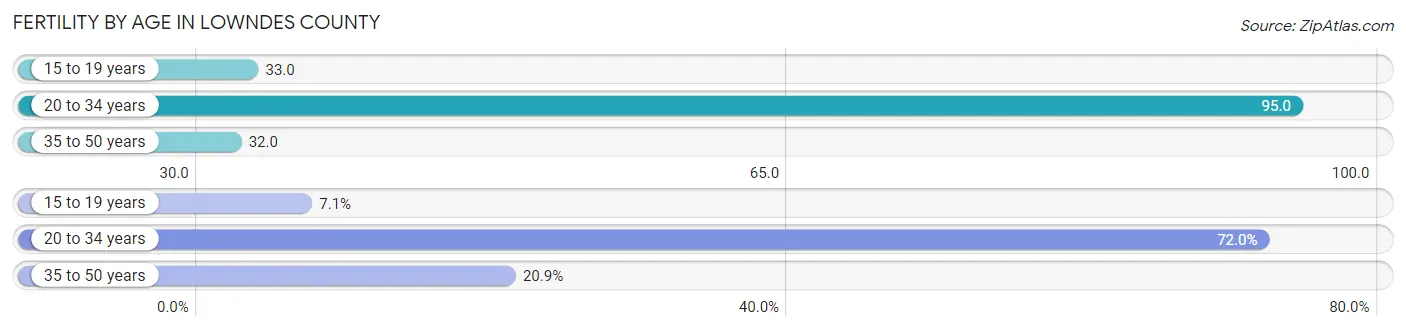
| Age Bracket | Women with Births | Births / 1,000 Women |
| 15 to 19 years | 60 (7.1%) | 33.0 |
| 20 to 34 years | 610 (72.0%) | 95.0 |
| 35 to 50 years | 177 (20.9%) | 32.0 |
| Total | 847 (100.0%) | 62.0 |
Fertility by Age by Marriage Status in Lowndes County
60.8% of women with births (847) in Lowndes County are married. The highest percentage of unmarried women with births falls into 15 to 19 years age bracket with 100.0% of them unmarried at the time of birth, while the lowest percentage of unmarried women with births belong to 20 to 34 years age bracket with 28.2% of them unmarried.
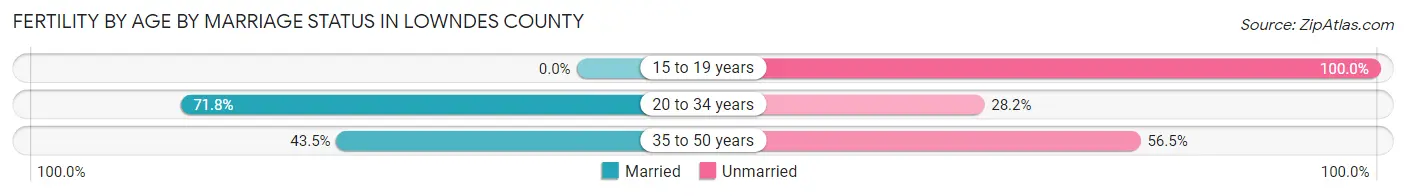
| Age Bracket | Married | Unmarried |
| 15 to 19 years | 0 (0.0%) | 60 (100.0%) |
| 20 to 34 years | 438 (71.8%) | 172 (28.2%) |
| 35 to 50 years | 77 (43.5%) | 100 (56.5%) |
| Total | 515 (60.8%) | 332 (39.2%) |
Fertility by Education in Lowndes County
Average fertility rate in Lowndes County is 62.0 births per 1,000 women. Women with the education attainment of graduate degree have the highest fertility rate of 200.0 births per 1,000 women, while women with the education attainment of high school diploma have the lowest fertility at 31.0 births per 1,000 women. Women with the education attainment of college or associate's degree represent 27.4% of all women with births.
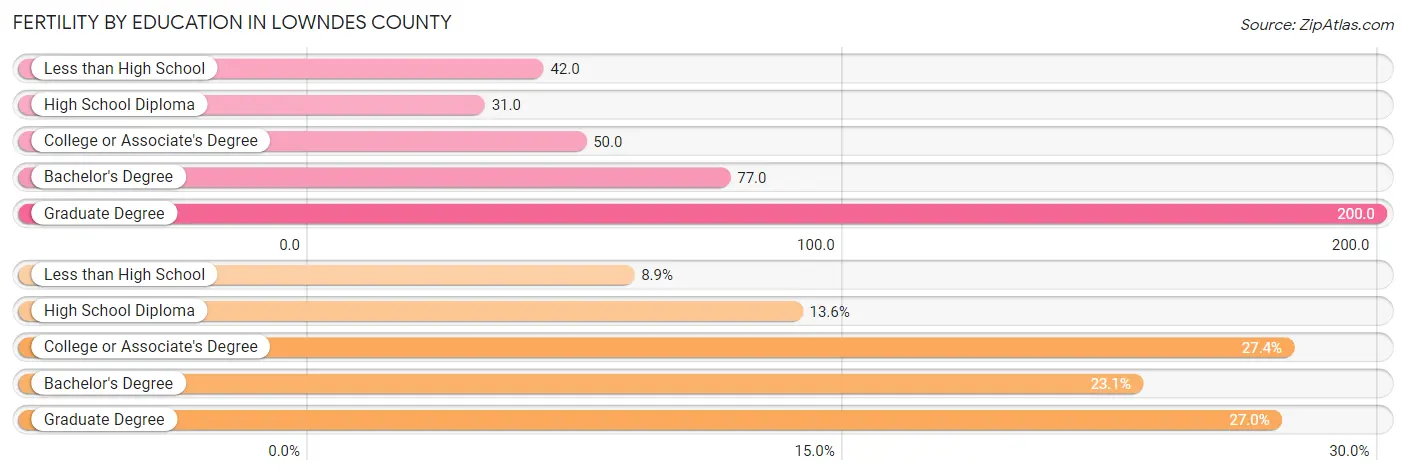
| Educational Attainment | Women with Births | Births / 1,000 Women |
| Less than High School | 75 (8.8%) | 42.0 |
| High School Diploma | 115 (13.6%) | 31.0 |
| College or Associate's Degree | 232 (27.4%) | 50.0 |
| Bachelor's Degree | 196 (23.1%) | 77.0 |
| Graduate Degree | 229 (27.0%) | 200.0 |
| Total | 847 (100.0%) | 62.0 |
Fertility by Education by Marriage Status in Lowndes County
39.2% of women with births in Lowndes County are unmarried. Women with the educational attainment of bachelor's degree are most likely to be married with 83.7% of them married at childbirth, while women with the educational attainment of less than high school are least likely to be married with 80.0% of them unmarried at childbirth.
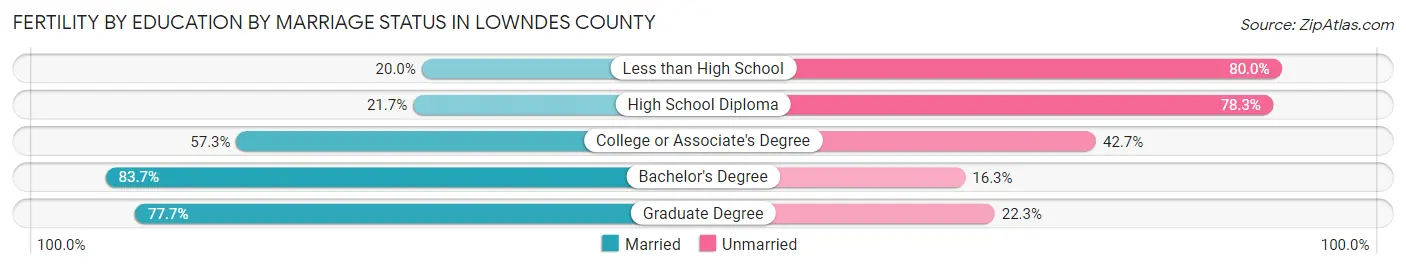
| Educational Attainment | Married | Unmarried |
| Less than High School | 15 (20.0%) | 60 (80.0%) |
| High School Diploma | 25 (21.7%) | 90 (78.3%) |
| College or Associate's Degree | 133 (57.3%) | 99 (42.7%) |
| Bachelor's Degree | 164 (83.7%) | 32 (16.3%) |
| Graduate Degree | 178 (77.7%) | 51 (22.3%) |
| Total | 515 (60.8%) | 332 (39.2%) |
Employment Characteristics in Lowndes County
Employment by Class of Employer in Lowndes County
Among the 24,604 employed individuals in Lowndes County, private company employees (15,610 | 63.4%), federal government employees (2,530 | 10.3%), and not-for-profit organizations (1,542 | 6.3%) make up the most common classes of employment.
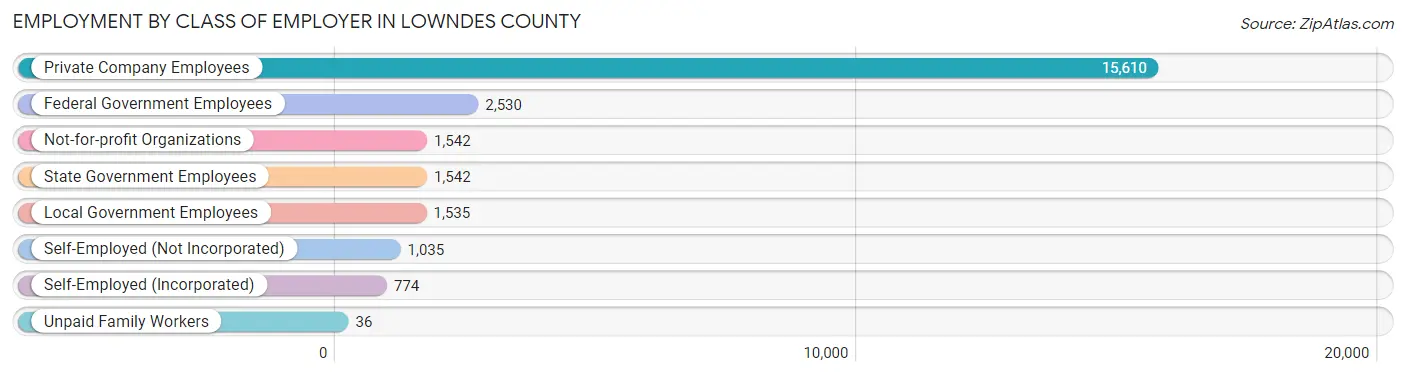
| Employer Class | # Employees | % Employees |
| Private Company Employees | 15,610 | 63.4% |
| Self-Employed (Incorporated) | 774 | 3.2% |
| Self-Employed (Not Incorporated) | 1,035 | 4.2% |
| Not-for-profit Organizations | 1,542 | 6.3% |
| Local Government Employees | 1,535 | 6.2% |
| State Government Employees | 1,542 | 6.3% |
| Federal Government Employees | 2,530 | 10.3% |
| Unpaid Family Workers | 36 | 0.2% |
| Total | 24,604 | 100.0% |
Employment Status by Age in Lowndes County
According to the labor force statistics for Lowndes County, out of the total population over 16 years of age (46,255), 57.8% or 26,735 individuals are in the labor force, with 6.2% or 1,658 of them unemployed. The age group with the highest labor force participation rate is 30 to 34 years, with 87.0% or 3,370 individuals in the labor force. Within the labor force, the 20 to 24 years age range has the highest percentage of unemployed individuals, with 16.0% or 369 of them being unemployed.
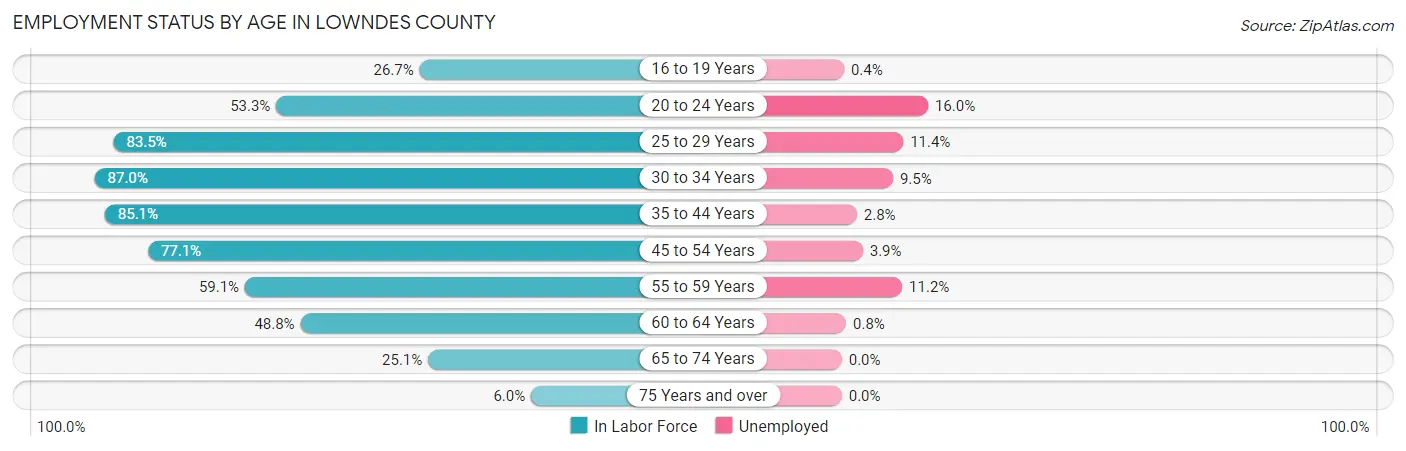
| Age Bracket | In Labor Force | Unemployed |
| 16 to 19 Years | 811 (26.7%) | 3 (0.4%) |
| 20 to 24 Years | 2,304 (53.3%) | 369 (16.0%) |
| 25 to 29 Years | 3,418 (83.5%) | 390 (11.4%) |
| 30 to 34 Years | 3,370 (87.0%) | 320 (9.5%) |
| 35 to 44 Years | 5,921 (85.1%) | 166 (2.8%) |
| 45 to 54 Years | 5,075 (77.1%) | 198 (3.9%) |
| 55 to 59 Years | 2,311 (59.1%) | 259 (11.2%) |
| 60 to 64 Years | 1,824 (48.8%) | 15 (0.8%) |
| 65 to 74 Years | 1,441 (25.1%) | 0 (0.0%) |
| 75 Years and over | 240 (6.0%) | 0 (0.0%) |
| Total | 26,735 (57.8%) | 1,658 (6.2%) |
Employment Status by Educational Attainment in Lowndes County
According to labor force statistics for Lowndes County, 75.2% of individuals (21,925) out of the total population between 25 and 64 years of age (29,156) are in the labor force, with 6.0% or 1,316 of them being unemployed. The group with the highest labor force participation rate are those with the educational attainment of bachelor's degree or higher, with 84.0% or 6,666 individuals in the labor force. Within the labor force, individuals with college / associate degree education have the highest percentage of unemployment, with 9.5% or 677 of them being unemployed.
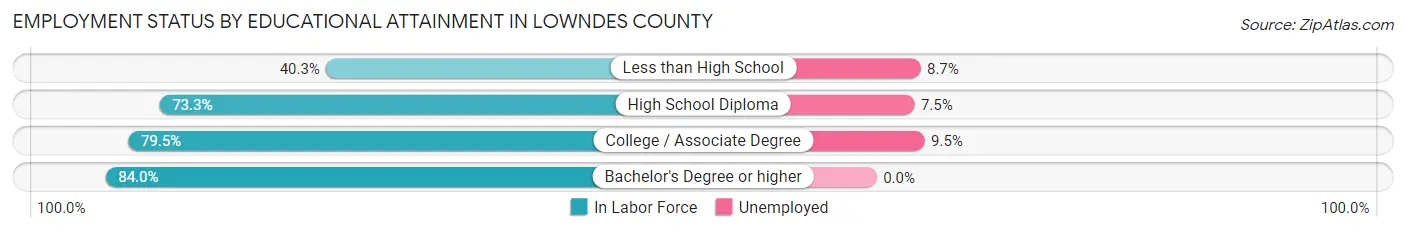
| Educational Attainment | In Labor Force | Unemployed |
| Less than High School | 1,056 (40.3%) | 228 (8.7%) |
| High School Diploma | 7,065 (73.3%) | 723 (7.5%) |
| College / Associate Degree | 7,125 (79.5%) | 851 (9.5%) |
| Bachelor's Degree or higher | 6,666 (84.0%) | 0 (0.0%) |
| Total | 21,925 (75.2%) | 1,749 (6.0%) |
Employment Occupations by Sex in Lowndes County
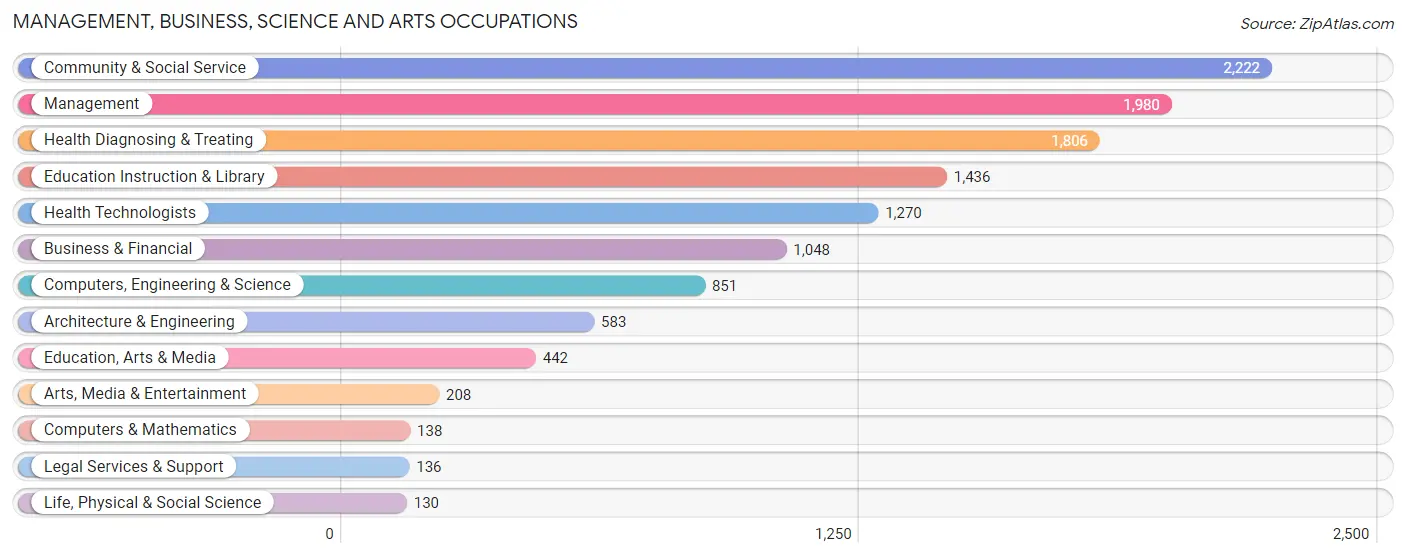
Management, Business, Science and Arts Occupations
The most common Management, Business, Science and Arts occupations in Lowndes County are Community & Social Service (2,222 | 9.3%), Management (1,980 | 8.3%), Health Diagnosing & Treating (1,806 | 7.6%), Education Instruction & Library (1,436 | 6.0%), and Health Technologists (1,270 | 5.3%).
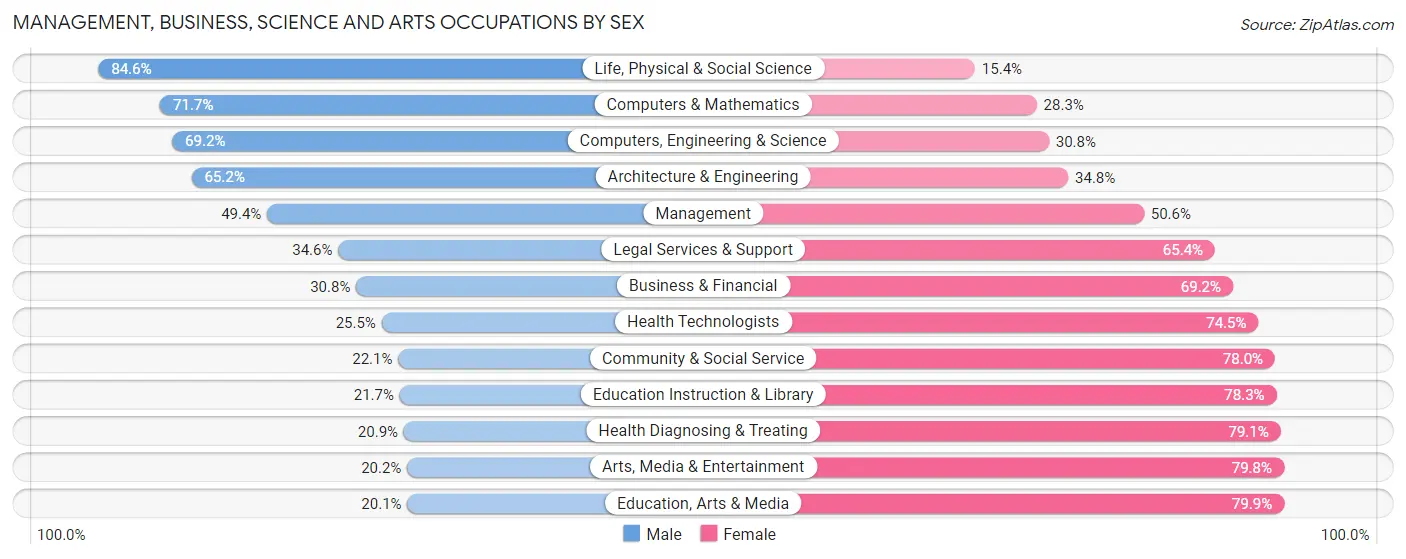
Management, Business, Science and Arts Occupations by Sex
Within the Management, Business, Science and Arts occupations in Lowndes County, the most male-oriented occupations are Life, Physical & Social Science (84.6%), Computers & Mathematics (71.7%), and Computers, Engineering & Science (69.2%), while the most female-oriented occupations are Education, Arts & Media (79.9%), Arts, Media & Entertainment (79.8%), and Health Diagnosing & Treating (79.1%).
| Occupation | Male | Female |
| Management | 978 (49.4%) | 1,002 (50.6%) |
| Business & Financial | 323 (30.8%) | 725 (69.2%) |
| Computers, Engineering & Science | 589 (69.2%) | 262 (30.8%) |
| Computers & Mathematics | 99 (71.7%) | 39 (28.3%) |
| Architecture & Engineering | 380 (65.2%) | 203 (34.8%) |
| Life, Physical & Social Science | 110 (84.6%) | 20 (15.4%) |
| Community & Social Service | 490 (22.1%) | 1,732 (77.9%) |
| Education, Arts & Media | 89 (20.1%) | 353 (79.9%) |
| Legal Services & Support | 47 (34.6%) | 89 (65.4%) |
| Education Instruction & Library | 312 (21.7%) | 1,124 (78.3%) |
| Arts, Media & Entertainment | 42 (20.2%) | 166 (79.8%) |
| Health Diagnosing & Treating | 377 (20.9%) | 1,429 (79.1%) |
| Health Technologists | 324 (25.5%) | 946 (74.5%) |
| Total (Category) | 2,757 (34.9%) | 5,150 (65.1%) |
| Total (Overall) | 11,832 (49.7%) | 11,995 (50.3%) |
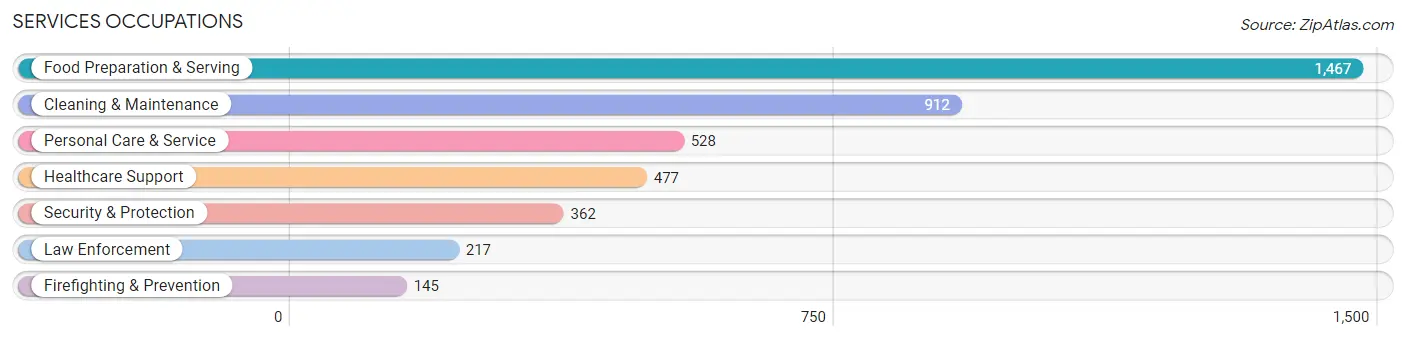
Services Occupations
The most common Services occupations in Lowndes County are Food Preparation & Serving (1,467 | 6.2%), Cleaning & Maintenance (912 | 3.8%), Personal Care & Service (528 | 2.2%), Healthcare Support (477 | 2.0%), and Security & Protection (362 | 1.5%).
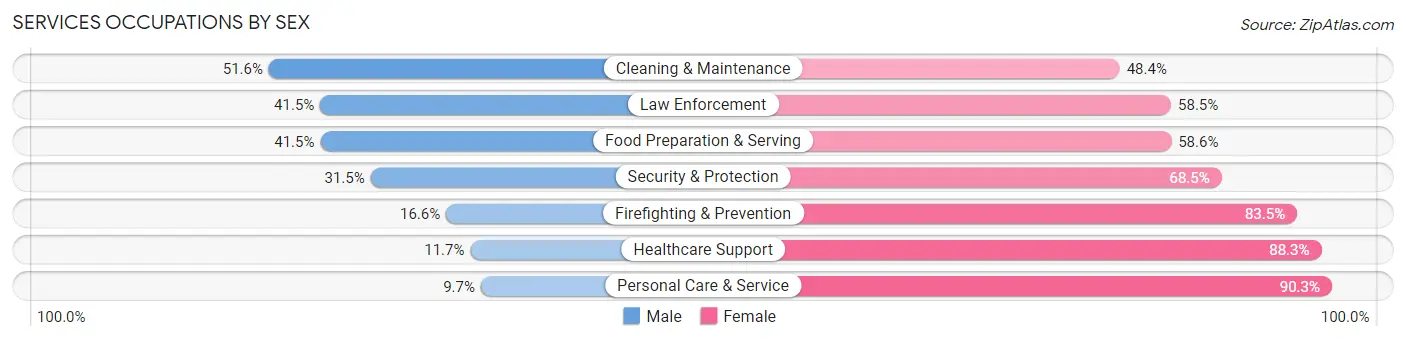
Services Occupations by Sex
Within the Services occupations in Lowndes County, the most male-oriented occupations are Cleaning & Maintenance (51.6%), Law Enforcement (41.5%), and Food Preparation & Serving (41.4%), while the most female-oriented occupations are Personal Care & Service (90.3%), Healthcare Support (88.3%), and Firefighting & Prevention (83.5%).
| Occupation | Male | Female |
| Healthcare Support | 56 (11.7%) | 421 (88.3%) |
| Security & Protection | 114 (31.5%) | 248 (68.5%) |
| Firefighting & Prevention | 24 (16.6%) | 121 (83.5%) |
| Law Enforcement | 90 (41.5%) | 127 (58.5%) |
| Food Preparation & Serving | 608 (41.4%) | 859 (58.6%) |
| Cleaning & Maintenance | 471 (51.6%) | 441 (48.4%) |
| Personal Care & Service | 51 (9.7%) | 477 (90.3%) |
| Total (Category) | 1,300 (34.7%) | 2,446 (65.3%) |
| Total (Overall) | 11,832 (49.7%) | 11,995 (50.3%) |
Sales and Office Occupations
The most common Sales and Office occupations in Lowndes County are Sales & Related (2,509 | 10.5%), and Office & Administration (2,280 | 9.6%).
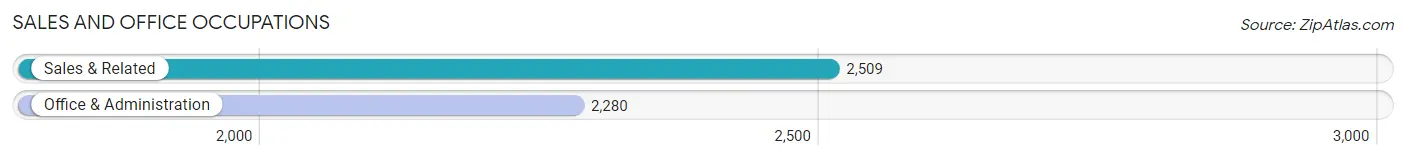
Sales and Office Occupations by Sex
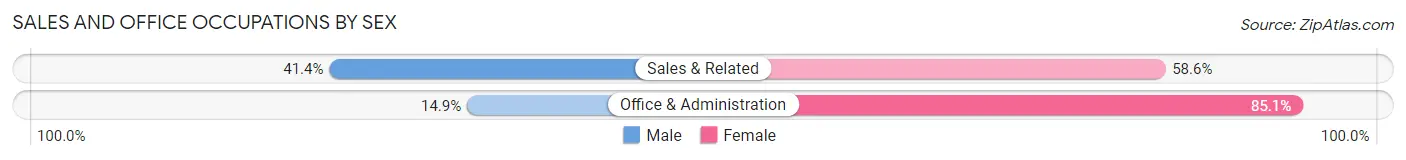
| Occupation | Male | Female |
| Sales & Related | 1,039 (41.4%) | 1,470 (58.6%) |
| Office & Administration | 340 (14.9%) | 1,940 (85.1%) |
| Total (Category) | 1,379 (28.8%) | 3,410 (71.2%) |
| Total (Overall) | 11,832 (49.7%) | 11,995 (50.3%) |
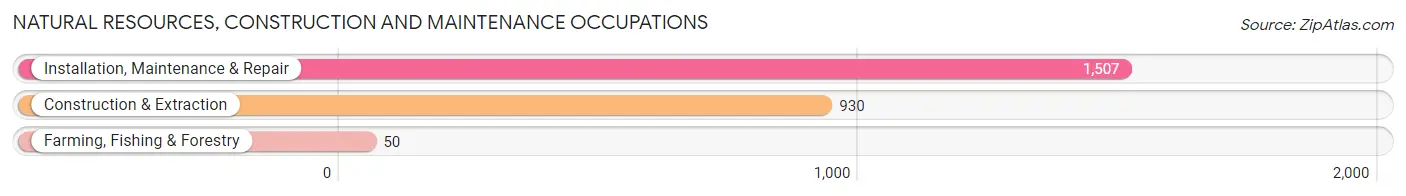
Natural Resources, Construction and Maintenance Occupations
The most common Natural Resources, Construction and Maintenance occupations in Lowndes County are Installation, Maintenance & Repair (1,507 | 6.3%), Construction & Extraction (930 | 3.9%), and Farming, Fishing & Forestry (50 | 0.2%).
Natural Resources, Construction and Maintenance Occupations by Sex
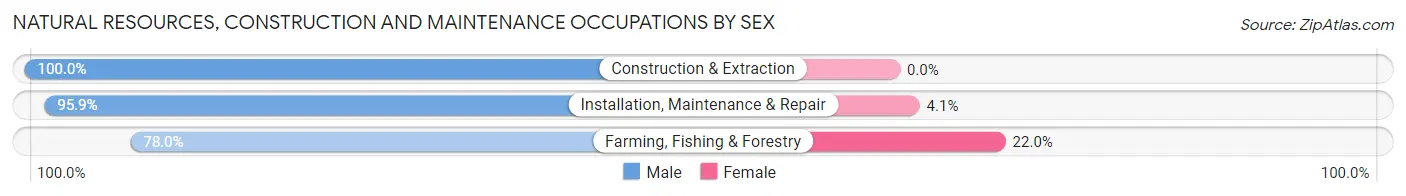
| Occupation | Male | Female |
| Farming, Fishing & Forestry | 39 (78.0%) | 11 (22.0%) |
| Construction & Extraction | 930 (100.0%) | 0 (0.0%) |
| Installation, Maintenance & Repair | 1,445 (95.9%) | 62 (4.1%) |
| Total (Category) | 2,414 (97.1%) | 73 (2.9%) |
| Total (Overall) | 11,832 (49.7%) | 11,995 (50.3%) |
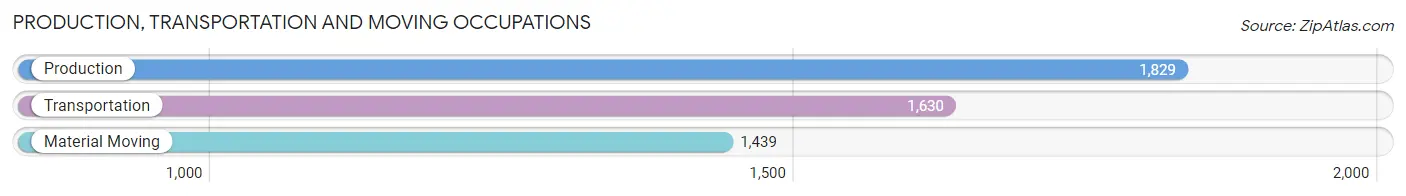
Production, Transportation and Moving Occupations
The most common Production, Transportation and Moving occupations in Lowndes County are Production (1,829 | 7.7%), Transportation (1,630 | 6.8%), and Material Moving (1,439 | 6.0%).
Production, Transportation and Moving Occupations by Sex
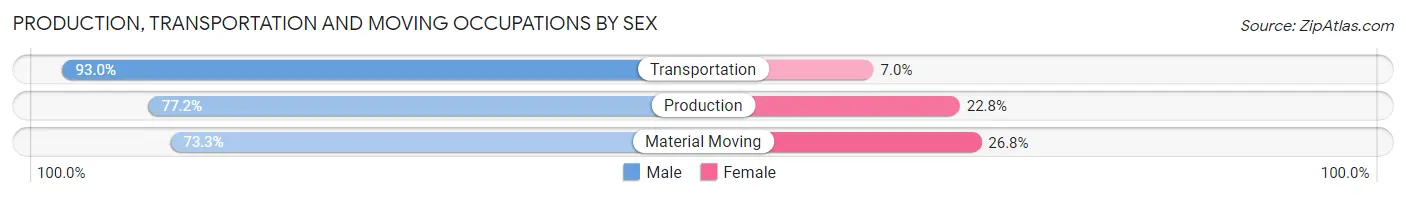
| Occupation | Male | Female |
| Production | 1,412 (77.2%) | 417 (22.8%) |
| Transportation | 1,516 (93.0%) | 114 (7.0%) |
| Material Moving | 1,054 (73.3%) | 385 (26.8%) |
| Total (Category) | 3,982 (81.3%) | 916 (18.7%) |
| Total (Overall) | 11,832 (49.7%) | 11,995 (50.3%) |
Employment Industries by Sex in Lowndes County
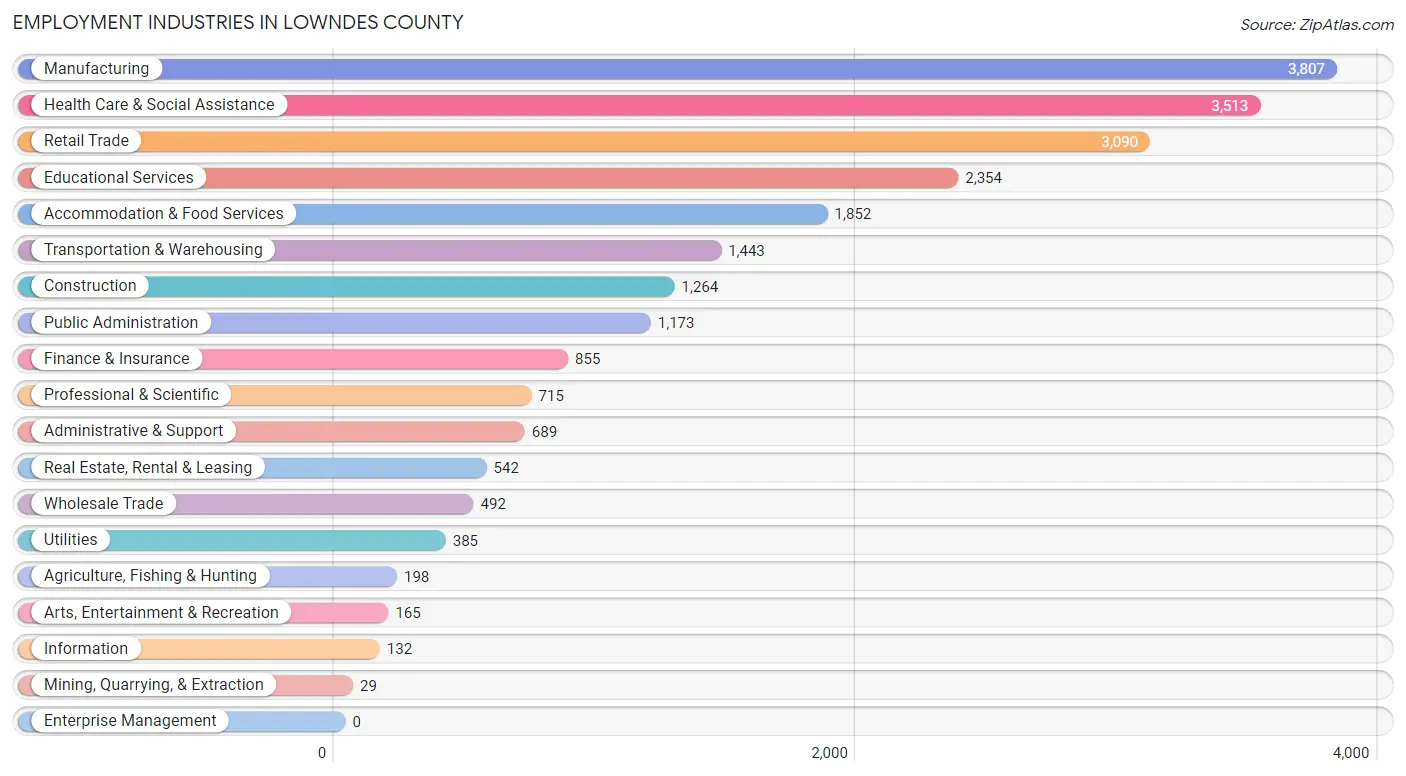
Employment Industries in Lowndes County
The major employment industries in Lowndes County include Manufacturing (3,807 | 16.0%), Health Care & Social Assistance (3,513 | 14.7%), Retail Trade (3,090 | 13.0%), Educational Services (2,354 | 9.9%), and Accommodation & Food Services (1,852 | 7.8%).
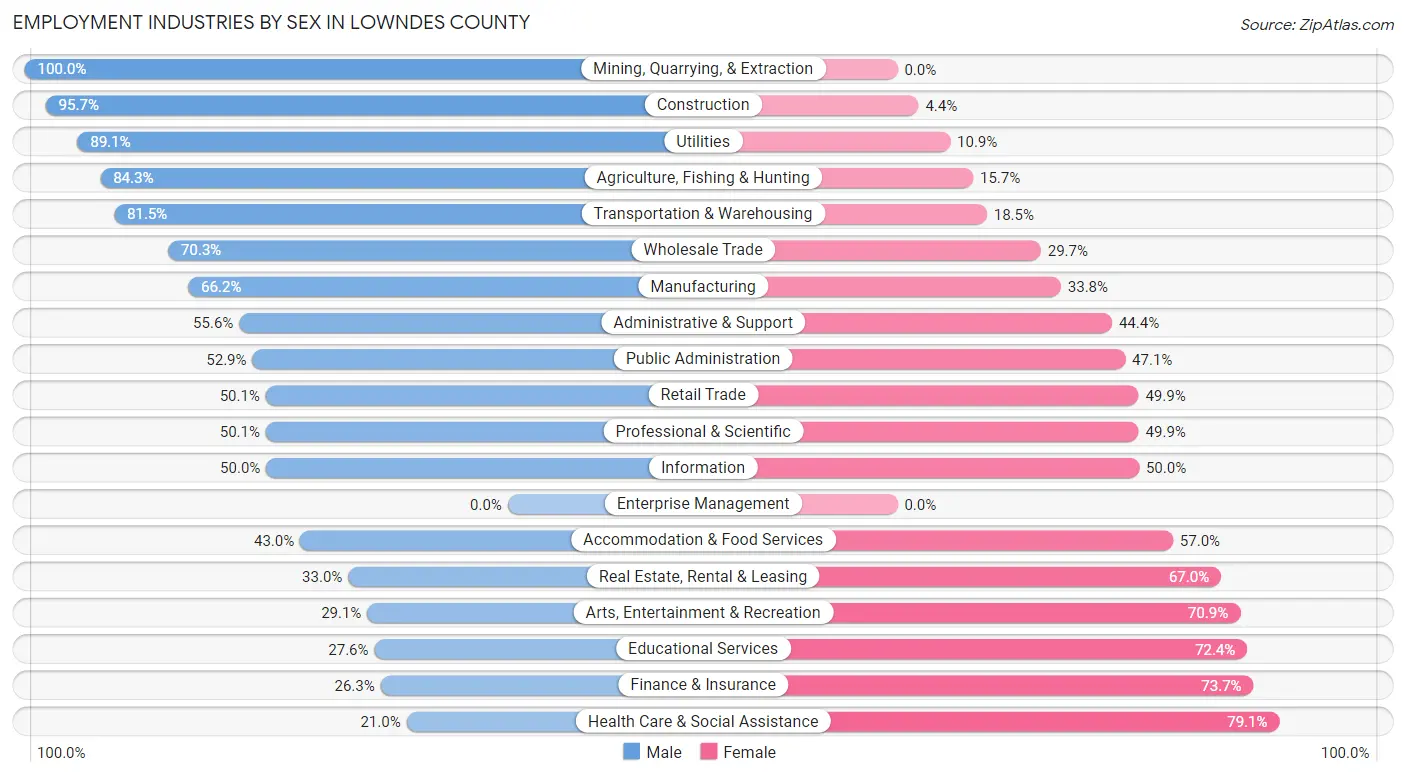
Employment Industries by Sex in Lowndes County
The Lowndes County industries that see more men than women are Mining, Quarrying, & Extraction (100.0%), Construction (95.7%), and Utilities (89.1%), whereas the industries that tend to have a higher number of women are Health Care & Social Assistance (79.0%), Finance & Insurance (73.7%), and Educational Services (72.4%).
| Industry | Male | Female |
| Agriculture, Fishing & Hunting | 167 (84.3%) | 31 (15.7%) |
| Mining, Quarrying, & Extraction | 29 (100.0%) | 0 (0.0%) |
| Construction | 1,209 (95.7%) | 55 (4.3%) |
| Manufacturing | 2,519 (66.2%) | 1,288 (33.8%) |
| Wholesale Trade | 346 (70.3%) | 146 (29.7%) |
| Retail Trade | 1,548 (50.1%) | 1,542 (49.9%) |
| Transportation & Warehousing | 1,176 (81.5%) | 267 (18.5%) |
| Utilities | 343 (89.1%) | 42 (10.9%) |
| Information | 66 (50.0%) | 66 (50.0%) |
| Finance & Insurance | 225 (26.3%) | 630 (73.7%) |
| Real Estate, Rental & Leasing | 179 (33.0%) | 363 (67.0%) |
| Professional & Scientific | 358 (50.1%) | 357 (49.9%) |
| Enterprise Management | 0 (0.0%) | 0 (0.0%) |
| Administrative & Support | 383 (55.6%) | 306 (44.4%) |
| Educational Services | 650 (27.6%) | 1,704 (72.4%) |
| Health Care & Social Assistance | 736 (20.9%) | 2,777 (79.0%) |
| Arts, Entertainment & Recreation | 48 (29.1%) | 117 (70.9%) |
| Accommodation & Food Services | 796 (43.0%) | 1,056 (57.0%) |
| Public Administration | 620 (52.9%) | 553 (47.1%) |
| Total | 11,832 (49.7%) | 11,995 (50.3%) |
Education in Lowndes County
School Enrollment in Lowndes County
The most common levels of schooling among the 14,505 students in Lowndes County are middle school (3,258 | 22.5%), high school (2,998 | 20.7%), and college / undergraduate (2,919 | 20.1%).

| School Level | # Students | % Students |
| Nursery / Preschool | 1,101 | 7.6% |
| Kindergarten | 955 | 6.6% |
| Elementary School | 2,814 | 19.4% |
| Middle School | 3,258 | 22.5% |
| High School | 2,998 | 20.7% |
| College / Undergraduate | 2,919 | 20.1% |
| Graduate / Professional | 460 | 3.2% |
| Total | 14,505 | 100.0% |
School Enrollment by Age by Funding Source in Lowndes County
Out of a total of 14,505 students who are enrolled in schools in Lowndes County, 1,596 (11.0%) attend a private institution, while the remaining 12,909 (89.0%) are enrolled in public schools. The age group of 5 to 9 year old has the highest likelihood of being enrolled in private schools, with 570 (16.7% in the age bracket) enrolled. Conversely, the age group of 25 to 34 year olds has the lowest likelihood of being enrolled in a private school, with 609 (99.5% in the age bracket) attending a public institution.
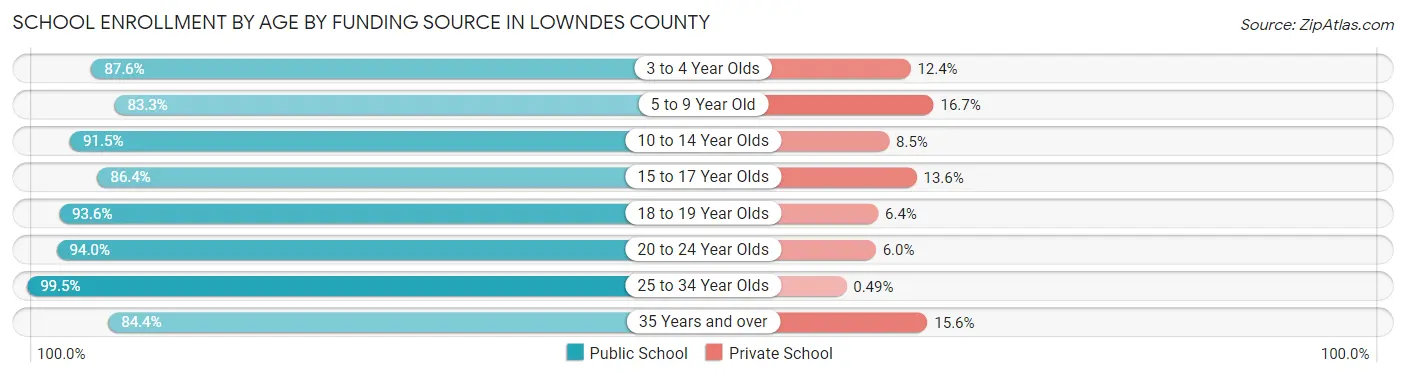
| Age Bracket | Public School | Private School |
| 3 to 4 Year Olds | 901 (87.6%) | 128 (12.4%) |
| 5 to 9 Year Old | 2,835 (83.3%) | 570 (16.7%) |
| 10 to 14 Year Olds | 3,702 (91.5%) | 342 (8.5%) |
| 15 to 17 Year Olds | 1,968 (86.4%) | 309 (13.6%) |
| 18 to 19 Year Olds | 935 (93.6%) | 64 (6.4%) |
| 20 to 24 Year Olds | 1,559 (94.0%) | 99 (6.0%) |
| 25 to 34 Year Olds | 609 (99.5%) | 3 (0.5%) |
| 35 Years and over | 406 (84.4%) | 75 (15.6%) |
| Total | 12,909 (89.0%) | 1,596 (11.0%) |
Educational Attainment by Field of Study in Lowndes County
Education (2,337 | 21.6%), business (2,334 | 21.6%), science & technology (1,140 | 10.5%), bio, nature & agricultural (1,093 | 10.1%), and arts & humanities (960 | 8.9%) are the most common fields of study among 10,817 individuals in Lowndes County who have obtained a bachelor's degree or higher.
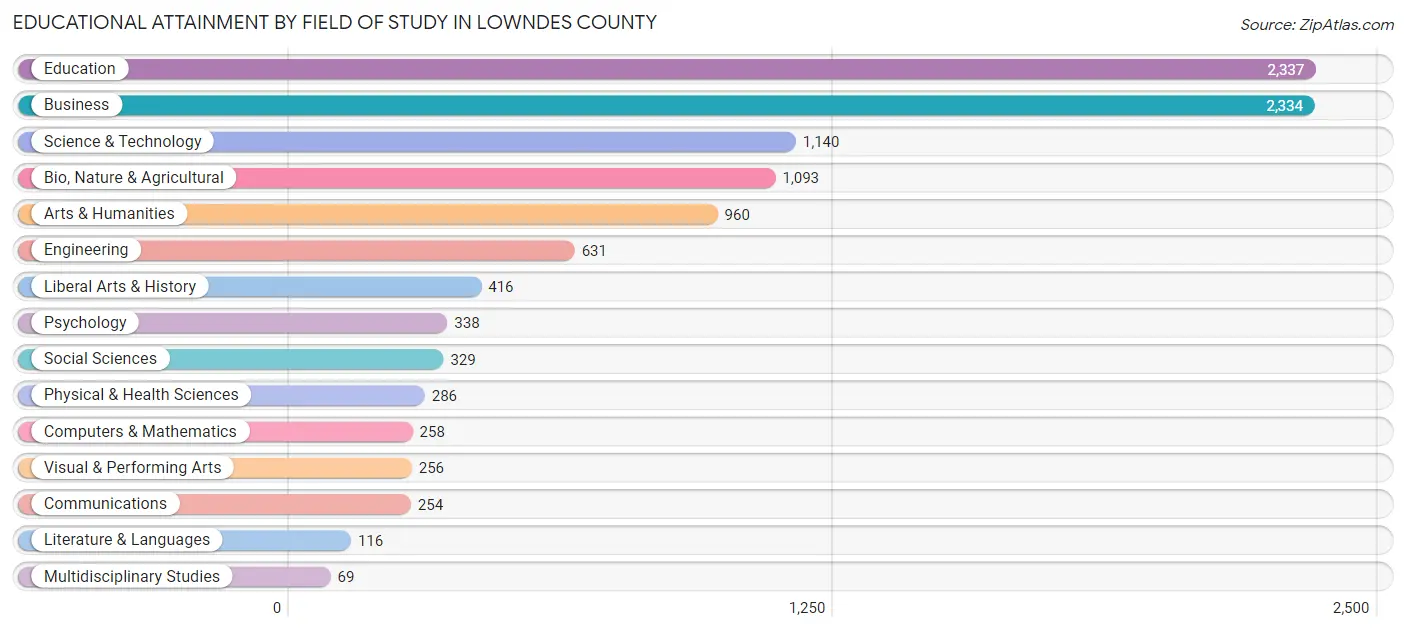
| Field of Study | # Graduates | % Graduates |
| Computers & Mathematics | 258 | 2.4% |
| Bio, Nature & Agricultural | 1,093 | 10.1% |
| Physical & Health Sciences | 286 | 2.6% |
| Psychology | 338 | 3.1% |
| Social Sciences | 329 | 3.0% |
| Engineering | 631 | 5.8% |
| Multidisciplinary Studies | 69 | 0.6% |
| Science & Technology | 1,140 | 10.5% |
| Business | 2,334 | 21.6% |
| Education | 2,337 | 21.6% |
| Literature & Languages | 116 | 1.1% |
| Liberal Arts & History | 416 | 3.8% |
| Visual & Performing Arts | 256 | 2.4% |
| Communications | 254 | 2.4% |
| Arts & Humanities | 960 | 8.9% |
| Total | 10,817 | 100.0% |
Transportation & Commute in Lowndes County
Vehicle Availability by Sex in Lowndes County
The most prevalent vehicle ownership categories in Lowndes County are males with 2 vehicles (5,398, accounting for 42.3%) and females with 2 vehicles (4,678, making up 46.7%).
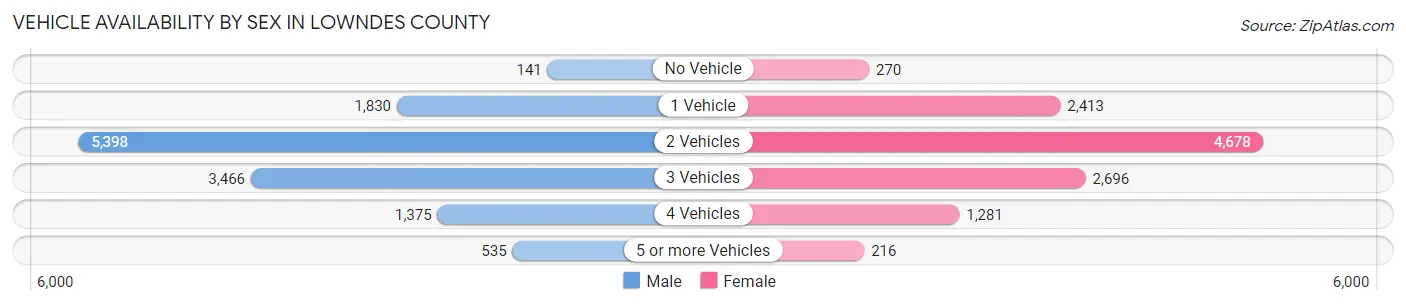
| Vehicles Available | Male | Female |
| No Vehicle | 141 (1.1%) | 270 (2.3%) |
| 1 Vehicle | 1,830 (14.4%) | 2,413 (20.9%) |
| 2 Vehicles | 5,398 (42.3%) | 4,678 (40.5%) |
| 3 Vehicles | 3,466 (27.2%) | 2,696 (23.3%) |
| 4 Vehicles | 1,375 (10.8%) | 1,281 (11.1%) |
| 5 or more Vehicles | 535 (4.2%) | 216 (1.9%) |
| Total | 12,745 (100.0%) | 11,554 (100.0%) |
Commute Time in Lowndes County
The most frequently occuring commute durations in Lowndes County are 15 to 19 minutes (5,217 commuters, 22.3%), 10 to 14 minutes (4,183 commuters, 17.9%), and 20 to 24 minutes (4,050 commuters, 17.3%).
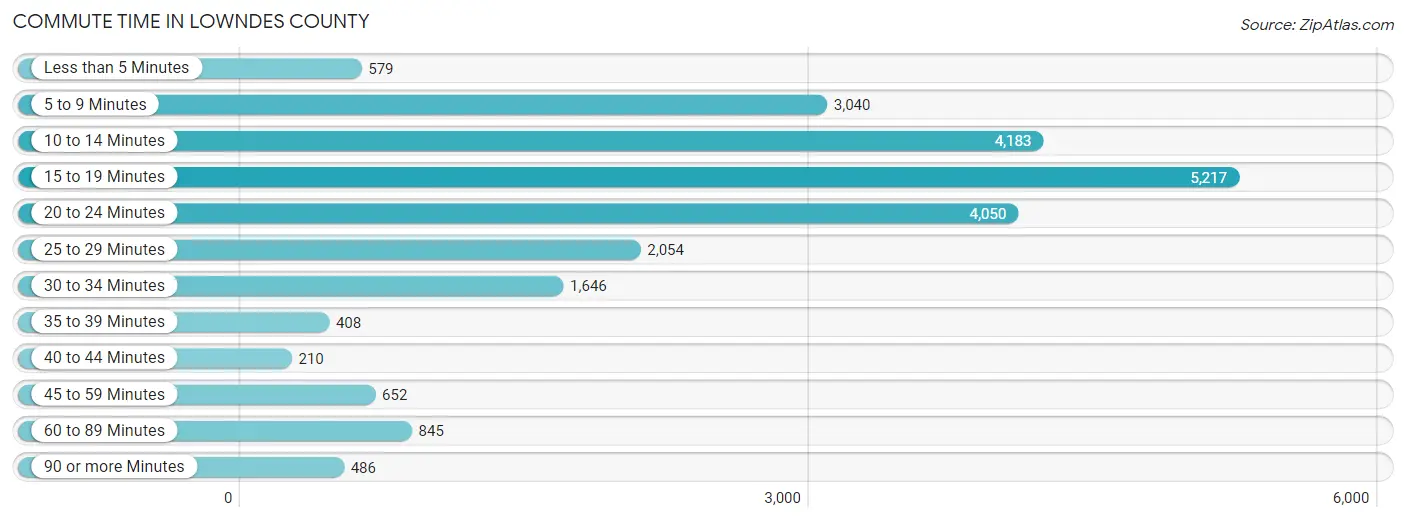
| Commute Time | # Commuters | % Commuters |
| Less than 5 Minutes | 579 | 2.5% |
| 5 to 9 Minutes | 3,040 | 13.0% |
| 10 to 14 Minutes | 4,183 | 17.9% |
| 15 to 19 Minutes | 5,217 | 22.3% |
| 20 to 24 Minutes | 4,050 | 17.3% |
| 25 to 29 Minutes | 2,054 | 8.8% |
| 30 to 34 Minutes | 1,646 | 7.0% |
| 35 to 39 Minutes | 408 | 1.8% |
| 40 to 44 Minutes | 210 | 0.9% |
| 45 to 59 Minutes | 652 | 2.8% |
| 60 to 89 Minutes | 845 | 3.6% |
| 90 or more Minutes | 486 | 2.1% |
Commute Time by Sex in Lowndes County
The most common commute times in Lowndes County are 15 to 19 minutes (2,731 commuters, 22.4%) for males and 15 to 19 minutes (2,486 commuters, 22.3%) for females.
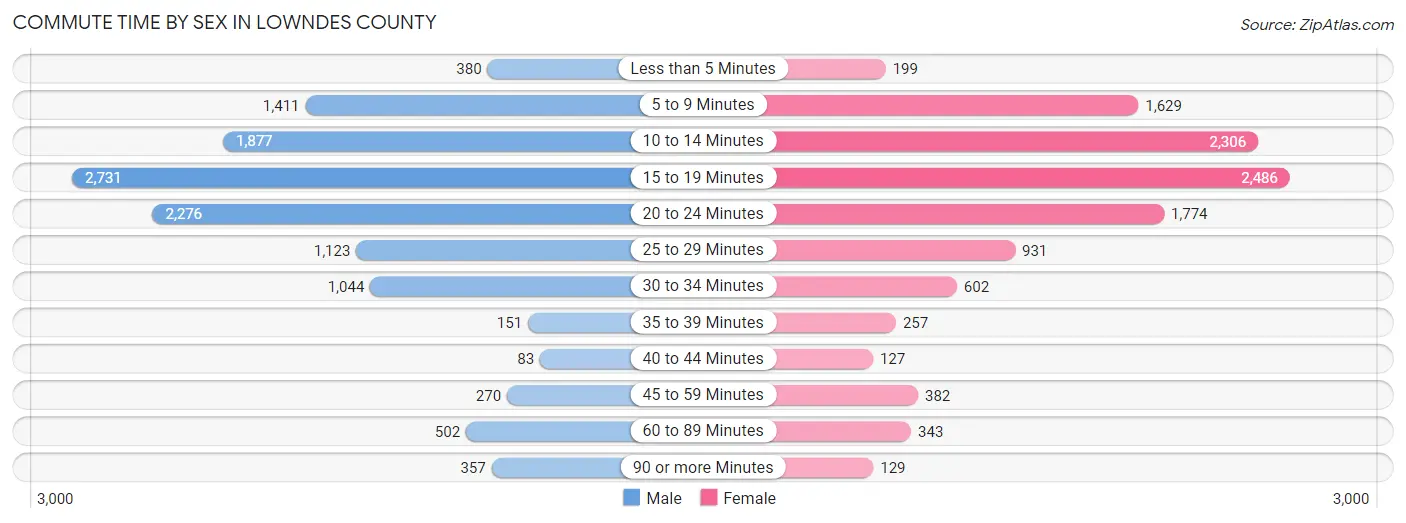
| Commute Time | Male | Female |
| Less than 5 Minutes | 380 (3.1%) | 199 (1.8%) |
| 5 to 9 Minutes | 1,411 (11.6%) | 1,629 (14.6%) |
| 10 to 14 Minutes | 1,877 (15.4%) | 2,306 (20.6%) |
| 15 to 19 Minutes | 2,731 (22.4%) | 2,486 (22.3%) |
| 20 to 24 Minutes | 2,276 (18.6%) | 1,774 (15.9%) |
| 25 to 29 Minutes | 1,123 (9.2%) | 931 (8.3%) |
| 30 to 34 Minutes | 1,044 (8.6%) | 602 (5.4%) |
| 35 to 39 Minutes | 151 (1.2%) | 257 (2.3%) |
| 40 to 44 Minutes | 83 (0.7%) | 127 (1.1%) |
| 45 to 59 Minutes | 270 (2.2%) | 382 (3.4%) |
| 60 to 89 Minutes | 502 (4.1%) | 343 (3.1%) |
| 90 or more Minutes | 357 (2.9%) | 129 (1.2%) |
Time of Departure to Work by Sex in Lowndes County
The most frequent times of departure to work in Lowndes County are 7:00 AM to 7:29 AM (2,990, 24.5%) for males and 7:30 AM to 7:59 AM (2,637, 23.6%) for females.
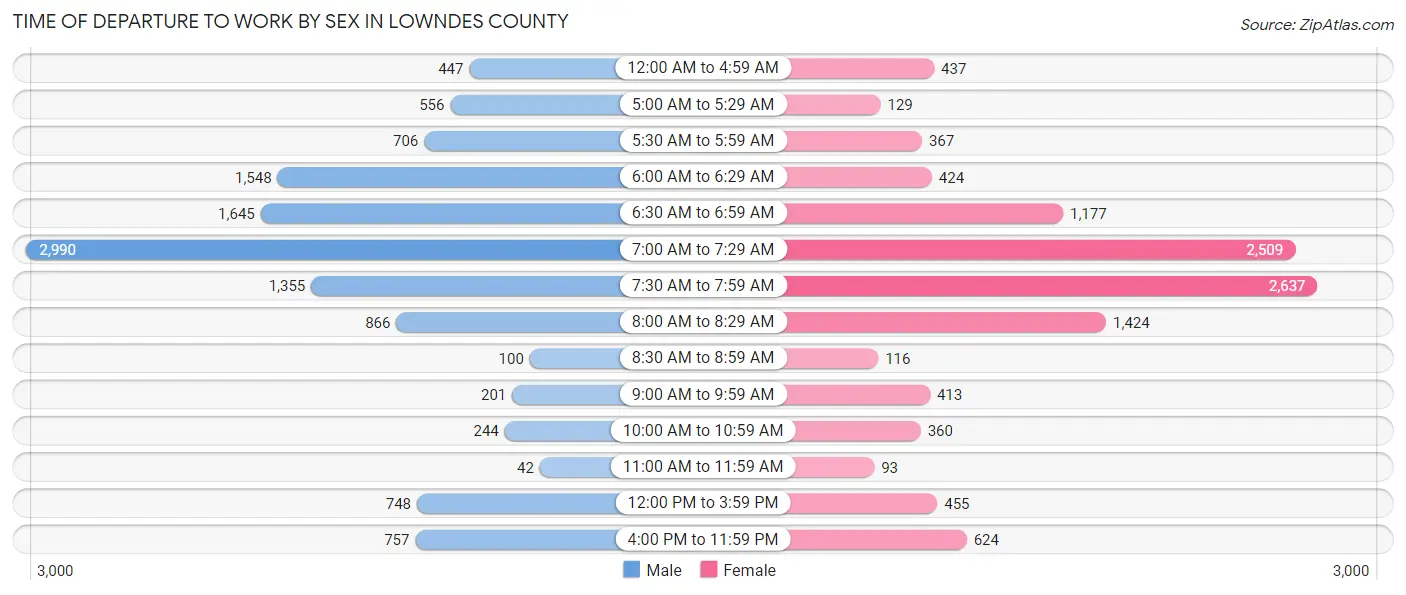
| Time of Departure | Male | Female |
| 12:00 AM to 4:59 AM | 447 (3.7%) | 437 (3.9%) |
| 5:00 AM to 5:29 AM | 556 (4.6%) | 129 (1.2%) |
| 5:30 AM to 5:59 AM | 706 (5.8%) | 367 (3.3%) |
| 6:00 AM to 6:29 AM | 1,548 (12.7%) | 424 (3.8%) |
| 6:30 AM to 6:59 AM | 1,645 (13.5%) | 1,177 (10.5%) |
| 7:00 AM to 7:29 AM | 2,990 (24.5%) | 2,509 (22.5%) |
| 7:30 AM to 7:59 AM | 1,355 (11.1%) | 2,637 (23.6%) |
| 8:00 AM to 8:29 AM | 866 (7.1%) | 1,424 (12.8%) |
| 8:30 AM to 8:59 AM | 100 (0.8%) | 116 (1.0%) |
| 9:00 AM to 9:59 AM | 201 (1.7%) | 413 (3.7%) |
| 10:00 AM to 10:59 AM | 244 (2.0%) | 360 (3.2%) |
| 11:00 AM to 11:59 AM | 42 (0.3%) | 93 (0.8%) |
| 12:00 PM to 3:59 PM | 748 (6.1%) | 455 (4.1%) |
| 4:00 PM to 11:59 PM | 757 (6.2%) | 624 (5.6%) |
| Total | 12,205 (100.0%) | 11,165 (100.0%) |
Housing Occupancy in Lowndes County
Occupancy by Ownership in Lowndes County
Of the total 22,651 dwellings in Lowndes County, owner-occupied units account for 14,011 (61.9%), while renter-occupied units make up 8,640 (38.1%).
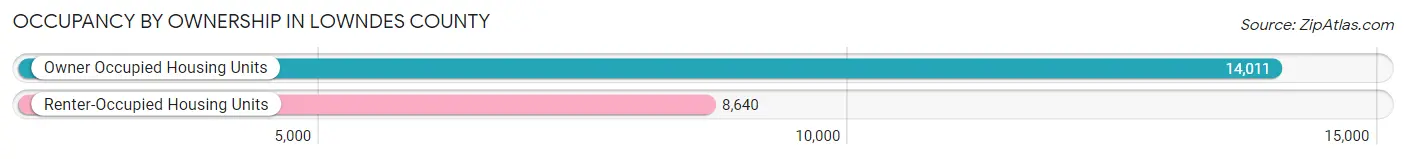
| Occupancy | # Housing Units | % Housing Units |
| Owner Occupied Housing Units | 14,011 | 61.9% |
| Renter-Occupied Housing Units | 8,640 | 38.1% |
| Total Occupied Housing Units | 22,651 | 100.0% |
Occupancy by Household Size in Lowndes County
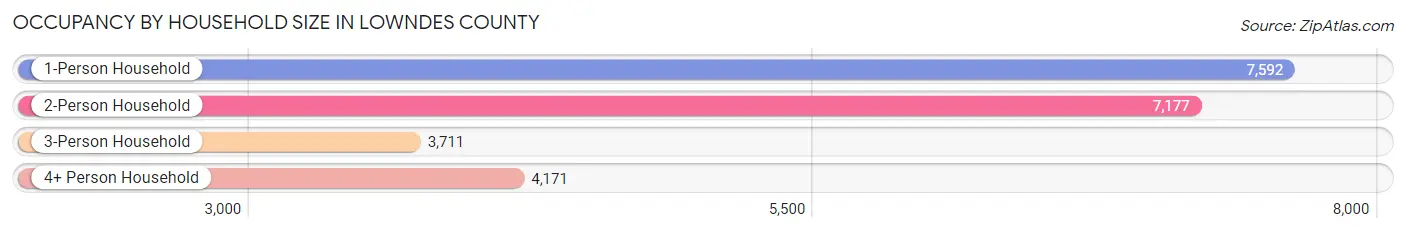
| Household Size | # Housing Units | % Housing Units |
| 1-Person Household | 7,592 | 33.5% |
| 2-Person Household | 7,177 | 31.7% |
| 3-Person Household | 3,711 | 16.4% |
| 4+ Person Household | 4,171 | 18.4% |
| Total Housing Units | 22,651 | 100.0% |
Occupancy by Ownership by Household Size in Lowndes County
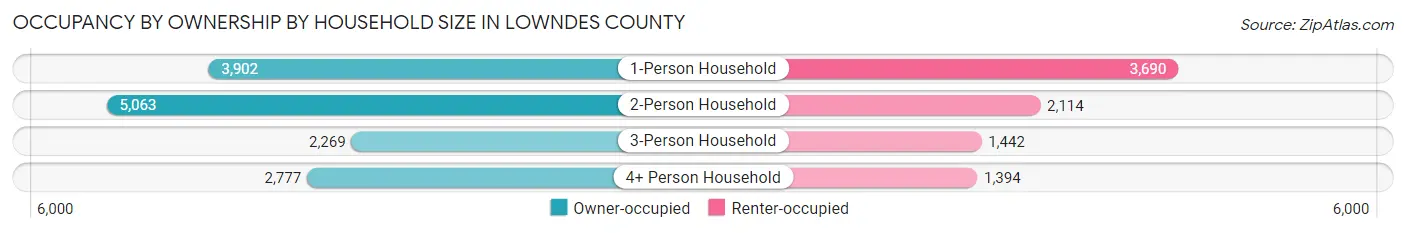
| Household Size | Owner-occupied | Renter-occupied |
| 1-Person Household | 3,902 (51.4%) | 3,690 (48.6%) |
| 2-Person Household | 5,063 (70.5%) | 2,114 (29.5%) |
| 3-Person Household | 2,269 (61.1%) | 1,442 (38.9%) |
| 4+ Person Household | 2,777 (66.6%) | 1,394 (33.4%) |
| Total Housing Units | 14,011 (61.9%) | 8,640 (38.1%) |
Occupancy by Educational Attainment in Lowndes County
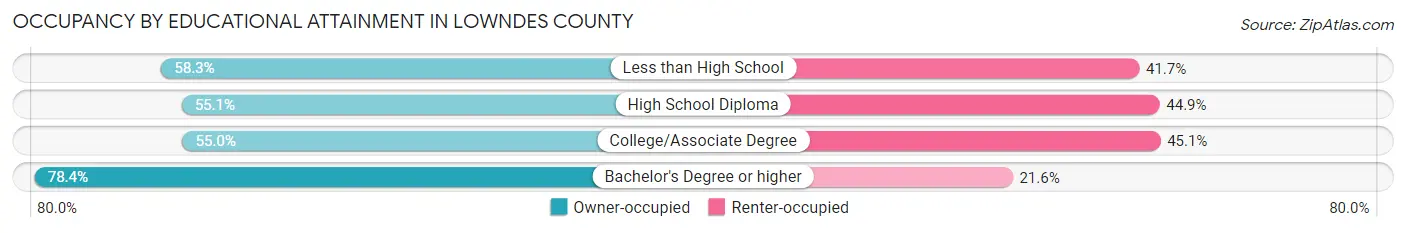
| Household Size | Owner-occupied | Renter-occupied |
| Less than High School | 1,539 (58.3%) | 1,101 (41.7%) |
| High School Diploma | 3,892 (55.1%) | 3,174 (44.9%) |
| College/Associate Degree | 3,674 (54.9%) | 3,012 (45.1%) |
| Bachelor's Degree or higher | 4,906 (78.4%) | 1,353 (21.6%) |
Occupancy by Age of Householder in Lowndes County
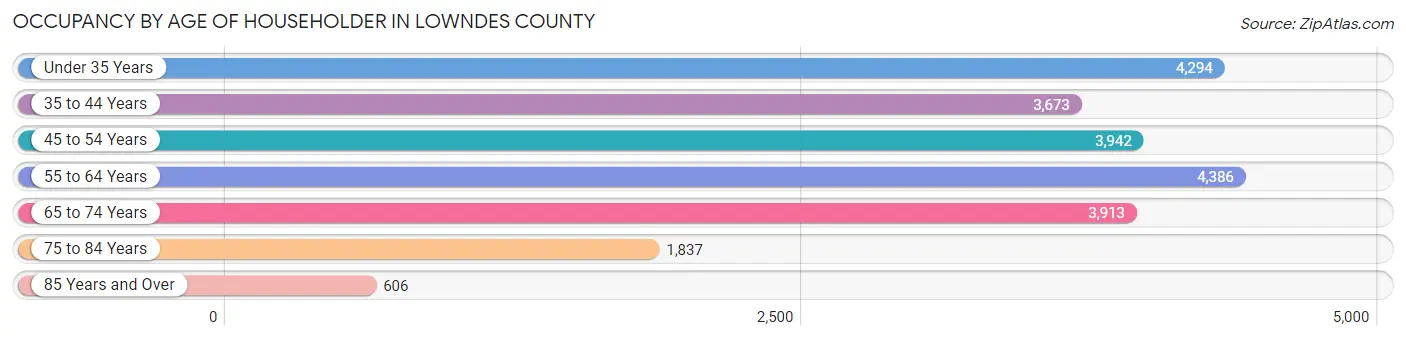
| Age Bracket | # Households | % Households |
| Under 35 Years | 4,294 | 19.0% |
| 35 to 44 Years | 3,673 | 16.2% |
| 45 to 54 Years | 3,942 | 17.4% |
| 55 to 64 Years | 4,386 | 19.4% |
| 65 to 74 Years | 3,913 | 17.3% |
| 75 to 84 Years | 1,837 | 8.1% |
| 85 Years and Over | 606 | 2.7% |
| Total | 22,651 | 100.0% |
Housing Finances in Lowndes County
Median Income by Occupancy in Lowndes County
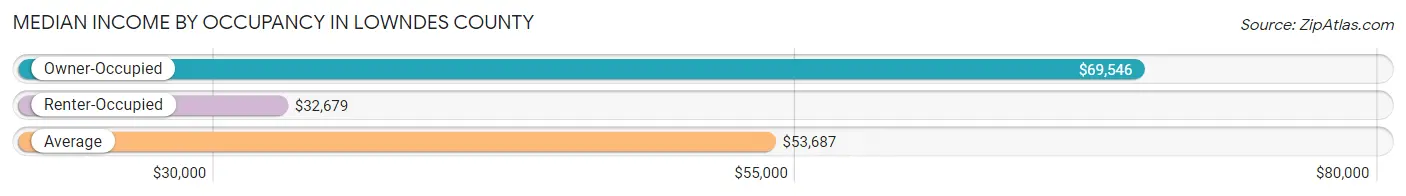
| Occupancy Type | # Households | Median Income |
| Owner-Occupied | 14,011 (61.9%) | $69,546 |
| Renter-Occupied | 8,640 (38.1%) | $32,679 |
| Average | 22,651 (100.0%) | $53,687 |
Occupancy by Householder Income Bracket in Lowndes County
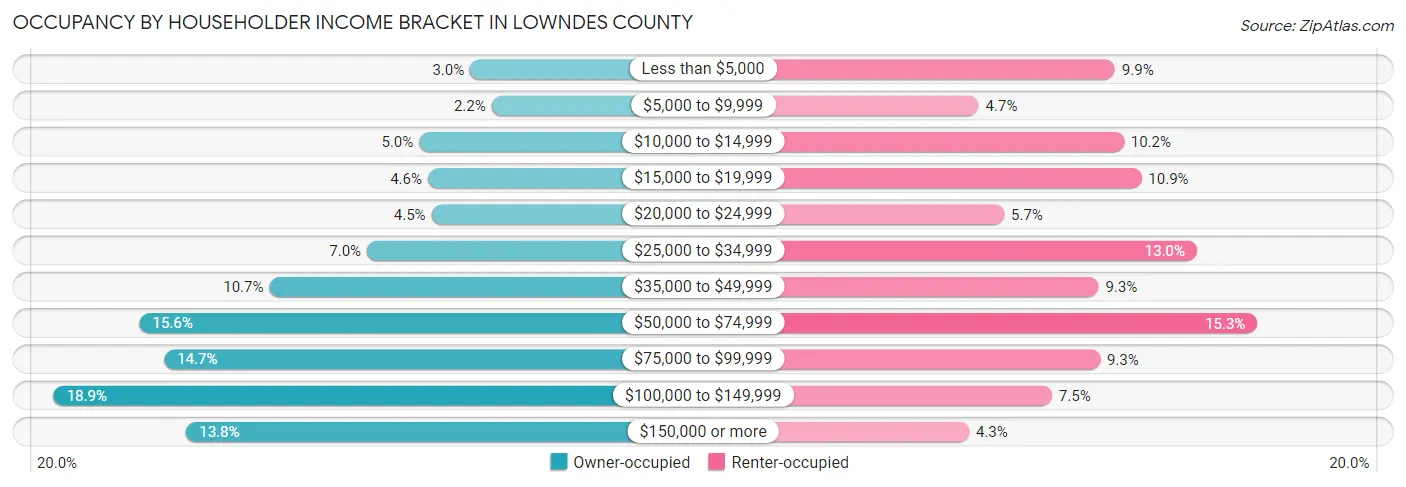
| Income Bracket | Owner-occupied | Renter-occupied |
| Less than $5,000 | 424 (3.0%) | 854 (9.9%) |
| $5,000 to $9,999 | 310 (2.2%) | 405 (4.7%) |
| $10,000 to $14,999 | 696 (5.0%) | 883 (10.2%) |
| $15,000 to $19,999 | 650 (4.6%) | 941 (10.9%) |
| $20,000 to $24,999 | 630 (4.5%) | 489 (5.7%) |
| $25,000 to $34,999 | 975 (7.0%) | 1,123 (13.0%) |
| $35,000 to $49,999 | 1,496 (10.7%) | 800 (9.3%) |
| $50,000 to $74,999 | 2,188 (15.6%) | 1,322 (15.3%) |
| $75,000 to $99,999 | 2,057 (14.7%) | 804 (9.3%) |
| $100,000 to $149,999 | 2,646 (18.9%) | 646 (7.5%) |
| $150,000 or more | 1,939 (13.8%) | 373 (4.3%) |
| Total | 14,011 (100.0%) | 8,640 (100.0%) |
Monthly Housing Cost Tiers in Lowndes County
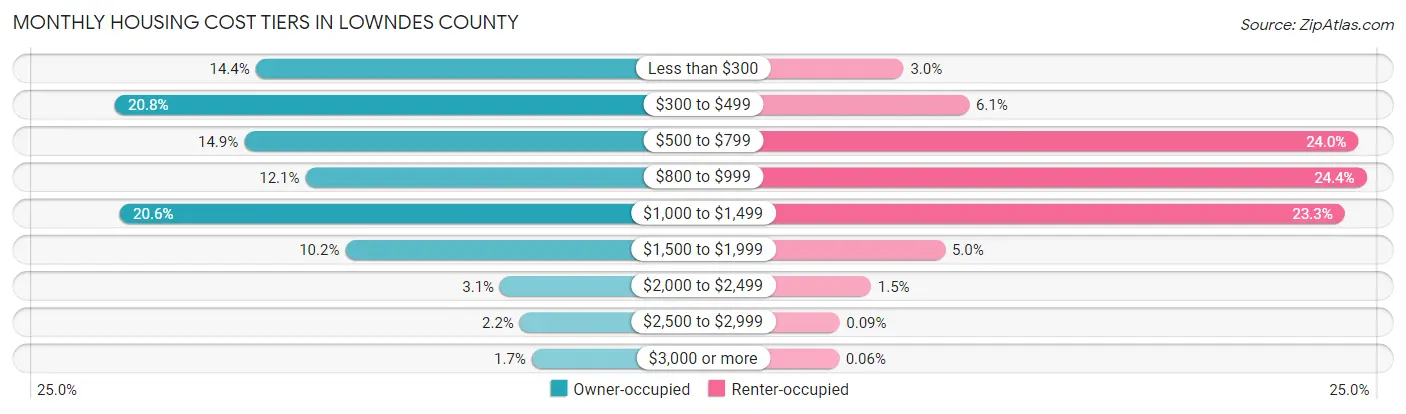
| Monthly Cost | Owner-occupied | Renter-occupied |
| Less than $300 | 2,013 (14.4%) | 263 (3.0%) |
| $300 to $499 | 2,918 (20.8%) | 524 (6.1%) |
| $500 to $799 | 2,087 (14.9%) | 2,071 (24.0%) |
| $800 to $999 | 1,693 (12.1%) | 2,104 (24.3%) |
| $1,000 to $1,499 | 2,886 (20.6%) | 2,017 (23.3%) |
| $1,500 to $1,999 | 1,435 (10.2%) | 428 (5.0%) |
| $2,000 to $2,499 | 437 (3.1%) | 133 (1.5%) |
| $2,500 to $2,999 | 310 (2.2%) | 8 (0.1%) |
| $3,000 or more | 232 (1.7%) | 5 (0.1%) |
| Total | 14,011 (100.0%) | 8,640 (100.0%) |
Physical Housing Characteristics in Lowndes County
Housing Structures in Lowndes County
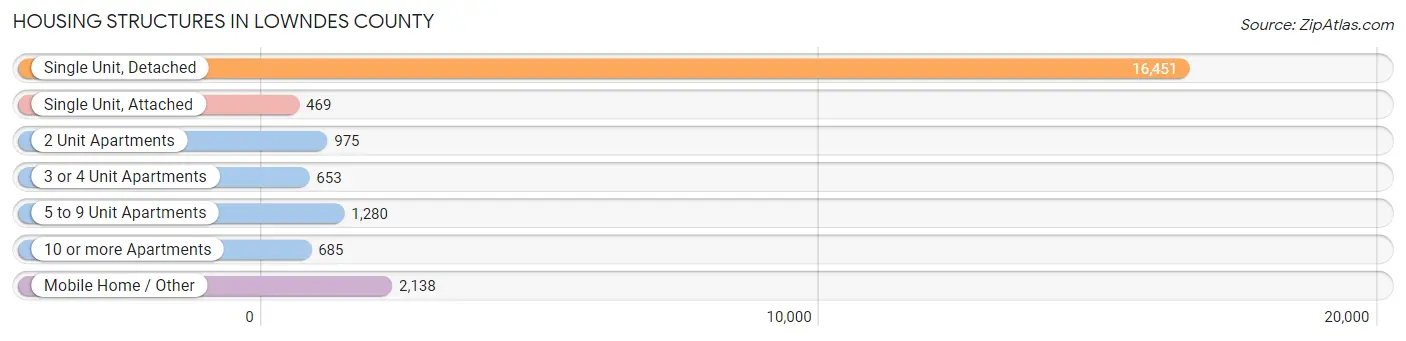
| Structure Type | # Housing Units | % Housing Units |
| Single Unit, Detached | 16,451 | 72.6% |
| Single Unit, Attached | 469 | 2.1% |
| 2 Unit Apartments | 975 | 4.3% |
| 3 or 4 Unit Apartments | 653 | 2.9% |
| 5 to 9 Unit Apartments | 1,280 | 5.7% |
| 10 or more Apartments | 685 | 3.0% |
| Mobile Home / Other | 2,138 | 9.4% |
| Total | 22,651 | 100.0% |
Housing Structures by Occupancy in Lowndes County
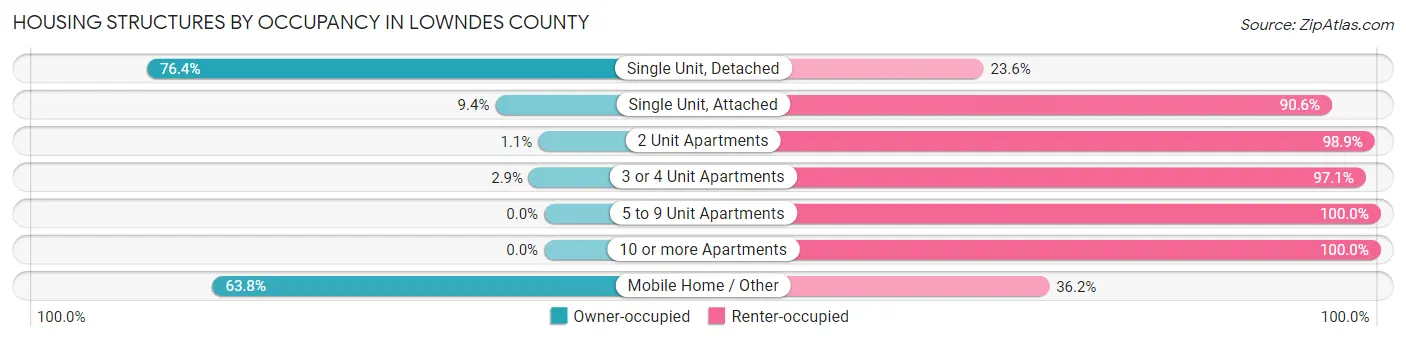
| Structure Type | Owner-occupied | Renter-occupied |
| Single Unit, Detached | 12,573 (76.4%) | 3,878 (23.6%) |
| Single Unit, Attached | 44 (9.4%) | 425 (90.6%) |
| 2 Unit Apartments | 11 (1.1%) | 964 (98.9%) |
| 3 or 4 Unit Apartments | 19 (2.9%) | 634 (97.1%) |
| 5 to 9 Unit Apartments | 0 (0.0%) | 1,280 (100.0%) |
| 10 or more Apartments | 0 (0.0%) | 685 (100.0%) |
| Mobile Home / Other | 1,364 (63.8%) | 774 (36.2%) |
| Total | 14,011 (61.9%) | 8,640 (38.1%) |
Housing Structures by Number of Rooms in Lowndes County
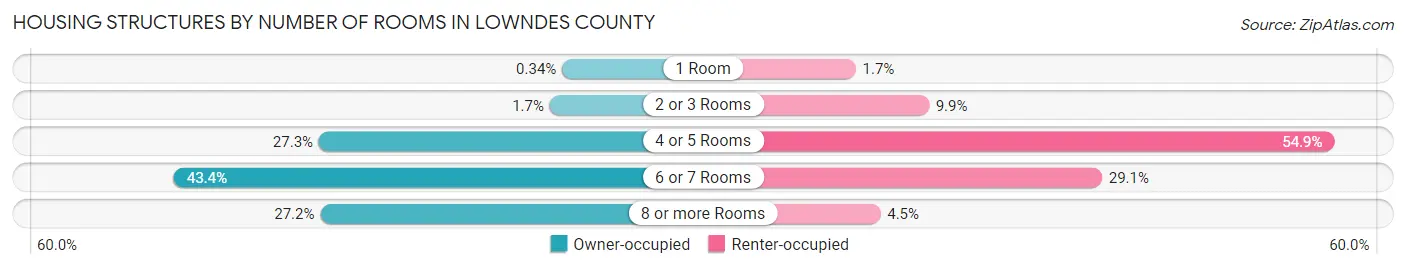
| Number of Rooms | Owner-occupied | Renter-occupied |
| 1 Room | 48 (0.3%) | 150 (1.7%) |
| 2 or 3 Rooms | 239 (1.7%) | 851 (9.9%) |
| 4 or 5 Rooms | 3,830 (27.3%) | 4,741 (54.9%) |
| 6 or 7 Rooms | 6,086 (43.4%) | 2,511 (29.1%) |
| 8 or more Rooms | 3,808 (27.2%) | 387 (4.5%) |
| Total | 14,011 (100.0%) | 8,640 (100.0%) |
Housing Structure by Heating Type in Lowndes County
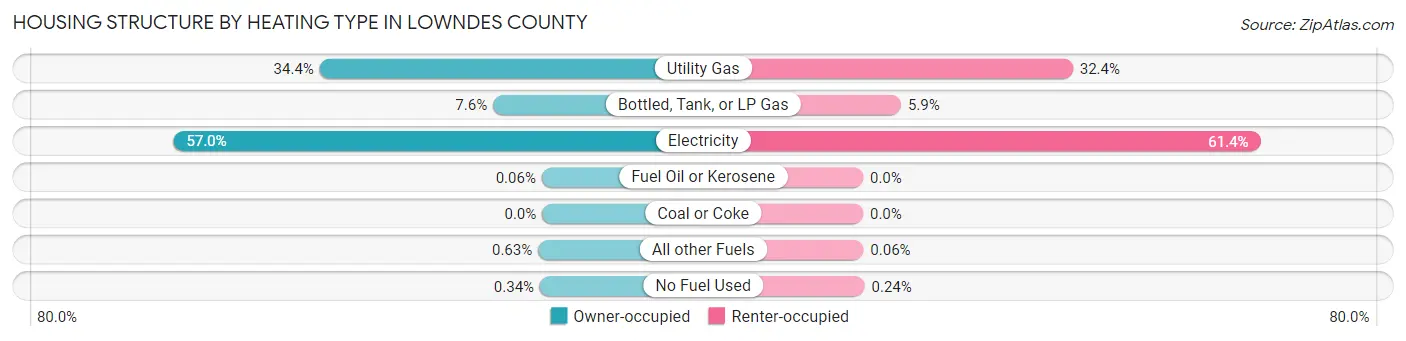
| Heating Type | Owner-occupied | Renter-occupied |
| Utility Gas | 4,819 (34.4%) | 2,801 (32.4%) |
| Bottled, Tank, or LP Gas | 1,063 (7.6%) | 506 (5.9%) |
| Electricity | 7,986 (57.0%) | 5,307 (61.4%) |
| Fuel Oil or Kerosene | 8 (0.1%) | 0 (0.0%) |
| Coal or Coke | 0 (0.0%) | 0 (0.0%) |
| All other Fuels | 88 (0.6%) | 5 (0.1%) |
| No Fuel Used | 47 (0.3%) | 21 (0.2%) |
| Total | 14,011 (100.0%) | 8,640 (100.0%) |
Household Vehicle Usage in Lowndes County
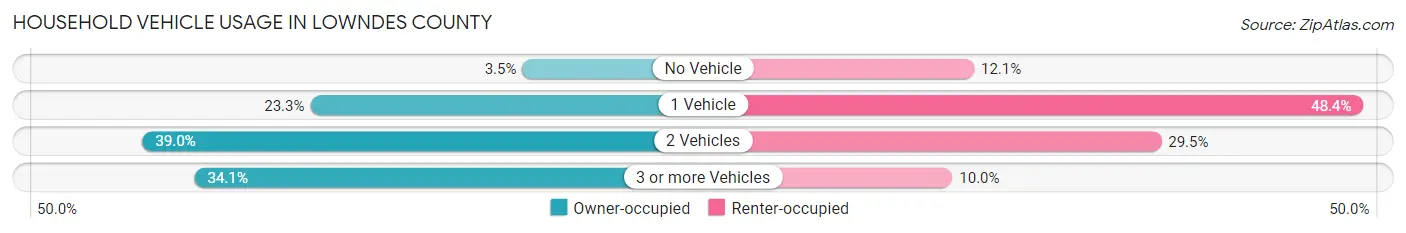
| Vehicles per Household | Owner-occupied | Renter-occupied |
| No Vehicle | 496 (3.5%) | 1,041 (12.0%) |
| 1 Vehicle | 3,269 (23.3%) | 4,181 (48.4%) |
| 2 Vehicles | 5,464 (39.0%) | 2,551 (29.5%) |
| 3 or more Vehicles | 4,782 (34.1%) | 867 (10.0%) |
| Total | 14,011 (100.0%) | 8,640 (100.0%) |
Real Estate & Mortgages in Lowndes County
Real Estate and Mortgage Overview in Lowndes County
| Characteristic | Without Mortgage | With Mortgage |
| Housing Units | 6,422 | 7,589 |
| Median Property Value | $128,600 | $173,000 |
| Median Household Income | $49,862 | $1,388 |
| Monthly Housing Costs | $383 | $232 |
| Real Estate Taxes | $764 | $827 |
Property Value by Mortgage Status in Lowndes County
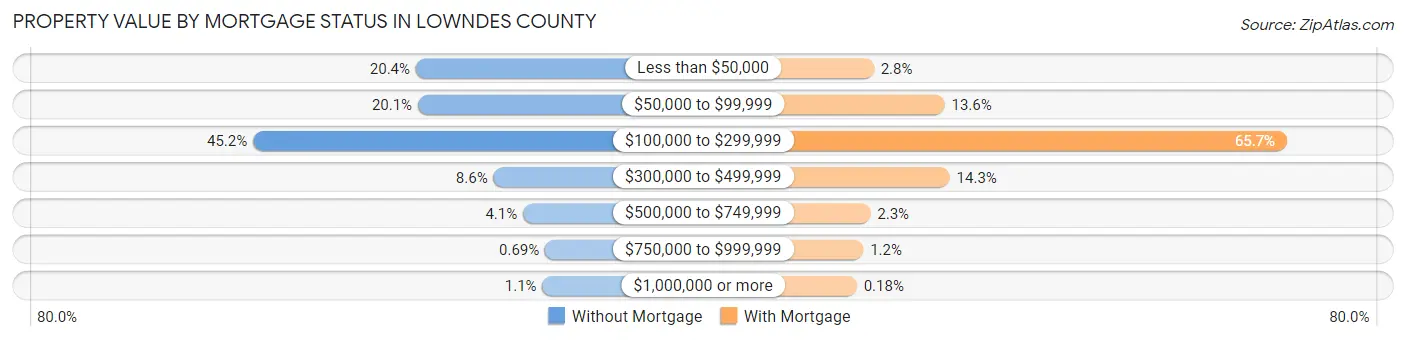
| Property Value | Without Mortgage | With Mortgage |
| Less than $50,000 | 1,309 (20.4%) | 210 (2.8%) |
| $50,000 to $99,999 | 1,288 (20.1%) | 1,029 (13.6%) |
| $100,000 to $299,999 | 2,902 (45.2%) | 4,988 (65.7%) |
| $300,000 to $499,999 | 549 (8.6%) | 1,088 (14.3%) |
| $500,000 to $749,999 | 260 (4.1%) | 171 (2.2%) |
| $750,000 to $999,999 | 44 (0.7%) | 89 (1.2%) |
| $1,000,000 or more | 70 (1.1%) | 14 (0.2%) |
| Total | 6,422 (100.0%) | 7,589 (100.0%) |
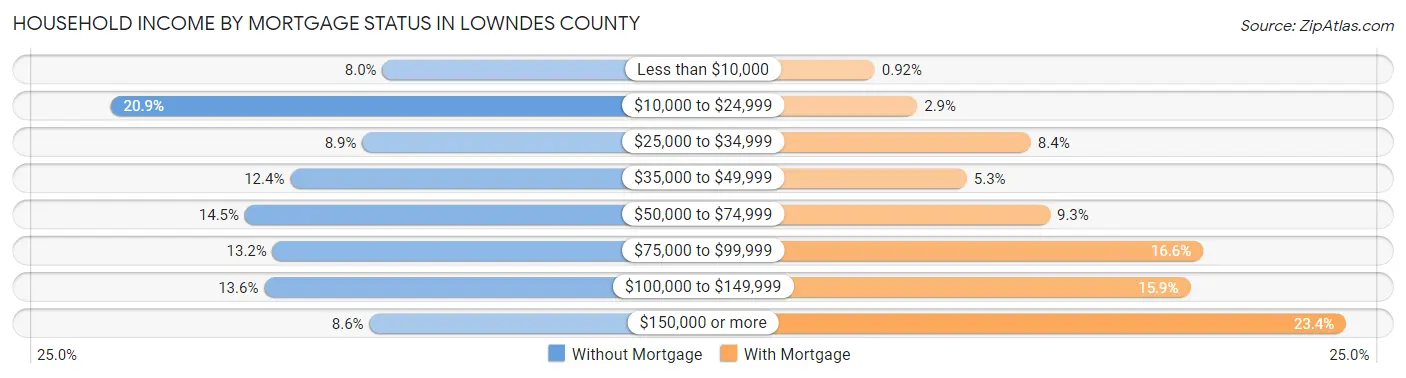
Household Income by Mortgage Status in Lowndes County
| Household Income | Without Mortgage | With Mortgage |
| Less than $10,000 | 511 (8.0%) | 70 (0.9%) |
| $10,000 to $24,999 | 1,342 (20.9%) | 223 (2.9%) |
| $25,000 to $34,999 | 573 (8.9%) | 634 (8.4%) |
| $35,000 to $49,999 | 793 (12.3%) | 402 (5.3%) |
| $50,000 to $74,999 | 932 (14.5%) | 703 (9.3%) |
| $75,000 to $99,999 | 847 (13.2%) | 1,256 (16.6%) |
| $100,000 to $149,999 | 873 (13.6%) | 1,210 (15.9%) |
| $150,000 or more | 551 (8.6%) | 1,773 (23.4%) |
| Total | 6,422 (100.0%) | 7,589 (100.0%) |
Property Value to Household Income Ratio in Lowndes County
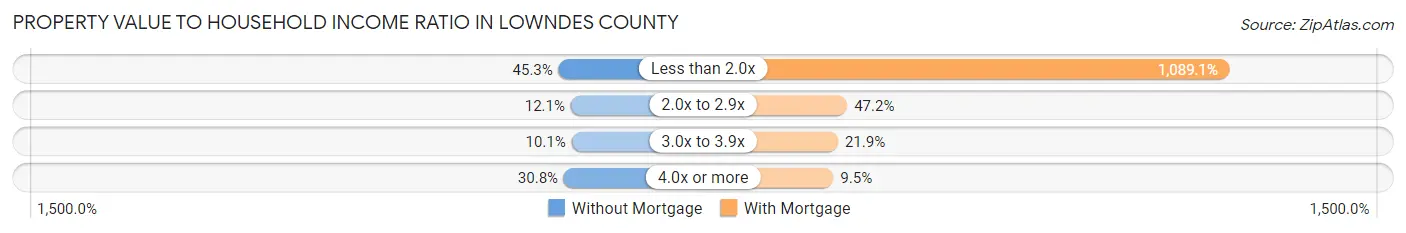
| Value-to-Income Ratio | Without Mortgage | With Mortgage |
| Less than 2.0x | 2,910 (45.3%) | 82,655 (1,089.1%) |
| 2.0x to 2.9x | 777 (12.1%) | 3,578 (47.1%) |
| 3.0x to 3.9x | 646 (10.1%) | 1,664 (21.9%) |
| 4.0x or more | 1,979 (30.8%) | 720 (9.5%) |
| Total | 6,422 (100.0%) | 7,589 (100.0%) |
Real Estate Taxes by Mortgage Status in Lowndes County
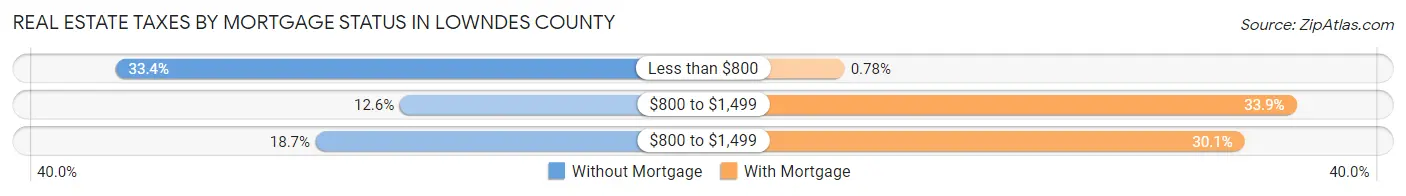
| Property Taxes | Without Mortgage | With Mortgage |
| Less than $800 | 2,142 (33.4%) | 59 (0.8%) |
| $800 to $1,499 | 807 (12.6%) | 2,569 (33.9%) |
| $800 to $1,499 | 1,202 (18.7%) | 2,282 (30.1%) |
| Total | 6,422 (100.0%) | 7,589 (100.0%) |
Health & Disability in Lowndes County
Health Insurance Coverage by Age in Lowndes County
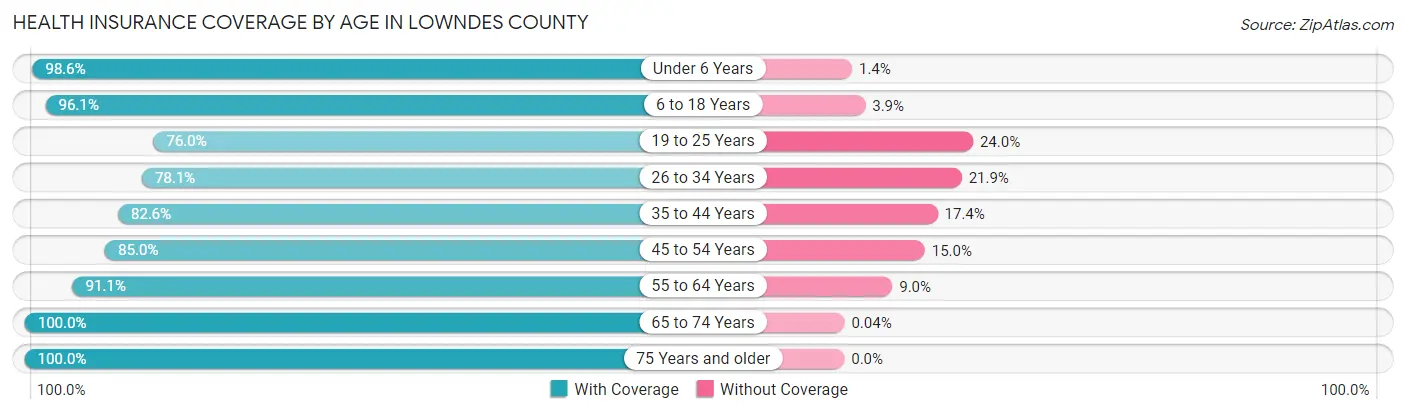
| Age Bracket | With Coverage | Without Coverage |
| Under 6 Years | 4,586 (98.6%) | 67 (1.4%) |
| 6 to 18 Years | 9,349 (96.1%) | 380 (3.9%) |
| 19 to 25 Years | 4,046 (76.0%) | 1,278 (24.0%) |
| 26 to 34 Years | 5,174 (78.1%) | 1,450 (21.9%) |
| 35 to 44 Years | 5,546 (82.6%) | 1,168 (17.4%) |
| 45 to 54 Years | 5,456 (85.0%) | 964 (15.0%) |
| 55 to 64 Years | 6,864 (91.0%) | 675 (8.9%) |
| 65 to 74 Years | 5,653 (100.0%) | 2 (0.0%) |
| 75 Years and older | 3,717 (100.0%) | 0 (0.0%) |
| Total | 50,391 (89.4%) | 5,984 (10.6%) |
Health Insurance Coverage by Citizenship Status in Lowndes County
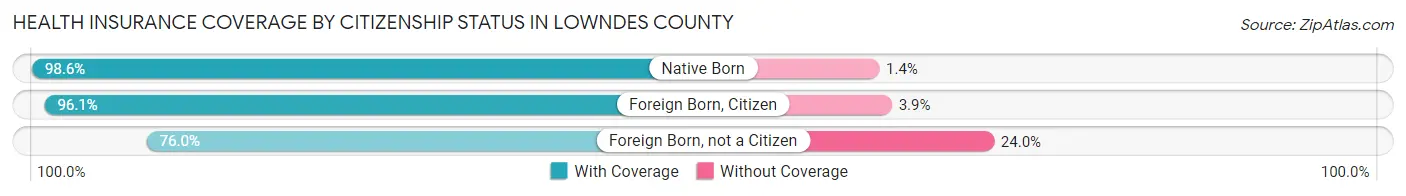
| Citizenship Status | With Coverage | Without Coverage |
| Native Born | 4,586 (98.6%) | 67 (1.4%) |
| Foreign Born, Citizen | 9,349 (96.1%) | 380 (3.9%) |
| Foreign Born, not a Citizen | 4,046 (76.0%) | 1,278 (24.0%) |
Health Insurance Coverage by Household Income in Lowndes County
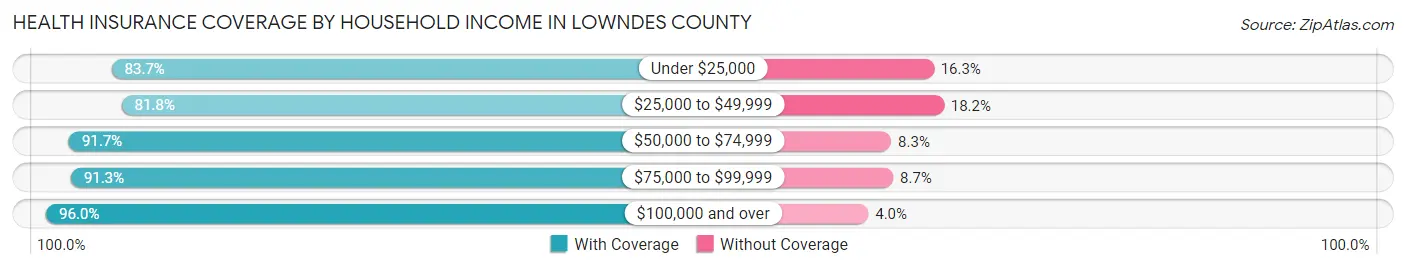
| Household Income | With Coverage | Without Coverage |
| Under $25,000 | 9,430 (83.7%) | 1,834 (16.3%) |
| $25,000 to $49,999 | 8,513 (81.8%) | 1,890 (18.2%) |
| $50,000 to $74,999 | 8,501 (91.7%) | 770 (8.3%) |
| $75,000 to $99,999 | 7,406 (91.3%) | 703 (8.7%) |
| $100,000 and over | 15,980 (96.0%) | 671 (4.0%) |
Public vs Private Health Insurance Coverage by Age in Lowndes County
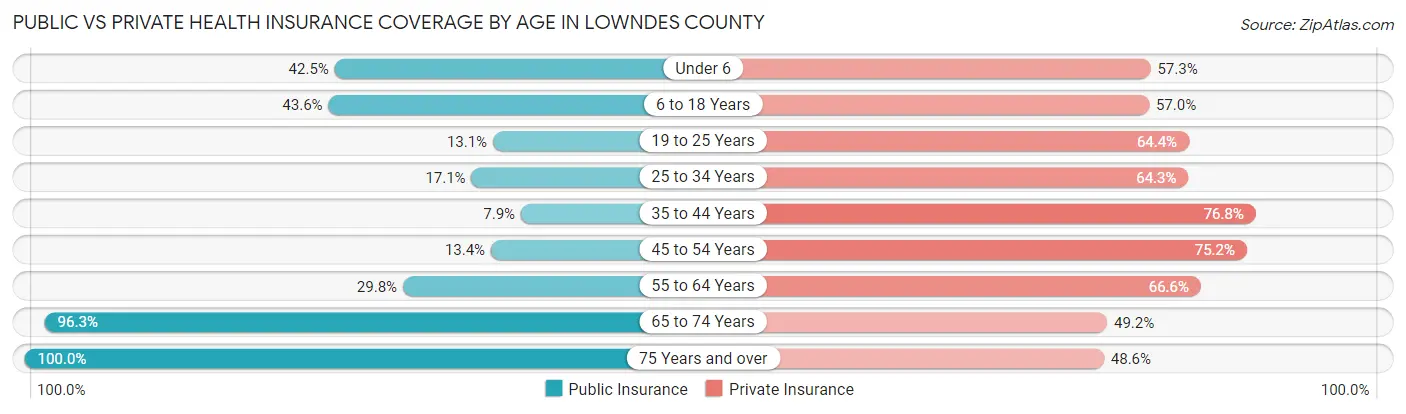
| Age Bracket | Public Insurance | Private Insurance |
| Under 6 | 1,975 (42.4%) | 2,666 (57.3%) |
| 6 to 18 Years | 4,243 (43.6%) | 5,547 (57.0%) |
| 19 to 25 Years | 696 (13.1%) | 3,430 (64.4%) |
| 25 to 34 Years | 1,130 (17.1%) | 4,260 (64.3%) |
| 35 to 44 Years | 529 (7.9%) | 5,158 (76.8%) |
| 45 to 54 Years | 863 (13.4%) | 4,825 (75.2%) |
| 55 to 64 Years | 2,245 (29.8%) | 5,023 (66.6%) |
| 65 to 74 Years | 5,444 (96.3%) | 2,784 (49.2%) |
| 75 Years and over | 3,717 (100.0%) | 1,808 (48.6%) |
| Total | 20,842 (37.0%) | 35,501 (63.0%) |
Disability Status by Sex by Age in Lowndes County
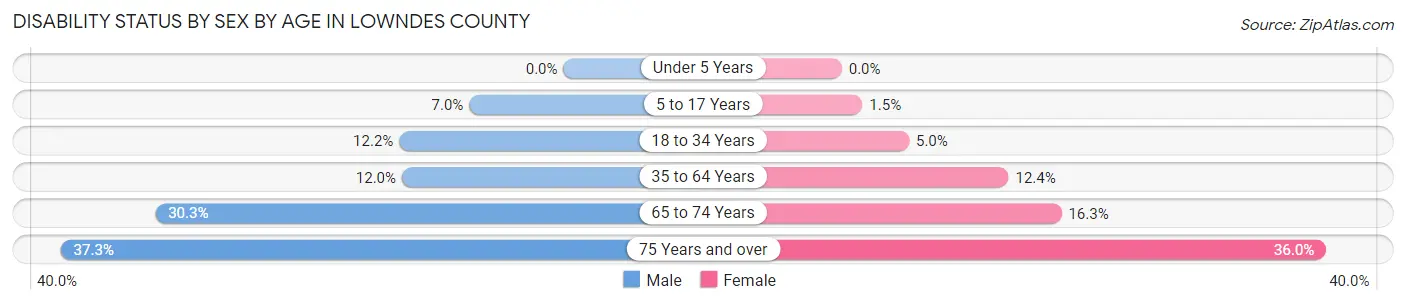
| Age Bracket | Male | Female |
| Under 5 Years | 0 (0.0%) | 0 (0.0%) |
| 5 to 17 Years | 360 (7.0%) | 74 (1.5%) |
| 18 to 34 Years | 676 (12.2%) | 349 (5.0%) |
| 35 to 64 Years | 1,159 (12.0%) | 1,363 (12.4%) |
| 65 to 74 Years | 792 (30.3%) | 496 (16.3%) |
| 75 Years and over | 502 (37.3%) | 853 (36.0%) |
Disability Class by Sex by Age in Lowndes County
Disability Class: Hearing Difficulty
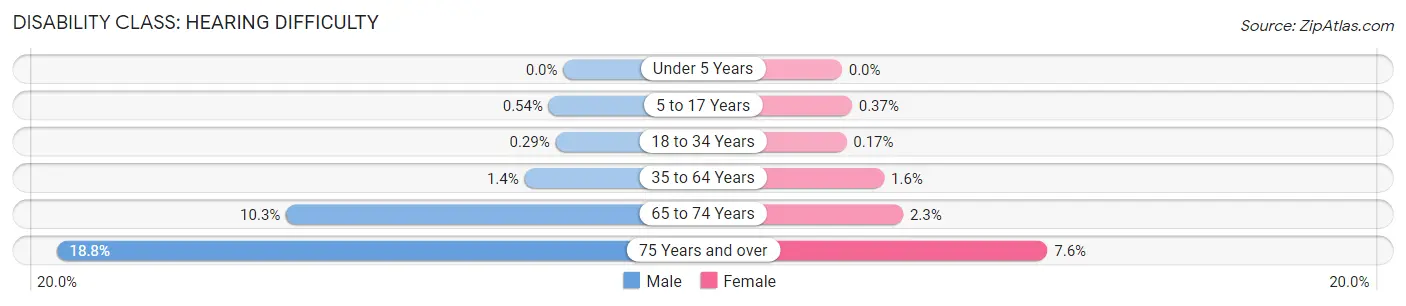
| Age Bracket | Male | Female |
| Under 5 Years | 0 (0.0%) | 0 (0.0%) |
| 5 to 17 Years | 28 (0.5%) | 18 (0.4%) |
| 18 to 34 Years | 16 (0.3%) | 12 (0.2%) |
| 35 to 64 Years | 139 (1.4%) | 173 (1.6%) |
| 65 to 74 Years | 269 (10.3%) | 69 (2.3%) |
| 75 Years and over | 253 (18.8%) | 181 (7.6%) |
Disability Class: Vision Difficulty
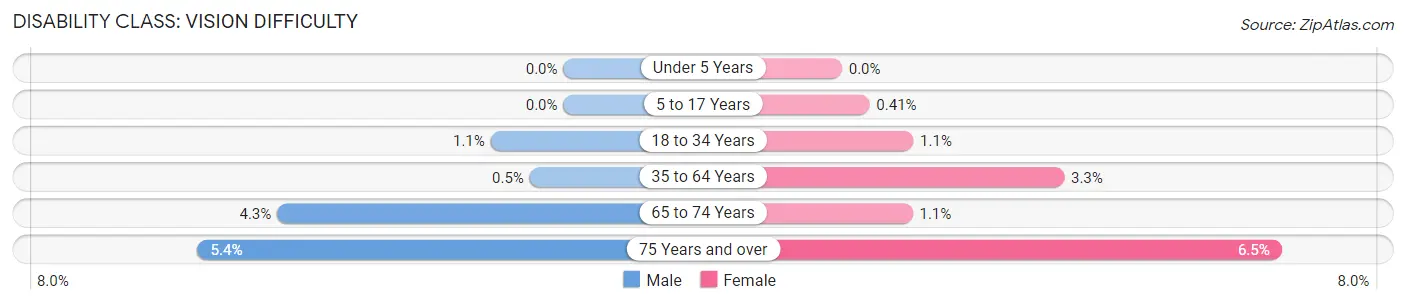
| Age Bracket | Male | Female |
| Under 5 Years | 0 (0.0%) | 0 (0.0%) |
| 5 to 17 Years | 0 (0.0%) | 20 (0.4%) |
| 18 to 34 Years | 60 (1.1%) | 74 (1.1%) |
| 35 to 64 Years | 48 (0.5%) | 363 (3.3%) |
| 65 to 74 Years | 111 (4.3%) | 32 (1.1%) |
| 75 Years and over | 73 (5.4%) | 155 (6.5%) |
Disability Class: Cognitive Difficulty
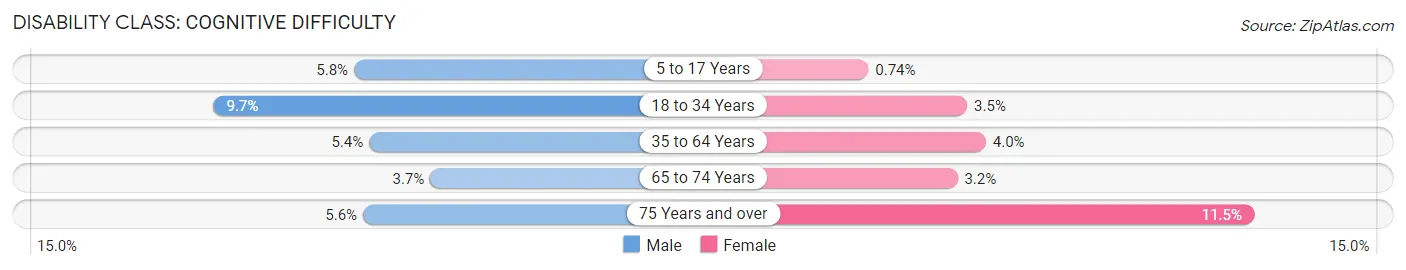
| Age Bracket | Male | Female |
| 5 to 17 Years | 300 (5.8%) | 36 (0.7%) |
| 18 to 34 Years | 540 (9.7%) | 244 (3.5%) |
| 35 to 64 Years | 523 (5.4%) | 441 (4.0%) |
| 65 to 74 Years | 97 (3.7%) | 98 (3.2%) |
| 75 Years and over | 75 (5.6%) | 272 (11.5%) |
Disability Class: Ambulatory Difficulty
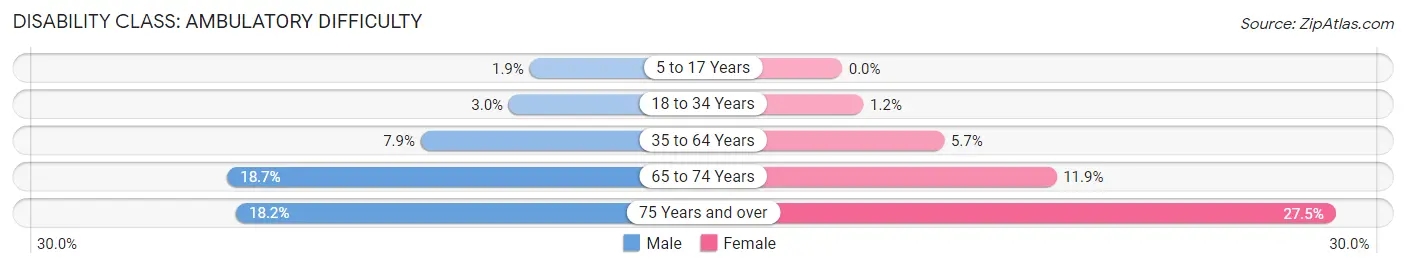
| Age Bracket | Male | Female |
| 5 to 17 Years | 97 (1.9%) | 0 (0.0%) |
| 18 to 34 Years | 168 (3.0%) | 83 (1.2%) |
| 35 to 64 Years | 767 (7.9%) | 626 (5.7%) |
| 65 to 74 Years | 489 (18.7%) | 363 (11.9%) |
| 75 Years and over | 245 (18.2%) | 652 (27.5%) |
Disability Class: Self-Care Difficulty
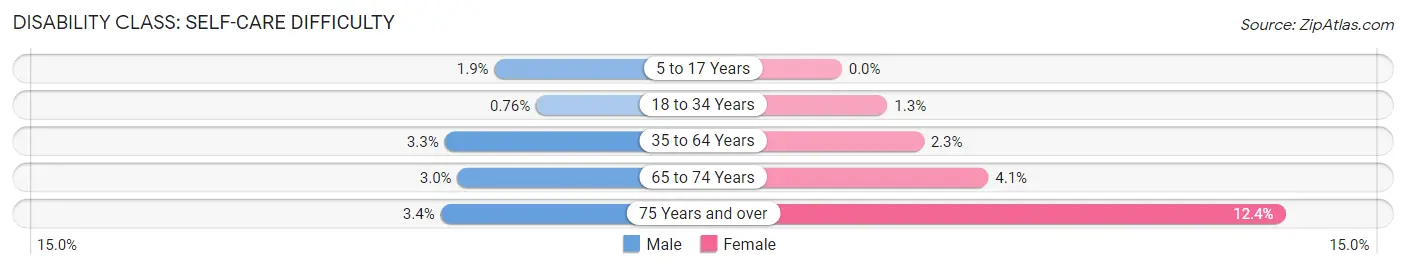
| Age Bracket | Male | Female |
| 5 to 17 Years | 99 (1.9%) | 0 (0.0%) |
| 18 to 34 Years | 42 (0.8%) | 89 (1.3%) |
| 35 to 64 Years | 320 (3.3%) | 251 (2.3%) |
| 65 to 74 Years | 77 (2.9%) | 124 (4.1%) |
| 75 Years and over | 46 (3.4%) | 293 (12.3%) |
Technology Access in Lowndes County
Computing Device Access in Lowndes County
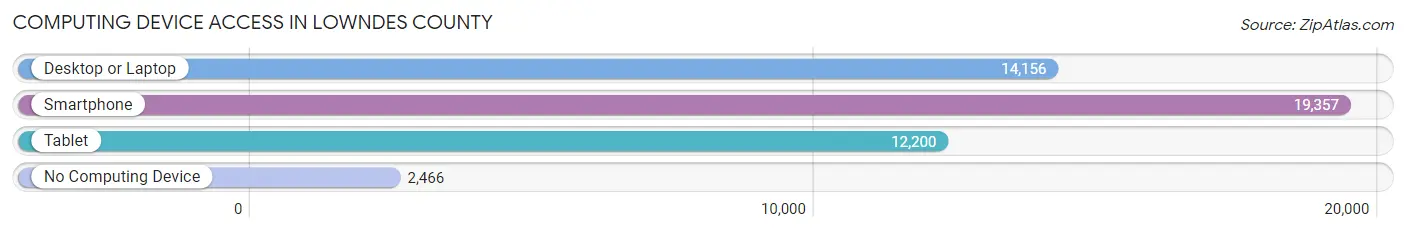
| Device Type | # Households | % Households |
| Desktop or Laptop | 14,156 | 62.5% |
| Smartphone | 19,357 | 85.5% |
| Tablet | 12,200 | 53.9% |
| No Computing Device | 2,466 | 10.9% |
| Total | 22,651 | 100.0% |
Internet Access in Lowndes County
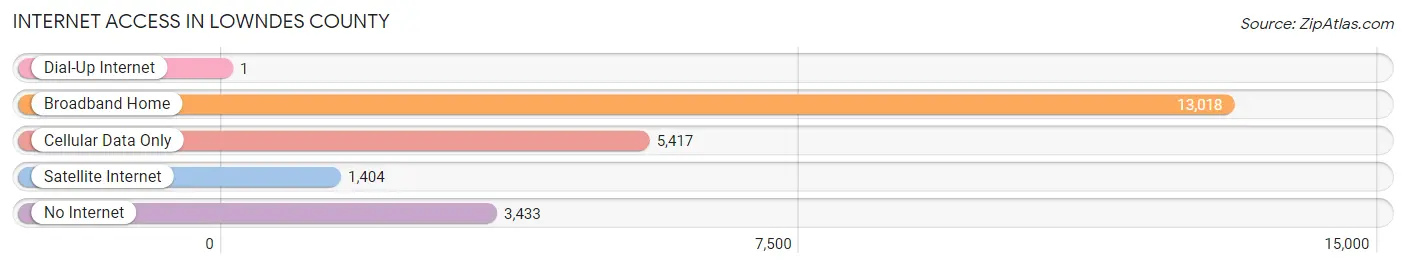
| Internet Type | # Households | % Households |
| Dial-Up Internet | 1 | 0.0% |
| Broadband Home | 13,018 | 57.5% |
| Cellular Data Only | 5,417 | 23.9% |
| Satellite Internet | 1,404 | 6.2% |
| No Internet | 3,433 | 15.2% |
| Total | 22,651 | 100.0% |
Lowndes County Summary
Lowndes County is located in the eastern part of Mississippi, in the United States. It is bordered by Clay County to the north, Oktibbeha County to the east, Noxubee County to the south, and Monroe County to the west. The county seat is Columbus, which is also the largest city in the county. Lowndes County is part of the Golden Triangle region of Mississippi, which includes the cities of Columbus, Starkville, and West Point.
History
Lowndes County was established in 1830, and was named after William Jones Lowndes, a prominent politician from South Carolina. The county was originally part of the Choctaw Nation, and was home to several Native American tribes, including the Chickasaw, Choctaw, and Natchez. The county was also home to several plantations, and was a major cotton-producing region.
During the Civil War, Lowndes County was the site of several battles, including the Battle of Columbus in 1863. After the war, the county was home to several freedmen's towns, including New Hope and Shiloh.
Geography
Lowndes County is located in the eastern part of Mississippi, and covers an area of 845 square miles. The county is mostly flat, with some rolling hills in the northern part of the county. The Tombigbee River forms the western border of the county, and the Noxubee River forms the eastern border. The county is home to several lakes, including Lake Lowndes, Lake Oktibbeha, and Lake Monroe.
The climate of Lowndes County is humid subtropical, with hot, humid summers and mild winters. The average annual temperature is around 70°F, and the average annual precipitation is around 50 inches.
Economy
The economy of Lowndes County is largely based on agriculture. The county is home to several large farms, and is a major producer of cotton, soybeans, corn, and other crops. The county is also home to several manufacturing companies, including Columbus Castings, which produces steel castings for the automotive industry.
The county is also home to several military bases, including Columbus Air Force Base and Camp Shelby. The county is also home to several colleges and universities, including Mississippi State University and East Mississippi Community College.
Demographics
As of the 2010 census, Lowndes County had a population of 59,779. The racial makeup of the county was 68.3% White, 28.7% African American, 0.3% Native American, 0.7% Asian, 0.1% Pacific Islander, 0.7% from other races, and 1.6% from two or more races. Hispanic or Latino of any race were 2.2% of the population.
The median income for a household in the county was $37,945, and the median income for a family was $45,945. The per capita income for the county was $19,945. About 17.3% of the population was below the poverty line.
Common Questions
What is Per Capita Income in Lowndes County?
Per Capita income in Lowndes County is $29,750.
What is the Median Family Income in Lowndes County?
Median Family Income in Lowndes County is $75,009.
What is the Median Household income in Lowndes County?
Median Household Income in Lowndes County is $53,687.
What is Income or Wage Gap in Lowndes County?
Income or Wage Gap in Lowndes County is 34.6%.
Women in Lowndes County earn 65.4 cents for every dollar earned by a man.
What is Family Income Deficit in Lowndes County?
Family Income Deficit in Lowndes County is $12,578.
Families that are below poverty line in Lowndes County earn $12,578 less on average than the poverty threshold level.
What is Inequality or Gini Index in Lowndes County?
Inequality or Gini Index in Lowndes County is 0.49.
What is the Total Population of Lowndes County?
Total Population of Lowndes County is 58,547.
What is the Total Male Population of Lowndes County?
Total Male Population of Lowndes County is 27,946.
What is the Total Female Population of Lowndes County?
Total Female Population of Lowndes County is 30,601.
What is the Ratio of Males per 100 Females in Lowndes County?
There are 91.32 Males per 100 Females in Lowndes County.
What is the Ratio of Females per 100 Males in Lowndes County?
There are 109.50 Females per 100 Males in Lowndes County.
What is the Median Population Age in Lowndes County?
Median Population Age in Lowndes County is 37.1 Years.
What is the Average Family Size in Lowndes County
Average Family Size in Lowndes County is 3.2 People.
What is the Average Household Size in Lowndes County
Average Household Size in Lowndes County is 2.5 People.
How Large is the Labor Force in Lowndes County?
There are 26,735 People in the Labor Forcein in Lowndes County.
What is the Percentage of People in the Labor Force in Lowndes County?
57.8% of People are in the Labor Force in Lowndes County.
What is the Unemployment Rate in Lowndes County?
Unemployment Rate in Lowndes County is 6.2%.