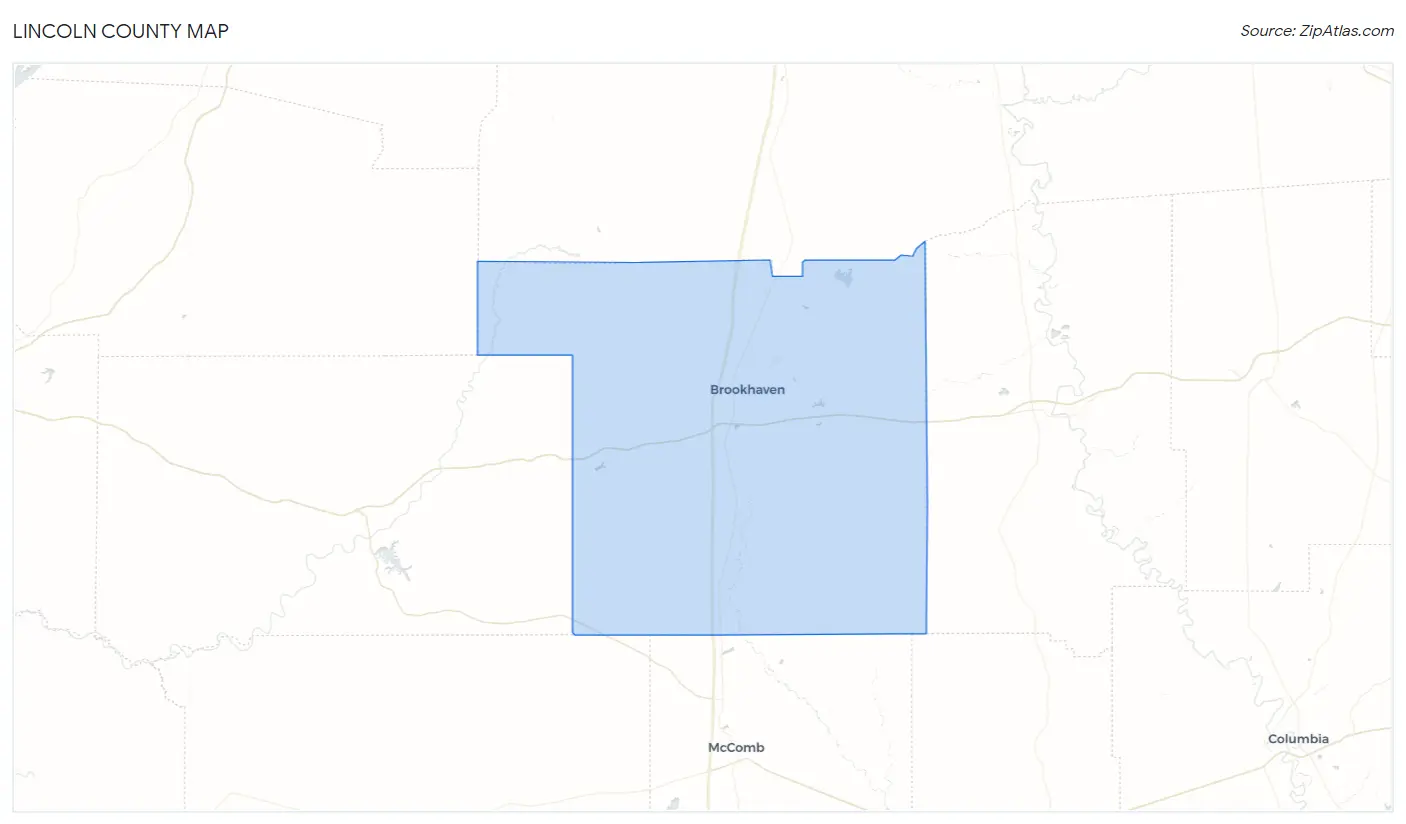
Lincoln County, MS Map & Demographics
Lincoln County Map
Lincoln County Overview
$25,775
PER CAPITA INCOME
$64,450
AVG FAMILY INCOME
$47,069
AVG HOUSEHOLD INCOME
39.9%
WAGE / INCOME GAP [ % ]
60.1¢/ $1
WAGE / INCOME GAP [ $ ]
$9,869
FAMILY INCOME DEFICIT
0.48
INEQUALITY / GINI INDEX
34,855
TOTAL POPULATION
16,669
MALE POPULATION
18,186
FEMALE POPULATION
91.66
MALES / 100 FEMALES
109.10
FEMALES / 100 MALES
40.7
MEDIAN AGE
3.2
AVG FAMILY SIZE
2.6
AVG HOUSEHOLD SIZE
14,361
LABOR FORCE [ PEOPLE ]
51.5%
PERCENT IN LABOR FORCE
4.3%
UNEMPLOYMENT RATE
Lincoln County Area Codes
Income in Lincoln County
Income Overview in Lincoln County
Per Capita Income in Lincoln County is $25,775, while median incomes of families and households are $64,450 and $47,069 respectively.
| Characteristic | Number | Measure |
| Per Capita Income | 34,855 | $25,775 |
| Median Family Income | 8,969 | $64,450 |
| Mean Family Income | 8,969 | $80,115 |
| Median Household Income | 13,070 | $47,069 |
| Mean Household Income | 13,070 | $65,345 |
| Income Deficit | 8,969 | $9,869 |
| Wage / Income Gap (%) | 34,855 | 39.88% |
| Wage / Income Gap ($) | 34,855 | 60.12¢ per $1 |
| Gini / Inequality Index | 34,855 | 0.48 |
Earnings by Sex in Lincoln County
Average Earnings in Lincoln County are $34,863, $45,722 for men and $27,486 for women, a difference of 39.9%.
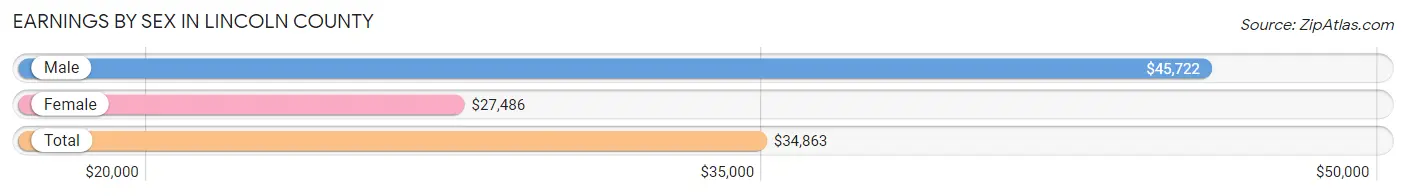
| Sex | Number | Average Earnings |
| Male | 8,304 (54.1%) | $45,722 |
| Female | 7,047 (45.9%) | $27,486 |
| Total | 15,351 (100.0%) | $34,863 |
Earnings by Sex by Income Bracket in Lincoln County
The most common earnings brackets in Lincoln County are $55,000 to $64,999 for men (1,178 | 14.2%) and $50,000 to $54,999 for women (662 | 9.4%).
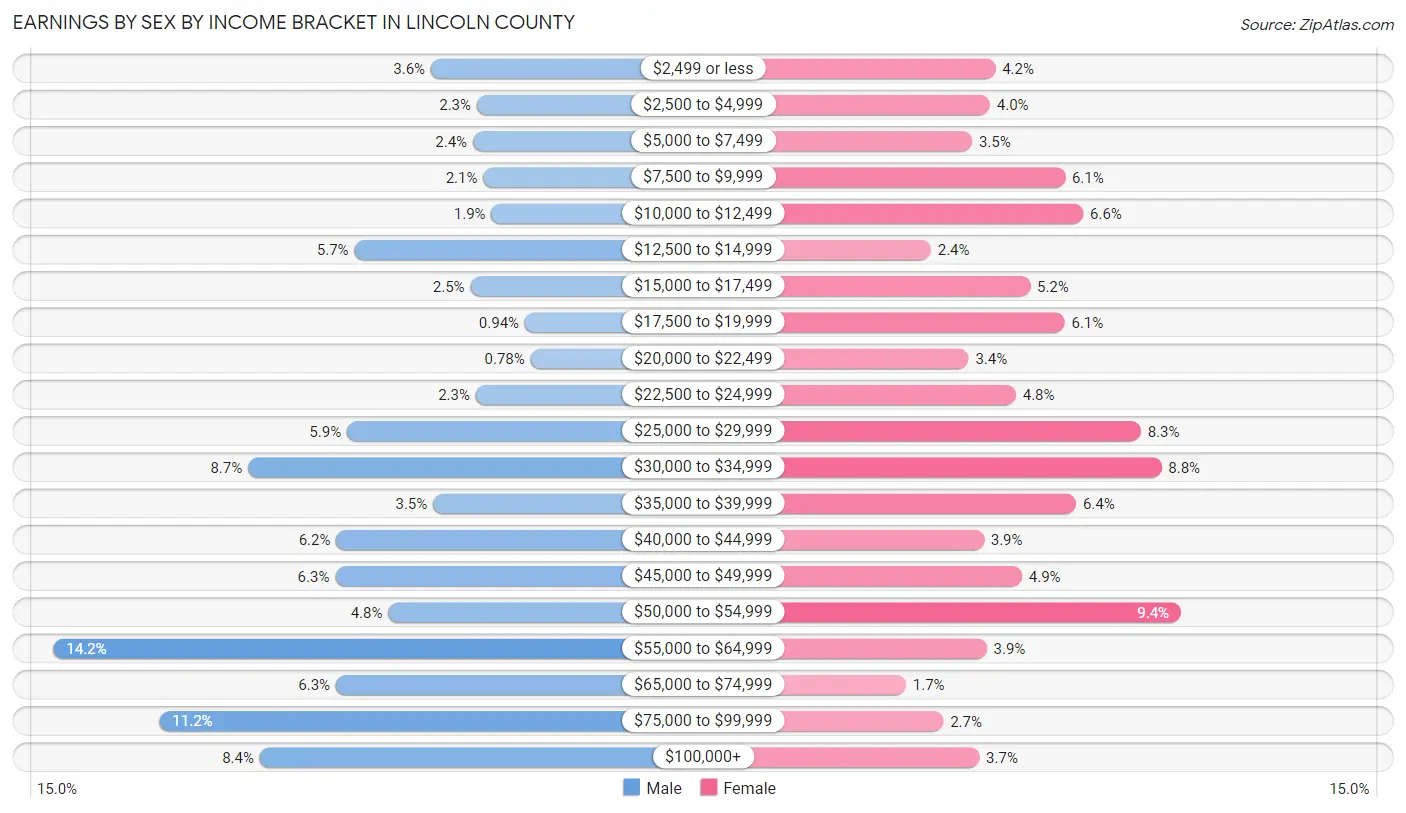
| Income | Male | Female |
| $2,499 or less | 297 (3.6%) | 294 (4.2%) |
| $2,500 to $4,999 | 190 (2.3%) | 283 (4.0%) |
| $5,000 to $7,499 | 199 (2.4%) | 248 (3.5%) |
| $7,500 to $9,999 | 175 (2.1%) | 432 (6.1%) |
| $10,000 to $12,499 | 156 (1.9%) | 468 (6.6%) |
| $12,500 to $14,999 | 476 (5.7%) | 166 (2.4%) |
| $15,000 to $17,499 | 205 (2.5%) | 363 (5.1%) |
| $17,500 to $19,999 | 78 (0.9%) | 431 (6.1%) |
| $20,000 to $22,499 | 65 (0.8%) | 241 (3.4%) |
| $22,500 to $24,999 | 193 (2.3%) | 335 (4.8%) |
| $25,000 to $29,999 | 493 (5.9%) | 582 (8.3%) |
| $30,000 to $34,999 | 724 (8.7%) | 623 (8.8%) |
| $35,000 to $39,999 | 292 (3.5%) | 454 (6.4%) |
| $40,000 to $44,999 | 518 (6.2%) | 271 (3.8%) |
| $45,000 to $49,999 | 521 (6.3%) | 347 (4.9%) |
| $50,000 to $54,999 | 397 (4.8%) | 662 (9.4%) |
| $55,000 to $64,999 | 1,178 (14.2%) | 277 (3.9%) |
| $65,000 to $74,999 | 519 (6.2%) | 117 (1.7%) |
| $75,000 to $99,999 | 931 (11.2%) | 191 (2.7%) |
| $100,000+ | 697 (8.4%) | 262 (3.7%) |
| Total | 8,304 (100.0%) | 7,047 (100.0%) |
Earnings by Sex by Educational Attainment in Lincoln County
Average earnings in Lincoln County are $47,712 for men and $30,069 for women, a difference of 37.0%. Men with an educational attainment of graduate degree enjoy the highest average annual earnings of $73,654, while those with less than high school education earn the least with $32,764. Women with an educational attainment of graduate degree earn the most with the average annual earnings of $53,355, while those with high school diploma education have the smallest earnings of $23,565.
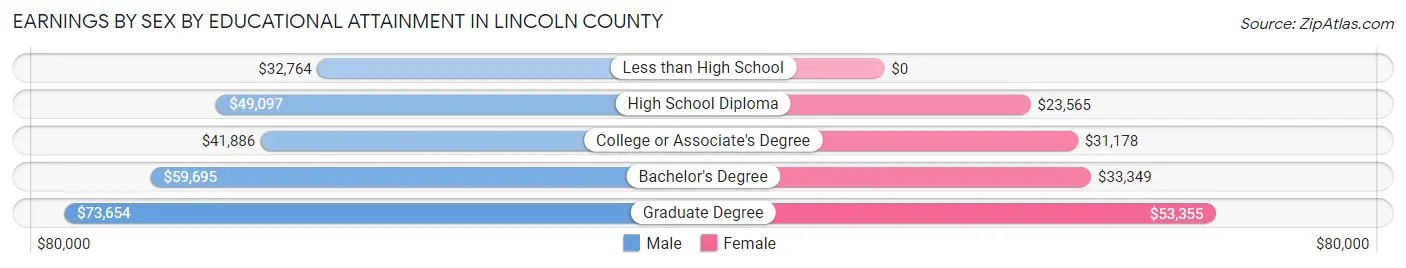
| Educational Attainment | Male Income | Female Income |
| Less than High School | $32,764 | $0 |
| High School Diploma | $49,097 | $23,565 |
| College or Associate's Degree | $41,886 | $31,178 |
| Bachelor's Degree | $59,695 | $33,349 |
| Graduate Degree | $73,654 | $53,355 |
| Total | $47,712 | $30,069 |
Family Income in Lincoln County
Family Income Brackets in Lincoln County
According to the Lincoln County family income data, there are 1,839 families falling into the $100,000 to $149,999 income range, which is the most common income bracket and makes up 20.5% of all families. Conversely, the $10,000 to $14,999 income bracket is the least frequent group with only 395 families (4.4%) belonging to this category.
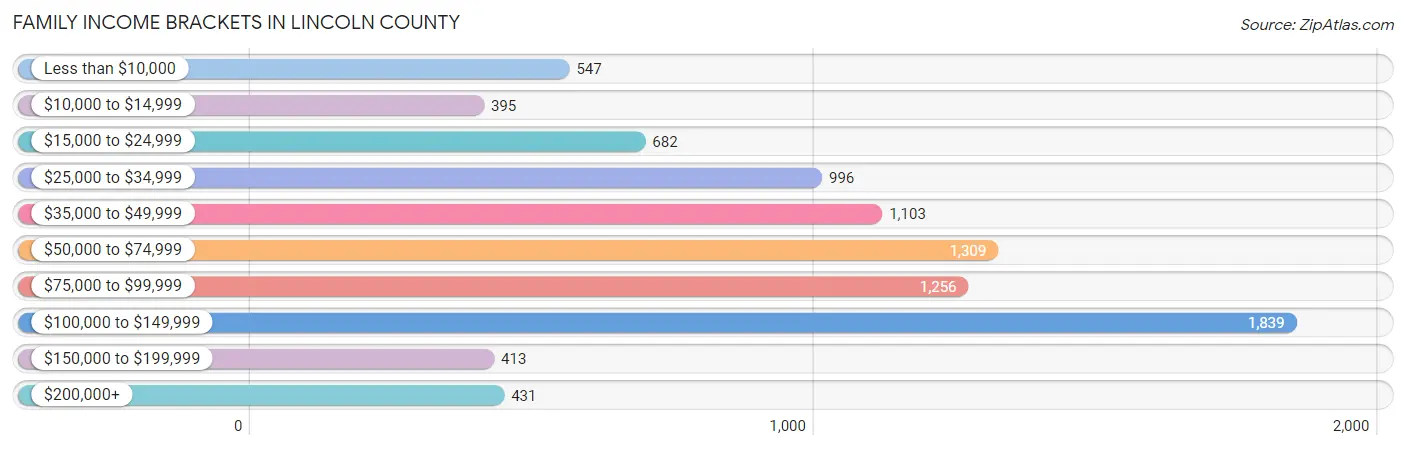
| Income Bracket | # Families | % Families |
| Less than $10,000 | 547 | 6.1% |
| $10,000 to $14,999 | 395 | 4.4% |
| $15,000 to $24,999 | 682 | 7.6% |
| $25,000 to $34,999 | 996 | 11.1% |
| $35,000 to $49,999 | 1,103 | 12.3% |
| $50,000 to $74,999 | 1,309 | 14.6% |
| $75,000 to $99,999 | 1,256 | 14.0% |
| $100,000 to $149,999 | 1,839 | 20.5% |
| $150,000 to $199,999 | 413 | 4.6% |
| $200,000+ | 431 | 4.8% |
Family Income by Famaliy Size in Lincoln County
5-person families (935 | 10.4%) account for the highest median family income in Lincoln County with $105,925 per family, while 2-person families (4,112 | 45.9%) have the highest median income of $28,808 per family member.
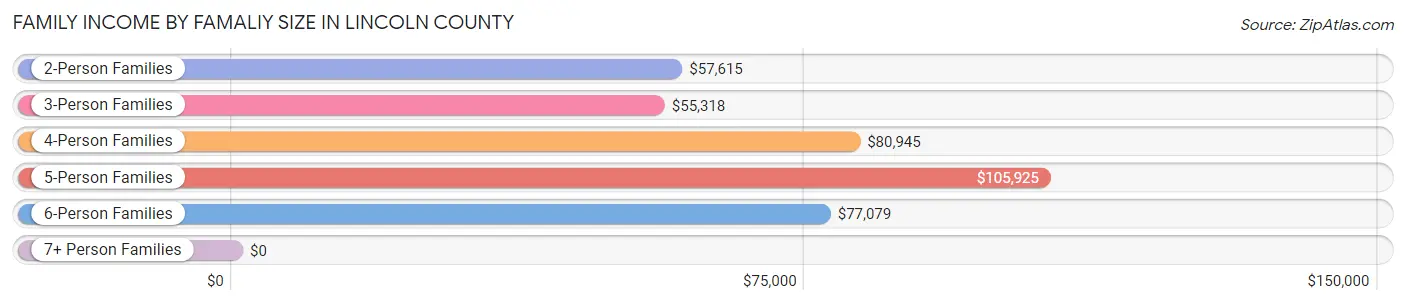
| Income Bracket | # Families | Median Income |
| 2-Person Families | 4,112 (45.9%) | $57,615 |
| 3-Person Families | 1,928 (21.5%) | $55,318 |
| 4-Person Families | 1,281 (14.3%) | $80,945 |
| 5-Person Families | 935 (10.4%) | $105,925 |
| 6-Person Families | 333 (3.7%) | $77,079 |
| 7+ Person Families | 380 (4.2%) | $0 |
| Total | 8,969 (100.0%) | $64,450 |
Family Income by Number of Earners in Lincoln County
The median family income in Lincoln County is $64,450, with families comprising 3+ earners (686) having the highest median family income of $127,000, while families with no earners (1,664) have the lowest median family income of $38,110, accounting for 7.6% and 18.5% of families, respectively.
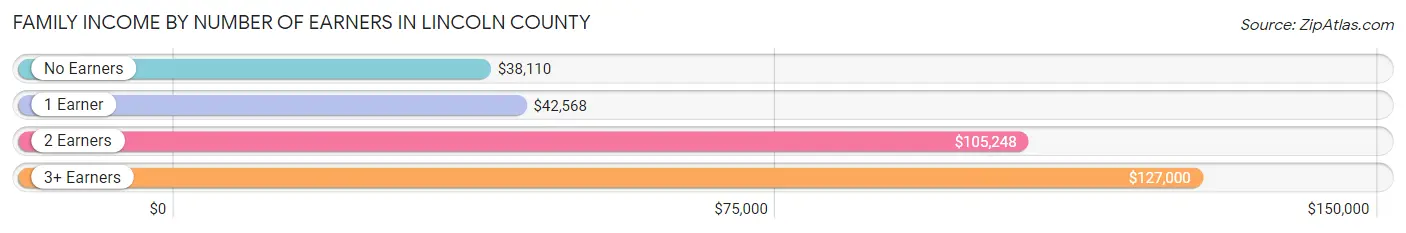
| Number of Earners | # Families | Median Income |
| No Earners | 1,664 (18.5%) | $38,110 |
| 1 Earner | 3,640 (40.6%) | $42,568 |
| 2 Earners | 2,979 (33.2%) | $105,248 |
| 3+ Earners | 686 (7.6%) | $127,000 |
| Total | 8,969 (100.0%) | $64,450 |
Household Income in Lincoln County
Household Income Brackets in Lincoln County
With 1,921 households falling in the category, the $50,000 to $74,999 income range is the most frequent in Lincoln County, accounting for 14.7% of all households. In contrast, only 431 households (3.3%) fall into the $200,000+ income bracket, making it the least populous group.
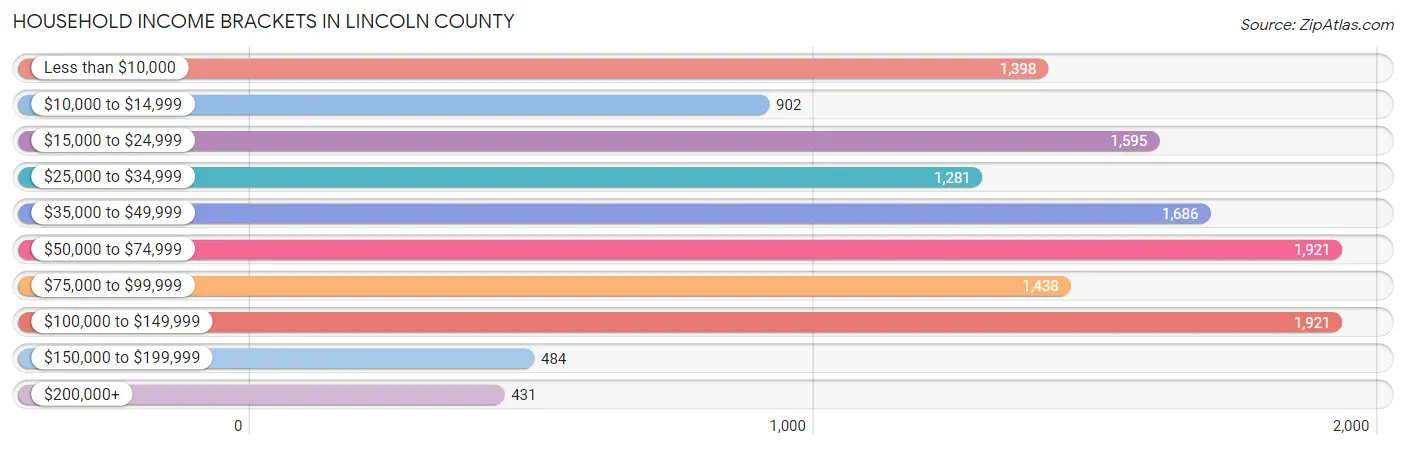
| Income Bracket | # Households | % Households |
| Less than $10,000 | 1,398 | 10.7% |
| $10,000 to $14,999 | 902 | 6.9% |
| $15,000 to $24,999 | 1,595 | 12.2% |
| $25,000 to $34,999 | 1,281 | 9.8% |
| $35,000 to $49,999 | 1,686 | 12.9% |
| $50,000 to $74,999 | 1,921 | 14.7% |
| $75,000 to $99,999 | 1,438 | 11.0% |
| $100,000 to $149,999 | 1,921 | 14.7% |
| $150,000 to $199,999 | 484 | 3.7% |
| $200,000+ | 431 | 3.3% |
Household Income by Householder Age in Lincoln County
The median household income in Lincoln County is $47,069, with the highest median household income of $60,081 found in the 45 to 64 years age bracket for the primary householder. A total of 5,215 households (39.9%) fall into this category. Meanwhile, the 65+ years age bracket for the primary householder has the lowest median household income of $33,483, with 3,755 households (28.7%) in this group.
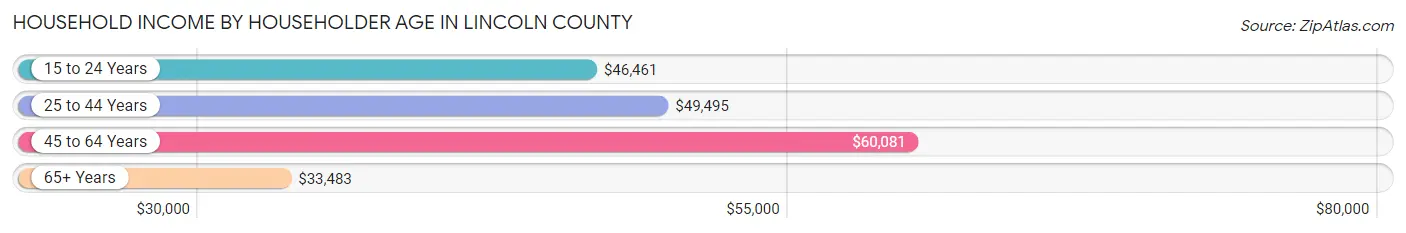
| Income Bracket | # Households | Median Income |
| 15 to 24 Years | 440 (3.4%) | $46,461 |
| 25 to 44 Years | 3,660 (28.0%) | $49,495 |
| 45 to 64 Years | 5,215 (39.9%) | $60,081 |
| 65+ Years | 3,755 (28.7%) | $33,483 |
| Total | 13,070 (100.0%) | $47,069 |
Poverty in Lincoln County
Income Below Poverty by Sex and Age in Lincoln County
With 20.6% poverty level for males and 23.9% for females among the residents of Lincoln County, 15 year old males and 25 to 34 year old females are the most vulnerable to poverty, with 66 males (60.6%) and 762 females (35.2%) in their respective age groups living below the poverty level.
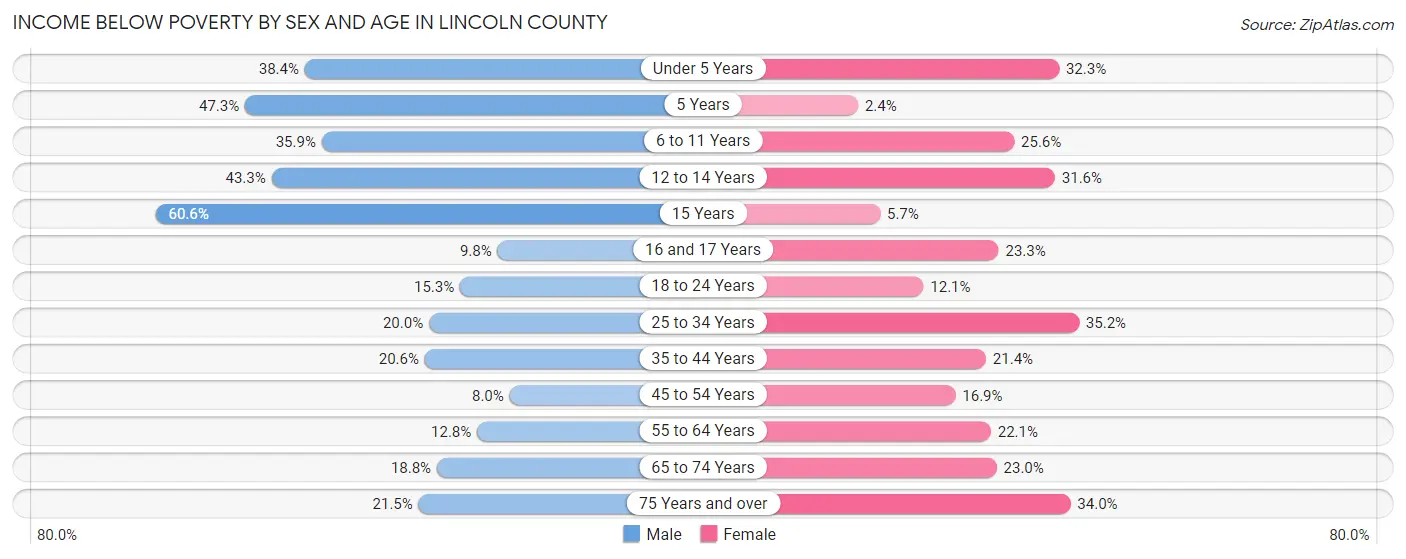
| Age Bracket | Male | Female |
| Under 5 Years | 390 (38.4%) | 319 (32.3%) |
| 5 Years | 69 (47.3%) | 3 (2.4%) |
| 6 to 11 Years | 574 (35.9%) | 337 (25.6%) |
| 12 to 14 Years | 234 (43.3%) | 230 (31.6%) |
| 15 Years | 66 (60.6%) | 18 (5.7%) |
| 16 and 17 Years | 59 (9.8%) | 108 (23.3%) |
| 18 to 24 Years | 227 (15.3%) | 171 (12.1%) |
| 25 to 34 Years | 376 (20.0%) | 762 (35.2%) |
| 35 to 44 Years | 444 (20.6%) | 496 (21.4%) |
| 45 to 54 Years | 174 (8.0%) | 392 (16.9%) |
| 55 to 64 Years | 284 (12.8%) | 579 (22.1%) |
| 65 to 74 Years | 303 (18.8%) | 435 (23.0%) |
| 75 Years and over | 182 (21.5%) | 443 (34.0%) |
| Total | 3,382 (20.6%) | 4,293 (23.9%) |
Income Above Poverty by Sex and Age in Lincoln County
According to the poverty statistics in Lincoln County, males aged 45 to 54 years and females aged 5 years are the age groups that are most secure financially, with 92.0% of males and 97.6% of females in these age groups living above the poverty line.
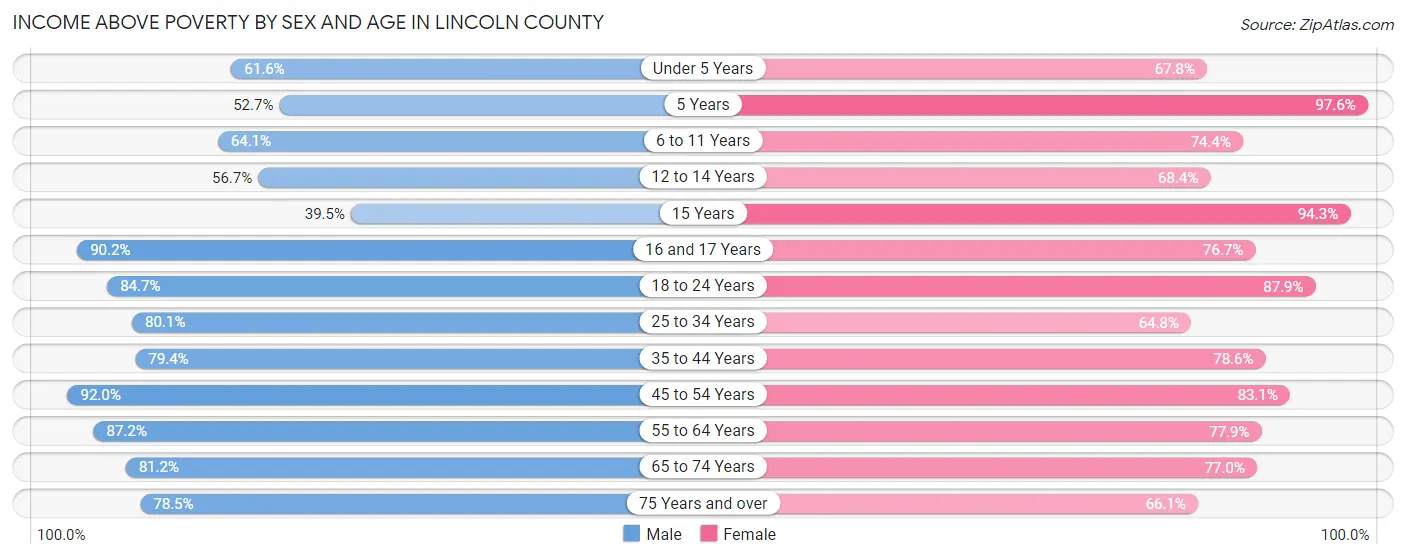
| Age Bracket | Male | Female |
| Under 5 Years | 626 (61.6%) | 670 (67.7%) |
| 5 Years | 77 (52.7%) | 122 (97.6%) |
| 6 to 11 Years | 1,026 (64.1%) | 980 (74.4%) |
| 12 to 14 Years | 306 (56.7%) | 497 (68.4%) |
| 15 Years | 43 (39.5%) | 299 (94.3%) |
| 16 and 17 Years | 545 (90.2%) | 356 (76.7%) |
| 18 to 24 Years | 1,253 (84.7%) | 1,241 (87.9%) |
| 25 to 34 Years | 1,509 (80.0%) | 1,402 (64.8%) |
| 35 to 44 Years | 1,715 (79.4%) | 1,822 (78.6%) |
| 45 to 54 Years | 2,006 (92.0%) | 1,933 (83.1%) |
| 55 to 64 Years | 1,933 (87.2%) | 2,037 (77.9%) |
| 65 to 74 Years | 1,311 (81.2%) | 1,457 (77.0%) |
| 75 Years and over | 665 (78.5%) | 862 (66.0%) |
| Total | 13,015 (79.4%) | 13,678 (76.1%) |
Income Below Poverty Among Married-Couple Families in Lincoln County
The poverty statistics for married-couple families in Lincoln County show that 12.2% or 815 of the total 6,671 families live below the poverty line. Families with 5 or more children have the highest poverty rate of 84.3%, comprising of 204 families. On the other hand, families with no children have the lowest poverty rate of 3.2%, which includes 115 families.
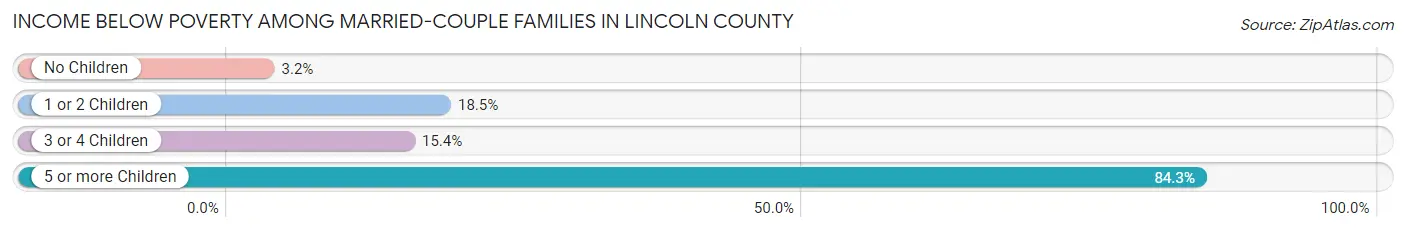
| Children | Above Poverty | Below Poverty |
| No Children | 3,506 (96.8%) | 115 (3.2%) |
| 1 or 2 Children | 1,648 (81.5%) | 375 (18.5%) |
| 3 or 4 Children | 664 (84.6%) | 121 (15.4%) |
| 5 or more Children | 38 (15.7%) | 204 (84.3%) |
| Total | 5,856 (87.8%) | 815 (12.2%) |
Income Below Poverty Among Single-Parent Households in Lincoln County
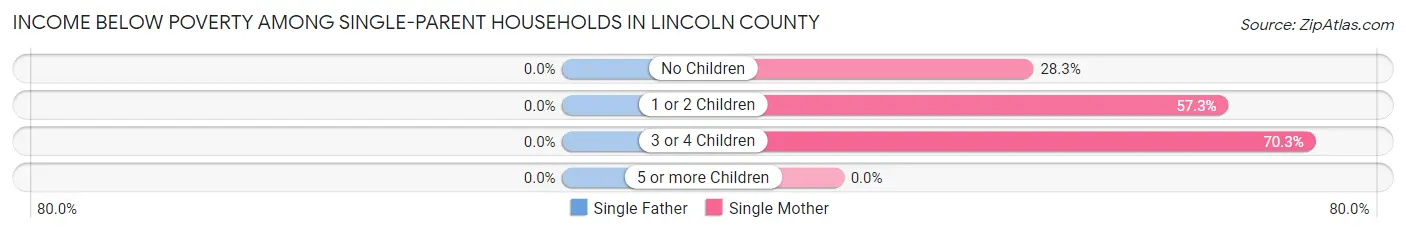
| Children | Single Father | Single Mother |
| No Children | 0 (0.0%) | 207 (28.3%) |
| 1 or 2 Children | 0 (0.0%) | 473 (57.3%) |
| 3 or 4 Children | 0 (0.0%) | 213 (70.3%) |
| 5 or more Children | 0 (0.0%) | 0 (0.0%) |
| Total | 0 (0.0%) | 893 (48.0%) |
Income Below Poverty Among Married-Couple vs Single-Parent Households in Lincoln County
The poverty data for Lincoln County shows that 815 of the married-couple family households (12.2%) and 893 of the single-parent households (38.9%) are living below the poverty level. Within the married-couple family households, those with 5 or more children have the highest poverty rate, with 204 households (84.3%) falling below the poverty line. Among the single-parent households, those with 3 or 4 children have the highest poverty rate, with 213 household (66.1%) living below poverty.
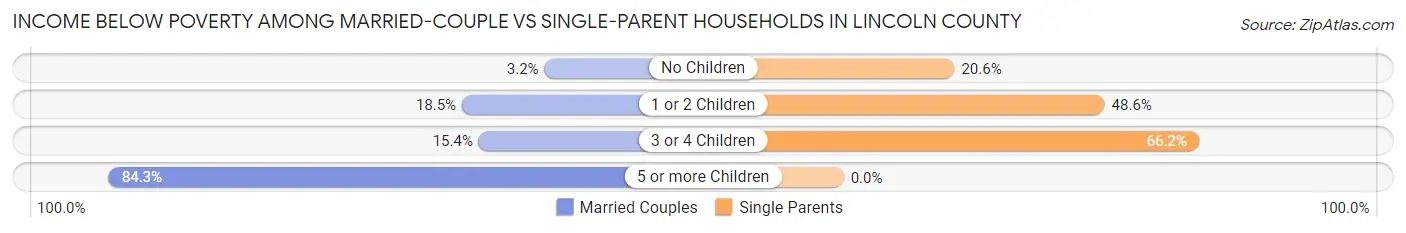
| Children | Married-Couple Families | Single-Parent Households |
| No Children | 115 (3.2%) | 207 (20.6%) |
| 1 or 2 Children | 375 (18.5%) | 473 (48.6%) |
| 3 or 4 Children | 121 (15.4%) | 213 (66.1%) |
| 5 or more Children | 204 (84.3%) | 0 (0.0%) |
| Total | 815 (12.2%) | 893 (38.9%) |
Race in Lincoln County
The most populous races in Lincoln County are White / Caucasian (23,670 | 67.9%), Black / African American (10,547 | 30.3%), and Hispanic or Latino (462 | 1.3%).
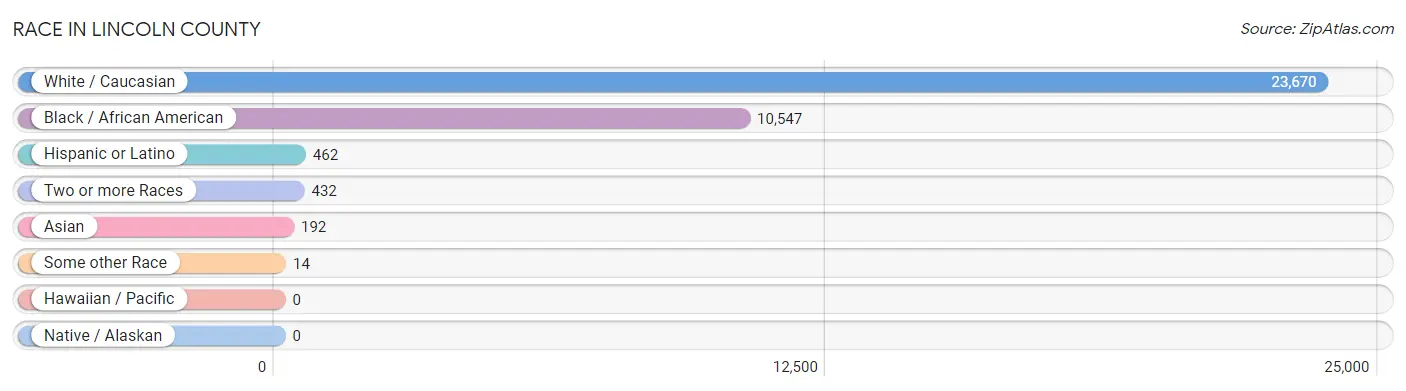
| Race | # Population | % Population |
| Asian | 192 | 0.5% |
| Black / African American | 10,547 | 30.3% |
| Hawaiian / Pacific | 0 | 0.0% |
| Hispanic or Latino | 462 | 1.3% |
| Native / Alaskan | 0 | 0.0% |
| White / Caucasian | 23,670 | 67.9% |
| Two or more Races | 432 | 1.2% |
| Some other Race | 14 | 0.0% |
| Total | 34,855 | 100.0% |
Ancestry in Lincoln County
The most populous ancestries reported in Lincoln County are American (3,110 | 8.9%), Irish (1,852 | 5.3%), English (1,809 | 5.2%), German (993 | 2.9%), and Scotch-Irish (945 | 2.7%), together accounting for 25.0% of all Lincoln County residents.
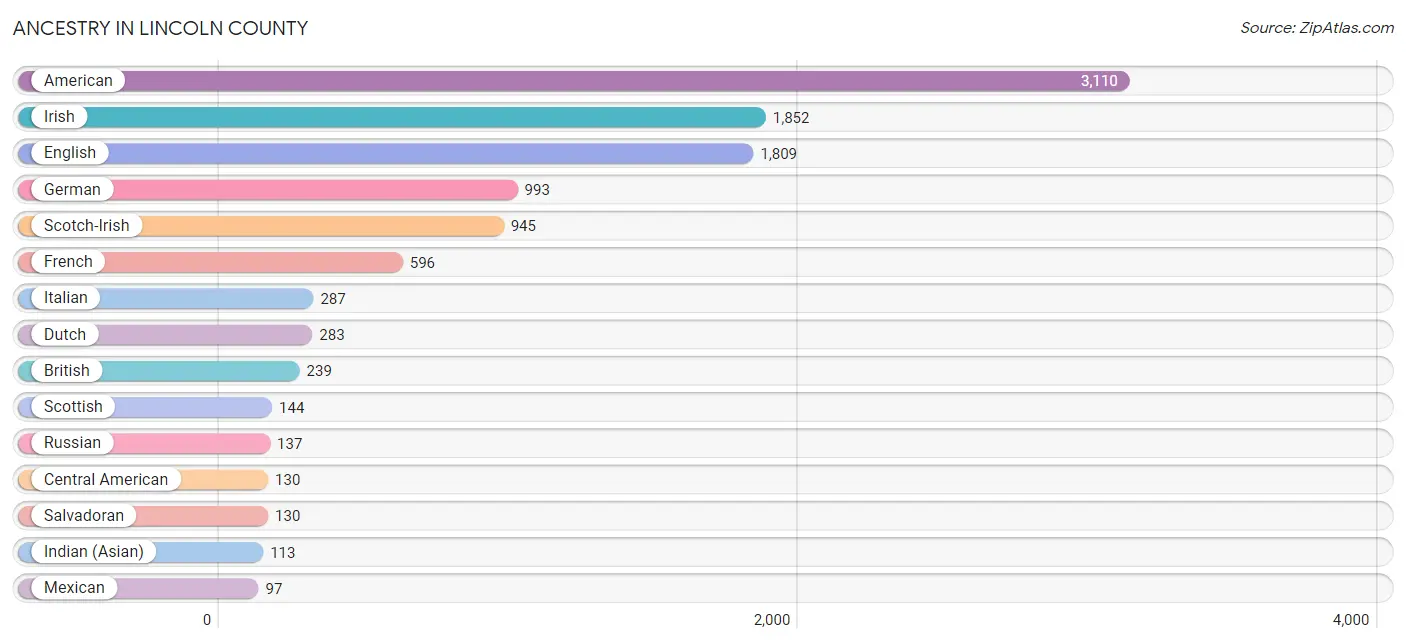
| Ancestry | # Population | % Population |
| African | 96 | 0.3% |
| American | 3,110 | 8.9% |
| Arab | 75 | 0.2% |
| Armenian | 16 | 0.1% |
| British | 239 | 0.7% |
| Cajun | 65 | 0.2% |
| Canadian | 27 | 0.1% |
| Central American | 130 | 0.4% |
| Cherokee | 4 | 0.0% |
| Choctaw | 69 | 0.2% |
| Creek | 9 | 0.0% |
| Cuban | 8 | 0.0% |
| Dutch | 283 | 0.8% |
| English | 1,809 | 5.2% |
| European | 30 | 0.1% |
| Finnish | 32 | 0.1% |
| French | 596 | 1.7% |
| French Canadian | 43 | 0.1% |
| German | 993 | 2.9% |
| Houma | 16 | 0.1% |
| Icelander | 35 | 0.1% |
| Indian (Asian) | 113 | 0.3% |
| Irish | 1,852 | 5.3% |
| Italian | 287 | 0.8% |
| Japanese | 3 | 0.0% |
| Korean | 14 | 0.0% |
| Lithuanian | 35 | 0.1% |
| Mexican | 97 | 0.3% |
| Northern European | 34 | 0.1% |
| Palestinian | 39 | 0.1% |
| Pennsylvania German | 8 | 0.0% |
| Polish | 67 | 0.2% |
| Portuguese | 15 | 0.0% |
| Romanian | 14 | 0.0% |
| Russian | 137 | 0.4% |
| Salvadoran | 130 | 0.4% |
| Scotch-Irish | 945 | 2.7% |
| Scottish | 144 | 0.4% |
| Sri Lankan | 9 | 0.0% |
| Subsaharan African | 96 | 0.3% |
| Swedish | 25 | 0.1% |
| Swiss | 14 | 0.0% |
| Syrian | 36 | 0.1% |
| Thai | 71 | 0.2% |
| Welsh | 45 | 0.1% | View All 45 Rows |
Immigrants in Lincoln County
The most numerous immigrant groups reported in Lincoln County came from Asia (185 | 0.5%), China (89 | 0.3%), Eastern Asia (89 | 0.3%), India (71 | 0.2%), and South Central Asia (71 | 0.2%), together accounting for 1.5% of all Lincoln County residents.
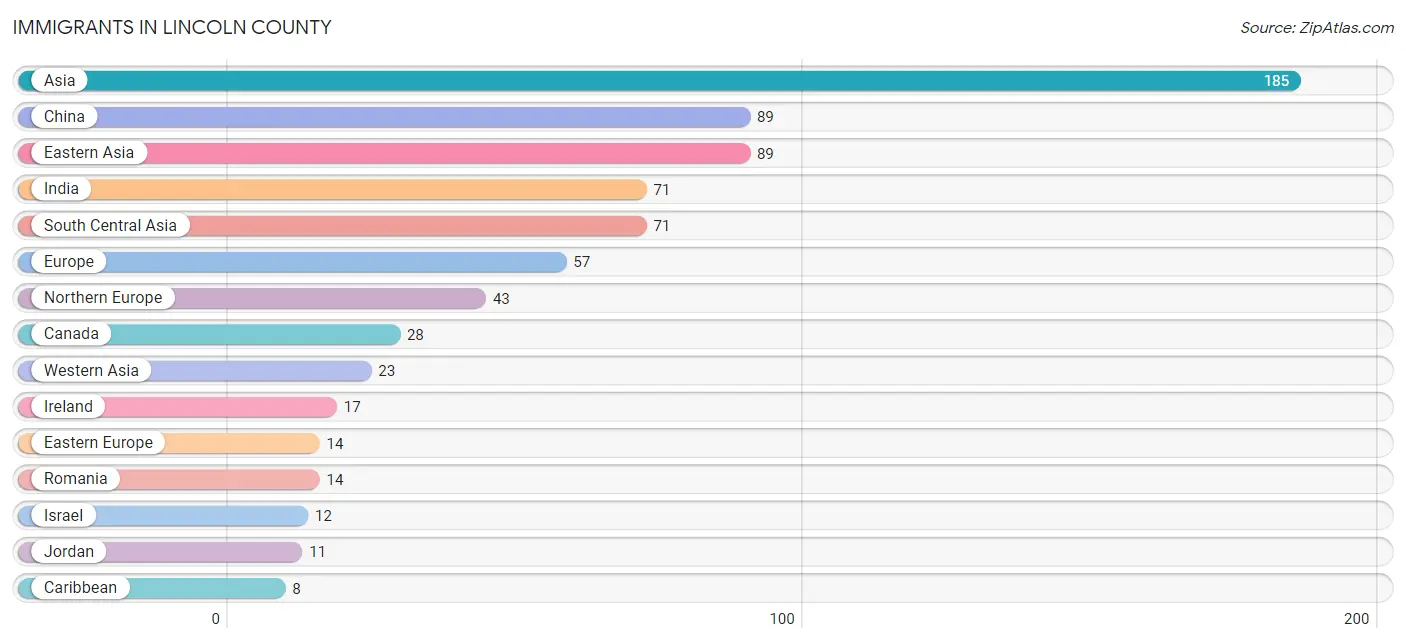
| Immigration Origin | # Population | % Population |
| Asia | 185 | 0.5% |
| Cambodia | 2 | 0.0% |
| Canada | 28 | 0.1% |
| Caribbean | 8 | 0.0% |
| China | 89 | 0.3% |
| Cuba | 8 | 0.0% |
| Eastern Asia | 89 | 0.3% |
| Eastern Europe | 14 | 0.0% |
| Europe | 57 | 0.2% |
| India | 71 | 0.2% |
| Ireland | 17 | 0.1% |
| Israel | 12 | 0.0% |
| Jordan | 11 | 0.0% |
| Latin America | 8 | 0.0% |
| Northern Europe | 43 | 0.1% |
| Romania | 14 | 0.0% |
| South Central Asia | 71 | 0.2% |
| South Eastern Asia | 2 | 0.0% |
| Western Asia | 23 | 0.1% | View All 19 Rows |
Sex and Age in Lincoln County
Sex and Age in Lincoln County
The most populous age groups in Lincoln County are 55 to 59 Years (1,333 | 8.0%) for men and 40 to 44 Years (1,437 | 7.9%) for women.
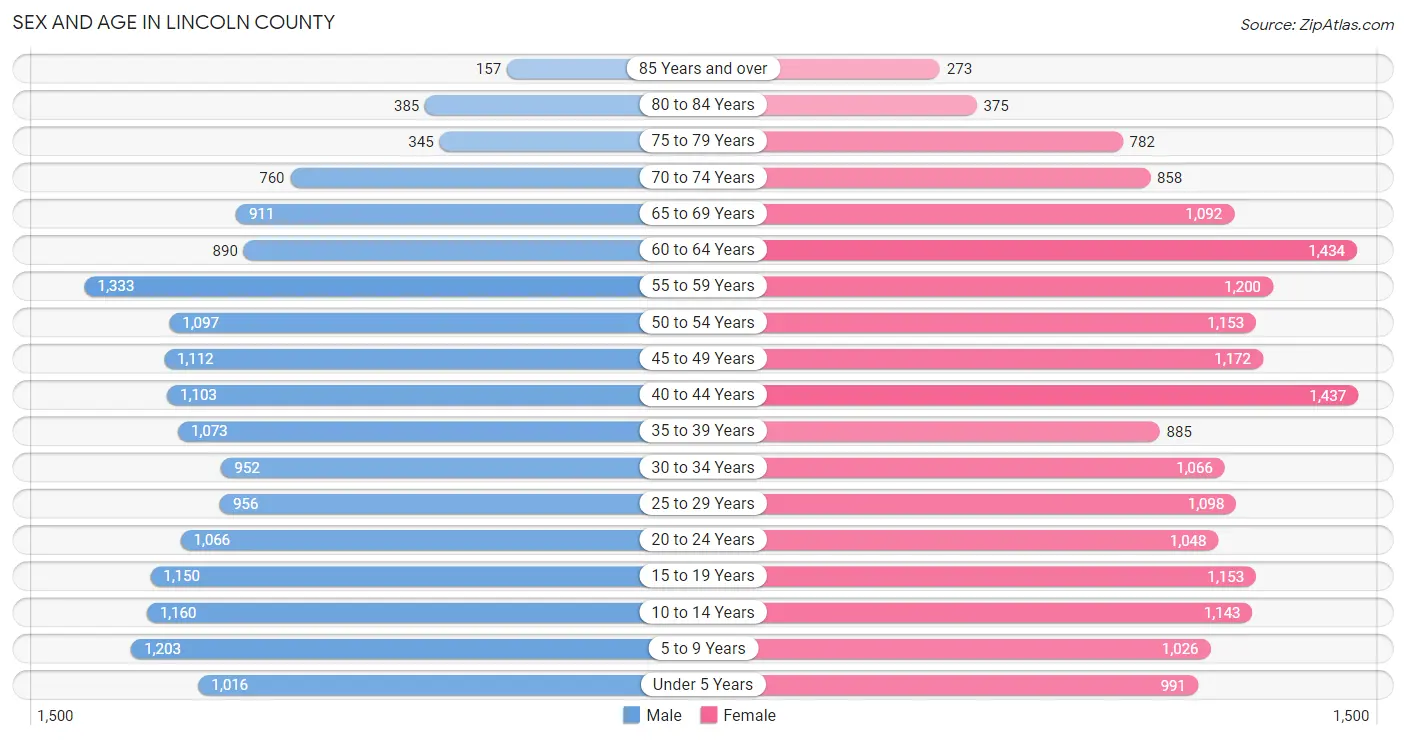
| Age Bracket | Male | Female |
| Under 5 Years | 1,016 (6.1%) | 991 (5.4%) |
| 5 to 9 Years | 1,203 (7.2%) | 1,026 (5.6%) |
| 10 to 14 Years | 1,160 (7.0%) | 1,143 (6.3%) |
| 15 to 19 Years | 1,150 (6.9%) | 1,153 (6.3%) |
| 20 to 24 Years | 1,066 (6.4%) | 1,048 (5.8%) |
| 25 to 29 Years | 956 (5.7%) | 1,098 (6.0%) |
| 30 to 34 Years | 952 (5.7%) | 1,066 (5.9%) |
| 35 to 39 Years | 1,073 (6.4%) | 885 (4.9%) |
| 40 to 44 Years | 1,103 (6.6%) | 1,437 (7.9%) |
| 45 to 49 Years | 1,112 (6.7%) | 1,172 (6.4%) |
| 50 to 54 Years | 1,097 (6.6%) | 1,153 (6.3%) |
| 55 to 59 Years | 1,333 (8.0%) | 1,200 (6.6%) |
| 60 to 64 Years | 890 (5.3%) | 1,434 (7.9%) |
| 65 to 69 Years | 911 (5.5%) | 1,092 (6.0%) |
| 70 to 74 Years | 760 (4.6%) | 858 (4.7%) |
| 75 to 79 Years | 345 (2.1%) | 782 (4.3%) |
| 80 to 84 Years | 385 (2.3%) | 375 (2.1%) |
| 85 Years and over | 157 (0.9%) | 273 (1.5%) |
| Total | 16,669 (100.0%) | 18,186 (100.0%) |
Families and Households in Lincoln County
Median Family Size in Lincoln County
The median family size in Lincoln County is 3.25 persons per family, with single male/father families (438 | 4.9%) accounting for the largest median family size of 3.78 persons per family. On the other hand, married-couple families (6,671 | 74.4%) represent the smallest median family size with 3.21 persons per family.
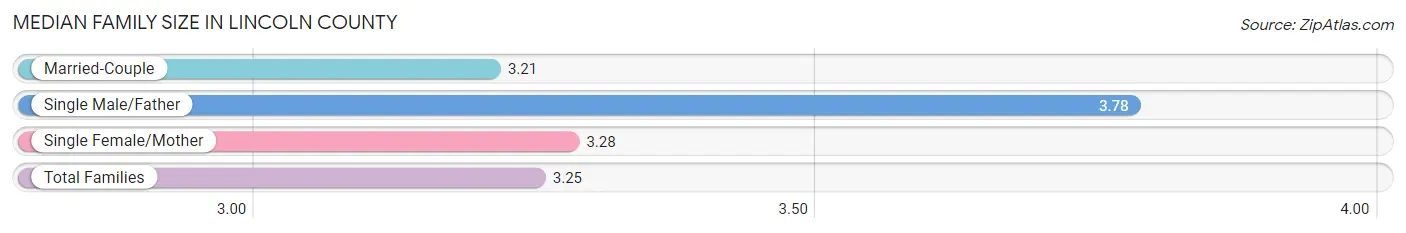
| Family Type | # Families | Family Size |
| Married-Couple | 6,671 (74.4%) | 3.21 |
| Single Male/Father | 438 (4.9%) | 3.78 |
| Single Female/Mother | 1,860 (20.7%) | 3.28 |
| Total Families | 8,969 (100.0%) | 3.25 |
Median Household Size in Lincoln County
The median household size in Lincoln County is 2.62 persons per household, with single male/father households (438 | 3.4%) accounting for the largest median household size of 3.94 persons per household. non-family households (4,101 | 31.4%) represent the smallest median household size with 1.13 persons per household.
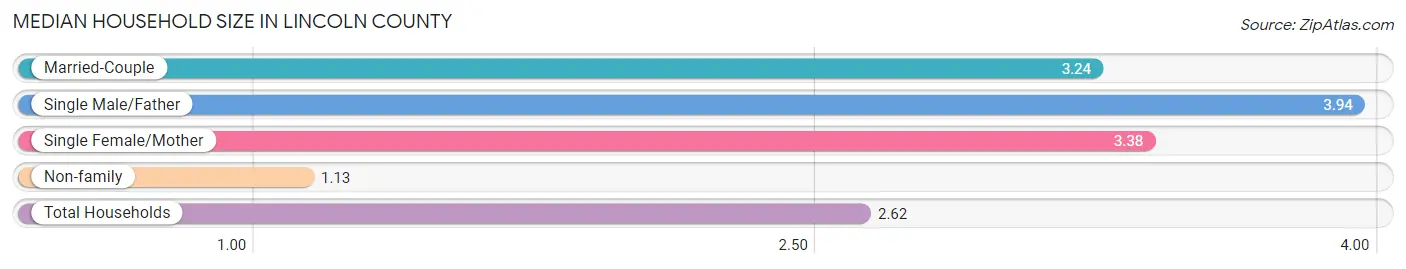
| Household Type | # Households | Household Size |
| Married-Couple | 6,671 (51.0%) | 3.24 |
| Single Male/Father | 438 (3.4%) | 3.94 |
| Single Female/Mother | 1,860 (14.2%) | 3.38 |
| Non-family | 4,101 (31.4%) | 1.13 |
| Total Households | 13,070 (100.0%) | 2.62 |
Household Size by Marriage Status in Lincoln County
Out of a total of 13,070 households in Lincoln County, 8,969 (68.6%) are family households, while 4,101 (31.4%) are nonfamily households. The most numerous type of family households are 2-person households, comprising 4,048, and the most common type of nonfamily households are 1-person households, comprising 3,724.
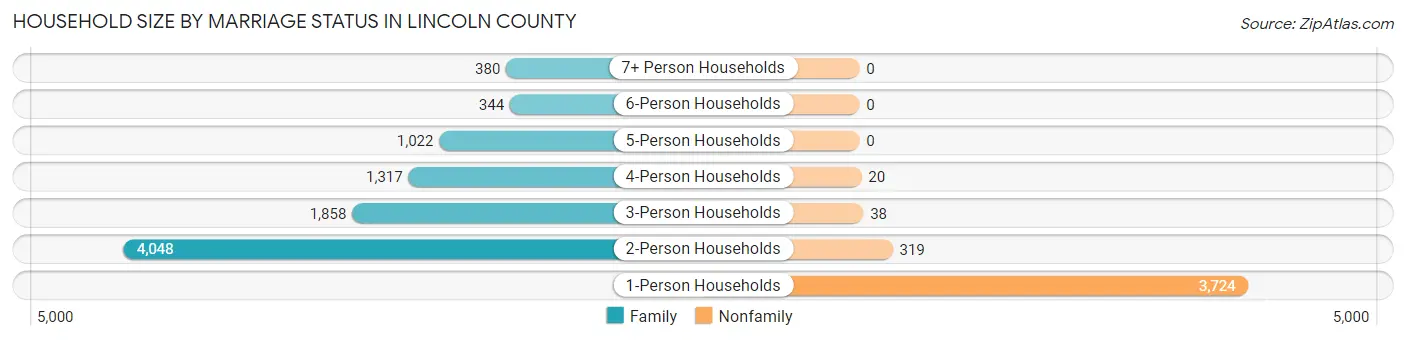
| Household Size | Family Households | Nonfamily Households |
| 1-Person Households | - | 3,724 (28.5%) |
| 2-Person Households | 4,048 (31.0%) | 319 (2.4%) |
| 3-Person Households | 1,858 (14.2%) | 38 (0.3%) |
| 4-Person Households | 1,317 (10.1%) | 20 (0.2%) |
| 5-Person Households | 1,022 (7.8%) | 0 (0.0%) |
| 6-Person Households | 344 (2.6%) | 0 (0.0%) |
| 7+ Person Households | 380 (2.9%) | 0 (0.0%) |
| Total | 8,969 (68.6%) | 4,101 (31.4%) |
Female Fertility in Lincoln County
Fertility by Age in Lincoln County
Average fertility rate in Lincoln County is 70.0 births per 1,000 women. Women in the age bracket of 20 to 34 years have the highest fertility rate with 110.0 births per 1,000 women. Women in the age bracket of 20 to 34 years acount for 61.4% of all women with births.
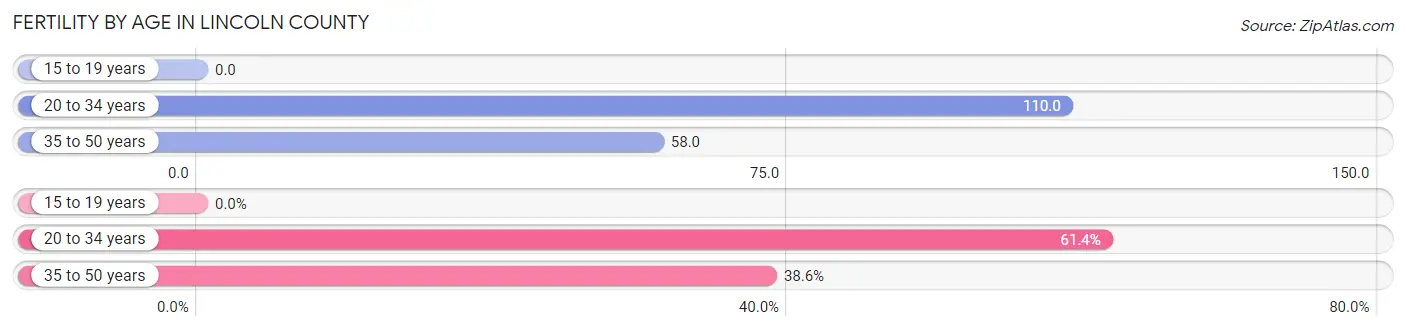
| Age Bracket | Women with Births | Births / 1,000 Women |
| 15 to 19 years | 0 (0.0%) | 0.0 |
| 20 to 34 years | 353 (61.4%) | 110.0 |
| 35 to 50 years | 222 (38.6%) | 58.0 |
| Total | 575 (100.0%) | 70.0 |
Fertility by Age by Marriage Status in Lincoln County
58.6% of women with births (575) in Lincoln County are married. The highest percentage of unmarried women with births falls into 20 to 34 years age bracket with 67.4% of them unmarried at the time of birth, while the lowest percentage of unmarried women with births belong to 35 to 50 years age bracket with 0.0% of them unmarried.
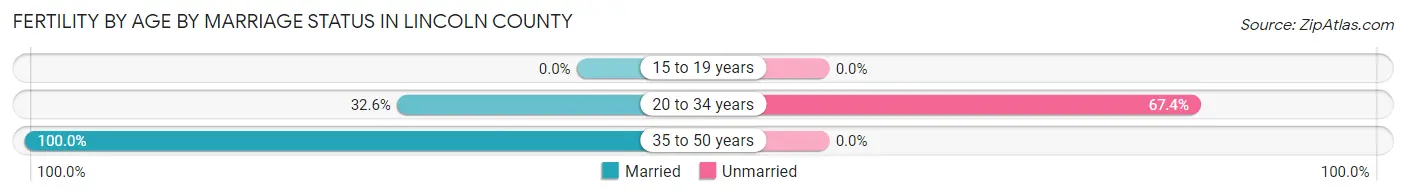
| Age Bracket | Married | Unmarried |
| 15 to 19 years | 0 (0.0%) | 0 (0.0%) |
| 20 to 34 years | 115 (32.6%) | 238 (67.4%) |
| 35 to 50 years | 222 (100.0%) | 0 (0.0%) |
| Total | 337 (58.6%) | 238 (41.4%) |
Fertility by Education in Lincoln County
Average fertility rate in Lincoln County is 70.0 births per 1,000 women. Women with the education attainment of graduate degree have the highest fertility rate of 206.0 births per 1,000 women, while women with the education attainment of bachelor's degree have the lowest fertility at 11.0 births per 1,000 women. Women with the education attainment of college or associate's degree represent 47.0% of all women with births.
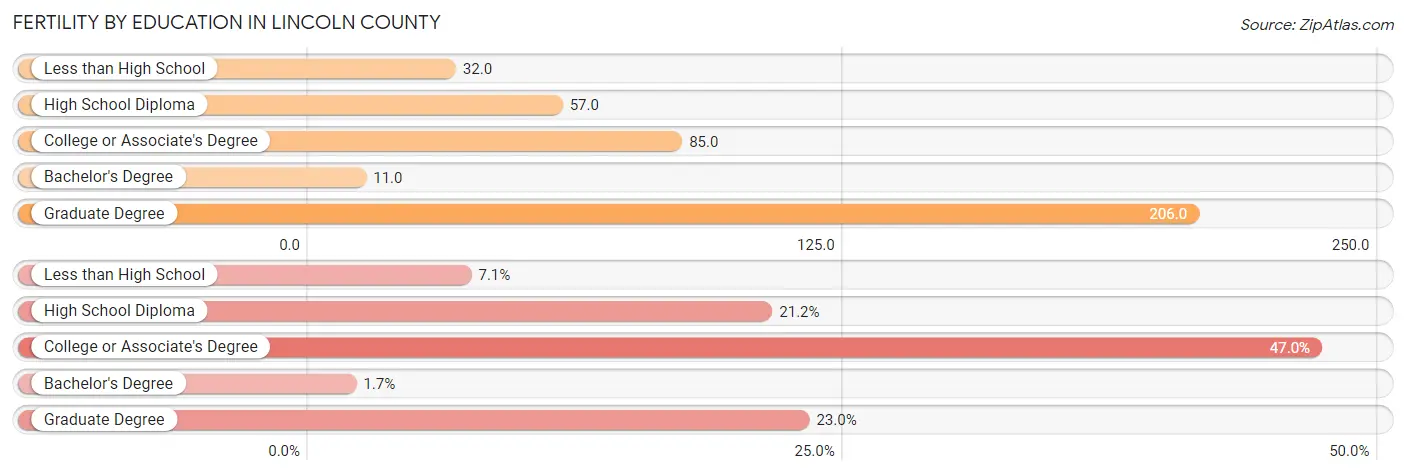
| Educational Attainment | Women with Births | Births / 1,000 Women |
| Less than High School | 41 (7.1%) | 32.0 |
| High School Diploma | 122 (21.2%) | 57.0 |
| College or Associate's Degree | 270 (47.0%) | 85.0 |
| Bachelor's Degree | 10 (1.7%) | 11.0 |
| Graduate Degree | 132 (23.0%) | 206.0 |
| Total | 575 (100.0%) | 70.0 |
Fertility by Education by Marriage Status in Lincoln County
41.4% of women with births in Lincoln County are unmarried. Women with the educational attainment of less than high school are most likely to be married with 100.0% of them married at childbirth, while women with the educational attainment of college or associate's degree are least likely to be married with 74.1% of them unmarried at childbirth.
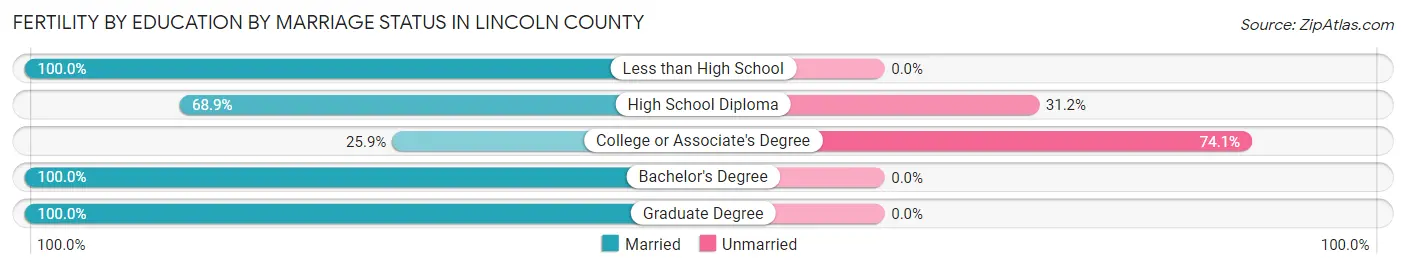
| Educational Attainment | Married | Unmarried |
| Less than High School | 41 (100.0%) | 0 (0.0%) |
| High School Diploma | 84 (68.9%) | 38 (31.1%) |
| College or Associate's Degree | 70 (25.9%) | 200 (74.1%) |
| Bachelor's Degree | 10 (100.0%) | 0 (0.0%) |
| Graduate Degree | 132 (100.0%) | 0 (0.0%) |
| Total | 337 (58.6%) | 238 (41.4%) |
Employment Characteristics in Lincoln County
Employment by Class of Employer in Lincoln County
Among the 13,497 employed individuals in Lincoln County, private company employees (9,417 | 69.8%), state government employees (1,126 | 8.3%), and self-employed (not incorporated) (748 | 5.5%) make up the most common classes of employment.
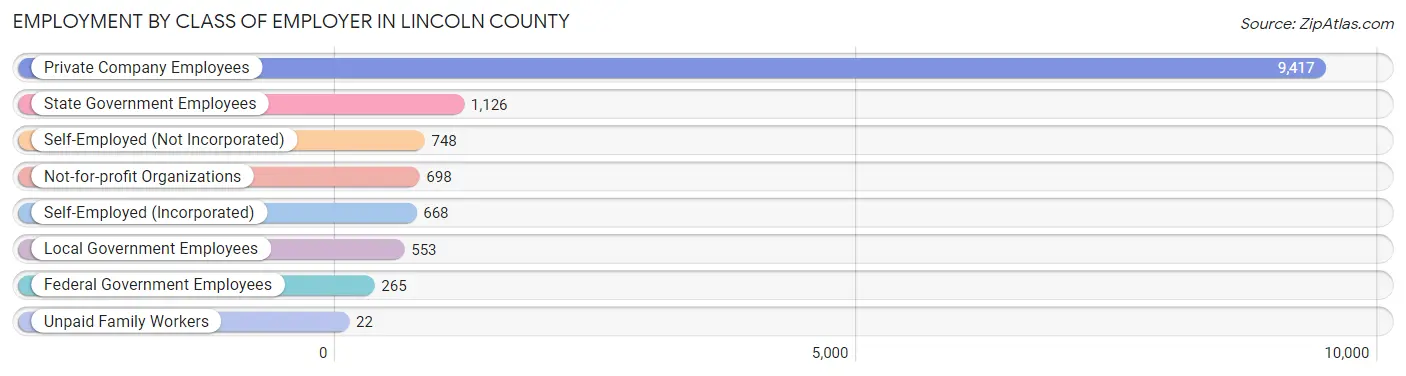
| Employer Class | # Employees | % Employees |
| Private Company Employees | 9,417 | 69.8% |
| Self-Employed (Incorporated) | 668 | 5.0% |
| Self-Employed (Not Incorporated) | 748 | 5.5% |
| Not-for-profit Organizations | 698 | 5.2% |
| Local Government Employees | 553 | 4.1% |
| State Government Employees | 1,126 | 8.3% |
| Federal Government Employees | 265 | 2.0% |
| Unpaid Family Workers | 22 | 0.2% |
| Total | 13,497 | 100.0% |
Employment Status by Age in Lincoln County
According to the labor force statistics for Lincoln County, out of the total population over 16 years of age (27,886), 51.5% or 14,361 individuals are in the labor force, with 4.3% or 618 of them unemployed. The age group with the highest labor force participation rate is 35 to 44 years, with 79.1% or 3,558 individuals in the labor force. Within the labor force, the 16 to 19 years age range has the highest percentage of unemployed individuals, with 14.3% or 48 of them being unemployed.
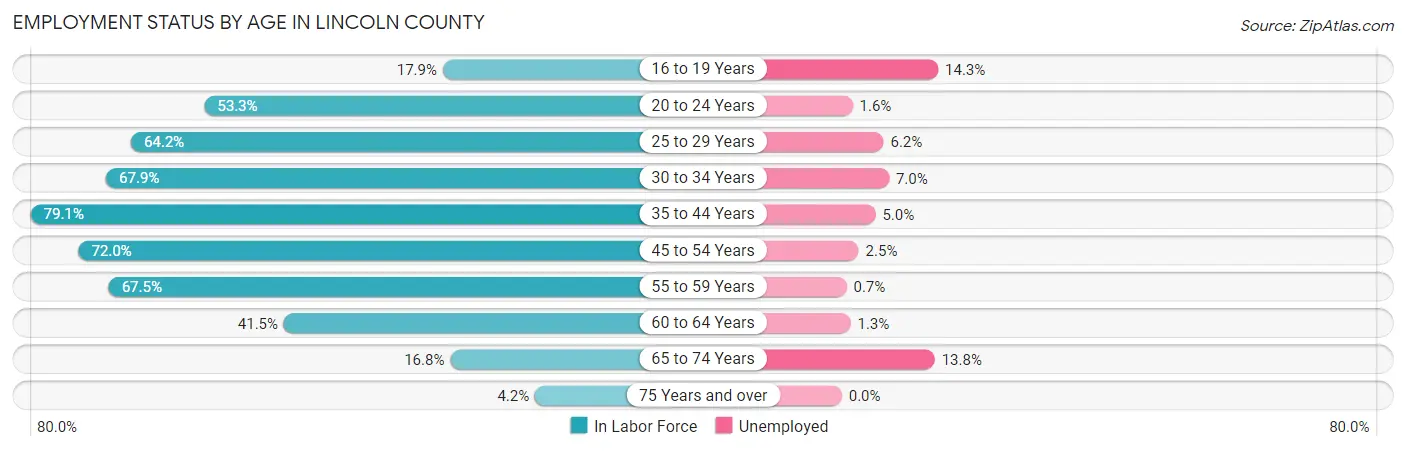
| Age Bracket | In Labor Force | Unemployed |
| 16 to 19 Years | 335 (17.9%) | 48 (14.3%) |
| 20 to 24 Years | 1,127 (53.3%) | 18 (1.6%) |
| 25 to 29 Years | 1,319 (64.2%) | 82 (6.2%) |
| 30 to 34 Years | 1,370 (67.9%) | 96 (7.0%) |
| 35 to 44 Years | 3,558 (79.1%) | 178 (5.0%) |
| 45 to 54 Years | 3,264 (72.0%) | 82 (2.5%) |
| 55 to 59 Years | 1,710 (67.5%) | 12 (0.7%) |
| 60 to 64 Years | 964 (41.5%) | 13 (1.3%) |
| 65 to 74 Years | 608 (16.8%) | 84 (13.8%) |
| 75 Years and over | 97 (4.2%) | 0 (0.0%) |
| Total | 14,361 (51.5%) | 618 (4.3%) |
Employment Status by Educational Attainment in Lincoln County
According to labor force statistics for Lincoln County, 67.8% of individuals (12,178) out of the total population between 25 and 64 years of age (17,961) are in the labor force, with 3.8% or 463 of them being unemployed. The group with the highest labor force participation rate are those with the educational attainment of bachelor's degree or higher, with 86.3% or 3,223 individuals in the labor force. Within the labor force, individuals with less than high school education have the highest percentage of unemployment, with 16.5% or 144 of them being unemployed.
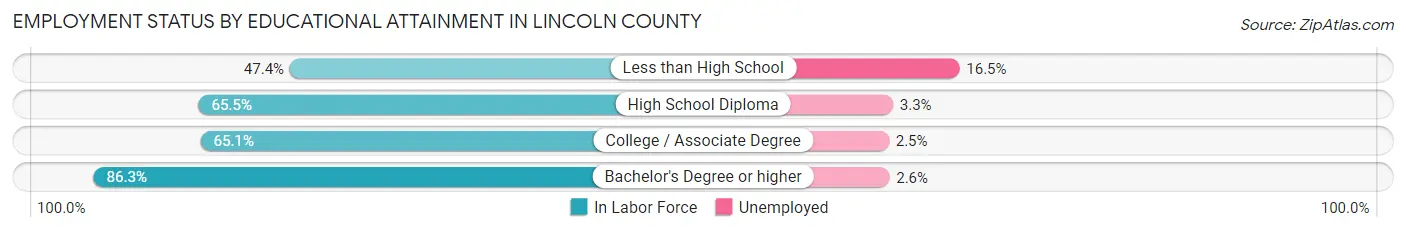
| Educational Attainment | In Labor Force | Unemployed |
| Less than High School | 870 (47.4%) | 303 (16.5%) |
| High School Diploma | 4,330 (65.5%) | 218 (3.3%) |
| College / Associate Degree | 3,763 (65.1%) | 144 (2.5%) |
| Bachelor's Degree or higher | 3,223 (86.3%) | 97 (2.6%) |
| Total | 12,178 (67.8%) | 683 (3.8%) |
Employment Occupations by Sex in Lincoln County
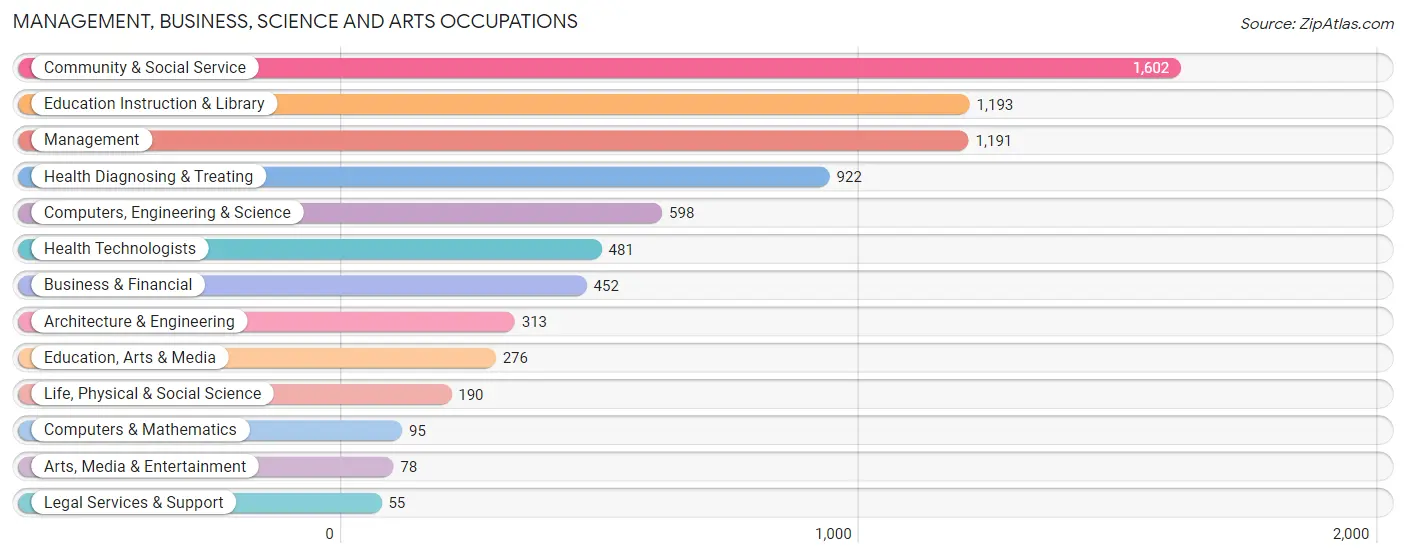
Management, Business, Science and Arts Occupations
The most common Management, Business, Science and Arts occupations in Lincoln County are Community & Social Service (1,602 | 11.7%), Education Instruction & Library (1,193 | 8.7%), Management (1,191 | 8.7%), Health Diagnosing & Treating (922 | 6.7%), and Computers, Engineering & Science (598 | 4.3%).
Management, Business, Science and Arts Occupations by Sex
Within the Management, Business, Science and Arts occupations in Lincoln County, the most male-oriented occupations are Computers & Mathematics (100.0%), Computers, Engineering & Science (73.8%), and Architecture & Engineering (72.2%), while the most female-oriented occupations are Legal Services & Support (100.0%), Health Technologists (88.1%), and Health Diagnosing & Treating (85.9%).
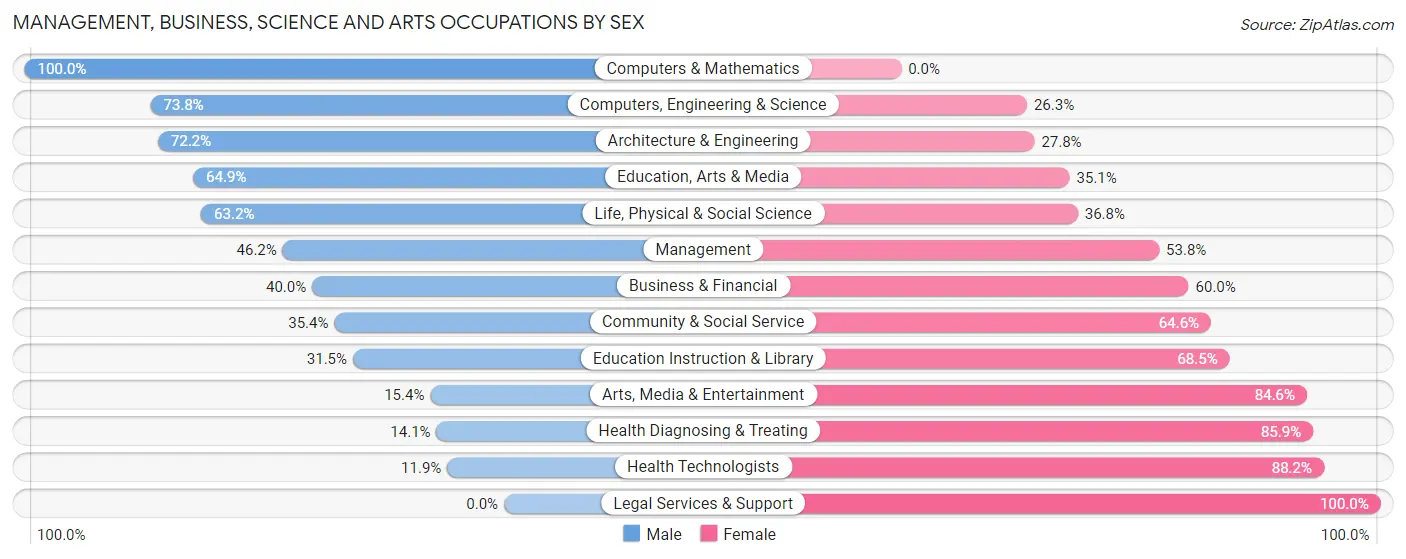
| Occupation | Male | Female |
| Management | 550 (46.2%) | 641 (53.8%) |
| Business & Financial | 181 (40.0%) | 271 (60.0%) |
| Computers, Engineering & Science | 441 (73.8%) | 157 (26.3%) |
| Computers & Mathematics | 95 (100.0%) | 0 (0.0%) |
| Architecture & Engineering | 226 (72.2%) | 87 (27.8%) |
| Life, Physical & Social Science | 120 (63.2%) | 70 (36.8%) |
| Community & Social Service | 567 (35.4%) | 1,035 (64.6%) |
| Education, Arts & Media | 179 (64.9%) | 97 (35.1%) |
| Legal Services & Support | 0 (0.0%) | 55 (100.0%) |
| Education Instruction & Library | 376 (31.5%) | 817 (68.5%) |
| Arts, Media & Entertainment | 12 (15.4%) | 66 (84.6%) |
| Health Diagnosing & Treating | 130 (14.1%) | 792 (85.9%) |
| Health Technologists | 57 (11.8%) | 424 (88.1%) |
| Total (Category) | 1,869 (39.2%) | 2,896 (60.8%) |
| Total (Overall) | 7,376 (53.7%) | 6,362 (46.3%) |
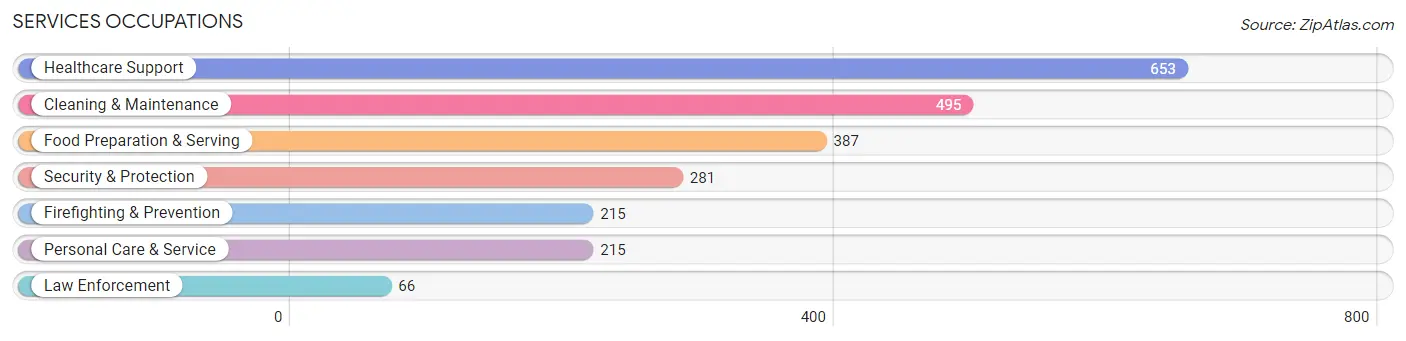
Services Occupations
The most common Services occupations in Lincoln County are Healthcare Support (653 | 4.8%), Cleaning & Maintenance (495 | 3.6%), Food Preparation & Serving (387 | 2.8%), Security & Protection (281 | 2.1%), and Firefighting & Prevention (215 | 1.6%).
Services Occupations by Sex
Within the Services occupations in Lincoln County, the most male-oriented occupations are Law Enforcement (100.0%), Personal Care & Service (69.3%), and Security & Protection (62.6%), while the most female-oriented occupations are Healthcare Support (97.1%), Food Preparation & Serving (72.6%), and Cleaning & Maintenance (69.9%).
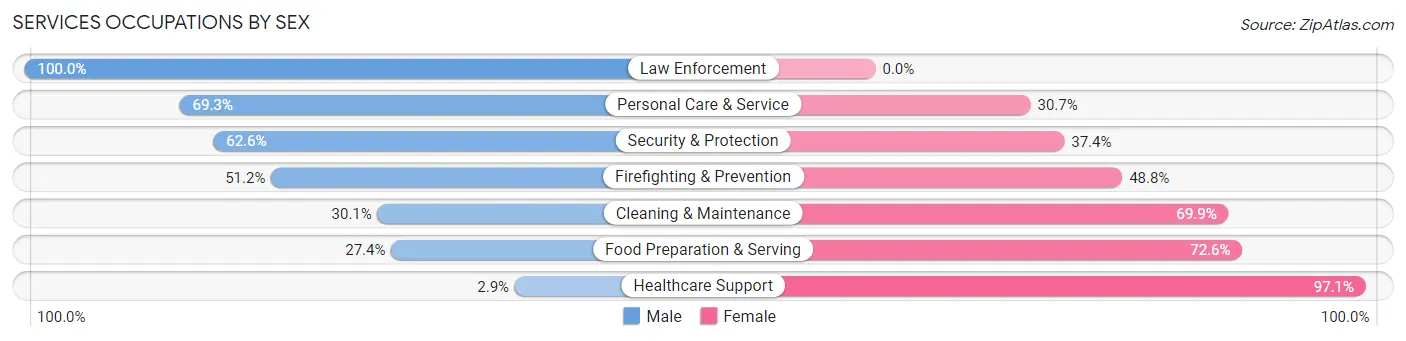
| Occupation | Male | Female |
| Healthcare Support | 19 (2.9%) | 634 (97.1%) |
| Security & Protection | 176 (62.6%) | 105 (37.4%) |
| Firefighting & Prevention | 110 (51.2%) | 105 (48.8%) |
| Law Enforcement | 66 (100.0%) | 0 (0.0%) |
| Food Preparation & Serving | 106 (27.4%) | 281 (72.6%) |
| Cleaning & Maintenance | 149 (30.1%) | 346 (69.9%) |
| Personal Care & Service | 149 (69.3%) | 66 (30.7%) |
| Total (Category) | 599 (29.5%) | 1,432 (70.5%) |
| Total (Overall) | 7,376 (53.7%) | 6,362 (46.3%) |
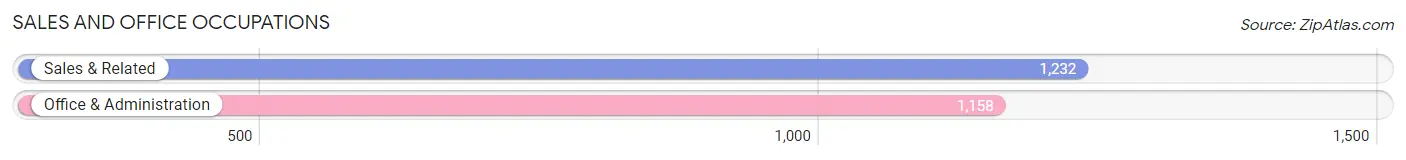
Sales and Office Occupations
The most common Sales and Office occupations in Lincoln County are Sales & Related (1,232 | 9.0%), and Office & Administration (1,158 | 8.4%).
Sales and Office Occupations by Sex
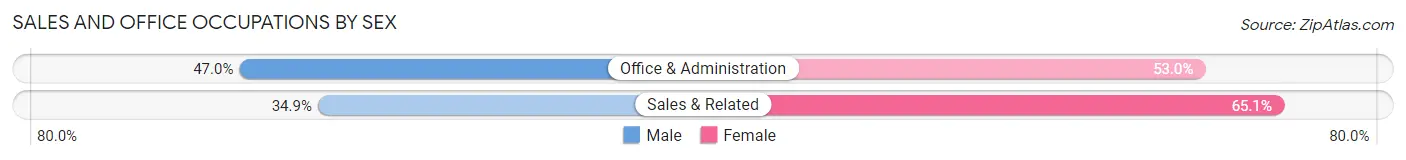
| Occupation | Male | Female |
| Sales & Related | 430 (34.9%) | 802 (65.1%) |
| Office & Administration | 544 (47.0%) | 614 (53.0%) |
| Total (Category) | 974 (40.7%) | 1,416 (59.3%) |
| Total (Overall) | 7,376 (53.7%) | 6,362 (46.3%) |
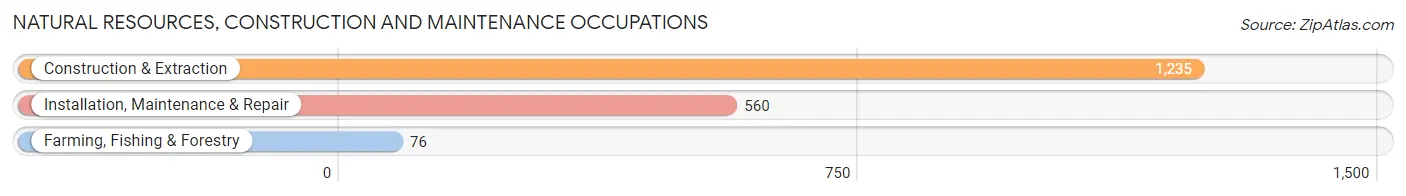
Natural Resources, Construction and Maintenance Occupations
The most common Natural Resources, Construction and Maintenance occupations in Lincoln County are Construction & Extraction (1,235 | 9.0%), Installation, Maintenance & Repair (560 | 4.1%), and Farming, Fishing & Forestry (76 | 0.5%).
Natural Resources, Construction and Maintenance Occupations by Sex
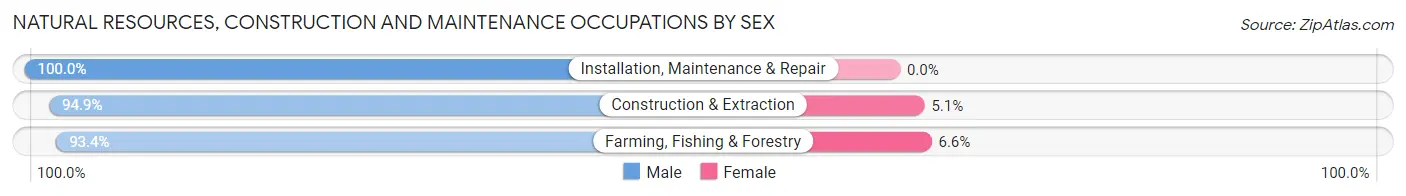
| Occupation | Male | Female |
| Farming, Fishing & Forestry | 71 (93.4%) | 5 (6.6%) |
| Construction & Extraction | 1,172 (94.9%) | 63 (5.1%) |
| Installation, Maintenance & Repair | 560 (100.0%) | 0 (0.0%) |
| Total (Category) | 1,803 (96.4%) | 68 (3.6%) |
| Total (Overall) | 7,376 (53.7%) | 6,362 (46.3%) |
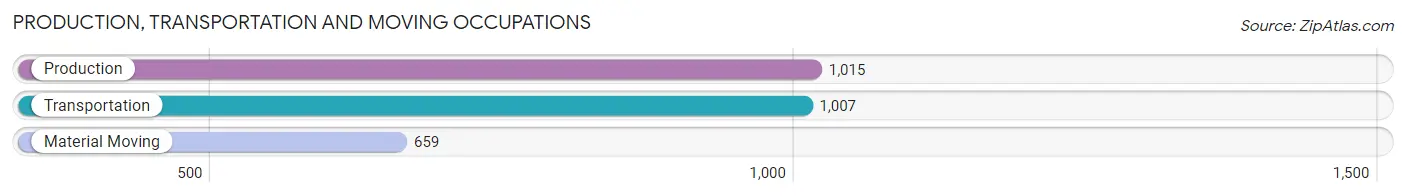
Production, Transportation and Moving Occupations
The most common Production, Transportation and Moving occupations in Lincoln County are Production (1,015 | 7.4%), Transportation (1,007 | 7.3%), and Material Moving (659 | 4.8%).
Production, Transportation and Moving Occupations by Sex
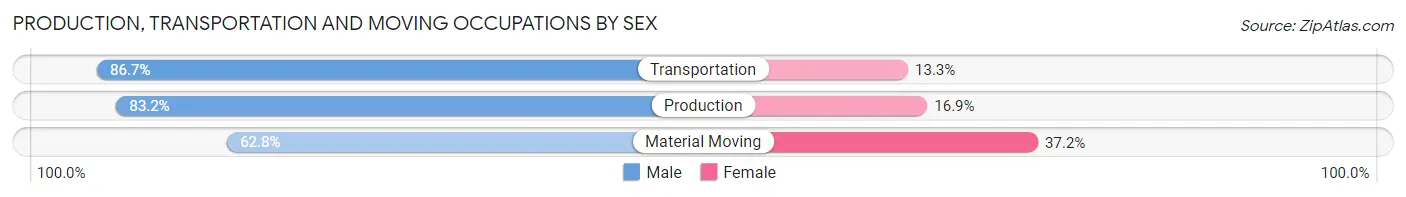
| Occupation | Male | Female |
| Production | 844 (83.2%) | 171 (16.9%) |
| Transportation | 873 (86.7%) | 134 (13.3%) |
| Material Moving | 414 (62.8%) | 245 (37.2%) |
| Total (Category) | 2,131 (79.5%) | 550 (20.5%) |
| Total (Overall) | 7,376 (53.7%) | 6,362 (46.3%) |
Employment Industries by Sex in Lincoln County
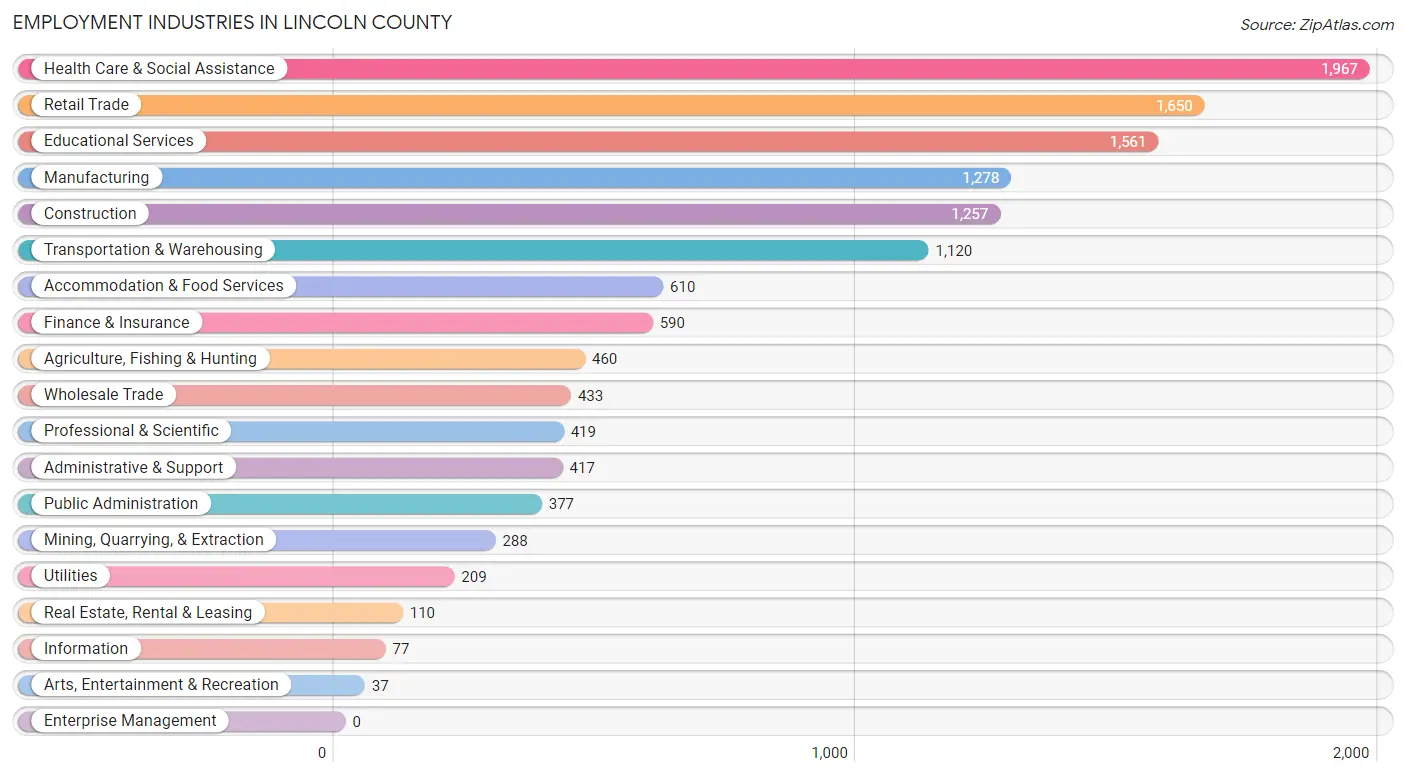
Employment Industries in Lincoln County
The major employment industries in Lincoln County include Health Care & Social Assistance (1,967 | 14.3%), Retail Trade (1,650 | 12.0%), Educational Services (1,561 | 11.4%), Manufacturing (1,278 | 9.3%), and Construction (1,257 | 9.1%).
Employment Industries by Sex in Lincoln County
The Lincoln County industries that see more men than women are Mining, Quarrying, & Extraction (100.0%), Utilities (100.0%), and Agriculture, Fishing & Hunting (95.7%), whereas the industries that tend to have a higher number of women are Health Care & Social Assistance (89.9%), Accommodation & Food Services (80.8%), and Educational Services (67.6%).
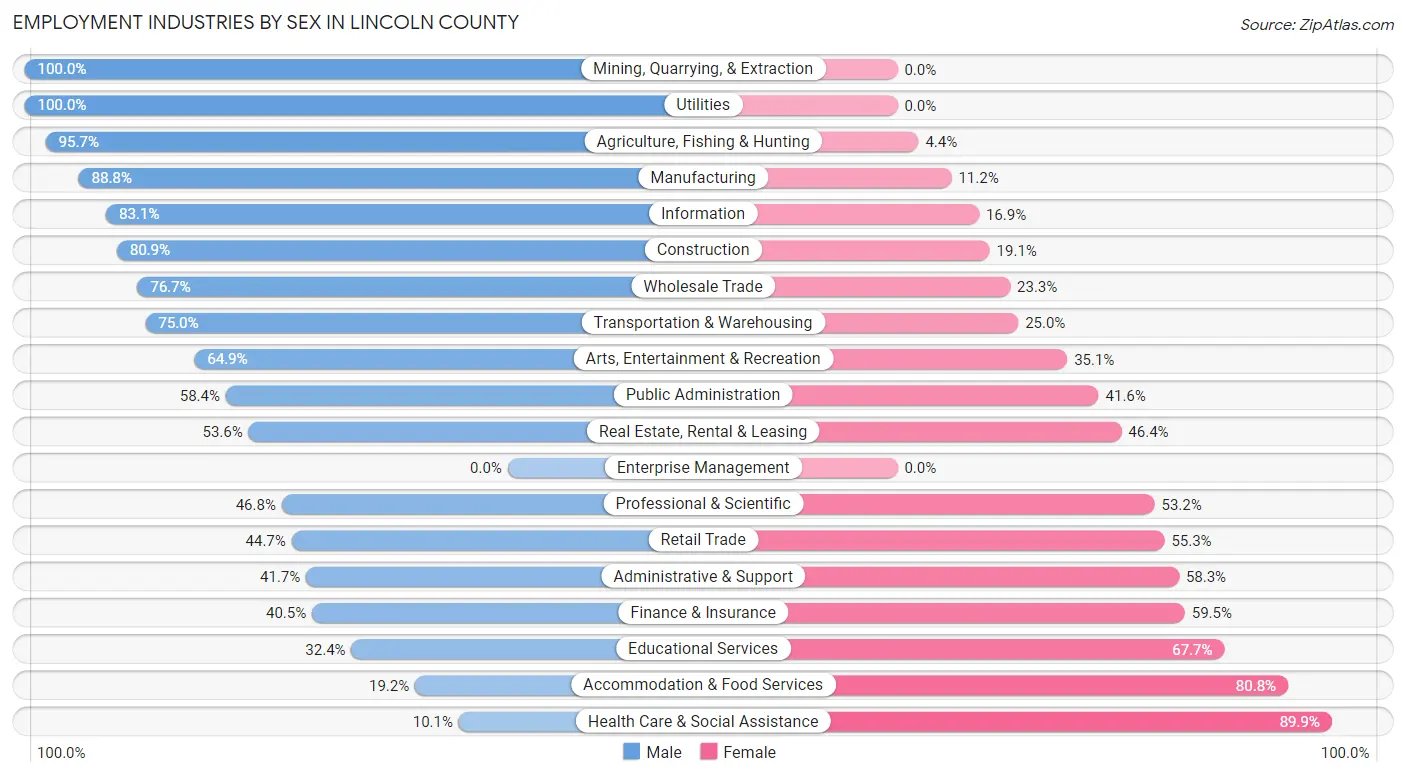
| Industry | Male | Female |
| Agriculture, Fishing & Hunting | 440 (95.7%) | 20 (4.3%) |
| Mining, Quarrying, & Extraction | 288 (100.0%) | 0 (0.0%) |
| Construction | 1,017 (80.9%) | 240 (19.1%) |
| Manufacturing | 1,135 (88.8%) | 143 (11.2%) |
| Wholesale Trade | 332 (76.7%) | 101 (23.3%) |
| Retail Trade | 738 (44.7%) | 912 (55.3%) |
| Transportation & Warehousing | 840 (75.0%) | 280 (25.0%) |
| Utilities | 209 (100.0%) | 0 (0.0%) |
| Information | 64 (83.1%) | 13 (16.9%) |
| Finance & Insurance | 239 (40.5%) | 351 (59.5%) |
| Real Estate, Rental & Leasing | 59 (53.6%) | 51 (46.4%) |
| Professional & Scientific | 196 (46.8%) | 223 (53.2%) |
| Enterprise Management | 0 (0.0%) | 0 (0.0%) |
| Administrative & Support | 174 (41.7%) | 243 (58.3%) |
| Educational Services | 505 (32.4%) | 1,056 (67.6%) |
| Health Care & Social Assistance | 199 (10.1%) | 1,768 (89.9%) |
| Arts, Entertainment & Recreation | 24 (64.9%) | 13 (35.1%) |
| Accommodation & Food Services | 117 (19.2%) | 493 (80.8%) |
| Public Administration | 220 (58.4%) | 157 (41.6%) |
| Total | 7,376 (53.7%) | 6,362 (46.3%) |
Education in Lincoln County
School Enrollment in Lincoln County
The most common levels of schooling among the 7,557 students in Lincoln County are high school (1,992 | 26.4%), elementary school (1,916 | 25.4%), and middle school (1,667 | 22.1%).
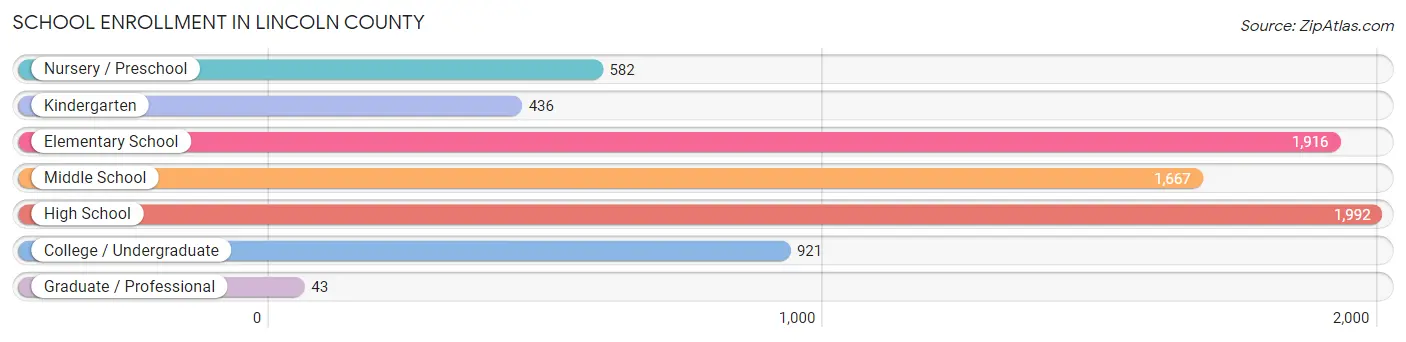
| School Level | # Students | % Students |
| Nursery / Preschool | 582 | 7.7% |
| Kindergarten | 436 | 5.8% |
| Elementary School | 1,916 | 25.4% |
| Middle School | 1,667 | 22.1% |
| High School | 1,992 | 26.4% |
| College / Undergraduate | 921 | 12.2% |
| Graduate / Professional | 43 | 0.6% |
| Total | 7,557 | 100.0% |
School Enrollment by Age by Funding Source in Lincoln County
Out of a total of 7,557 students who are enrolled in schools in Lincoln County, 1,118 (14.8%) attend a private institution, while the remaining 6,439 (85.2%) are enrolled in public schools. The age group of 10 to 14 year olds has the highest likelihood of being enrolled in private schools, with 479 (21.4% in the age bracket) enrolled. Conversely, the age group of 18 to 19 year olds has the lowest likelihood of being enrolled in a private school, with 533 (100.0% in the age bracket) attending a public institution.
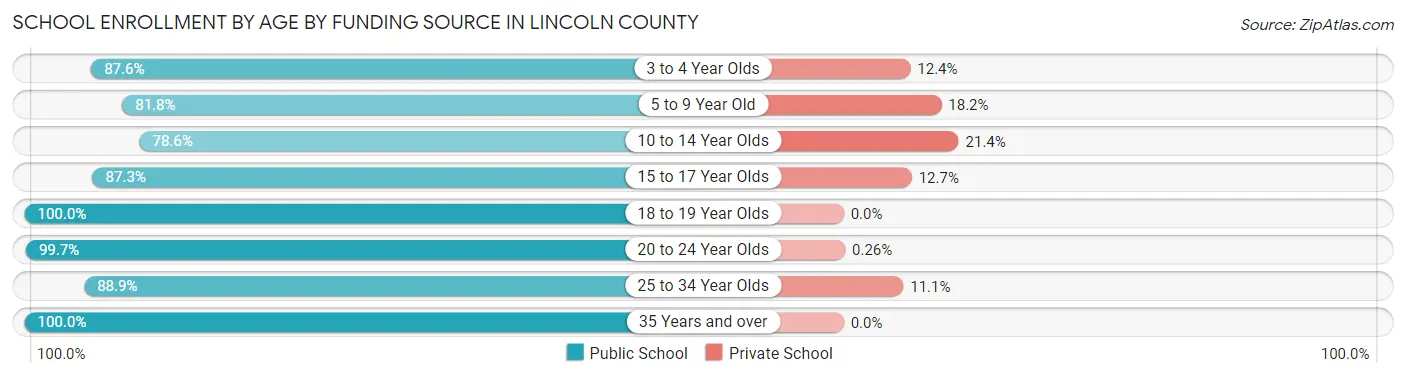
| Age Bracket | Public School | Private School |
| 3 to 4 Year Olds | 388 (87.6%) | 55 (12.4%) |
| 5 to 9 Year Old | 1,712 (81.8%) | 381 (18.2%) |
| 10 to 14 Year Olds | 1,758 (78.6%) | 479 (21.4%) |
| 15 to 17 Year Olds | 1,288 (87.3%) | 187 (12.7%) |
| 18 to 19 Year Olds | 533 (100.0%) | 0 (0.0%) |
| 20 to 24 Year Olds | 389 (99.7%) | 1 (0.3%) |
| 25 to 34 Year Olds | 128 (88.9%) | 16 (11.1%) |
| 35 Years and over | 242 (100.0%) | 0 (0.0%) |
| Total | 6,439 (85.2%) | 1,118 (14.8%) |
Educational Attainment by Field of Study in Lincoln County
Education (1,184 | 23.8%), business (972 | 19.6%), science & technology (593 | 11.9%), bio, nature & agricultural (571 | 11.5%), and arts & humanities (367 | 7.4%) are the most common fields of study among 4,970 individuals in Lincoln County who have obtained a bachelor's degree or higher.
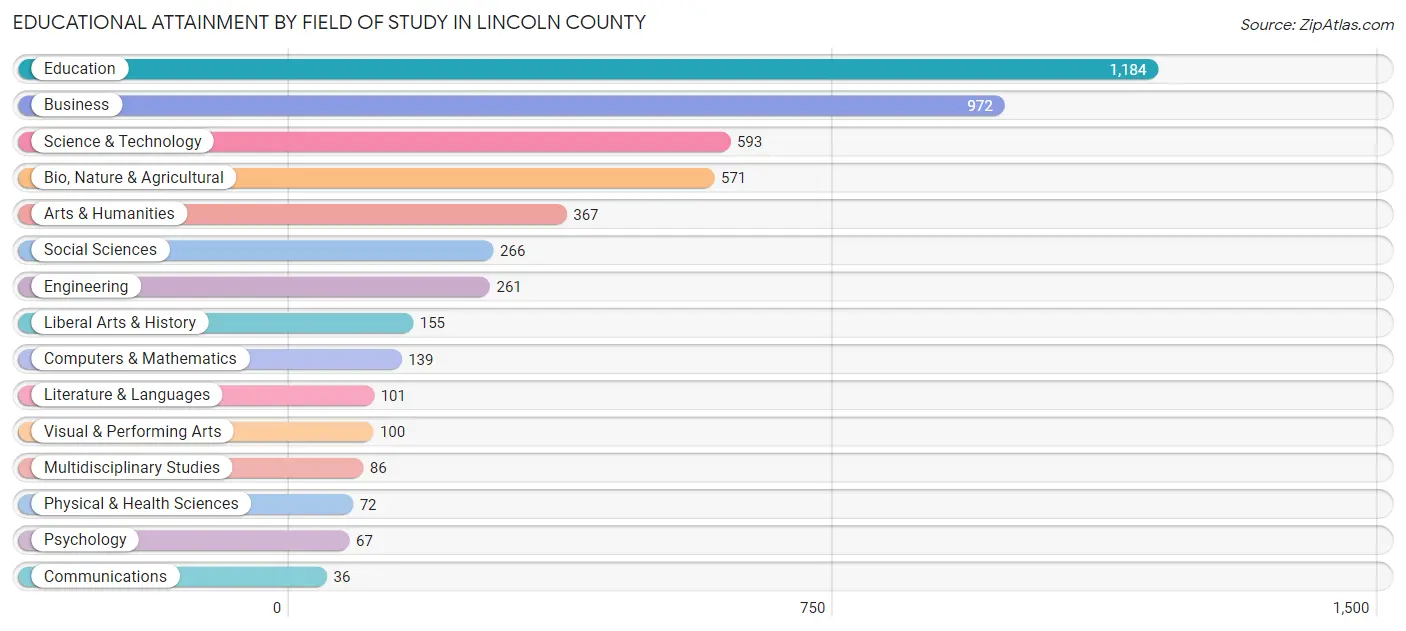
| Field of Study | # Graduates | % Graduates |
| Computers & Mathematics | 139 | 2.8% |
| Bio, Nature & Agricultural | 571 | 11.5% |
| Physical & Health Sciences | 72 | 1.5% |
| Psychology | 67 | 1.3% |
| Social Sciences | 266 | 5.3% |
| Engineering | 261 | 5.2% |
| Multidisciplinary Studies | 86 | 1.7% |
| Science & Technology | 593 | 11.9% |
| Business | 972 | 19.6% |
| Education | 1,184 | 23.8% |
| Literature & Languages | 101 | 2.0% |
| Liberal Arts & History | 155 | 3.1% |
| Visual & Performing Arts | 100 | 2.0% |
| Communications | 36 | 0.7% |
| Arts & Humanities | 367 | 7.4% |
| Total | 4,970 | 100.0% |
Transportation & Commute in Lincoln County
Vehicle Availability by Sex in Lincoln County
The most prevalent vehicle ownership categories in Lincoln County are males with 2 vehicles (3,495, accounting for 48.4%) and females with 2 vehicles (2,735, making up 55.7%).
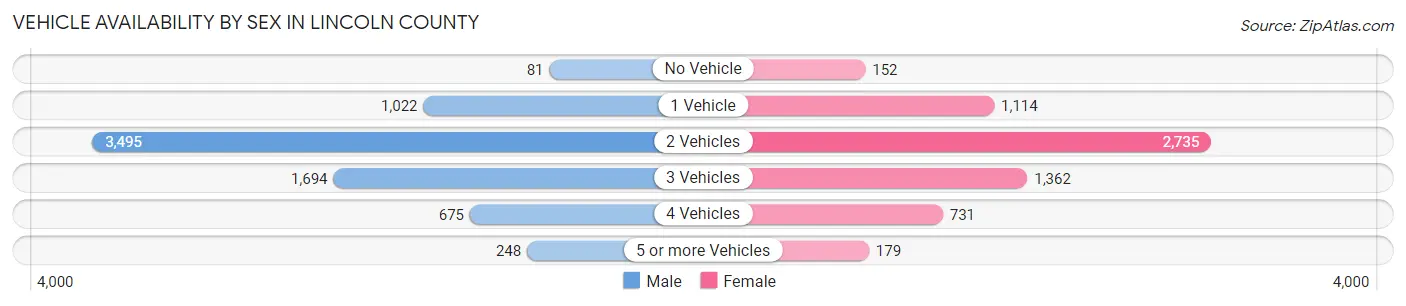
| Vehicles Available | Male | Female |
| No Vehicle | 81 (1.1%) | 152 (2.4%) |
| 1 Vehicle | 1,022 (14.2%) | 1,114 (17.8%) |
| 2 Vehicles | 3,495 (48.4%) | 2,735 (43.6%) |
| 3 Vehicles | 1,694 (23.5%) | 1,362 (21.7%) |
| 4 Vehicles | 675 (9.4%) | 731 (11.7%) |
| 5 or more Vehicles | 248 (3.4%) | 179 (2.9%) |
| Total | 7,215 (100.0%) | 6,273 (100.0%) |
Commute Time in Lincoln County
The most frequently occuring commute durations in Lincoln County are 10 to 14 minutes (2,610 commuters, 19.9%), 5 to 9 minutes (1,950 commuters, 14.9%), and 15 to 19 minutes (1,615 commuters, 12.3%).
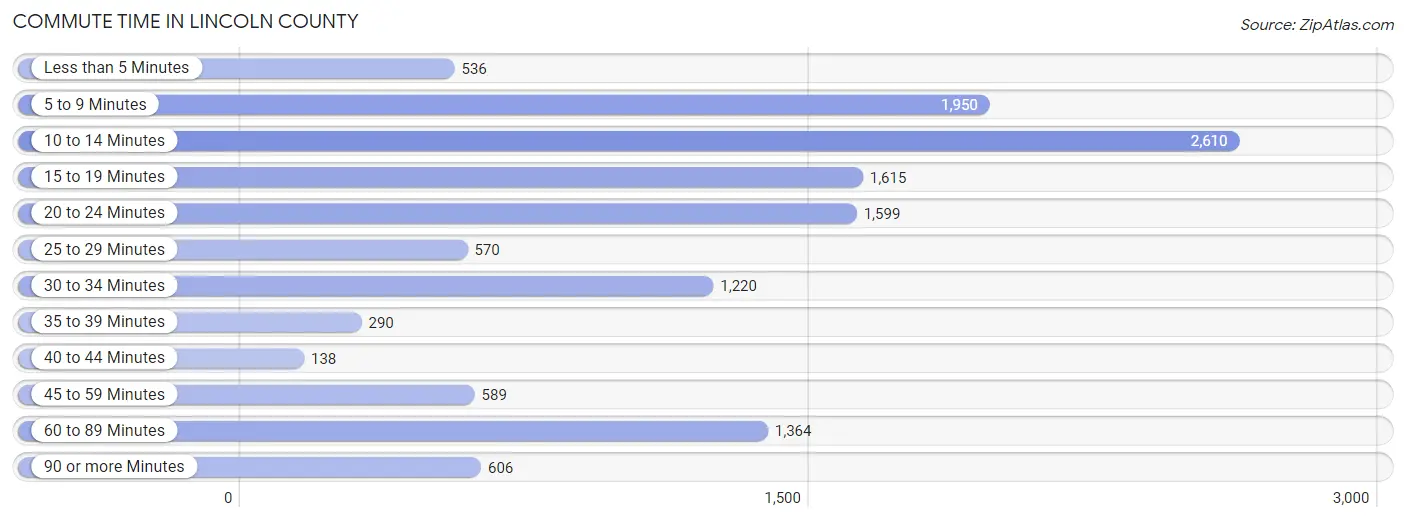
| Commute Time | # Commuters | % Commuters |
| Less than 5 Minutes | 536 | 4.1% |
| 5 to 9 Minutes | 1,950 | 14.9% |
| 10 to 14 Minutes | 2,610 | 19.9% |
| 15 to 19 Minutes | 1,615 | 12.3% |
| 20 to 24 Minutes | 1,599 | 12.2% |
| 25 to 29 Minutes | 570 | 4.4% |
| 30 to 34 Minutes | 1,220 | 9.3% |
| 35 to 39 Minutes | 290 | 2.2% |
| 40 to 44 Minutes | 138 | 1.1% |
| 45 to 59 Minutes | 589 | 4.5% |
| 60 to 89 Minutes | 1,364 | 10.4% |
| 90 or more Minutes | 606 | 4.6% |
Commute Time by Sex in Lincoln County
The most common commute times in Lincoln County are 10 to 14 minutes (1,152 commuters, 16.8%) for males and 10 to 14 minutes (1,458 commuters, 23.5%) for females.
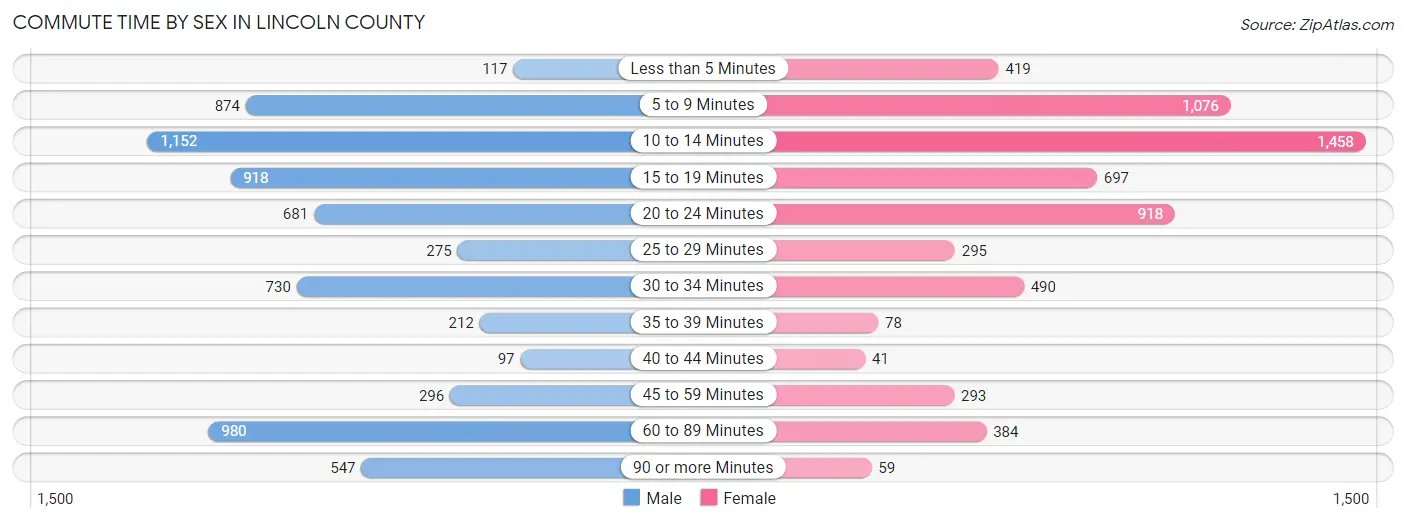
| Commute Time | Male | Female |
| Less than 5 Minutes | 117 (1.7%) | 419 (6.8%) |
| 5 to 9 Minutes | 874 (12.7%) | 1,076 (17.3%) |
| 10 to 14 Minutes | 1,152 (16.8%) | 1,458 (23.5%) |
| 15 to 19 Minutes | 918 (13.3%) | 697 (11.2%) |
| 20 to 24 Minutes | 681 (9.9%) | 918 (14.8%) |
| 25 to 29 Minutes | 275 (4.0%) | 295 (4.8%) |
| 30 to 34 Minutes | 730 (10.6%) | 490 (7.9%) |
| 35 to 39 Minutes | 212 (3.1%) | 78 (1.3%) |
| 40 to 44 Minutes | 97 (1.4%) | 41 (0.7%) |
| 45 to 59 Minutes | 296 (4.3%) | 293 (4.7%) |
| 60 to 89 Minutes | 980 (14.2%) | 384 (6.2%) |
| 90 or more Minutes | 547 (8.0%) | 59 (0.9%) |
Time of Departure to Work by Sex in Lincoln County
The most frequent times of departure to work in Lincoln County are 7:00 AM to 7:29 AM (1,117, 16.2%) for males and 7:00 AM to 7:29 AM (1,175, 18.9%) for females.
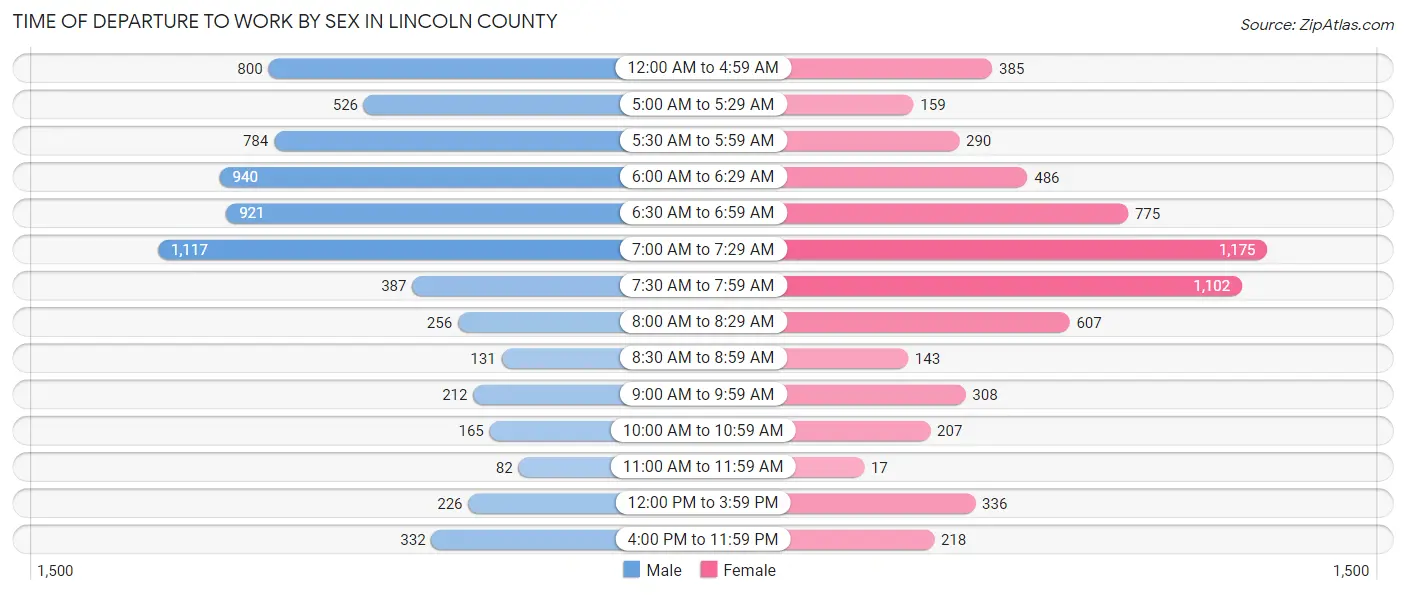
| Time of Departure | Male | Female |
| 12:00 AM to 4:59 AM | 800 (11.6%) | 385 (6.2%) |
| 5:00 AM to 5:29 AM | 526 (7.6%) | 159 (2.6%) |
| 5:30 AM to 5:59 AM | 784 (11.4%) | 290 (4.7%) |
| 6:00 AM to 6:29 AM | 940 (13.7%) | 486 (7.8%) |
| 6:30 AM to 6:59 AM | 921 (13.4%) | 775 (12.5%) |
| 7:00 AM to 7:29 AM | 1,117 (16.2%) | 1,175 (18.9%) |
| 7:30 AM to 7:59 AM | 387 (5.6%) | 1,102 (17.7%) |
| 8:00 AM to 8:29 AM | 256 (3.7%) | 607 (9.8%) |
| 8:30 AM to 8:59 AM | 131 (1.9%) | 143 (2.3%) |
| 9:00 AM to 9:59 AM | 212 (3.1%) | 308 (5.0%) |
| 10:00 AM to 10:59 AM | 165 (2.4%) | 207 (3.3%) |
| 11:00 AM to 11:59 AM | 82 (1.2%) | 17 (0.3%) |
| 12:00 PM to 3:59 PM | 226 (3.3%) | 336 (5.4%) |
| 4:00 PM to 11:59 PM | 332 (4.8%) | 218 (3.5%) |
| Total | 6,879 (100.0%) | 6,208 (100.0%) |
Housing Occupancy in Lincoln County
Occupancy by Ownership in Lincoln County
Of the total 13,070 dwellings in Lincoln County, owner-occupied units account for 9,866 (75.5%), while renter-occupied units make up 3,204 (24.5%).
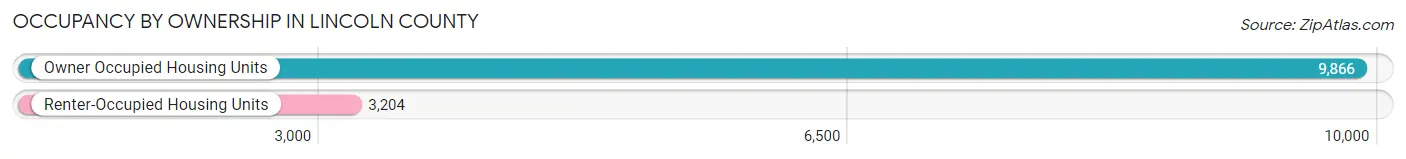
| Occupancy | # Housing Units | % Housing Units |
| Owner Occupied Housing Units | 9,866 | 75.5% |
| Renter-Occupied Housing Units | 3,204 | 24.5% |
| Total Occupied Housing Units | 13,070 | 100.0% |
Occupancy by Household Size in Lincoln County
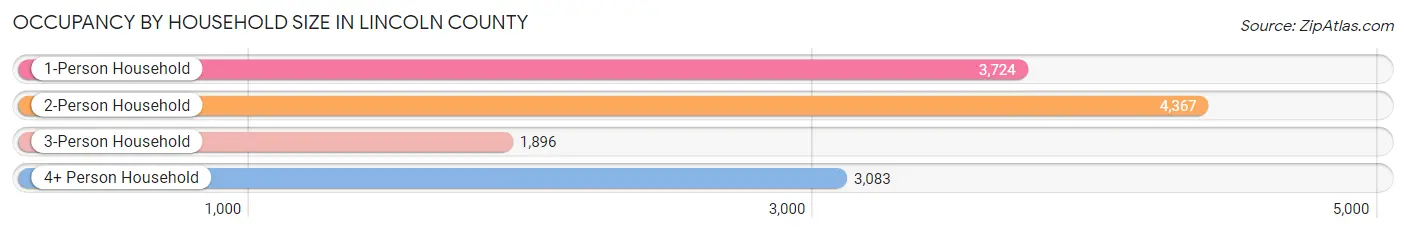
| Household Size | # Housing Units | % Housing Units |
| 1-Person Household | 3,724 | 28.5% |
| 2-Person Household | 4,367 | 33.4% |
| 3-Person Household | 1,896 | 14.5% |
| 4+ Person Household | 3,083 | 23.6% |
| Total Housing Units | 13,070 | 100.0% |
Occupancy by Ownership by Household Size in Lincoln County
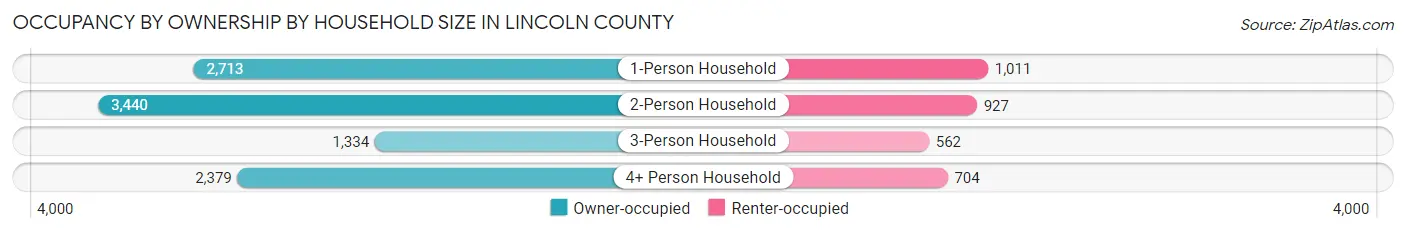
| Household Size | Owner-occupied | Renter-occupied |
| 1-Person Household | 2,713 (72.9%) | 1,011 (27.2%) |
| 2-Person Household | 3,440 (78.8%) | 927 (21.2%) |
| 3-Person Household | 1,334 (70.4%) | 562 (29.6%) |
| 4+ Person Household | 2,379 (77.2%) | 704 (22.8%) |
| Total Housing Units | 9,866 (75.5%) | 3,204 (24.5%) |
Occupancy by Educational Attainment in Lincoln County
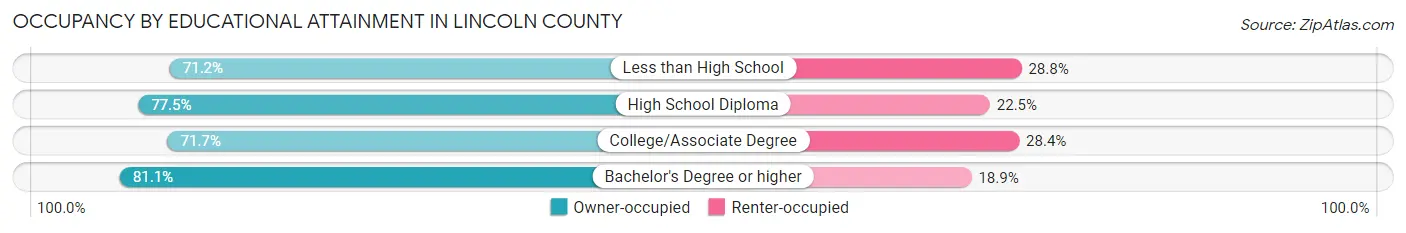
| Household Size | Owner-occupied | Renter-occupied |
| Less than High School | 1,211 (71.2%) | 490 (28.8%) |
| High School Diploma | 3,285 (77.5%) | 956 (22.5%) |
| College/Associate Degree | 3,113 (71.7%) | 1,232 (28.3%) |
| Bachelor's Degree or higher | 2,257 (81.1%) | 526 (18.9%) |
Occupancy by Age of Householder in Lincoln County
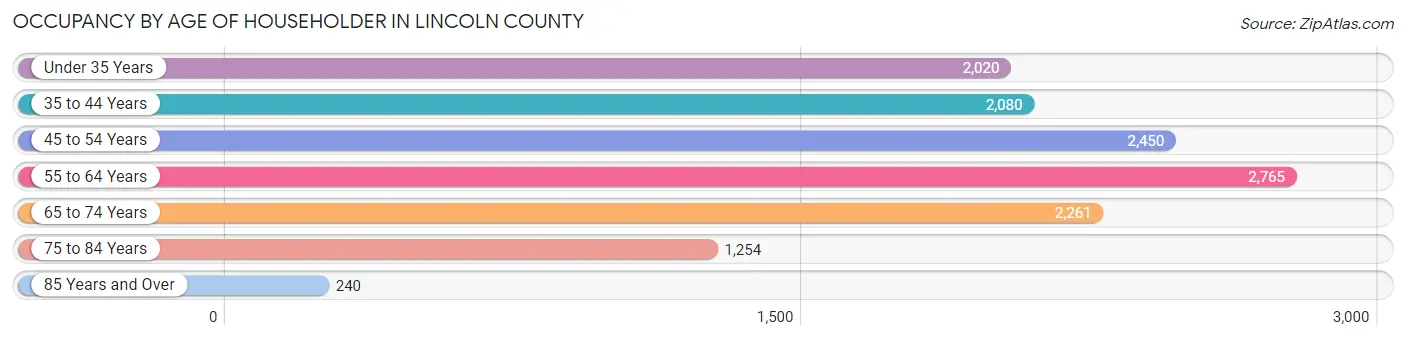
| Age Bracket | # Households | % Households |
| Under 35 Years | 2,020 | 15.5% |
| 35 to 44 Years | 2,080 | 15.9% |
| 45 to 54 Years | 2,450 | 18.8% |
| 55 to 64 Years | 2,765 | 21.2% |
| 65 to 74 Years | 2,261 | 17.3% |
| 75 to 84 Years | 1,254 | 9.6% |
| 85 Years and Over | 240 | 1.8% |
| Total | 13,070 | 100.0% |
Housing Finances in Lincoln County
Median Income by Occupancy in Lincoln County
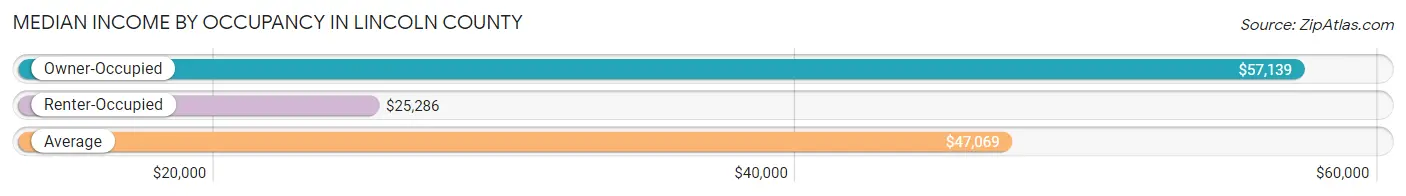
| Occupancy Type | # Households | Median Income |
| Owner-Occupied | 9,866 (75.5%) | $57,139 |
| Renter-Occupied | 3,204 (24.5%) | $25,286 |
| Average | 13,070 (100.0%) | $47,069 |
Occupancy by Householder Income Bracket in Lincoln County
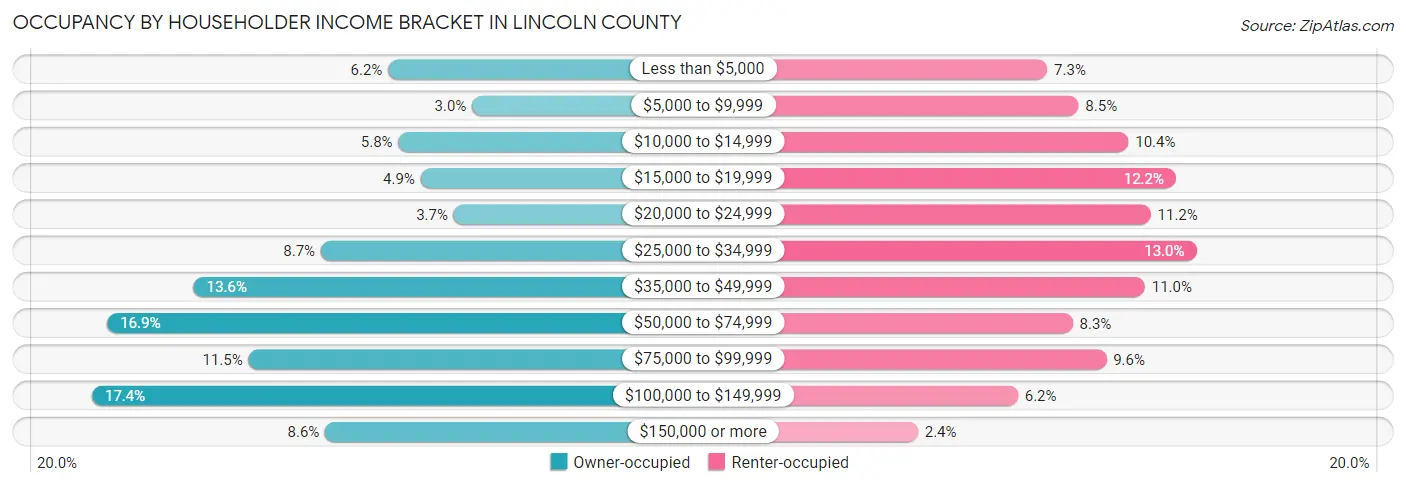
| Income Bracket | Owner-occupied | Renter-occupied |
| Less than $5,000 | 607 (6.1%) | 234 (7.3%) |
| $5,000 to $9,999 | 291 (2.9%) | 272 (8.5%) |
| $10,000 to $14,999 | 568 (5.8%) | 333 (10.4%) |
| $15,000 to $19,999 | 484 (4.9%) | 391 (12.2%) |
| $20,000 to $24,999 | 360 (3.6%) | 360 (11.2%) |
| $25,000 to $34,999 | 859 (8.7%) | 416 (13.0%) |
| $35,000 to $49,999 | 1,338 (13.6%) | 353 (11.0%) |
| $50,000 to $74,999 | 1,662 (16.9%) | 265 (8.3%) |
| $75,000 to $99,999 | 1,132 (11.5%) | 306 (9.6%) |
| $100,000 to $149,999 | 1,721 (17.4%) | 198 (6.2%) |
| $150,000 or more | 844 (8.6%) | 76 (2.4%) |
| Total | 9,866 (100.0%) | 3,204 (100.0%) |
Monthly Housing Cost Tiers in Lincoln County
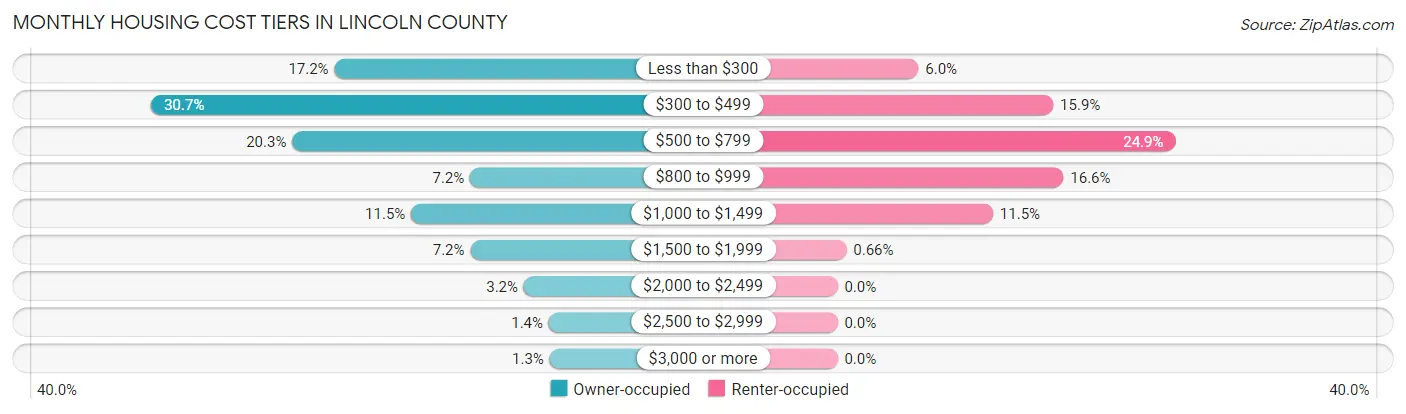
| Monthly Cost | Owner-occupied | Renter-occupied |
| Less than $300 | 1,695 (17.2%) | 191 (6.0%) |
| $300 to $499 | 3,028 (30.7%) | 509 (15.9%) |
| $500 to $799 | 2,002 (20.3%) | 797 (24.9%) |
| $800 to $999 | 709 (7.2%) | 533 (16.6%) |
| $1,000 to $1,499 | 1,138 (11.5%) | 367 (11.5%) |
| $1,500 to $1,999 | 707 (7.2%) | 21 (0.7%) |
| $2,000 to $2,499 | 319 (3.2%) | 0 (0.0%) |
| $2,500 to $2,999 | 137 (1.4%) | 0 (0.0%) |
| $3,000 or more | 131 (1.3%) | 0 (0.0%) |
| Total | 9,866 (100.0%) | 3,204 (100.0%) |
Physical Housing Characteristics in Lincoln County
Housing Structures in Lincoln County
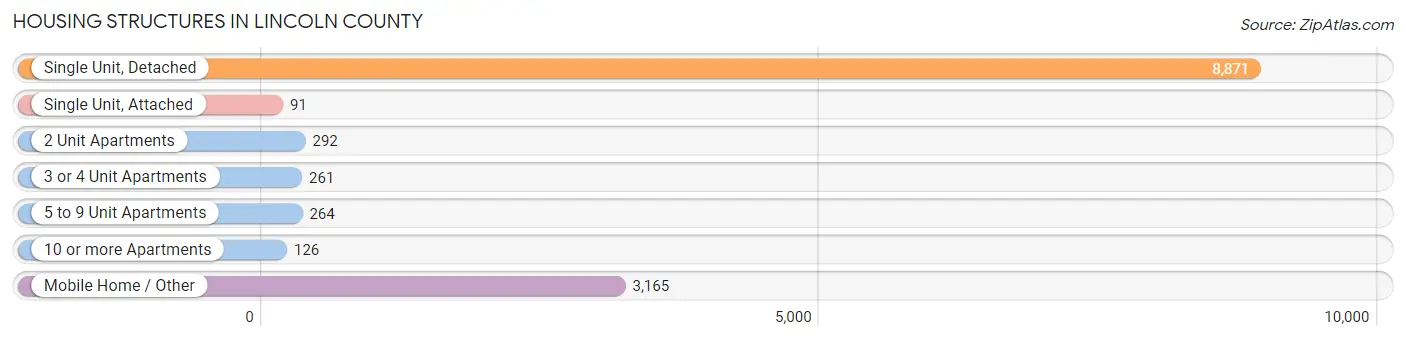
| Structure Type | # Housing Units | % Housing Units |
| Single Unit, Detached | 8,871 | 67.9% |
| Single Unit, Attached | 91 | 0.7% |
| 2 Unit Apartments | 292 | 2.2% |
| 3 or 4 Unit Apartments | 261 | 2.0% |
| 5 to 9 Unit Apartments | 264 | 2.0% |
| 10 or more Apartments | 126 | 1.0% |
| Mobile Home / Other | 3,165 | 24.2% |
| Total | 13,070 | 100.0% |
Housing Structures by Occupancy in Lincoln County
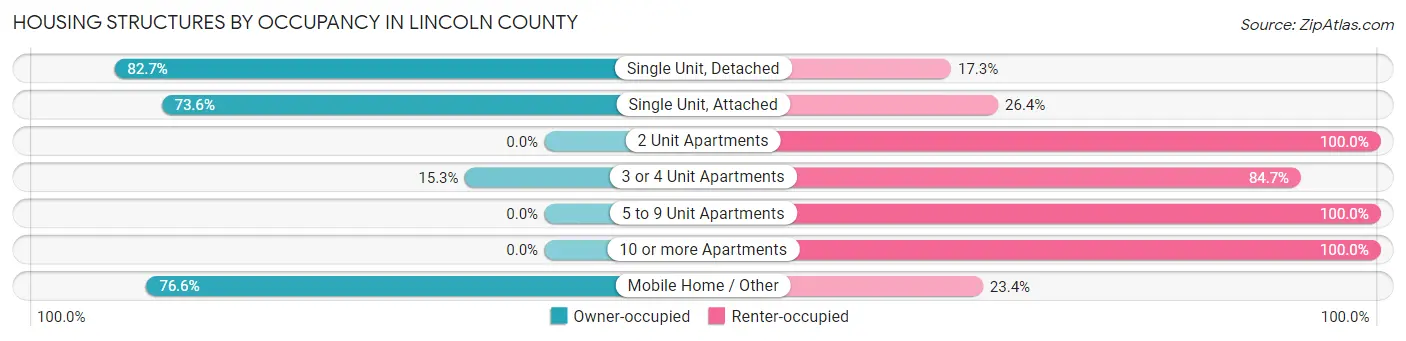
| Structure Type | Owner-occupied | Renter-occupied |
| Single Unit, Detached | 7,336 (82.7%) | 1,535 (17.3%) |
| Single Unit, Attached | 67 (73.6%) | 24 (26.4%) |
| 2 Unit Apartments | 0 (0.0%) | 292 (100.0%) |
| 3 or 4 Unit Apartments | 40 (15.3%) | 221 (84.7%) |
| 5 to 9 Unit Apartments | 0 (0.0%) | 264 (100.0%) |
| 10 or more Apartments | 0 (0.0%) | 126 (100.0%) |
| Mobile Home / Other | 2,423 (76.6%) | 742 (23.4%) |
| Total | 9,866 (75.5%) | 3,204 (24.5%) |
Housing Structures by Number of Rooms in Lincoln County
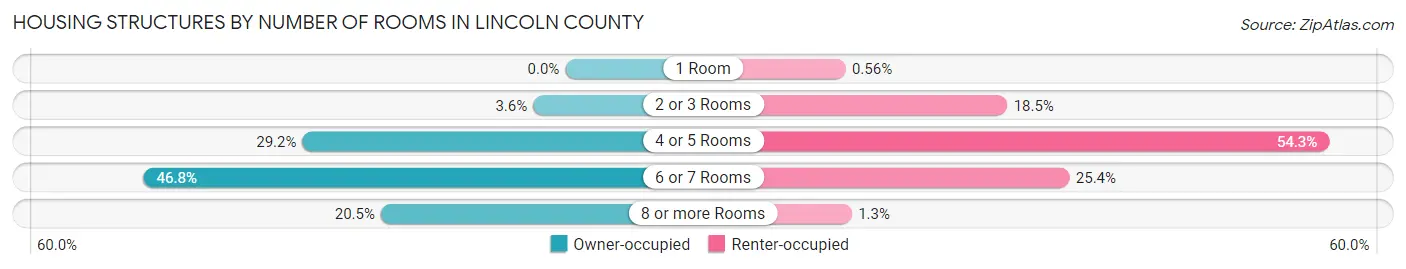
| Number of Rooms | Owner-occupied | Renter-occupied |
| 1 Room | 0 (0.0%) | 18 (0.6%) |
| 2 or 3 Rooms | 352 (3.6%) | 593 (18.5%) |
| 4 or 5 Rooms | 2,879 (29.2%) | 1,739 (54.3%) |
| 6 or 7 Rooms | 4,615 (46.8%) | 814 (25.4%) |
| 8 or more Rooms | 2,020 (20.5%) | 40 (1.3%) |
| Total | 9,866 (100.0%) | 3,204 (100.0%) |
Housing Structure by Heating Type in Lincoln County
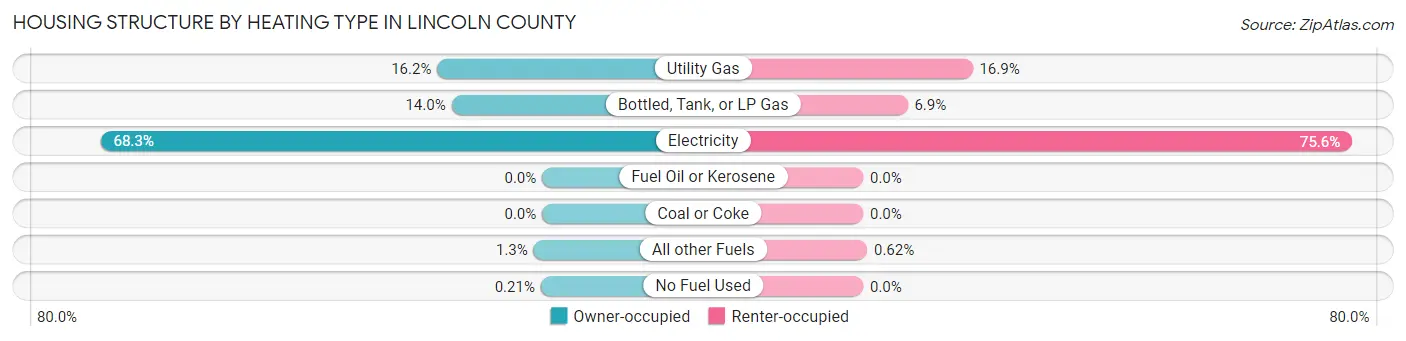
| Heating Type | Owner-occupied | Renter-occupied |
| Utility Gas | 1,599 (16.2%) | 542 (16.9%) |
| Bottled, Tank, or LP Gas | 1,382 (14.0%) | 220 (6.9%) |
| Electricity | 6,735 (68.3%) | 2,422 (75.6%) |
| Fuel Oil or Kerosene | 0 (0.0%) | 0 (0.0%) |
| Coal or Coke | 0 (0.0%) | 0 (0.0%) |
| All other Fuels | 129 (1.3%) | 20 (0.6%) |
| No Fuel Used | 21 (0.2%) | 0 (0.0%) |
| Total | 9,866 (100.0%) | 3,204 (100.0%) |
Household Vehicle Usage in Lincoln County
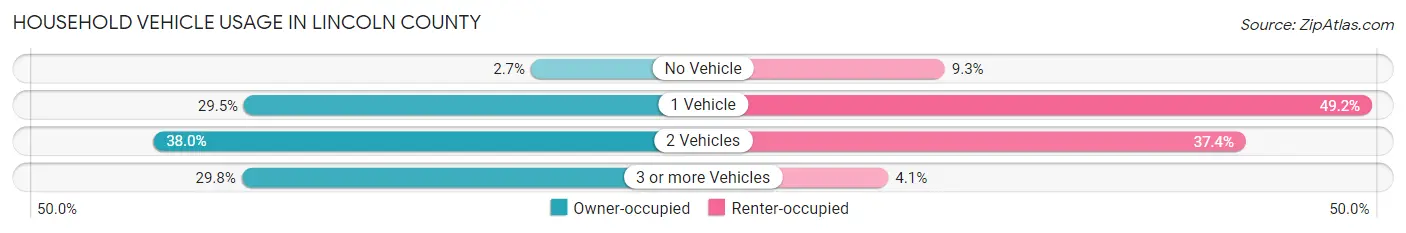
| Vehicles per Household | Owner-occupied | Renter-occupied |
| No Vehicle | 270 (2.7%) | 299 (9.3%) |
| 1 Vehicle | 2,913 (29.5%) | 1,576 (49.2%) |
| 2 Vehicles | 3,748 (38.0%) | 1,199 (37.4%) |
| 3 or more Vehicles | 2,935 (29.7%) | 130 (4.1%) |
| Total | 9,866 (100.0%) | 3,204 (100.0%) |
Real Estate & Mortgages in Lincoln County
Real Estate and Mortgage Overview in Lincoln County
| Characteristic | Without Mortgage | With Mortgage |
| Housing Units | 6,363 | 3,503 |
| Median Property Value | $108,100 | $162,500 |
| Median Household Income | $43,570 | $578 |
| Monthly Housing Costs | $374 | $131 |
| Real Estate Taxes | $686 | $484 |
Property Value by Mortgage Status in Lincoln County
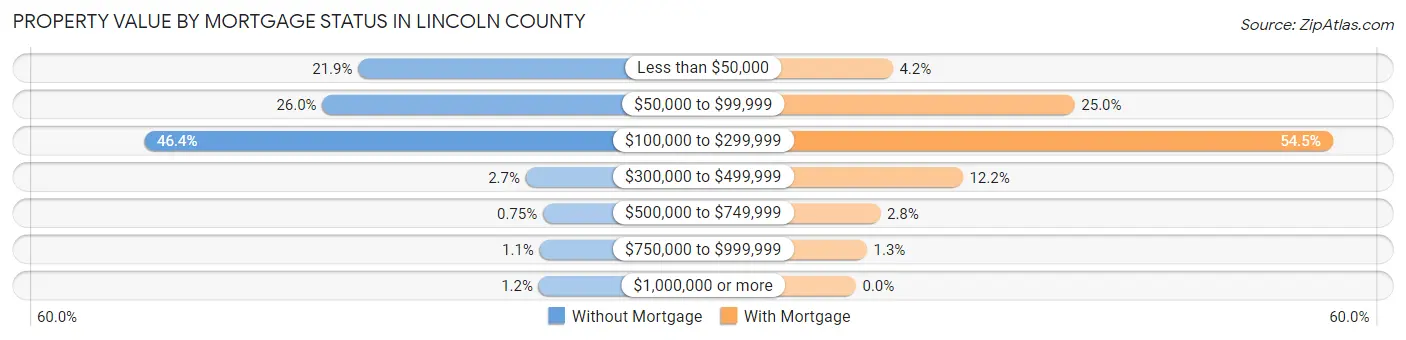
| Property Value | Without Mortgage | With Mortgage |
| Less than $50,000 | 1,391 (21.9%) | 148 (4.2%) |
| $50,000 to $99,999 | 1,652 (26.0%) | 876 (25.0%) |
| $100,000 to $299,999 | 2,949 (46.4%) | 1,909 (54.5%) |
| $300,000 to $499,999 | 173 (2.7%) | 428 (12.2%) |
| $500,000 to $749,999 | 48 (0.7%) | 98 (2.8%) |
| $750,000 to $999,999 | 72 (1.1%) | 44 (1.3%) |
| $1,000,000 or more | 78 (1.2%) | 0 (0.0%) |
| Total | 6,363 (100.0%) | 3,503 (100.0%) |
Household Income by Mortgage Status in Lincoln County
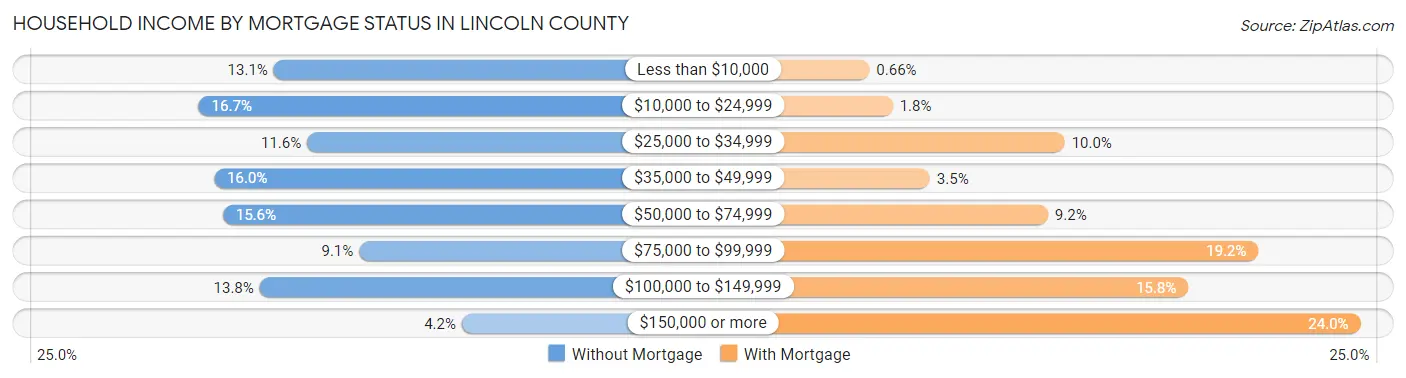
| Household Income | Without Mortgage | With Mortgage |
| Less than $10,000 | 836 (13.1%) | 23 (0.7%) |
| $10,000 to $24,999 | 1,063 (16.7%) | 62 (1.8%) |
| $25,000 to $34,999 | 735 (11.6%) | 349 (10.0%) |
| $35,000 to $49,999 | 1,017 (16.0%) | 124 (3.5%) |
| $50,000 to $74,999 | 990 (15.6%) | 321 (9.2%) |
| $75,000 to $99,999 | 577 (9.1%) | 672 (19.2%) |
| $100,000 to $149,999 | 879 (13.8%) | 555 (15.8%) |
| $150,000 or more | 266 (4.2%) | 842 (24.0%) |
| Total | 6,363 (100.0%) | 3,503 (100.0%) |
Property Value to Household Income Ratio in Lincoln County
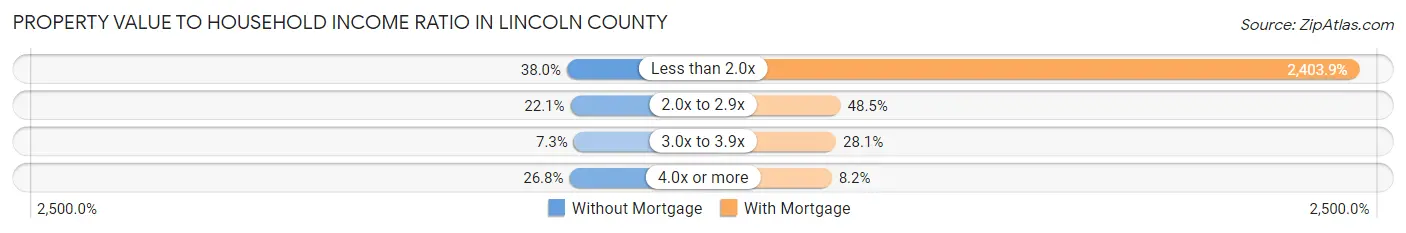
| Value-to-Income Ratio | Without Mortgage | With Mortgage |
| Less than 2.0x | 2,417 (38.0%) | 84,210 (2,403.9%) |
| 2.0x to 2.9x | 1,405 (22.1%) | 1,698 (48.5%) |
| 3.0x to 3.9x | 467 (7.3%) | 983 (28.1%) |
| 4.0x or more | 1,705 (26.8%) | 287 (8.2%) |
| Total | 6,363 (100.0%) | 3,503 (100.0%) |
Real Estate Taxes by Mortgage Status in Lincoln County
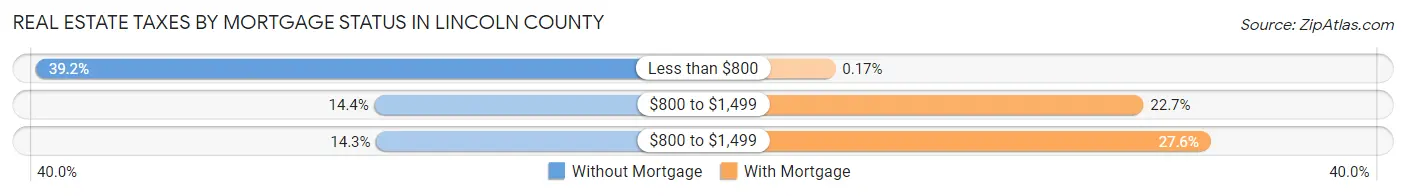
| Property Taxes | Without Mortgage | With Mortgage |
| Less than $800 | 2,493 (39.2%) | 6 (0.2%) |
| $800 to $1,499 | 918 (14.4%) | 794 (22.7%) |
| $800 to $1,499 | 910 (14.3%) | 967 (27.6%) |
| Total | 6,363 (100.0%) | 3,503 (100.0%) |
Health & Disability in Lincoln County
Health Insurance Coverage by Age in Lincoln County
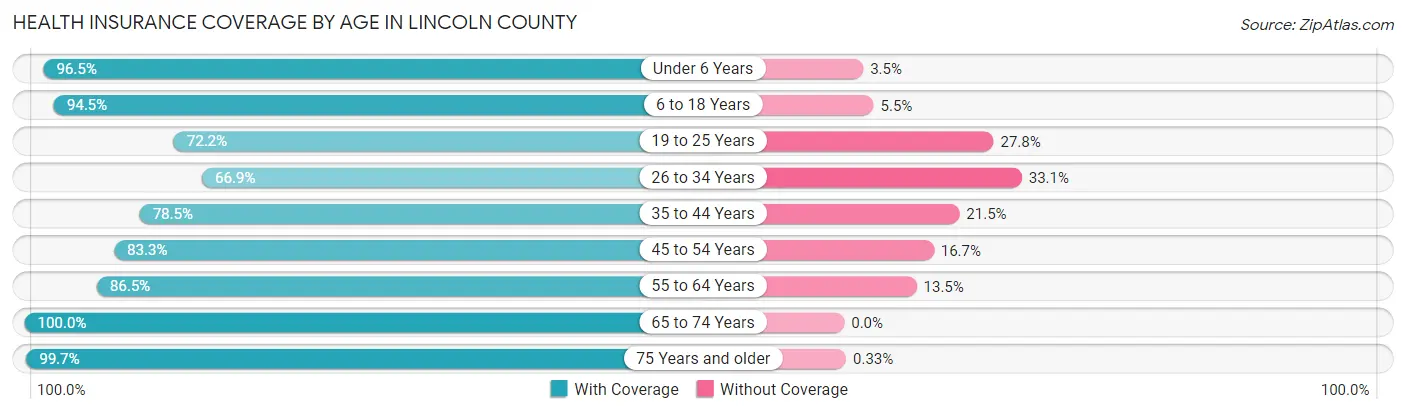
| Age Bracket | With Coverage | Without Coverage |
| Under 6 Years | 2,244 (96.5%) | 82 (3.5%) |
| 6 to 18 Years | 5,796 (94.5%) | 335 (5.5%) |
| 19 to 25 Years | 2,058 (72.2%) | 794 (27.8%) |
| 26 to 34 Years | 2,446 (66.9%) | 1,210 (33.1%) |
| 35 to 44 Years | 3,516 (78.5%) | 961 (21.5%) |
| 45 to 54 Years | 3,753 (83.3%) | 752 (16.7%) |
| 55 to 64 Years | 4,181 (86.5%) | 652 (13.5%) |
| 65 to 74 Years | 3,506 (100.0%) | 0 (0.0%) |
| 75 Years and older | 2,145 (99.7%) | 7 (0.3%) |
| Total | 29,645 (86.1%) | 4,793 (13.9%) |
Health Insurance Coverage by Citizenship Status in Lincoln County
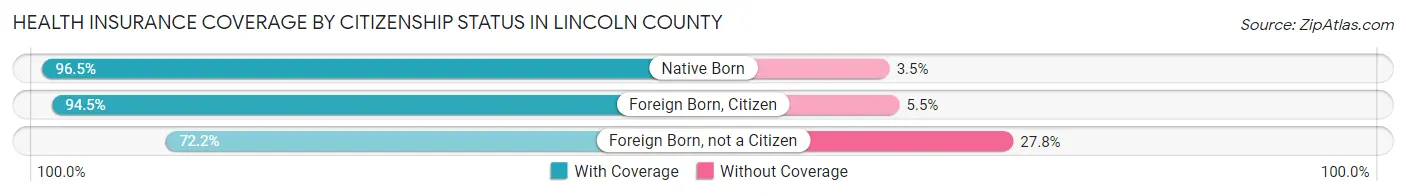
| Citizenship Status | With Coverage | Without Coverage |
| Native Born | 2,244 (96.5%) | 82 (3.5%) |
| Foreign Born, Citizen | 5,796 (94.5%) | 335 (5.5%) |
| Foreign Born, not a Citizen | 2,058 (72.2%) | 794 (27.8%) |
Health Insurance Coverage by Household Income in Lincoln County
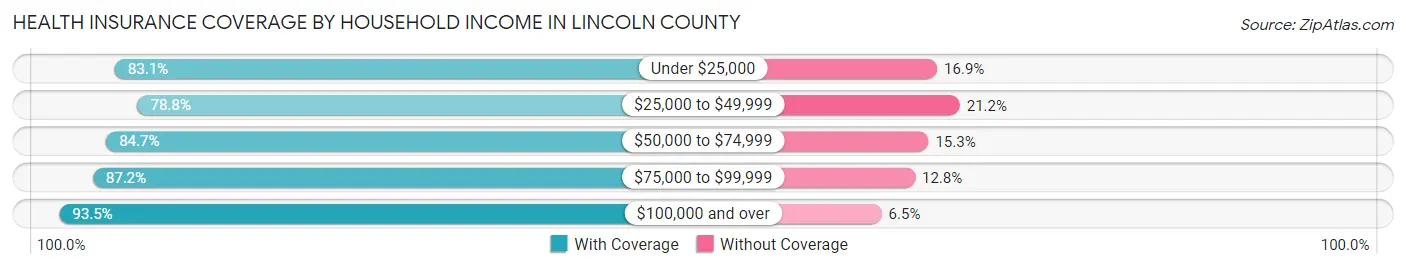
| Household Income | With Coverage | Without Coverage |
| Under $25,000 | 5,903 (83.1%) | 1,203 (16.9%) |
| $25,000 to $49,999 | 5,717 (78.8%) | 1,535 (21.2%) |
| $50,000 to $74,999 | 4,145 (84.7%) | 749 (15.3%) |
| $75,000 to $99,999 | 4,433 (87.2%) | 650 (12.8%) |
| $100,000 and over | 9,272 (93.5%) | 648 (6.5%) |
Public vs Private Health Insurance Coverage by Age in Lincoln County
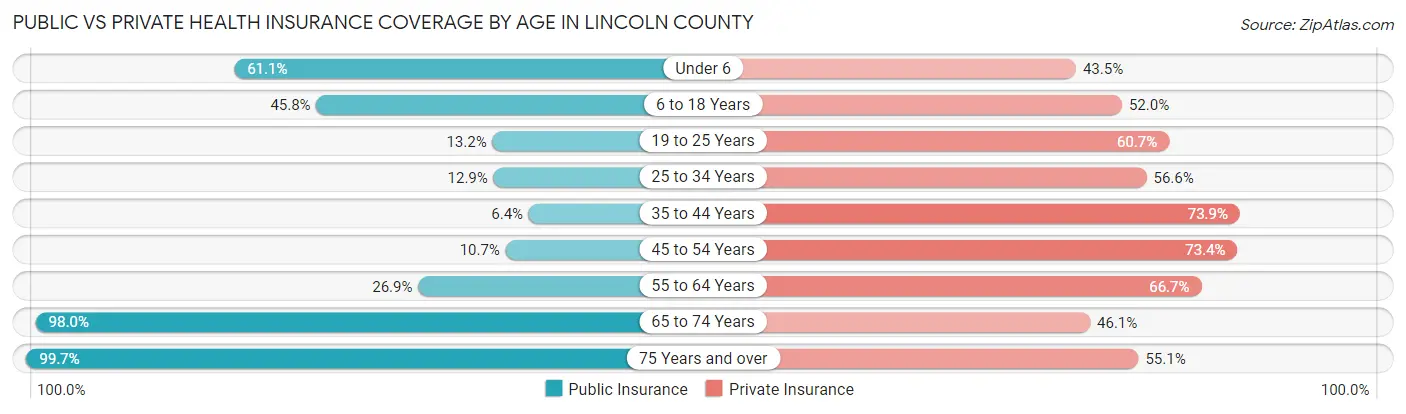
| Age Bracket | Public Insurance | Private Insurance |
| Under 6 | 1,421 (61.1%) | 1,011 (43.5%) |
| 6 to 18 Years | 2,810 (45.8%) | 3,189 (52.0%) |
| 19 to 25 Years | 375 (13.2%) | 1,732 (60.7%) |
| 25 to 34 Years | 473 (12.9%) | 2,068 (56.6%) |
| 35 to 44 Years | 286 (6.4%) | 3,307 (73.9%) |
| 45 to 54 Years | 482 (10.7%) | 3,308 (73.4%) |
| 55 to 64 Years | 1,301 (26.9%) | 3,225 (66.7%) |
| 65 to 74 Years | 3,434 (98.0%) | 1,616 (46.1%) |
| 75 Years and over | 2,145 (99.7%) | 1,185 (55.1%) |
| Total | 12,727 (37.0%) | 20,641 (59.9%) |
Disability Status by Sex by Age in Lincoln County
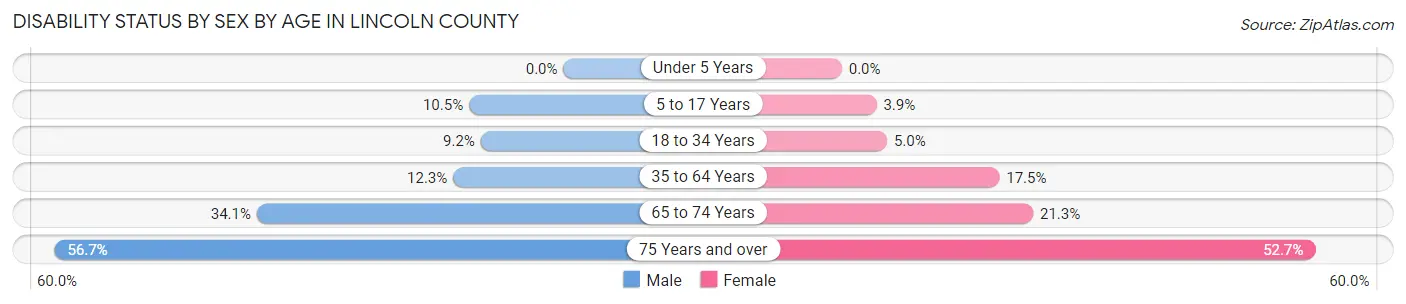
| Age Bracket | Male | Female |
| Under 5 Years | 0 (0.0%) | 0 (0.0%) |
| 5 to 17 Years | 322 (10.5%) | 114 (3.9%) |
| 18 to 34 Years | 310 (9.2%) | 180 (5.0%) |
| 35 to 64 Years | 805 (12.3%) | 1,273 (17.5%) |
| 65 to 74 Years | 551 (34.1%) | 403 (21.3%) |
| 75 Years and over | 480 (56.7%) | 688 (52.7%) |
Disability Class by Sex by Age in Lincoln County
Disability Class: Hearing Difficulty
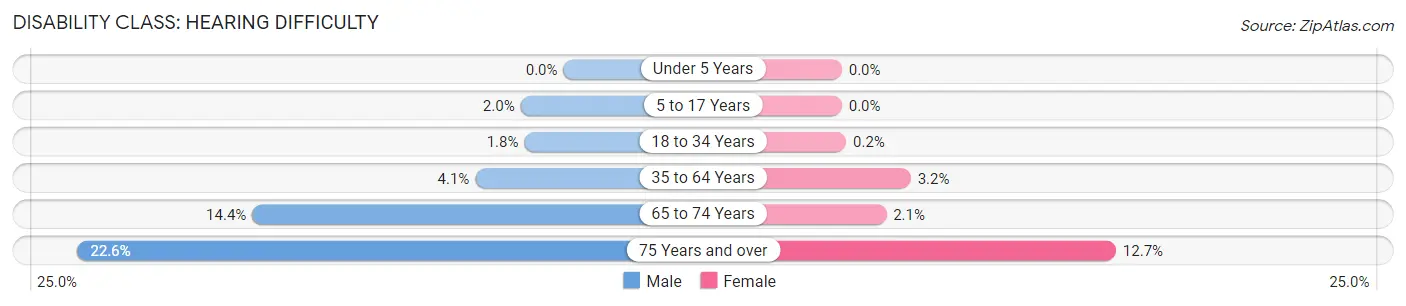
| Age Bracket | Male | Female |
| Under 5 Years | 0 (0.0%) | 0 (0.0%) |
| 5 to 17 Years | 61 (2.0%) | 0 (0.0%) |
| 18 to 34 Years | 61 (1.8%) | 7 (0.2%) |
| 35 to 64 Years | 268 (4.1%) | 232 (3.2%) |
| 65 to 74 Years | 233 (14.4%) | 39 (2.1%) |
| 75 Years and over | 191 (22.6%) | 166 (12.7%) |
Disability Class: Vision Difficulty
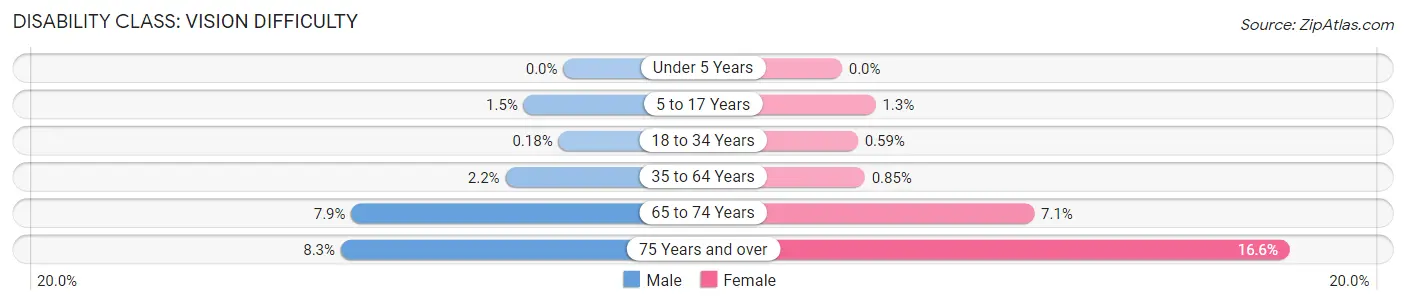
| Age Bracket | Male | Female |
| Under 5 Years | 0 (0.0%) | 0 (0.0%) |
| 5 to 17 Years | 45 (1.5%) | 37 (1.3%) |
| 18 to 34 Years | 6 (0.2%) | 21 (0.6%) |
| 35 to 64 Years | 141 (2.1%) | 62 (0.9%) |
| 65 to 74 Years | 127 (7.9%) | 135 (7.1%) |
| 75 Years and over | 70 (8.3%) | 217 (16.6%) |
Disability Class: Cognitive Difficulty
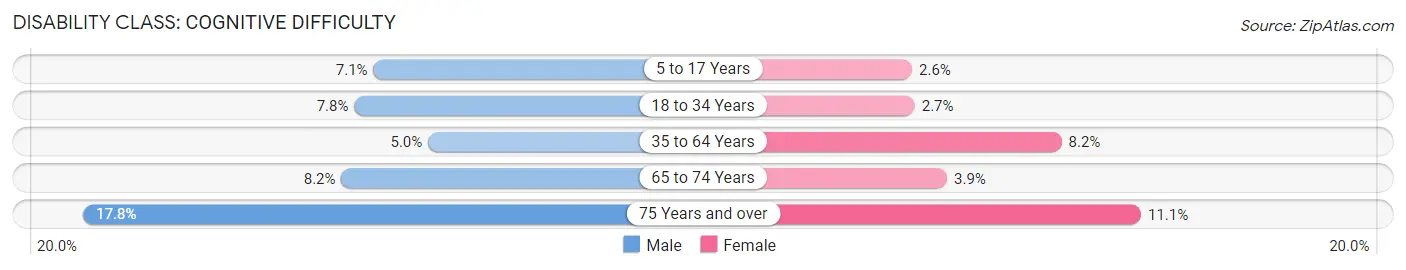
| Age Bracket | Male | Female |
| 5 to 17 Years | 216 (7.0%) | 77 (2.6%) |
| 18 to 34 Years | 261 (7.8%) | 97 (2.7%) |
| 35 to 64 Years | 329 (5.0%) | 592 (8.2%) |
| 65 to 74 Years | 133 (8.2%) | 74 (3.9%) |
| 75 Years and over | 151 (17.8%) | 145 (11.1%) |
Disability Class: Ambulatory Difficulty
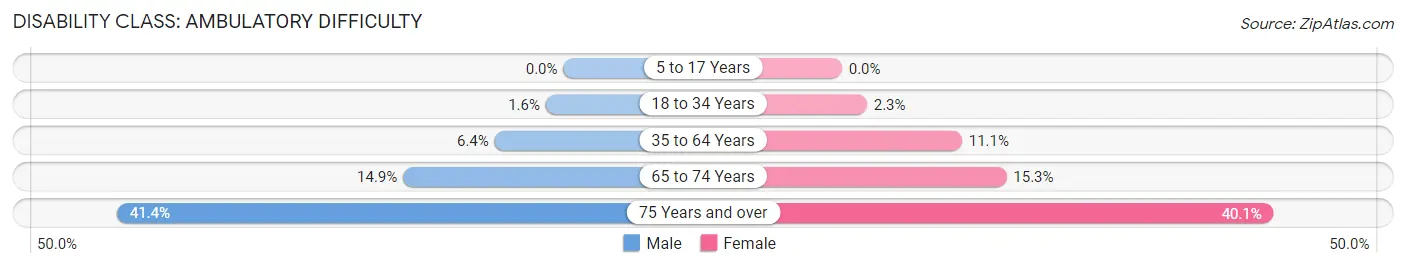
| Age Bracket | Male | Female |
| 5 to 17 Years | 0 (0.0%) | 0 (0.0%) |
| 18 to 34 Years | 55 (1.6%) | 83 (2.3%) |
| 35 to 64 Years | 418 (6.4%) | 809 (11.1%) |
| 65 to 74 Years | 240 (14.9%) | 289 (15.3%) |
| 75 Years and over | 351 (41.4%) | 523 (40.1%) |
Disability Class: Self-Care Difficulty
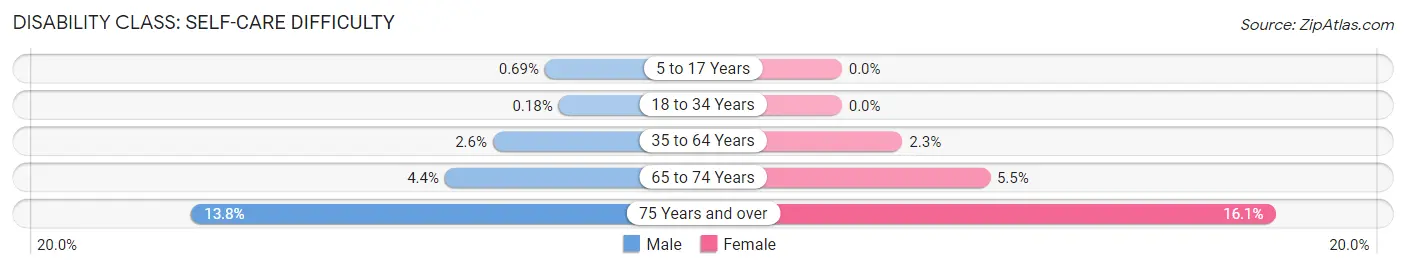
| Age Bracket | Male | Female |
| 5 to 17 Years | 21 (0.7%) | 0 (0.0%) |
| 18 to 34 Years | 6 (0.2%) | 0 (0.0%) |
| 35 to 64 Years | 172 (2.6%) | 163 (2.2%) |
| 65 to 74 Years | 71 (4.4%) | 104 (5.5%) |
| 75 Years and over | 117 (13.8%) | 210 (16.1%) |
Technology Access in Lincoln County
Computing Device Access in Lincoln County
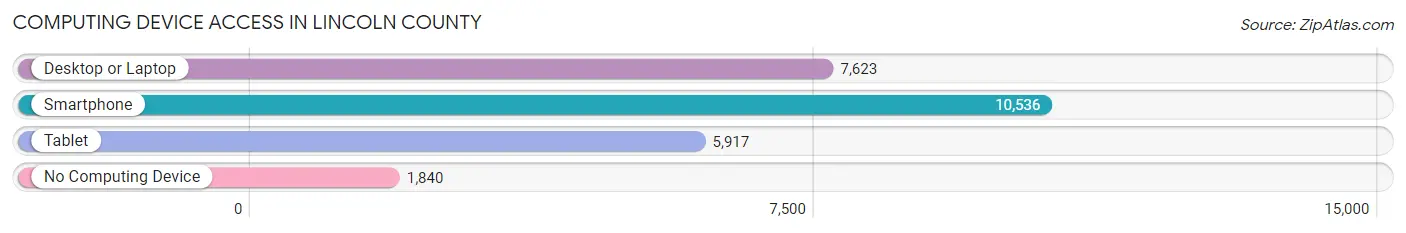
| Device Type | # Households | % Households |
| Desktop or Laptop | 7,623 | 58.3% |
| Smartphone | 10,536 | 80.6% |
| Tablet | 5,917 | 45.3% |
| No Computing Device | 1,840 | 14.1% |
| Total | 13,070 | 100.0% |
Internet Access in Lincoln County
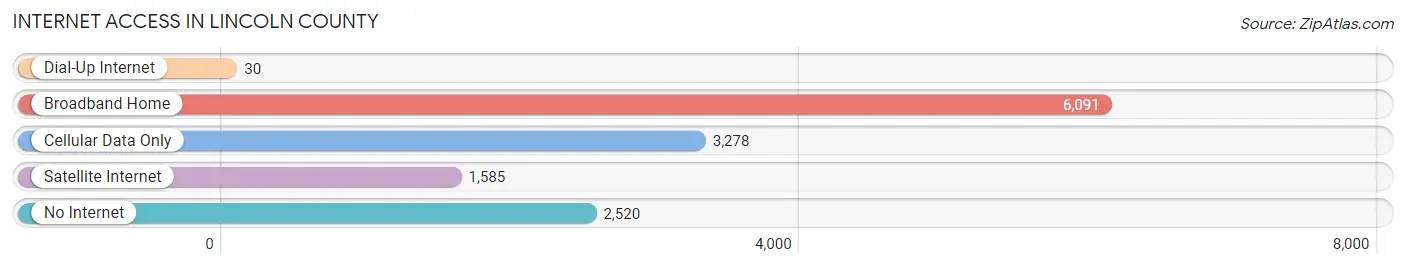
| Internet Type | # Households | % Households |
| Dial-Up Internet | 30 | 0.2% |
| Broadband Home | 6,091 | 46.6% |
| Cellular Data Only | 3,278 | 25.1% |
| Satellite Internet | 1,585 | 12.1% |
| No Internet | 2,520 | 19.3% |
| Total | 13,070 | 100.0% |
Lincoln County Summary
Lincoln County is located in the southeastern corner of Mississippi, and is bordered by Lawrence County to the north, Franklin County to the east, Pike County to the south, and Copiah County to the west. The county seat is Brookhaven, and the county is named for President Abraham Lincoln.
Geography
Lincoln County covers an area of 576 square miles, and is mostly rural. The terrain is mostly flat, with some rolling hills in the northern part of the county. The county is drained by the Bogue Chitto River, which flows through the center of the county. The county is also home to several small lakes, including Lake Lincoln, Lake Mary Crawford, and Lake Lincoln State Park.
The climate of Lincoln County is humid subtropical, with hot, humid summers and mild winters. The average annual temperature is around 70 degrees Fahrenheit, and the average annual precipitation is around 50 inches.
Demographics
As of the 2010 census, Lincoln County had a population of 34,869. The population was spread out, with 24.3% under the age of 18, 8.2% from 18 to 24, 25.2% from 25 to 44, 25.2% from 45 to 64, and 17.1% who were 65 years of age or older. The median age was 38.4 years.
The racial makeup of the county was 79.2% White, 18.3% African American, 0.3% Native American, 0.3% Asian, 0.1% Pacific Islander, 0.7% from other races, and 1.3% from two or more races. Hispanic or Latino of any race were 2.2% of the population.
Economy
Lincoln County has a diverse economy, with a mix of agriculture, manufacturing, and services. The county is home to several large employers, including the Lincoln County School District, the Brookhaven-Lincoln County Hospital, and the Lincoln County Sheriff's Office.
Agriculture is a major part of the economy, with the county producing a variety of crops, including corn, soybeans, cotton, and wheat. The county is also home to several large poultry farms, and is a major producer of eggs and poultry products.
Manufacturing is also an important part of the economy, with several large factories located in the county. The largest employer in the county is the Lincoln County Industrial Park, which is home to several large companies, including a paper mill, a furniture manufacturer, and a plastics manufacturer.
The county also has a thriving service sector, with several large retail stores, restaurants, and hotels located in the county. The county is also home to several large medical facilities, including the Brookhaven-Lincoln County Hospital and the Lincoln County Medical Center.
Conclusion
Lincoln County is a rural county located in the southeastern corner of Mississippi. The county has a diverse economy, with a mix of agriculture, manufacturing, and services. The county is home to several large employers, and is a major producer of eggs and poultry products. The county also has a thriving service sector, with several large retail stores, restaurants, and hotels located in the county.
Common Questions
What is Per Capita Income in Lincoln County?
Per Capita income in Lincoln County is $25,775.
What is the Median Family Income in Lincoln County?
Median Family Income in Lincoln County is $64,450.
What is the Median Household income in Lincoln County?
Median Household Income in Lincoln County is $47,069.
What is Income or Wage Gap in Lincoln County?
Income or Wage Gap in Lincoln County is 39.9%.
Women in Lincoln County earn 60.1 cents for every dollar earned by a man.
What is Family Income Deficit in Lincoln County?
Family Income Deficit in Lincoln County is $9,869.
Families that are below poverty line in Lincoln County earn $9,869 less on average than the poverty threshold level.
What is Inequality or Gini Index in Lincoln County?
Inequality or Gini Index in Lincoln County is 0.48.
What is the Total Population of Lincoln County?
Total Population of Lincoln County is 34,855.
What is the Total Male Population of Lincoln County?
Total Male Population of Lincoln County is 16,669.
What is the Total Female Population of Lincoln County?
Total Female Population of Lincoln County is 18,186.
What is the Ratio of Males per 100 Females in Lincoln County?
There are 91.66 Males per 100 Females in Lincoln County.
What is the Ratio of Females per 100 Males in Lincoln County?
There are 109.10 Females per 100 Males in Lincoln County.
What is the Median Population Age in Lincoln County?
Median Population Age in Lincoln County is 40.7 Years.
What is the Average Family Size in Lincoln County
Average Family Size in Lincoln County is 3.2 People.
What is the Average Household Size in Lincoln County
Average Household Size in Lincoln County is 2.6 People.
How Large is the Labor Force in Lincoln County?
There are 14,361 People in the Labor Forcein in Lincoln County.
What is the Percentage of People in the Labor Force in Lincoln County?
51.5% of People are in the Labor Force in Lincoln County.
What is the Unemployment Rate in Lincoln County?
Unemployment Rate in Lincoln County is 4.3%.