Lauderdale County, MS Map & Demographics
Lauderdale County Overview
$26,590
PER CAPITA INCOME
$59,610
AVG FAMILY INCOME
$45,649
AVG HOUSEHOLD INCOME
31.3%
WAGE / INCOME GAP [ % ]
68.7¢/ $1
WAGE / INCOME GAP [ $ ]
$10,418
FAMILY INCOME DEFICIT
0.51
INEQUALITY / GINI INDEX
72,741
TOTAL POPULATION
35,314
MALE POPULATION
37,427
FEMALE POPULATION
94.35
MALES / 100 FEMALES
105.98
FEMALES / 100 MALES
38.5
MEDIAN AGE
3.1
AVG FAMILY SIZE
2.5
AVG HOUSEHOLD SIZE
31,697
LABOR FORCE [ PEOPLE ]
55.1%
PERCENT IN LABOR FORCE
5.5%
UNEMPLOYMENT RATE
Income in Lauderdale County
Income Overview in Lauderdale County
Per Capita Income in Lauderdale County is $26,590, while median incomes of families and households are $59,610 and $45,649 respectively.
| Characteristic | Number | Measure |
| Per Capita Income | 72,741 | $26,590 |
| Median Family Income | 18,397 | $59,610 |
| Mean Family Income | 18,397 | $79,804 |
| Median Household Income | 28,349 | $45,649 |
| Mean Household Income | 28,349 | $65,795 |
| Income Deficit | 18,397 | $10,418 |
| Wage / Income Gap (%) | 72,741 | 31.33% |
| Wage / Income Gap ($) | 72,741 | 68.67¢ per $1 |
| Gini / Inequality Index | 72,741 | 0.51 |
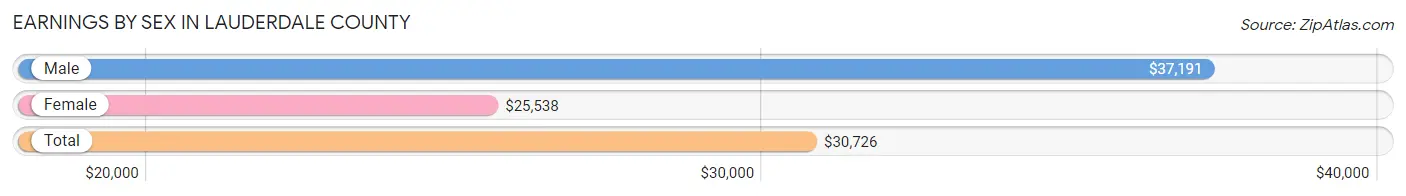
Earnings by Sex in Lauderdale County
Average Earnings in Lauderdale County are $30,726, $37,191 for men and $25,538 for women, a difference of 31.3%.
| Sex | Number | Average Earnings |
| Male | 16,265 (48.8%) | $37,191 |
| Female | 17,040 (51.2%) | $25,538 |
| Total | 33,305 (100.0%) | $30,726 |
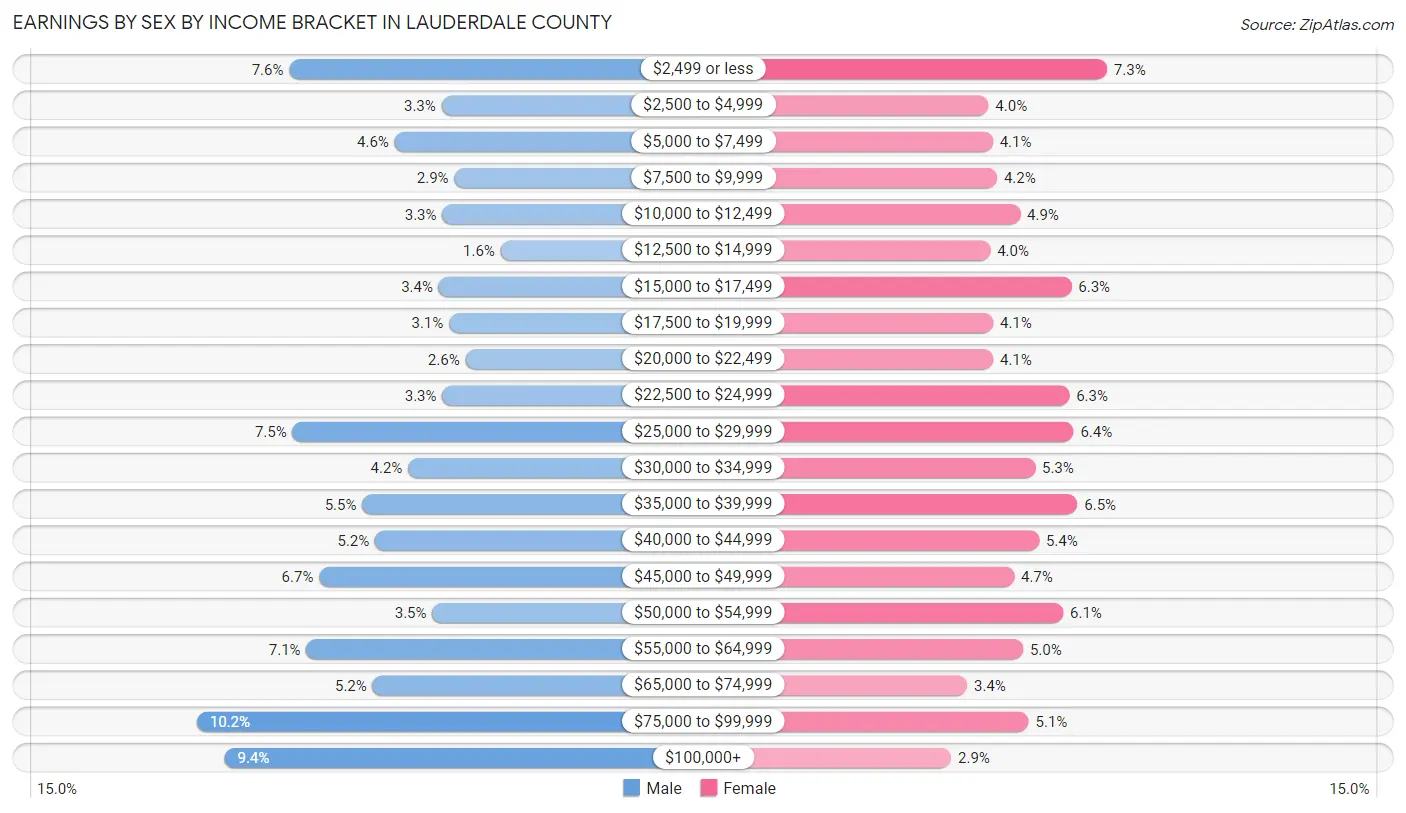
Earnings by Sex by Income Bracket in Lauderdale County
The most common earnings brackets in Lauderdale County are $75,000 to $99,999 for men (1,652 | 10.2%) and $2,499 or less for women (1,246 | 7.3%).
| Income | Male | Female |
| $2,499 or less | 1,230 (7.6%) | 1,246 (7.3%) |
| $2,500 to $4,999 | 534 (3.3%) | 679 (4.0%) |
| $5,000 to $7,499 | 749 (4.6%) | 699 (4.1%) |
| $7,500 to $9,999 | 475 (2.9%) | 719 (4.2%) |
| $10,000 to $12,499 | 530 (3.3%) | 830 (4.9%) |
| $12,500 to $14,999 | 263 (1.6%) | 687 (4.0%) |
| $15,000 to $17,499 | 547 (3.4%) | 1,075 (6.3%) |
| $17,500 to $19,999 | 499 (3.1%) | 701 (4.1%) |
| $20,000 to $22,499 | 424 (2.6%) | 701 (4.1%) |
| $22,500 to $24,999 | 531 (3.3%) | 1,065 (6.2%) |
| $25,000 to $29,999 | 1,215 (7.5%) | 1,085 (6.4%) |
| $30,000 to $34,999 | 686 (4.2%) | 902 (5.3%) |
| $35,000 to $39,999 | 897 (5.5%) | 1,104 (6.5%) |
| $40,000 to $44,999 | 838 (5.1%) | 920 (5.4%) |
| $45,000 to $49,999 | 1,093 (6.7%) | 801 (4.7%) |
| $50,000 to $54,999 | 576 (3.5%) | 1,036 (6.1%) |
| $55,000 to $64,999 | 1,152 (7.1%) | 844 (5.0%) |
| $65,000 to $74,999 | 849 (5.2%) | 576 (3.4%) |
| $75,000 to $99,999 | 1,652 (10.2%) | 871 (5.1%) |
| $100,000+ | 1,525 (9.4%) | 499 (2.9%) |
| Total | 16,265 (100.0%) | 17,040 (100.0%) |
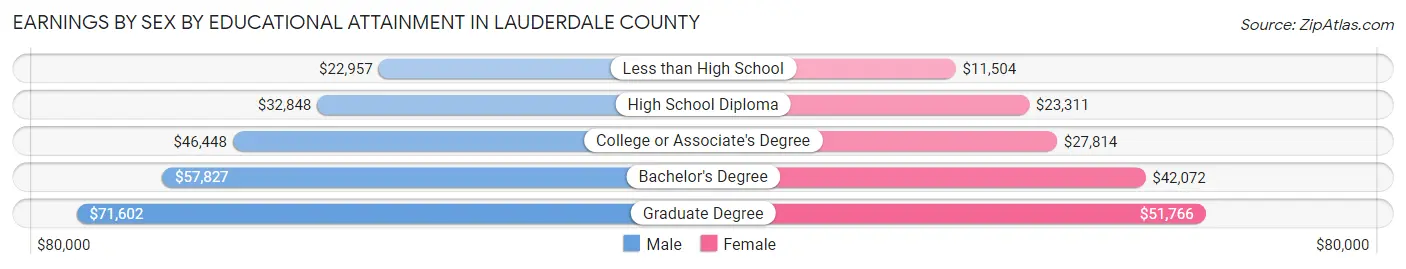
Earnings by Sex by Educational Attainment in Lauderdale County
Average earnings in Lauderdale County are $43,935 for men and $29,039 for women, a difference of 33.9%. Men with an educational attainment of graduate degree enjoy the highest average annual earnings of $71,602, while those with less than high school education earn the least with $22,957. Women with an educational attainment of graduate degree earn the most with the average annual earnings of $51,766, while those with less than high school education have the smallest earnings of $11,504.
| Educational Attainment | Male Income | Female Income |
| Less than High School | $22,957 | $11,504 |
| High School Diploma | $32,848 | $23,311 |
| College or Associate's Degree | $46,448 | $27,814 |
| Bachelor's Degree | $57,827 | $42,072 |
| Graduate Degree | $71,602 | $51,766 |
| Total | $43,935 | $29,039 |
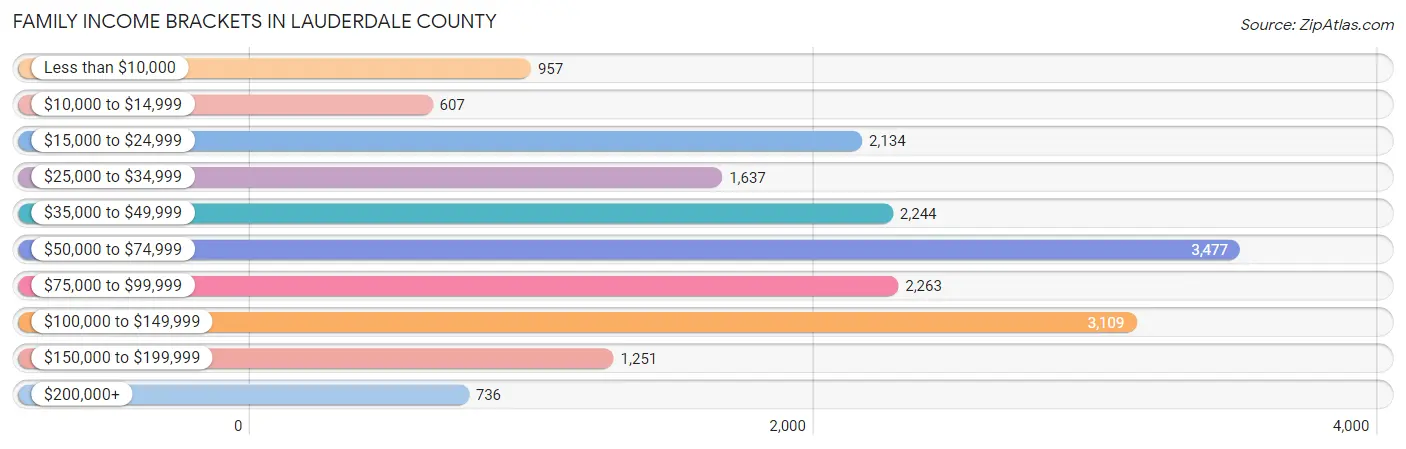
Family Income in Lauderdale County
Family Income Brackets in Lauderdale County
According to the Lauderdale County family income data, there are 3,477 families falling into the $50,000 to $74,999 income range, which is the most common income bracket and makes up 18.9% of all families. Conversely, the $10,000 to $14,999 income bracket is the least frequent group with only 607 families (3.3%) belonging to this category.
| Income Bracket | # Families | % Families |
| Less than $10,000 | 957 | 5.2% |
| $10,000 to $14,999 | 607 | 3.3% |
| $15,000 to $24,999 | 2,134 | 11.6% |
| $25,000 to $34,999 | 1,637 | 8.9% |
| $35,000 to $49,999 | 2,244 | 12.2% |
| $50,000 to $74,999 | 3,477 | 18.9% |
| $75,000 to $99,999 | 2,263 | 12.3% |
| $100,000 to $149,999 | 3,109 | 16.9% |
| $150,000 to $199,999 | 1,251 | 6.8% |
| $200,000+ | 736 | 4.0% |
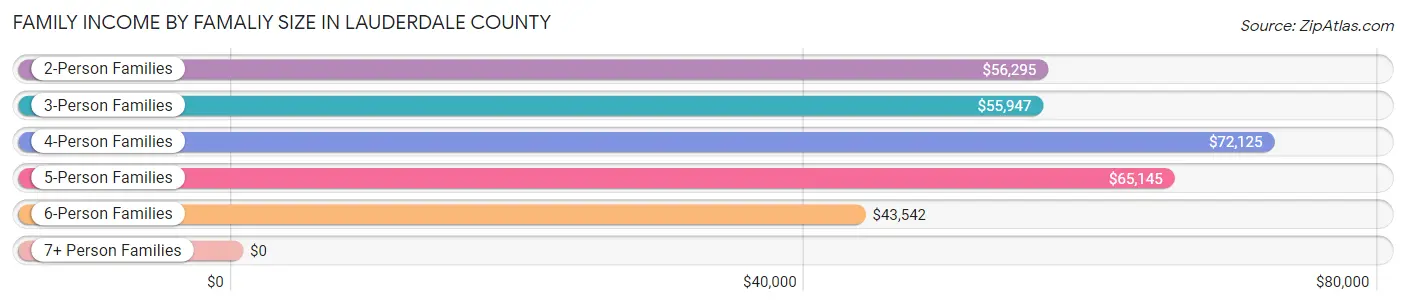
Family Income by Famaliy Size in Lauderdale County
4-person families (2,886 | 15.7%) account for the highest median family income in Lauderdale County with $72,125 per family, while 2-person families (8,815 | 47.9%) have the highest median income of $28,148 per family member.
| Income Bracket | # Families | Median Income |
| 2-Person Families | 8,815 (47.9%) | $56,295 |
| 3-Person Families | 4,520 (24.6%) | $55,947 |
| 4-Person Families | 2,886 (15.7%) | $72,125 |
| 5-Person Families | 1,507 (8.2%) | $65,145 |
| 6-Person Families | 409 (2.2%) | $43,542 |
| 7+ Person Families | 260 (1.4%) | $0 |
| Total | 18,397 (100.0%) | $59,610 |
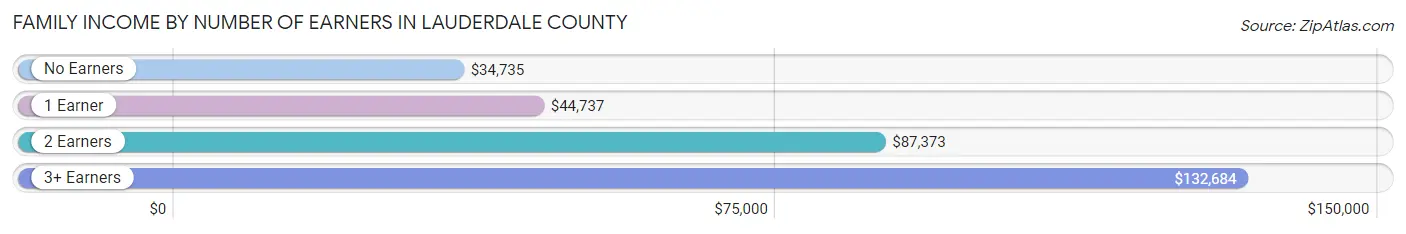
Family Income by Number of Earners in Lauderdale County
The median family income in Lauderdale County is $59,610, with families comprising 3+ earners (1,453) having the highest median family income of $132,684, while families with no earners (3,291) have the lowest median family income of $34,735, accounting for 7.9% and 17.9% of families, respectively.
| Number of Earners | # Families | Median Income |
| No Earners | 3,291 (17.9%) | $34,735 |
| 1 Earner | 6,710 (36.5%) | $44,737 |
| 2 Earners | 6,943 (37.7%) | $87,373 |
| 3+ Earners | 1,453 (7.9%) | $132,684 |
| Total | 18,397 (100.0%) | $59,610 |
Household Income in Lauderdale County
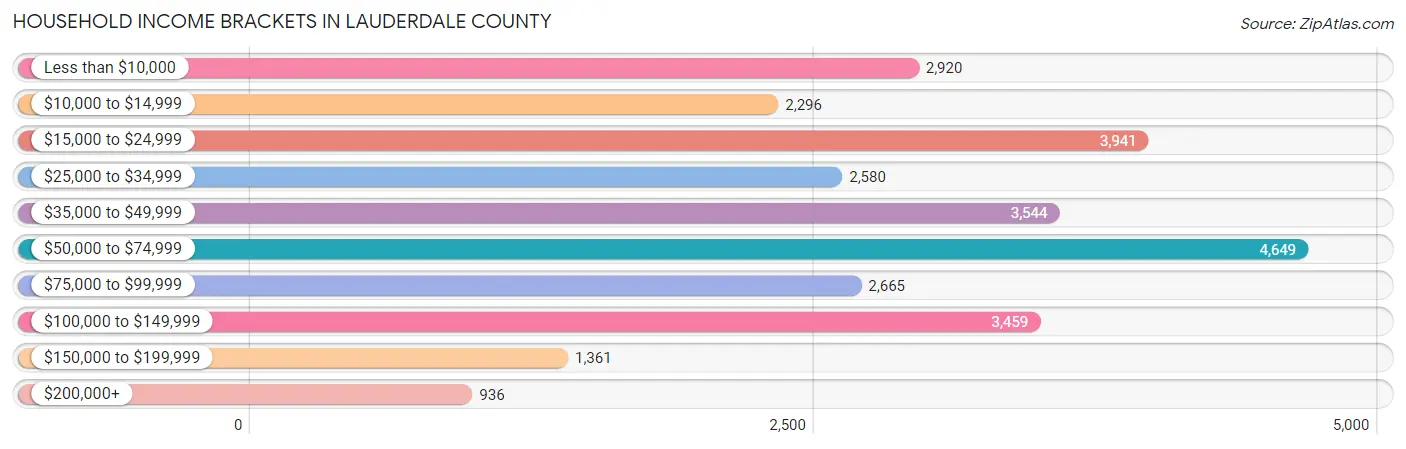
Household Income Brackets in Lauderdale County
With 4,649 households falling in the category, the $50,000 to $74,999 income range is the most frequent in Lauderdale County, accounting for 16.4% of all households. In contrast, only 936 households (3.3%) fall into the $200,000+ income bracket, making it the least populous group.
| Income Bracket | # Households | % Households |
| Less than $10,000 | 2,920 | 10.3% |
| $10,000 to $14,999 | 2,296 | 8.1% |
| $15,000 to $24,999 | 3,941 | 13.9% |
| $25,000 to $34,999 | 2,580 | 9.1% |
| $35,000 to $49,999 | 3,544 | 12.5% |
| $50,000 to $74,999 | 4,649 | 16.4% |
| $75,000 to $99,999 | 2,665 | 9.4% |
| $100,000 to $149,999 | 3,459 | 12.2% |
| $150,000 to $199,999 | 1,361 | 4.8% |
| $200,000+ | 936 | 3.3% |
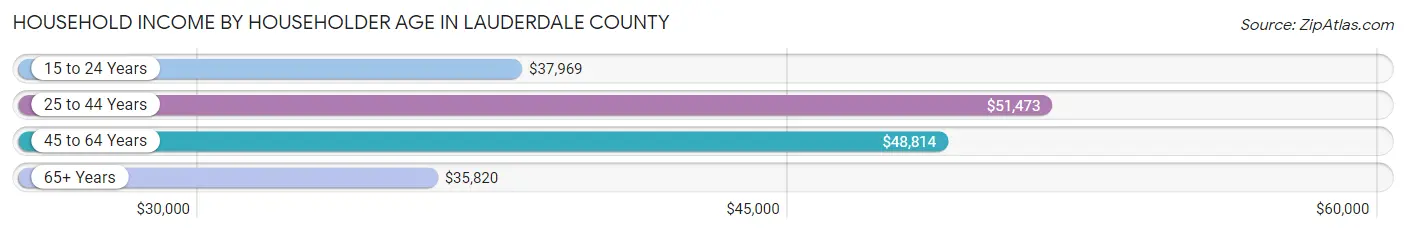
Household Income by Householder Age in Lauderdale County
The median household income in Lauderdale County is $45,649, with the highest median household income of $51,473 found in the 25 to 44 years age bracket for the primary householder. A total of 8,669 households (30.6%) fall into this category. Meanwhile, the 65+ years age bracket for the primary householder has the lowest median household income of $35,820, with 8,267 households (29.2%) in this group.
| Income Bracket | # Households | Median Income |
| 15 to 24 Years | 851 (3.0%) | $37,969 |
| 25 to 44 Years | 8,669 (30.6%) | $51,473 |
| 45 to 64 Years | 10,562 (37.3%) | $48,814 |
| 65+ Years | 8,267 (29.2%) | $35,820 |
| Total | 28,349 (100.0%) | $45,649 |
Poverty in Lauderdale County
Income Below Poverty by Sex and Age in Lauderdale County
With 22.1% poverty level for males and 27.3% for females among the residents of Lauderdale County, under 5 year old males and 5 year old females are the most vulnerable to poverty, with 1,061 males (49.5%) and 309 females (54.4%) in their respective age groups living below the poverty level.
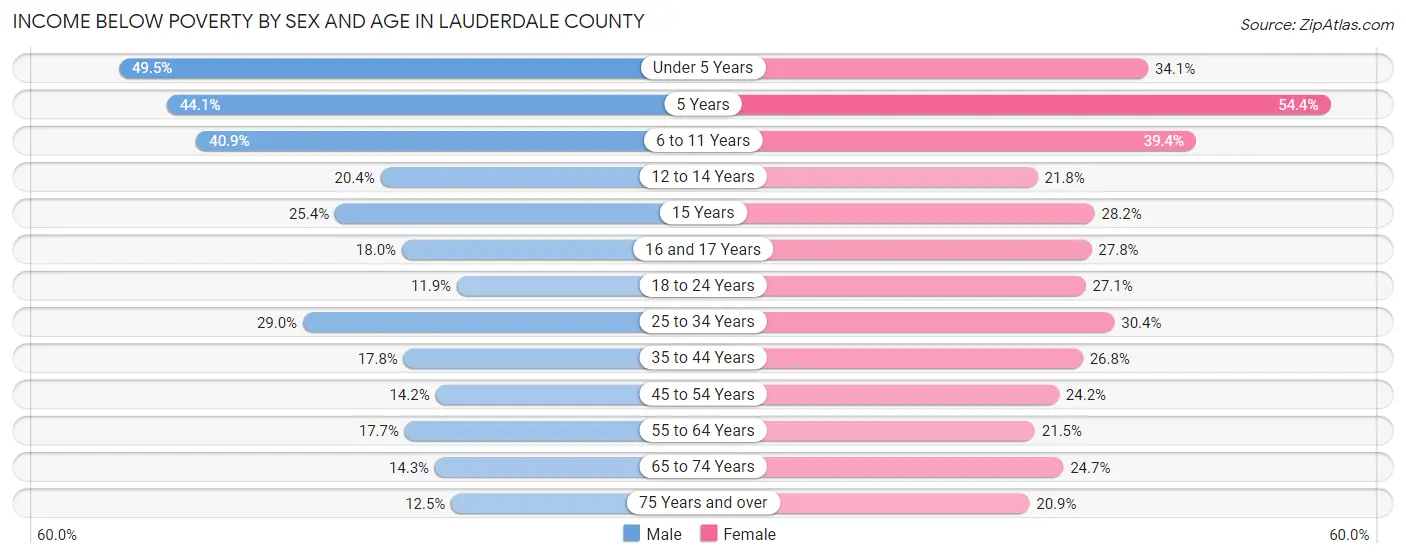
| Age Bracket | Male | Female |
| Under 5 Years | 1,061 (49.5%) | 741 (34.1%) |
| 5 Years | 113 (44.1%) | 309 (54.4%) |
| 6 to 11 Years | 1,121 (40.9%) | 1,172 (39.4%) |
| 12 to 14 Years | 387 (20.4%) | 239 (21.8%) |
| 15 Years | 147 (25.4%) | 170 (28.1%) |
| 16 and 17 Years | 180 (18.0%) | 236 (27.8%) |
| 18 to 24 Years | 327 (11.8%) | 724 (27.1%) |
| 25 to 34 Years | 1,244 (29.0%) | 1,403 (30.3%) |
| 35 to 44 Years | 699 (17.8%) | 1,211 (26.8%) |
| 45 to 54 Years | 547 (14.2%) | 1,100 (24.2%) |
| 55 to 64 Years | 733 (17.7%) | 1,050 (21.5%) |
| 65 to 74 Years | 484 (14.3%) | 1,003 (24.7%) |
| 75 Years and over | 244 (12.5%) | 645 (20.9%) |
| Total | 7,287 (22.1%) | 10,003 (27.3%) |
Income Above Poverty by Sex and Age in Lauderdale County
According to the poverty statistics in Lauderdale County, males aged 18 to 24 years and females aged 75 years and over are the age groups that are most secure financially, with 88.1% of males and 79.1% of females in these age groups living above the poverty line.
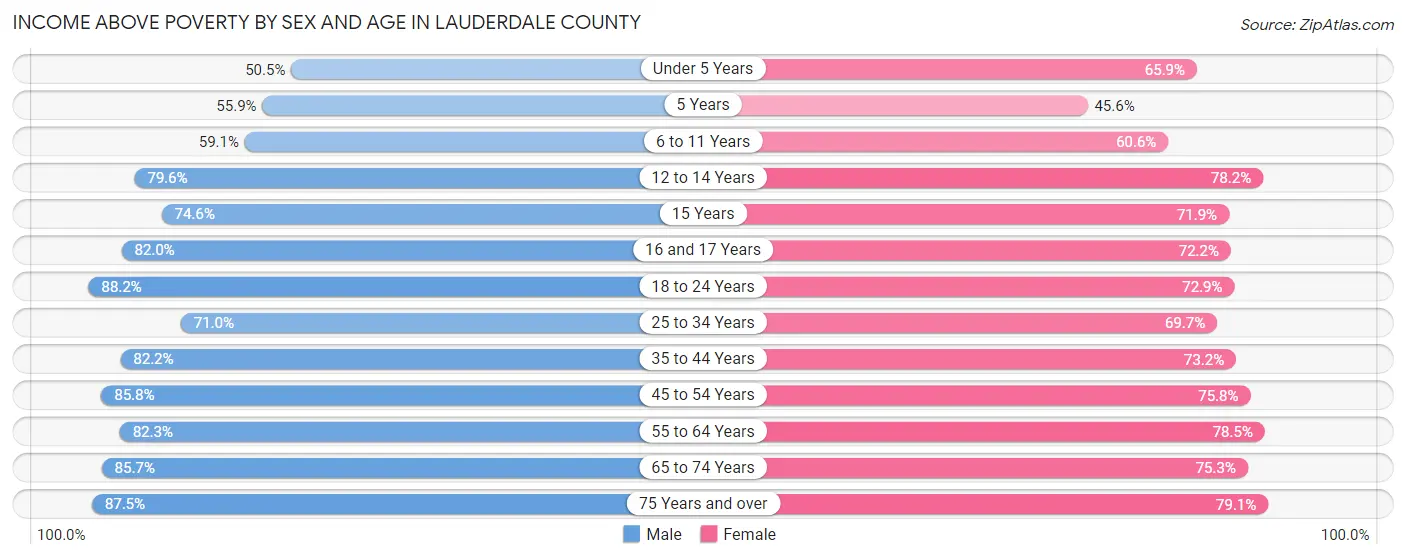
| Age Bracket | Male | Female |
| Under 5 Years | 1,083 (50.5%) | 1,432 (65.9%) |
| 5 Years | 143 (55.9%) | 259 (45.6%) |
| 6 to 11 Years | 1,622 (59.1%) | 1,801 (60.6%) |
| 12 to 14 Years | 1,514 (79.6%) | 857 (78.2%) |
| 15 Years | 431 (74.6%) | 434 (71.9%) |
| 16 and 17 Years | 821 (82.0%) | 613 (72.2%) |
| 18 to 24 Years | 2,433 (88.1%) | 1,944 (72.9%) |
| 25 to 34 Years | 3,046 (71.0%) | 3,220 (69.7%) |
| 35 to 44 Years | 3,233 (82.2%) | 3,302 (73.2%) |
| 45 to 54 Years | 3,293 (85.8%) | 3,450 (75.8%) |
| 55 to 64 Years | 3,418 (82.3%) | 3,833 (78.5%) |
| 65 to 74 Years | 2,900 (85.7%) | 3,065 (75.3%) |
| 75 Years and over | 1,709 (87.5%) | 2,444 (79.1%) |
| Total | 25,646 (77.9%) | 26,654 (72.7%) |
Income Below Poverty Among Married-Couple Families in Lauderdale County
The poverty statistics for married-couple families in Lauderdale County show that 6.3% or 738 of the total 11,763 families live below the poverty line. Families with 5 or more children have the highest poverty rate of 53.1%, comprising of 34 families. On the other hand, families with no children have the lowest poverty rate of 4.6%, which includes 328 families.
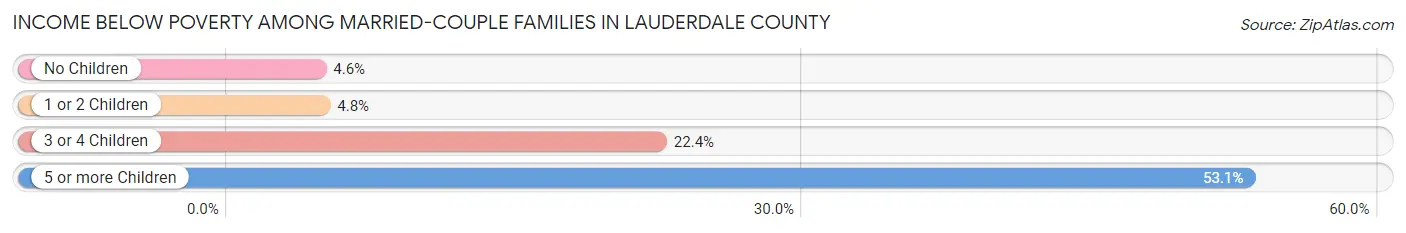
| Children | Above Poverty | Below Poverty |
| No Children | 6,794 (95.4%) | 328 (4.6%) |
| 1 or 2 Children | 3,515 (95.2%) | 178 (4.8%) |
| 3 or 4 Children | 686 (77.6%) | 198 (22.4%) |
| 5 or more Children | 30 (46.9%) | 34 (53.1%) |
| Total | 11,025 (93.7%) | 738 (6.3%) |
Income Below Poverty Among Single-Parent Households in Lauderdale County
According to the poverty data in Lauderdale County, 32.0% or 395 single-father households and 43.7% or 2,359 single-mother households are living below the poverty line. Among single-father households, those with 5 or more children have the highest poverty rate, with 24 households (100.0%) experiencing poverty. Likewise, among single-mother households, those with 5 or more children have the highest poverty rate, with 175 households (100.0%) falling below the poverty line.
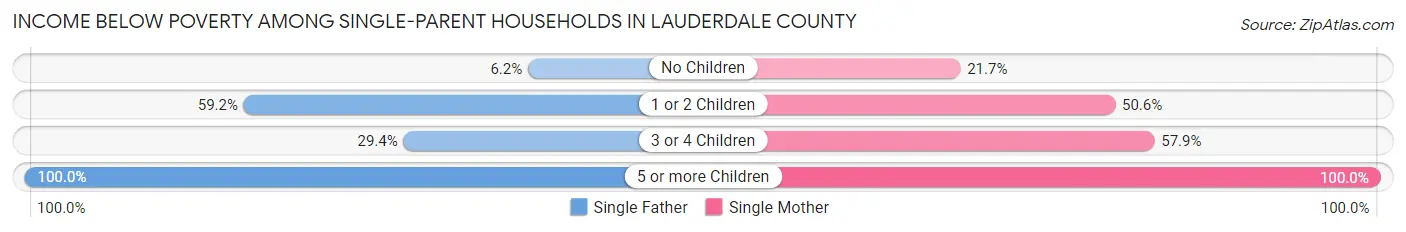
| Children | Single Father | Single Mother |
| No Children | 40 (6.2%) | 380 (21.7%) |
| 1 or 2 Children | 326 (59.2%) | 1,425 (50.5%) |
| 3 or 4 Children | 5 (29.4%) | 379 (57.9%) |
| 5 or more Children | 24 (100.0%) | 175 (100.0%) |
| Total | 395 (32.0%) | 2,359 (43.7%) |
Income Below Poverty Among Married-Couple vs Single-Parent Households in Lauderdale County
The poverty data for Lauderdale County shows that 738 of the married-couple family households (6.3%) and 2,754 of the single-parent households (41.5%) are living below the poverty level. Within the married-couple family households, those with 5 or more children have the highest poverty rate, with 34 households (53.1%) falling below the poverty line. Among the single-parent households, those with 5 or more children have the highest poverty rate, with 199 household (100.0%) living below poverty.
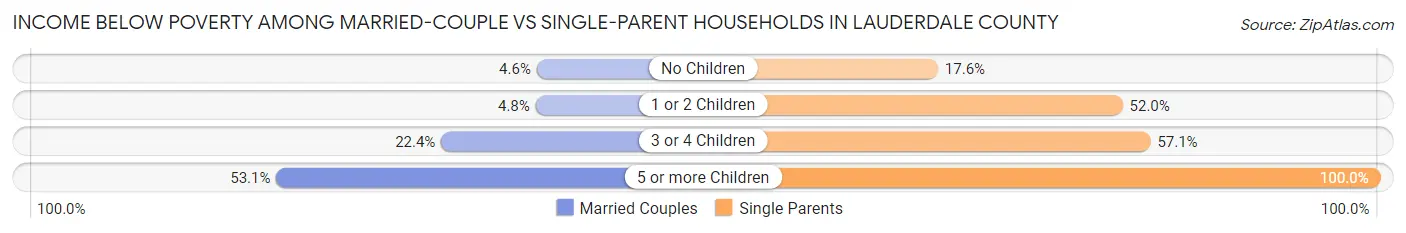
| Children | Married-Couple Families | Single-Parent Households |
| No Children | 328 (4.6%) | 420 (17.5%) |
| 1 or 2 Children | 178 (4.8%) | 1,751 (52.0%) |
| 3 or 4 Children | 198 (22.4%) | 384 (57.1%) |
| 5 or more Children | 34 (53.1%) | 199 (100.0%) |
| Total | 738 (6.3%) | 2,754 (41.5%) |
Race in Lauderdale County
The most populous races in Lauderdale County are White / Caucasian (38,257 | 52.6%), Black / African American (31,617 | 43.5%), and Hispanic or Latino (1,635 | 2.2%).
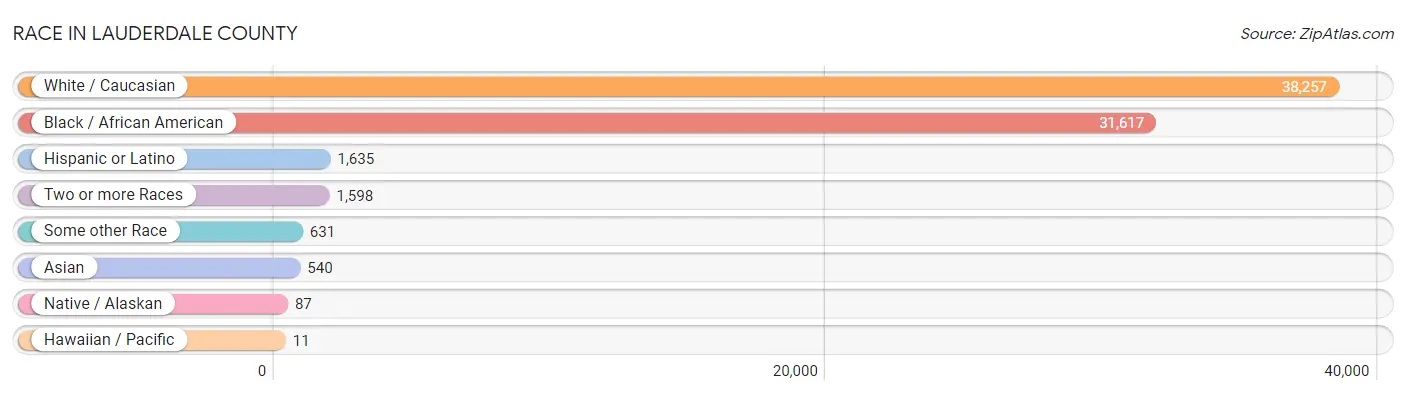
| Race | # Population | % Population |
| Asian | 540 | 0.7% |
| Black / African American | 31,617 | 43.5% |
| Hawaiian / Pacific | 11 | 0.0% |
| Hispanic or Latino | 1,635 | 2.2% |
| Native / Alaskan | 87 | 0.1% |
| White / Caucasian | 38,257 | 52.6% |
| Two or more Races | 1,598 | 2.2% |
| Some other Race | 631 | 0.9% |
| Total | 72,741 | 100.0% |
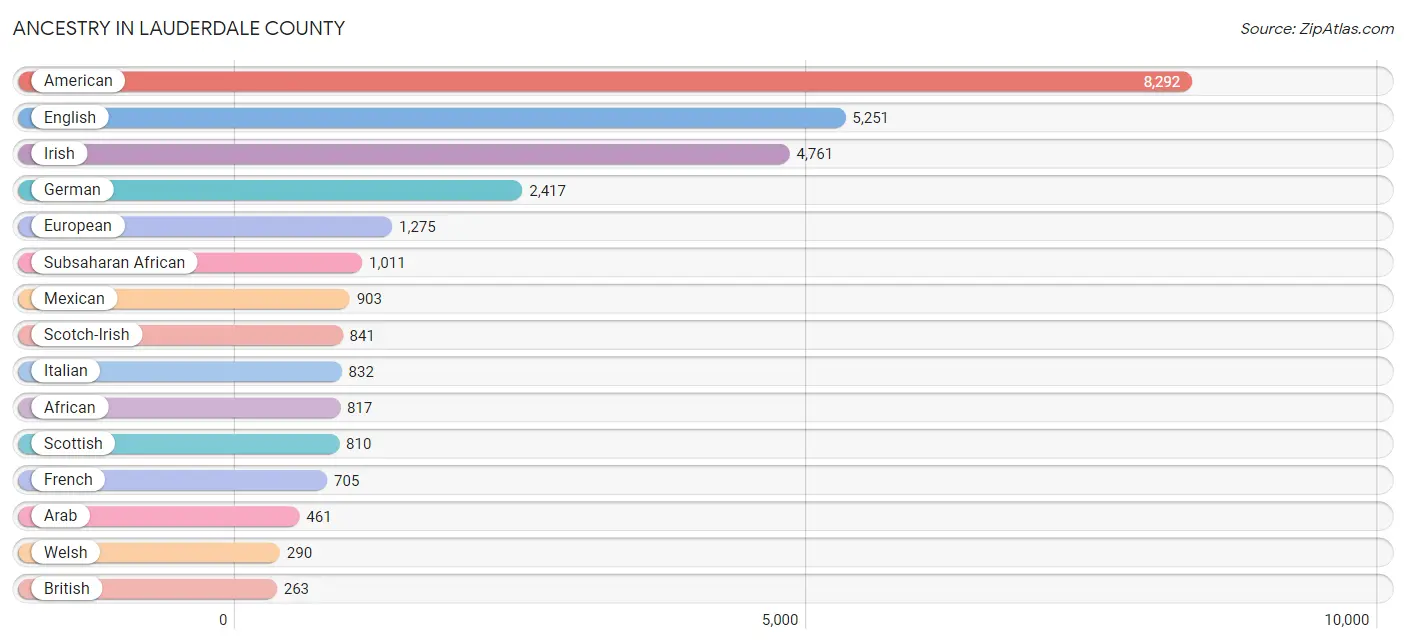
Ancestry in Lauderdale County
The most populous ancestries reported in Lauderdale County are American (8,292 | 11.4%), English (5,251 | 7.2%), Irish (4,761 | 6.6%), German (2,417 | 3.3%), and European (1,275 | 1.8%), together accounting for 30.2% of all Lauderdale County residents.
| Ancestry | # Population | % Population |
| African | 817 | 1.1% |
| Albanian | 13 | 0.0% |
| American | 8,292 | 11.4% |
| Arab | 461 | 0.6% |
| Austrian | 36 | 0.1% |
| Bhutanese | 36 | 0.1% |
| Blackfeet | 28 | 0.0% |
| British | 263 | 0.4% |
| Burmese | 11 | 0.0% |
| Cajun | 12 | 0.0% |
| Canadian | 11 | 0.0% |
| Celtic | 7 | 0.0% |
| Central American | 154 | 0.2% |
| Cherokee | 34 | 0.1% |
| Choctaw | 80 | 0.1% |
| Colombian | 89 | 0.1% |
| Creek | 4 | 0.0% |
| Croatian | 34 | 0.1% |
| Cuban | 77 | 0.1% |
| Czech | 75 | 0.1% |
| Danish | 13 | 0.0% |
| Dominican | 28 | 0.0% |
| Dutch | 137 | 0.2% |
| English | 5,251 | 7.2% |
| European | 1,275 | 1.8% |
| French | 705 | 1.0% |
| French Canadian | 23 | 0.0% |
| German | 2,417 | 3.3% |
| Greek | 100 | 0.1% |
| Guatemalan | 8 | 0.0% |
| Honduran | 106 | 0.2% |
| Houma | 7 | 0.0% |
| Hungarian | 15 | 0.0% |
| Indian (Asian) | 111 | 0.2% |
| Irish | 4,761 | 6.6% |
| Italian | 832 | 1.1% |
| Jamaican | 21 | 0.0% |
| Japanese | 38 | 0.1% |
| Korean | 137 | 0.2% |
| Lebanese | 40 | 0.1% |
| Malaysian | 25 | 0.0% |
| Mexican | 903 | 1.2% |
| Moroccan | 26 | 0.0% |
| Native Hawaiian | 2 | 0.0% |
| Nicaraguan | 15 | 0.0% |
| Nigerian | 157 | 0.2% |
| Northern European | 55 | 0.1% |
| Norwegian | 92 | 0.1% |
| Pakistani | 69 | 0.1% |
| Palestinian | 82 | 0.1% |
| Panamanian | 8 | 0.0% |
| Peruvian | 6 | 0.0% |
| Polish | 221 | 0.3% |
| Portuguese | 80 | 0.1% |
| Puerto Rican | 106 | 0.2% |
| Romanian | 17 | 0.0% |
| Russian | 51 | 0.1% |
| Salvadoran | 17 | 0.0% |
| Scandinavian | 7 | 0.0% |
| Scotch-Irish | 841 | 1.2% |
| Scottish | 810 | 1.1% |
| Sierra Leonean | 13 | 0.0% |
| South African | 37 | 0.1% |
| South American | 143 | 0.2% |
| Spaniard | 162 | 0.2% |
| Sri Lankan | 45 | 0.1% |
| Subsaharan African | 1,011 | 1.4% |
| Swedish | 16 | 0.0% |
| Swiss | 7 | 0.0% |
| Thai | 177 | 0.2% |
| Trinidadian and Tobagonian | 4 | 0.0% |
| Ukrainian | 25 | 0.0% |
| Venezuelan | 48 | 0.1% |
| Welsh | 290 | 0.4% |
| Yugoslavian | 76 | 0.1% | View All 75 Rows |
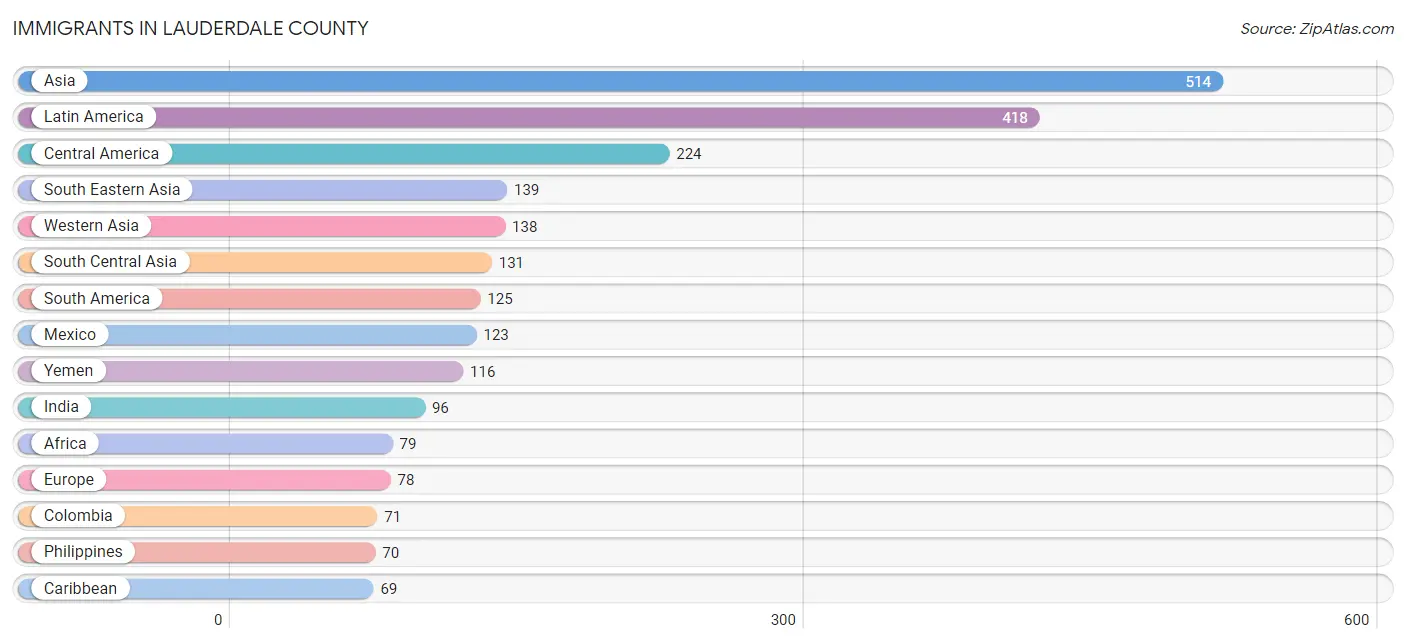
Immigrants in Lauderdale County
The most numerous immigrant groups reported in Lauderdale County came from Asia (514 | 0.7%), Latin America (418 | 0.6%), Central America (224 | 0.3%), South Eastern Asia (139 | 0.2%), and Western Asia (138 | 0.2%), together accounting for 2.0% of all Lauderdale County residents.
| Immigration Origin | # Population | % Population |
| Africa | 79 | 0.1% |
| Albania | 13 | 0.0% |
| Asia | 514 | 0.7% |
| Cambodia | 13 | 0.0% |
| Caribbean | 69 | 0.1% |
| Central America | 224 | 0.3% |
| China | 53 | 0.1% |
| Colombia | 71 | 0.1% |
| Dominican Republic | 33 | 0.1% |
| Eastern Africa | 14 | 0.0% |
| Eastern Asia | 64 | 0.1% |
| Eastern Europe | 20 | 0.0% |
| El Salvador | 13 | 0.0% |
| Ethiopia | 14 | 0.0% |
| Europe | 78 | 0.1% |
| Guatemala | 8 | 0.0% |
| Honduras | 65 | 0.1% |
| India | 96 | 0.1% |
| Jamaica | 32 | 0.0% |
| Korea | 11 | 0.0% |
| Latin America | 418 | 0.6% |
| Mexico | 123 | 0.2% |
| Netherlands | 12 | 0.0% |
| Nicaragua | 15 | 0.0% |
| Nigeria | 42 | 0.1% |
| Northern Europe | 46 | 0.1% |
| Pakistan | 35 | 0.1% |
| Peru | 6 | 0.0% |
| Philippines | 70 | 0.1% |
| Russia | 7 | 0.0% |
| Scotland | 46 | 0.1% |
| South Africa | 16 | 0.0% |
| South America | 125 | 0.2% |
| South Central Asia | 131 | 0.2% |
| South Eastern Asia | 139 | 0.2% |
| Thailand | 35 | 0.1% |
| Trinidad and Tobago | 4 | 0.0% |
| Venezuela | 48 | 0.1% |
| Vietnam | 21 | 0.0% |
| Western Africa | 42 | 0.1% |
| Western Asia | 138 | 0.2% |
| Western Europe | 12 | 0.0% |
| Yemen | 116 | 0.2% | View All 43 Rows |
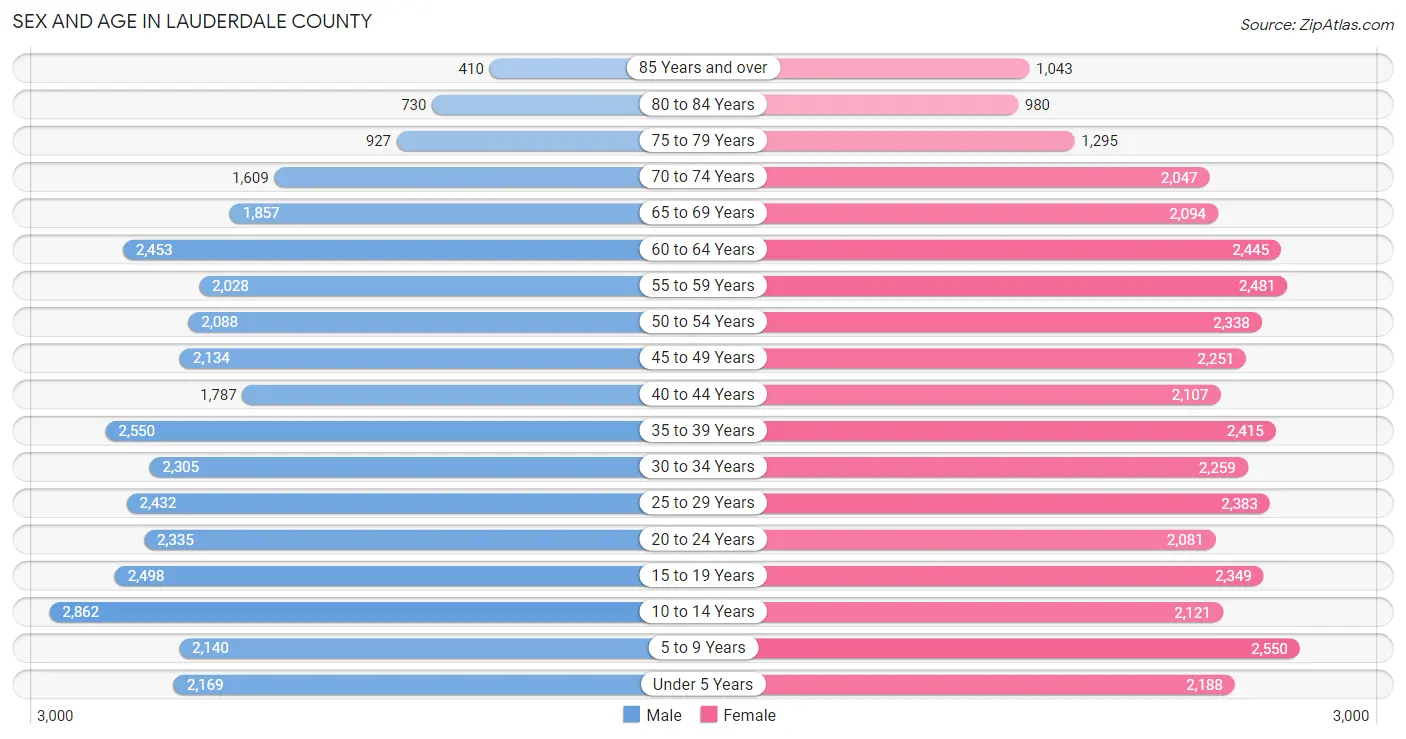
Sex and Age in Lauderdale County
Sex and Age in Lauderdale County
The most populous age groups in Lauderdale County are 10 to 14 Years (2,862 | 8.1%) for men and 5 to 9 Years (2,550 | 6.8%) for women.
| Age Bracket | Male | Female |
| Under 5 Years | 2,169 (6.1%) | 2,188 (5.9%) |
| 5 to 9 Years | 2,140 (6.1%) | 2,550 (6.8%) |
| 10 to 14 Years | 2,862 (8.1%) | 2,121 (5.7%) |
| 15 to 19 Years | 2,498 (7.1%) | 2,349 (6.3%) |
| 20 to 24 Years | 2,335 (6.6%) | 2,081 (5.6%) |
| 25 to 29 Years | 2,432 (6.9%) | 2,383 (6.4%) |
| 30 to 34 Years | 2,305 (6.5%) | 2,259 (6.0%) |
| 35 to 39 Years | 2,550 (7.2%) | 2,415 (6.5%) |
| 40 to 44 Years | 1,787 (5.1%) | 2,107 (5.6%) |
| 45 to 49 Years | 2,134 (6.0%) | 2,251 (6.0%) |
| 50 to 54 Years | 2,088 (5.9%) | 2,338 (6.2%) |
| 55 to 59 Years | 2,028 (5.7%) | 2,481 (6.6%) |
| 60 to 64 Years | 2,453 (7.0%) | 2,445 (6.5%) |
| 65 to 69 Years | 1,857 (5.3%) | 2,094 (5.6%) |
| 70 to 74 Years | 1,609 (4.6%) | 2,047 (5.5%) |
| 75 to 79 Years | 927 (2.6%) | 1,295 (3.5%) |
| 80 to 84 Years | 730 (2.1%) | 980 (2.6%) |
| 85 Years and over | 410 (1.2%) | 1,043 (2.8%) |
| Total | 35,314 (100.0%) | 37,427 (100.0%) |
Families and Households in Lauderdale County
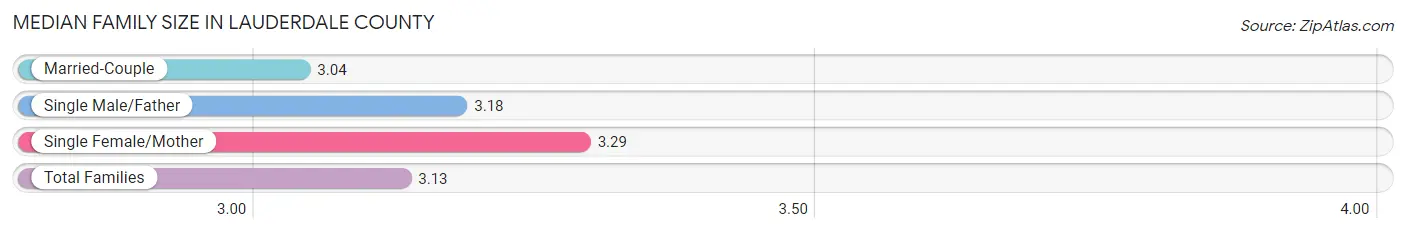
Median Family Size in Lauderdale County
The median family size in Lauderdale County is 3.13 persons per family, with single female/mother families (5,399 | 29.3%) accounting for the largest median family size of 3.29 persons per family. On the other hand, married-couple families (11,763 | 63.9%) represent the smallest median family size with 3.04 persons per family.
| Family Type | # Families | Family Size |
| Married-Couple | 11,763 (63.9%) | 3.04 |
| Single Male/Father | 1,235 (6.7%) | 3.18 |
| Single Female/Mother | 5,399 (29.3%) | 3.29 |
| Total Families | 18,397 (100.0%) | 3.13 |
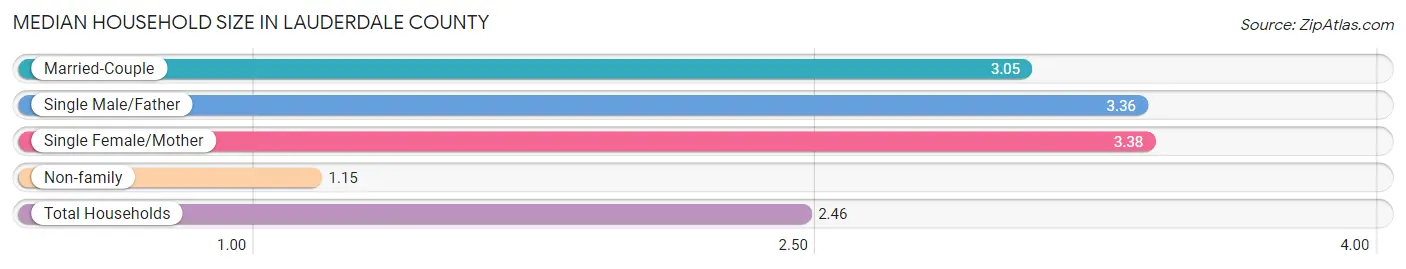
Median Household Size in Lauderdale County
The median household size in Lauderdale County is 2.46 persons per household, with single female/mother households (5,399 | 19.0%) accounting for the largest median household size of 3.38 persons per household. non-family households (9,952 | 35.1%) represent the smallest median household size with 1.15 persons per household.
| Household Type | # Households | Household Size |
| Married-Couple | 11,763 (41.5%) | 3.05 |
| Single Male/Father | 1,235 (4.4%) | 3.36 |
| Single Female/Mother | 5,399 (19.0%) | 3.38 |
| Non-family | 9,952 (35.1%) | 1.15 |
| Total Households | 28,349 (100.0%) | 2.46 |
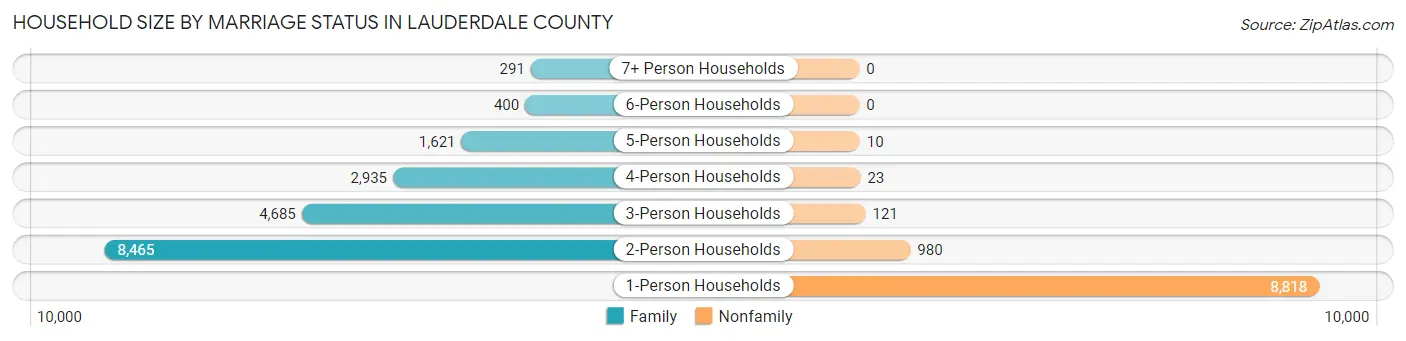
Household Size by Marriage Status in Lauderdale County
Out of a total of 28,349 households in Lauderdale County, 18,397 (64.9%) are family households, while 9,952 (35.1%) are nonfamily households. The most numerous type of family households are 2-person households, comprising 8,465, and the most common type of nonfamily households are 1-person households, comprising 8,818.
| Household Size | Family Households | Nonfamily Households |
| 1-Person Households | - | 8,818 (31.1%) |
| 2-Person Households | 8,465 (29.9%) | 980 (3.5%) |
| 3-Person Households | 4,685 (16.5%) | 121 (0.4%) |
| 4-Person Households | 2,935 (10.3%) | 23 (0.1%) |
| 5-Person Households | 1,621 (5.7%) | 10 (0.0%) |
| 6-Person Households | 400 (1.4%) | 0 (0.0%) |
| 7+ Person Households | 291 (1.0%) | 0 (0.0%) |
| Total | 18,397 (64.9%) | 9,952 (35.1%) |
Female Fertility in Lauderdale County
Fertility by Age in Lauderdale County
Average fertility rate in Lauderdale County is 69.0 births per 1,000 women. Women in the age bracket of 20 to 34 years have the highest fertility rate with 134.0 births per 1,000 women. Women in the age bracket of 20 to 34 years acount for 78.4% of all women with births.
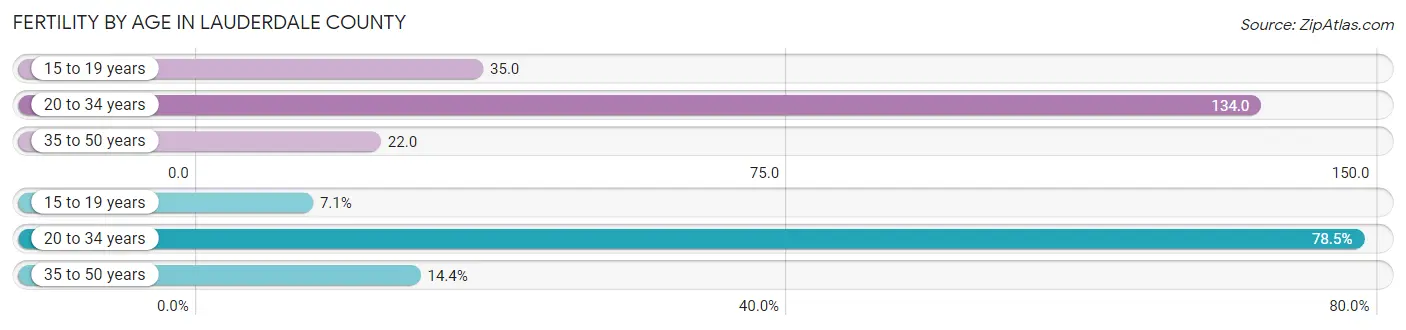
| Age Bracket | Women with Births | Births / 1,000 Women |
| 15 to 19 years | 82 (7.1%) | 35.0 |
| 20 to 34 years | 903 (78.4%) | 134.0 |
| 35 to 50 years | 166 (14.4%) | 22.0 |
| Total | 1,151 (100.0%) | 69.0 |
Fertility by Age by Marriage Status in Lauderdale County
46.0% of women with births (1,151) in Lauderdale County are married. The highest percentage of unmarried women with births falls into 15 to 19 years age bracket with 100.0% of them unmarried at the time of birth, while the lowest percentage of unmarried women with births belong to 35 to 50 years age bracket with 26.5% of them unmarried.
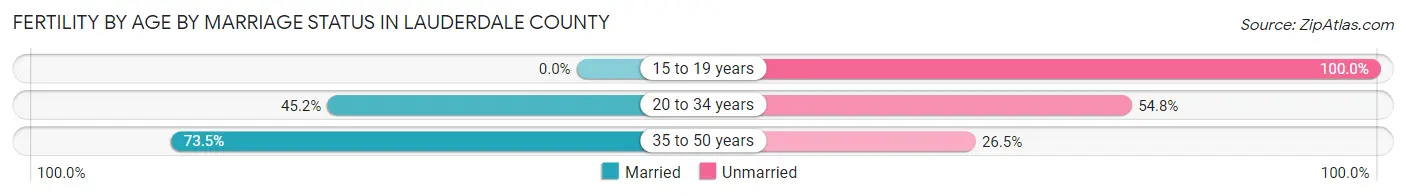
| Age Bracket | Married | Unmarried |
| 15 to 19 years | 0 (0.0%) | 82 (100.0%) |
| 20 to 34 years | 408 (45.2%) | 495 (54.8%) |
| 35 to 50 years | 122 (73.5%) | 44 (26.5%) |
| Total | 529 (46.0%) | 622 (54.0%) |
Fertility by Education in Lauderdale County
Average fertility rate in Lauderdale County is 69.0 births per 1,000 women. Women with the education attainment of graduate degree have the highest fertility rate of 126.0 births per 1,000 women, while women with the education attainment of bachelor's degree have the lowest fertility at 37.0 births per 1,000 women. Women with the education attainment of college or associate's degree represent 31.9% of all women with births.
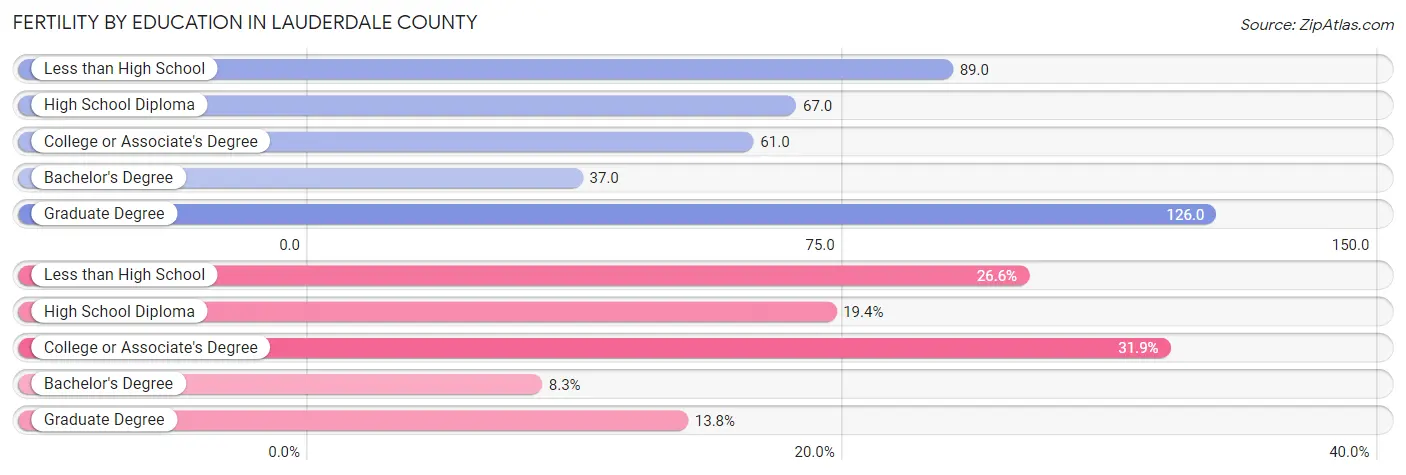
| Educational Attainment | Women with Births | Births / 1,000 Women |
| Less than High School | 306 (26.6%) | 89.0 |
| High School Diploma | 223 (19.4%) | 67.0 |
| College or Associate's Degree | 367 (31.9%) | 61.0 |
| Bachelor's Degree | 96 (8.3%) | 37.0 |
| Graduate Degree | 159 (13.8%) | 126.0 |
| Total | 1,151 (100.0%) | 69.0 |
Fertility by Education by Marriage Status in Lauderdale County
54.0% of women with births in Lauderdale County are unmarried. Women with the educational attainment of bachelor's degree are most likely to be married with 100.0% of them married at childbirth, while women with the educational attainment of less than high school are least likely to be married with 100.0% of them unmarried at childbirth.
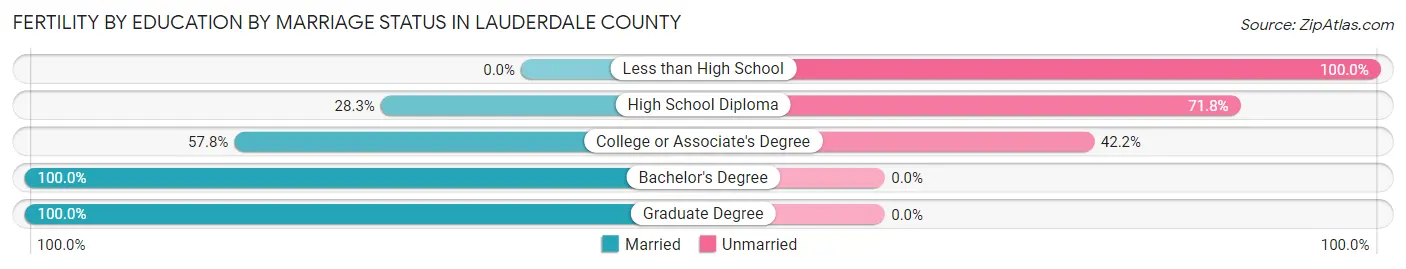
| Educational Attainment | Married | Unmarried |
| Less than High School | 0 (0.0%) | 306 (100.0%) |
| High School Diploma | 63 (28.2%) | 160 (71.8%) |
| College or Associate's Degree | 212 (57.8%) | 155 (42.2%) |
| Bachelor's Degree | 96 (100.0%) | 0 (0.0%) |
| Graduate Degree | 159 (100.0%) | 0 (0.0%) |
| Total | 529 (46.0%) | 622 (54.0%) |
Employment Characteristics in Lauderdale County
Employment by Class of Employer in Lauderdale County
Among the 29,647 employed individuals in Lauderdale County, private company employees (19,329 | 65.2%), local government employees (2,385 | 8.0%), and state government employees (2,180 | 7.3%) make up the most common classes of employment.
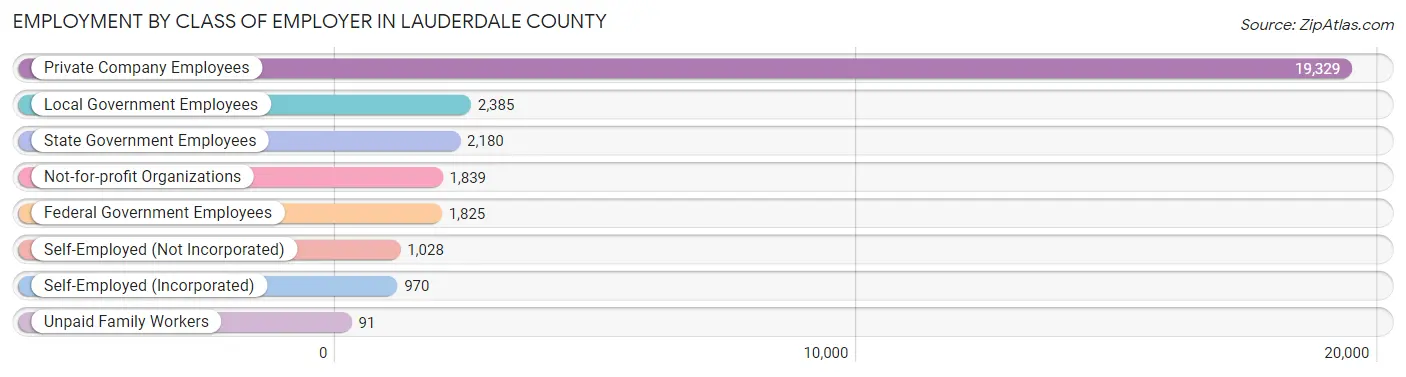
| Employer Class | # Employees | % Employees |
| Private Company Employees | 19,329 | 65.2% |
| Self-Employed (Incorporated) | 970 | 3.3% |
| Self-Employed (Not Incorporated) | 1,028 | 3.5% |
| Not-for-profit Organizations | 1,839 | 6.2% |
| Local Government Employees | 2,385 | 8.0% |
| State Government Employees | 2,180 | 7.3% |
| Federal Government Employees | 1,825 | 6.2% |
| Unpaid Family Workers | 91 | 0.3% |
| Total | 29,647 | 100.0% |
Employment Status by Age in Lauderdale County
According to the labor force statistics for Lauderdale County, out of the total population over 16 years of age (57,526), 55.1% or 31,697 individuals are in the labor force, with 5.5% or 1,743 of them unemployed. The age group with the highest labor force participation rate is 30 to 34 years, with 80.1% or 3,656 individuals in the labor force. Within the labor force, the 16 to 19 years age range has the highest percentage of unemployed individuals, with 16.4% or 216 of them being unemployed.
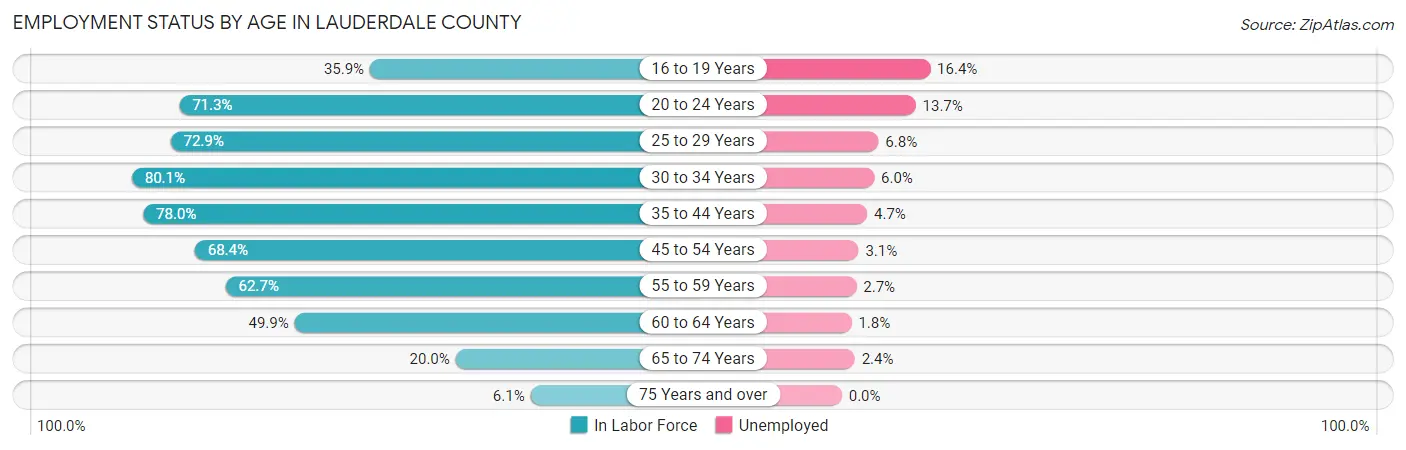
| Age Bracket | In Labor Force | Unemployed |
| 16 to 19 Years | 1,315 (35.9%) | 216 (16.4%) |
| 20 to 24 Years | 3,149 (71.3%) | 431 (13.7%) |
| 25 to 29 Years | 3,510 (72.9%) | 239 (6.8%) |
| 30 to 34 Years | 3,656 (80.1%) | 219 (6.0%) |
| 35 to 44 Years | 6,910 (78.0%) | 325 (4.7%) |
| 45 to 54 Years | 6,027 (68.4%) | 187 (3.1%) |
| 55 to 59 Years | 2,827 (62.7%) | 76 (2.7%) |
| 60 to 64 Years | 2,444 (49.9%) | 44 (1.8%) |
| 65 to 74 Years | 1,521 (20.0%) | 37 (2.4%) |
| 75 Years and over | 328 (6.1%) | 0 (0.0%) |
| Total | 31,697 (55.1%) | 1,743 (5.5%) |
Employment Status by Educational Attainment in Lauderdale County
According to labor force statistics for Lauderdale County, 69.6% of individuals (25,373) out of the total population between 25 and 64 years of age (36,456) are in the labor force, with 4.3% or 1,091 of them being unemployed. The group with the highest labor force participation rate are those with the educational attainment of bachelor's degree or higher, with 89.3% or 6,994 individuals in the labor force. Within the labor force, individuals with less than high school education have the highest percentage of unemployment, with 12.0% or 280 of them being unemployed.
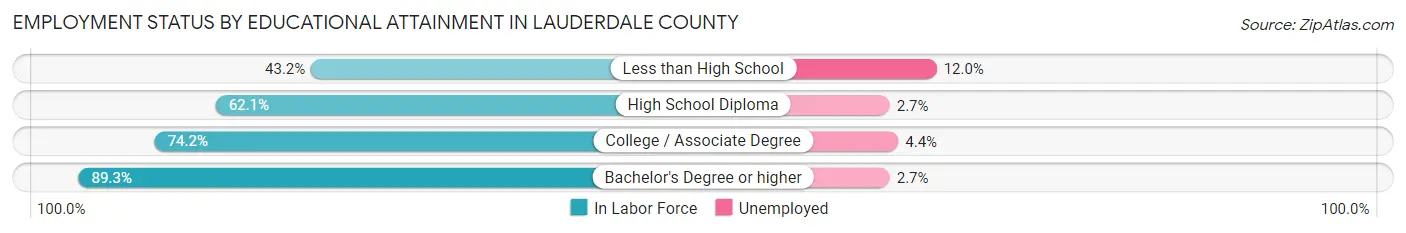
| Educational Attainment | In Labor Force | Unemployed |
| Less than High School | 2,335 (43.2%) | 649 (12.0%) |
| High School Diploma | 6,090 (62.1%) | 265 (2.7%) |
| College / Associate Degree | 9,952 (74.2%) | 590 (4.4%) |
| Bachelor's Degree or higher | 6,994 (89.3%) | 211 (2.7%) |
| Total | 25,373 (69.6%) | 1,568 (4.3%) |
Employment Occupations by Sex in Lauderdale County
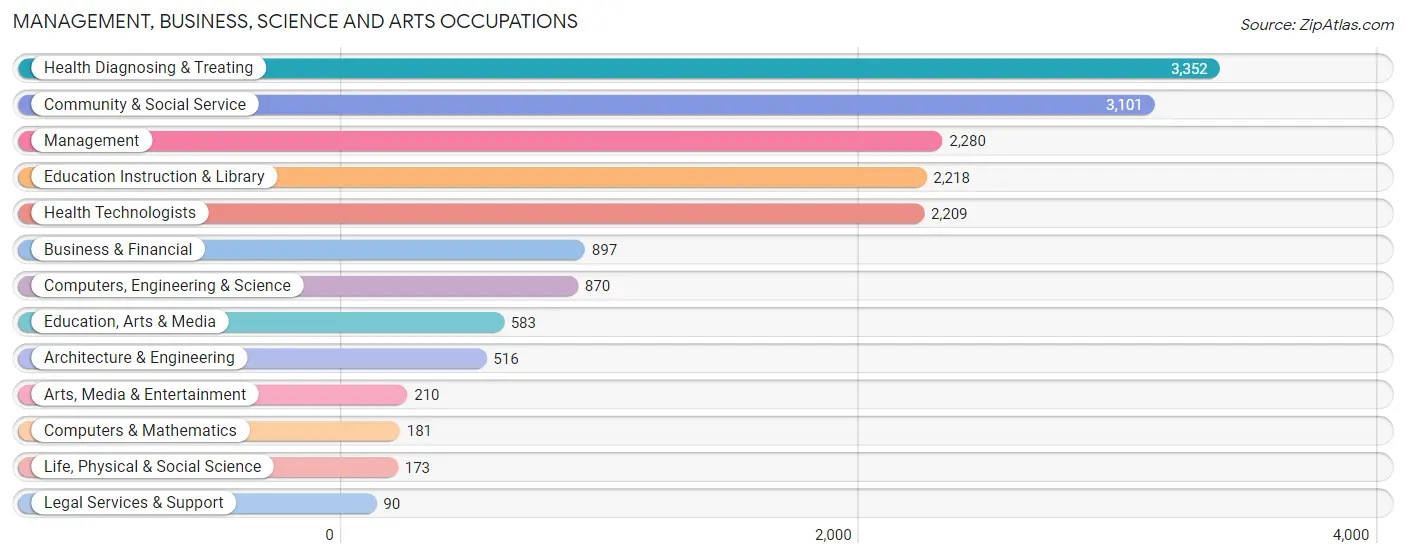
Management, Business, Science and Arts Occupations
The most common Management, Business, Science and Arts occupations in Lauderdale County are Health Diagnosing & Treating (3,352 | 11.5%), Community & Social Service (3,101 | 10.7%), Management (2,280 | 7.9%), Education Instruction & Library (2,218 | 7.6%), and Health Technologists (2,209 | 7.6%).
Management, Business, Science and Arts Occupations by Sex
Within the Management, Business, Science and Arts occupations in Lauderdale County, the most male-oriented occupations are Architecture & Engineering (100.0%), Arts, Media & Entertainment (76.7%), and Computers, Engineering & Science (76.4%), while the most female-oriented occupations are Education Instruction & Library (86.2%), Health Diagnosing & Treating (82.6%), and Health Technologists (79.9%).
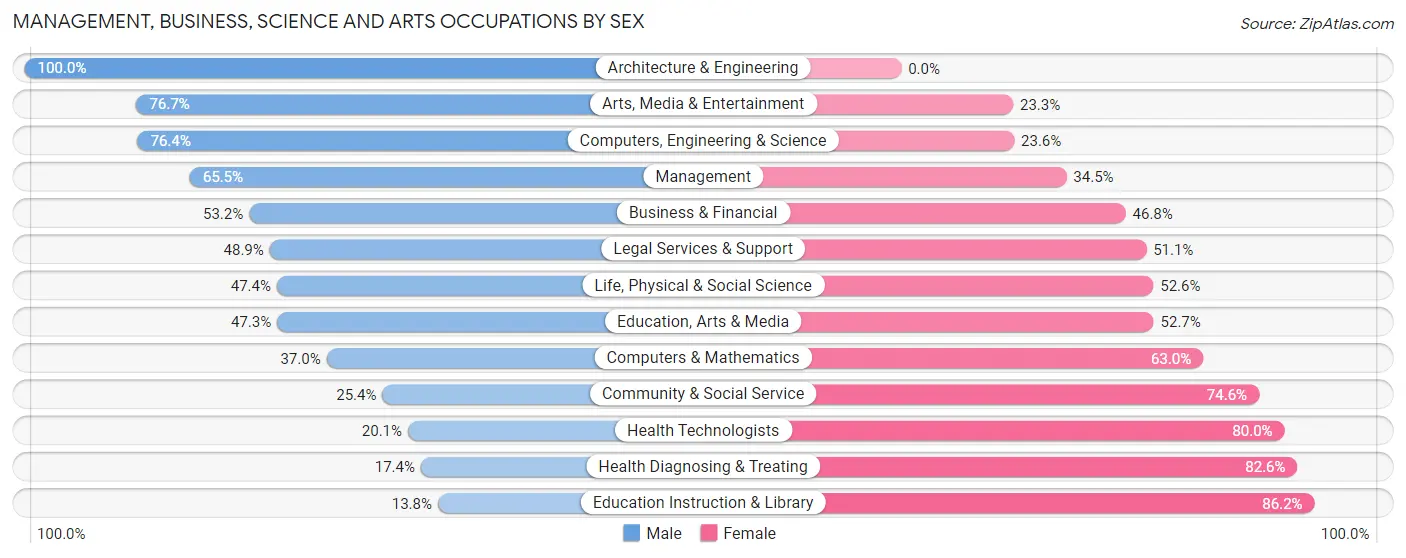
| Occupation | Male | Female |
| Management | 1,494 (65.5%) | 786 (34.5%) |
| Business & Financial | 477 (53.2%) | 420 (46.8%) |
| Computers, Engineering & Science | 665 (76.4%) | 205 (23.6%) |
| Computers & Mathematics | 67 (37.0%) | 114 (63.0%) |
| Architecture & Engineering | 516 (100.0%) | 0 (0.0%) |
| Life, Physical & Social Science | 82 (47.4%) | 91 (52.6%) |
| Community & Social Service | 787 (25.4%) | 2,314 (74.6%) |
| Education, Arts & Media | 276 (47.3%) | 307 (52.7%) |
| Legal Services & Support | 44 (48.9%) | 46 (51.1%) |
| Education Instruction & Library | 306 (13.8%) | 1,912 (86.2%) |
| Arts, Media & Entertainment | 161 (76.7%) | 49 (23.3%) |
| Health Diagnosing & Treating | 582 (17.4%) | 2,770 (82.6%) |
| Health Technologists | 443 (20.1%) | 1,766 (79.9%) |
| Total (Category) | 4,005 (38.1%) | 6,495 (61.9%) |
| Total (Overall) | 14,051 (48.4%) | 15,006 (51.6%) |
Services Occupations
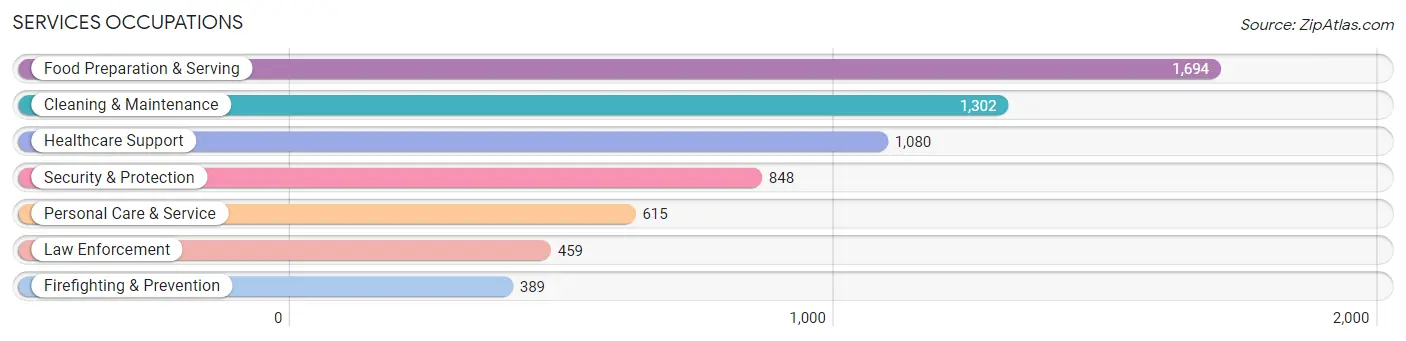
The most common Services occupations in Lauderdale County are Food Preparation & Serving (1,694 | 5.8%), Cleaning & Maintenance (1,302 | 4.5%), Healthcare Support (1,080 | 3.7%), Security & Protection (848 | 2.9%), and Personal Care & Service (615 | 2.1%).
Services Occupations by Sex
Within the Services occupations in Lauderdale County, the most male-oriented occupations are Law Enforcement (78.0%), Security & Protection (71.9%), and Firefighting & Prevention (64.8%), while the most female-oriented occupations are Healthcare Support (82.1%), Personal Care & Service (72.0%), and Food Preparation & Serving (60.5%).
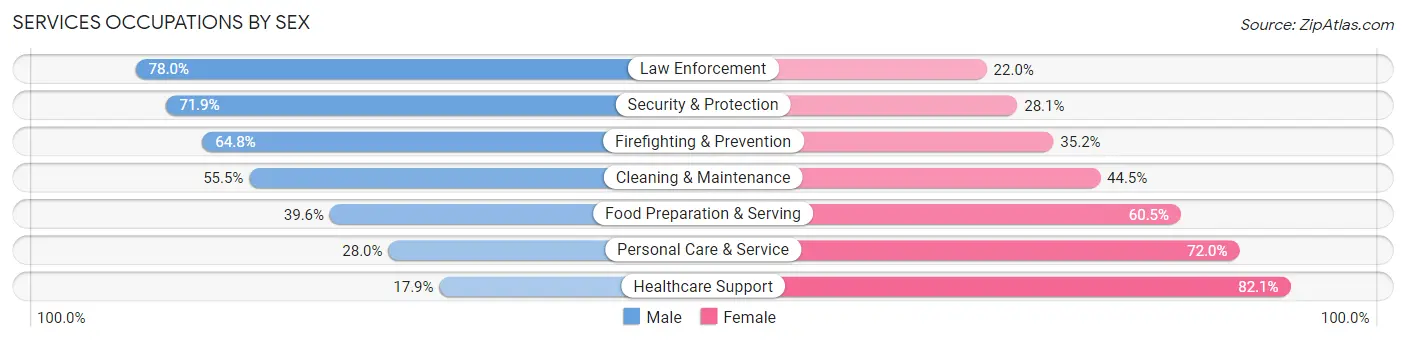
| Occupation | Male | Female |
| Healthcare Support | 193 (17.9%) | 887 (82.1%) |
| Security & Protection | 610 (71.9%) | 238 (28.1%) |
| Firefighting & Prevention | 252 (64.8%) | 137 (35.2%) |
| Law Enforcement | 358 (78.0%) | 101 (22.0%) |
| Food Preparation & Serving | 670 (39.6%) | 1,024 (60.5%) |
| Cleaning & Maintenance | 723 (55.5%) | 579 (44.5%) |
| Personal Care & Service | 172 (28.0%) | 443 (72.0%) |
| Total (Category) | 2,368 (42.7%) | 3,171 (57.3%) |
| Total (Overall) | 14,051 (48.4%) | 15,006 (51.6%) |
Sales and Office Occupations
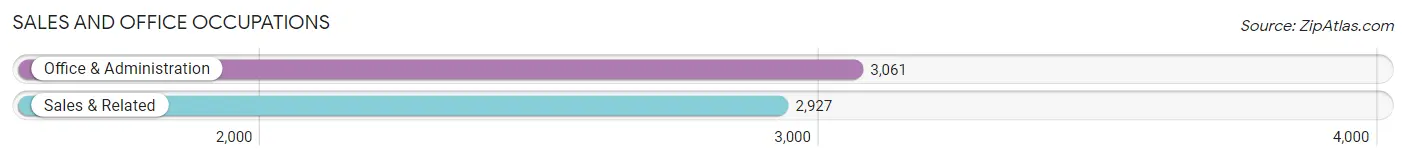
The most common Sales and Office occupations in Lauderdale County are Office & Administration (3,061 | 10.5%), and Sales & Related (2,927 | 10.1%).
Sales and Office Occupations by Sex

| Occupation | Male | Female |
| Sales & Related | 1,156 (39.5%) | 1,771 (60.5%) |
| Office & Administration | 542 (17.7%) | 2,519 (82.3%) |
| Total (Category) | 1,698 (28.4%) | 4,290 (71.6%) |
| Total (Overall) | 14,051 (48.4%) | 15,006 (51.6%) |
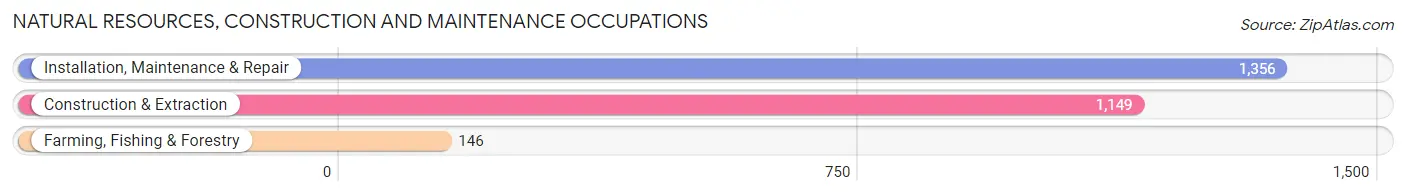
Natural Resources, Construction and Maintenance Occupations
The most common Natural Resources, Construction and Maintenance occupations in Lauderdale County are Installation, Maintenance & Repair (1,356 | 4.7%), Construction & Extraction (1,149 | 4.0%), and Farming, Fishing & Forestry (146 | 0.5%).
Natural Resources, Construction and Maintenance Occupations by Sex
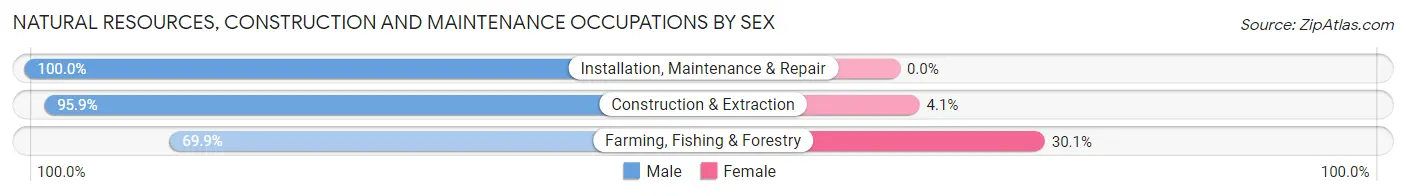
| Occupation | Male | Female |
| Farming, Fishing & Forestry | 102 (69.9%) | 44 (30.1%) |
| Construction & Extraction | 1,102 (95.9%) | 47 (4.1%) |
| Installation, Maintenance & Repair | 1,356 (100.0%) | 0 (0.0%) |
| Total (Category) | 2,560 (96.6%) | 91 (3.4%) |
| Total (Overall) | 14,051 (48.4%) | 15,006 (51.6%) |
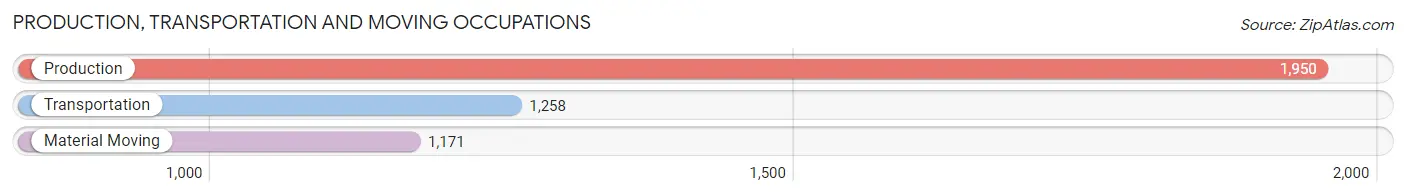
Production, Transportation and Moving Occupations
The most common Production, Transportation and Moving occupations in Lauderdale County are Production (1,950 | 6.7%), Transportation (1,258 | 4.3%), and Material Moving (1,171 | 4.0%).
Production, Transportation and Moving Occupations by Sex
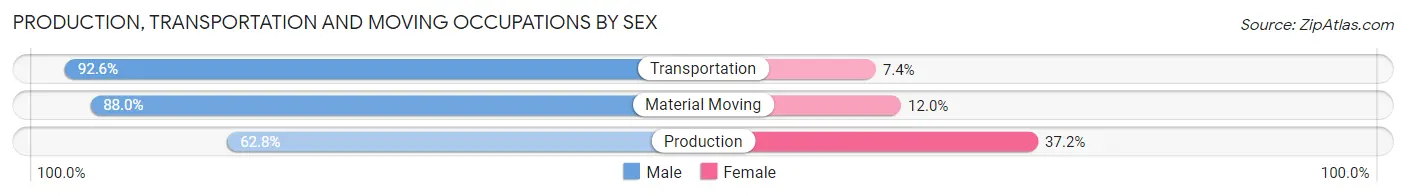
| Occupation | Male | Female |
| Production | 1,225 (62.8%) | 725 (37.2%) |
| Transportation | 1,165 (92.6%) | 93 (7.4%) |
| Material Moving | 1,030 (88.0%) | 141 (12.0%) |
| Total (Category) | 3,420 (78.1%) | 959 (21.9%) |
| Total (Overall) | 14,051 (48.4%) | 15,006 (51.6%) |
Employment Industries by Sex in Lauderdale County
Employment Industries in Lauderdale County
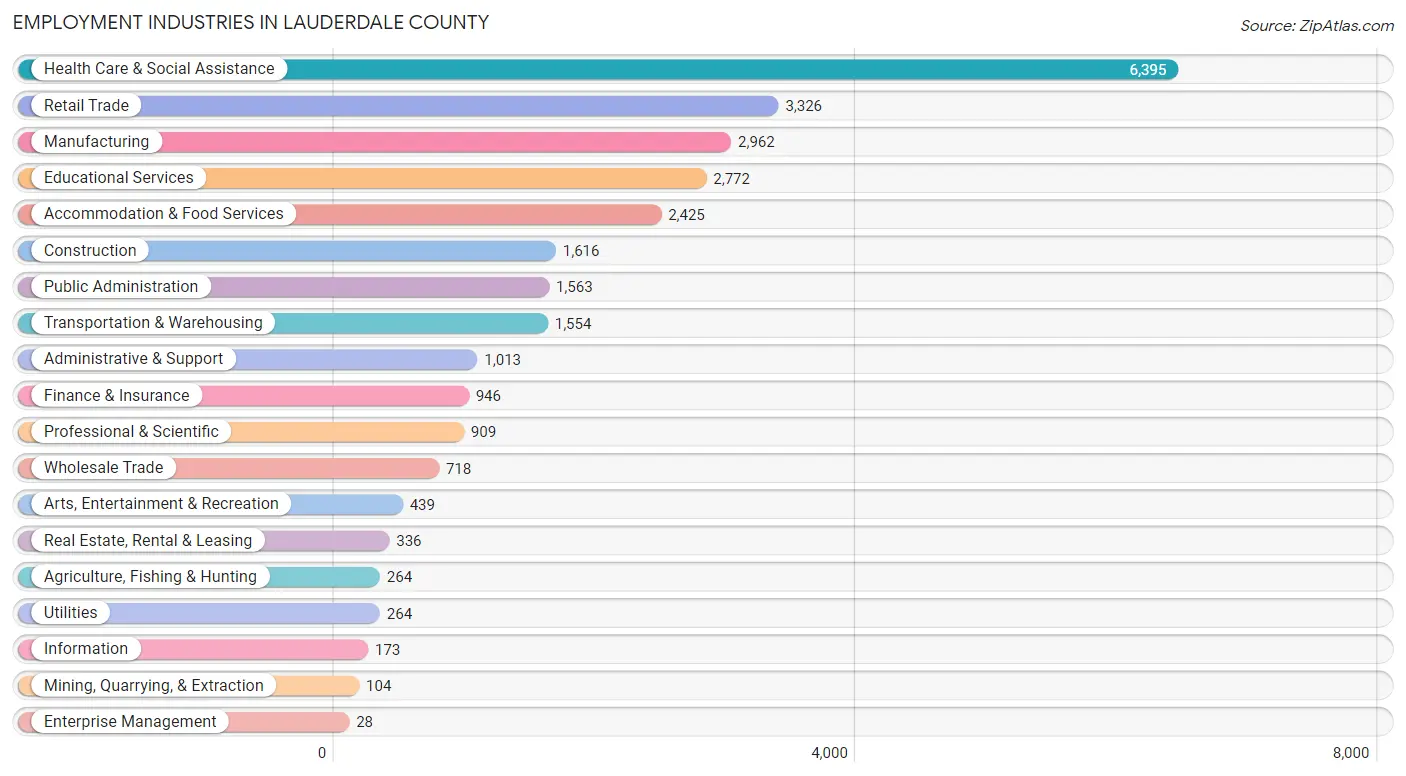
The major employment industries in Lauderdale County include Health Care & Social Assistance (6,395 | 22.0%), Retail Trade (3,326 | 11.5%), Manufacturing (2,962 | 10.2%), Educational Services (2,772 | 9.5%), and Accommodation & Food Services (2,425 | 8.4%).
Employment Industries by Sex in Lauderdale County
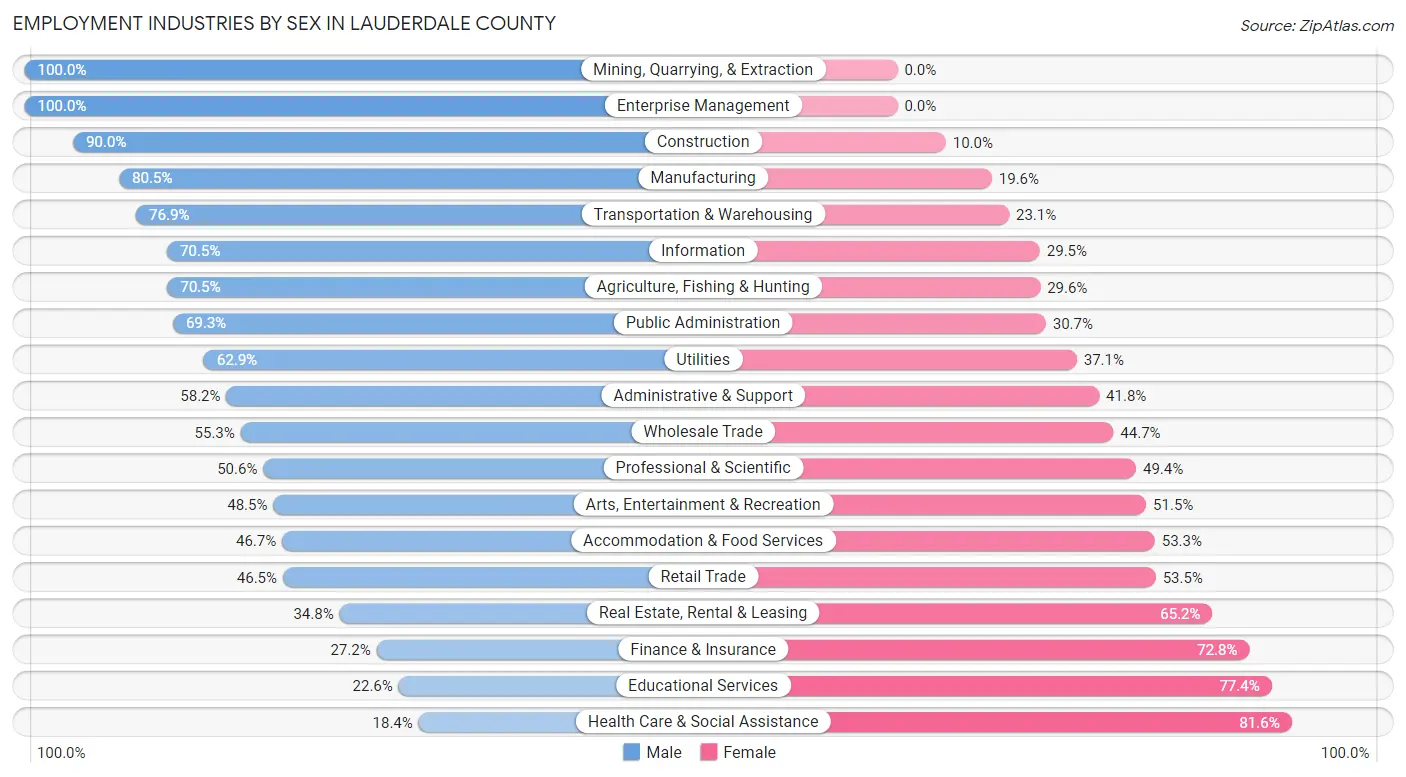
The Lauderdale County industries that see more men than women are Mining, Quarrying, & Extraction (100.0%), Enterprise Management (100.0%), and Construction (90.0%), whereas the industries that tend to have a higher number of women are Health Care & Social Assistance (81.6%), Educational Services (77.4%), and Finance & Insurance (72.8%).
| Industry | Male | Female |
| Agriculture, Fishing & Hunting | 186 (70.5%) | 78 (29.5%) |
| Mining, Quarrying, & Extraction | 104 (100.0%) | 0 (0.0%) |
| Construction | 1,454 (90.0%) | 162 (10.0%) |
| Manufacturing | 2,383 (80.4%) | 579 (19.6%) |
| Wholesale Trade | 397 (55.3%) | 321 (44.7%) |
| Retail Trade | 1,548 (46.5%) | 1,778 (53.5%) |
| Transportation & Warehousing | 1,195 (76.9%) | 359 (23.1%) |
| Utilities | 166 (62.9%) | 98 (37.1%) |
| Information | 122 (70.5%) | 51 (29.5%) |
| Finance & Insurance | 257 (27.2%) | 689 (72.8%) |
| Real Estate, Rental & Leasing | 117 (34.8%) | 219 (65.2%) |
| Professional & Scientific | 460 (50.6%) | 449 (49.4%) |
| Enterprise Management | 28 (100.0%) | 0 (0.0%) |
| Administrative & Support | 590 (58.2%) | 423 (41.8%) |
| Educational Services | 626 (22.6%) | 2,146 (77.4%) |
| Health Care & Social Assistance | 1,179 (18.4%) | 5,216 (81.6%) |
| Arts, Entertainment & Recreation | 213 (48.5%) | 226 (51.5%) |
| Accommodation & Food Services | 1,133 (46.7%) | 1,292 (53.3%) |
| Public Administration | 1,083 (69.3%) | 480 (30.7%) |
| Total | 14,051 (48.4%) | 15,006 (51.6%) |
Education in Lauderdale County
School Enrollment in Lauderdale County
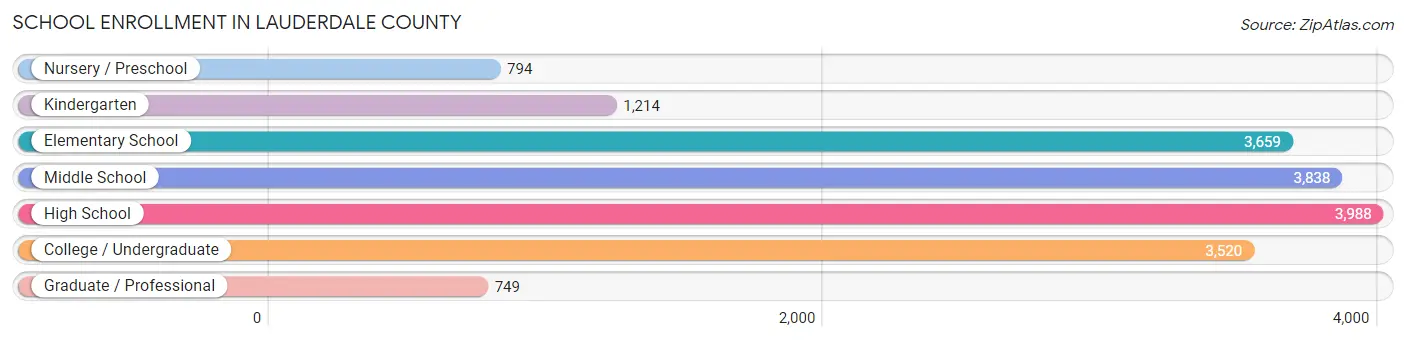
The most common levels of schooling among the 17,762 students in Lauderdale County are high school (3,988 | 22.5%), middle school (3,838 | 21.6%), and elementary school (3,659 | 20.6%).
| School Level | # Students | % Students |
| Nursery / Preschool | 794 | 4.5% |
| Kindergarten | 1,214 | 6.8% |
| Elementary School | 3,659 | 20.6% |
| Middle School | 3,838 | 21.6% |
| High School | 3,988 | 22.5% |
| College / Undergraduate | 3,520 | 19.8% |
| Graduate / Professional | 749 | 4.2% |
| Total | 17,762 | 100.0% |
School Enrollment by Age by Funding Source in Lauderdale County
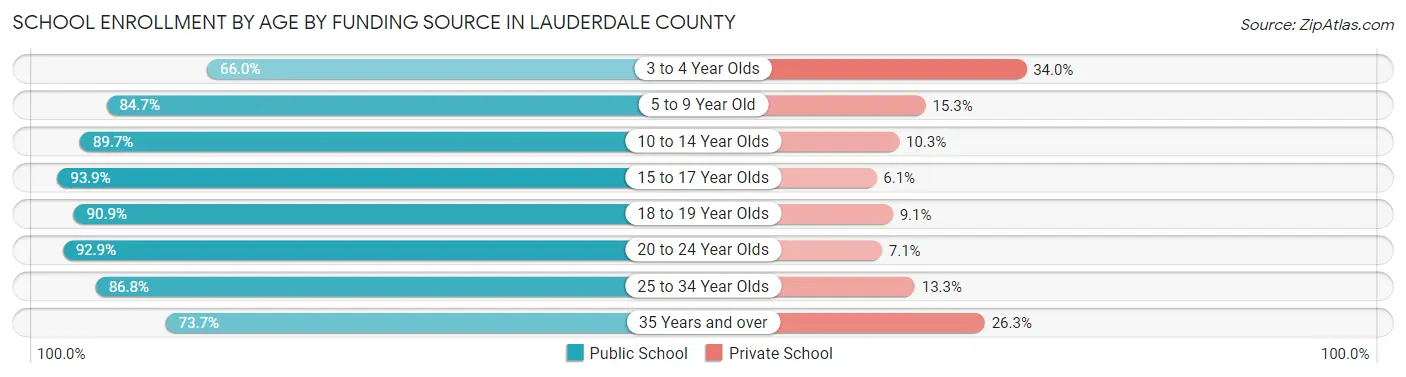
Out of a total of 17,762 students who are enrolled in schools in Lauderdale County, 2,291 (12.9%) attend a private institution, while the remaining 15,471 (87.1%) are enrolled in public schools. The age group of 3 to 4 year olds has the highest likelihood of being enrolled in private schools, with 305 (34.0% in the age bracket) enrolled. Conversely, the age group of 15 to 17 year olds has the lowest likelihood of being enrolled in a private school, with 2,791 (93.9% in the age bracket) attending a public institution.
| Age Bracket | Public School | Private School |
| 3 to 4 Year Olds | 592 (66.0%) | 305 (34.0%) |
| 5 to 9 Year Old | 3,693 (84.7%) | 665 (15.3%) |
| 10 to 14 Year Olds | 4,360 (89.7%) | 501 (10.3%) |
| 15 to 17 Year Olds | 2,791 (93.9%) | 181 (6.1%) |
| 18 to 19 Year Olds | 1,103 (90.9%) | 111 (9.1%) |
| 20 to 24 Year Olds | 1,228 (92.9%) | 94 (7.1%) |
| 25 to 34 Year Olds | 858 (86.8%) | 131 (13.3%) |
| 35 Years and over | 847 (73.7%) | 302 (26.3%) |
| Total | 15,471 (87.1%) | 2,291 (12.9%) |
Educational Attainment by Field of Study in Lauderdale County
Education (2,030 | 18.8%), business (1,856 | 17.1%), science & technology (1,480 | 13.7%), arts & humanities (766 | 7.1%), and liberal arts & history (634 | 5.9%) are the most common fields of study among 10,828 individuals in Lauderdale County who have obtained a bachelor's degree or higher.
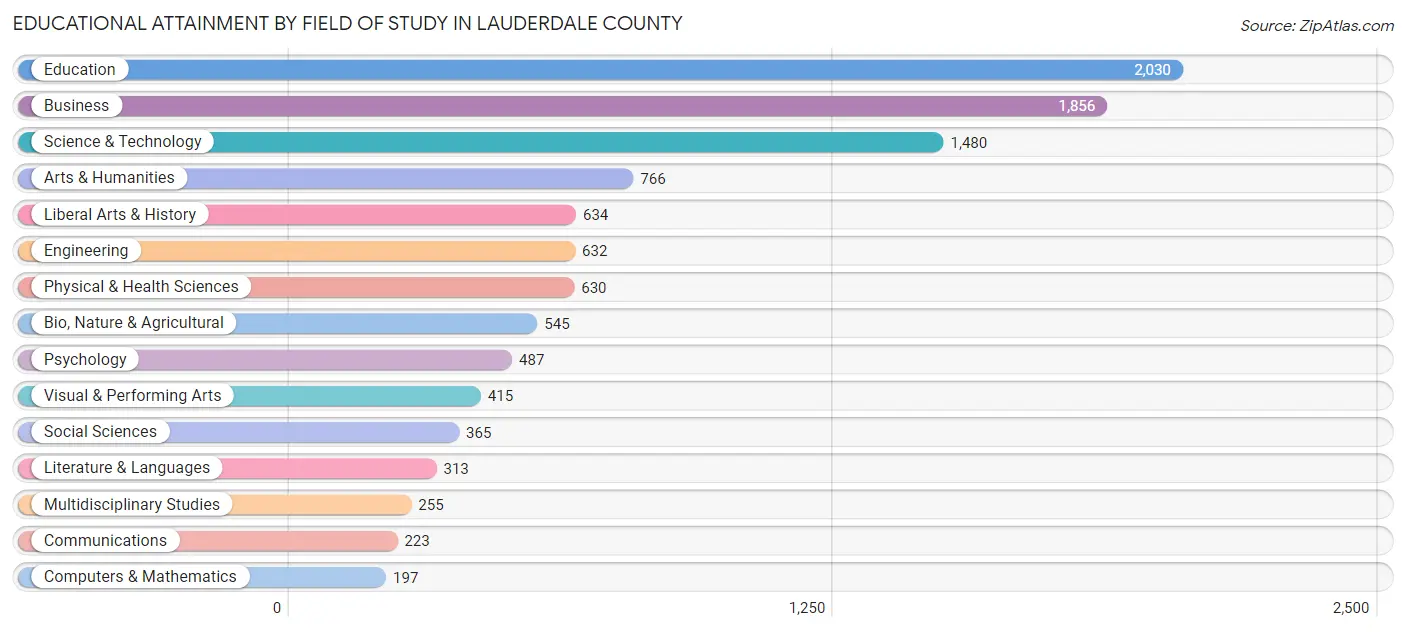
| Field of Study | # Graduates | % Graduates |
| Computers & Mathematics | 197 | 1.8% |
| Bio, Nature & Agricultural | 545 | 5.0% |
| Physical & Health Sciences | 630 | 5.8% |
| Psychology | 487 | 4.5% |
| Social Sciences | 365 | 3.4% |
| Engineering | 632 | 5.8% |
| Multidisciplinary Studies | 255 | 2.4% |
| Science & Technology | 1,480 | 13.7% |
| Business | 1,856 | 17.1% |
| Education | 2,030 | 18.8% |
| Literature & Languages | 313 | 2.9% |
| Liberal Arts & History | 634 | 5.9% |
| Visual & Performing Arts | 415 | 3.8% |
| Communications | 223 | 2.1% |
| Arts & Humanities | 766 | 7.1% |
| Total | 10,828 | 100.0% |
Transportation & Commute in Lauderdale County
Vehicle Availability by Sex in Lauderdale County
The most prevalent vehicle ownership categories in Lauderdale County are males with 2 vehicles (6,332, accounting for 44.1%) and females with 2 vehicles (6,339, making up 42.7%).
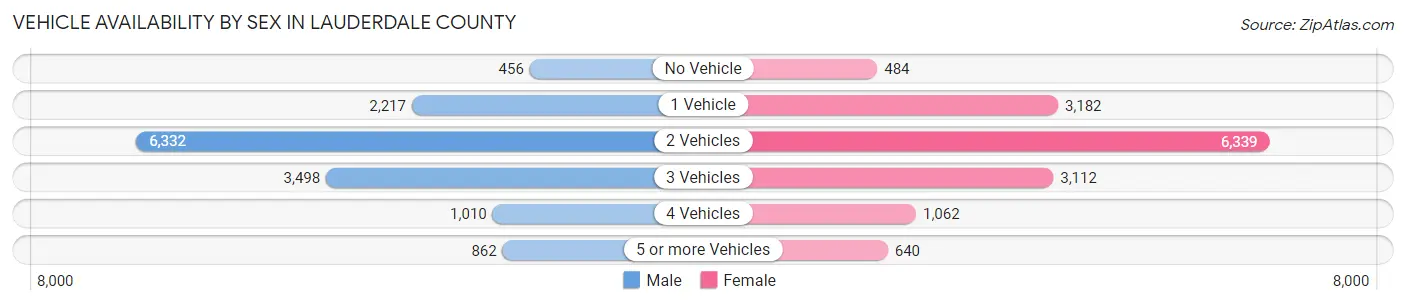
| Vehicles Available | Male | Female |
| No Vehicle | 456 (3.2%) | 484 (3.3%) |
| 1 Vehicle | 2,217 (15.4%) | 3,182 (21.5%) |
| 2 Vehicles | 6,332 (44.1%) | 6,339 (42.8%) |
| 3 Vehicles | 3,498 (24.3%) | 3,112 (21.0%) |
| 4 Vehicles | 1,010 (7.0%) | 1,062 (7.2%) |
| 5 or more Vehicles | 862 (6.0%) | 640 (4.3%) |
| Total | 14,375 (100.0%) | 14,819 (100.0%) |
Commute Time in Lauderdale County
The most frequently occuring commute durations in Lauderdale County are 10 to 14 minutes (6,406 commuters, 22.5%), 20 to 24 minutes (5,312 commuters, 18.7%), and 15 to 19 minutes (5,268 commuters, 18.5%).
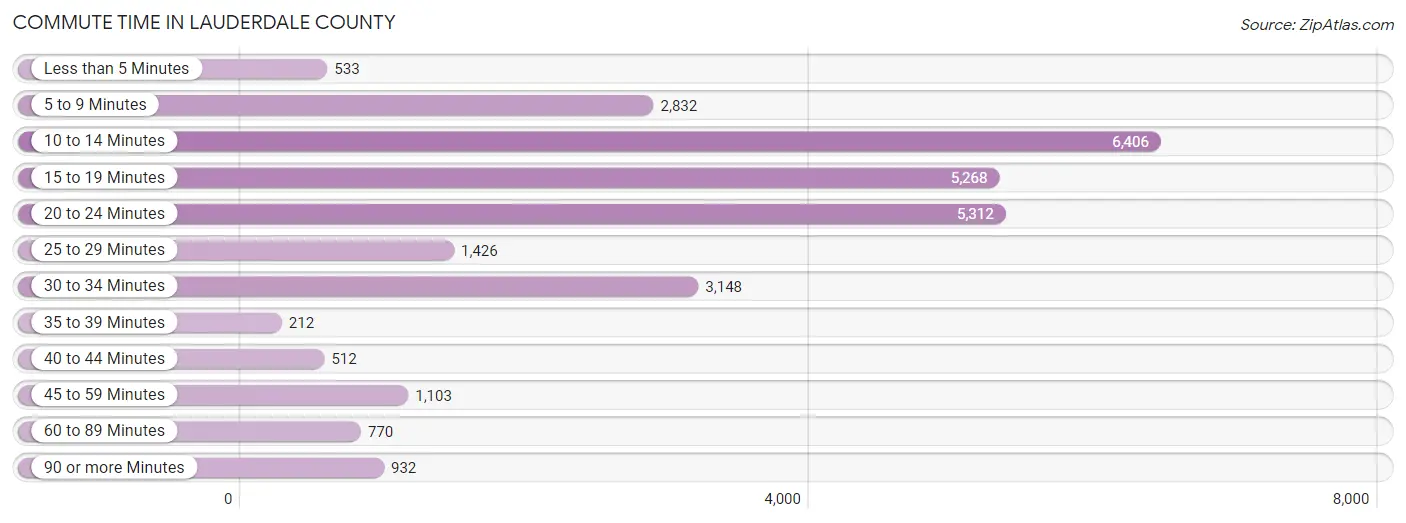
| Commute Time | # Commuters | % Commuters |
| Less than 5 Minutes | 533 | 1.9% |
| 5 to 9 Minutes | 2,832 | 10.0% |
| 10 to 14 Minutes | 6,406 | 22.5% |
| 15 to 19 Minutes | 5,268 | 18.5% |
| 20 to 24 Minutes | 5,312 | 18.7% |
| 25 to 29 Minutes | 1,426 | 5.0% |
| 30 to 34 Minutes | 3,148 | 11.1% |
| 35 to 39 Minutes | 212 | 0.7% |
| 40 to 44 Minutes | 512 | 1.8% |
| 45 to 59 Minutes | 1,103 | 3.9% |
| 60 to 89 Minutes | 770 | 2.7% |
| 90 or more Minutes | 932 | 3.3% |
Commute Time by Sex in Lauderdale County
The most common commute times in Lauderdale County are 20 to 24 minutes (3,151 commuters, 22.1%) for males and 10 to 14 minutes (3,428 commuters, 24.2%) for females.
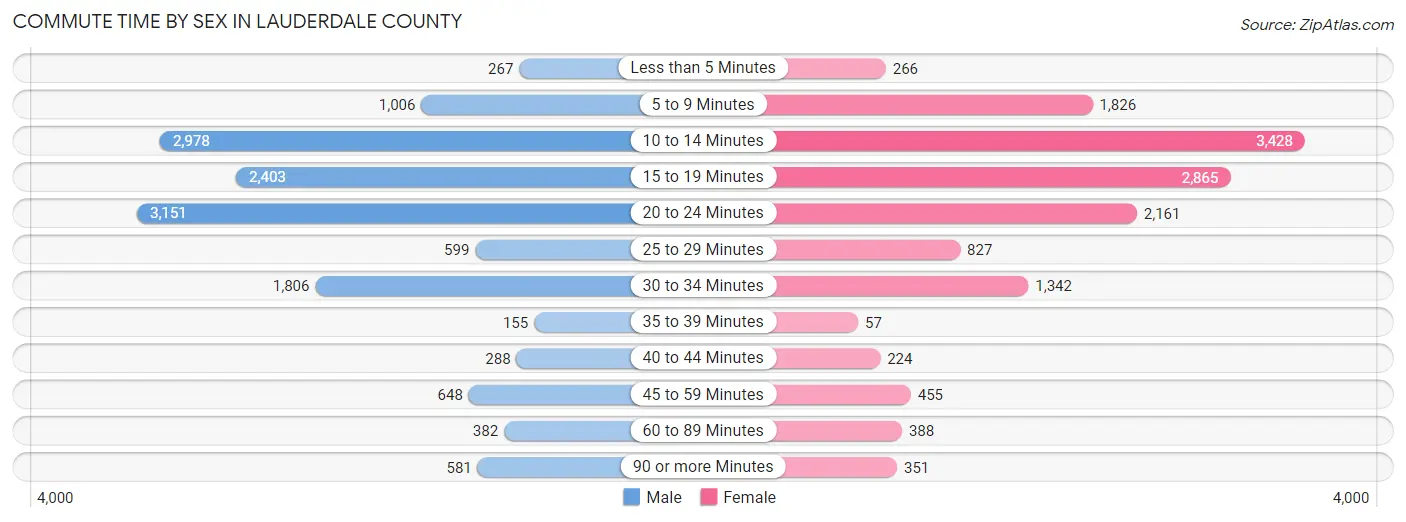
| Commute Time | Male | Female |
| Less than 5 Minutes | 267 (1.9%) | 266 (1.9%) |
| 5 to 9 Minutes | 1,006 (7.0%) | 1,826 (12.9%) |
| 10 to 14 Minutes | 2,978 (20.9%) | 3,428 (24.2%) |
| 15 to 19 Minutes | 2,403 (16.9%) | 2,865 (20.2%) |
| 20 to 24 Minutes | 3,151 (22.1%) | 2,161 (15.2%) |
| 25 to 29 Minutes | 599 (4.2%) | 827 (5.8%) |
| 30 to 34 Minutes | 1,806 (12.7%) | 1,342 (9.5%) |
| 35 to 39 Minutes | 155 (1.1%) | 57 (0.4%) |
| 40 to 44 Minutes | 288 (2.0%) | 224 (1.6%) |
| 45 to 59 Minutes | 648 (4.5%) | 455 (3.2%) |
| 60 to 89 Minutes | 382 (2.7%) | 388 (2.7%) |
| 90 or more Minutes | 581 (4.1%) | 351 (2.5%) |
Time of Departure to Work by Sex in Lauderdale County
The most frequent times of departure to work in Lauderdale County are 6:30 AM to 6:59 AM (2,230, 15.6%) for males and 7:00 AM to 7:29 AM (2,507, 17.7%) for females.
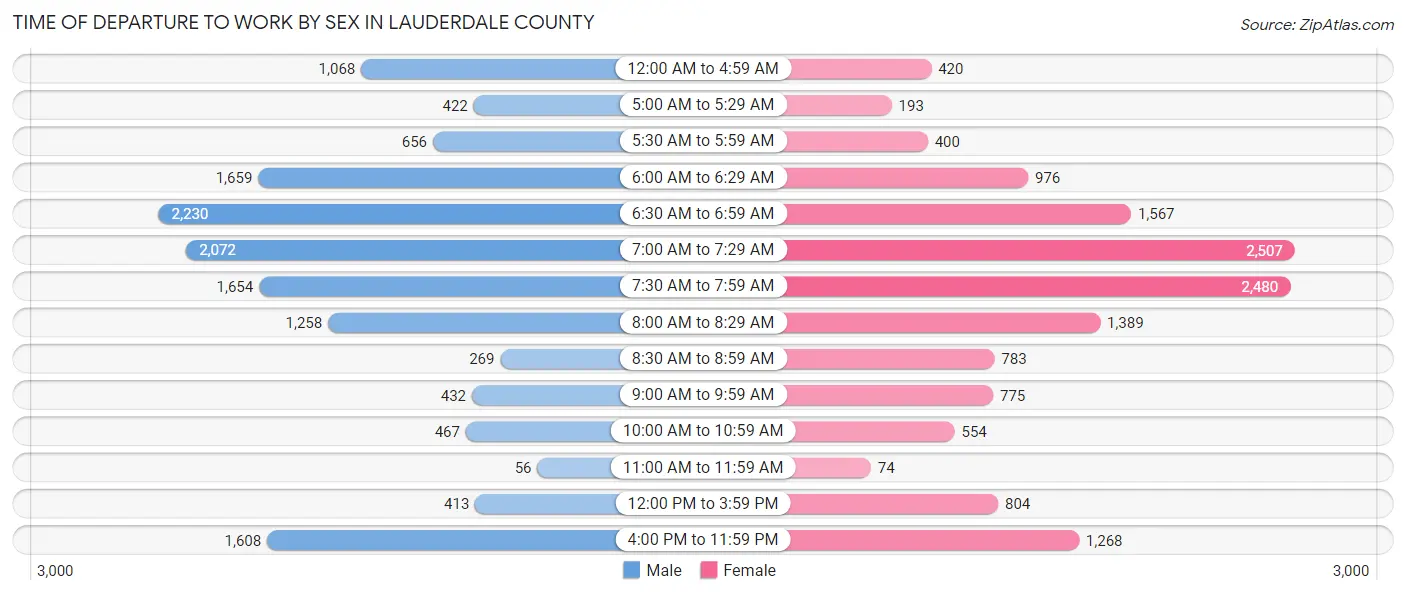
| Time of Departure | Male | Female |
| 12:00 AM to 4:59 AM | 1,068 (7.5%) | 420 (3.0%) |
| 5:00 AM to 5:29 AM | 422 (3.0%) | 193 (1.4%) |
| 5:30 AM to 5:59 AM | 656 (4.6%) | 400 (2.8%) |
| 6:00 AM to 6:29 AM | 1,659 (11.6%) | 976 (6.9%) |
| 6:30 AM to 6:59 AM | 2,230 (15.6%) | 1,567 (11.0%) |
| 7:00 AM to 7:29 AM | 2,072 (14.5%) | 2,507 (17.7%) |
| 7:30 AM to 7:59 AM | 1,654 (11.6%) | 2,480 (17.5%) |
| 8:00 AM to 8:29 AM | 1,258 (8.8%) | 1,389 (9.8%) |
| 8:30 AM to 8:59 AM | 269 (1.9%) | 783 (5.5%) |
| 9:00 AM to 9:59 AM | 432 (3.0%) | 775 (5.5%) |
| 10:00 AM to 10:59 AM | 467 (3.3%) | 554 (3.9%) |
| 11:00 AM to 11:59 AM | 56 (0.4%) | 74 (0.5%) |
| 12:00 PM to 3:59 PM | 413 (2.9%) | 804 (5.7%) |
| 4:00 PM to 11:59 PM | 1,608 (11.3%) | 1,268 (8.9%) |
| Total | 14,264 (100.0%) | 14,190 (100.0%) |
Housing Occupancy in Lauderdale County
Occupancy by Ownership in Lauderdale County
Of the total 28,349 dwellings in Lauderdale County, owner-occupied units account for 17,766 (62.7%), while renter-occupied units make up 10,583 (37.3%).
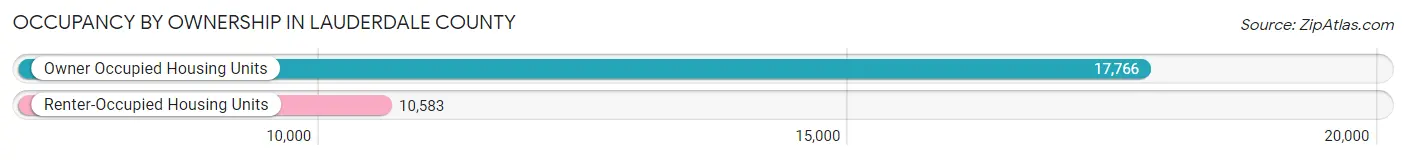
| Occupancy | # Housing Units | % Housing Units |
| Owner Occupied Housing Units | 17,766 | 62.7% |
| Renter-Occupied Housing Units | 10,583 | 37.3% |
| Total Occupied Housing Units | 28,349 | 100.0% |
Occupancy by Household Size in Lauderdale County
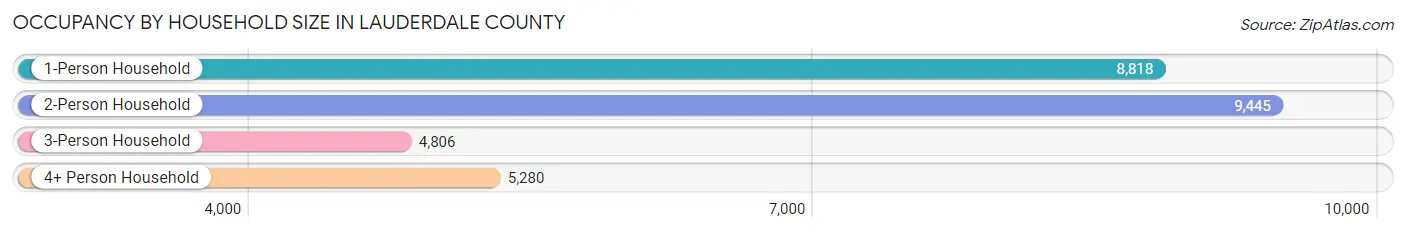
| Household Size | # Housing Units | % Housing Units |
| 1-Person Household | 8,818 | 31.1% |
| 2-Person Household | 9,445 | 33.3% |
| 3-Person Household | 4,806 | 17.0% |
| 4+ Person Household | 5,280 | 18.6% |
| Total Housing Units | 28,349 | 100.0% |
Occupancy by Ownership by Household Size in Lauderdale County
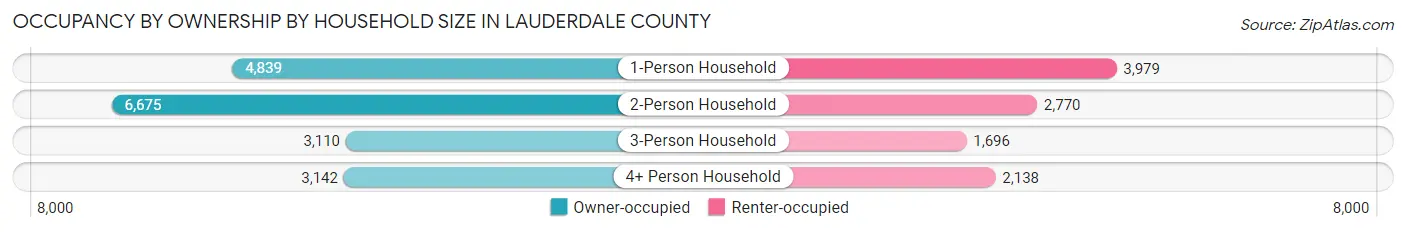
| Household Size | Owner-occupied | Renter-occupied |
| 1-Person Household | 4,839 (54.9%) | 3,979 (45.1%) |
| 2-Person Household | 6,675 (70.7%) | 2,770 (29.3%) |
| 3-Person Household | 3,110 (64.7%) | 1,696 (35.3%) |
| 4+ Person Household | 3,142 (59.5%) | 2,138 (40.5%) |
| Total Housing Units | 17,766 (62.7%) | 10,583 (37.3%) |
Occupancy by Educational Attainment in Lauderdale County
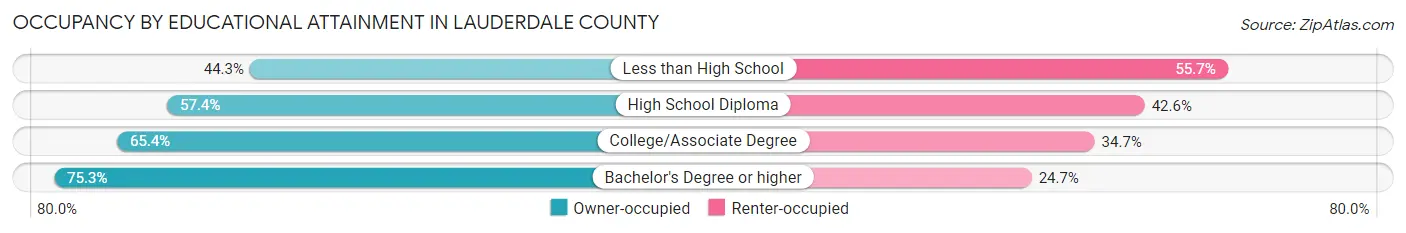
| Household Size | Owner-occupied | Renter-occupied |
| Less than High School | 1,623 (44.3%) | 2,042 (55.7%) |
| High School Diploma | 4,372 (57.4%) | 3,245 (42.6%) |
| College/Associate Degree | 7,109 (65.3%) | 3,769 (34.6%) |
| Bachelor's Degree or higher | 4,662 (75.3%) | 1,527 (24.7%) |
Occupancy by Age of Householder in Lauderdale County
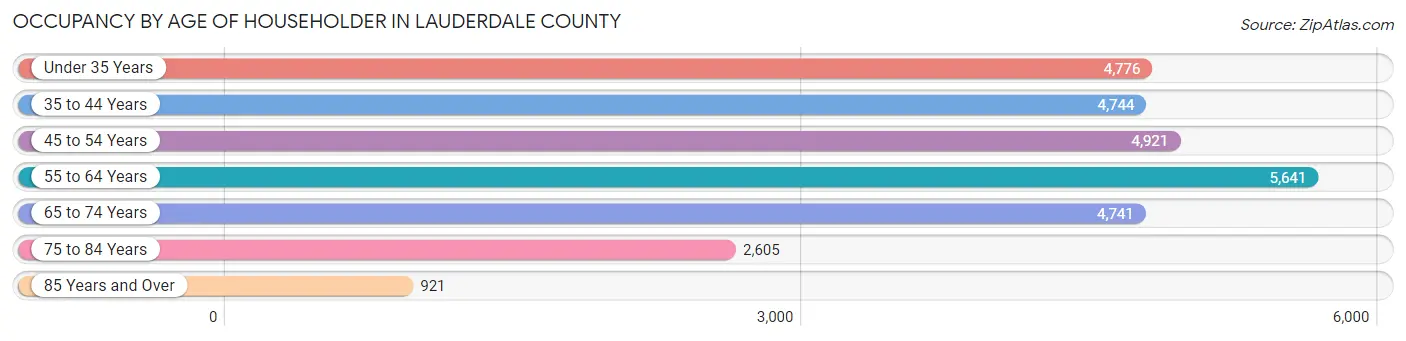
| Age Bracket | # Households | % Households |
| Under 35 Years | 4,776 | 16.9% |
| 35 to 44 Years | 4,744 | 16.7% |
| 45 to 54 Years | 4,921 | 17.4% |
| 55 to 64 Years | 5,641 | 19.9% |
| 65 to 74 Years | 4,741 | 16.7% |
| 75 to 84 Years | 2,605 | 9.2% |
| 85 Years and Over | 921 | 3.3% |
| Total | 28,349 | 100.0% |
Housing Finances in Lauderdale County
Median Income by Occupancy in Lauderdale County
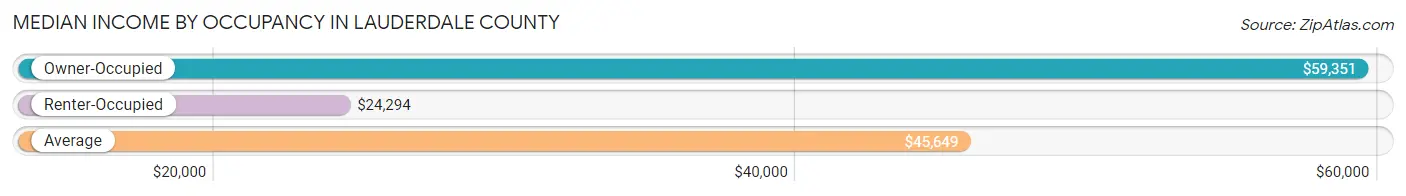
| Occupancy Type | # Households | Median Income |
| Owner-Occupied | 17,766 (62.7%) | $59,351 |
| Renter-Occupied | 10,583 (37.3%) | $24,294 |
| Average | 28,349 (100.0%) | $45,649 |
Occupancy by Householder Income Bracket in Lauderdale County
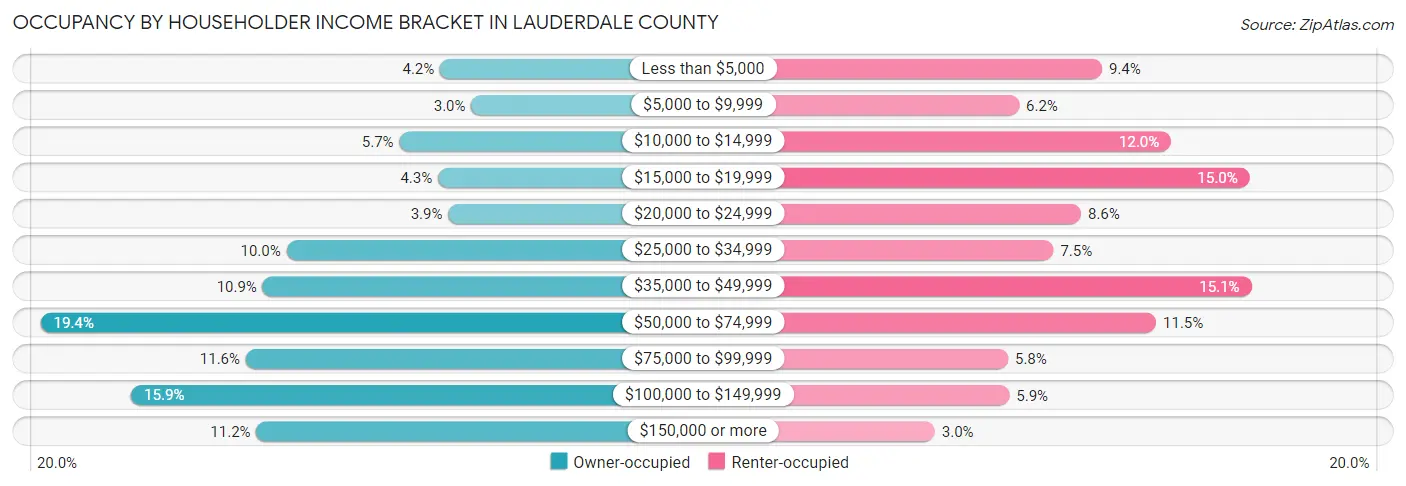
| Income Bracket | Owner-occupied | Renter-occupied |
| Less than $5,000 | 740 (4.2%) | 994 (9.4%) |
| $5,000 to $9,999 | 530 (3.0%) | 659 (6.2%) |
| $10,000 to $14,999 | 1,016 (5.7%) | 1,272 (12.0%) |
| $15,000 to $19,999 | 755 (4.3%) | 1,588 (15.0%) |
| $20,000 to $24,999 | 686 (3.9%) | 909 (8.6%) |
| $25,000 to $34,999 | 1,780 (10.0%) | 798 (7.5%) |
| $35,000 to $49,999 | 1,942 (10.9%) | 1,596 (15.1%) |
| $50,000 to $74,999 | 3,444 (19.4%) | 1,212 (11.5%) |
| $75,000 to $99,999 | 2,056 (11.6%) | 615 (5.8%) |
| $100,000 to $149,999 | 2,832 (15.9%) | 620 (5.9%) |
| $150,000 or more | 1,985 (11.2%) | 320 (3.0%) |
| Total | 17,766 (100.0%) | 10,583 (100.0%) |
Monthly Housing Cost Tiers in Lauderdale County
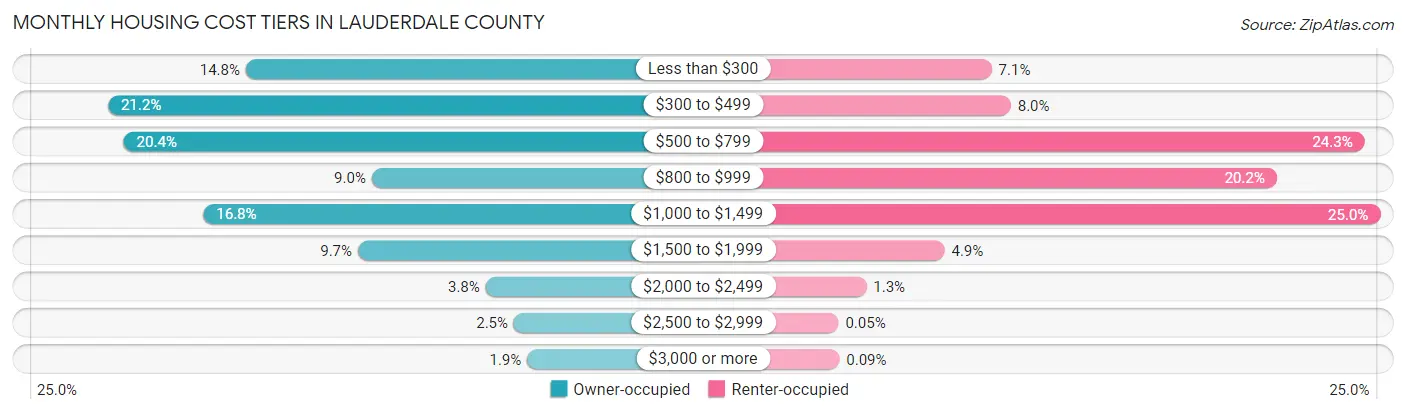
| Monthly Cost | Owner-occupied | Renter-occupied |
| Less than $300 | 2,633 (14.8%) | 751 (7.1%) |
| $300 to $499 | 3,759 (21.2%) | 845 (8.0%) |
| $500 to $799 | 3,632 (20.4%) | 2,567 (24.3%) |
| $800 to $999 | 1,603 (9.0%) | 2,140 (20.2%) |
| $1,000 to $1,499 | 2,979 (16.8%) | 2,644 (25.0%) |
| $1,500 to $1,999 | 1,716 (9.7%) | 522 (4.9%) |
| $2,000 to $2,499 | 672 (3.8%) | 141 (1.3%) |
| $2,500 to $2,999 | 440 (2.5%) | 5 (0.1%) |
| $3,000 or more | 332 (1.9%) | 10 (0.1%) |
| Total | 17,766 (100.0%) | 10,583 (100.0%) |
Physical Housing Characteristics in Lauderdale County
Housing Structures in Lauderdale County
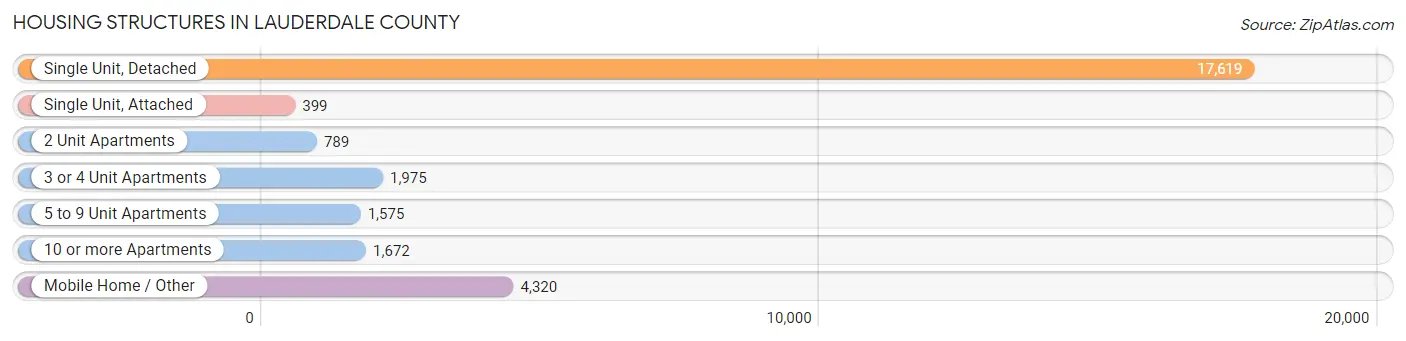
| Structure Type | # Housing Units | % Housing Units |
| Single Unit, Detached | 17,619 | 62.2% |
| Single Unit, Attached | 399 | 1.4% |
| 2 Unit Apartments | 789 | 2.8% |
| 3 or 4 Unit Apartments | 1,975 | 7.0% |
| 5 to 9 Unit Apartments | 1,575 | 5.6% |
| 10 or more Apartments | 1,672 | 5.9% |
| Mobile Home / Other | 4,320 | 15.2% |
| Total | 28,349 | 100.0% |
Housing Structures by Occupancy in Lauderdale County
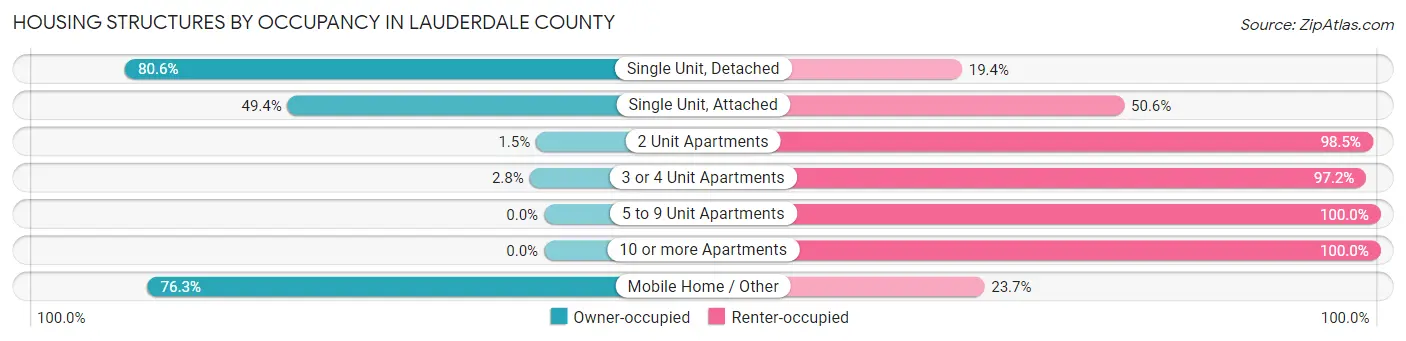
| Structure Type | Owner-occupied | Renter-occupied |
| Single Unit, Detached | 14,206 (80.6%) | 3,413 (19.4%) |
| Single Unit, Attached | 197 (49.4%) | 202 (50.6%) |
| 2 Unit Apartments | 12 (1.5%) | 777 (98.5%) |
| 3 or 4 Unit Apartments | 55 (2.8%) | 1,920 (97.2%) |
| 5 to 9 Unit Apartments | 0 (0.0%) | 1,575 (100.0%) |
| 10 or more Apartments | 0 (0.0%) | 1,672 (100.0%) |
| Mobile Home / Other | 3,296 (76.3%) | 1,024 (23.7%) |
| Total | 17,766 (62.7%) | 10,583 (37.3%) |
Housing Structures by Number of Rooms in Lauderdale County
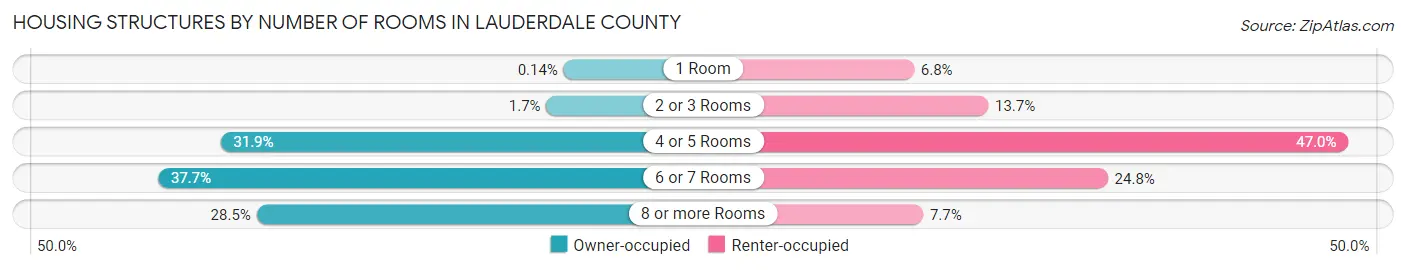
| Number of Rooms | Owner-occupied | Renter-occupied |
| 1 Room | 24 (0.1%) | 724 (6.8%) |
| 2 or 3 Rooms | 310 (1.7%) | 1,450 (13.7%) |
| 4 or 5 Rooms | 5,666 (31.9%) | 4,976 (47.0%) |
| 6 or 7 Rooms | 6,695 (37.7%) | 2,620 (24.8%) |
| 8 or more Rooms | 5,071 (28.5%) | 813 (7.7%) |
| Total | 17,766 (100.0%) | 10,583 (100.0%) |
Housing Structure by Heating Type in Lauderdale County
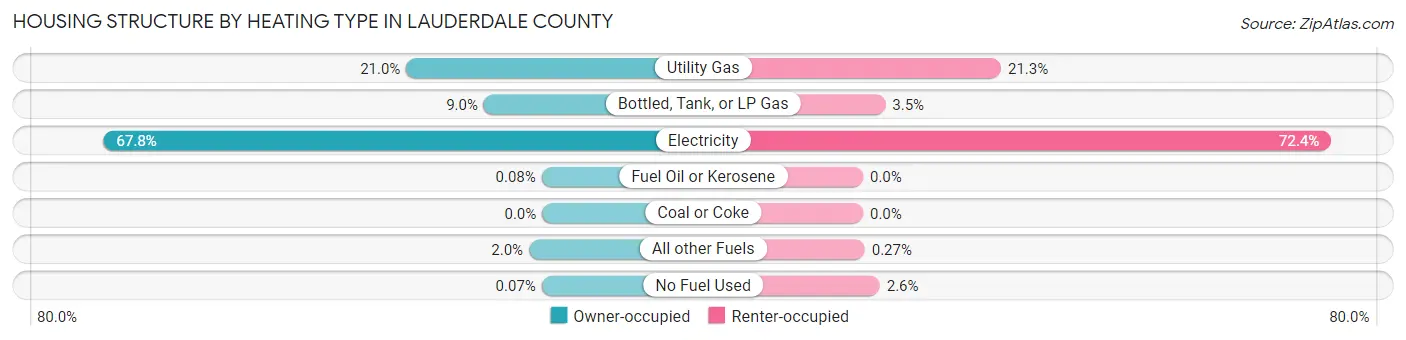
| Heating Type | Owner-occupied | Renter-occupied |
| Utility Gas | 3,732 (21.0%) | 2,257 (21.3%) |
| Bottled, Tank, or LP Gas | 1,601 (9.0%) | 365 (3.5%) |
| Electricity | 12,047 (67.8%) | 7,658 (72.4%) |
| Fuel Oil or Kerosene | 14 (0.1%) | 0 (0.0%) |
| Coal or Coke | 0 (0.0%) | 0 (0.0%) |
| All other Fuels | 360 (2.0%) | 29 (0.3%) |
| No Fuel Used | 12 (0.1%) | 274 (2.6%) |
| Total | 17,766 (100.0%) | 10,583 (100.0%) |
Household Vehicle Usage in Lauderdale County
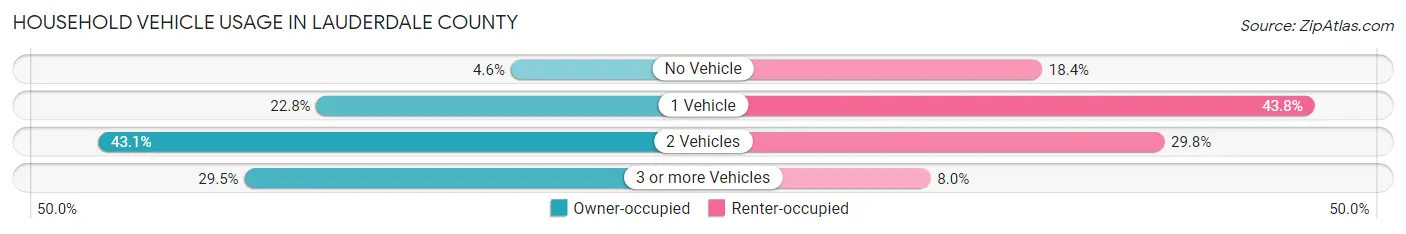
| Vehicles per Household | Owner-occupied | Renter-occupied |
| No Vehicle | 820 (4.6%) | 1,946 (18.4%) |
| 1 Vehicle | 4,043 (22.8%) | 4,639 (43.8%) |
| 2 Vehicles | 7,665 (43.1%) | 3,153 (29.8%) |
| 3 or more Vehicles | 5,238 (29.5%) | 845 (8.0%) |
| Total | 17,766 (100.0%) | 10,583 (100.0%) |
Real Estate & Mortgages in Lauderdale County
Real Estate and Mortgage Overview in Lauderdale County
| Characteristic | Without Mortgage | With Mortgage |
| Housing Units | 9,306 | 8,460 |
| Median Property Value | $93,400 | $167,200 |
| Median Household Income | $48,787 | $1,100 |
| Monthly Housing Costs | $404 | $282 |
| Real Estate Taxes | $810 | $1,203 |
Property Value by Mortgage Status in Lauderdale County
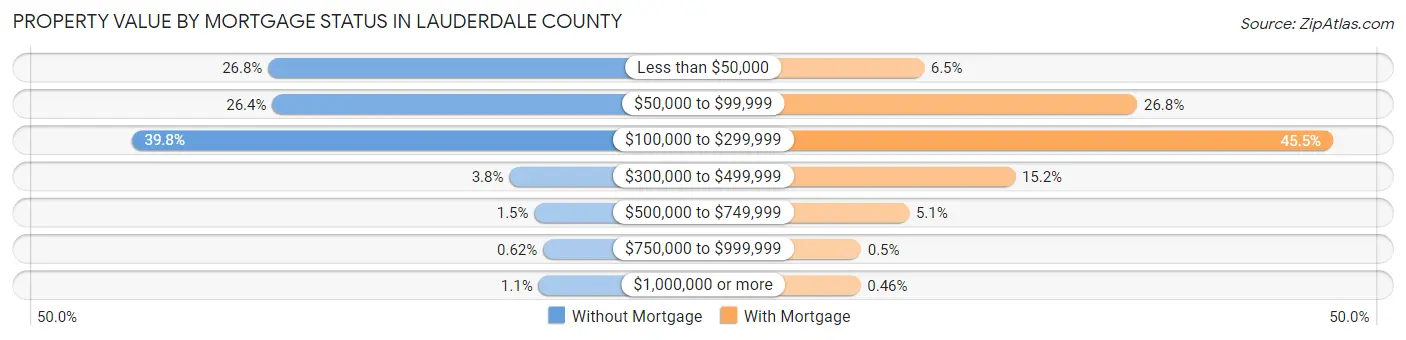
| Property Value | Without Mortgage | With Mortgage |
| Less than $50,000 | 2,494 (26.8%) | 550 (6.5%) |
| $50,000 to $99,999 | 2,458 (26.4%) | 2,268 (26.8%) |
| $100,000 to $299,999 | 3,705 (39.8%) | 3,846 (45.5%) |
| $300,000 to $499,999 | 357 (3.8%) | 1,284 (15.2%) |
| $500,000 to $749,999 | 135 (1.5%) | 431 (5.1%) |
| $750,000 to $999,999 | 58 (0.6%) | 42 (0.5%) |
| $1,000,000 or more | 99 (1.1%) | 39 (0.5%) |
| Total | 9,306 (100.0%) | 8,460 (100.0%) |
Household Income by Mortgage Status in Lauderdale County
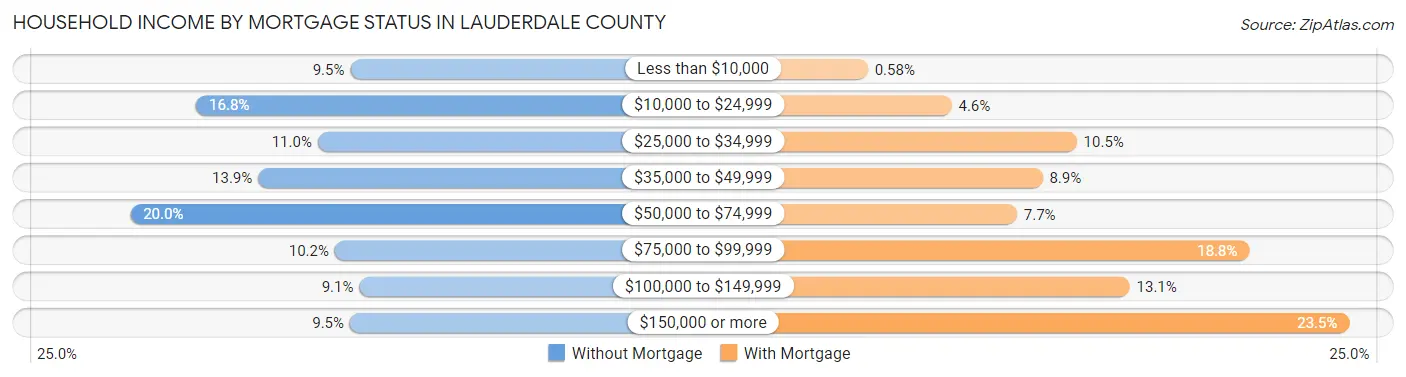
| Household Income | Without Mortgage | With Mortgage |
| Less than $10,000 | 883 (9.5%) | 49 (0.6%) |
| $10,000 to $24,999 | 1,566 (16.8%) | 387 (4.6%) |
| $25,000 to $34,999 | 1,027 (11.0%) | 891 (10.5%) |
| $35,000 to $49,999 | 1,292 (13.9%) | 753 (8.9%) |
| $50,000 to $74,999 | 1,858 (20.0%) | 650 (7.7%) |
| $75,000 to $99,999 | 952 (10.2%) | 1,586 (18.8%) |
| $100,000 to $149,999 | 843 (9.1%) | 1,104 (13.1%) |
| $150,000 or more | 885 (9.5%) | 1,989 (23.5%) |
| Total | 9,306 (100.0%) | 8,460 (100.0%) |
Property Value to Household Income Ratio in Lauderdale County
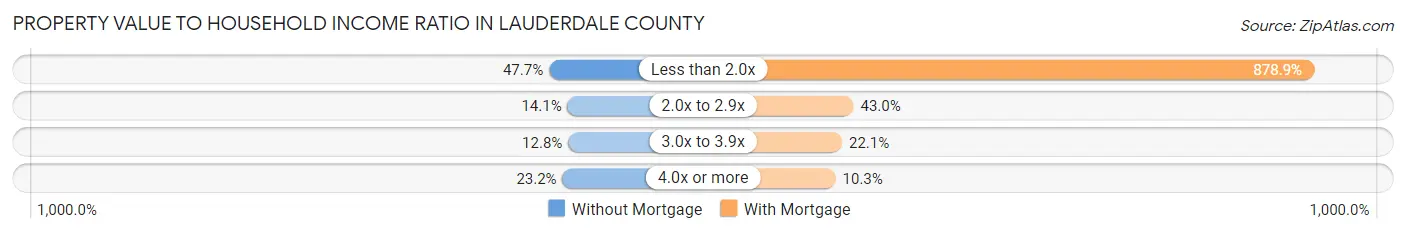
| Value-to-Income Ratio | Without Mortgage | With Mortgage |
| Less than 2.0x | 4,437 (47.7%) | 74,353 (878.9%) |
| 2.0x to 2.9x | 1,310 (14.1%) | 3,636 (43.0%) |
| 3.0x to 3.9x | 1,193 (12.8%) | 1,867 (22.1%) |
| 4.0x or more | 2,162 (23.2%) | 873 (10.3%) |
| Total | 9,306 (100.0%) | 8,460 (100.0%) |
Real Estate Taxes by Mortgage Status in Lauderdale County
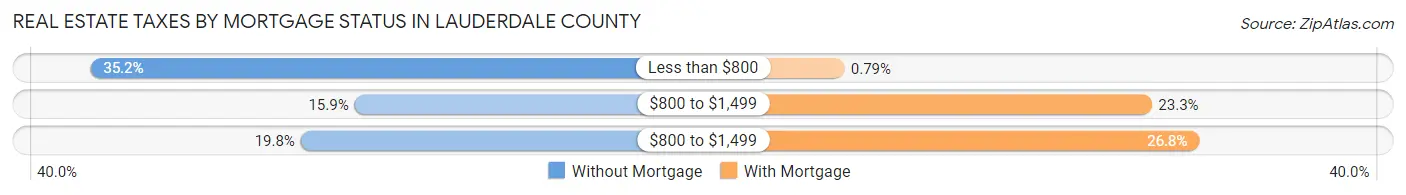
| Property Taxes | Without Mortgage | With Mortgage |
| Less than $800 | 3,276 (35.2%) | 67 (0.8%) |
| $800 to $1,499 | 1,480 (15.9%) | 1,968 (23.3%) |
| $800 to $1,499 | 1,845 (19.8%) | 2,264 (26.8%) |
| Total | 9,306 (100.0%) | 8,460 (100.0%) |
Health & Disability in Lauderdale County
Health Insurance Coverage by Age in Lauderdale County
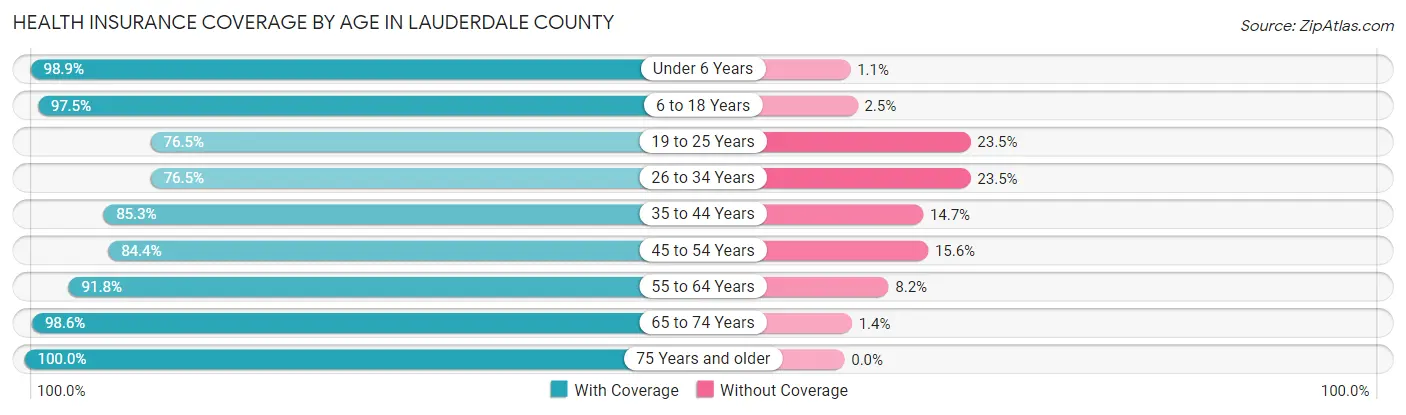
| Age Bracket | With Coverage | Without Coverage |
| Under 6 Years | 5,146 (98.9%) | 58 (1.1%) |
| 6 to 18 Years | 12,346 (97.5%) | 312 (2.5%) |
| 19 to 25 Years | 4,138 (76.5%) | 1,272 (23.5%) |
| 26 to 34 Years | 6,092 (76.5%) | 1,873 (23.5%) |
| 35 to 44 Years | 7,117 (85.3%) | 1,224 (14.7%) |
| 45 to 54 Years | 7,064 (84.4%) | 1,306 (15.6%) |
| 55 to 64 Years | 8,280 (91.8%) | 742 (8.2%) |
| 65 to 74 Years | 7,349 (98.6%) | 103 (1.4%) |
| 75 Years and older | 5,042 (100.0%) | 0 (0.0%) |
| Total | 62,574 (90.1%) | 6,890 (9.9%) |
Health Insurance Coverage by Citizenship Status in Lauderdale County
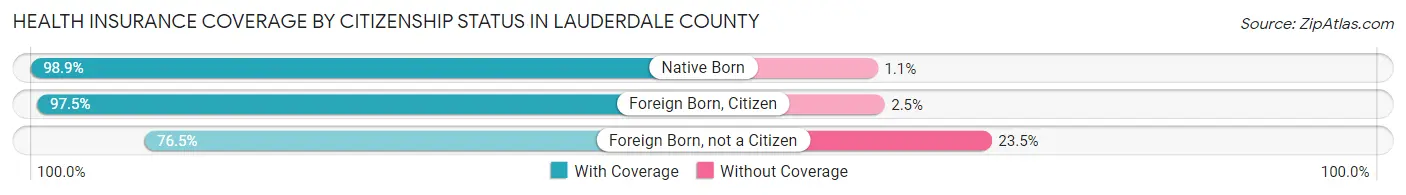
| Citizenship Status | With Coverage | Without Coverage |
| Native Born | 5,146 (98.9%) | 58 (1.1%) |
| Foreign Born, Citizen | 12,346 (97.5%) | 312 (2.5%) |
| Foreign Born, not a Citizen | 4,138 (76.5%) | 1,272 (23.5%) |
Health Insurance Coverage by Household Income in Lauderdale County
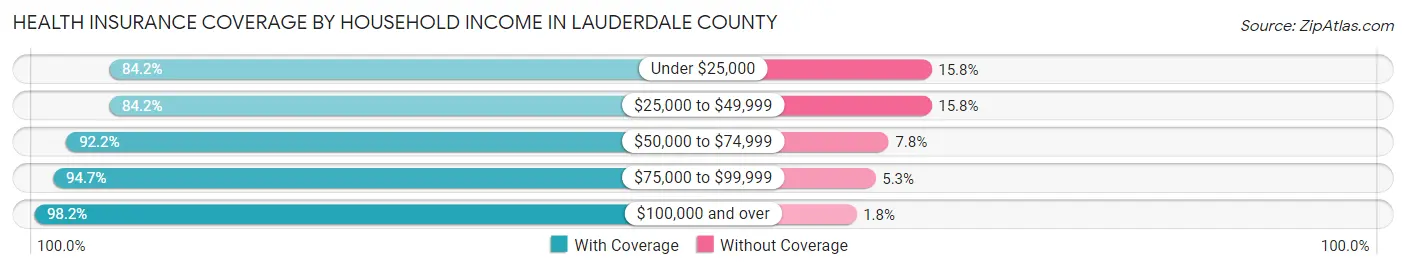
| Household Income | With Coverage | Without Coverage |
| Under $25,000 | 14,594 (84.2%) | 2,744 (15.8%) |
| $25,000 to $49,999 | 12,980 (84.2%) | 2,441 (15.8%) |
| $50,000 to $74,999 | 10,723 (92.2%) | 908 (7.8%) |
| $75,000 to $99,999 | 6,929 (94.7%) | 391 (5.3%) |
| $100,000 and over | 16,956 (98.2%) | 303 (1.8%) |
Public vs Private Health Insurance Coverage by Age in Lauderdale County
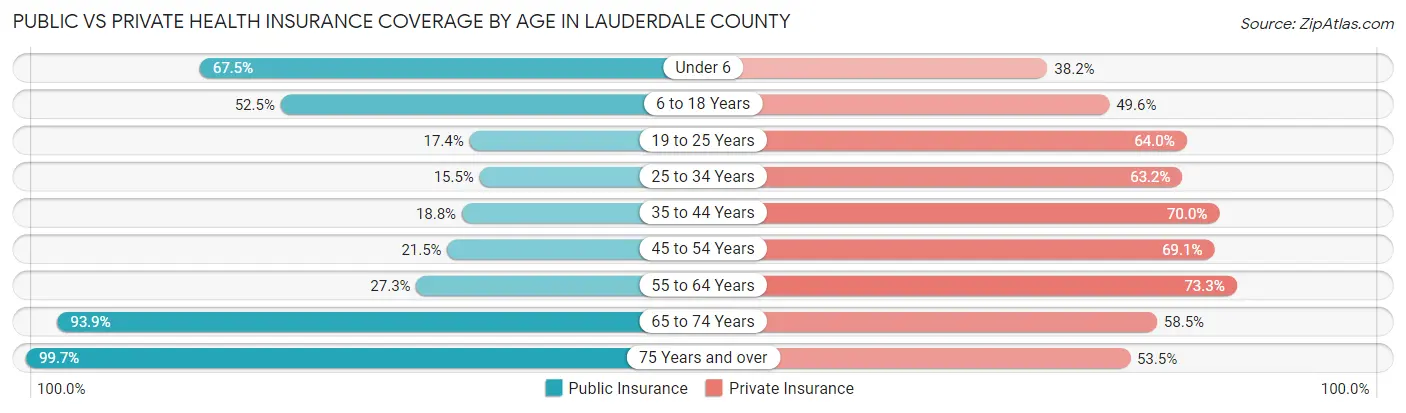
| Age Bracket | Public Insurance | Private Insurance |
| Under 6 | 3,511 (67.5%) | 1,986 (38.2%) |
| 6 to 18 Years | 6,640 (52.5%) | 6,283 (49.6%) |
| 19 to 25 Years | 942 (17.4%) | 3,461 (64.0%) |
| 25 to 34 Years | 1,237 (15.5%) | 5,033 (63.2%) |
| 35 to 44 Years | 1,570 (18.8%) | 5,842 (70.0%) |
| 45 to 54 Years | 1,800 (21.5%) | 5,785 (69.1%) |
| 55 to 64 Years | 2,461 (27.3%) | 6,609 (73.3%) |
| 65 to 74 Years | 6,999 (93.9%) | 4,359 (58.5%) |
| 75 Years and over | 5,029 (99.7%) | 2,697 (53.5%) |
| Total | 30,189 (43.5%) | 42,055 (60.5%) |
Disability Status by Sex by Age in Lauderdale County
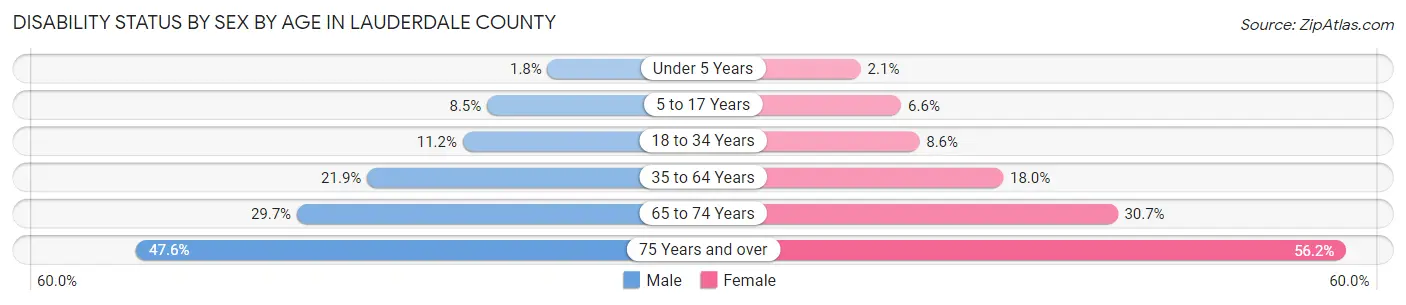
| Age Bracket | Male | Female |
| Under 5 Years | 38 (1.8%) | 46 (2.1%) |
| 5 to 17 Years | 559 (8.5%) | 405 (6.6%) |
| 18 to 34 Years | 757 (11.2%) | 640 (8.6%) |
| 35 to 64 Years | 2,575 (21.8%) | 2,505 (18.0%) |
| 65 to 74 Years | 1,004 (29.7%) | 1,249 (30.7%) |
| 75 Years and over | 929 (47.6%) | 1,735 (56.2%) |
Disability Class by Sex by Age in Lauderdale County
Disability Class: Hearing Difficulty
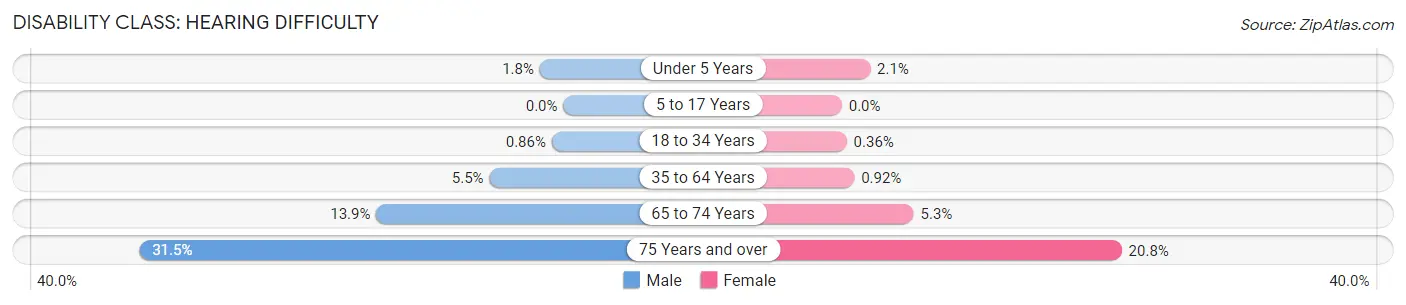
| Age Bracket | Male | Female |
| Under 5 Years | 38 (1.8%) | 46 (2.1%) |
| 5 to 17 Years | 0 (0.0%) | 0 (0.0%) |
| 18 to 34 Years | 58 (0.9%) | 27 (0.4%) |
| 35 to 64 Years | 647 (5.5%) | 128 (0.9%) |
| 65 to 74 Years | 470 (13.9%) | 217 (5.3%) |
| 75 Years and over | 615 (31.5%) | 642 (20.8%) |
Disability Class: Vision Difficulty
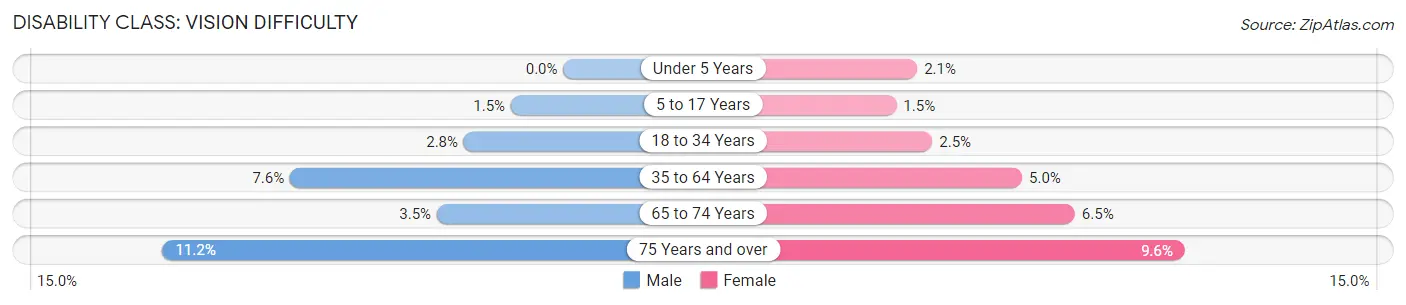
| Age Bracket | Male | Female |
| Under 5 Years | 0 (0.0%) | 46 (2.1%) |
| 5 to 17 Years | 96 (1.5%) | 93 (1.5%) |
| 18 to 34 Years | 187 (2.8%) | 187 (2.5%) |
| 35 to 64 Years | 897 (7.6%) | 700 (5.0%) |
| 65 to 74 Years | 119 (3.5%) | 264 (6.5%) |
| 75 Years and over | 218 (11.2%) | 295 (9.6%) |
Disability Class: Cognitive Difficulty
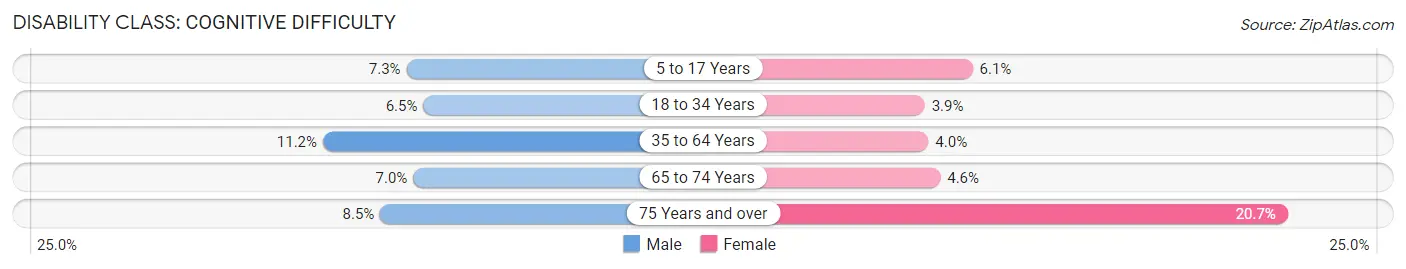
| Age Bracket | Male | Female |
| 5 to 17 Years | 479 (7.3%) | 372 (6.1%) |
| 18 to 34 Years | 439 (6.5%) | 286 (3.8%) |
| 35 to 64 Years | 1,315 (11.2%) | 561 (4.0%) |
| 65 to 74 Years | 236 (7.0%) | 186 (4.6%) |
| 75 Years and over | 166 (8.5%) | 639 (20.7%) |
Disability Class: Ambulatory Difficulty
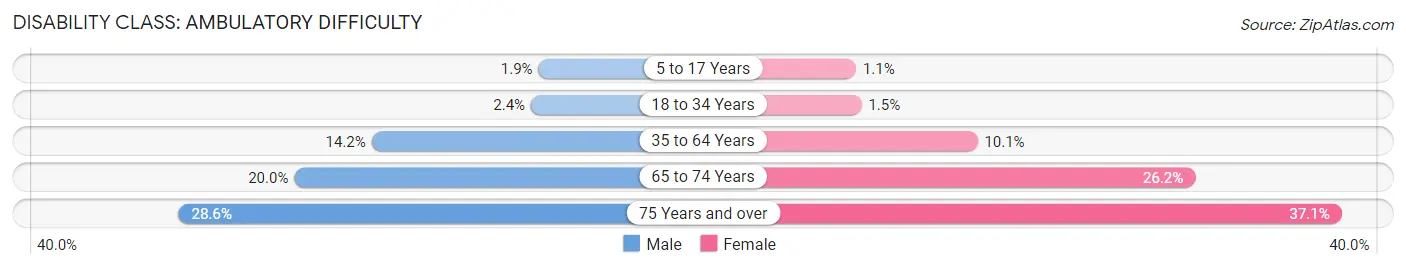
| Age Bracket | Male | Female |
| 5 to 17 Years | 122 (1.8%) | 64 (1.1%) |
| 18 to 34 Years | 163 (2.4%) | 108 (1.5%) |
| 35 to 64 Years | 1,678 (14.2%) | 1,404 (10.1%) |
| 65 to 74 Years | 676 (20.0%) | 1,067 (26.2%) |
| 75 Years and over | 558 (28.6%) | 1,146 (37.1%) |
Disability Class: Self-Care Difficulty
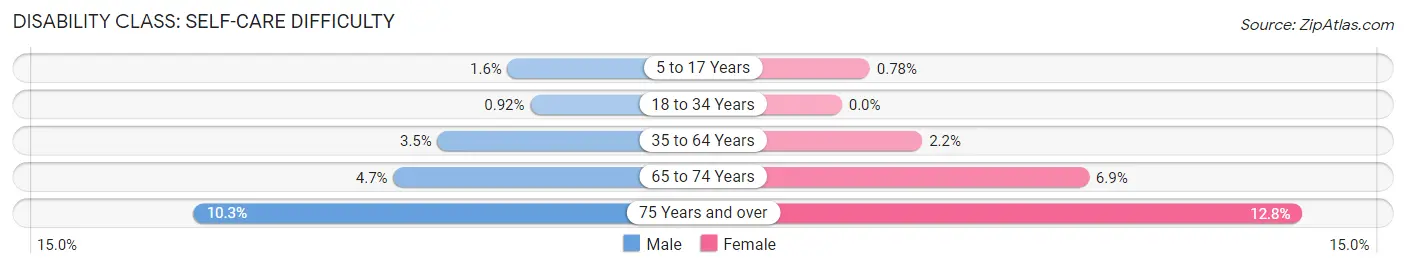
| Age Bracket | Male | Female |
| 5 to 17 Years | 102 (1.5%) | 48 (0.8%) |
| 18 to 34 Years | 62 (0.9%) | 0 (0.0%) |
| 35 to 64 Years | 413 (3.5%) | 312 (2.2%) |
| 65 to 74 Years | 160 (4.7%) | 280 (6.9%) |
| 75 Years and over | 201 (10.3%) | 396 (12.8%) |
Technology Access in Lauderdale County
Computing Device Access in Lauderdale County
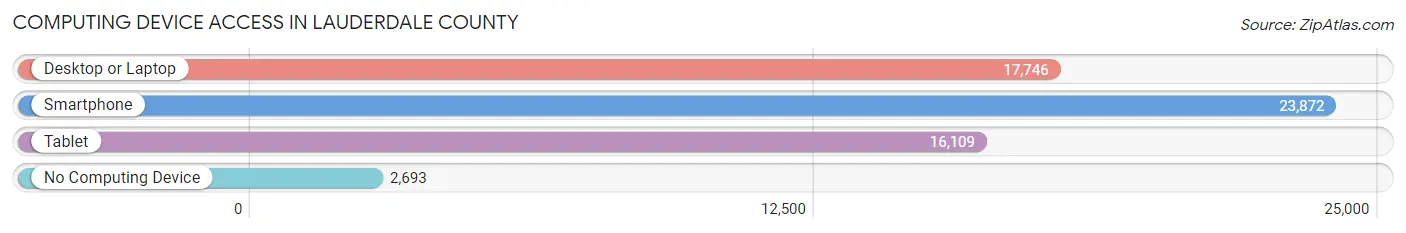
| Device Type | # Households | % Households |
| Desktop or Laptop | 17,746 | 62.6% |
| Smartphone | 23,872 | 84.2% |
| Tablet | 16,109 | 56.8% |
| No Computing Device | 2,693 | 9.5% |
| Total | 28,349 | 100.0% |
Internet Access in Lauderdale County
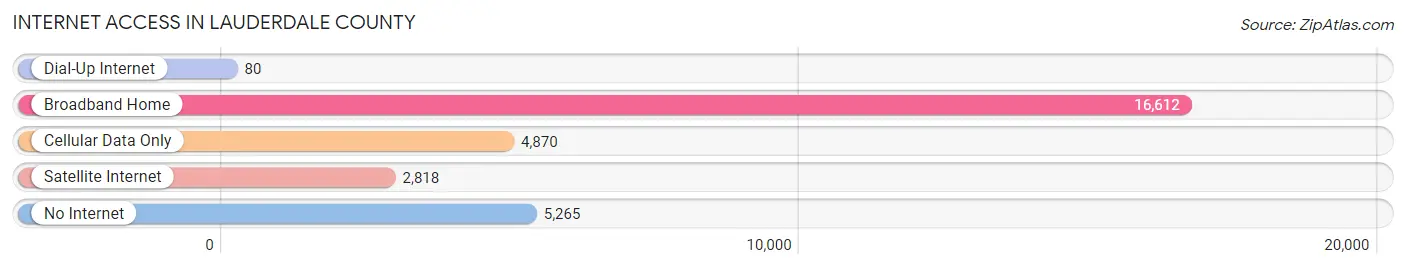
| Internet Type | # Households | % Households |
| Dial-Up Internet | 80 | 0.3% |
| Broadband Home | 16,612 | 58.6% |
| Cellular Data Only | 4,870 | 17.2% |
| Satellite Internet | 2,818 | 9.9% |
| No Internet | 5,265 | 18.6% |
| Total | 28,349 | 100.0% |
Lauderdale County Summary
Lauderdale County is located in the state of Mississippi, in the United States of America. It is bordered by the states of Alabama to the east, and Tennessee to the north. The county seat is Meridian, and the county has a population of approximately 80,000 people.
History
Lauderdale County was established in 1833, and was named after Colonel James Lauderdale, who was a soldier in the War of 1812. The county was originally part of the Choctaw Nation, and was part of the Treaty of Dancing Rabbit Creek in 1830, which ceded the land to the United States. The county was then divided into two parts, with the western part becoming Lauderdale County, and the eastern part becoming Clarke County.
The county was largely agricultural in its early years, with cotton being the main crop. The county was also home to several large plantations, and the economy was largely based on the labor of enslaved African Americans. After the Civil War, the county's economy shifted to timber and lumber production, and the county was home to several sawmills.
In the late 19th century, the county began to develop a manufacturing sector, and the city of Meridian became an important railroad hub. The city was also home to several large factories, including a cotton mill, a shoe factory, and a furniture factory.
Geography
Lauderdale County is located in the southeastern part of Mississippi, and is bordered by the states of Alabama to the east, and Tennessee to the north. The county is located in the East Gulf Coastal Plain region, and is mostly flat, with some rolling hills in the northern part of the county. The county is drained by the Tombigbee River, which flows through the county from north to south.
The county has a total area of 845 square miles, and is home to several state parks, including Paul B. Johnson State Park, and Noxubee National Wildlife Refuge. The county is also home to several lakes, including Lake Pushmataha, and Lake Lamar Bruce.
Economy
Lauderdale County has a diverse economy, with a mix of manufacturing, agriculture, and services. The county is home to several large manufacturing companies, including a paper mill, a furniture factory, and a shoe factory. The county is also home to several agricultural operations, including poultry farms, and cattle ranches.
The county is also home to several service-based businesses, including healthcare, retail, and hospitality. The county is home to several hospitals, including Anderson Regional Medical Center, and Rush Foundation Hospital. The county is also home to several shopping centers, and several hotels and restaurants.
Demographics
As of the 2010 census, the population of Lauderdale County was 79,926. The population is largely white, with African Americans making up the largest minority group. The median household income in the county is $41,945, and the median age is 38.7 years. The county has a poverty rate of 19.3%, and the unemployment rate is 6.2%.
Common Questions
What is Per Capita Income in Lauderdale County?
Per Capita income in Lauderdale County is $26,590.
What is the Median Family Income in Lauderdale County?
Median Family Income in Lauderdale County is $59,610.
What is the Median Household income in Lauderdale County?
Median Household Income in Lauderdale County is $45,649.
What is Income or Wage Gap in Lauderdale County?
Income or Wage Gap in Lauderdale County is 31.3%.
Women in Lauderdale County earn 68.7 cents for every dollar earned by a man.
What is Family Income Deficit in Lauderdale County?
Family Income Deficit in Lauderdale County is $10,418.
Families that are below poverty line in Lauderdale County earn $10,418 less on average than the poverty threshold level.
What is Inequality or Gini Index in Lauderdale County?
Inequality or Gini Index in Lauderdale County is 0.51.
What is the Total Population of Lauderdale County?
Total Population of Lauderdale County is 72,741.
What is the Total Male Population of Lauderdale County?
Total Male Population of Lauderdale County is 35,314.
What is the Total Female Population of Lauderdale County?
Total Female Population of Lauderdale County is 37,427.
What is the Ratio of Males per 100 Females in Lauderdale County?
There are 94.35 Males per 100 Females in Lauderdale County.
What is the Ratio of Females per 100 Males in Lauderdale County?
There are 105.98 Females per 100 Males in Lauderdale County.
What is the Median Population Age in Lauderdale County?
Median Population Age in Lauderdale County is 38.5 Years.
What is the Average Family Size in Lauderdale County
Average Family Size in Lauderdale County is 3.1 People.
What is the Average Household Size in Lauderdale County
Average Household Size in Lauderdale County is 2.5 People.
How Large is the Labor Force in Lauderdale County?
There are 31,697 People in the Labor Forcein in Lauderdale County.
What is the Percentage of People in the Labor Force in Lauderdale County?
55.1% of People are in the Labor Force in Lauderdale County.
What is the Unemployment Rate in Lauderdale County?
Unemployment Rate in Lauderdale County is 5.5%.