Hinds County, MS Map & Demographics
Hinds County Map
Hinds County Overview
$27,943
PER CAPITA INCOME
$62,295
AVG FAMILY INCOME
$48,596
AVG HOUSEHOLD INCOME
21.1%
WAGE / INCOME GAP [ % ]
78.9¢/ $1
WAGE / INCOME GAP [ $ ]
$10,946
FAMILY INCOME DEFICIT
0.48
INEQUALITY / GINI INDEX
226,541
TOTAL POPULATION
106,310
MALE POPULATION
120,231
FEMALE POPULATION
88.42
MALES / 100 FEMALES
113.09
FEMALES / 100 MALES
36.1
MEDIAN AGE
3.2
AVG FAMILY SIZE
2.4
AVG HOUSEHOLD SIZE
107,785
LABOR FORCE [ PEOPLE ]
60.1%
PERCENT IN LABOR FORCE
7.8%
UNEMPLOYMENT RATE
Income in Hinds County
Income Overview in Hinds County
Per Capita Income in Hinds County is $27,943, while median incomes of families and households are $62,295 and $48,596 respectively.
| Characteristic | Number | Measure |
| Per Capita Income | 226,541 | $27,943 |
| Median Family Income | 54,269 | $62,295 |
| Mean Family Income | 54,269 | $83,889 |
| Median Household Income | 89,585 | $48,596 |
| Mean Household Income | 89,585 | $68,871 |
| Income Deficit | 54,269 | $10,946 |
| Wage / Income Gap (%) | 226,541 | 21.05% |
| Wage / Income Gap ($) | 226,541 | 78.95¢ per $1 |
| Gini / Inequality Index | 226,541 | 0.48 |
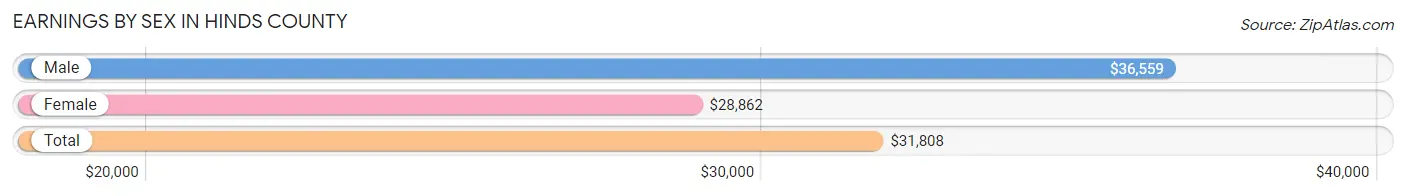
Earnings by Sex in Hinds County
Average Earnings in Hinds County are $31,808, $36,559 for men and $28,862 for women, a difference of 21.0%.
| Sex | Number | Average Earnings |
| Male | 51,886 (47.0%) | $36,559 |
| Female | 58,512 (53.0%) | $28,862 |
| Total | 110,398 (100.0%) | $31,808 |
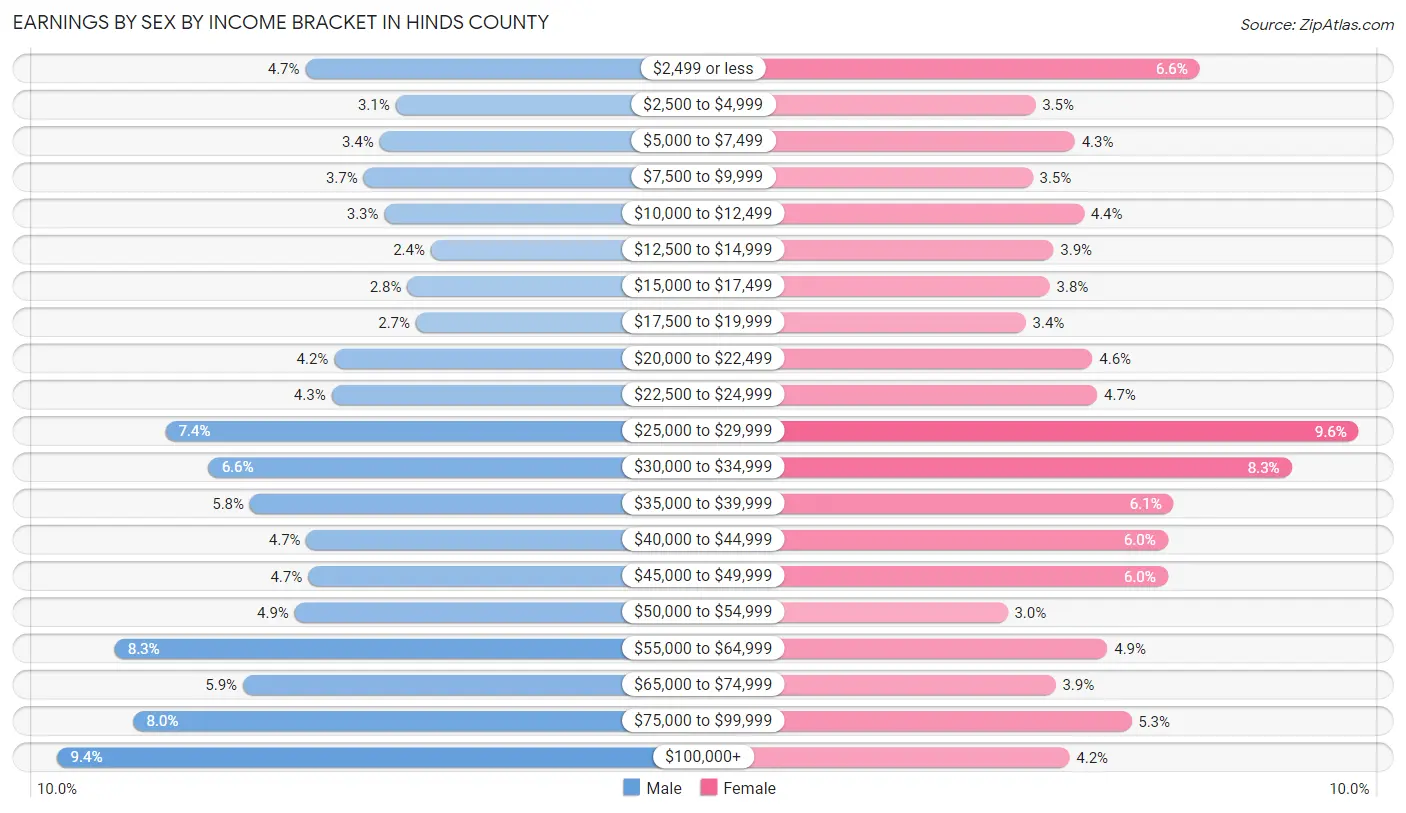
Earnings by Sex by Income Bracket in Hinds County
The most common earnings brackets in Hinds County are $100,000+ for men (4,869 | 9.4%) and $25,000 to $29,999 for women (5,614 | 9.6%).
| Income | Male | Female |
| $2,499 or less | 2,457 (4.7%) | 3,866 (6.6%) |
| $2,500 to $4,999 | 1,585 (3.0%) | 2,063 (3.5%) |
| $5,000 to $7,499 | 1,737 (3.4%) | 2,496 (4.3%) |
| $7,500 to $9,999 | 1,893 (3.6%) | 2,037 (3.5%) |
| $10,000 to $12,499 | 1,690 (3.3%) | 2,596 (4.4%) |
| $12,500 to $14,999 | 1,240 (2.4%) | 2,264 (3.9%) |
| $15,000 to $17,499 | 1,468 (2.8%) | 2,222 (3.8%) |
| $17,500 to $19,999 | 1,384 (2.7%) | 1,963 (3.4%) |
| $20,000 to $22,499 | 2,181 (4.2%) | 2,690 (4.6%) |
| $22,500 to $24,999 | 2,203 (4.3%) | 2,747 (4.7%) |
| $25,000 to $29,999 | 3,819 (7.4%) | 5,614 (9.6%) |
| $30,000 to $34,999 | 3,401 (6.6%) | 4,873 (8.3%) |
| $35,000 to $39,999 | 2,999 (5.8%) | 3,582 (6.1%) |
| $40,000 to $44,999 | 2,449 (4.7%) | 3,518 (6.0%) |
| $45,000 to $49,999 | 2,436 (4.7%) | 3,514 (6.0%) |
| $50,000 to $54,999 | 2,564 (4.9%) | 1,763 (3.0%) |
| $55,000 to $64,999 | 4,312 (8.3%) | 2,853 (4.9%) |
| $65,000 to $74,999 | 3,067 (5.9%) | 2,289 (3.9%) |
| $75,000 to $99,999 | 4,132 (8.0%) | 3,121 (5.3%) |
| $100,000+ | 4,869 (9.4%) | 2,441 (4.2%) |
| Total | 51,886 (100.0%) | 58,512 (100.0%) |
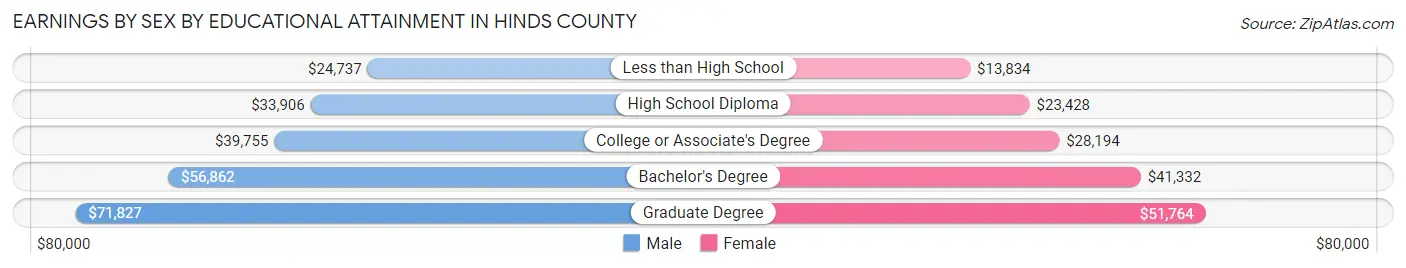
Earnings by Sex by Educational Attainment in Hinds County
Average earnings in Hinds County are $42,002 for men and $32,121 for women, a difference of 23.5%. Men with an educational attainment of graduate degree enjoy the highest average annual earnings of $71,827, while those with less than high school education earn the least with $24,737. Women with an educational attainment of graduate degree earn the most with the average annual earnings of $51,764, while those with less than high school education have the smallest earnings of $13,834.
| Educational Attainment | Male Income | Female Income |
| Less than High School | $24,737 | $13,834 |
| High School Diploma | $33,906 | $23,428 |
| College or Associate's Degree | $39,755 | $28,194 |
| Bachelor's Degree | $56,862 | $41,332 |
| Graduate Degree | $71,827 | $51,764 |
| Total | $42,002 | $32,121 |
Family Income in Hinds County
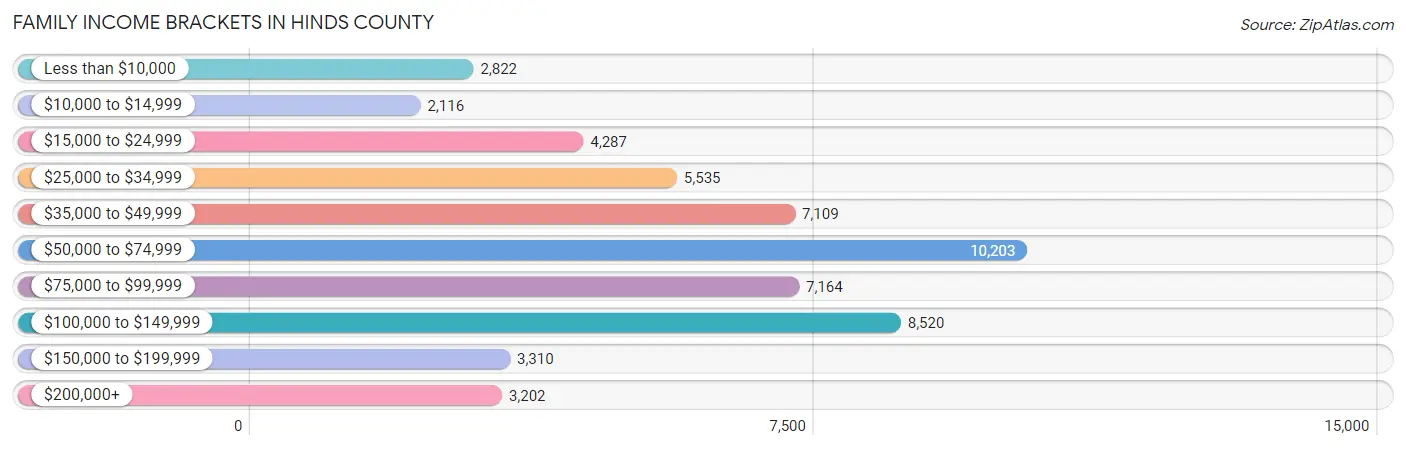
Family Income Brackets in Hinds County
According to the Hinds County family income data, there are 10,203 families falling into the $50,000 to $74,999 income range, which is the most common income bracket and makes up 18.8% of all families. Conversely, the $10,000 to $14,999 income bracket is the least frequent group with only 2,116 families (3.9%) belonging to this category.
| Income Bracket | # Families | % Families |
| Less than $10,000 | 2,822 | 5.2% |
| $10,000 to $14,999 | 2,116 | 3.9% |
| $15,000 to $24,999 | 4,287 | 7.9% |
| $25,000 to $34,999 | 5,535 | 10.2% |
| $35,000 to $49,999 | 7,109 | 13.1% |
| $50,000 to $74,999 | 10,203 | 18.8% |
| $75,000 to $99,999 | 7,164 | 13.2% |
| $100,000 to $149,999 | 8,520 | 15.7% |
| $150,000 to $199,999 | 3,310 | 6.1% |
| $200,000+ | 3,202 | 5.9% |
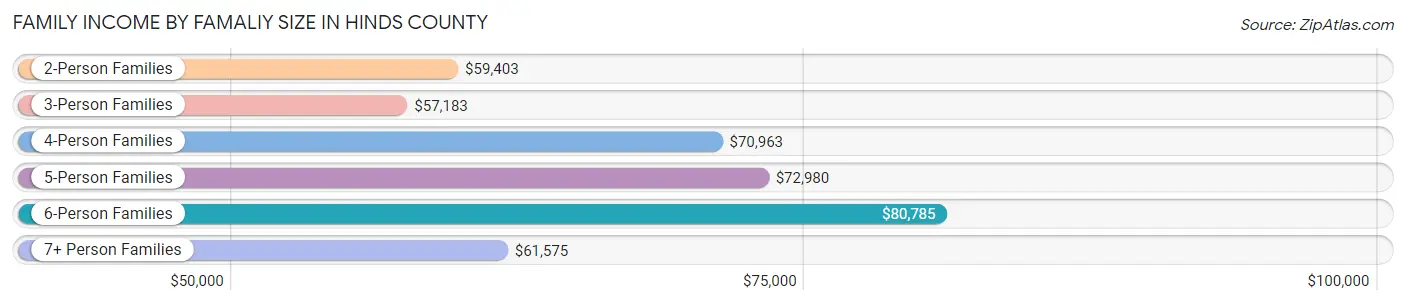
Family Income by Famaliy Size in Hinds County
6-person families (1,133 | 2.1%) account for the highest median family income in Hinds County with $80,785 per family, while 2-person families (24,601 | 45.3%) have the highest median income of $29,702 per family member.
| Income Bracket | # Families | Median Income |
| 2-Person Families | 24,601 (45.3%) | $59,403 |
| 3-Person Families | 14,265 (26.3%) | $57,183 |
| 4-Person Families | 8,814 (16.2%) | $70,963 |
| 5-Person Families | 4,431 (8.2%) | $72,980 |
| 6-Person Families | 1,133 (2.1%) | $80,785 |
| 7+ Person Families | 1,025 (1.9%) | $61,575 |
| Total | 54,269 (100.0%) | $62,295 |
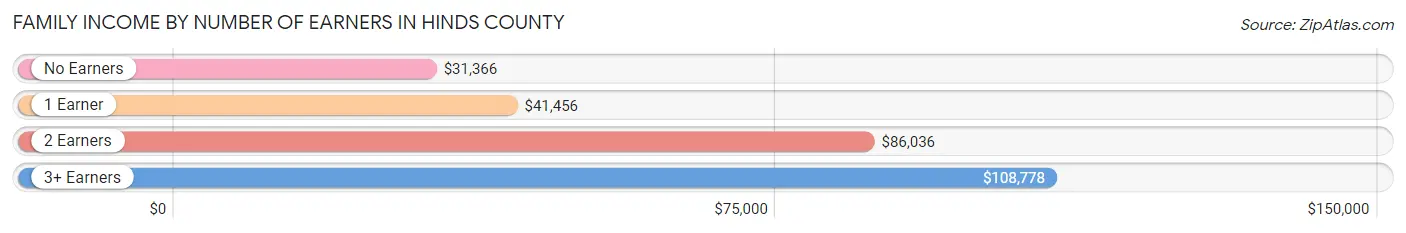
Family Income by Number of Earners in Hinds County
The median family income in Hinds County is $62,295, with families comprising 3+ earners (5,529) having the highest median family income of $108,778, while families with no earners (7,944) have the lowest median family income of $31,366, accounting for 10.2% and 14.6% of families, respectively.
| Number of Earners | # Families | Median Income |
| No Earners | 7,944 (14.6%) | $31,366 |
| 1 Earner | 21,521 (39.7%) | $41,456 |
| 2 Earners | 19,275 (35.5%) | $86,036 |
| 3+ Earners | 5,529 (10.2%) | $108,778 |
| Total | 54,269 (100.0%) | $62,295 |
Household Income in Hinds County
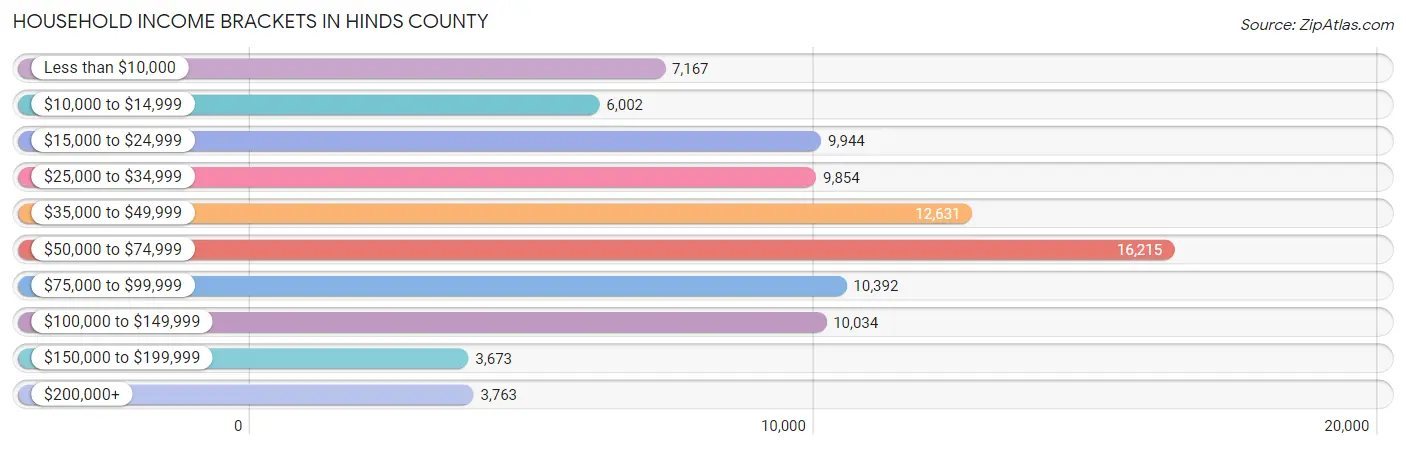
Household Income Brackets in Hinds County
With 16,215 households falling in the category, the $50,000 to $74,999 income range is the most frequent in Hinds County, accounting for 18.1% of all households. In contrast, only 3,673 households (4.1%) fall into the $150,000 to $199,999 income bracket, making it the least populous group.
| Income Bracket | # Households | % Households |
| Less than $10,000 | 7,167 | 8.0% |
| $10,000 to $14,999 | 6,002 | 6.7% |
| $15,000 to $24,999 | 9,944 | 11.1% |
| $25,000 to $34,999 | 9,854 | 11.0% |
| $35,000 to $49,999 | 12,631 | 14.1% |
| $50,000 to $74,999 | 16,215 | 18.1% |
| $75,000 to $99,999 | 10,392 | 11.6% |
| $100,000 to $149,999 | 10,034 | 11.2% |
| $150,000 to $199,999 | 3,673 | 4.1% |
| $200,000+ | 3,763 | 4.2% |
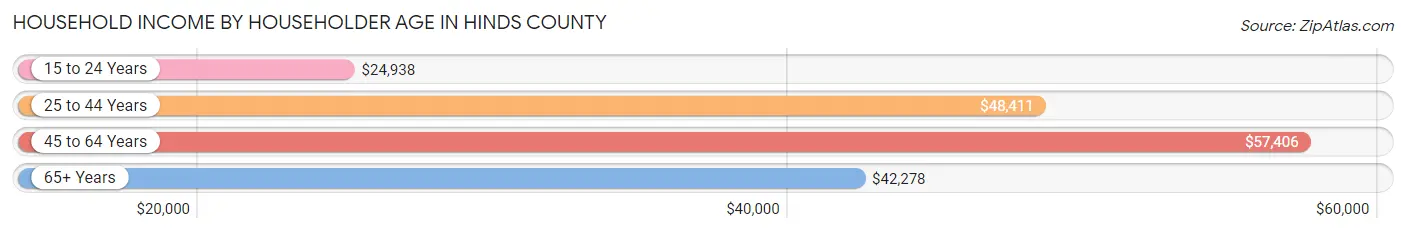
Household Income by Householder Age in Hinds County
The median household income in Hinds County is $48,596, with the highest median household income of $57,406 found in the 45 to 64 years age bracket for the primary householder. A total of 33,051 households (36.9%) fall into this category. Meanwhile, the 15 to 24 years age bracket for the primary householder has the lowest median household income of $24,938, with 3,059 households (3.4%) in this group.
| Income Bracket | # Households | Median Income |
| 15 to 24 Years | 3,059 (3.4%) | $24,938 |
| 25 to 44 Years | 30,741 (34.3%) | $48,411 |
| 45 to 64 Years | 33,051 (36.9%) | $57,406 |
| 65+ Years | 22,734 (25.4%) | $42,278 |
| Total | 89,585 (100.0%) | $48,596 |
Poverty in Hinds County
Income Below Poverty by Sex and Age in Hinds County
With 19.4% poverty level for males and 22.5% for females among the residents of Hinds County, 6 to 11 year old males and 5 year old females are the most vulnerable to poverty, with 2,904 males (34.7%) and 534 females (38.3%) in their respective age groups living below the poverty level.
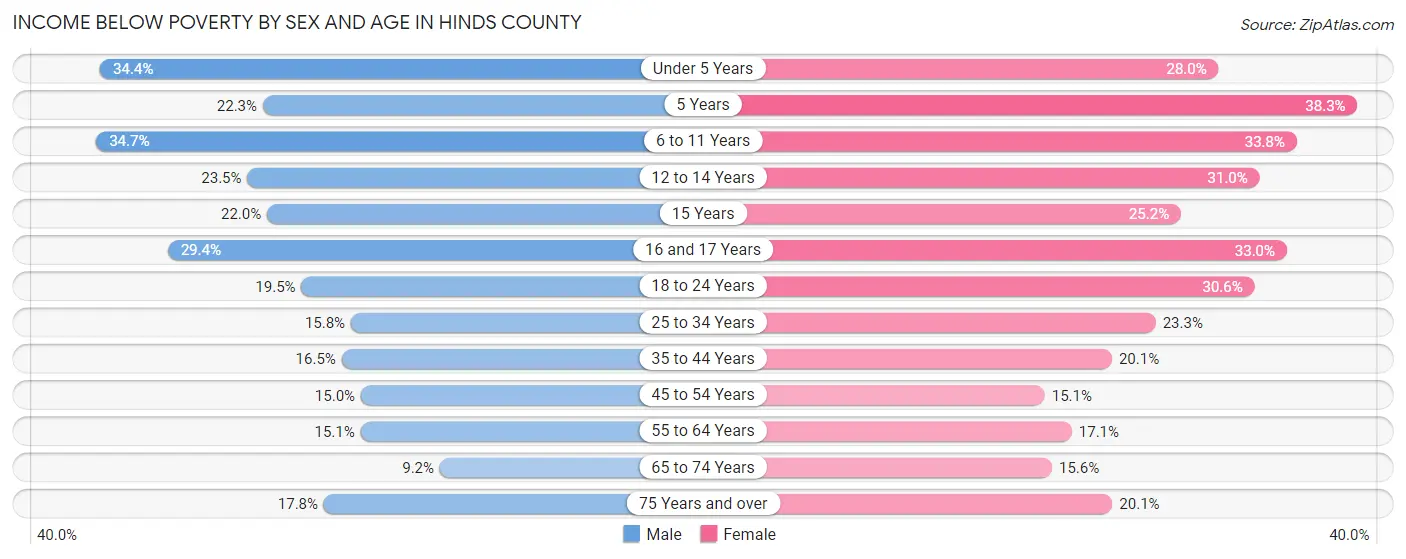
| Age Bracket | Male | Female |
| Under 5 Years | 2,520 (34.4%) | 1,842 (28.0%) |
| 5 Years | 350 (22.3%) | 534 (38.3%) |
| 6 to 11 Years | 2,904 (34.7%) | 2,813 (33.8%) |
| 12 to 14 Years | 1,211 (23.5%) | 1,434 (31.0%) |
| 15 Years | 341 (22.0%) | 388 (25.2%) |
| 16 and 17 Years | 939 (29.4%) | 1,008 (33.0%) |
| 18 to 24 Years | 1,778 (19.5%) | 3,025 (30.6%) |
| 25 to 34 Years | 2,285 (15.8%) | 3,857 (23.3%) |
| 35 to 44 Years | 2,097 (16.5%) | 2,941 (20.1%) |
| 45 to 54 Years | 1,755 (15.0%) | 2,108 (15.1%) |
| 55 to 64 Years | 1,939 (15.1%) | 2,622 (17.1%) |
| 65 to 74 Years | 849 (9.2%) | 1,818 (15.6%) |
| 75 Years and over | 827 (17.8%) | 1,624 (20.1%) |
| Total | 19,795 (19.4%) | 26,014 (22.5%) |
Income Above Poverty by Sex and Age in Hinds County
According to the poverty statistics in Hinds County, males aged 65 to 74 years and females aged 45 to 54 years are the age groups that are most secure financially, with 90.8% of males and 84.9% of females in these age groups living above the poverty line.
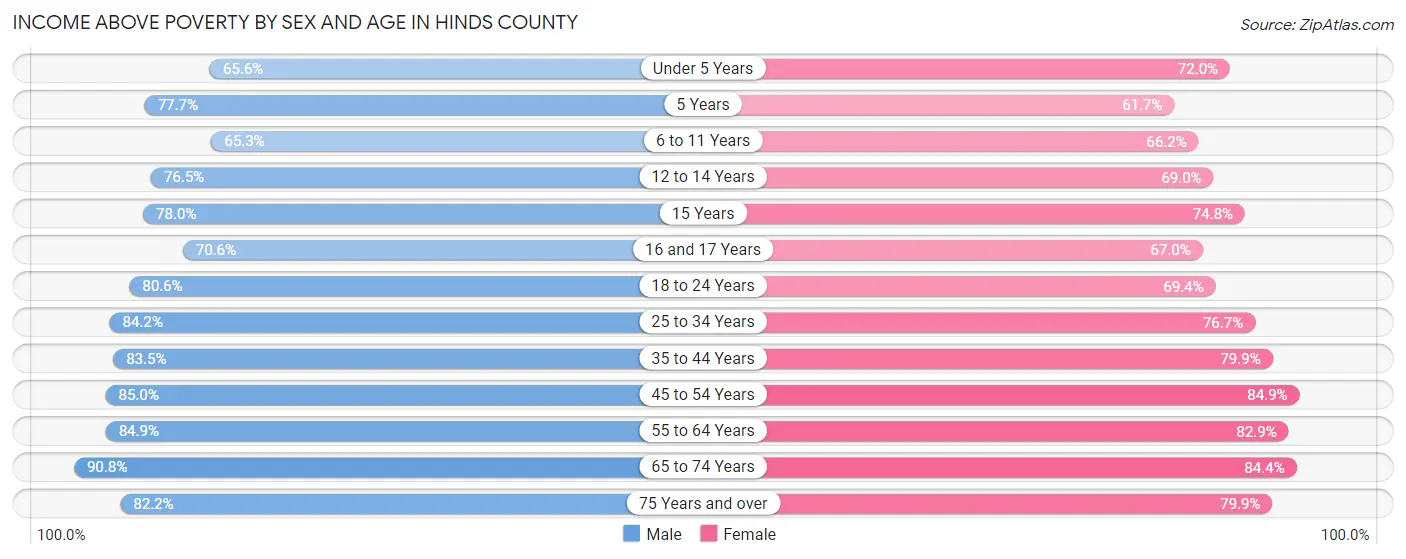
| Age Bracket | Male | Female |
| Under 5 Years | 4,806 (65.6%) | 4,744 (72.0%) |
| 5 Years | 1,219 (77.7%) | 861 (61.7%) |
| 6 to 11 Years | 5,469 (65.3%) | 5,514 (66.2%) |
| 12 to 14 Years | 3,951 (76.5%) | 3,189 (69.0%) |
| 15 Years | 1,209 (78.0%) | 1,153 (74.8%) |
| 16 and 17 Years | 2,258 (70.6%) | 2,043 (67.0%) |
| 18 to 24 Years | 7,365 (80.5%) | 6,848 (69.4%) |
| 25 to 34 Years | 12,204 (84.2%) | 12,689 (76.7%) |
| 35 to 44 Years | 10,642 (83.5%) | 11,719 (79.9%) |
| 45 to 54 Years | 9,925 (85.0%) | 11,876 (84.9%) |
| 55 to 64 Years | 10,937 (84.9%) | 12,728 (82.9%) |
| 65 to 74 Years | 8,409 (90.8%) | 9,825 (84.4%) |
| 75 Years and over | 3,823 (82.2%) | 6,460 (79.9%) |
| Total | 82,217 (80.6%) | 89,649 (77.5%) |
Income Below Poverty Among Married-Couple Families in Hinds County
The poverty statistics for married-couple families in Hinds County show that 5.4% or 1,600 of the total 29,508 families live below the poverty line. Families with 5 or more children have the highest poverty rate of 45.8%, comprising of 71 families. On the other hand, families with 1 or 2 children have the lowest poverty rate of 4.2%, which includes 364 families.
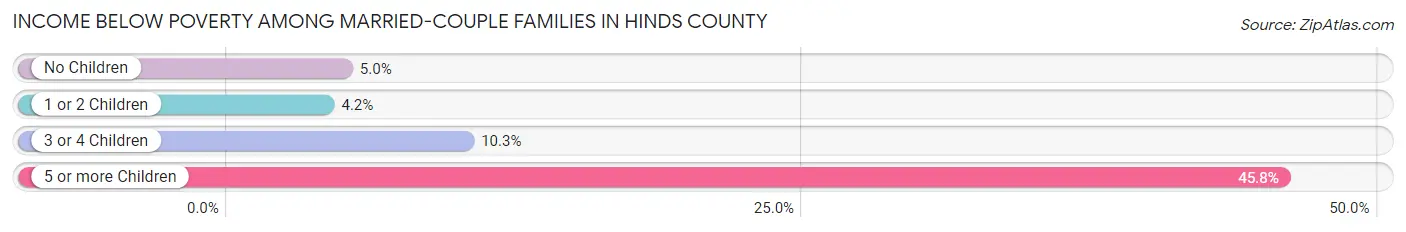
| Children | Above Poverty | Below Poverty |
| No Children | 17,283 (95.0%) | 909 (5.0%) |
| 1 or 2 Children | 8,307 (95.8%) | 364 (4.2%) |
| 3 or 4 Children | 2,234 (89.7%) | 256 (10.3%) |
| 5 or more Children | 84 (54.2%) | 71 (45.8%) |
| Total | 27,908 (94.6%) | 1,600 (5.4%) |
Income Below Poverty Among Single-Parent Households in Hinds County
According to the poverty data in Hinds County, 27.4% or 1,234 single-father households and 29.1% or 5,893 single-mother households are living below the poverty line. Among single-father households, those with 1 or 2 children have the highest poverty rate, with 686 households (38.0%) experiencing poverty. Likewise, among single-mother households, those with 5 or more children have the highest poverty rate, with 309 households (97.5%) falling below the poverty line.
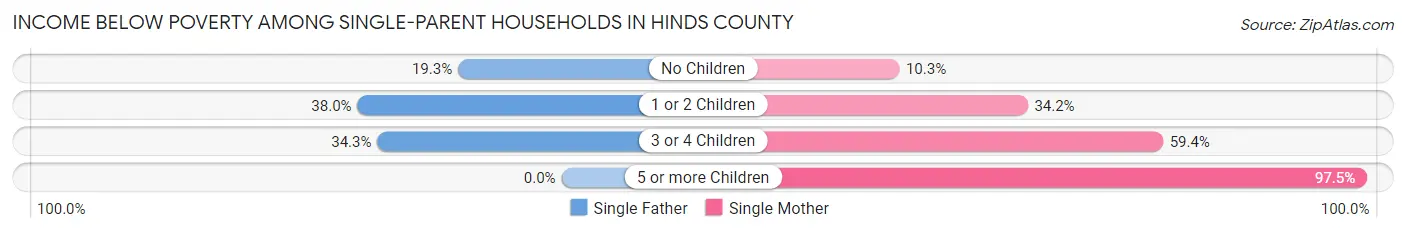
| Children | Single Father | Single Mother |
| No Children | 478 (19.3%) | 768 (10.3%) |
| 1 or 2 Children | 686 (38.0%) | 3,539 (34.2%) |
| 3 or 4 Children | 70 (34.3%) | 1,277 (59.4%) |
| 5 or more Children | 0 (0.0%) | 309 (97.5%) |
| Total | 1,234 (27.4%) | 5,893 (29.1%) |
Income Below Poverty Among Married-Couple vs Single-Parent Households in Hinds County
The poverty data for Hinds County shows that 1,600 of the married-couple family households (5.4%) and 7,127 of the single-parent households (28.8%) are living below the poverty level. Within the married-couple family households, those with 5 or more children have the highest poverty rate, with 71 households (45.8%) falling below the poverty line. Among the single-parent households, those with 5 or more children have the highest poverty rate, with 309 household (94.2%) living below poverty.
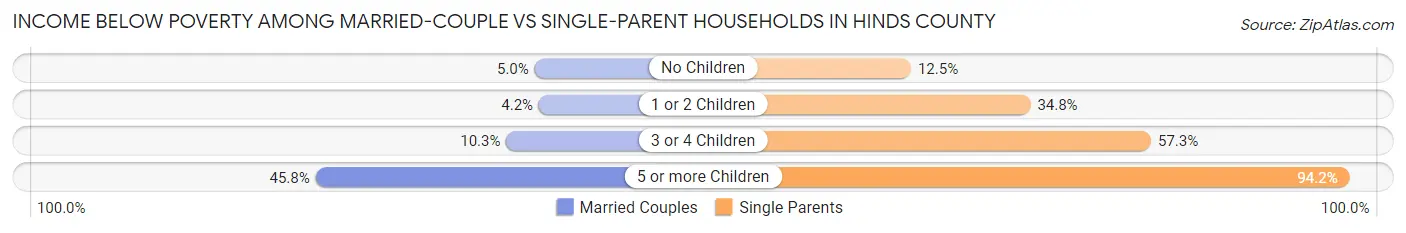
| Children | Married-Couple Families | Single-Parent Households |
| No Children | 909 (5.0%) | 1,246 (12.5%) |
| 1 or 2 Children | 364 (4.2%) | 4,225 (34.8%) |
| 3 or 4 Children | 256 (10.3%) | 1,347 (57.3%) |
| 5 or more Children | 71 (45.8%) | 309 (94.2%) |
| Total | 1,600 (5.4%) | 7,127 (28.8%) |
Race in Hinds County
The most populous races in Hinds County are Black / African American (165,118 | 72.9%), White / Caucasian (54,389 | 24.0%), and Two or more Races (3,800 | 1.7%).
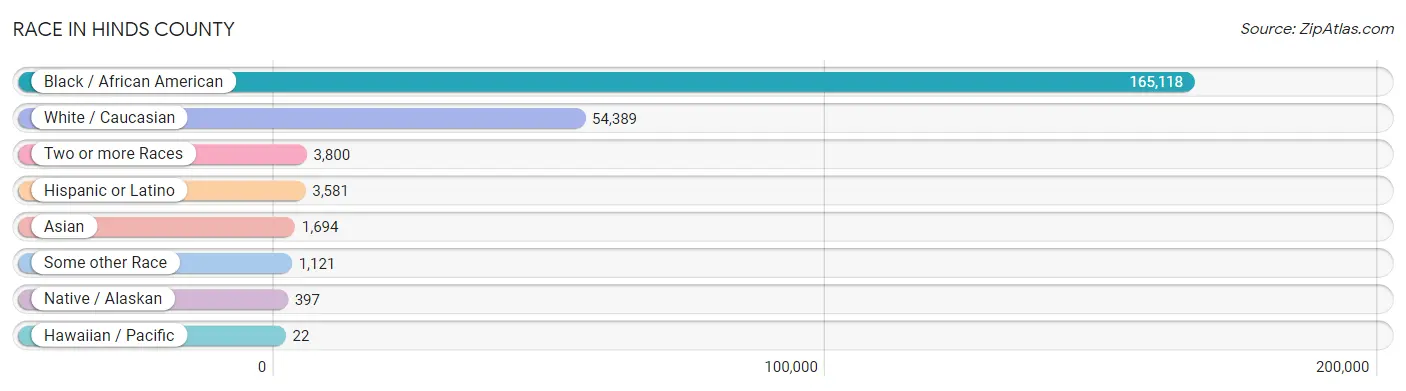
| Race | # Population | % Population |
| Asian | 1,694 | 0.7% |
| Black / African American | 165,118 | 72.9% |
| Hawaiian / Pacific | 22 | 0.0% |
| Hispanic or Latino | 3,581 | 1.6% |
| Native / Alaskan | 397 | 0.2% |
| White / Caucasian | 54,389 | 24.0% |
| Two or more Races | 3,800 | 1.7% |
| Some other Race | 1,121 | 0.5% |
| Total | 226,541 | 100.0% |
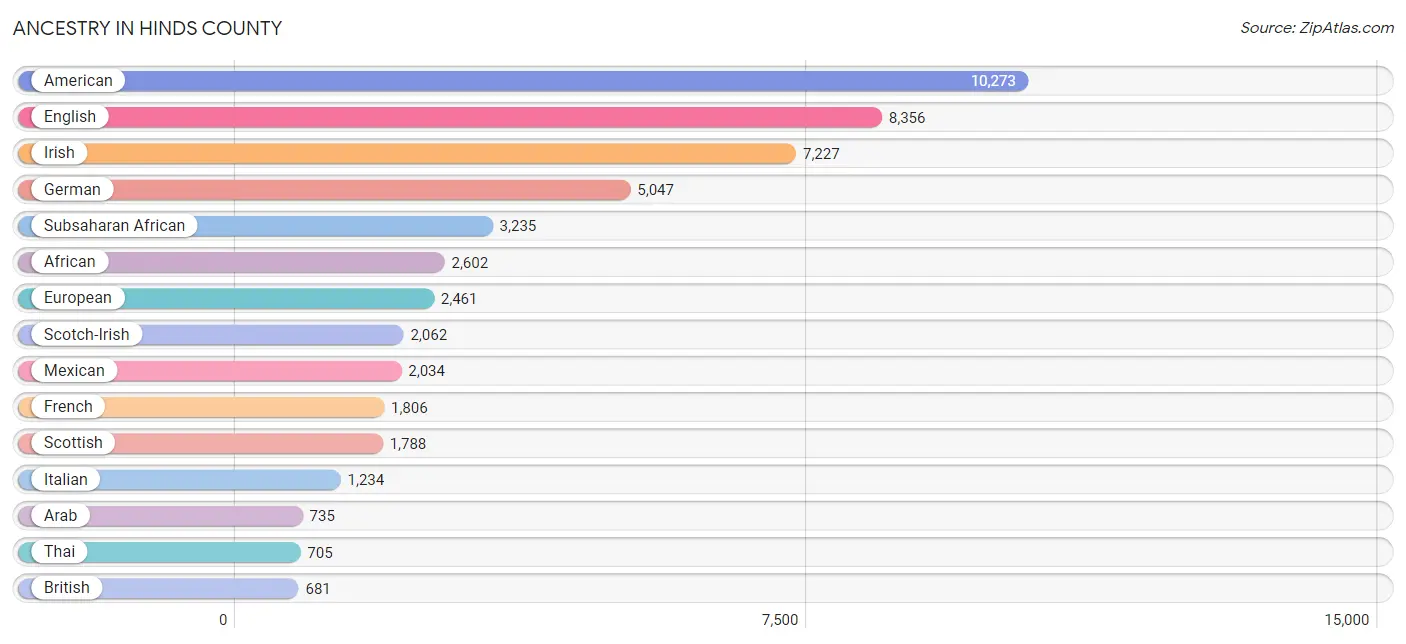
Ancestry in Hinds County
The most populous ancestries reported in Hinds County are American (10,273 | 4.5%), English (8,356 | 3.7%), Irish (7,227 | 3.2%), German (5,047 | 2.2%), and Subsaharan African (3,235 | 1.4%), together accounting for 15.1% of all Hinds County residents.
| Ancestry | # Population | % Population |
| Afghan | 16 | 0.0% |
| African | 2,602 | 1.1% |
| Albanian | 7 | 0.0% |
| American | 10,273 | 4.5% |
| Arab | 735 | 0.3% |
| Austrian | 32 | 0.0% |
| Belgian | 7 | 0.0% |
| Belizean | 8 | 0.0% |
| Bhutanese | 15 | 0.0% |
| Blackfeet | 275 | 0.1% |
| British | 681 | 0.3% |
| Bulgarian | 7 | 0.0% |
| Burmese | 257 | 0.1% |
| Cajun | 68 | 0.0% |
| Canadian | 50 | 0.0% |
| Carpatho Rusyn | 31 | 0.0% |
| Celtic | 11 | 0.0% |
| Central American | 494 | 0.2% |
| Central American Indian | 218 | 0.1% |
| Cherokee | 112 | 0.1% |
| Cheyenne | 11 | 0.0% |
| Chickasaw | 25 | 0.0% |
| Chinese | 11 | 0.0% |
| Chippewa | 12 | 0.0% |
| Choctaw | 242 | 0.1% |
| Colombian | 80 | 0.0% |
| Creek | 55 | 0.0% |
| Croatian | 3 | 0.0% |
| Crow | 9 | 0.0% |
| Cuban | 109 | 0.1% |
| Czech | 49 | 0.0% |
| Czechoslovakian | 10 | 0.0% |
| Danish | 60 | 0.0% |
| Dominican | 131 | 0.1% |
| Dutch | 415 | 0.2% |
| Eastern European | 7 | 0.0% |
| Ecuadorian | 18 | 0.0% |
| Egyptian | 42 | 0.0% |
| English | 8,356 | 3.7% |
| Ethiopian | 58 | 0.0% |
| European | 2,461 | 1.1% |
| Finnish | 11 | 0.0% |
| French | 1,806 | 0.8% |
| French Canadian | 336 | 0.2% |
| German | 5,047 | 2.2% |
| Ghanaian | 10 | 0.0% |
| Greek | 342 | 0.2% |
| Guamanian / Chamorro | 6 | 0.0% |
| Guatemalan | 43 | 0.0% |
| Haitian | 62 | 0.0% |
| Honduran | 422 | 0.2% |
| Houma | 5 | 0.0% |
| Hungarian | 19 | 0.0% |
| Indian (Asian) | 477 | 0.2% |
| Indonesian | 11 | 0.0% |
| Inupiat | 23 | 0.0% |
| Iranian | 65 | 0.0% |
| Irish | 7,227 | 3.2% |
| Israeli | 238 | 0.1% |
| Italian | 1,234 | 0.5% |
| Jamaican | 168 | 0.1% |
| Japanese | 2 | 0.0% |
| Korean | 93 | 0.0% |
| Lebanese | 346 | 0.2% |
| Lithuanian | 5 | 0.0% |
| Mexican | 2,034 | 0.9% |
| Mexican American Indian | 30 | 0.0% |
| Moroccan | 34 | 0.0% |
| Nigerian | 460 | 0.2% |
| Northern European | 80 | 0.0% |
| Norwegian | 127 | 0.1% |
| Pakistani | 179 | 0.1% |
| Palestinian | 5 | 0.0% |
| Panamanian | 11 | 0.0% |
| Peruvian | 138 | 0.1% |
| Polish | 593 | 0.3% |
| Portuguese | 57 | 0.0% |
| Puerto Rican | 371 | 0.2% |
| Russian | 36 | 0.0% |
| Salvadoran | 18 | 0.0% |
| Samoan | 32 | 0.0% |
| Scandinavian | 169 | 0.1% |
| Scotch-Irish | 2,062 | 0.9% |
| Scottish | 1,788 | 0.8% |
| Serbian | 95 | 0.0% |
| Shoshone | 6 | 0.0% |
| Sioux | 2 | 0.0% |
| Slavic | 43 | 0.0% |
| Slovak | 18 | 0.0% |
| South American | 236 | 0.1% |
| Spaniard | 16 | 0.0% |
| Spanish | 164 | 0.1% |
| Sri Lankan | 272 | 0.1% |
| Subsaharan African | 3,235 | 1.4% |
| Swedish | 405 | 0.2% |
| Swiss | 38 | 0.0% |
| Syrian | 154 | 0.1% |
| Thai | 705 | 0.3% |
| Ukrainian | 18 | 0.0% |
| Welsh | 327 | 0.1% |
| Yugoslavian | 10 | 0.0% | View All 101 Rows |
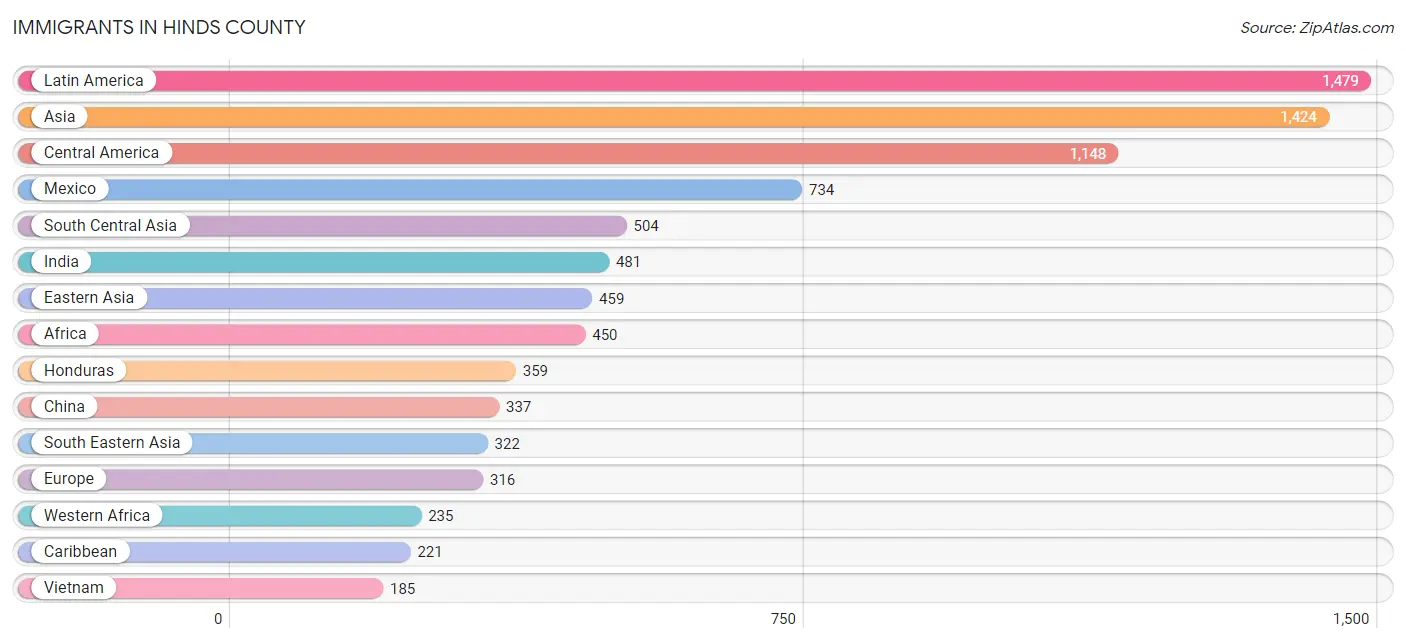
Immigrants in Hinds County
The most numerous immigrant groups reported in Hinds County came from Latin America (1,479 | 0.6%), Asia (1,424 | 0.6%), Central America (1,148 | 0.5%), Mexico (734 | 0.3%), and South Central Asia (504 | 0.2%), together accounting for 2.3% of all Hinds County residents.
| Immigration Origin | # Population | % Population |
| Africa | 450 | 0.2% |
| Asia | 1,424 | 0.6% |
| Austria | 18 | 0.0% |
| Barbados | 15 | 0.0% |
| Belgium | 7 | 0.0% |
| Brazil | 1 | 0.0% |
| Bulgaria | 7 | 0.0% |
| Cameroon | 77 | 0.0% |
| Canada | 27 | 0.0% |
| Caribbean | 221 | 0.1% |
| Central America | 1,148 | 0.5% |
| China | 337 | 0.2% |
| Colombia | 7 | 0.0% |
| Cuba | 40 | 0.0% |
| Dominican Republic | 14 | 0.0% |
| Eastern Africa | 65 | 0.0% |
| Eastern Asia | 459 | 0.2% |
| Eastern Europe | 125 | 0.1% |
| Ecuador | 18 | 0.0% |
| El Salvador | 3 | 0.0% |
| England | 32 | 0.0% |
| Ethiopia | 58 | 0.0% |
| Europe | 316 | 0.1% |
| Germany | 41 | 0.0% |
| Ghana | 18 | 0.0% |
| Guatemala | 41 | 0.0% |
| Haiti | 40 | 0.0% |
| Honduras | 359 | 0.2% |
| Hong Kong | 18 | 0.0% |
| India | 481 | 0.2% |
| Ireland | 25 | 0.0% |
| Italy | 3 | 0.0% |
| Jamaica | 112 | 0.1% |
| Japan | 13 | 0.0% |
| Kazakhstan | 2 | 0.0% |
| Korea | 109 | 0.1% |
| Latin America | 1,479 | 0.6% |
| Lebanon | 33 | 0.0% |
| Liberia | 16 | 0.0% |
| Mexico | 734 | 0.3% |
| Middle Africa | 77 | 0.0% |
| Morocco | 23 | 0.0% |
| Netherlands | 12 | 0.0% |
| Nigeria | 176 | 0.1% |
| Northern Africa | 23 | 0.0% |
| Northern Europe | 62 | 0.0% |
| Pakistan | 21 | 0.0% |
| Panama | 11 | 0.0% |
| Philippines | 63 | 0.0% |
| Poland | 107 | 0.1% |
| Portugal | 10 | 0.0% |
| Russia | 11 | 0.0% |
| South Africa | 30 | 0.0% |
| South America | 110 | 0.1% |
| South Central Asia | 504 | 0.2% |
| South Eastern Asia | 322 | 0.1% |
| Southern Europe | 45 | 0.0% |
| Spain | 32 | 0.0% |
| Sweden | 5 | 0.0% |
| Switzerland | 6 | 0.0% |
| Taiwan | 30 | 0.0% |
| Thailand | 63 | 0.0% |
| Vietnam | 185 | 0.1% |
| Western Africa | 235 | 0.1% |
| Western Asia | 113 | 0.1% |
| Western Europe | 84 | 0.0% |
| Yemen | 80 | 0.0% | View All 67 Rows |
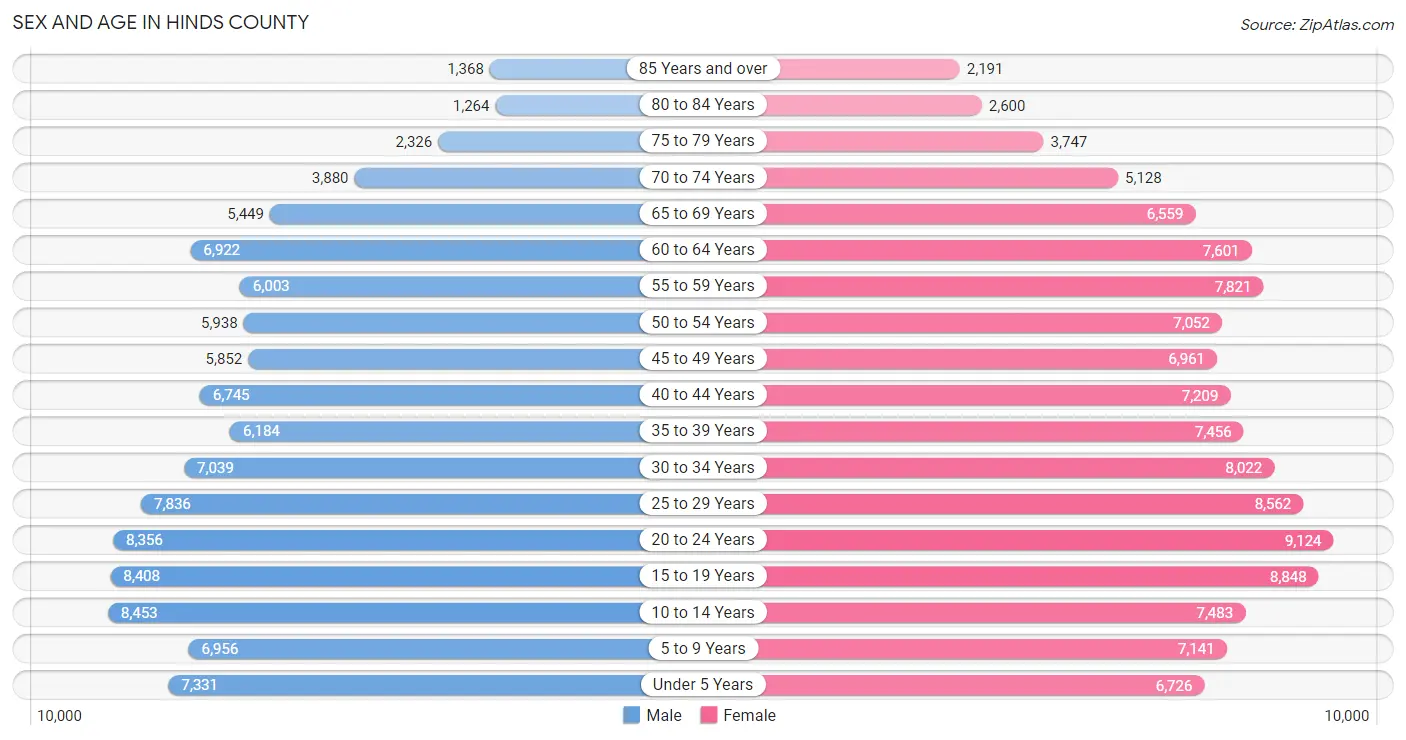
Sex and Age in Hinds County
Sex and Age in Hinds County
The most populous age groups in Hinds County are 10 to 14 Years (8,453 | 8.0%) for men and 20 to 24 Years (9,124 | 7.6%) for women.
| Age Bracket | Male | Female |
| Under 5 Years | 7,331 (6.9%) | 6,726 (5.6%) |
| 5 to 9 Years | 6,956 (6.5%) | 7,141 (5.9%) |
| 10 to 14 Years | 8,453 (8.0%) | 7,483 (6.2%) |
| 15 to 19 Years | 8,408 (7.9%) | 8,848 (7.4%) |
| 20 to 24 Years | 8,356 (7.9%) | 9,124 (7.6%) |
| 25 to 29 Years | 7,836 (7.4%) | 8,562 (7.1%) |
| 30 to 34 Years | 7,039 (6.6%) | 8,022 (6.7%) |
| 35 to 39 Years | 6,184 (5.8%) | 7,456 (6.2%) |
| 40 to 44 Years | 6,745 (6.3%) | 7,209 (6.0%) |
| 45 to 49 Years | 5,852 (5.5%) | 6,961 (5.8%) |
| 50 to 54 Years | 5,938 (5.6%) | 7,052 (5.9%) |
| 55 to 59 Years | 6,003 (5.7%) | 7,821 (6.5%) |
| 60 to 64 Years | 6,922 (6.5%) | 7,601 (6.3%) |
| 65 to 69 Years | 5,449 (5.1%) | 6,559 (5.5%) |
| 70 to 74 Years | 3,880 (3.6%) | 5,128 (4.3%) |
| 75 to 79 Years | 2,326 (2.2%) | 3,747 (3.1%) |
| 80 to 84 Years | 1,264 (1.2%) | 2,600 (2.2%) |
| 85 Years and over | 1,368 (1.3%) | 2,191 (1.8%) |
| Total | 106,310 (100.0%) | 120,231 (100.0%) |
Families and Households in Hinds County
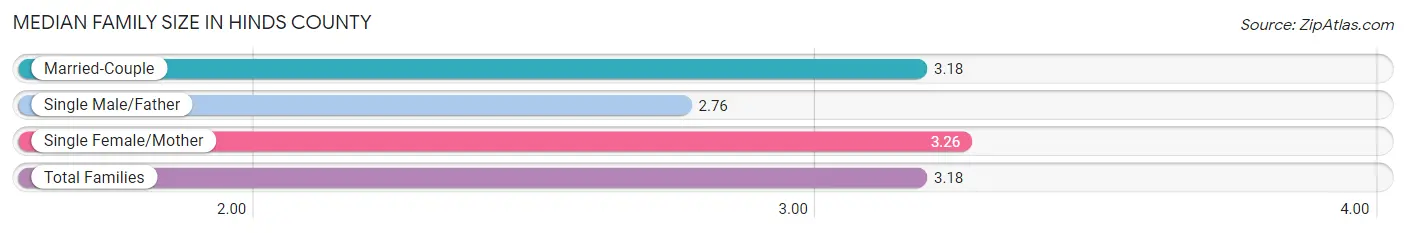
Median Family Size in Hinds County
The median family size in Hinds County is 3.18 persons per family, with single female/mother families (20,262 | 37.3%) accounting for the largest median family size of 3.26 persons per family. On the other hand, single male/father families (4,499 | 8.3%) represent the smallest median family size with 2.76 persons per family.
| Family Type | # Families | Family Size |
| Married-Couple | 29,508 (54.4%) | 3.18 |
| Single Male/Father | 4,499 (8.3%) | 2.76 |
| Single Female/Mother | 20,262 (37.3%) | 3.26 |
| Total Families | 54,269 (100.0%) | 3.18 |
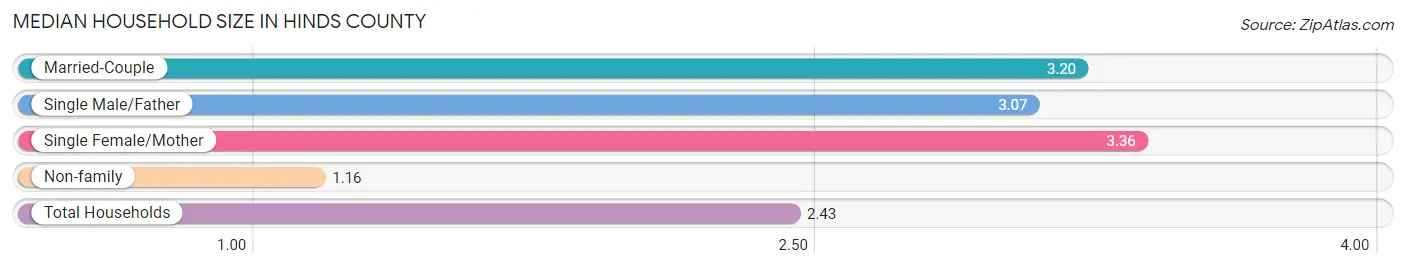
Median Household Size in Hinds County
The median household size in Hinds County is 2.43 persons per household, with single female/mother households (20,262 | 22.6%) accounting for the largest median household size of 3.36 persons per household. non-family households (35,316 | 39.4%) represent the smallest median household size with 1.16 persons per household.
| Household Type | # Households | Household Size |
| Married-Couple | 29,508 (32.9%) | 3.20 |
| Single Male/Father | 4,499 (5.0%) | 3.07 |
| Single Female/Mother | 20,262 (22.6%) | 3.36 |
| Non-family | 35,316 (39.4%) | 1.16 |
| Total Households | 89,585 (100.0%) | 2.43 |
Household Size by Marriage Status in Hinds County
Out of a total of 89,585 households in Hinds County, 54,269 (60.6%) are family households, while 35,316 (39.4%) are nonfamily households. The most numerous type of family households are 2-person households, comprising 23,373, and the most common type of nonfamily households are 1-person households, comprising 30,945.
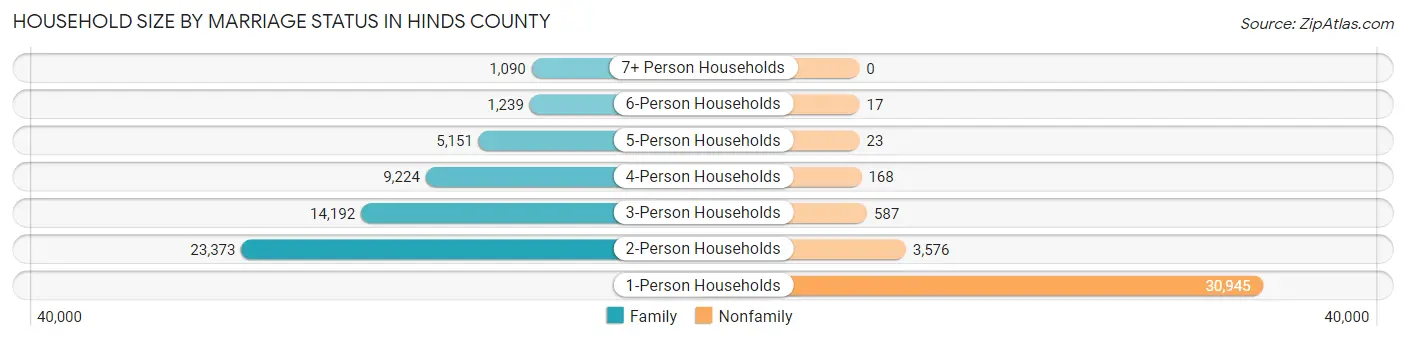
| Household Size | Family Households | Nonfamily Households |
| 1-Person Households | - | 30,945 (34.5%) |
| 2-Person Households | 23,373 (26.1%) | 3,576 (4.0%) |
| 3-Person Households | 14,192 (15.8%) | 587 (0.7%) |
| 4-Person Households | 9,224 (10.3%) | 168 (0.2%) |
| 5-Person Households | 5,151 (5.8%) | 23 (0.0%) |
| 6-Person Households | 1,239 (1.4%) | 17 (0.0%) |
| 7+ Person Households | 1,090 (1.2%) | 0 (0.0%) |
| Total | 54,269 (60.6%) | 35,316 (39.4%) |
Female Fertility in Hinds County
Fertility by Age in Hinds County
Average fertility rate in Hinds County is 60.0 births per 1,000 women. Women in the age bracket of 20 to 34 years have the highest fertility rate with 106.0 births per 1,000 women. Women in the age bracket of 20 to 34 years acount for 79.1% of all women with births.
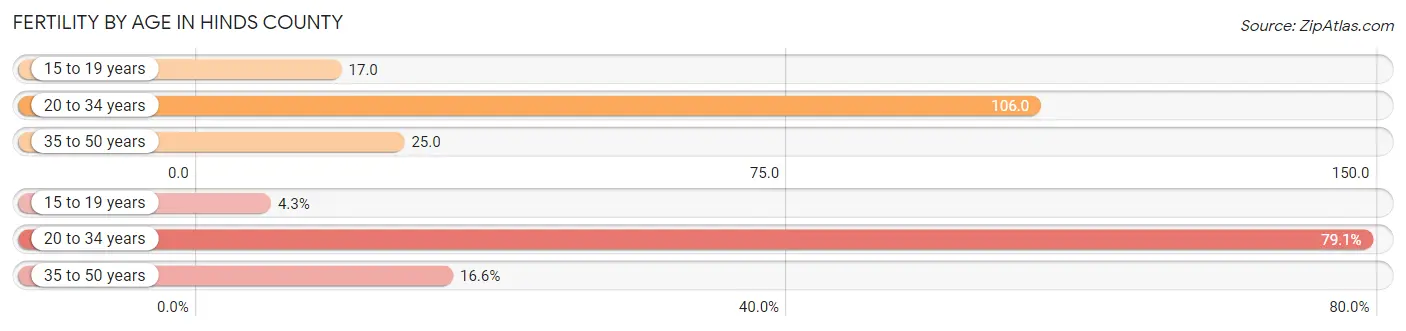
| Age Bracket | Women with Births | Births / 1,000 Women |
| 15 to 19 years | 147 (4.3%) | 17.0 |
| 20 to 34 years | 2,720 (79.1%) | 106.0 |
| 35 to 50 years | 572 (16.6%) | 25.0 |
| Total | 3,439 (100.0%) | 60.0 |
Fertility by Age by Marriage Status in Hinds County
34.6% of women with births (3,439) in Hinds County are married. The highest percentage of unmarried women with births falls into 15 to 19 years age bracket with 95.2% of them unmarried at the time of birth, while the lowest percentage of unmarried women with births belong to 35 to 50 years age bracket with 38.8% of them unmarried.
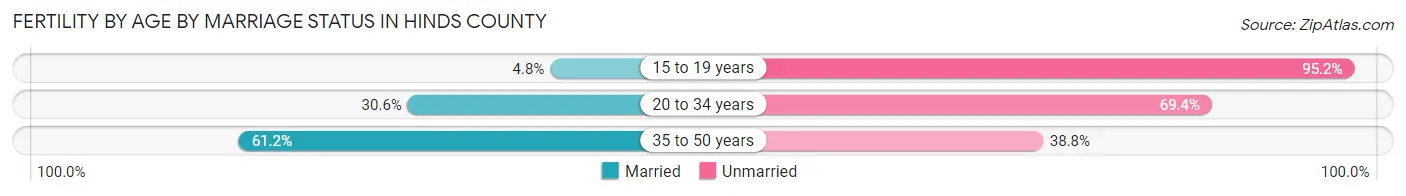
| Age Bracket | Married | Unmarried |
| 15 to 19 years | 7 (4.8%) | 140 (95.2%) |
| 20 to 34 years | 832 (30.6%) | 1,888 (69.4%) |
| 35 to 50 years | 350 (61.2%) | 222 (38.8%) |
| Total | 1,190 (34.6%) | 2,249 (65.4%) |
Fertility by Education in Hinds County
Average fertility rate in Hinds County is 60.0 births per 1,000 women. Women with the education attainment of high school diploma have the highest fertility rate of 67.0 births per 1,000 women, while women with the education attainment of graduate degree have the lowest fertility at 49.0 births per 1,000 women. Women with the education attainment of college or associate's degree represent 40.2% of all women with births.
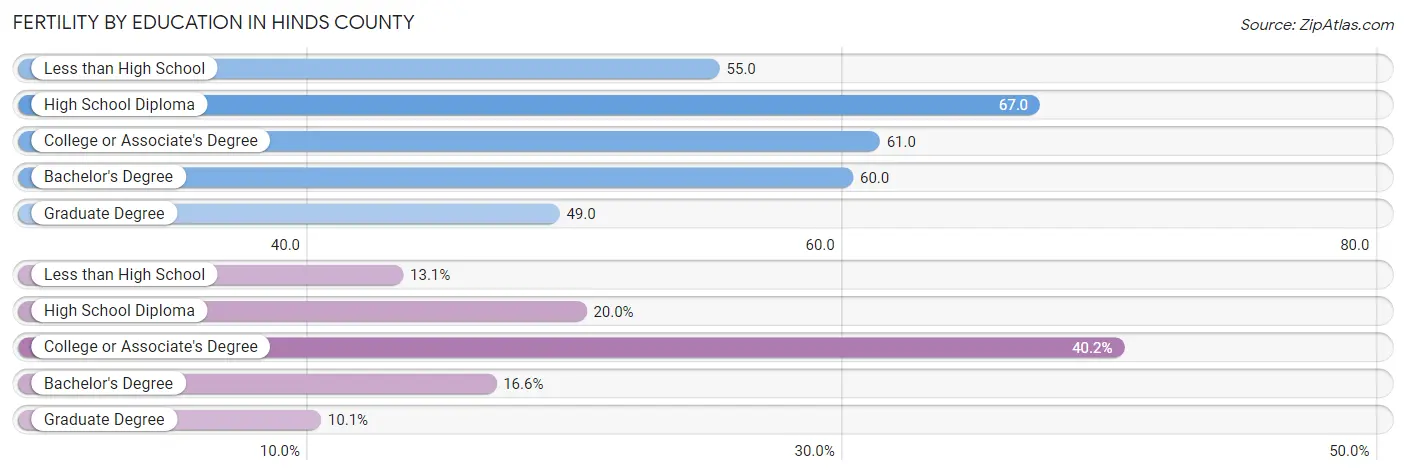
| Educational Attainment | Women with Births | Births / 1,000 Women |
| Less than High School | 452 (13.1%) | 55.0 |
| High School Diploma | 688 (20.0%) | 67.0 |
| College or Associate's Degree | 1,381 (40.2%) | 61.0 |
| Bachelor's Degree | 572 (16.6%) | 60.0 |
| Graduate Degree | 346 (10.1%) | 49.0 |
| Total | 3,439 (100.0%) | 60.0 |
Fertility by Education by Marriage Status in Hinds County
65.4% of women with births in Hinds County are unmarried. Women with the educational attainment of graduate degree are most likely to be married with 72.8% of them married at childbirth, while women with the educational attainment of high school diploma are least likely to be married with 88.5% of them unmarried at childbirth.
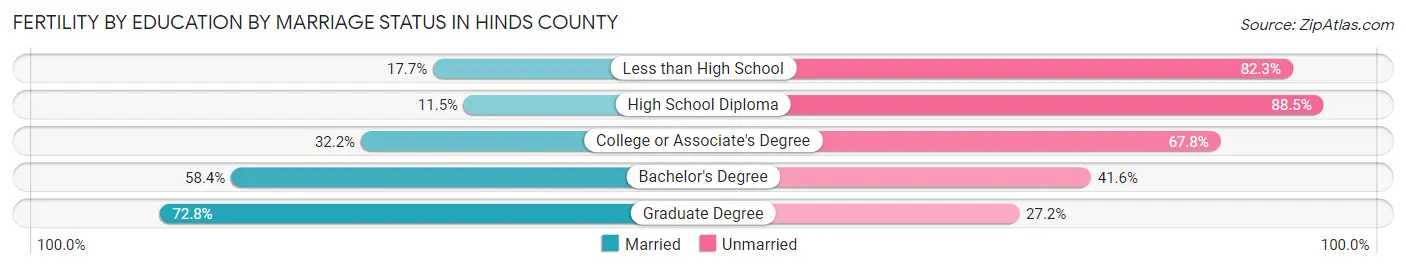
| Educational Attainment | Married | Unmarried |
| Less than High School | 80 (17.7%) | 372 (82.3%) |
| High School Diploma | 79 (11.5%) | 609 (88.5%) |
| College or Associate's Degree | 445 (32.2%) | 936 (67.8%) |
| Bachelor's Degree | 334 (58.4%) | 238 (41.6%) |
| Graduate Degree | 252 (72.8%) | 94 (27.2%) |
| Total | 1,190 (34.6%) | 2,249 (65.4%) |
Employment Characteristics in Hinds County
Employment by Class of Employer in Hinds County
Among the 96,567 employed individuals in Hinds County, private company employees (59,075 | 61.2%), state government employees (12,431 | 12.9%), and not-for-profit organizations (7,406 | 7.7%) make up the most common classes of employment.
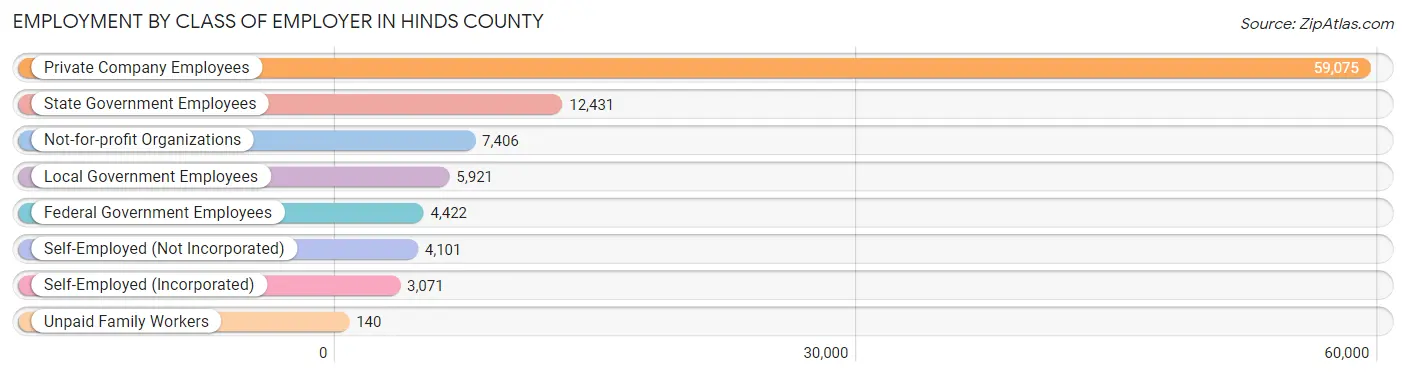
| Employer Class | # Employees | % Employees |
| Private Company Employees | 59,075 | 61.2% |
| Self-Employed (Incorporated) | 3,071 | 3.2% |
| Self-Employed (Not Incorporated) | 4,101 | 4.3% |
| Not-for-profit Organizations | 7,406 | 7.7% |
| Local Government Employees | 5,921 | 6.1% |
| State Government Employees | 12,431 | 12.9% |
| Federal Government Employees | 4,422 | 4.6% |
| Unpaid Family Workers | 140 | 0.1% |
| Total | 96,567 | 100.0% |
Employment Status by Age in Hinds County
According to the labor force statistics for Hinds County, out of the total population over 16 years of age (179,343), 60.1% or 107,785 individuals are in the labor force, with 7.8% or 8,407 of them unemployed. The age group with the highest labor force participation rate is 35 to 44 years, with 83.8% or 23,124 individuals in the labor force. Within the labor force, the 16 to 19 years age range has the highest percentage of unemployed individuals, with 24.6% or 912 of them being unemployed.
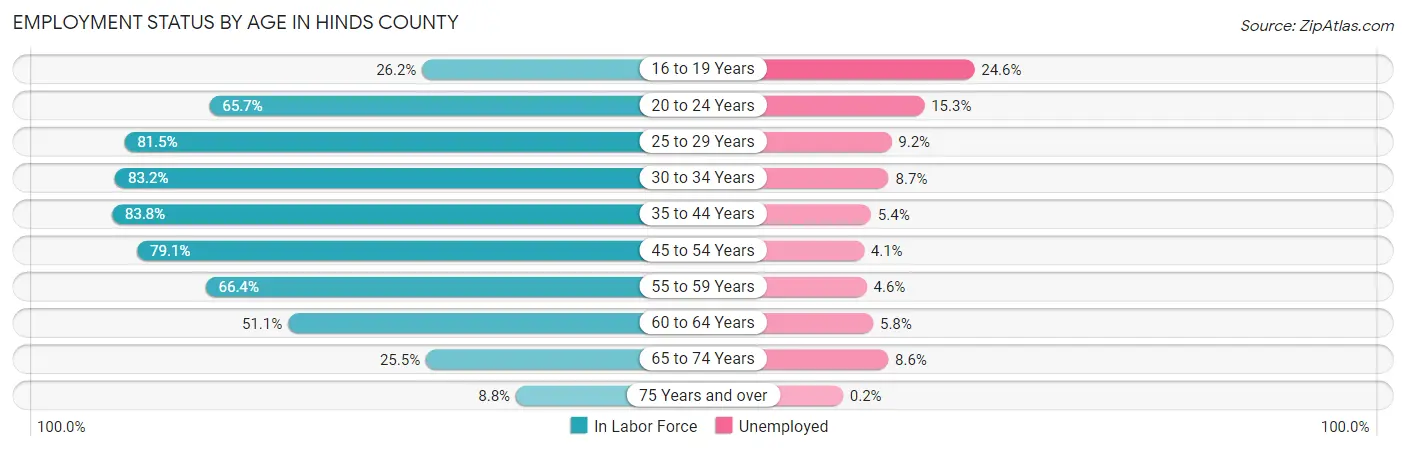
| Age Bracket | In Labor Force | Unemployed |
| 16 to 19 Years | 3,707 (26.2%) | 912 (24.6%) |
| 20 to 24 Years | 11,484 (65.7%) | 1,757 (15.3%) |
| 25 to 29 Years | 13,364 (81.5%) | 1,229 (9.2%) |
| 30 to 34 Years | 12,531 (83.2%) | 1,090 (8.7%) |
| 35 to 44 Years | 23,124 (83.8%) | 1,249 (5.4%) |
| 45 to 54 Years | 20,410 (79.1%) | 837 (4.1%) |
| 55 to 59 Years | 9,179 (66.4%) | 422 (4.6%) |
| 60 to 64 Years | 7,421 (51.1%) | 430 (5.8%) |
| 65 to 74 Years | 5,359 (25.5%) | 461 (8.6%) |
| 75 Years and over | 1,188 (8.8%) | 2 (0.2%) |
| Total | 107,785 (60.1%) | 8,407 (7.8%) |
Employment Status by Educational Attainment in Hinds County
According to labor force statistics for Hinds County, 76.0% of individuals (86,034) out of the total population between 25 and 64 years of age (113,203) are in the labor force, with 6.1% or 5,248 of them being unemployed. The group with the highest labor force participation rate are those with the educational attainment of bachelor's degree or higher, with 84.4% or 30,062 individuals in the labor force. Within the labor force, individuals with less than high school education have the highest percentage of unemployment, with 16.5% or 967 of them being unemployed.
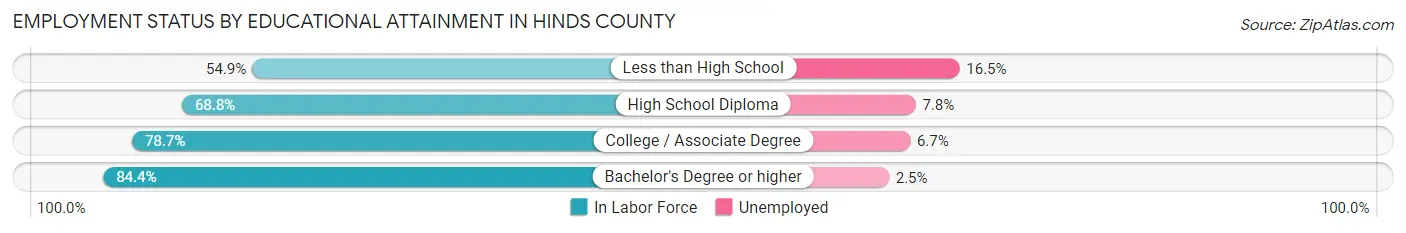
| Educational Attainment | In Labor Force | Unemployed |
| Less than High School | 5,859 (54.9%) | 1,761 (16.5%) |
| High School Diploma | 17,827 (68.8%) | 2,021 (7.8%) |
| College / Associate Degree | 32,269 (78.7%) | 2,747 (6.7%) |
| Bachelor's Degree or higher | 30,062 (84.4%) | 890 (2.5%) |
| Total | 86,034 (76.0%) | 6,905 (6.1%) |
Employment Occupations by Sex in Hinds County
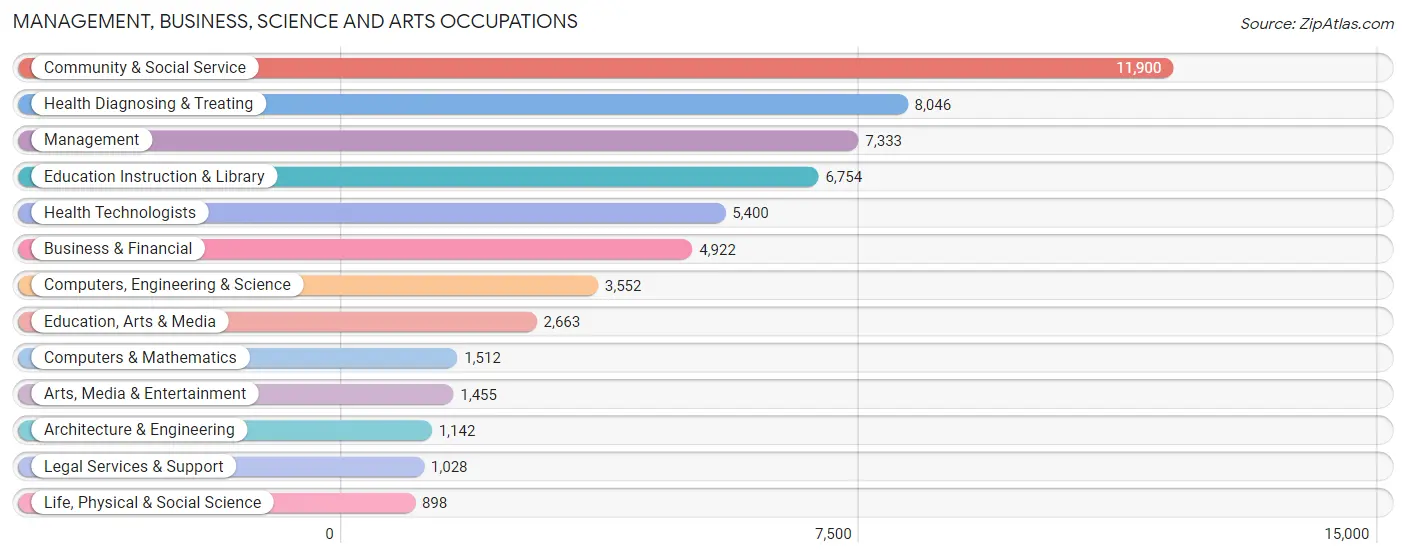
Management, Business, Science and Arts Occupations
The most common Management, Business, Science and Arts occupations in Hinds County are Community & Social Service (11,900 | 12.0%), Health Diagnosing & Treating (8,046 | 8.1%), Management (7,333 | 7.4%), Education Instruction & Library (6,754 | 6.8%), and Health Technologists (5,400 | 5.4%).
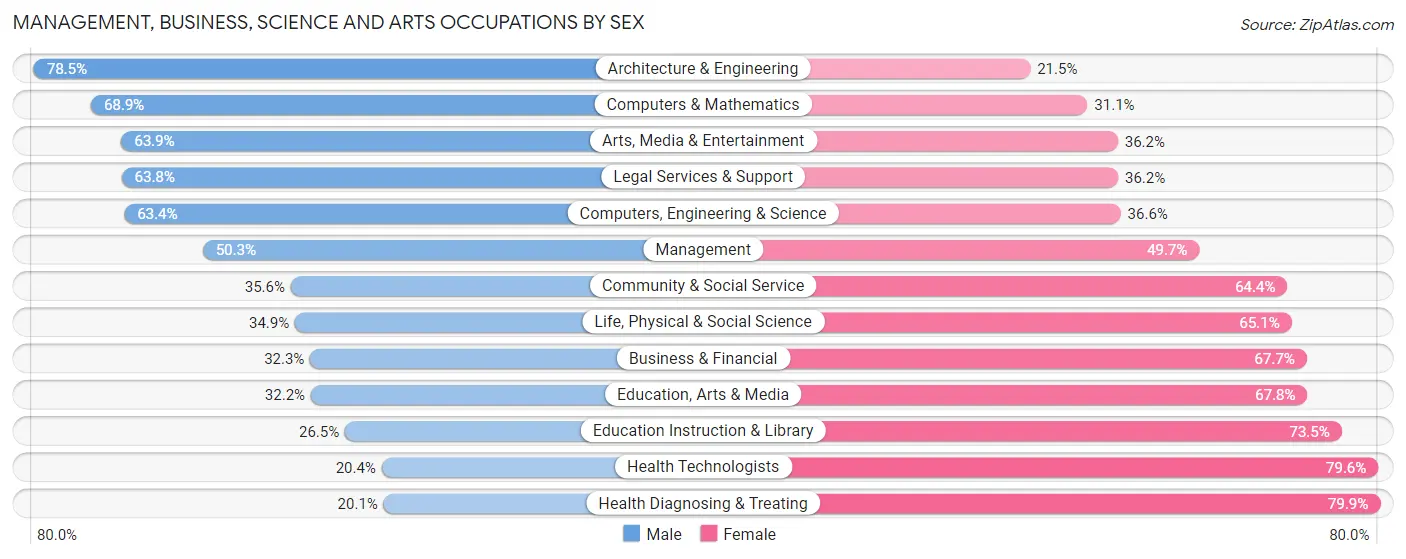
Management, Business, Science and Arts Occupations by Sex
Within the Management, Business, Science and Arts occupations in Hinds County, the most male-oriented occupations are Architecture & Engineering (78.5%), Computers & Mathematics (68.9%), and Arts, Media & Entertainment (63.8%), while the most female-oriented occupations are Health Diagnosing & Treating (79.9%), Health Technologists (79.6%), and Education Instruction & Library (73.5%).
| Occupation | Male | Female |
| Management | 3,686 (50.3%) | 3,647 (49.7%) |
| Business & Financial | 1,592 (32.3%) | 3,330 (67.7%) |
| Computers, Engineering & Science | 2,251 (63.4%) | 1,301 (36.6%) |
| Computers & Mathematics | 1,042 (68.9%) | 470 (31.1%) |
| Architecture & Engineering | 896 (78.5%) | 246 (21.5%) |
| Life, Physical & Social Science | 313 (34.9%) | 585 (65.1%) |
| Community & Social Service | 4,234 (35.6%) | 7,666 (64.4%) |
| Education, Arts & Media | 858 (32.2%) | 1,805 (67.8%) |
| Legal Services & Support | 656 (63.8%) | 372 (36.2%) |
| Education Instruction & Library | 1,791 (26.5%) | 4,963 (73.5%) |
| Arts, Media & Entertainment | 929 (63.8%) | 526 (36.1%) |
| Health Diagnosing & Treating | 1,616 (20.1%) | 6,430 (79.9%) |
| Health Technologists | 1,102 (20.4%) | 4,298 (79.6%) |
| Total (Category) | 13,379 (37.4%) | 22,374 (62.6%) |
| Total (Overall) | 46,759 (47.2%) | 52,248 (52.8%) |
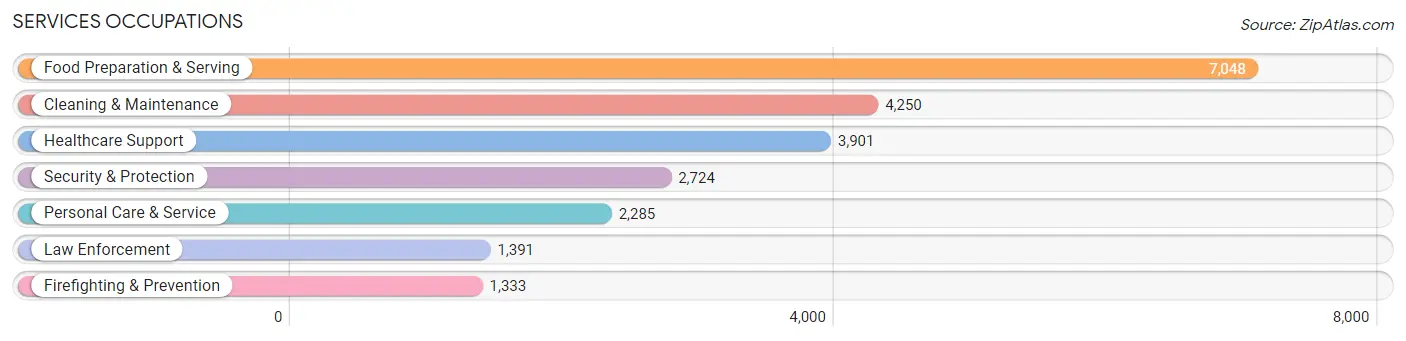
Services Occupations
The most common Services occupations in Hinds County are Food Preparation & Serving (7,048 | 7.1%), Cleaning & Maintenance (4,250 | 4.3%), Healthcare Support (3,901 | 3.9%), Security & Protection (2,724 | 2.8%), and Personal Care & Service (2,285 | 2.3%).
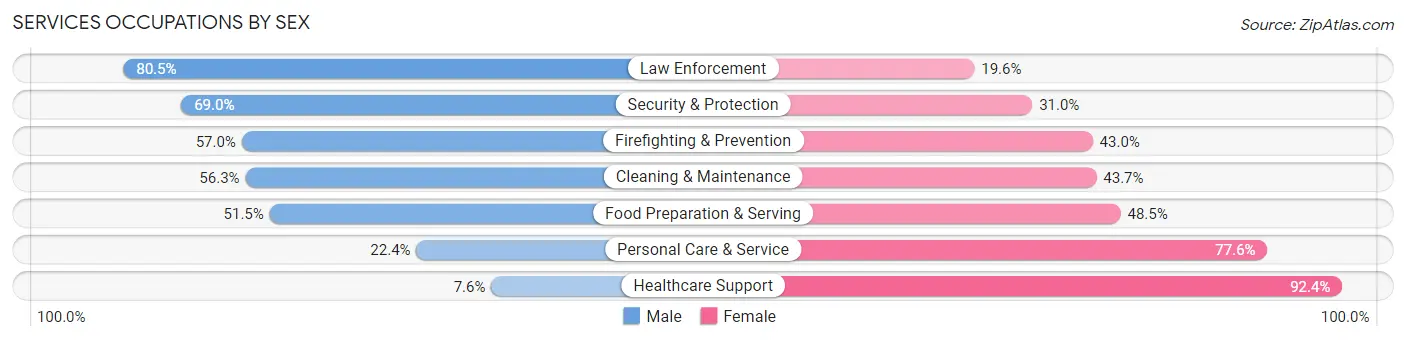
Services Occupations by Sex
Within the Services occupations in Hinds County, the most male-oriented occupations are Law Enforcement (80.4%), Security & Protection (69.0%), and Firefighting & Prevention (57.0%), while the most female-oriented occupations are Healthcare Support (92.4%), Personal Care & Service (77.6%), and Food Preparation & Serving (48.5%).
| Occupation | Male | Female |
| Healthcare Support | 296 (7.6%) | 3,605 (92.4%) |
| Security & Protection | 1,879 (69.0%) | 845 (31.0%) |
| Firefighting & Prevention | 760 (57.0%) | 573 (43.0%) |
| Law Enforcement | 1,119 (80.4%) | 272 (19.6%) |
| Food Preparation & Serving | 3,628 (51.5%) | 3,420 (48.5%) |
| Cleaning & Maintenance | 2,392 (56.3%) | 1,858 (43.7%) |
| Personal Care & Service | 512 (22.4%) | 1,773 (77.6%) |
| Total (Category) | 8,707 (43.1%) | 11,501 (56.9%) |
| Total (Overall) | 46,759 (47.2%) | 52,248 (52.8%) |
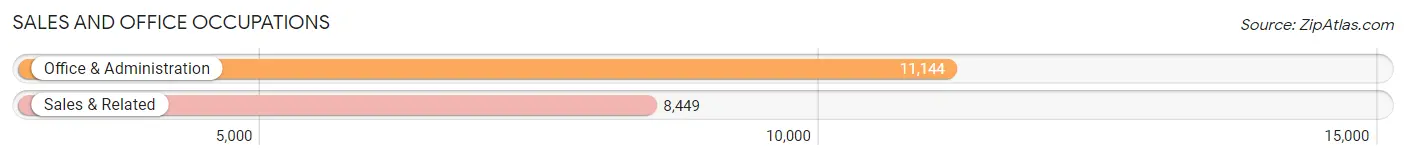
Sales and Office Occupations
The most common Sales and Office occupations in Hinds County are Office & Administration (11,144 | 11.3%), and Sales & Related (8,449 | 8.5%).
Sales and Office Occupations by Sex
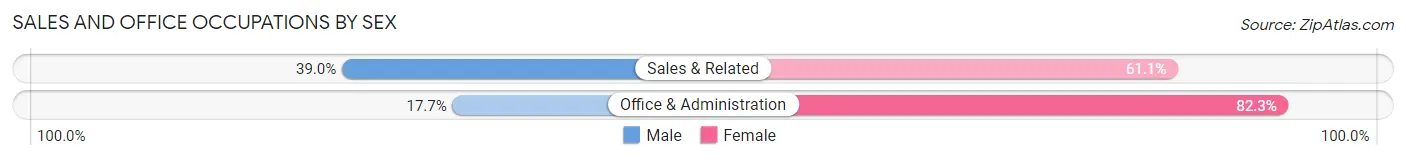
| Occupation | Male | Female |
| Sales & Related | 3,291 (39.0%) | 5,158 (61.1%) |
| Office & Administration | 1,972 (17.7%) | 9,172 (82.3%) |
| Total (Category) | 5,263 (26.9%) | 14,330 (73.1%) |
| Total (Overall) | 46,759 (47.2%) | 52,248 (52.8%) |
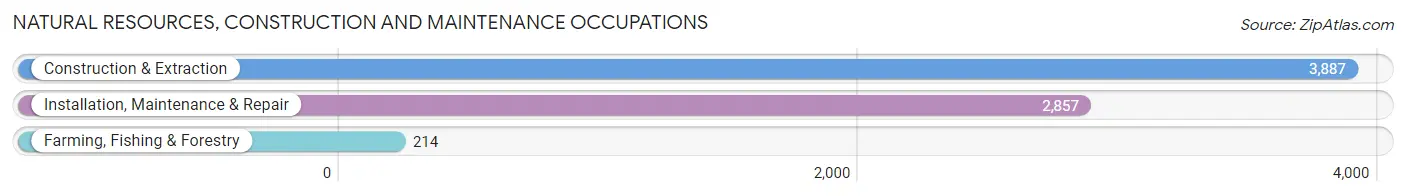
Natural Resources, Construction and Maintenance Occupations
The most common Natural Resources, Construction and Maintenance occupations in Hinds County are Construction & Extraction (3,887 | 3.9%), Installation, Maintenance & Repair (2,857 | 2.9%), and Farming, Fishing & Forestry (214 | 0.2%).
Natural Resources, Construction and Maintenance Occupations by Sex
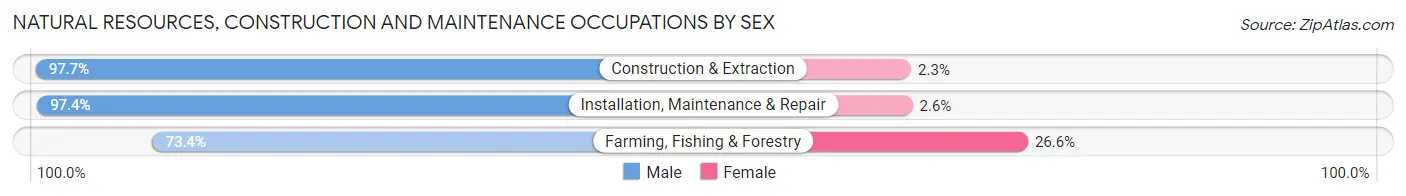
| Occupation | Male | Female |
| Farming, Fishing & Forestry | 157 (73.4%) | 57 (26.6%) |
| Construction & Extraction | 3,796 (97.7%) | 91 (2.3%) |
| Installation, Maintenance & Repair | 2,782 (97.4%) | 75 (2.6%) |
| Total (Category) | 6,735 (96.8%) | 223 (3.2%) |
| Total (Overall) | 46,759 (47.2%) | 52,248 (52.8%) |
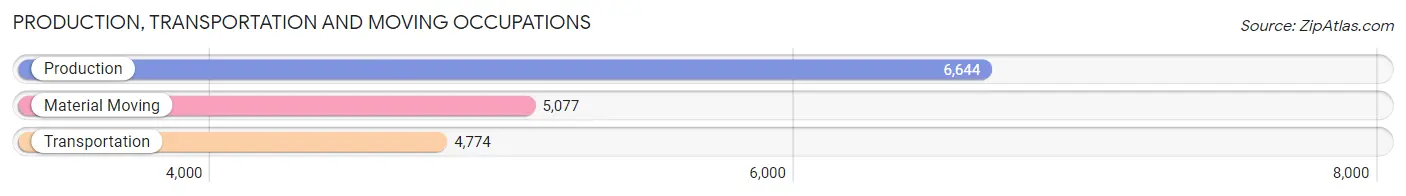
Production, Transportation and Moving Occupations
The most common Production, Transportation and Moving occupations in Hinds County are Production (6,644 | 6.7%), Material Moving (5,077 | 5.1%), and Transportation (4,774 | 4.8%).
Production, Transportation and Moving Occupations by Sex
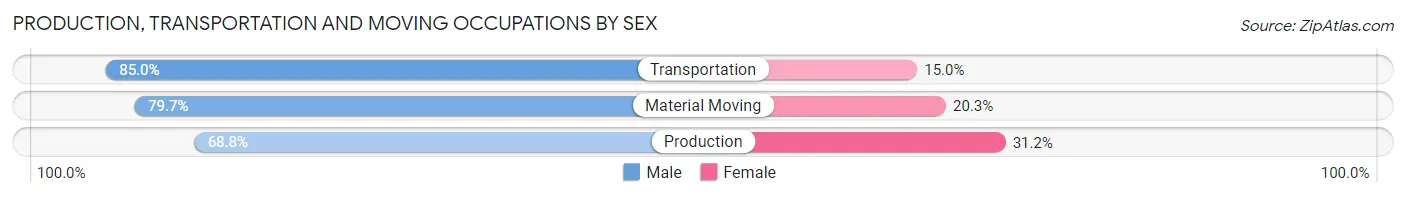
| Occupation | Male | Female |
| Production | 4,570 (68.8%) | 2,074 (31.2%) |
| Transportation | 4,058 (85.0%) | 716 (15.0%) |
| Material Moving | 4,047 (79.7%) | 1,030 (20.3%) |
| Total (Category) | 12,675 (76.8%) | 3,820 (23.2%) |
| Total (Overall) | 46,759 (47.2%) | 52,248 (52.8%) |
Employment Industries by Sex in Hinds County
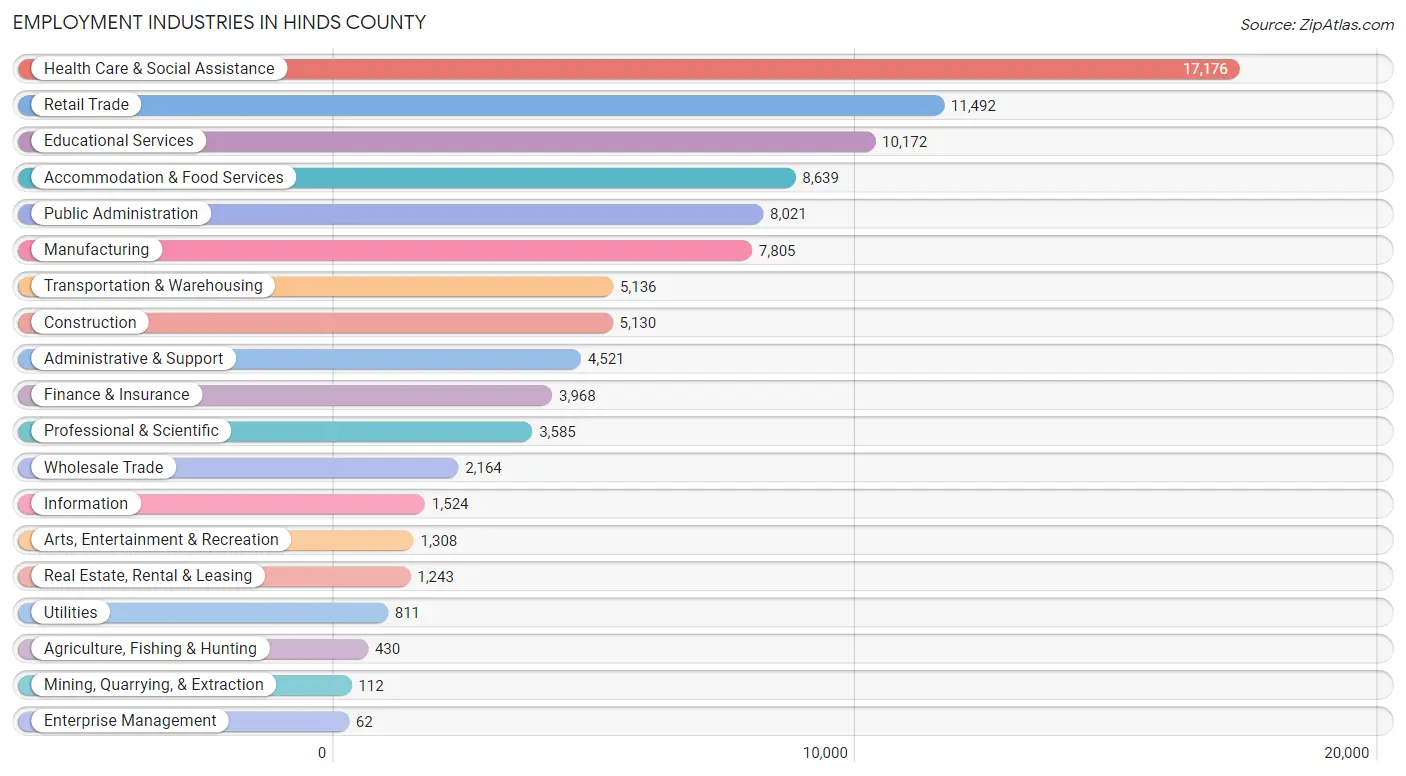
Employment Industries in Hinds County
The major employment industries in Hinds County include Health Care & Social Assistance (17,176 | 17.3%), Retail Trade (11,492 | 11.6%), Educational Services (10,172 | 10.3%), Accommodation & Food Services (8,639 | 8.7%), and Public Administration (8,021 | 8.1%).
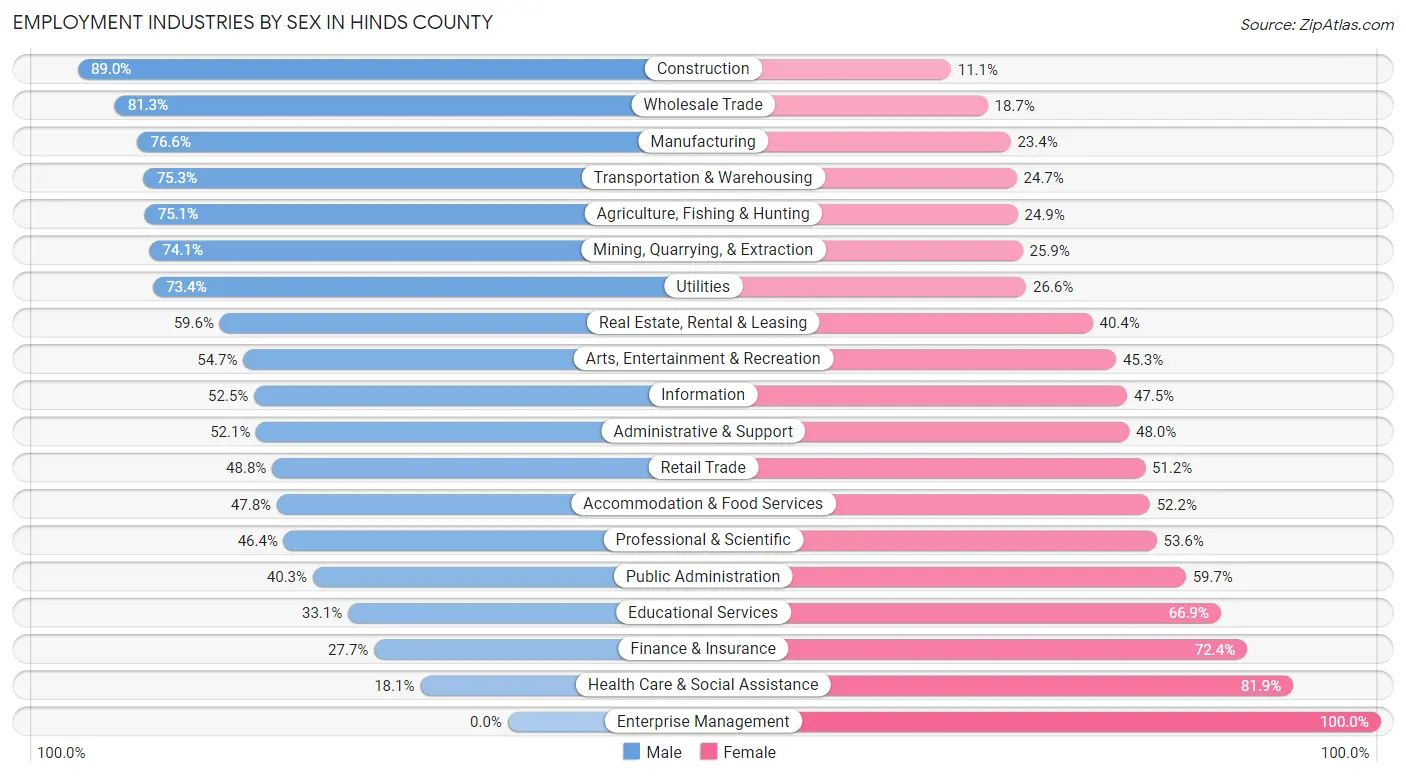
Employment Industries by Sex in Hinds County
The Hinds County industries that see more men than women are Construction (88.9%), Wholesale Trade (81.3%), and Manufacturing (76.6%), whereas the industries that tend to have a higher number of women are Enterprise Management (100.0%), Health Care & Social Assistance (81.9%), and Finance & Insurance (72.4%).
| Industry | Male | Female |
| Agriculture, Fishing & Hunting | 323 (75.1%) | 107 (24.9%) |
| Mining, Quarrying, & Extraction | 83 (74.1%) | 29 (25.9%) |
| Construction | 4,563 (88.9%) | 567 (11.1%) |
| Manufacturing | 5,979 (76.6%) | 1,826 (23.4%) |
| Wholesale Trade | 1,760 (81.3%) | 404 (18.7%) |
| Retail Trade | 5,603 (48.8%) | 5,889 (51.2%) |
| Transportation & Warehousing | 3,869 (75.3%) | 1,267 (24.7%) |
| Utilities | 595 (73.4%) | 216 (26.6%) |
| Information | 800 (52.5%) | 724 (47.5%) |
| Finance & Insurance | 1,097 (27.7%) | 2,871 (72.4%) |
| Real Estate, Rental & Leasing | 741 (59.6%) | 502 (40.4%) |
| Professional & Scientific | 1,662 (46.4%) | 1,923 (53.6%) |
| Enterprise Management | 0 (0.0%) | 62 (100.0%) |
| Administrative & Support | 2,353 (52.0%) | 2,168 (47.9%) |
| Educational Services | 3,363 (33.1%) | 6,809 (66.9%) |
| Health Care & Social Assistance | 3,111 (18.1%) | 14,065 (81.9%) |
| Arts, Entertainment & Recreation | 716 (54.7%) | 592 (45.3%) |
| Accommodation & Food Services | 4,128 (47.8%) | 4,511 (52.2%) |
| Public Administration | 3,235 (40.3%) | 4,786 (59.7%) |
| Total | 46,759 (47.2%) | 52,248 (52.8%) |
Education in Hinds County
School Enrollment in Hinds County
The most common levels of schooling among the 63,020 students in Hinds County are college / undergraduate (15,190 | 24.1%), middle school (12,472 | 19.8%), and high school (11,667 | 18.5%).
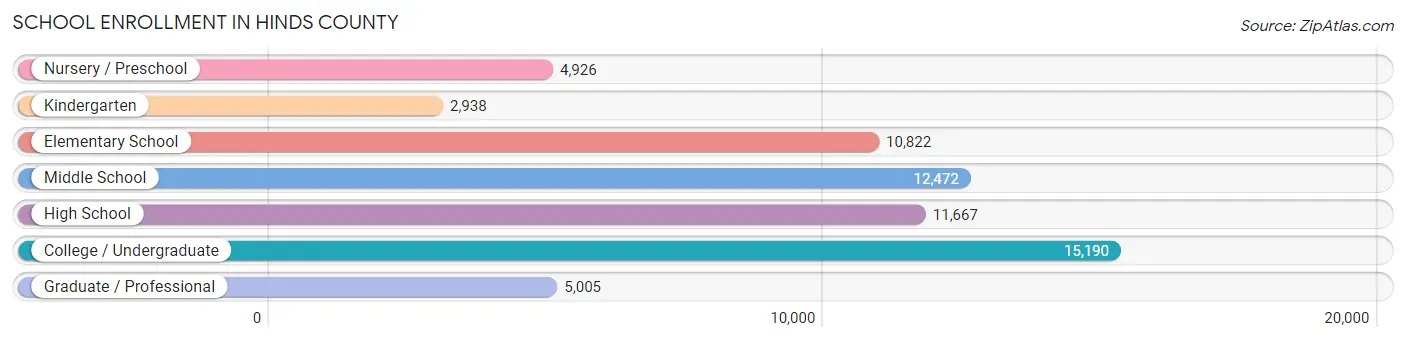
| School Level | # Students | % Students |
| Nursery / Preschool | 4,926 | 7.8% |
| Kindergarten | 2,938 | 4.7% |
| Elementary School | 10,822 | 17.2% |
| Middle School | 12,472 | 19.8% |
| High School | 11,667 | 18.5% |
| College / Undergraduate | 15,190 | 24.1% |
| Graduate / Professional | 5,005 | 7.9% |
| Total | 63,020 | 100.0% |
School Enrollment by Age by Funding Source in Hinds County
Out of a total of 63,020 students who are enrolled in schools in Hinds County, 12,289 (19.5%) attend a private institution, while the remaining 50,731 (80.5%) are enrolled in public schools. The age group of 3 to 4 year olds has the highest likelihood of being enrolled in private schools, with 2,129 (52.0% in the age bracket) enrolled. Conversely, the age group of 18 to 19 year olds has the lowest likelihood of being enrolled in a private school, with 5,644 (88.7% in the age bracket) attending a public institution.
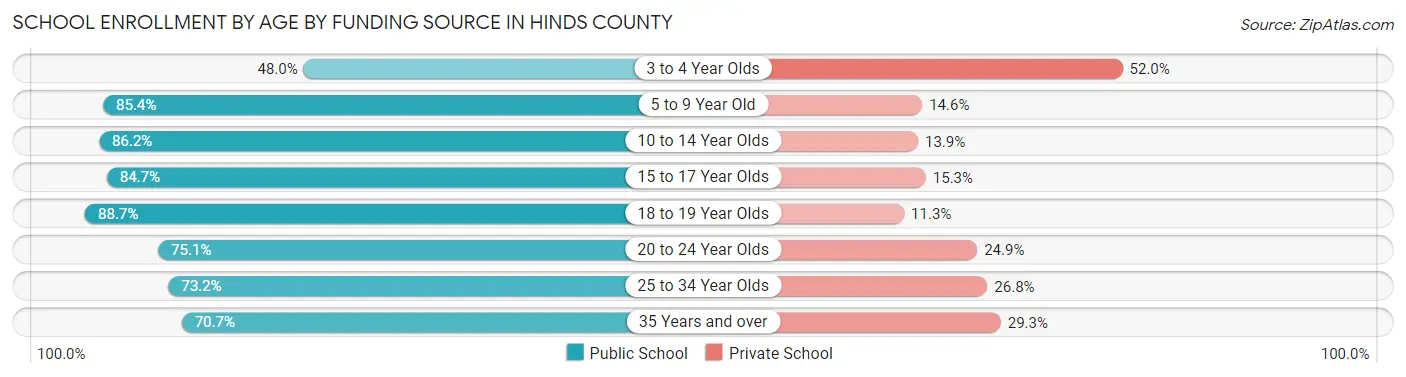
| Age Bracket | Public School | Private School |
| 3 to 4 Year Olds | 1,968 (48.0%) | 2,129 (52.0%) |
| 5 to 9 Year Old | 10,931 (85.4%) | 1,873 (14.6%) |
| 10 to 14 Year Olds | 13,371 (86.2%) | 2,150 (13.9%) |
| 15 to 17 Year Olds | 7,379 (84.7%) | 1,334 (15.3%) |
| 18 to 19 Year Olds | 5,644 (88.7%) | 717 (11.3%) |
| 20 to 24 Year Olds | 6,104 (75.1%) | 2,022 (24.9%) |
| 25 to 34 Year Olds | 2,968 (73.2%) | 1,085 (26.8%) |
| 35 Years and over | 2,366 (70.7%) | 979 (29.3%) |
| Total | 50,731 (80.5%) | 12,289 (19.5%) |
Educational Attainment by Field of Study in Hinds County
Business (9,672 | 19.7%), science & technology (7,314 | 14.9%), education (7,143 | 14.5%), bio, nature & agricultural (3,802 | 7.7%), and arts & humanities (3,692 | 7.5%) are the most common fields of study among 49,091 individuals in Hinds County who have obtained a bachelor's degree or higher.
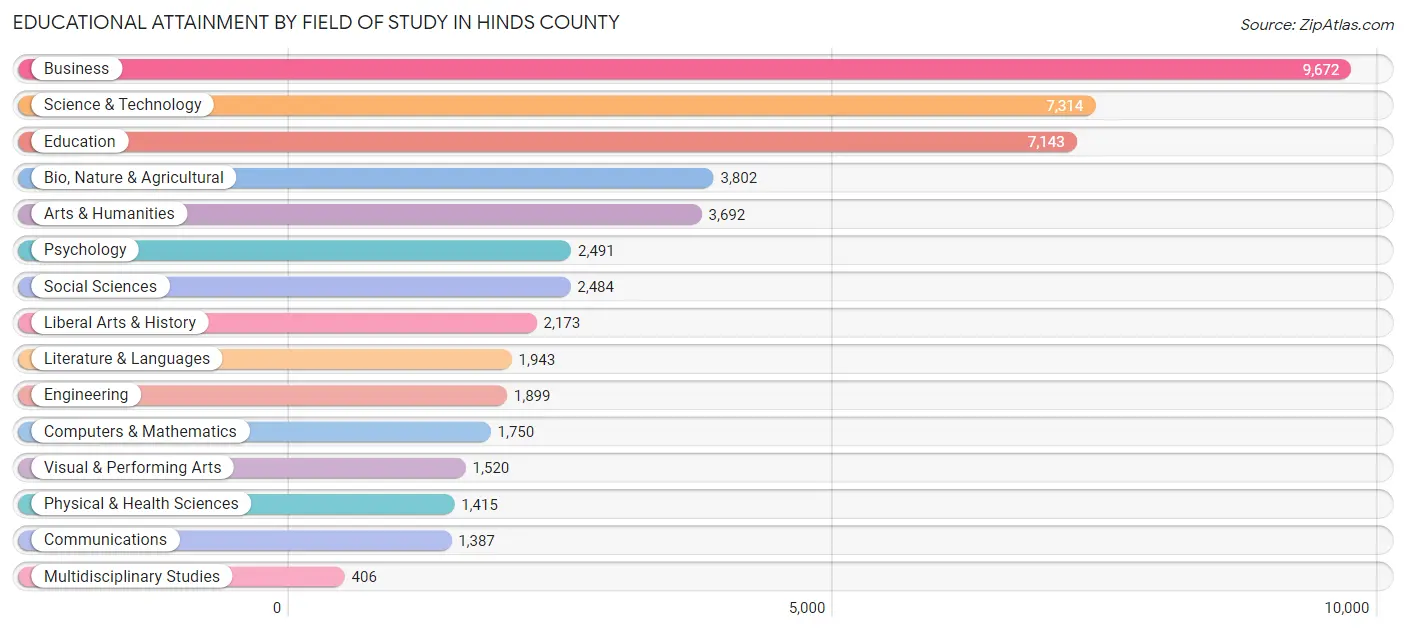
| Field of Study | # Graduates | % Graduates |
| Computers & Mathematics | 1,750 | 3.6% |
| Bio, Nature & Agricultural | 3,802 | 7.7% |
| Physical & Health Sciences | 1,415 | 2.9% |
| Psychology | 2,491 | 5.1% |
| Social Sciences | 2,484 | 5.1% |
| Engineering | 1,899 | 3.9% |
| Multidisciplinary Studies | 406 | 0.8% |
| Science & Technology | 7,314 | 14.9% |
| Business | 9,672 | 19.7% |
| Education | 7,143 | 14.5% |
| Literature & Languages | 1,943 | 4.0% |
| Liberal Arts & History | 2,173 | 4.4% |
| Visual & Performing Arts | 1,520 | 3.1% |
| Communications | 1,387 | 2.8% |
| Arts & Humanities | 3,692 | 7.5% |
| Total | 49,091 | 100.0% |
Transportation & Commute in Hinds County
Vehicle Availability by Sex in Hinds County
The most prevalent vehicle ownership categories in Hinds County are males with 2 vehicles (18,418, accounting for 40.5%) and females with 2 vehicles (18,006, making up 36.6%).
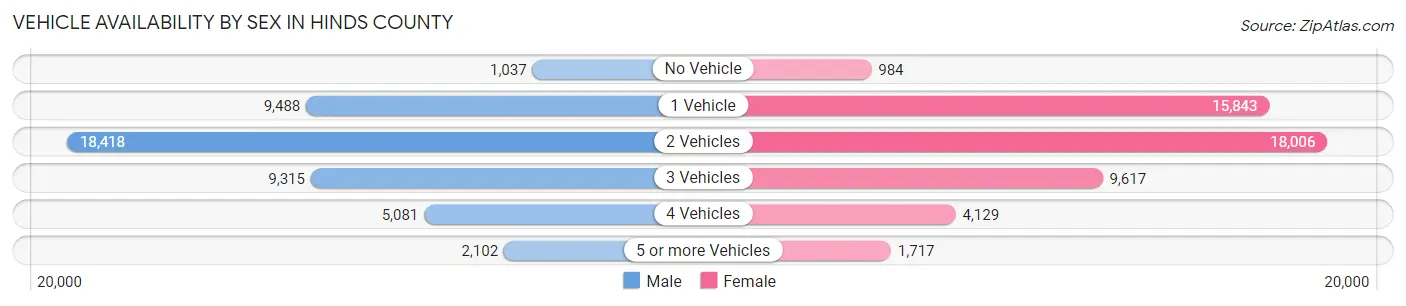
| Vehicles Available | Male | Female |
| No Vehicle | 1,037 (2.3%) | 984 (2.0%) |
| 1 Vehicle | 9,488 (20.9%) | 15,843 (31.5%) |
| 2 Vehicles | 18,418 (40.5%) | 18,006 (35.8%) |
| 3 Vehicles | 9,315 (20.5%) | 9,617 (19.1%) |
| 4 Vehicles | 5,081 (11.2%) | 4,129 (8.2%) |
| 5 or more Vehicles | 2,102 (4.6%) | 1,717 (3.4%) |
| Total | 45,441 (100.0%) | 50,296 (100.0%) |
Commute Time in Hinds County
The most frequently occuring commute durations in Hinds County are 20 to 24 minutes (19,075 commuters, 21.1%), 15 to 19 minutes (17,531 commuters, 19.4%), and 30 to 34 minutes (13,183 commuters, 14.6%).
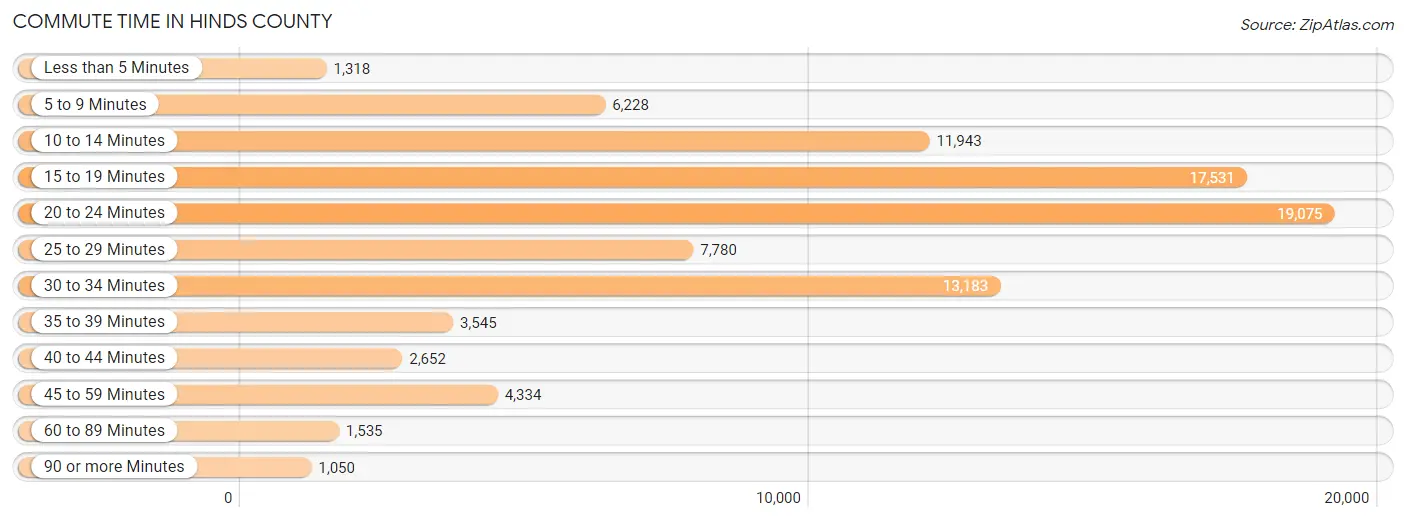
| Commute Time | # Commuters | % Commuters |
| Less than 5 Minutes | 1,318 | 1.5% |
| 5 to 9 Minutes | 6,228 | 6.9% |
| 10 to 14 Minutes | 11,943 | 13.2% |
| 15 to 19 Minutes | 17,531 | 19.4% |
| 20 to 24 Minutes | 19,075 | 21.1% |
| 25 to 29 Minutes | 7,780 | 8.6% |
| 30 to 34 Minutes | 13,183 | 14.6% |
| 35 to 39 Minutes | 3,545 | 3.9% |
| 40 to 44 Minutes | 2,652 | 2.9% |
| 45 to 59 Minutes | 4,334 | 4.8% |
| 60 to 89 Minutes | 1,535 | 1.7% |
| 90 or more Minutes | 1,050 | 1.2% |
Commute Time by Sex in Hinds County
The most common commute times in Hinds County are 20 to 24 minutes (8,945 commuters, 20.7%) for males and 20 to 24 minutes (10,130 commuters, 21.6%) for females.
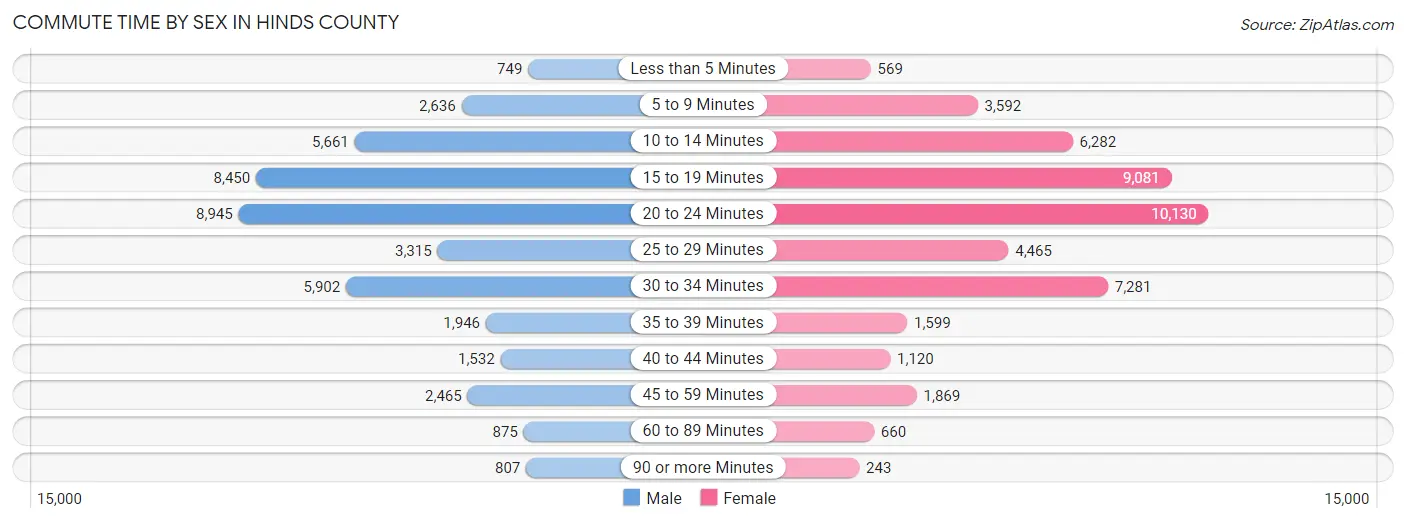
| Commute Time | Male | Female |
| Less than 5 Minutes | 749 (1.7%) | 569 (1.2%) |
| 5 to 9 Minutes | 2,636 (6.1%) | 3,592 (7.7%) |
| 10 to 14 Minutes | 5,661 (13.1%) | 6,282 (13.4%) |
| 15 to 19 Minutes | 8,450 (19.5%) | 9,081 (19.4%) |
| 20 to 24 Minutes | 8,945 (20.7%) | 10,130 (21.6%) |
| 25 to 29 Minutes | 3,315 (7.7%) | 4,465 (9.5%) |
| 30 to 34 Minutes | 5,902 (13.6%) | 7,281 (15.5%) |
| 35 to 39 Minutes | 1,946 (4.5%) | 1,599 (3.4%) |
| 40 to 44 Minutes | 1,532 (3.5%) | 1,120 (2.4%) |
| 45 to 59 Minutes | 2,465 (5.7%) | 1,869 (4.0%) |
| 60 to 89 Minutes | 875 (2.0%) | 660 (1.4%) |
| 90 or more Minutes | 807 (1.9%) | 243 (0.5%) |
Time of Departure to Work by Sex in Hinds County
The most frequent times of departure to work in Hinds County are 4:00 PM to 11:59 PM (5,932, 13.7%) for males and 7:00 AM to 7:29 AM (9,475, 20.2%) for females.
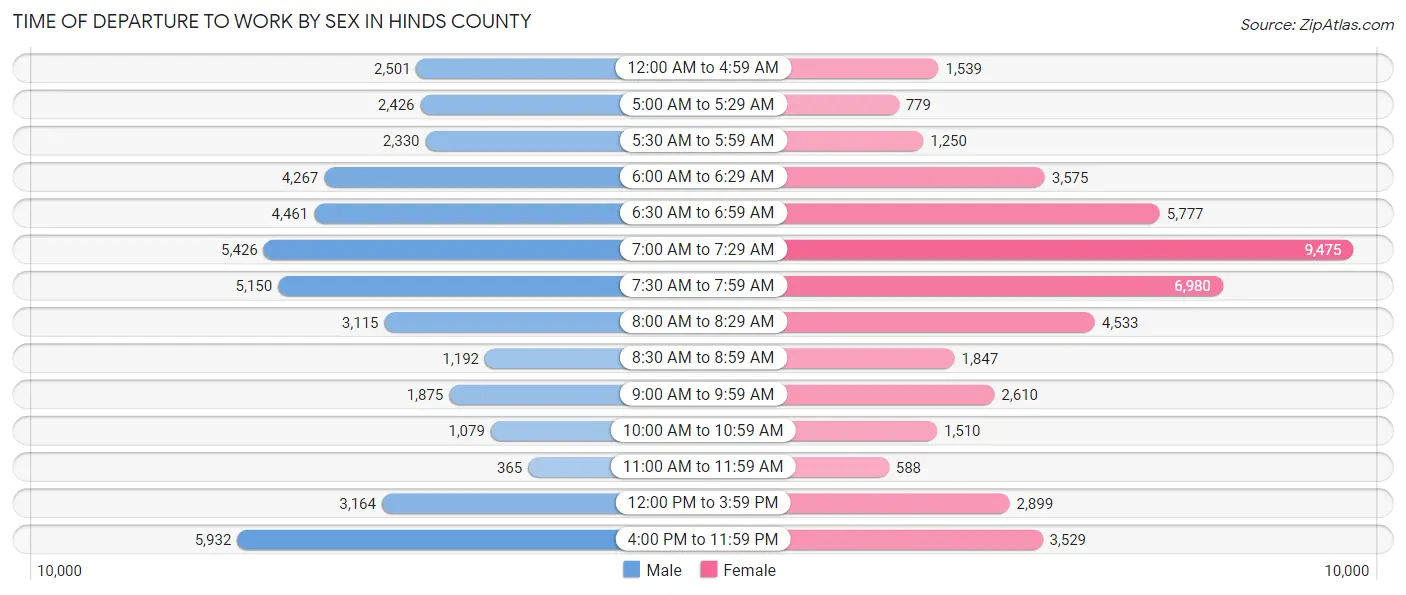
| Time of Departure | Male | Female |
| 12:00 AM to 4:59 AM | 2,501 (5.8%) | 1,539 (3.3%) |
| 5:00 AM to 5:29 AM | 2,426 (5.6%) | 779 (1.7%) |
| 5:30 AM to 5:59 AM | 2,330 (5.4%) | 1,250 (2.7%) |
| 6:00 AM to 6:29 AM | 4,267 (9.9%) | 3,575 (7.6%) |
| 6:30 AM to 6:59 AM | 4,461 (10.3%) | 5,777 (12.3%) |
| 7:00 AM to 7:29 AM | 5,426 (12.5%) | 9,475 (20.2%) |
| 7:30 AM to 7:59 AM | 5,150 (11.9%) | 6,980 (14.9%) |
| 8:00 AM to 8:29 AM | 3,115 (7.2%) | 4,533 (9.7%) |
| 8:30 AM to 8:59 AM | 1,192 (2.8%) | 1,847 (3.9%) |
| 9:00 AM to 9:59 AM | 1,875 (4.3%) | 2,610 (5.6%) |
| 10:00 AM to 10:59 AM | 1,079 (2.5%) | 1,510 (3.2%) |
| 11:00 AM to 11:59 AM | 365 (0.8%) | 588 (1.3%) |
| 12:00 PM to 3:59 PM | 3,164 (7.3%) | 2,899 (6.2%) |
| 4:00 PM to 11:59 PM | 5,932 (13.7%) | 3,529 (7.5%) |
| Total | 43,283 (100.0%) | 46,891 (100.0%) |
Housing Occupancy in Hinds County
Occupancy by Ownership in Hinds County
Of the total 89,585 dwellings in Hinds County, owner-occupied units account for 51,765 (57.8%), while renter-occupied units make up 37,820 (42.2%).
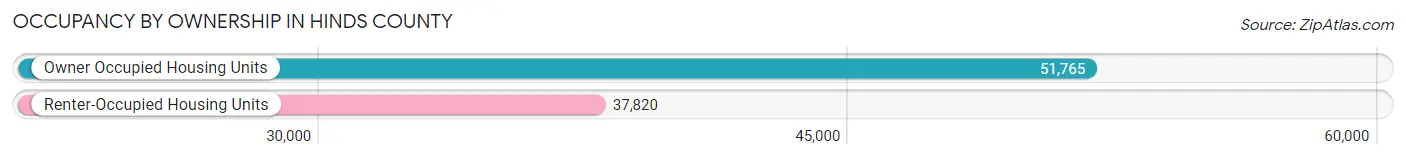
| Occupancy | # Housing Units | % Housing Units |
| Owner Occupied Housing Units | 51,765 | 57.8% |
| Renter-Occupied Housing Units | 37,820 | 42.2% |
| Total Occupied Housing Units | 89,585 | 100.0% |
Occupancy by Household Size in Hinds County
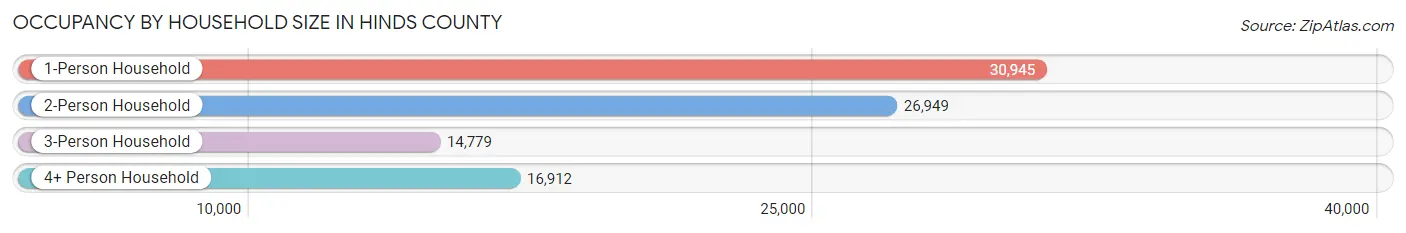
| Household Size | # Housing Units | % Housing Units |
| 1-Person Household | 30,945 | 34.5% |
| 2-Person Household | 26,949 | 30.1% |
| 3-Person Household | 14,779 | 16.5% |
| 4+ Person Household | 16,912 | 18.9% |
| Total Housing Units | 89,585 | 100.0% |
Occupancy by Ownership by Household Size in Hinds County
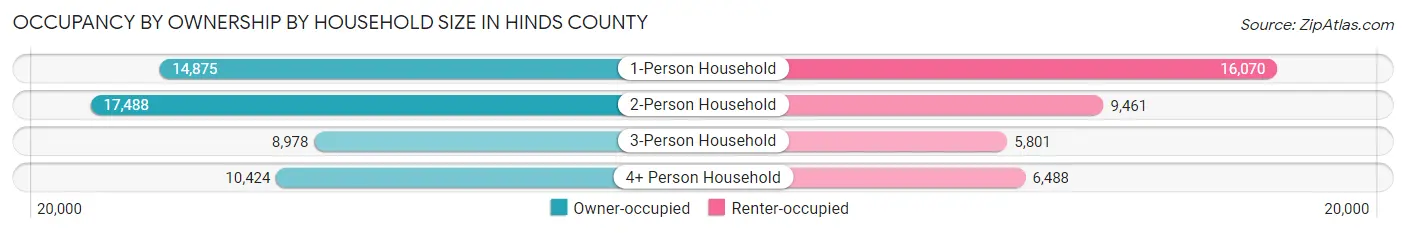
| Household Size | Owner-occupied | Renter-occupied |
| 1-Person Household | 14,875 (48.1%) | 16,070 (51.9%) |
| 2-Person Household | 17,488 (64.9%) | 9,461 (35.1%) |
| 3-Person Household | 8,978 (60.8%) | 5,801 (39.3%) |
| 4+ Person Household | 10,424 (61.6%) | 6,488 (38.4%) |
| Total Housing Units | 51,765 (57.8%) | 37,820 (42.2%) |
Occupancy by Educational Attainment in Hinds County
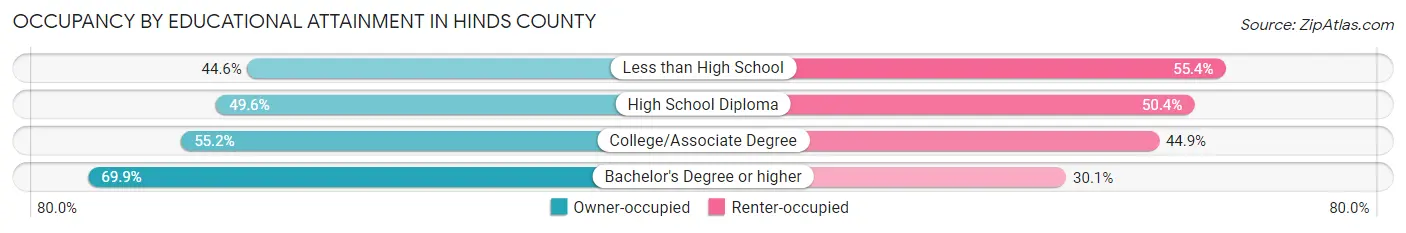
| Household Size | Owner-occupied | Renter-occupied |
| Less than High School | 4,035 (44.6%) | 5,005 (55.4%) |
| High School Diploma | 9,360 (49.6%) | 9,519 (50.4%) |
| College/Associate Degree | 17,676 (55.1%) | 14,374 (44.9%) |
| Bachelor's Degree or higher | 20,694 (69.9%) | 8,922 (30.1%) |
Occupancy by Age of Householder in Hinds County
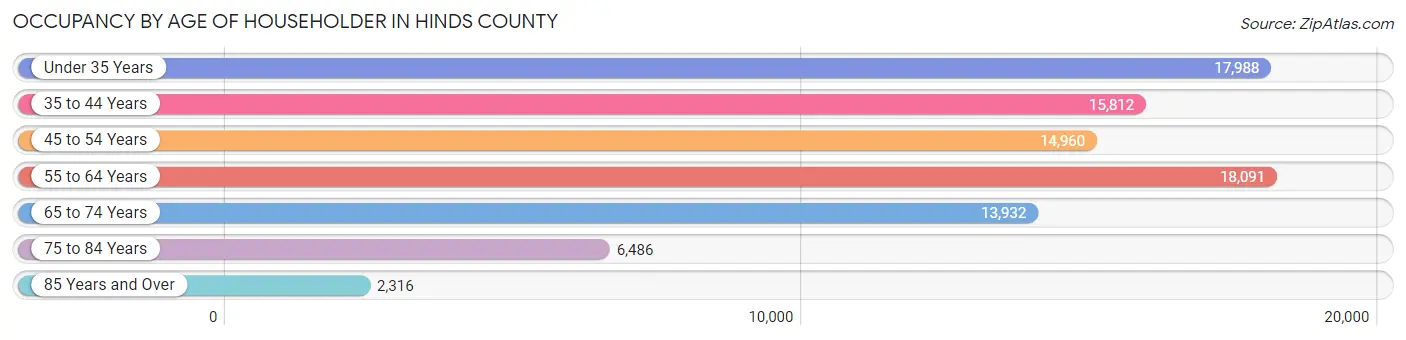
| Age Bracket | # Households | % Households |
| Under 35 Years | 17,988 | 20.1% |
| 35 to 44 Years | 15,812 | 17.6% |
| 45 to 54 Years | 14,960 | 16.7% |
| 55 to 64 Years | 18,091 | 20.2% |
| 65 to 74 Years | 13,932 | 15.5% |
| 75 to 84 Years | 6,486 | 7.2% |
| 85 Years and Over | 2,316 | 2.6% |
| Total | 89,585 | 100.0% |
Housing Finances in Hinds County
Median Income by Occupancy in Hinds County
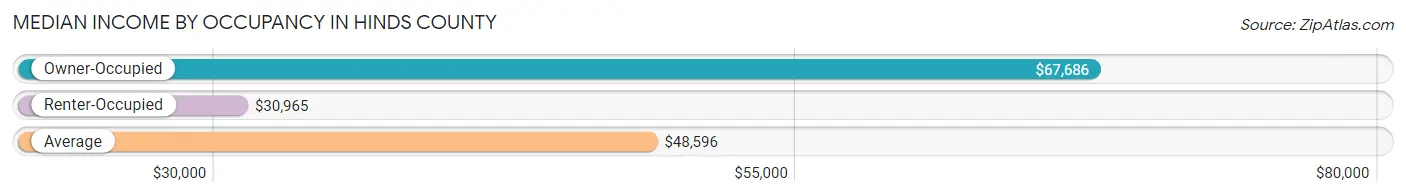
| Occupancy Type | # Households | Median Income |
| Owner-Occupied | 51,765 (57.8%) | $67,686 |
| Renter-Occupied | 37,820 (42.2%) | $30,965 |
| Average | 89,585 (100.0%) | $48,596 |
Occupancy by Householder Income Bracket in Hinds County
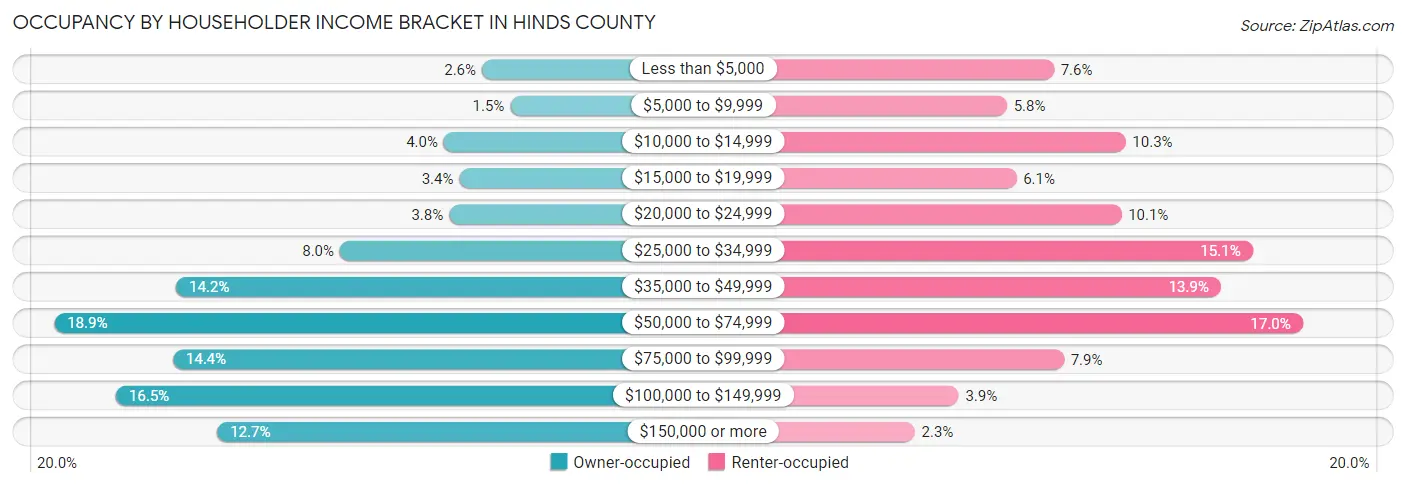
| Income Bracket | Owner-occupied | Renter-occupied |
| Less than $5,000 | 1,334 (2.6%) | 2,857 (7.5%) |
| $5,000 to $9,999 | 777 (1.5%) | 2,179 (5.8%) |
| $10,000 to $14,999 | 2,087 (4.0%) | 3,889 (10.3%) |
| $15,000 to $19,999 | 1,781 (3.4%) | 2,313 (6.1%) |
| $20,000 to $24,999 | 1,983 (3.8%) | 3,828 (10.1%) |
| $25,000 to $34,999 | 4,134 (8.0%) | 5,720 (15.1%) |
| $35,000 to $49,999 | 7,365 (14.2%) | 5,262 (13.9%) |
| $50,000 to $74,999 | 9,769 (18.9%) | 6,439 (17.0%) |
| $75,000 to $99,999 | 7,428 (14.3%) | 3,001 (7.9%) |
| $100,000 to $149,999 | 8,551 (16.5%) | 1,482 (3.9%) |
| $150,000 or more | 6,556 (12.7%) | 850 (2.2%) |
| Total | 51,765 (100.0%) | 37,820 (100.0%) |
Monthly Housing Cost Tiers in Hinds County
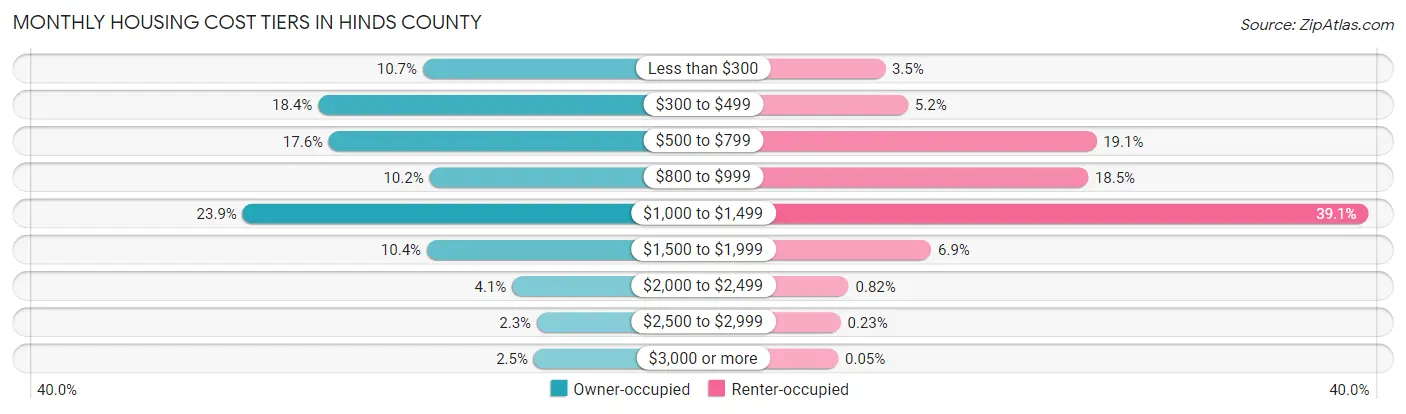
| Monthly Cost | Owner-occupied | Renter-occupied |
| Less than $300 | 5,525 (10.7%) | 1,323 (3.5%) |
| $300 to $499 | 9,515 (18.4%) | 1,963 (5.2%) |
| $500 to $799 | 9,107 (17.6%) | 7,207 (19.1%) |
| $800 to $999 | 5,269 (10.2%) | 6,976 (18.4%) |
| $1,000 to $1,499 | 12,395 (23.9%) | 14,787 (39.1%) |
| $1,500 to $1,999 | 5,370 (10.4%) | 2,611 (6.9%) |
| $2,000 to $2,499 | 2,117 (4.1%) | 312 (0.8%) |
| $2,500 to $2,999 | 1,174 (2.3%) | 86 (0.2%) |
| $3,000 or more | 1,293 (2.5%) | 20 (0.1%) |
| Total | 51,765 (100.0%) | 37,820 (100.0%) |
Physical Housing Characteristics in Hinds County
Housing Structures in Hinds County
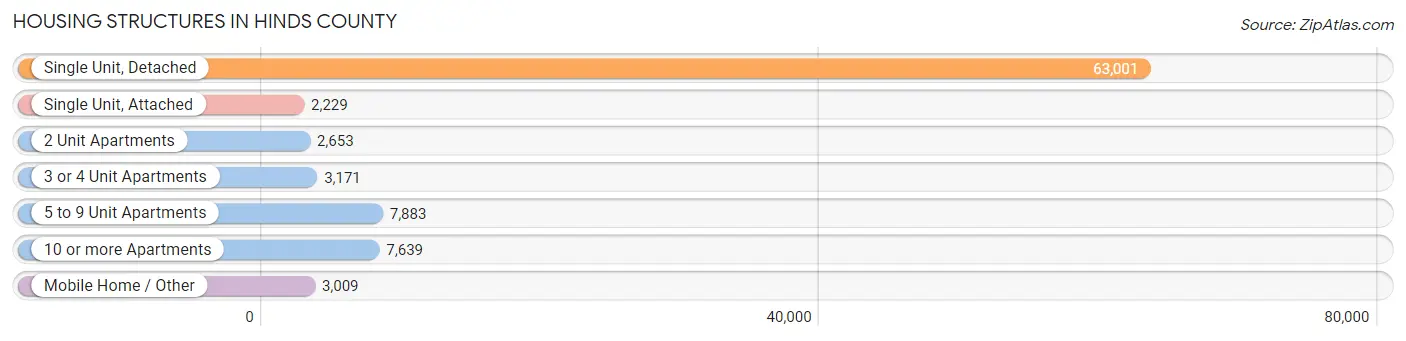
| Structure Type | # Housing Units | % Housing Units |
| Single Unit, Detached | 63,001 | 70.3% |
| Single Unit, Attached | 2,229 | 2.5% |
| 2 Unit Apartments | 2,653 | 3.0% |
| 3 or 4 Unit Apartments | 3,171 | 3.5% |
| 5 to 9 Unit Apartments | 7,883 | 8.8% |
| 10 or more Apartments | 7,639 | 8.5% |
| Mobile Home / Other | 3,009 | 3.4% |
| Total | 89,585 | 100.0% |
Housing Structures by Occupancy in Hinds County
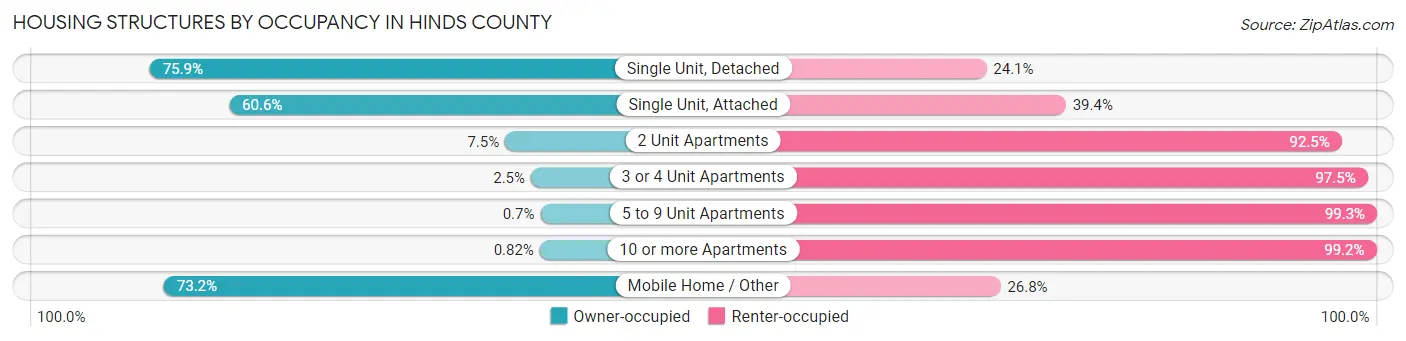
| Structure Type | Owner-occupied | Renter-occupied |
| Single Unit, Detached | 47,815 (75.9%) | 15,186 (24.1%) |
| Single Unit, Attached | 1,351 (60.6%) | 878 (39.4%) |
| 2 Unit Apartments | 199 (7.5%) | 2,454 (92.5%) |
| 3 or 4 Unit Apartments | 80 (2.5%) | 3,091 (97.5%) |
| 5 to 9 Unit Apartments | 55 (0.7%) | 7,828 (99.3%) |
| 10 or more Apartments | 63 (0.8%) | 7,576 (99.2%) |
| Mobile Home / Other | 2,202 (73.2%) | 807 (26.8%) |
| Total | 51,765 (57.8%) | 37,820 (42.2%) |
Housing Structures by Number of Rooms in Hinds County
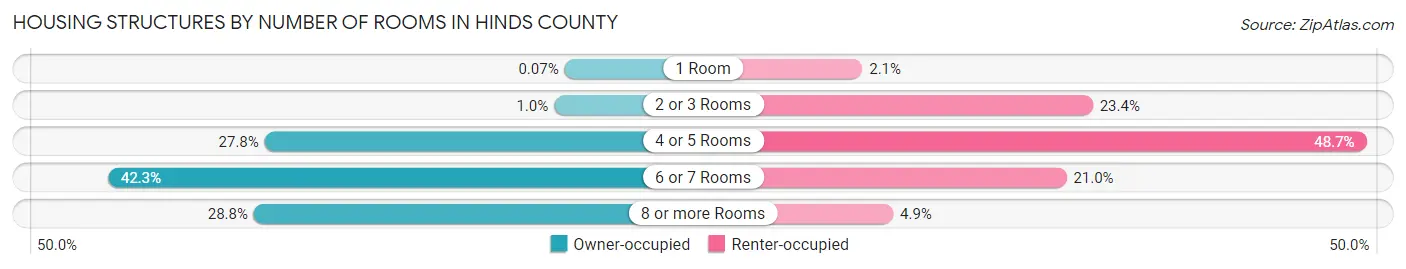
| Number of Rooms | Owner-occupied | Renter-occupied |
| 1 Room | 38 (0.1%) | 782 (2.1%) |
| 2 or 3 Rooms | 531 (1.0%) | 8,842 (23.4%) |
| 4 or 5 Rooms | 14,390 (27.8%) | 18,413 (48.7%) |
| 6 or 7 Rooms | 21,897 (42.3%) | 7,922 (20.9%) |
| 8 or more Rooms | 14,909 (28.8%) | 1,861 (4.9%) |
| Total | 51,765 (100.0%) | 37,820 (100.0%) |
Housing Structure by Heating Type in Hinds County
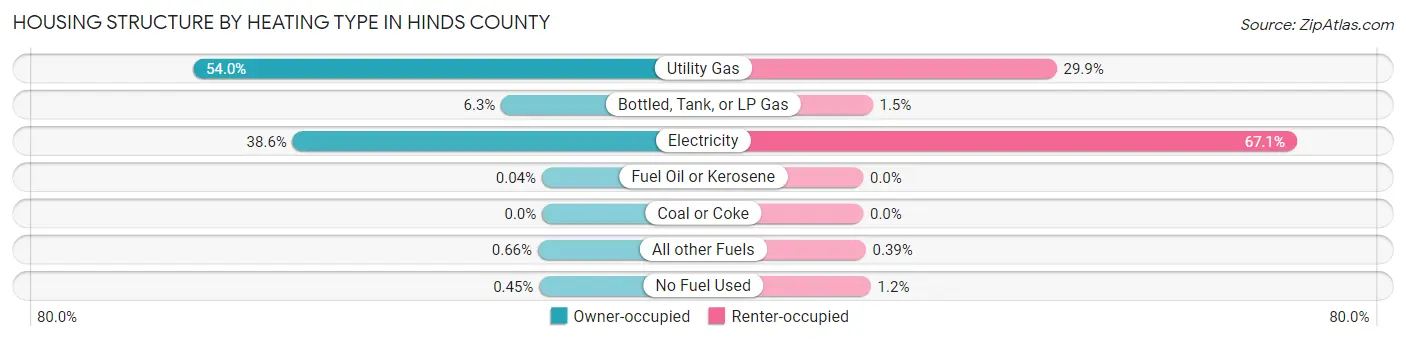
| Heating Type | Owner-occupied | Renter-occupied |
| Utility Gas | 27,936 (54.0%) | 11,311 (29.9%) |
| Bottled, Tank, or LP Gas | 3,271 (6.3%) | 556 (1.5%) |
| Electricity | 19,960 (38.6%) | 25,358 (67.0%) |
| Fuel Oil or Kerosene | 21 (0.0%) | 0 (0.0%) |
| Coal or Coke | 0 (0.0%) | 0 (0.0%) |
| All other Fuels | 343 (0.7%) | 149 (0.4%) |
| No Fuel Used | 234 (0.4%) | 446 (1.2%) |
| Total | 51,765 (100.0%) | 37,820 (100.0%) |
Household Vehicle Usage in Hinds County
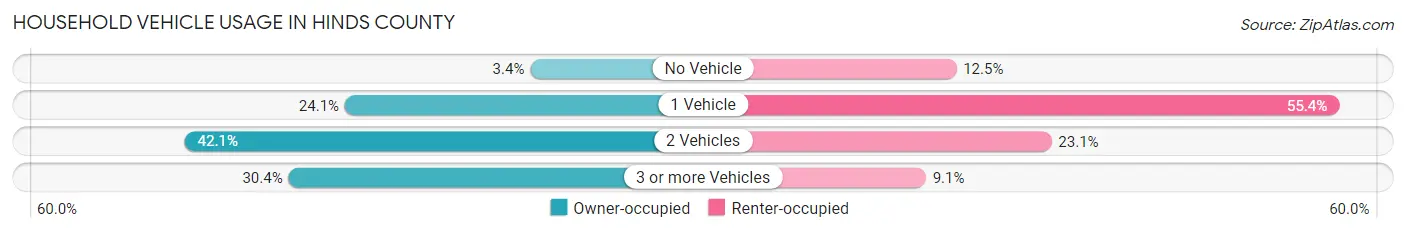
| Vehicles per Household | Owner-occupied | Renter-occupied |
| No Vehicle | 1,741 (3.4%) | 4,718 (12.5%) |
| 1 Vehicle | 12,487 (24.1%) | 20,932 (55.3%) |
| 2 Vehicles | 21,778 (42.1%) | 8,746 (23.1%) |
| 3 or more Vehicles | 15,759 (30.4%) | 3,424 (9.0%) |
| Total | 51,765 (100.0%) | 37,820 (100.0%) |
Real Estate & Mortgages in Hinds County
Real Estate and Mortgage Overview in Hinds County
| Characteristic | Without Mortgage | With Mortgage |
| Housing Units | 23,098 | 28,667 |
| Median Property Value | $109,300 | $159,600 |
| Median Household Income | $49,789 | $4,449 |
| Monthly Housing Costs | $431 | $1,293 |
| Real Estate Taxes | $1,029 | $3,924 |
Property Value by Mortgage Status in Hinds County
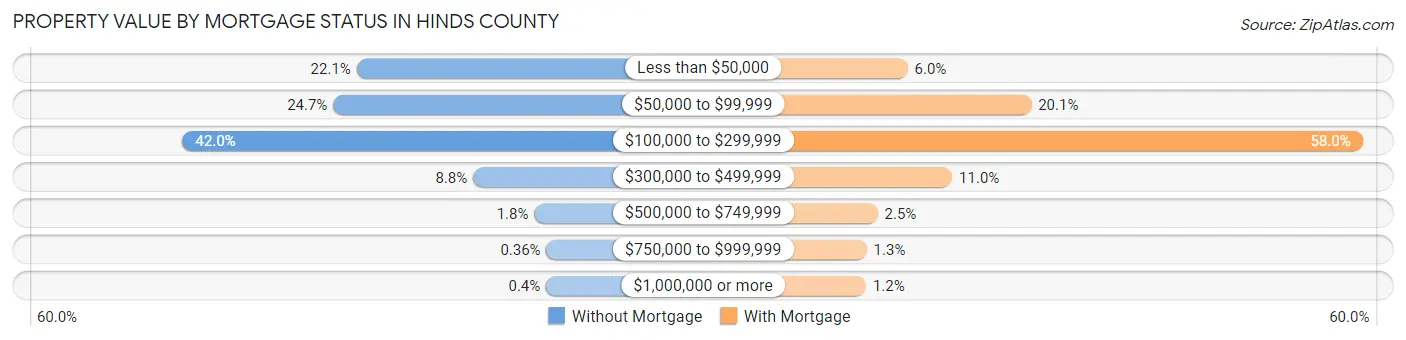
| Property Value | Without Mortgage | With Mortgage |
| Less than $50,000 | 5,093 (22.1%) | 1,706 (5.9%) |
| $50,000 to $99,999 | 5,713 (24.7%) | 5,757 (20.1%) |
| $100,000 to $299,999 | 9,693 (42.0%) | 16,612 (58.0%) |
| $300,000 to $499,999 | 2,021 (8.7%) | 3,165 (11.0%) |
| $500,000 to $749,999 | 404 (1.8%) | 721 (2.5%) |
| $750,000 to $999,999 | 82 (0.4%) | 365 (1.3%) |
| $1,000,000 or more | 92 (0.4%) | 341 (1.2%) |
| Total | 23,098 (100.0%) | 28,667 (100.0%) |
Household Income by Mortgage Status in Hinds County
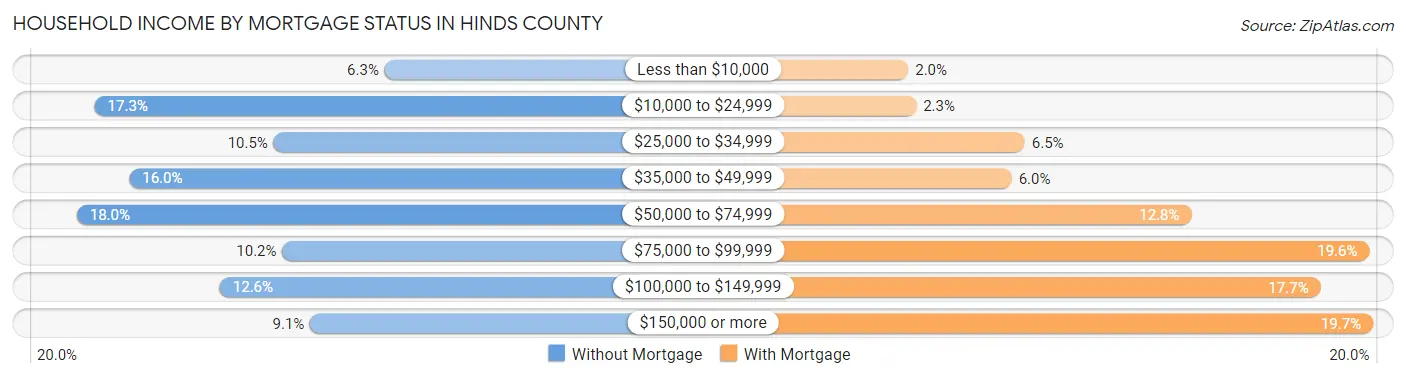
| Household Income | Without Mortgage | With Mortgage |
| Less than $10,000 | 1,450 (6.3%) | 575 (2.0%) |
| $10,000 to $24,999 | 4,002 (17.3%) | 661 (2.3%) |
| $25,000 to $34,999 | 2,427 (10.5%) | 1,849 (6.5%) |
| $35,000 to $49,999 | 3,699 (16.0%) | 1,707 (5.9%) |
| $50,000 to $74,999 | 4,160 (18.0%) | 3,666 (12.8%) |
| $75,000 to $99,999 | 2,351 (10.2%) | 5,609 (19.6%) |
| $100,000 to $149,999 | 2,902 (12.6%) | 5,077 (17.7%) |
| $150,000 or more | 2,107 (9.1%) | 5,649 (19.7%) |
| Total | 23,098 (100.0%) | 28,667 (100.0%) |
Property Value to Household Income Ratio in Hinds County
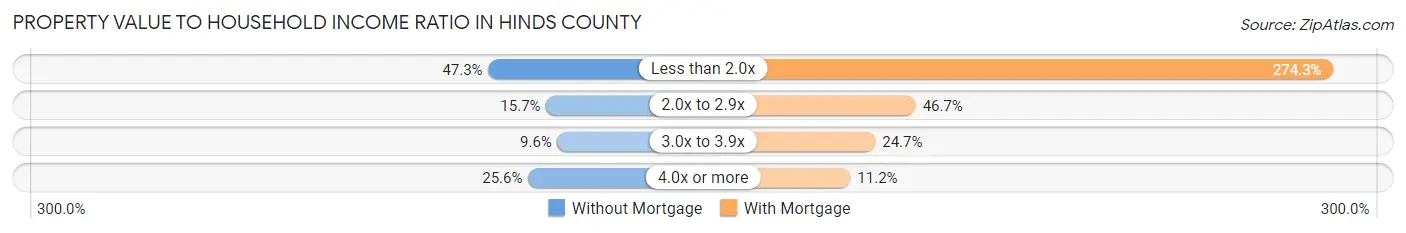
| Value-to-Income Ratio | Without Mortgage | With Mortgage |
| Less than 2.0x | 10,921 (47.3%) | 78,636 (274.3%) |
| 2.0x to 2.9x | 3,628 (15.7%) | 13,399 (46.7%) |
| 3.0x to 3.9x | 2,210 (9.6%) | 7,088 (24.7%) |
| 4.0x or more | 5,907 (25.6%) | 3,198 (11.2%) |
| Total | 23,098 (100.0%) | 28,667 (100.0%) |
Real Estate Taxes by Mortgage Status in Hinds County
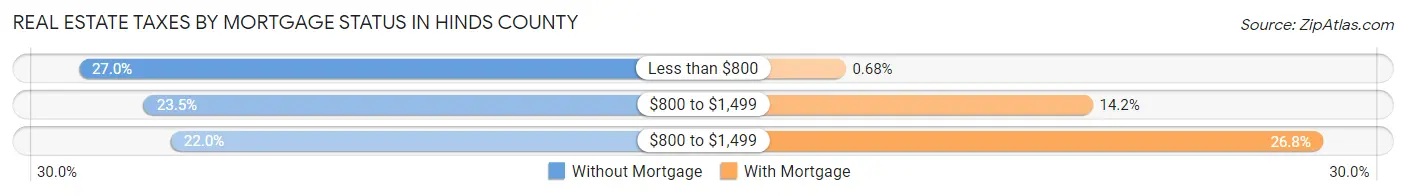
| Property Taxes | Without Mortgage | With Mortgage |
| Less than $800 | 6,242 (27.0%) | 195 (0.7%) |
| $800 to $1,499 | 5,419 (23.5%) | 4,076 (14.2%) |
| $800 to $1,499 | 5,077 (22.0%) | 7,692 (26.8%) |
| Total | 23,098 (100.0%) | 28,667 (100.0%) |
Health & Disability in Hinds County
Health Insurance Coverage by Age in Hinds County
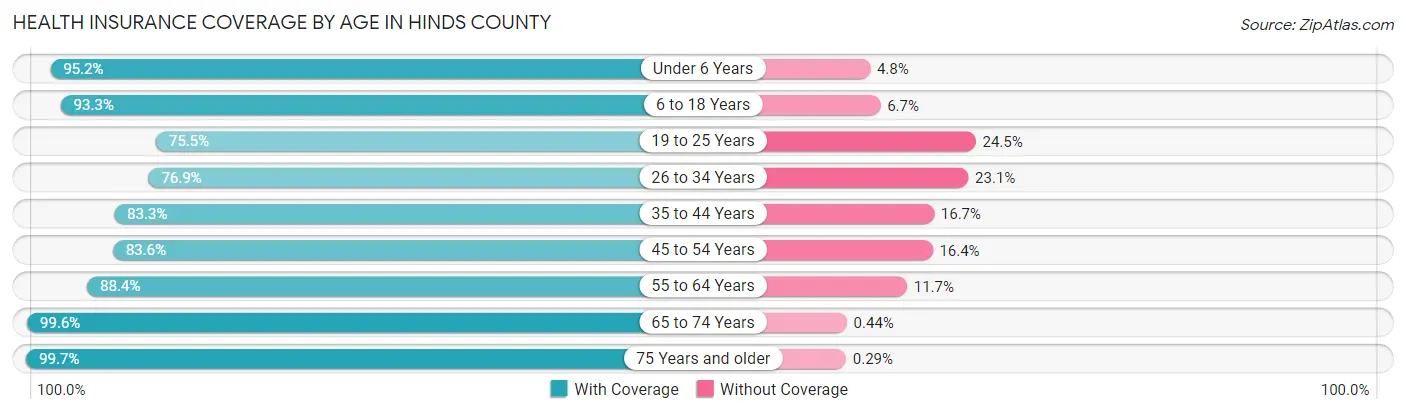
| Age Bracket | With Coverage | Without Coverage |
| Under 6 Years | 16,258 (95.2%) | 816 (4.8%) |
| 6 to 18 Years | 37,926 (93.3%) | 2,722 (6.7%) |
| 19 to 25 Years | 18,517 (75.5%) | 6,002 (24.5%) |
| 26 to 34 Years | 21,020 (76.9%) | 6,313 (23.1%) |
| 35 to 44 Years | 22,733 (83.3%) | 4,559 (16.7%) |
| 45 to 54 Years | 21,358 (83.6%) | 4,201 (16.4%) |
| 55 to 64 Years | 24,945 (88.3%) | 3,289 (11.7%) |
| 65 to 74 Years | 20,808 (99.6%) | 93 (0.4%) |
| 75 Years and older | 12,697 (99.7%) | 37 (0.3%) |
| Total | 196,262 (87.5%) | 28,032 (12.5%) |
Health Insurance Coverage by Citizenship Status in Hinds County
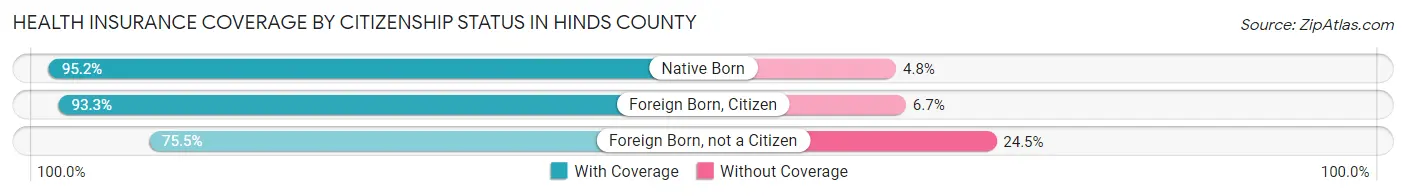
| Citizenship Status | With Coverage | Without Coverage |
| Native Born | 16,258 (95.2%) | 816 (4.8%) |
| Foreign Born, Citizen | 37,926 (93.3%) | 2,722 (6.7%) |
| Foreign Born, not a Citizen | 18,517 (75.5%) | 6,002 (24.5%) |
Health Insurance Coverage by Household Income in Hinds County
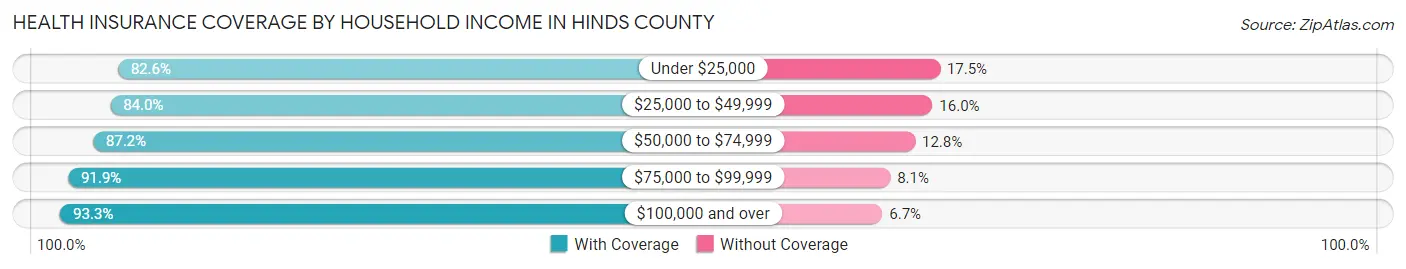
| Household Income | With Coverage | Without Coverage |
| Under $25,000 | 34,882 (82.6%) | 7,376 (17.4%) |
| $25,000 to $49,999 | 42,359 (84.0%) | 8,095 (16.0%) |
| $50,000 to $74,999 | 36,709 (87.2%) | 5,385 (12.8%) |
| $75,000 to $99,999 | 25,414 (91.9%) | 2,248 (8.1%) |
| $100,000 and over | 50,860 (93.3%) | 3,628 (6.7%) |
Public vs Private Health Insurance Coverage by Age in Hinds County
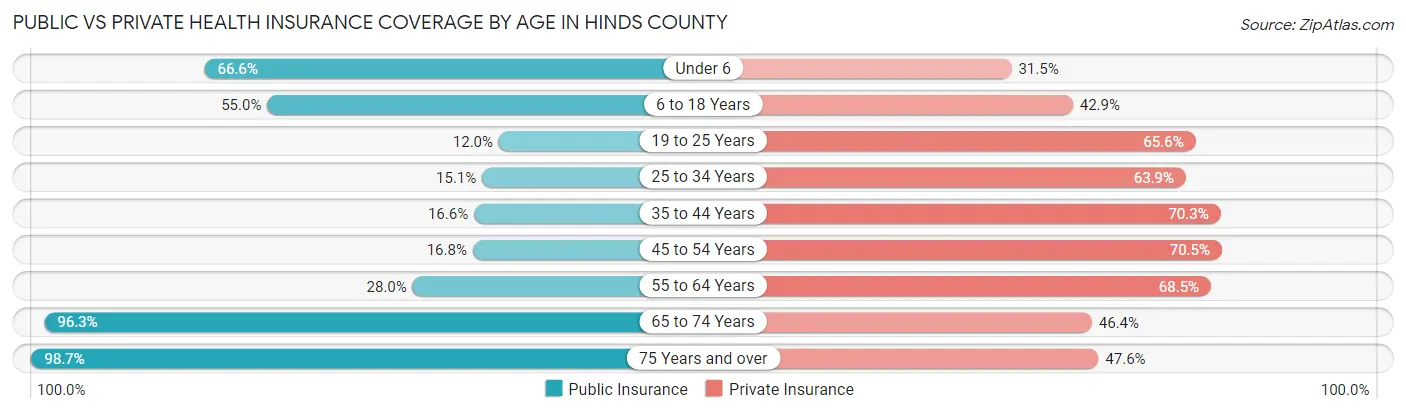
| Age Bracket | Public Insurance | Private Insurance |
| Under 6 | 11,371 (66.6%) | 5,379 (31.5%) |
| 6 to 18 Years | 22,341 (55.0%) | 17,429 (42.9%) |
| 19 to 25 Years | 2,934 (12.0%) | 16,094 (65.6%) |
| 25 to 34 Years | 4,121 (15.1%) | 17,455 (63.9%) |
| 35 to 44 Years | 4,529 (16.6%) | 19,182 (70.3%) |
| 45 to 54 Years | 4,299 (16.8%) | 18,025 (70.5%) |
| 55 to 64 Years | 7,900 (28.0%) | 19,343 (68.5%) |
| 65 to 74 Years | 20,134 (96.3%) | 9,702 (46.4%) |
| 75 Years and over | 12,573 (98.7%) | 6,065 (47.6%) |
| Total | 90,202 (40.2%) | 128,674 (57.4%) |
Disability Status by Sex by Age in Hinds County
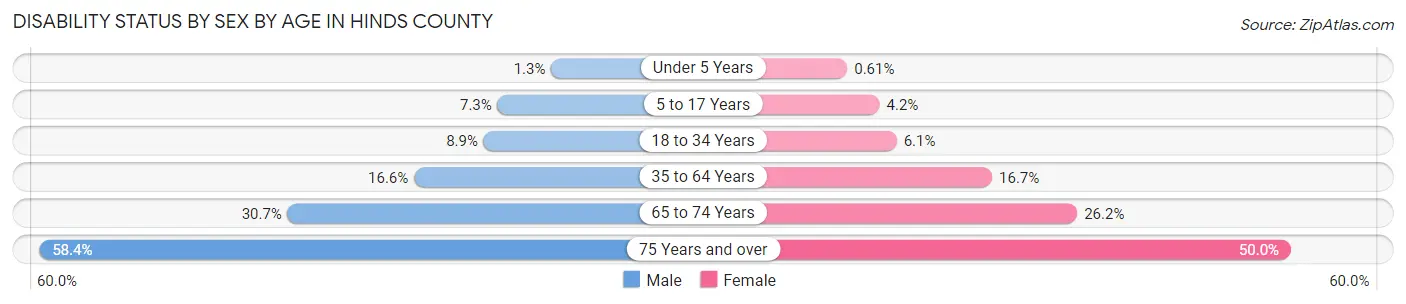
| Age Bracket | Male | Female |
| Under 5 Years | 98 (1.3%) | 41 (0.6%) |
| 5 to 17 Years | 1,474 (7.3%) | 808 (4.2%) |
| 18 to 34 Years | 2,329 (8.9%) | 1,829 (6.1%) |
| 35 to 64 Years | 6,174 (16.6%) | 7,354 (16.7%) |
| 65 to 74 Years | 2,842 (30.7%) | 3,053 (26.2%) |
| 75 Years and over | 2,714 (58.4%) | 4,044 (50.0%) |
Disability Class by Sex by Age in Hinds County
Disability Class: Hearing Difficulty
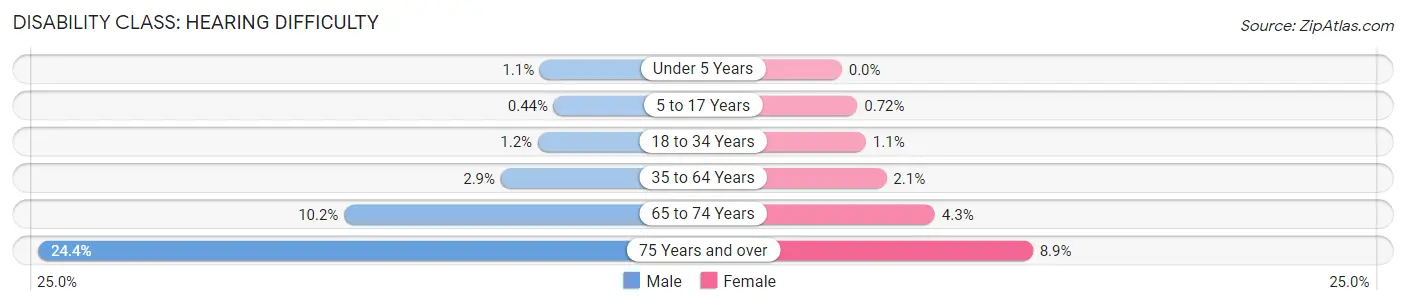
| Age Bracket | Male | Female |
| Under 5 Years | 79 (1.1%) | 0 (0.0%) |
| 5 to 17 Years | 88 (0.4%) | 138 (0.7%) |
| 18 to 34 Years | 311 (1.2%) | 336 (1.1%) |
| 35 to 64 Years | 1,079 (2.9%) | 908 (2.1%) |
| 65 to 74 Years | 942 (10.2%) | 503 (4.3%) |
| 75 Years and over | 1,133 (24.4%) | 716 (8.9%) |
Disability Class: Vision Difficulty
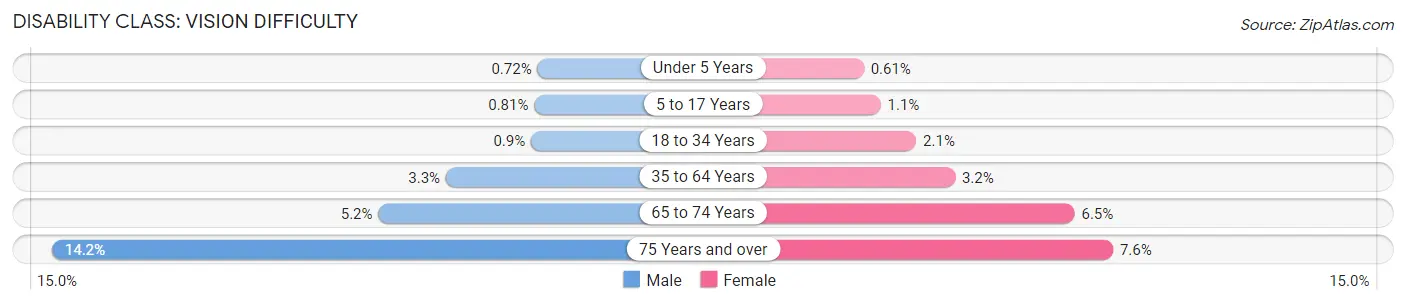
| Age Bracket | Male | Female |
| Under 5 Years | 53 (0.7%) | 41 (0.6%) |
| 5 to 17 Years | 163 (0.8%) | 207 (1.1%) |
| 18 to 34 Years | 237 (0.9%) | 620 (2.1%) |
| 35 to 64 Years | 1,216 (3.3%) | 1,384 (3.2%) |
| 65 to 74 Years | 477 (5.1%) | 754 (6.5%) |
| 75 Years and over | 662 (14.2%) | 610 (7.5%) |
Disability Class: Cognitive Difficulty
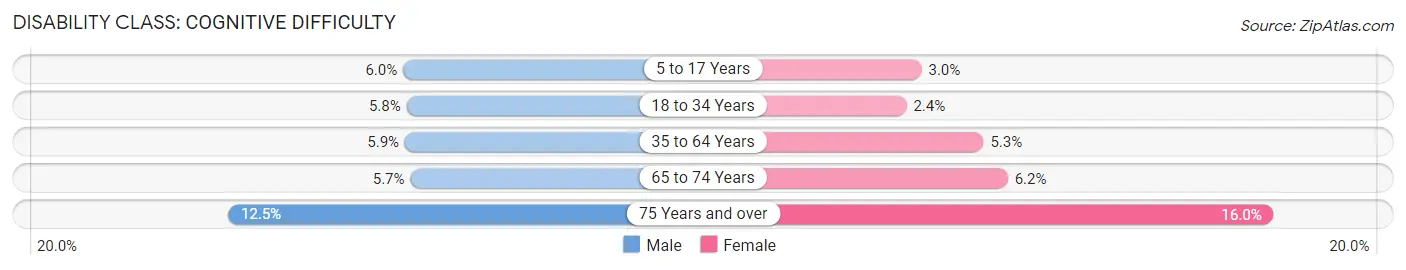
| Age Bracket | Male | Female |
| 5 to 17 Years | 1,197 (5.9%) | 569 (3.0%) |
| 18 to 34 Years | 1,529 (5.8%) | 718 (2.4%) |
| 35 to 64 Years | 2,183 (5.9%) | 2,309 (5.3%) |
| 65 to 74 Years | 526 (5.7%) | 717 (6.2%) |
| 75 Years and over | 579 (12.4%) | 1,296 (16.0%) |
Disability Class: Ambulatory Difficulty
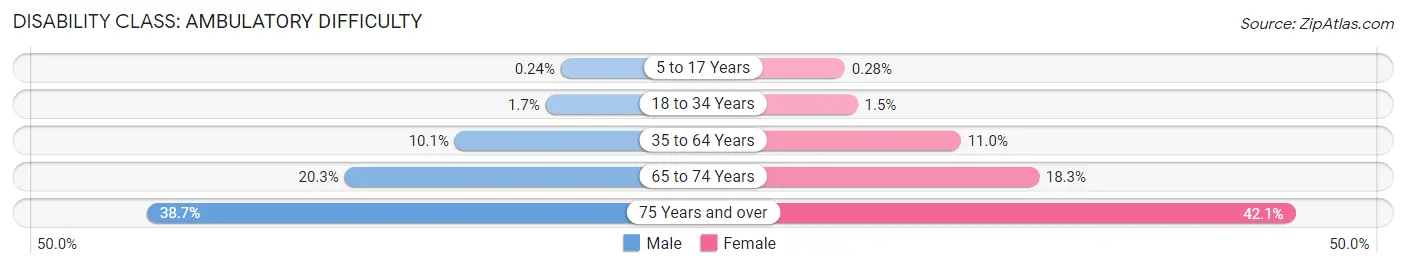
| Age Bracket | Male | Female |
| 5 to 17 Years | 48 (0.2%) | 53 (0.3%) |
| 18 to 34 Years | 435 (1.7%) | 440 (1.5%) |
| 35 to 64 Years | 3,745 (10.1%) | 4,852 (11.0%) |
| 65 to 74 Years | 1,880 (20.3%) | 2,128 (18.3%) |
| 75 Years and over | 1,797 (38.7%) | 3,403 (42.1%) |
Disability Class: Self-Care Difficulty
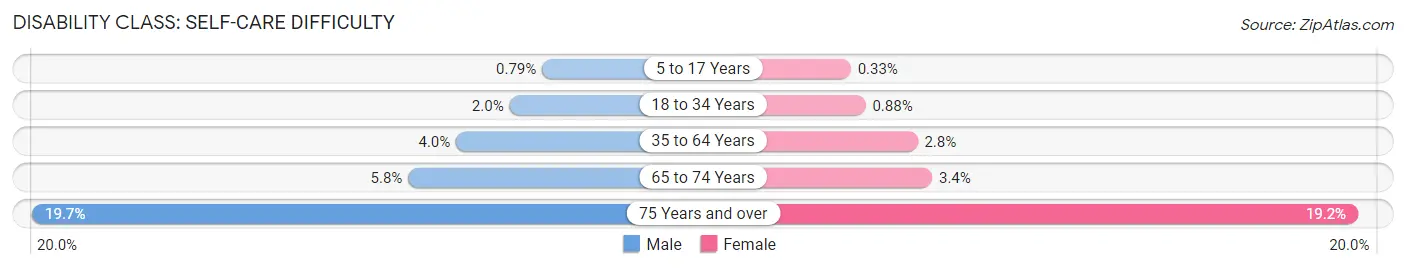
| Age Bracket | Male | Female |
| 5 to 17 Years | 158 (0.8%) | 63 (0.3%) |
| 18 to 34 Years | 527 (2.0%) | 262 (0.9%) |
| 35 to 64 Years | 1,480 (4.0%) | 1,236 (2.8%) |
| 65 to 74 Years | 533 (5.8%) | 390 (3.4%) |
| 75 Years and over | 917 (19.7%) | 1,549 (19.2%) |
Technology Access in Hinds County
Computing Device Access in Hinds County
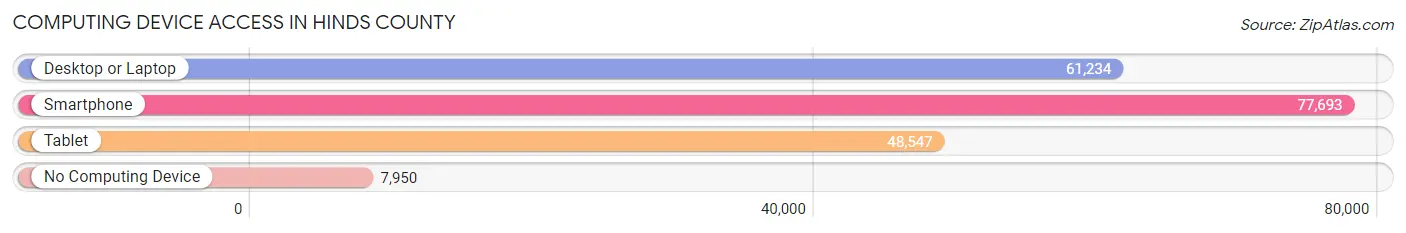
| Device Type | # Households | % Households |
| Desktop or Laptop | 61,234 | 68.3% |
| Smartphone | 77,693 | 86.7% |
| Tablet | 48,547 | 54.2% |
| No Computing Device | 7,950 | 8.9% |
| Total | 89,585 | 100.0% |
Internet Access in Hinds County
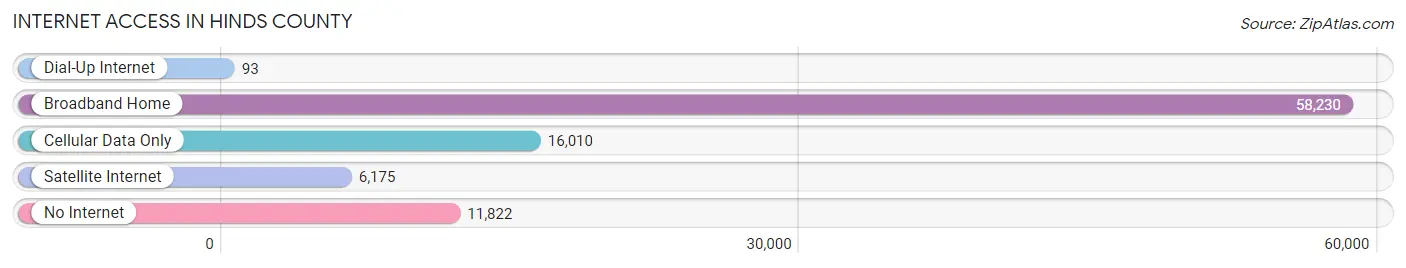
| Internet Type | # Households | % Households |
| Dial-Up Internet | 93 | 0.1% |
| Broadband Home | 58,230 | 65.0% |
| Cellular Data Only | 16,010 | 17.9% |
| Satellite Internet | 6,175 | 6.9% |
| No Internet | 11,822 | 13.2% |
| Total | 89,585 | 100.0% |
Hinds County Summary
Hinds County, Mississippi is located in the central part of the state and is the most populous county in the state. It is bordered by Madison County to the north, Rankin County to the east, Copiah County to the south, and Yazoo County to the west. The county seat is Jackson, the state capital.
History
Hinds County was established in 1821 and named after General Thomas Hinds, a hero of the War of 1812. The county was originally part of the Choctaw Nation, and the area was first settled by European Americans in the early 1800s. The county was home to many plantations, and the economy was largely based on agriculture.
During the Civil War, Hinds County was a major center of Confederate activity. The Battle of Raymond, one of the most important battles of the war, was fought in the county in 1863. After the war, the county was the site of the first public school in the state, established in 1871.
Geography
Hinds County covers an area of 876 square miles, making it the largest county in the state. The terrain is mostly flat, with some rolling hills in the northern part of the county. The Pearl River forms the western border of the county, and the Big Black River forms the eastern border.
The county is home to several state parks, including LeFleur's Bluff State Park, which is located on the banks of the Pearl River. The county also contains the Ross Barnett Reservoir, a popular recreational area.
Economy
The economy of Hinds County is largely based on agriculture and manufacturing. The county is home to several large industrial plants, including a Nissan automobile plant and a Tyson Foods poultry processing plant.
Agriculture is also an important part of the economy. The county is home to several large farms, and the main crops grown in the area are cotton, soybeans, corn, and wheat.
Demographics
As of the 2010 census, Hinds County had a population of 245,285. The population is racially diverse, with African Americans making up the majority of the population (60.3%). The median household income is $41,945, and the median age is 35.
Conclusion
Hinds County, Mississippi is a large and diverse county located in the central part of the state. The county has a long and rich history, and the economy is largely based on agriculture and manufacturing. The population is racially diverse, and the median household income is relatively low.
Common Questions
What is Per Capita Income in Hinds County?
Per Capita income in Hinds County is $27,943.
What is the Median Family Income in Hinds County?
Median Family Income in Hinds County is $62,295.
What is the Median Household income in Hinds County?
Median Household Income in Hinds County is $48,596.
What is Income or Wage Gap in Hinds County?
Income or Wage Gap in Hinds County is 21.1%.
Women in Hinds County earn 78.9 cents for every dollar earned by a man.
What is Family Income Deficit in Hinds County?
Family Income Deficit in Hinds County is $10,946.
Families that are below poverty line in Hinds County earn $10,946 less on average than the poverty threshold level.
What is Inequality or Gini Index in Hinds County?
Inequality or Gini Index in Hinds County is 0.48.
What is the Total Population of Hinds County?
Total Population of Hinds County is 226,541.
What is the Total Male Population of Hinds County?
Total Male Population of Hinds County is 106,310.
What is the Total Female Population of Hinds County?
Total Female Population of Hinds County is 120,231.
What is the Ratio of Males per 100 Females in Hinds County?
There are 88.42 Males per 100 Females in Hinds County.
What is the Ratio of Females per 100 Males in Hinds County?
There are 113.09 Females per 100 Males in Hinds County.
What is the Median Population Age in Hinds County?
Median Population Age in Hinds County is 36.1 Years.
What is the Average Family Size in Hinds County
Average Family Size in Hinds County is 3.2 People.
What is the Average Household Size in Hinds County
Average Household Size in Hinds County is 2.4 People.
How Large is the Labor Force in Hinds County?
There are 107,785 People in the Labor Forcein in Hinds County.
What is the Percentage of People in the Labor Force in Hinds County?
60.1% of People are in the Labor Force in Hinds County.
What is the Unemployment Rate in Hinds County?
Unemployment Rate in Hinds County is 7.8%.