Harrison County, MS Map & Demographics
Harrison County Map
Harrison County Overview
$30,120
PER CAPITA INCOME
$68,818
AVG FAMILY INCOME
$55,211
AVG HOUSEHOLD INCOME
25.5%
WAGE / INCOME GAP [ % ]
74.5¢/ $1
WAGE / INCOME GAP [ $ ]
$11,334
FAMILY INCOME DEFICIT
0.46
INEQUALITY / GINI INDEX
208,748
TOTAL POPULATION
102,341
MALE POPULATION
106,407
FEMALE POPULATION
96.18
MALES / 100 FEMALES
103.97
FEMALES / 100 MALES
37.6
MEDIAN AGE
3.1
AVG FAMILY SIZE
2.5
AVG HOUSEHOLD SIZE
100,965
LABOR FORCE [ PEOPLE ]
61.3%
PERCENT IN LABOR FORCE
8.4%
UNEMPLOYMENT RATE
Harrison County Area Codes
Income in Harrison County
Income Overview in Harrison County
Per Capita Income in Harrison County is $30,120, while median incomes of families and households are $68,818 and $55,211 respectively.
| Characteristic | Number | Measure |
| Per Capita Income | 208,748 | $30,120 |
| Median Family Income | 52,676 | $68,818 |
| Mean Family Income | 52,676 | $87,269 |
| Median Household Income | 80,191 | $55,211 |
| Mean Household Income | 80,191 | $75,018 |
| Income Deficit | 52,676 | $11,334 |
| Wage / Income Gap (%) | 208,748 | 25.48% |
| Wage / Income Gap ($) | 208,748 | 74.52¢ per $1 |
| Gini / Inequality Index | 208,748 | 0.46 |
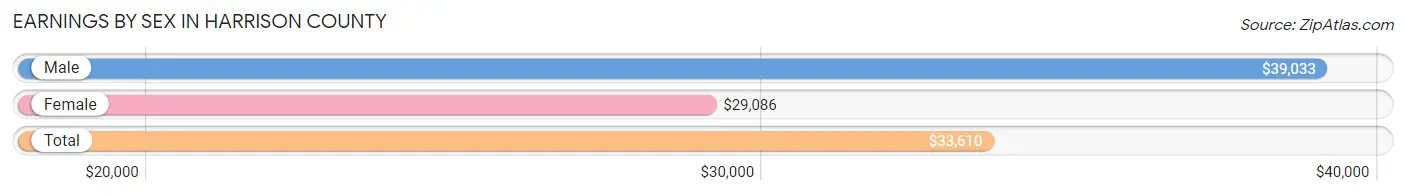
Earnings by Sex in Harrison County
Average Earnings in Harrison County are $33,610, $39,033 for men and $29,086 for women, a difference of 25.5%.
| Sex | Number | Average Earnings |
| Male | 53,199 (51.6%) | $39,033 |
| Female | 49,870 (48.4%) | $29,086 |
| Total | 103,069 (100.0%) | $33,610 |
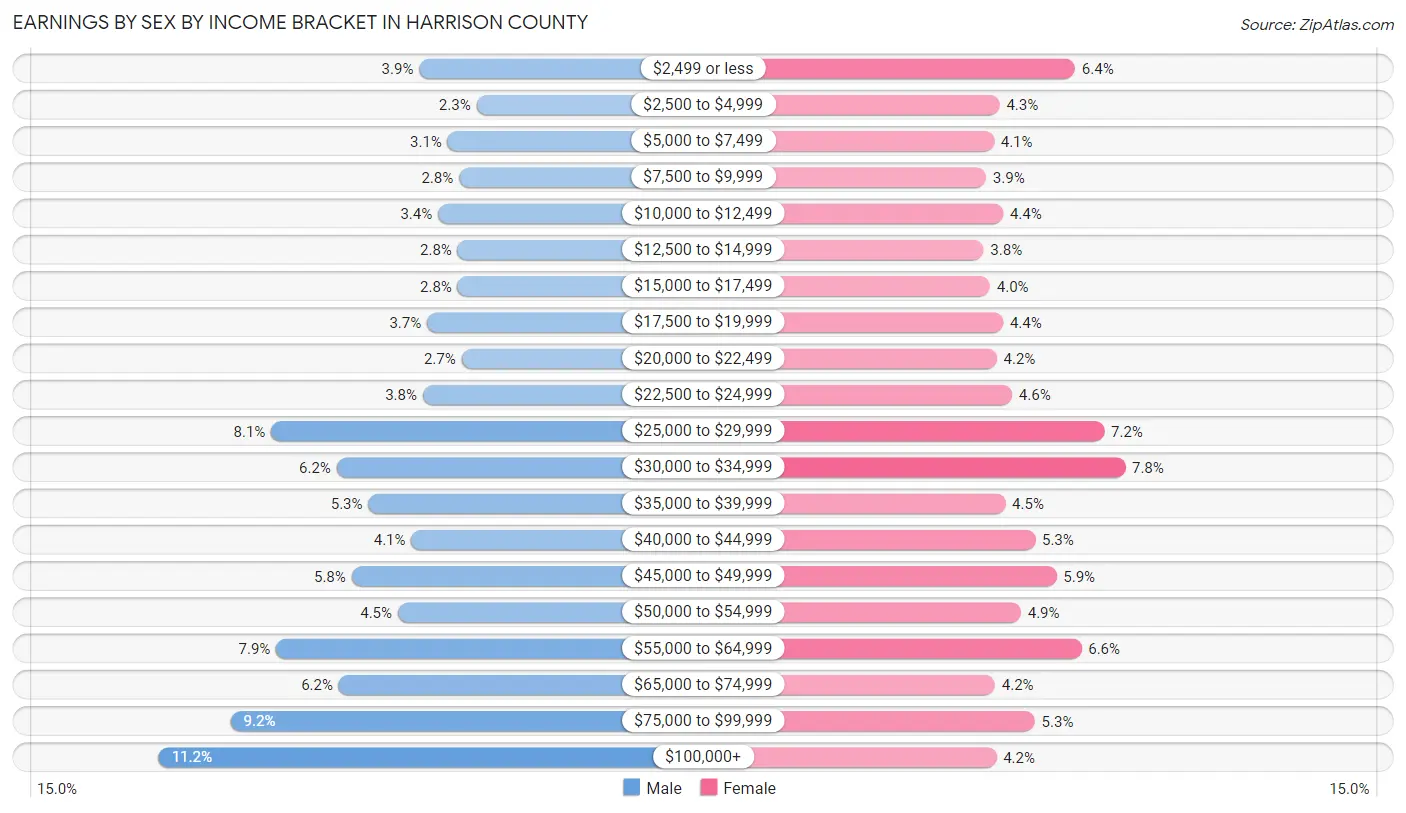
Earnings by Sex by Income Bracket in Harrison County
The most common earnings brackets in Harrison County are $100,000+ for men (5,974 | 11.2%) and $30,000 to $34,999 for women (3,898 | 7.8%).
| Income | Male | Female |
| $2,499 or less | 2,079 (3.9%) | 3,199 (6.4%) |
| $2,500 to $4,999 | 1,222 (2.3%) | 2,139 (4.3%) |
| $5,000 to $7,499 | 1,652 (3.1%) | 2,059 (4.1%) |
| $7,500 to $9,999 | 1,486 (2.8%) | 1,948 (3.9%) |
| $10,000 to $12,499 | 1,797 (3.4%) | 2,187 (4.4%) |
| $12,500 to $14,999 | 1,507 (2.8%) | 1,916 (3.8%) |
| $15,000 to $17,499 | 1,503 (2.8%) | 2,003 (4.0%) |
| $17,500 to $19,999 | 1,964 (3.7%) | 2,188 (4.4%) |
| $20,000 to $22,499 | 1,449 (2.7%) | 2,100 (4.2%) |
| $22,500 to $24,999 | 2,027 (3.8%) | 2,313 (4.6%) |
| $25,000 to $29,999 | 4,292 (8.1%) | 3,605 (7.2%) |
| $30,000 to $34,999 | 3,313 (6.2%) | 3,898 (7.8%) |
| $35,000 to $39,999 | 2,842 (5.3%) | 2,218 (4.4%) |
| $40,000 to $44,999 | 2,198 (4.1%) | 2,639 (5.3%) |
| $45,000 to $49,999 | 3,090 (5.8%) | 2,936 (5.9%) |
| $50,000 to $54,999 | 2,397 (4.5%) | 2,440 (4.9%) |
| $55,000 to $64,999 | 4,221 (7.9%) | 3,284 (6.6%) |
| $65,000 to $74,999 | 3,284 (6.2%) | 2,073 (4.2%) |
| $75,000 to $99,999 | 4,902 (9.2%) | 2,631 (5.3%) |
| $100,000+ | 5,974 (11.2%) | 2,094 (4.2%) |
| Total | 53,199 (100.0%) | 49,870 (100.0%) |
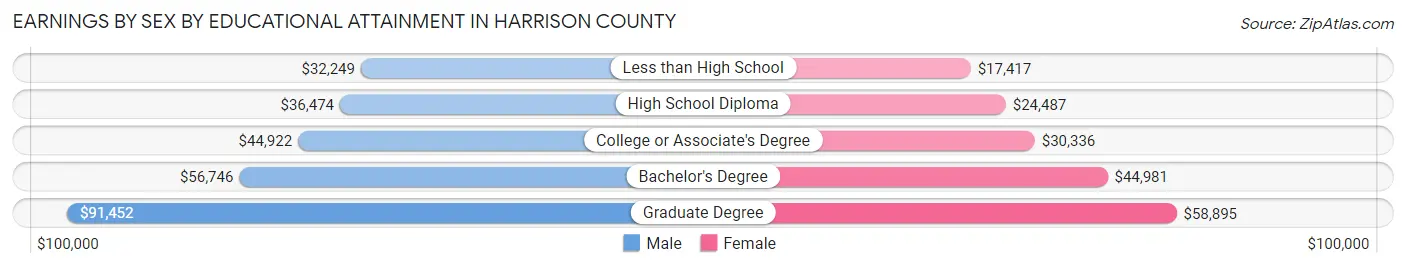
Earnings by Sex by Educational Attainment in Harrison County
Average earnings in Harrison County are $46,013 for men and $33,111 for women, a difference of 28.0%. Men with an educational attainment of graduate degree enjoy the highest average annual earnings of $91,452, while those with less than high school education earn the least with $32,249. Women with an educational attainment of graduate degree earn the most with the average annual earnings of $58,895, while those with less than high school education have the smallest earnings of $17,417.
| Educational Attainment | Male Income | Female Income |
| Less than High School | $32,249 | $17,417 |
| High School Diploma | $36,474 | $24,487 |
| College or Associate's Degree | $44,922 | $30,336 |
| Bachelor's Degree | $56,746 | $44,981 |
| Graduate Degree | $91,452 | $58,895 |
| Total | $46,013 | $33,111 |
Family Income in Harrison County
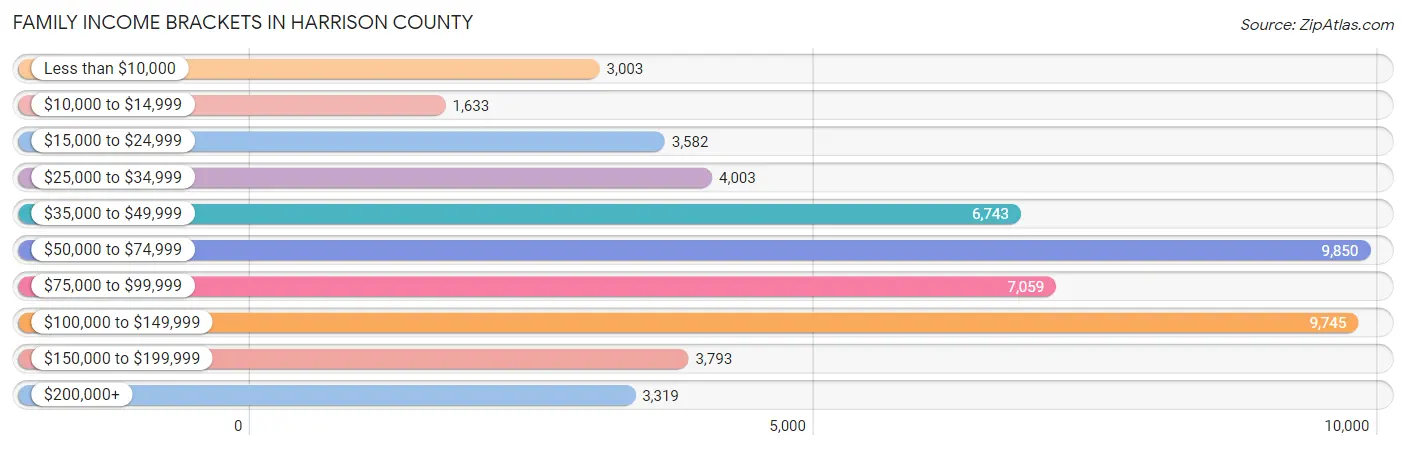
Family Income Brackets in Harrison County
According to the Harrison County family income data, there are 9,850 families falling into the $50,000 to $74,999 income range, which is the most common income bracket and makes up 18.7% of all families. Conversely, the $10,000 to $14,999 income bracket is the least frequent group with only 1,633 families (3.1%) belonging to this category.
| Income Bracket | # Families | % Families |
| Less than $10,000 | 3,003 | 5.7% |
| $10,000 to $14,999 | 1,633 | 3.1% |
| $15,000 to $24,999 | 3,582 | 6.8% |
| $25,000 to $34,999 | 4,003 | 7.6% |
| $35,000 to $49,999 | 6,743 | 12.8% |
| $50,000 to $74,999 | 9,850 | 18.7% |
| $75,000 to $99,999 | 7,059 | 13.4% |
| $100,000 to $149,999 | 9,745 | 18.5% |
| $150,000 to $199,999 | 3,793 | 7.2% |
| $200,000+ | 3,319 | 6.3% |
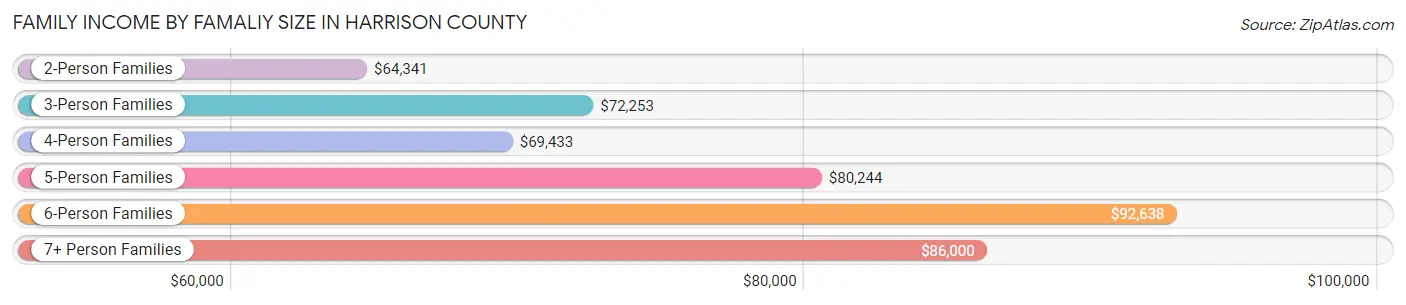
Family Income by Famaliy Size in Harrison County
6-person families (1,207 | 2.3%) account for the highest median family income in Harrison County with $92,638 per family, while 2-person families (25,158 | 47.8%) have the highest median income of $32,170 per family member.
| Income Bracket | # Families | Median Income |
| 2-Person Families | 25,158 (47.8%) | $64,341 |
| 3-Person Families | 13,088 (24.8%) | $72,253 |
| 4-Person Families | 8,620 (16.4%) | $69,433 |
| 5-Person Families | 3,505 (6.7%) | $80,244 |
| 6-Person Families | 1,207 (2.3%) | $92,638 |
| 7+ Person Families | 1,098 (2.1%) | $86,000 |
| Total | 52,676 (100.0%) | $68,818 |
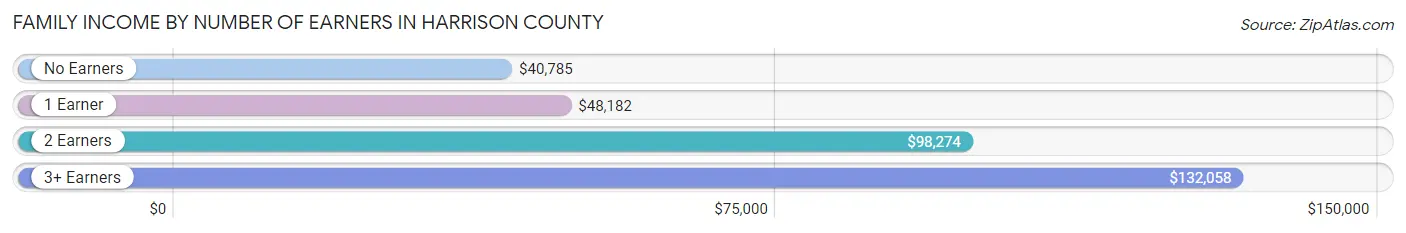
Family Income by Number of Earners in Harrison County
The median family income in Harrison County is $68,818, with families comprising 3+ earners (4,287) having the highest median family income of $132,058, while families with no earners (9,283) have the lowest median family income of $40,785, accounting for 8.1% and 17.6% of families, respectively.
| Number of Earners | # Families | Median Income |
| No Earners | 9,283 (17.6%) | $40,785 |
| 1 Earner | 19,495 (37.0%) | $48,182 |
| 2 Earners | 19,611 (37.2%) | $98,274 |
| 3+ Earners | 4,287 (8.1%) | $132,058 |
| Total | 52,676 (100.0%) | $68,818 |
Household Income in Harrison County
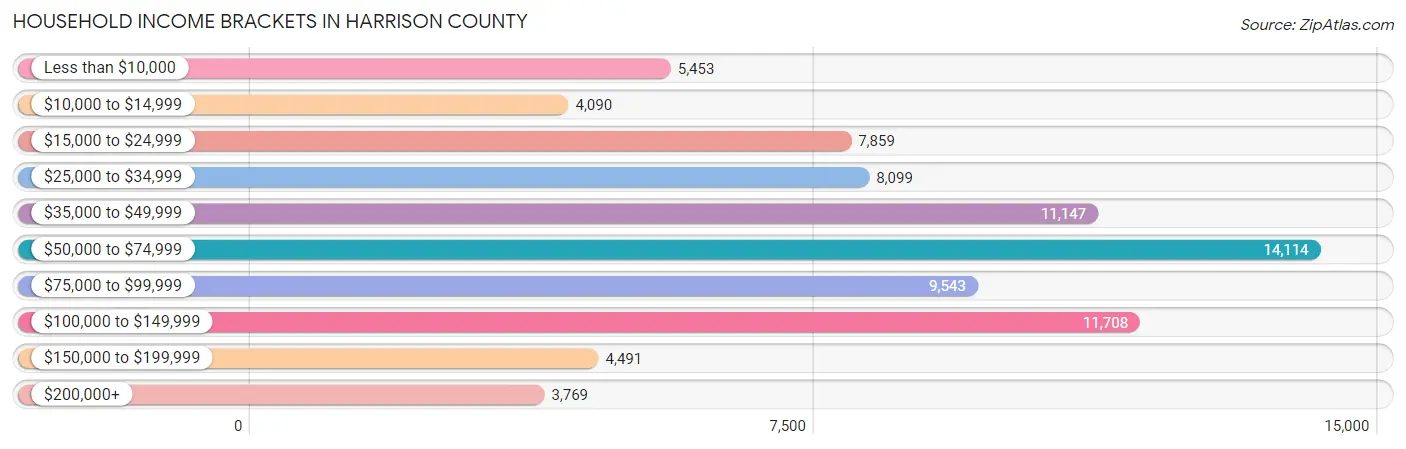
Household Income Brackets in Harrison County
With 14,114 households falling in the category, the $50,000 to $74,999 income range is the most frequent in Harrison County, accounting for 17.6% of all households. In contrast, only 3,769 households (4.7%) fall into the $200,000+ income bracket, making it the least populous group.
| Income Bracket | # Households | % Households |
| Less than $10,000 | 5,453 | 6.8% |
| $10,000 to $14,999 | 4,090 | 5.1% |
| $15,000 to $24,999 | 7,859 | 9.8% |
| $25,000 to $34,999 | 8,099 | 10.1% |
| $35,000 to $49,999 | 11,147 | 13.9% |
| $50,000 to $74,999 | 14,114 | 17.6% |
| $75,000 to $99,999 | 9,543 | 11.9% |
| $100,000 to $149,999 | 11,708 | 14.6% |
| $150,000 to $199,999 | 4,491 | 5.6% |
| $200,000+ | 3,769 | 4.7% |
Household Income by Householder Age in Harrison County
The median household income in Harrison County is $55,211, with the highest median household income of $65,514 found in the 45 to 64 years age bracket for the primary householder. A total of 29,288 households (36.5%) fall into this category. Meanwhile, the 15 to 24 years age bracket for the primary householder has the lowest median household income of $32,182, with 2,983 households (3.7%) in this group.
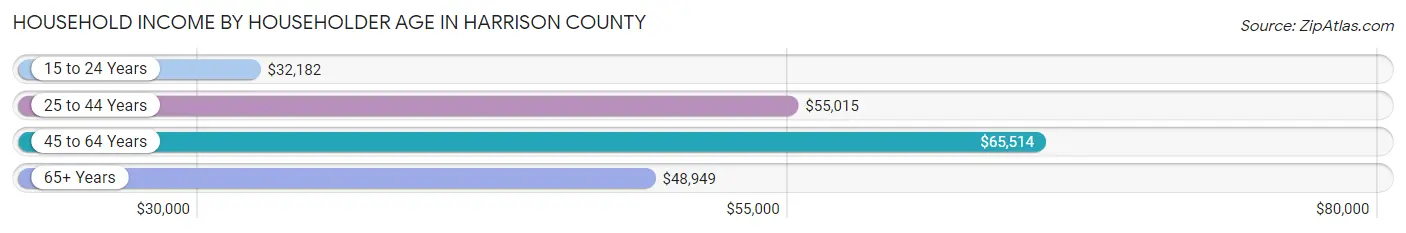
| Income Bracket | # Households | Median Income |
| 15 to 24 Years | 2,983 (3.7%) | $32,182 |
| 25 to 44 Years | 26,808 (33.4%) | $55,015 |
| 45 to 64 Years | 29,288 (36.5%) | $65,514 |
| 65+ Years | 21,112 (26.3%) | $48,949 |
| Total | 80,191 (100.0%) | $55,211 |
Poverty in Harrison County
Income Below Poverty by Sex and Age in Harrison County
With 16.2% poverty level for males and 20.4% for females among the residents of Harrison County, under 5 year old males and 15 year old females are the most vulnerable to poverty, with 2,037 males (31.3%) and 481 females (32.9%) in their respective age groups living below the poverty level.
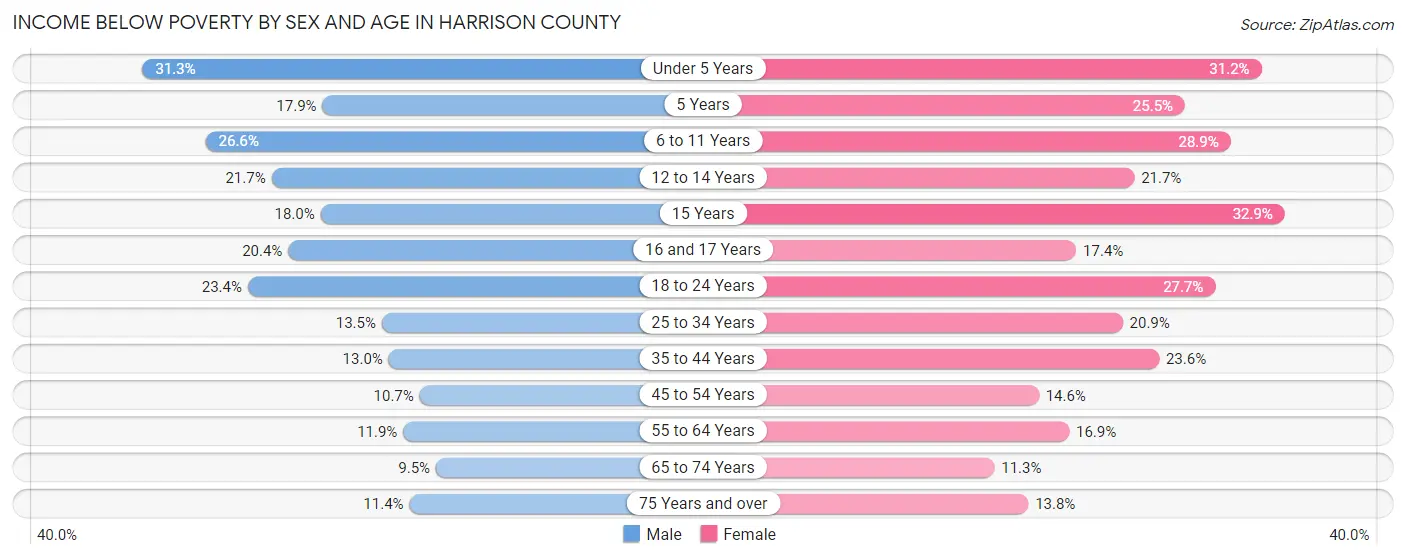
| Age Bracket | Male | Female |
| Under 5 Years | 2,037 (31.3%) | 1,936 (31.1%) |
| 5 Years | 242 (17.9%) | 405 (25.5%) |
| 6 to 11 Years | 2,258 (26.6%) | 2,246 (28.9%) |
| 12 to 14 Years | 936 (21.7%) | 844 (21.7%) |
| 15 Years | 265 (18.0%) | 481 (32.9%) |
| 16 and 17 Years | 575 (20.4%) | 452 (17.4%) |
| 18 to 24 Years | 2,056 (23.4%) | 2,346 (27.7%) |
| 25 to 34 Years | 1,784 (13.5%) | 3,044 (20.8%) |
| 35 to 44 Years | 1,614 (13.0%) | 3,204 (23.5%) |
| 45 to 54 Years | 1,260 (10.7%) | 1,885 (14.6%) |
| 55 to 64 Years | 1,562 (11.9%) | 2,360 (16.9%) |
| 65 to 74 Years | 885 (9.5%) | 1,208 (11.3%) |
| 75 Years and over | 610 (11.4%) | 955 (13.8%) |
| Total | 16,084 (16.2%) | 21,366 (20.4%) |
Income Above Poverty by Sex and Age in Harrison County
According to the poverty statistics in Harrison County, males aged 65 to 74 years and females aged 65 to 74 years are the age groups that are most secure financially, with 90.5% of males and 88.7% of females in these age groups living above the poverty line.
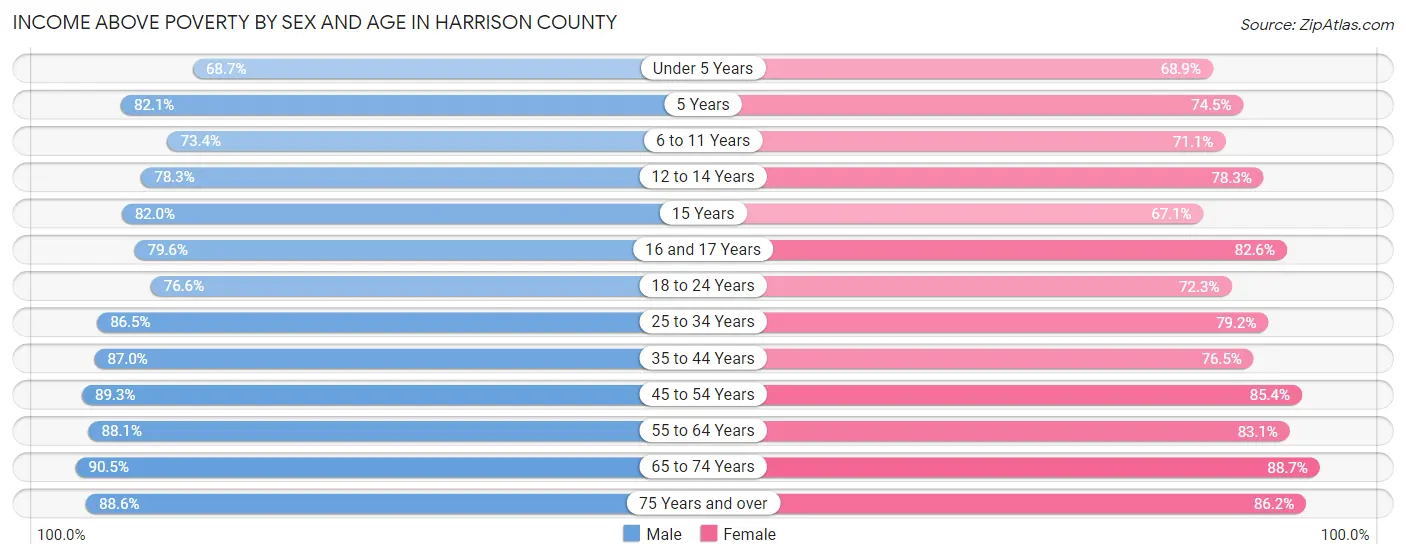
| Age Bracket | Male | Female |
| Under 5 Years | 4,479 (68.7%) | 4,280 (68.9%) |
| 5 Years | 1,111 (82.1%) | 1,185 (74.5%) |
| 6 to 11 Years | 6,243 (73.4%) | 5,537 (71.1%) |
| 12 to 14 Years | 3,383 (78.3%) | 3,043 (78.3%) |
| 15 Years | 1,205 (82.0%) | 982 (67.1%) |
| 16 and 17 Years | 2,240 (79.6%) | 2,145 (82.6%) |
| 18 to 24 Years | 6,720 (76.6%) | 6,116 (72.3%) |
| 25 to 34 Years | 11,446 (86.5%) | 11,557 (79.1%) |
| 35 to 44 Years | 10,831 (87.0%) | 10,402 (76.4%) |
| 45 to 54 Years | 10,544 (89.3%) | 11,005 (85.4%) |
| 55 to 64 Years | 11,576 (88.1%) | 11,632 (83.1%) |
| 65 to 74 Years | 8,473 (90.5%) | 9,467 (88.7%) |
| 75 Years and over | 4,729 (88.6%) | 5,947 (86.2%) |
| Total | 82,980 (83.8%) | 83,298 (79.6%) |
Income Below Poverty Among Married-Couple Families in Harrison County
The poverty statistics for married-couple families in Harrison County show that 6.7% or 2,335 of the total 35,111 families live below the poverty line. Families with 5 or more children have the highest poverty rate of 41.2%, comprising of 166 families. On the other hand, families with no children have the lowest poverty rate of 5.5%, which includes 1,125 families.
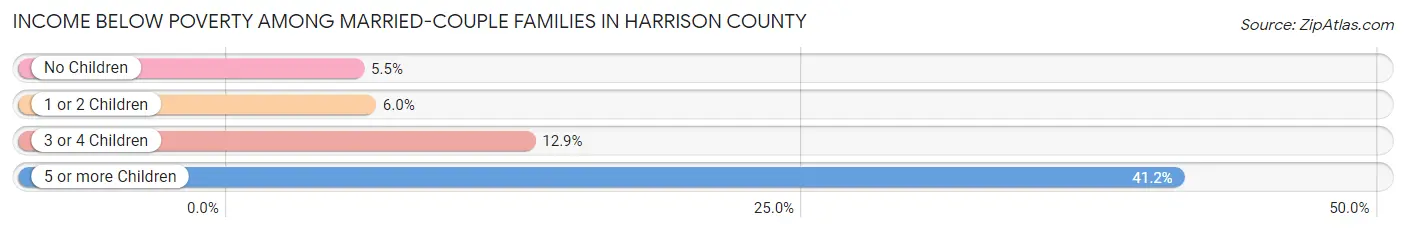
| Children | Above Poverty | Below Poverty |
| No Children | 19,368 (94.5%) | 1,125 (5.5%) |
| 1 or 2 Children | 10,769 (94.0%) | 687 (6.0%) |
| 3 or 4 Children | 2,402 (87.1%) | 357 (12.9%) |
| 5 or more Children | 237 (58.8%) | 166 (41.2%) |
| Total | 32,776 (93.3%) | 2,335 (6.7%) |
Income Below Poverty Among Single-Parent Households in Harrison County
According to the poverty data in Harrison County, 25.6% or 962 single-father households and 33.7% or 4,646 single-mother households are living below the poverty line. Among single-father households, those with 5 or more children have the highest poverty rate, with 14 households (100.0%) experiencing poverty. Likewise, among single-mother households, those with 5 or more children have the highest poverty rate, with 158 households (100.0%) falling below the poverty line.
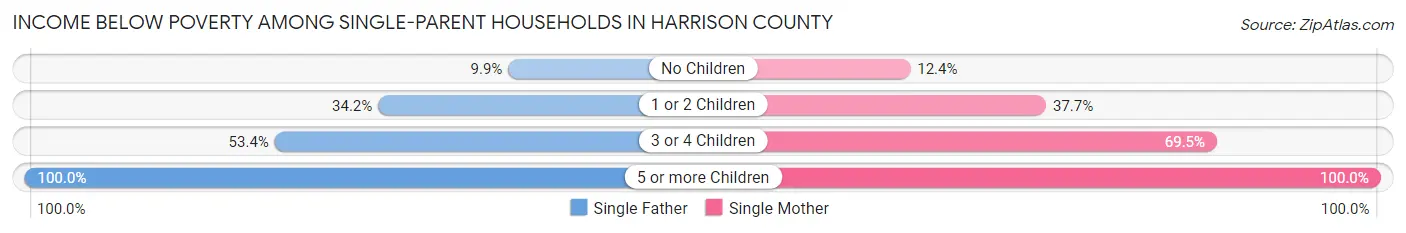
| Children | Single Father | Single Mother |
| No Children | 149 (9.9%) | 583 (12.4%) |
| 1 or 2 Children | 713 (34.2%) | 2,743 (37.7%) |
| 3 or 4 Children | 86 (53.4%) | 1,162 (69.5%) |
| 5 or more Children | 14 (100.0%) | 158 (100.0%) |
| Total | 962 (25.6%) | 4,646 (33.7%) |
Income Below Poverty Among Married-Couple vs Single-Parent Households in Harrison County
The poverty data for Harrison County shows that 2,335 of the married-couple family households (6.7%) and 5,608 of the single-parent households (31.9%) are living below the poverty level. Within the married-couple family households, those with 5 or more children have the highest poverty rate, with 166 households (41.2%) falling below the poverty line. Among the single-parent households, those with 5 or more children have the highest poverty rate, with 172 household (100.0%) living below poverty.
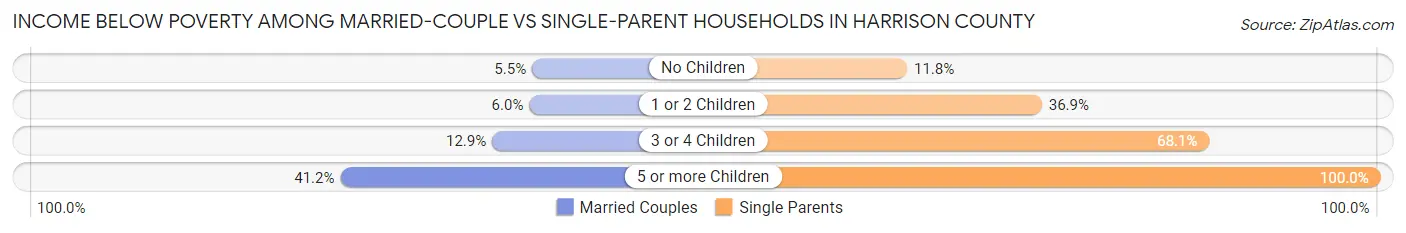
| Children | Married-Couple Families | Single-Parent Households |
| No Children | 1,125 (5.5%) | 732 (11.8%) |
| 1 or 2 Children | 687 (6.0%) | 3,456 (36.9%) |
| 3 or 4 Children | 357 (12.9%) | 1,248 (68.1%) |
| 5 or more Children | 166 (41.2%) | 172 (100.0%) |
| Total | 2,335 (6.7%) | 5,608 (31.9%) |
Race in Harrison County
The most populous races in Harrison County are White / Caucasian (135,147 | 64.7%), Black / African American (51,802 | 24.8%), and Two or more Races (13,153 | 6.3%).
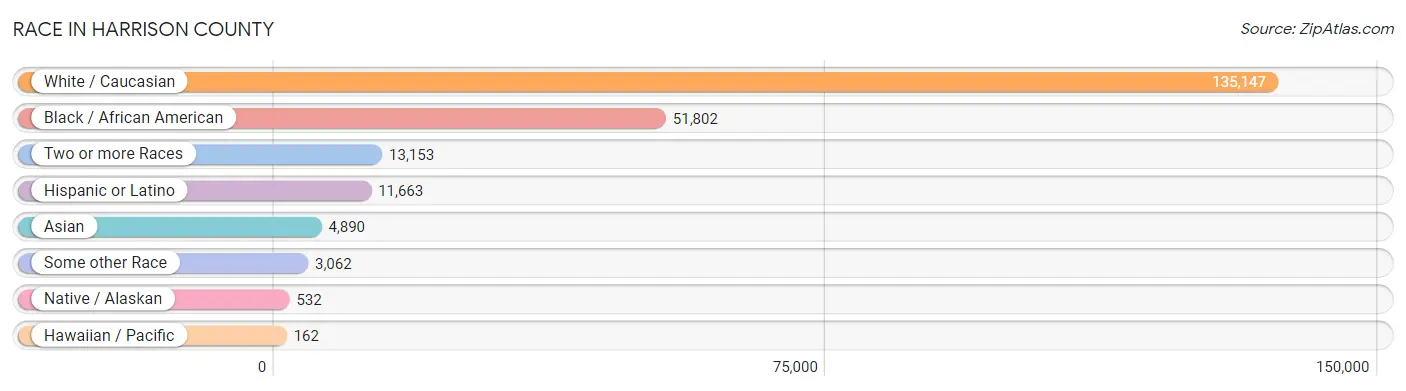
| Race | # Population | % Population |
| Asian | 4,890 | 2.3% |
| Black / African American | 51,802 | 24.8% |
| Hawaiian / Pacific | 162 | 0.1% |
| Hispanic or Latino | 11,663 | 5.6% |
| Native / Alaskan | 532 | 0.3% |
| White / Caucasian | 135,147 | 64.7% |
| Two or more Races | 13,153 | 6.3% |
| Some other Race | 3,062 | 1.5% |
| Total | 208,748 | 100.0% |
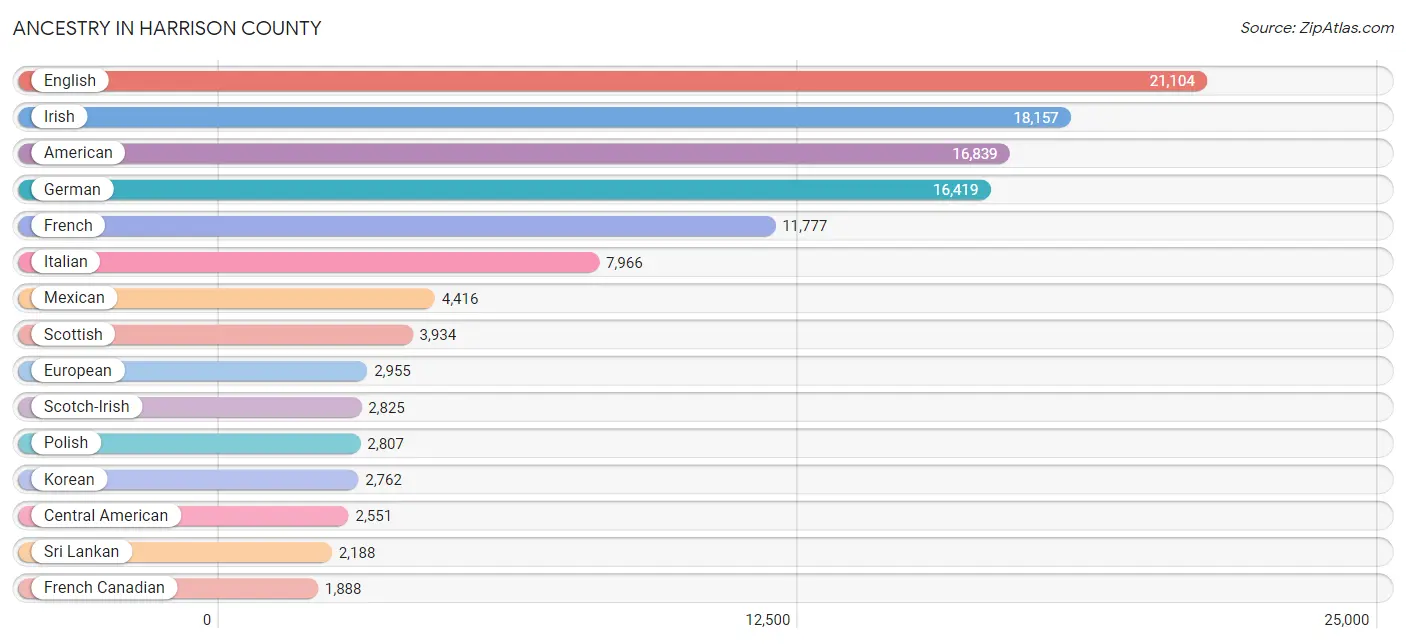
Ancestry in Harrison County
The most populous ancestries reported in Harrison County are English (21,104 | 10.1%), Irish (18,157 | 8.7%), American (16,839 | 8.1%), German (16,419 | 7.9%), and French (11,777 | 5.6%), together accounting for 40.4% of all Harrison County residents.
| Ancestry | # Population | % Population |
| African | 1,051 | 0.5% |
| Albanian | 14 | 0.0% |
| American | 16,839 | 8.1% |
| Apache | 15 | 0.0% |
| Arab | 502 | 0.2% |
| Argentinean | 31 | 0.0% |
| Armenian | 21 | 0.0% |
| Australian | 100 | 0.1% |
| Austrian | 220 | 0.1% |
| Bangladeshi | 19 | 0.0% |
| Barbadian | 55 | 0.0% |
| Basque | 59 | 0.0% |
| Belgian | 36 | 0.0% |
| Belizean | 4 | 0.0% |
| Bhutanese | 466 | 0.2% |
| Blackfeet | 26 | 0.0% |
| Bolivian | 67 | 0.0% |
| Brazilian | 10 | 0.0% |
| British | 1,172 | 0.6% |
| Bulgarian | 14 | 0.0% |
| Burmese | 738 | 0.4% |
| Cajun | 165 | 0.1% |
| Canadian | 306 | 0.2% |
| Cape Verdean | 39 | 0.0% |
| Central American | 2,551 | 1.2% |
| Central American Indian | 17 | 0.0% |
| Cherokee | 576 | 0.3% |
| Chickasaw | 17 | 0.0% |
| Chilean | 9 | 0.0% |
| Chinese | 161 | 0.1% |
| Chippewa | 121 | 0.1% |
| Choctaw | 400 | 0.2% |
| Colombian | 337 | 0.2% |
| Costa Rican | 68 | 0.0% |
| Creek | 185 | 0.1% |
| Croatian | 634 | 0.3% |
| Cuban | 318 | 0.2% |
| Czech | 308 | 0.2% |
| Czechoslovakian | 51 | 0.0% |
| Danish | 219 | 0.1% |
| Dominican | 175 | 0.1% |
| Dutch | 1,422 | 0.7% |
| Dutch West Indian | 9 | 0.0% |
| Eastern European | 84 | 0.0% |
| English | 21,104 | 10.1% |
| European | 2,955 | 1.4% |
| Filipino | 5 | 0.0% |
| Finnish | 78 | 0.0% |
| French | 11,777 | 5.6% |
| French American Indian | 23 | 0.0% |
| French Canadian | 1,888 | 0.9% |
| German | 16,419 | 7.9% |
| Greek | 701 | 0.3% |
| Guamanian / Chamorro | 209 | 0.1% |
| Guatemalan | 427 | 0.2% |
| Guyanese | 5 | 0.0% |
| Haitian | 175 | 0.1% |
| Honduran | 1,503 | 0.7% |
| Houma | 6 | 0.0% |
| Hungarian | 224 | 0.1% |
| Indian (Asian) | 960 | 0.5% |
| Iranian | 173 | 0.1% |
| Irish | 18,157 | 8.7% |
| Iroquois | 64 | 0.0% |
| Israeli | 27 | 0.0% |
| Italian | 7,966 | 3.8% |
| Jamaican | 681 | 0.3% |
| Japanese | 43 | 0.0% |
| Jordanian | 11 | 0.0% |
| Korean | 2,762 | 1.3% |
| Lebanese | 286 | 0.1% |
| Lithuanian | 53 | 0.0% |
| Malaysian | 115 | 0.1% |
| Maltese | 4 | 0.0% |
| Mexican | 4,416 | 2.1% |
| Mexican American Indian | 95 | 0.1% |
| Native Hawaiian | 156 | 0.1% |
| Navajo | 5 | 0.0% |
| New Zealander | 22 | 0.0% |
| Nicaraguan | 10 | 0.0% |
| Nigerian | 287 | 0.1% |
| Northern European | 94 | 0.1% |
| Norwegian | 1,183 | 0.6% |
| Pakistani | 200 | 0.1% |
| Palestinian | 14 | 0.0% |
| Panamanian | 305 | 0.2% |
| Pennsylvania German | 63 | 0.0% |
| Peruvian | 184 | 0.1% |
| Polish | 2,807 | 1.3% |
| Portuguese | 250 | 0.1% |
| Puerto Rican | 1,757 | 0.8% |
| Romanian | 33 | 0.0% |
| Russian | 591 | 0.3% |
| Salvadoran | 238 | 0.1% |
| Samoan | 118 | 0.1% |
| Scandinavian | 374 | 0.2% |
| Scotch-Irish | 2,825 | 1.3% |
| Scottish | 3,934 | 1.9% |
| Serbian | 6 | 0.0% |
| Sioux | 42 | 0.0% |
| Slavic | 102 | 0.1% |
| Slovak | 331 | 0.2% |
| Slovene | 19 | 0.0% |
| South African | 74 | 0.0% |
| South American | 636 | 0.3% |
| Spaniard | 447 | 0.2% |
| Spanish | 786 | 0.4% |
| Spanish American | 16 | 0.0% |
| Sri Lankan | 2,188 | 1.1% |
| Subsaharan African | 1,481 | 0.7% |
| Swedish | 880 | 0.4% |
| Swiss | 123 | 0.1% |
| Syrian | 39 | 0.0% |
| Thai | 649 | 0.3% |
| Trinidadian and Tobagonian | 18 | 0.0% |
| Turkish | 87 | 0.0% |
| Ukrainian | 67 | 0.0% |
| Venezuelan | 8 | 0.0% |
| Welsh | 938 | 0.4% |
| West Indian | 104 | 0.1% |
| Yaqui | 5 | 0.0% |
| Yugoslavian | 93 | 0.0% |
| Zimbabwean | 5 | 0.0% | View All 123 Rows |
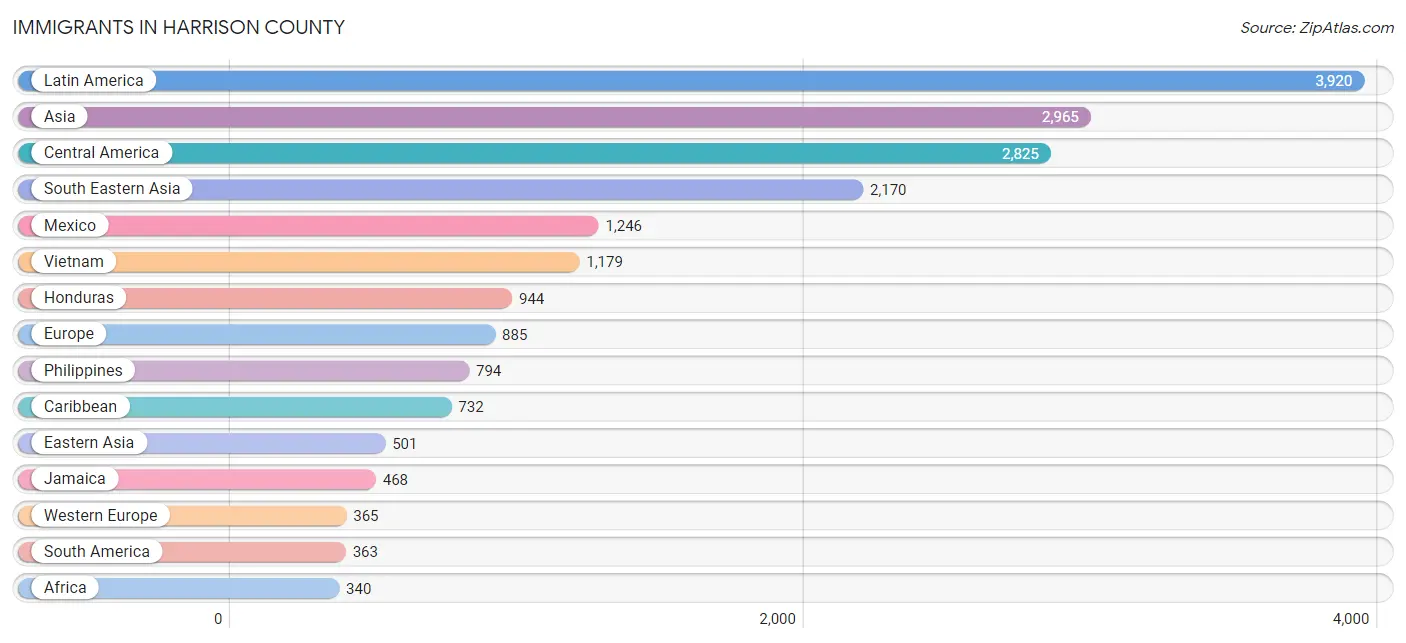
Immigrants in Harrison County
The most numerous immigrant groups reported in Harrison County came from Latin America (3,920 | 1.9%), Asia (2,965 | 1.4%), Central America (2,825 | 1.3%), South Eastern Asia (2,170 | 1.0%), and Mexico (1,246 | 0.6%), together accounting for 6.3% of all Harrison County residents.
| Immigration Origin | # Population | % Population |
| Africa | 340 | 0.2% |
| Argentina | 24 | 0.0% |
| Asia | 2,965 | 1.4% |
| Austria | 21 | 0.0% |
| Azores | 5 | 0.0% |
| Belize | 52 | 0.0% |
| Bolivia | 70 | 0.0% |
| Brazil | 42 | 0.0% |
| Bulgaria | 24 | 0.0% |
| Cameroon | 74 | 0.0% |
| Canada | 206 | 0.1% |
| Caribbean | 732 | 0.4% |
| Central America | 2,825 | 1.3% |
| Chile | 12 | 0.0% |
| China | 187 | 0.1% |
| Colombia | 76 | 0.0% |
| Costa Rica | 33 | 0.0% |
| Cuba | 57 | 0.0% |
| Czechoslovakia | 13 | 0.0% |
| Dominican Republic | 26 | 0.0% |
| Eastern Africa | 73 | 0.0% |
| Eastern Asia | 501 | 0.2% |
| Eastern Europe | 253 | 0.1% |
| Egypt | 8 | 0.0% |
| El Salvador | 153 | 0.1% |
| England | 98 | 0.1% |
| Ethiopia | 64 | 0.0% |
| Europe | 885 | 0.4% |
| France | 34 | 0.0% |
| Germany | 262 | 0.1% |
| Ghana | 4 | 0.0% |
| Grenada | 21 | 0.0% |
| Guatemala | 317 | 0.2% |
| Guyana | 7 | 0.0% |
| Haiti | 124 | 0.1% |
| Honduras | 944 | 0.4% |
| Hong Kong | 16 | 0.0% |
| India | 79 | 0.0% |
| Iran | 20 | 0.0% |
| Italy | 28 | 0.0% |
| Jamaica | 468 | 0.2% |
| Japan | 51 | 0.0% |
| Korea | 263 | 0.1% |
| Latin America | 3,920 | 1.9% |
| Liberia | 11 | 0.0% |
| Malaysia | 36 | 0.0% |
| Mexico | 1,246 | 0.6% |
| Middle Africa | 74 | 0.0% |
| Morocco | 6 | 0.0% |
| Netherlands | 48 | 0.0% |
| Nicaragua | 27 | 0.0% |
| Northern Africa | 14 | 0.0% |
| Northern Europe | 210 | 0.1% |
| Oceania | 22 | 0.0% |
| Pakistan | 13 | 0.0% |
| Panama | 53 | 0.0% |
| Peru | 121 | 0.1% |
| Philippines | 794 | 0.4% |
| Poland | 5 | 0.0% |
| Portugal | 13 | 0.0% |
| Romania | 11 | 0.0% |
| Russia | 31 | 0.0% |
| Saudi Arabia | 121 | 0.1% |
| Scotland | 43 | 0.0% |
| Sierra Leone | 19 | 0.0% |
| South Africa | 145 | 0.1% |
| South America | 363 | 0.2% |
| South Central Asia | 112 | 0.1% |
| South Eastern Asia | 2,170 | 1.0% |
| Southern Europe | 49 | 0.0% |
| Spain | 8 | 0.0% |
| St. Vincent and the Grenadines | 21 | 0.0% |
| Syria | 28 | 0.0% |
| Taiwan | 5 | 0.0% |
| Thailand | 153 | 0.1% |
| Trinidad and Tobago | 15 | 0.0% |
| Turkey | 6 | 0.0% |
| Ukraine | 12 | 0.0% |
| Vietnam | 1,179 | 0.6% |
| Western Africa | 34 | 0.0% |
| Western Asia | 182 | 0.1% |
| Western Europe | 365 | 0.2% |
| Zimbabwe | 8 | 0.0% | View All 83 Rows |
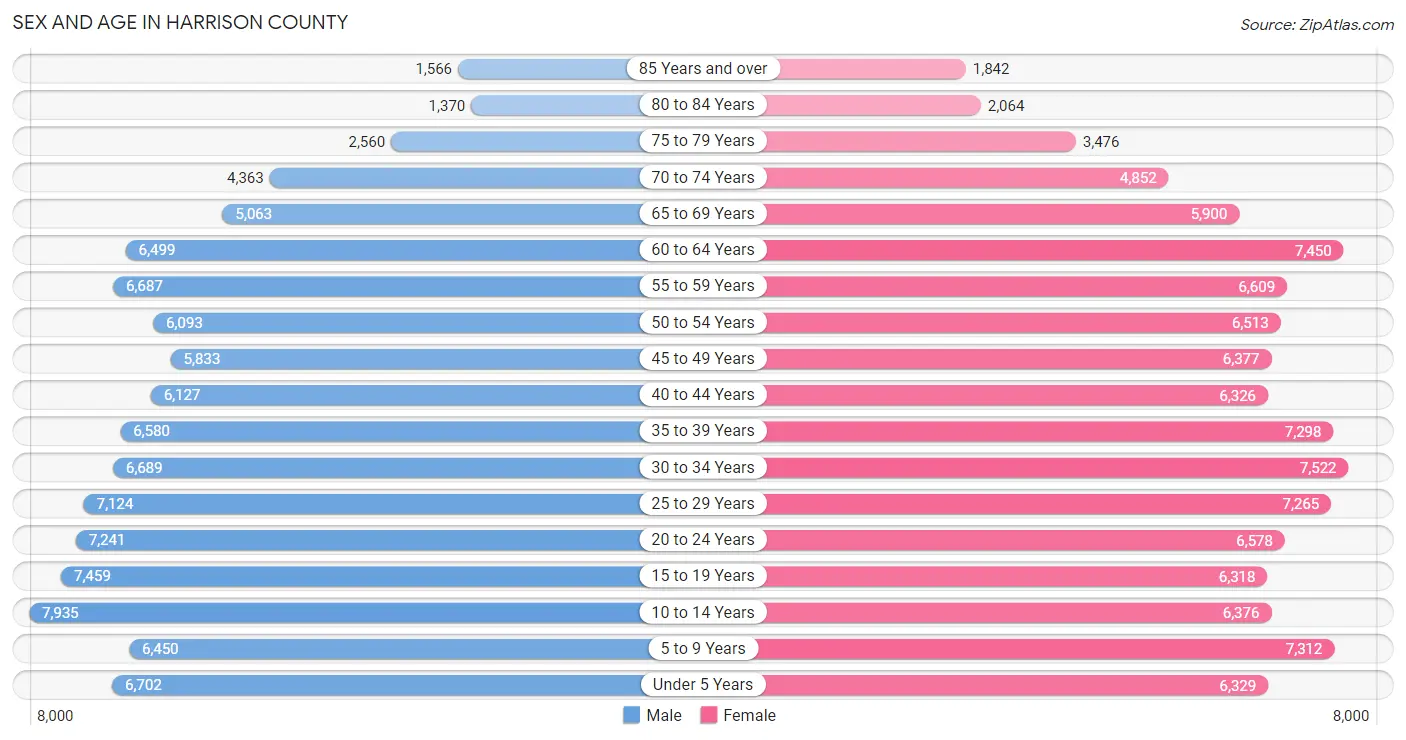
Sex and Age in Harrison County
Sex and Age in Harrison County
The most populous age groups in Harrison County are 10 to 14 Years (7,935 | 7.7%) for men and 30 to 34 Years (7,522 | 7.1%) for women.
| Age Bracket | Male | Female |
| Under 5 Years | 6,702 (6.6%) | 6,329 (5.9%) |
| 5 to 9 Years | 6,450 (6.3%) | 7,312 (6.9%) |
| 10 to 14 Years | 7,935 (7.7%) | 6,376 (6.0%) |
| 15 to 19 Years | 7,459 (7.3%) | 6,318 (5.9%) |
| 20 to 24 Years | 7,241 (7.1%) | 6,578 (6.2%) |
| 25 to 29 Years | 7,124 (7.0%) | 7,265 (6.8%) |
| 30 to 34 Years | 6,689 (6.5%) | 7,522 (7.1%) |
| 35 to 39 Years | 6,580 (6.4%) | 7,298 (6.9%) |
| 40 to 44 Years | 6,127 (6.0%) | 6,326 (5.9%) |
| 45 to 49 Years | 5,833 (5.7%) | 6,377 (6.0%) |
| 50 to 54 Years | 6,093 (5.9%) | 6,513 (6.1%) |
| 55 to 59 Years | 6,687 (6.5%) | 6,609 (6.2%) |
| 60 to 64 Years | 6,499 (6.4%) | 7,450 (7.0%) |
| 65 to 69 Years | 5,063 (5.0%) | 5,900 (5.5%) |
| 70 to 74 Years | 4,363 (4.3%) | 4,852 (4.6%) |
| 75 to 79 Years | 2,560 (2.5%) | 3,476 (3.3%) |
| 80 to 84 Years | 1,370 (1.3%) | 2,064 (1.9%) |
| 85 Years and over | 1,566 (1.5%) | 1,842 (1.7%) |
| Total | 102,341 (100.0%) | 106,407 (100.0%) |
Families and Households in Harrison County
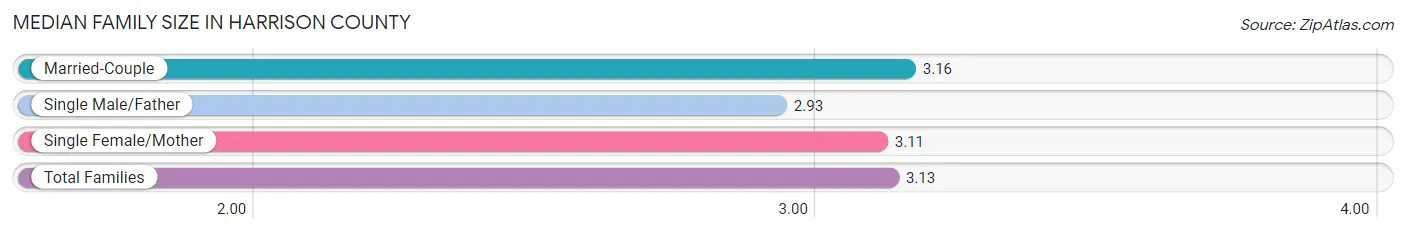
Median Family Size in Harrison County
The median family size in Harrison County is 3.13 persons per family, with married-couple families (35,111 | 66.6%) accounting for the largest median family size of 3.16 persons per family. On the other hand, single male/father families (3,762 | 7.1%) represent the smallest median family size with 2.93 persons per family.
| Family Type | # Families | Family Size |
| Married-Couple | 35,111 (66.6%) | 3.16 |
| Single Male/Father | 3,762 (7.1%) | 2.93 |
| Single Female/Mother | 13,803 (26.2%) | 3.11 |
| Total Families | 52,676 (100.0%) | 3.13 |
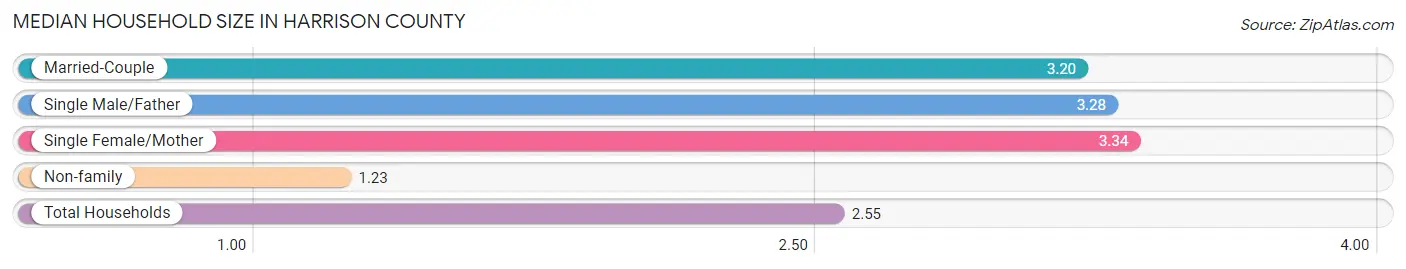
Median Household Size in Harrison County
The median household size in Harrison County is 2.55 persons per household, with single female/mother households (13,803 | 17.2%) accounting for the largest median household size of 3.34 persons per household. non-family households (27,515 | 34.3%) represent the smallest median household size with 1.23 persons per household.
| Household Type | # Households | Household Size |
| Married-Couple | 35,111 (43.8%) | 3.20 |
| Single Male/Father | 3,762 (4.7%) | 3.28 |
| Single Female/Mother | 13,803 (17.2%) | 3.34 |
| Non-family | 27,515 (34.3%) | 1.23 |
| Total Households | 80,191 (100.0%) | 2.55 |
Household Size by Marriage Status in Harrison County
Out of a total of 80,191 households in Harrison County, 52,676 (65.7%) are family households, while 27,515 (34.3%) are nonfamily households. The most numerous type of family households are 2-person households, comprising 23,605, and the most common type of nonfamily households are 1-person households, comprising 22,795.
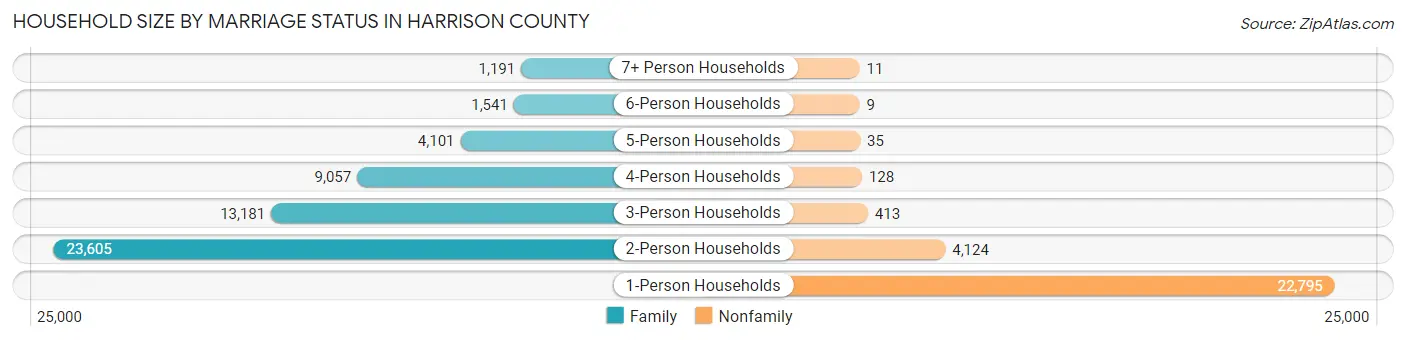
| Household Size | Family Households | Nonfamily Households |
| 1-Person Households | - | 22,795 (28.4%) |
| 2-Person Households | 23,605 (29.4%) | 4,124 (5.1%) |
| 3-Person Households | 13,181 (16.4%) | 413 (0.5%) |
| 4-Person Households | 9,057 (11.3%) | 128 (0.2%) |
| 5-Person Households | 4,101 (5.1%) | 35 (0.0%) |
| 6-Person Households | 1,541 (1.9%) | 9 (0.0%) |
| 7+ Person Households | 1,191 (1.5%) | 11 (0.0%) |
| Total | 52,676 (65.7%) | 27,515 (34.3%) |
Female Fertility in Harrison County
Fertility by Age in Harrison County
Average fertility rate in Harrison County is 50.0 births per 1,000 women. Women in the age bracket of 20 to 34 years have the highest fertility rate with 92.0 births per 1,000 women. Women in the age bracket of 20 to 34 years acount for 79.6% of all women with births.
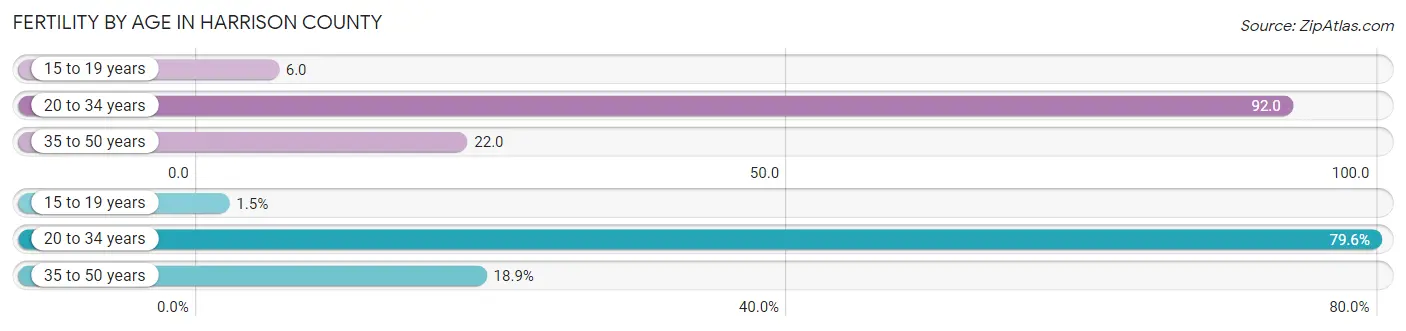
| Age Bracket | Women with Births | Births / 1,000 Women |
| 15 to 19 years | 36 (1.5%) | 6.0 |
| 20 to 34 years | 1,971 (79.6%) | 92.0 |
| 35 to 50 years | 468 (18.9%) | 22.0 |
| Total | 2,475 (100.0%) | 50.0 |
Fertility by Age by Marriage Status in Harrison County
56.9% of women with births (2,475) in Harrison County are married. The highest percentage of unmarried women with births falls into 15 to 19 years age bracket with 100.0% of them unmarried at the time of birth, while the lowest percentage of unmarried women with births belong to 35 to 50 years age bracket with 37.8% of them unmarried.
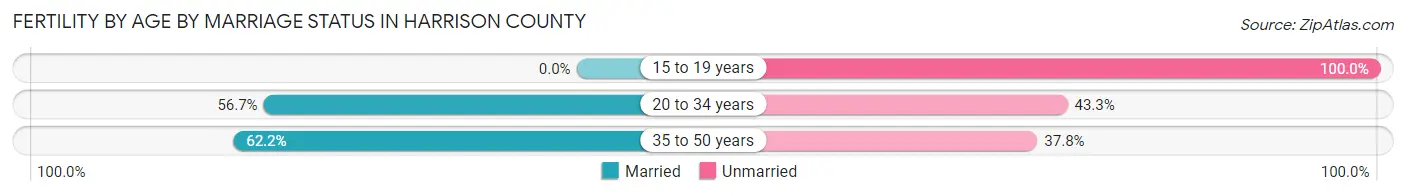
| Age Bracket | Married | Unmarried |
| 15 to 19 years | 0 (0.0%) | 36 (100.0%) |
| 20 to 34 years | 1,118 (56.7%) | 853 (43.3%) |
| 35 to 50 years | 291 (62.2%) | 177 (37.8%) |
| Total | 1,408 (56.9%) | 1,067 (43.1%) |
Fertility by Education in Harrison County
Average fertility rate in Harrison County is 50.0 births per 1,000 women. Women with the education attainment of graduate degree have the highest fertility rate of 140.0 births per 1,000 women, while women with the education attainment of college or associate's degree have the lowest fertility at 33.0 births per 1,000 women. Women with the education attainment of high school diploma represent 29.9% of all women with births.
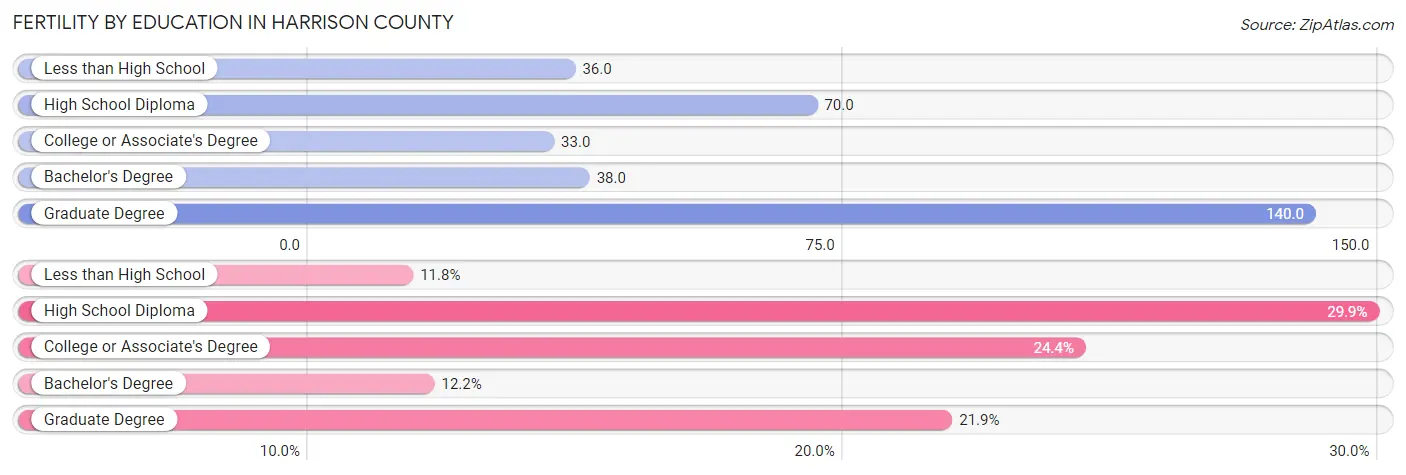
| Educational Attainment | Women with Births | Births / 1,000 Women |
| Less than High School | 291 (11.8%) | 36.0 |
| High School Diploma | 739 (29.9%) | 70.0 |
| College or Associate's Degree | 603 (24.4%) | 33.0 |
| Bachelor's Degree | 301 (12.2%) | 38.0 |
| Graduate Degree | 541 (21.9%) | 140.0 |
| Total | 2,475 (100.0%) | 50.0 |
Fertility by Education by Marriage Status in Harrison County
43.1% of women with births in Harrison County are unmarried. Women with the educational attainment of graduate degree are most likely to be married with 97.4% of them married at childbirth, while women with the educational attainment of high school diploma are least likely to be married with 73.1% of them unmarried at childbirth.
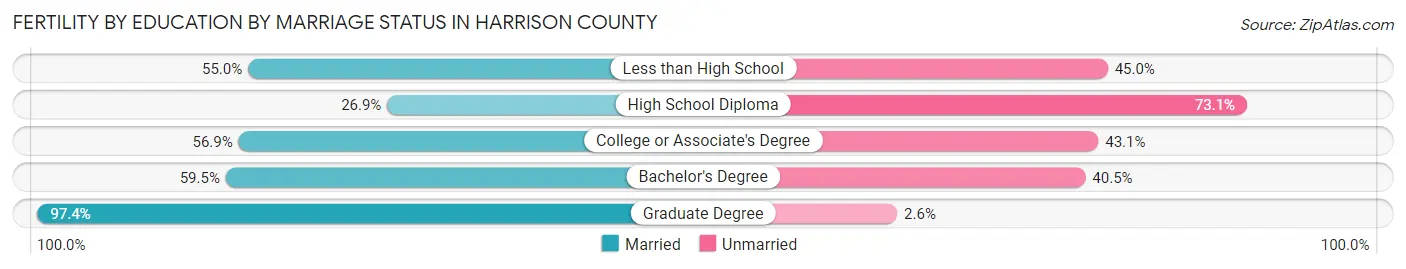
| Educational Attainment | Married | Unmarried |
| Less than High School | 160 (55.0%) | 131 (45.0%) |
| High School Diploma | 199 (26.9%) | 540 (73.1%) |
| College or Associate's Degree | 343 (56.9%) | 260 (43.1%) |
| Bachelor's Degree | 179 (59.5%) | 122 (40.5%) |
| Graduate Degree | 527 (97.4%) | 14 (2.6%) |
| Total | 1,408 (56.9%) | 1,067 (43.1%) |
Employment Characteristics in Harrison County
Employment by Class of Employer in Harrison County
Among the 91,384 employed individuals in Harrison County, private company employees (55,740 | 61.0%), federal government employees (11,633 | 12.7%), and local government employees (6,672 | 7.3%) make up the most common classes of employment.
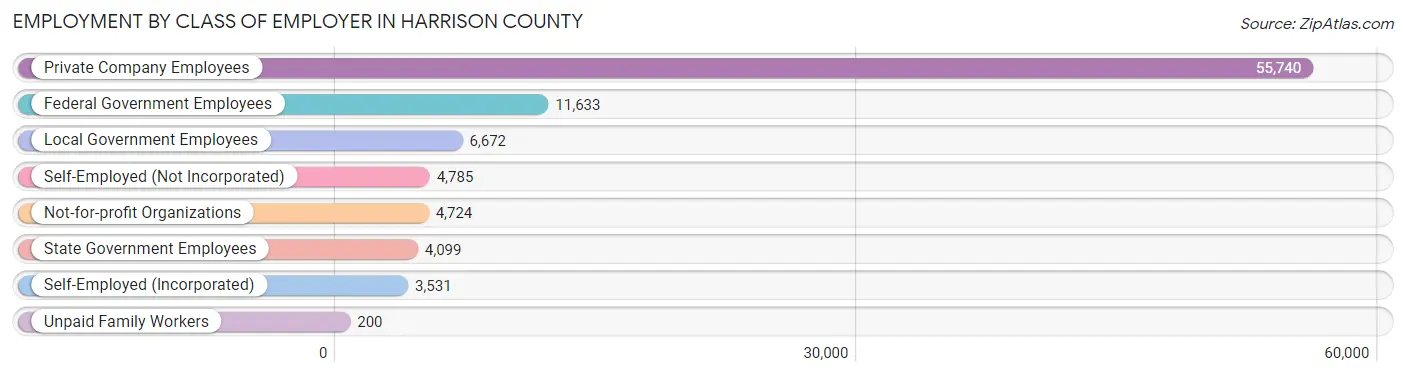
| Employer Class | # Employees | % Employees |
| Private Company Employees | 55,740 | 61.0% |
| Self-Employed (Incorporated) | 3,531 | 3.9% |
| Self-Employed (Not Incorporated) | 4,785 | 5.2% |
| Not-for-profit Organizations | 4,724 | 5.2% |
| Local Government Employees | 6,672 | 7.3% |
| State Government Employees | 4,099 | 4.5% |
| Federal Government Employees | 11,633 | 12.7% |
| Unpaid Family Workers | 200 | 0.2% |
| Total | 91,384 | 100.0% |
Employment Status by Age in Harrison County
According to the labor force statistics for Harrison County, out of the total population over 16 years of age (164,707), 61.3% or 100,965 individuals are in the labor force, with 8.4% or 8,481 of them unemployed. The age group with the highest labor force participation rate is 30 to 34 years, with 83.9% or 11,923 individuals in the labor force. Within the labor force, the 16 to 19 years age range has the highest percentage of unemployed individuals, with 22.5% or 946 of them being unemployed.
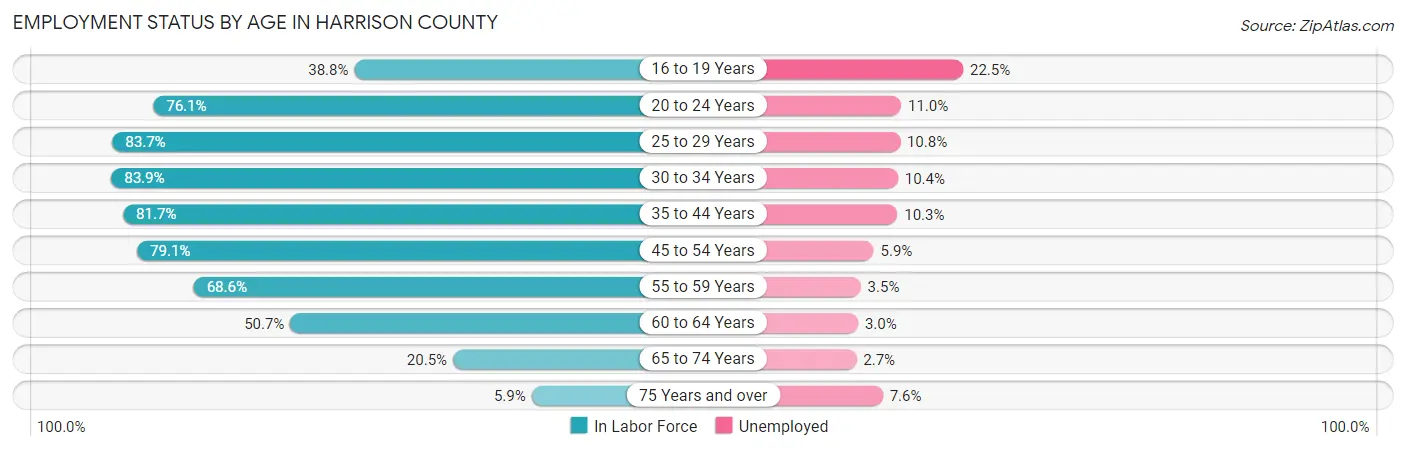
| Age Bracket | In Labor Force | Unemployed |
| 16 to 19 Years | 4,206 (38.8%) | 946 (22.5%) |
| 20 to 24 Years | 10,516 (76.1%) | 1,157 (11.0%) |
| 25 to 29 Years | 12,044 (83.7%) | 1,301 (10.8%) |
| 30 to 34 Years | 11,923 (83.9%) | 1,240 (10.4%) |
| 35 to 44 Years | 21,512 (81.7%) | 2,216 (10.3%) |
| 45 to 54 Years | 19,629 (79.1%) | 1,158 (5.9%) |
| 55 to 59 Years | 9,121 (68.6%) | 319 (3.5%) |
| 60 to 64 Years | 7,072 (50.7%) | 212 (3.0%) |
| 65 to 74 Years | 4,136 (20.5%) | 112 (2.7%) |
| 75 Years and over | 760 (5.9%) | 58 (7.6%) |
| Total | 100,965 (61.3%) | 8,481 (8.4%) |
Employment Status by Educational Attainment in Harrison County
According to labor force statistics for Harrison County, 76.0% of individuals (81,314) out of the total population between 25 and 64 years of age (106,992) are in the labor force, with 7.8% or 6,342 of them being unemployed. The group with the highest labor force participation rate are those with the educational attainment of bachelor's degree or higher, with 89.4% or 24,228 individuals in the labor force. Within the labor force, individuals with less than high school education have the highest percentage of unemployment, with 16.1% or 1,025 of them being unemployed.
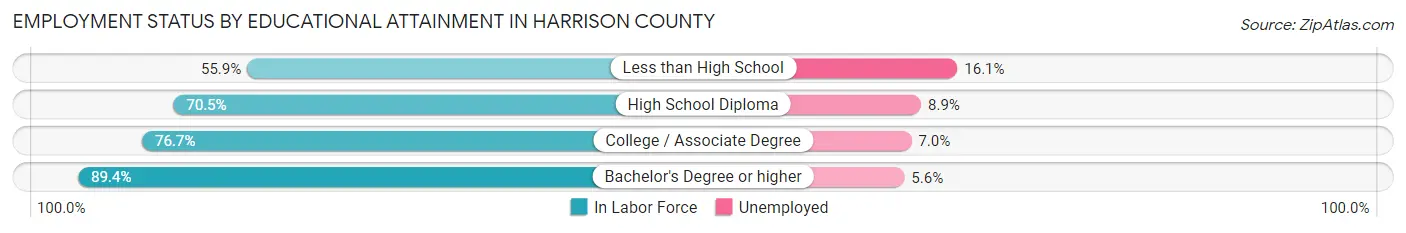
| Educational Attainment | In Labor Force | Unemployed |
| Less than High School | 6,364 (55.9%) | 1,833 (16.1%) |
| High School Diploma | 20,608 (70.5%) | 2,602 (8.9%) |
| College / Associate Degree | 30,124 (76.7%) | 2,749 (7.0%) |
| Bachelor's Degree or higher | 24,228 (89.4%) | 1,518 (5.6%) |
| Total | 81,314 (76.0%) | 8,345 (7.8%) |
Employment Occupations by Sex in Harrison County
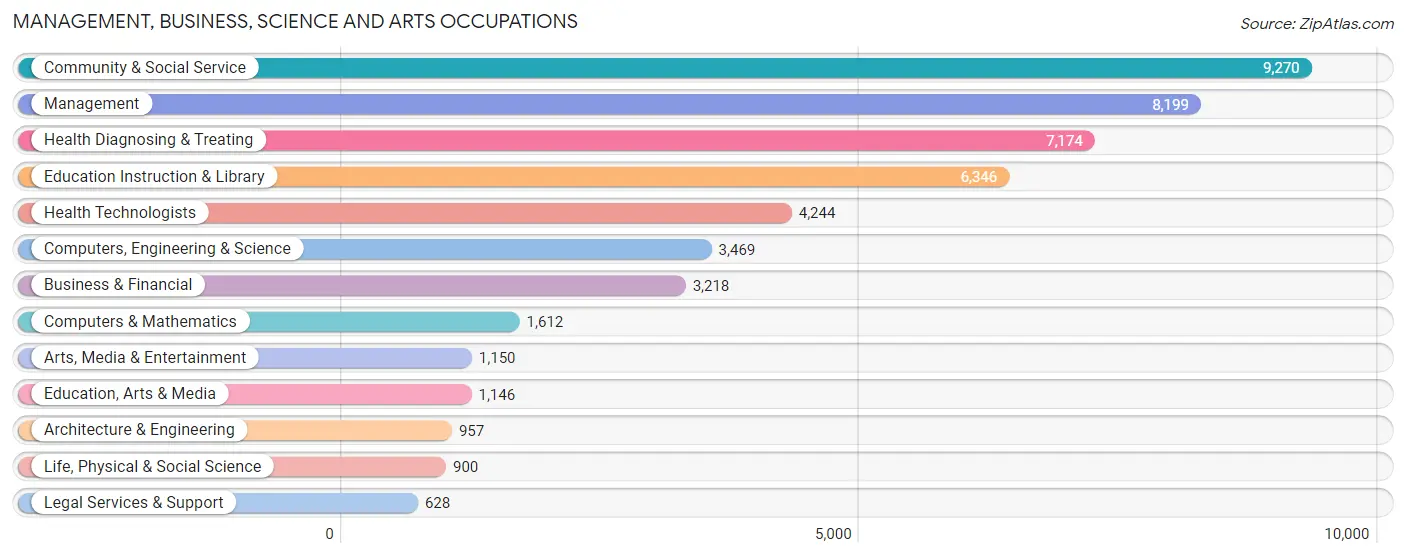
Management, Business, Science and Arts Occupations
The most common Management, Business, Science and Arts occupations in Harrison County are Community & Social Service (9,270 | 10.6%), Management (8,199 | 9.4%), Health Diagnosing & Treating (7,174 | 8.2%), Education Instruction & Library (6,346 | 7.3%), and Health Technologists (4,244 | 4.9%).
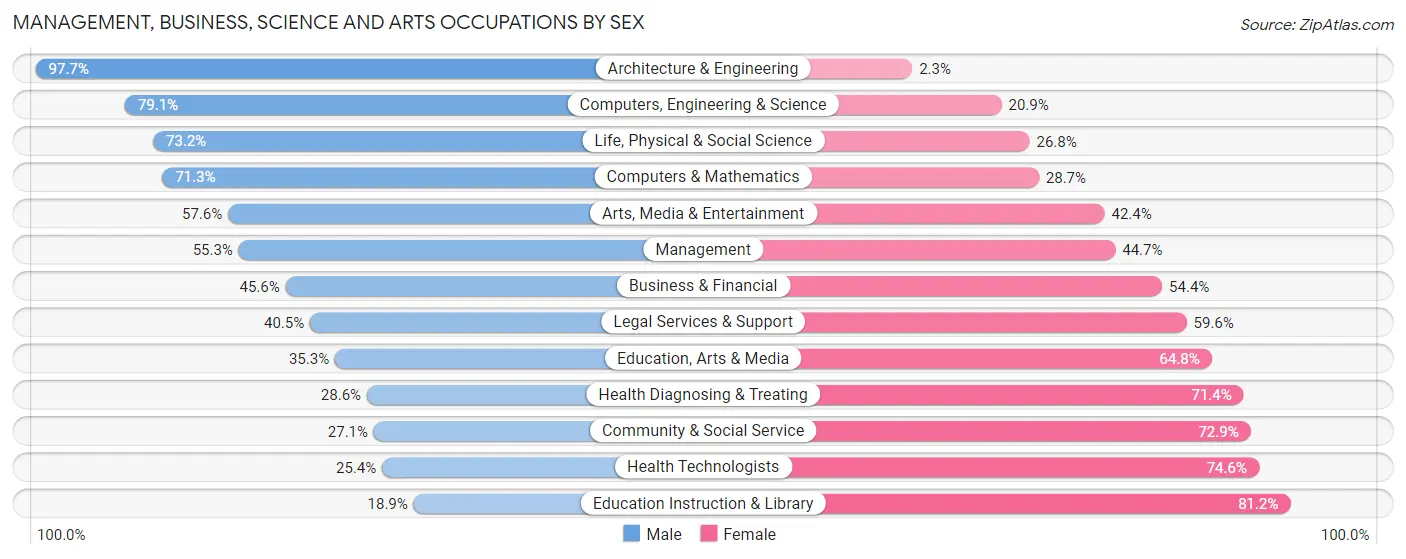
Management, Business, Science and Arts Occupations by Sex
Within the Management, Business, Science and Arts occupations in Harrison County, the most male-oriented occupations are Architecture & Engineering (97.7%), Computers, Engineering & Science (79.1%), and Life, Physical & Social Science (73.2%), while the most female-oriented occupations are Education Instruction & Library (81.1%), Health Technologists (74.6%), and Community & Social Service (72.9%).
| Occupation | Male | Female |
| Management | 4,537 (55.3%) | 3,662 (44.7%) |
| Business & Financial | 1,466 (45.6%) | 1,752 (54.4%) |
| Computers, Engineering & Science | 2,743 (79.1%) | 726 (20.9%) |
| Computers & Mathematics | 1,149 (71.3%) | 463 (28.7%) |
| Architecture & Engineering | 935 (97.7%) | 22 (2.3%) |
| Life, Physical & Social Science | 659 (73.2%) | 241 (26.8%) |
| Community & Social Service | 2,516 (27.1%) | 6,754 (72.9%) |
| Education, Arts & Media | 404 (35.2%) | 742 (64.7%) |
| Legal Services & Support | 254 (40.5%) | 374 (59.6%) |
| Education Instruction & Library | 1,196 (18.9%) | 5,150 (81.1%) |
| Arts, Media & Entertainment | 662 (57.6%) | 488 (42.4%) |
| Health Diagnosing & Treating | 2,051 (28.6%) | 5,123 (71.4%) |
| Health Technologists | 1,079 (25.4%) | 3,165 (74.6%) |
| Total (Category) | 13,313 (42.5%) | 18,017 (57.5%) |
| Total (Overall) | 43,634 (50.0%) | 43,706 (50.0%) |
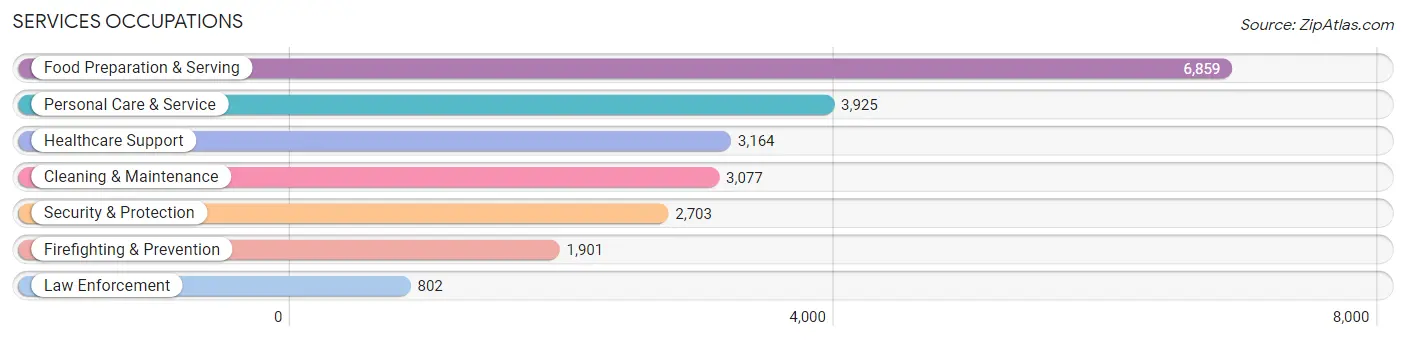
Services Occupations
The most common Services occupations in Harrison County are Food Preparation & Serving (6,859 | 7.9%), Personal Care & Service (3,925 | 4.5%), Healthcare Support (3,164 | 3.6%), Cleaning & Maintenance (3,077 | 3.5%), and Security & Protection (2,703 | 3.1%).
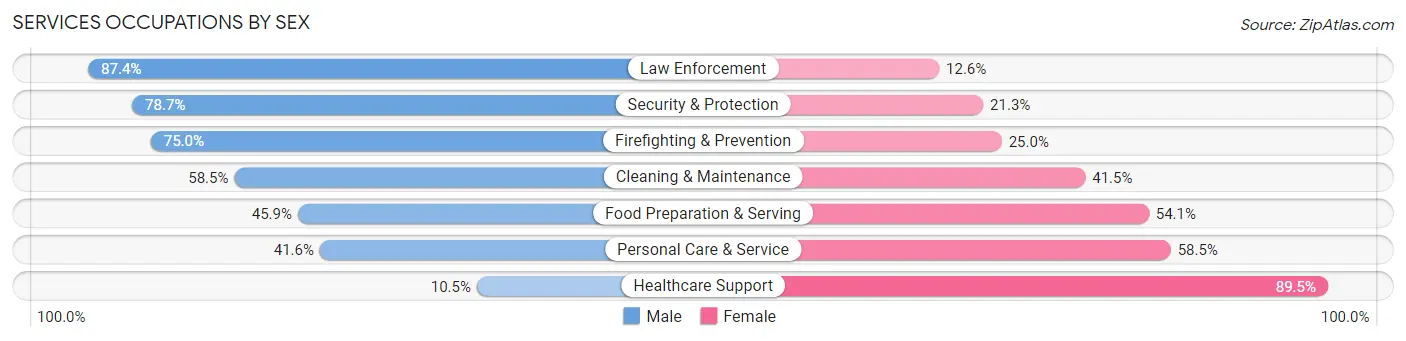
Services Occupations by Sex
Within the Services occupations in Harrison County, the most male-oriented occupations are Law Enforcement (87.4%), Security & Protection (78.7%), and Firefighting & Prevention (75.0%), while the most female-oriented occupations are Healthcare Support (89.5%), Personal Care & Service (58.5%), and Food Preparation & Serving (54.1%).
| Occupation | Male | Female |
| Healthcare Support | 331 (10.5%) | 2,833 (89.5%) |
| Security & Protection | 2,127 (78.7%) | 576 (21.3%) |
| Firefighting & Prevention | 1,426 (75.0%) | 475 (25.0%) |
| Law Enforcement | 701 (87.4%) | 101 (12.6%) |
| Food Preparation & Serving | 3,148 (45.9%) | 3,711 (54.1%) |
| Cleaning & Maintenance | 1,799 (58.5%) | 1,278 (41.5%) |
| Personal Care & Service | 1,631 (41.5%) | 2,294 (58.5%) |
| Total (Category) | 9,036 (45.8%) | 10,692 (54.2%) |
| Total (Overall) | 43,634 (50.0%) | 43,706 (50.0%) |
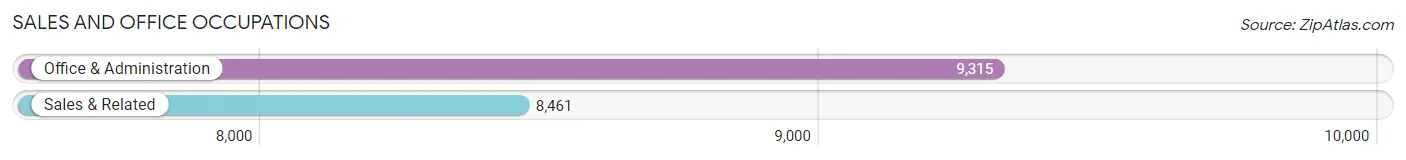
Sales and Office Occupations
The most common Sales and Office occupations in Harrison County are Office & Administration (9,315 | 10.7%), and Sales & Related (8,461 | 9.7%).
Sales and Office Occupations by Sex
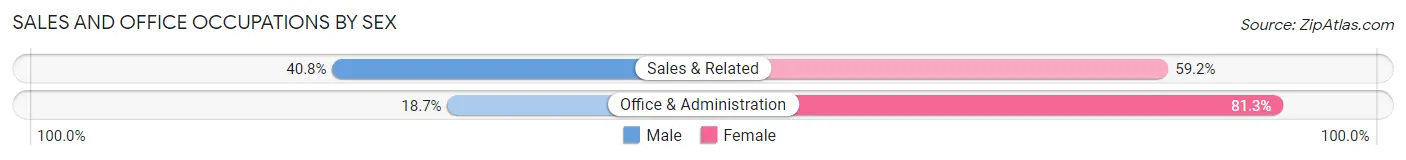
| Occupation | Male | Female |
| Sales & Related | 3,453 (40.8%) | 5,008 (59.2%) |
| Office & Administration | 1,741 (18.7%) | 7,574 (81.3%) |
| Total (Category) | 5,194 (29.2%) | 12,582 (70.8%) |
| Total (Overall) | 43,634 (50.0%) | 43,706 (50.0%) |
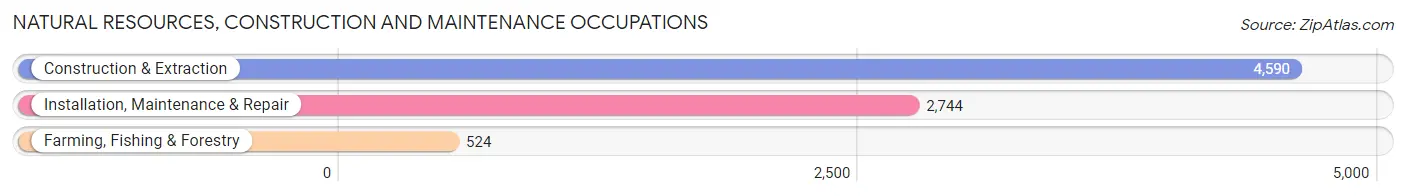
Natural Resources, Construction and Maintenance Occupations
The most common Natural Resources, Construction and Maintenance occupations in Harrison County are Construction & Extraction (4,590 | 5.3%), Installation, Maintenance & Repair (2,744 | 3.1%), and Farming, Fishing & Forestry (524 | 0.6%).
Natural Resources, Construction and Maintenance Occupations by Sex
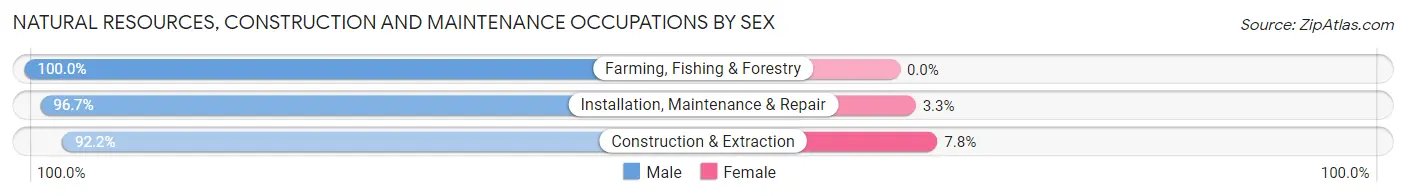
| Occupation | Male | Female |
| Farming, Fishing & Forestry | 524 (100.0%) | 0 (0.0%) |
| Construction & Extraction | 4,232 (92.2%) | 358 (7.8%) |
| Installation, Maintenance & Repair | 2,654 (96.7%) | 90 (3.3%) |
| Total (Category) | 7,410 (94.3%) | 448 (5.7%) |
| Total (Overall) | 43,634 (50.0%) | 43,706 (50.0%) |
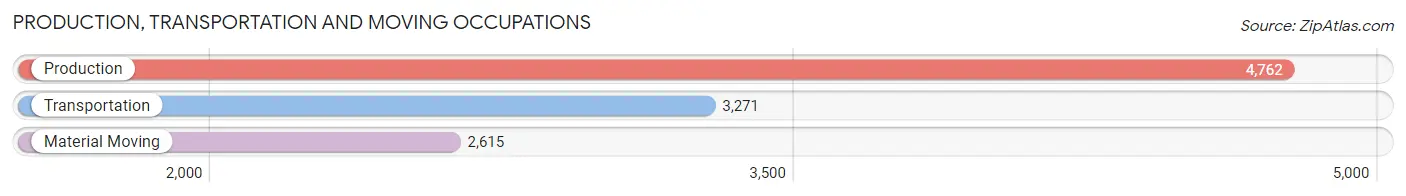
Production, Transportation and Moving Occupations
The most common Production, Transportation and Moving occupations in Harrison County are Production (4,762 | 5.4%), Transportation (3,271 | 3.7%), and Material Moving (2,615 | 3.0%).
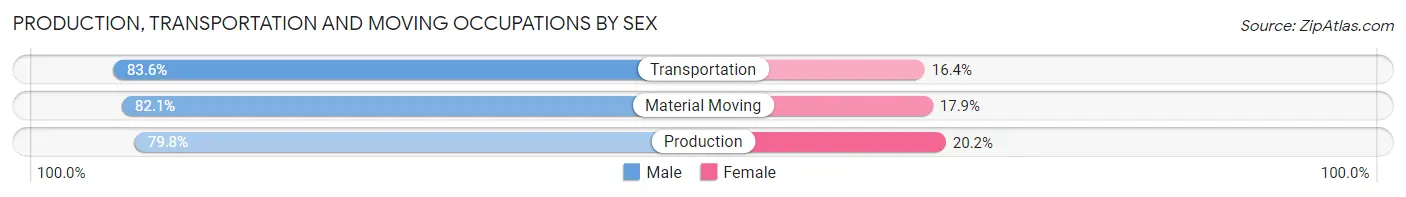
Production, Transportation and Moving Occupations by Sex
| Occupation | Male | Female |
| Production | 3,798 (79.8%) | 964 (20.2%) |
| Transportation | 2,735 (83.6%) | 536 (16.4%) |
| Material Moving | 2,148 (82.1%) | 467 (17.9%) |
| Total (Category) | 8,681 (81.5%) | 1,967 (18.5%) |
| Total (Overall) | 43,634 (50.0%) | 43,706 (50.0%) |
Employment Industries by Sex in Harrison County
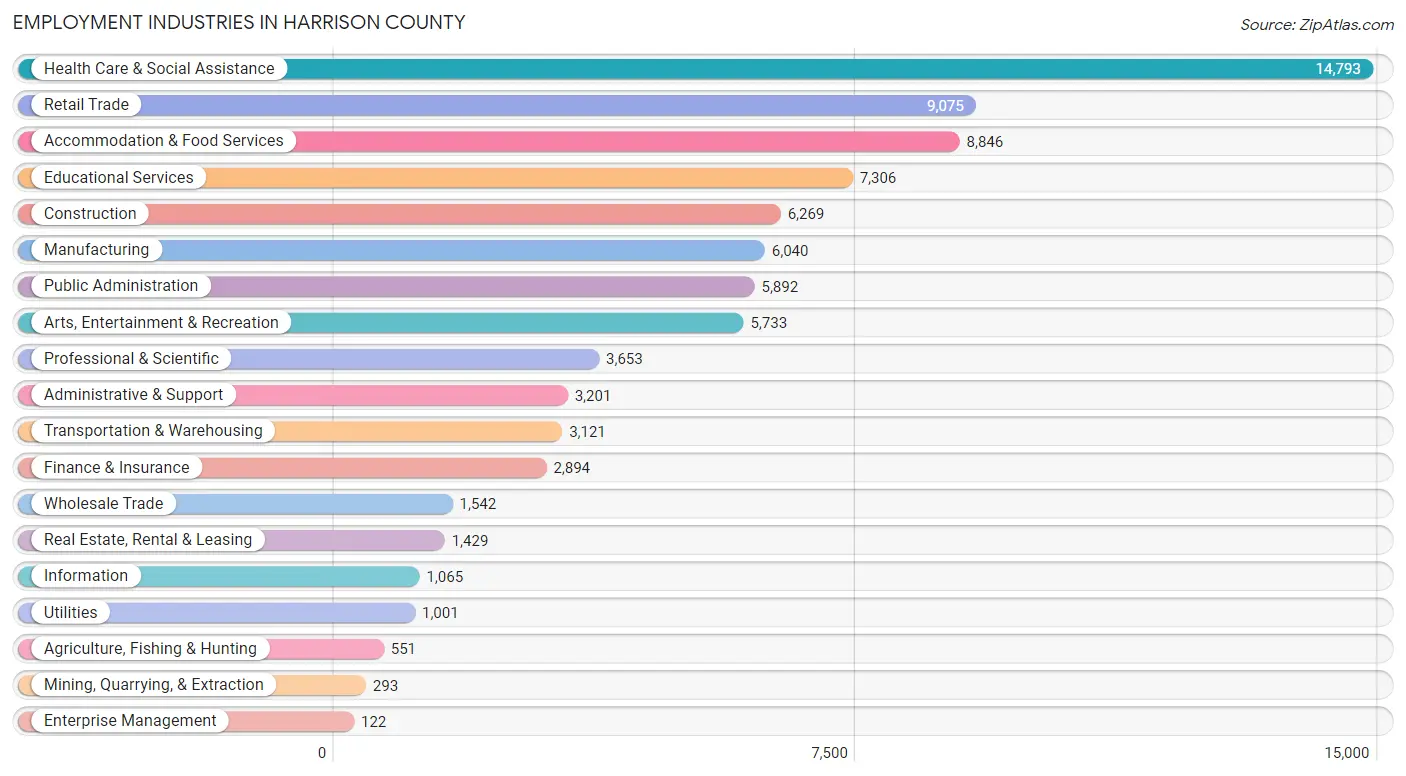
Employment Industries in Harrison County
The major employment industries in Harrison County include Health Care & Social Assistance (14,793 | 16.9%), Retail Trade (9,075 | 10.4%), Accommodation & Food Services (8,846 | 10.1%), Educational Services (7,306 | 8.4%), and Construction (6,269 | 7.2%).
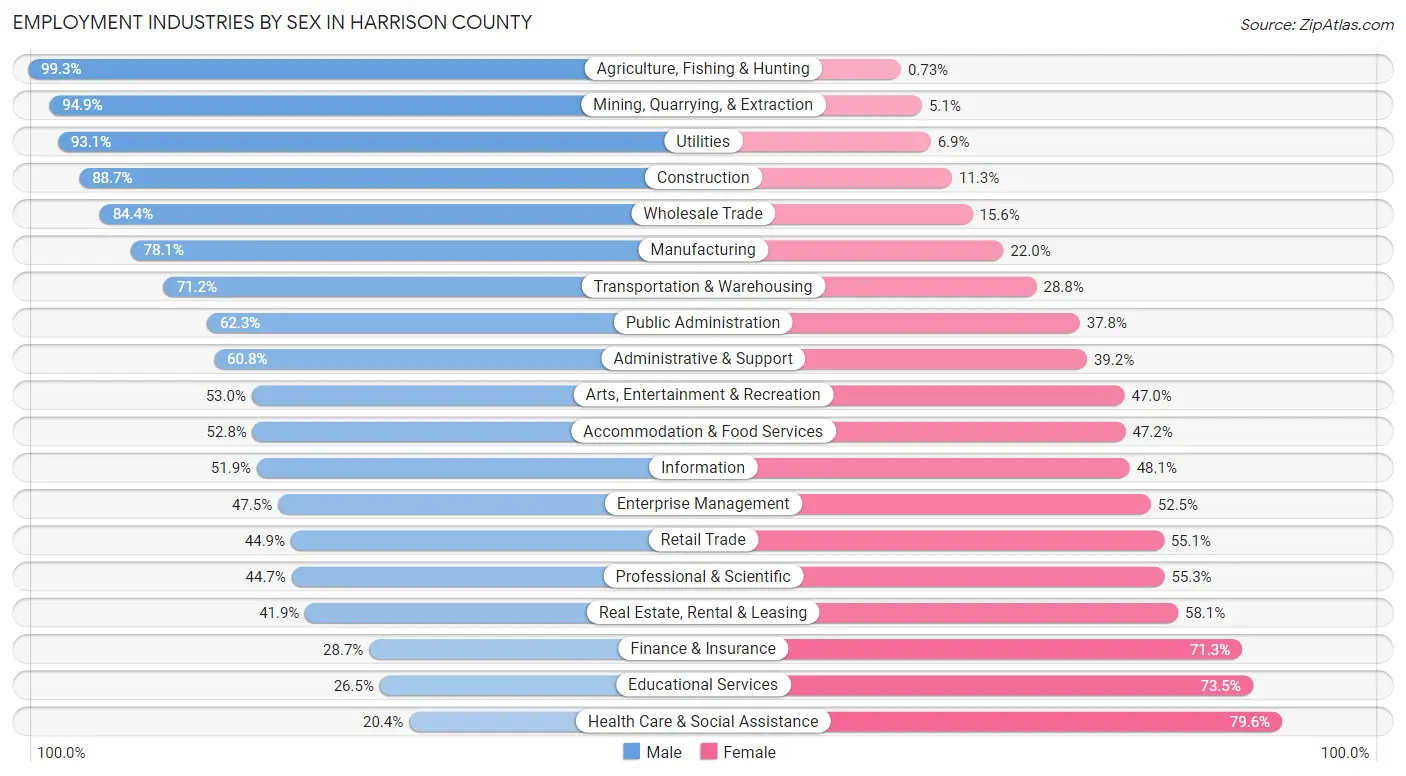
Employment Industries by Sex in Harrison County
The Harrison County industries that see more men than women are Agriculture, Fishing & Hunting (99.3%), Mining, Quarrying, & Extraction (94.9%), and Utilities (93.1%), whereas the industries that tend to have a higher number of women are Health Care & Social Assistance (79.6%), Educational Services (73.5%), and Finance & Insurance (71.3%).
| Industry | Male | Female |
| Agriculture, Fishing & Hunting | 547 (99.3%) | 4 (0.7%) |
| Mining, Quarrying, & Extraction | 278 (94.9%) | 15 (5.1%) |
| Construction | 5,560 (88.7%) | 709 (11.3%) |
| Manufacturing | 4,714 (78.0%) | 1,326 (22.0%) |
| Wholesale Trade | 1,302 (84.4%) | 240 (15.6%) |
| Retail Trade | 4,074 (44.9%) | 5,001 (55.1%) |
| Transportation & Warehousing | 2,222 (71.2%) | 899 (28.8%) |
| Utilities | 932 (93.1%) | 69 (6.9%) |
| Information | 553 (51.9%) | 512 (48.1%) |
| Finance & Insurance | 830 (28.7%) | 2,064 (71.3%) |
| Real Estate, Rental & Leasing | 599 (41.9%) | 830 (58.1%) |
| Professional & Scientific | 1,634 (44.7%) | 2,019 (55.3%) |
| Enterprise Management | 58 (47.5%) | 64 (52.5%) |
| Administrative & Support | 1,945 (60.8%) | 1,256 (39.2%) |
| Educational Services | 1,935 (26.5%) | 5,371 (73.5%) |
| Health Care & Social Assistance | 3,021 (20.4%) | 11,772 (79.6%) |
| Arts, Entertainment & Recreation | 3,038 (53.0%) | 2,695 (47.0%) |
| Accommodation & Food Services | 4,670 (52.8%) | 4,176 (47.2%) |
| Public Administration | 3,668 (62.3%) | 2,224 (37.8%) |
| Total | 43,634 (50.0%) | 43,706 (50.0%) |
Education in Harrison County
School Enrollment in Harrison County
The most common levels of schooling among the 50,005 students in Harrison County are middle school (11,675 | 23.4%), high school (10,822 | 21.6%), and elementary school (10,800 | 21.6%).
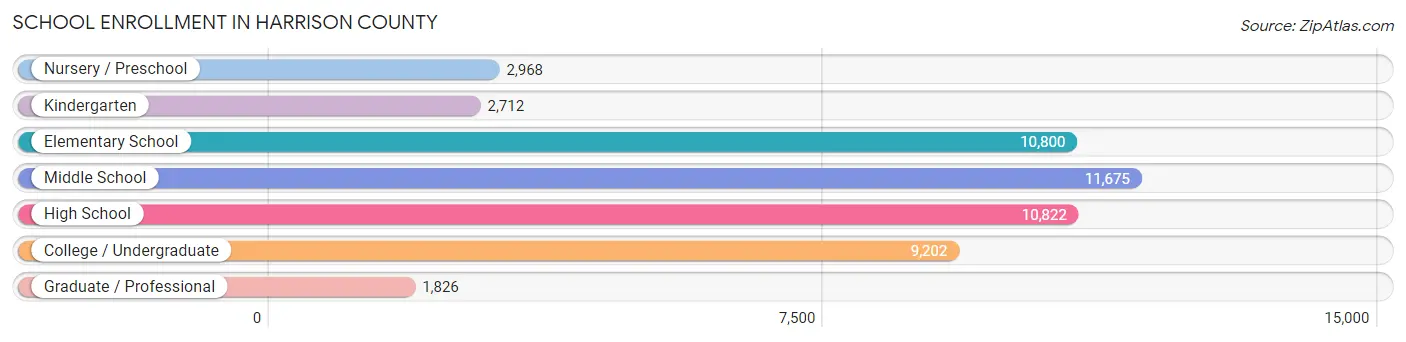
| School Level | # Students | % Students |
| Nursery / Preschool | 2,968 | 5.9% |
| Kindergarten | 2,712 | 5.4% |
| Elementary School | 10,800 | 21.6% |
| Middle School | 11,675 | 23.4% |
| High School | 10,822 | 21.6% |
| College / Undergraduate | 9,202 | 18.4% |
| Graduate / Professional | 1,826 | 3.6% |
| Total | 50,005 | 100.0% |
School Enrollment by Age by Funding Source in Harrison County
Out of a total of 50,005 students who are enrolled in schools in Harrison County, 7,051 (14.1%) attend a private institution, while the remaining 42,954 (85.9%) are enrolled in public schools. The age group of 3 to 4 year olds has the highest likelihood of being enrolled in private schools, with 1,039 (43.1% in the age bracket) enrolled. Conversely, the age group of 15 to 17 year olds has the lowest likelihood of being enrolled in a private school, with 7,350 (90.9% in the age bracket) attending a public institution.
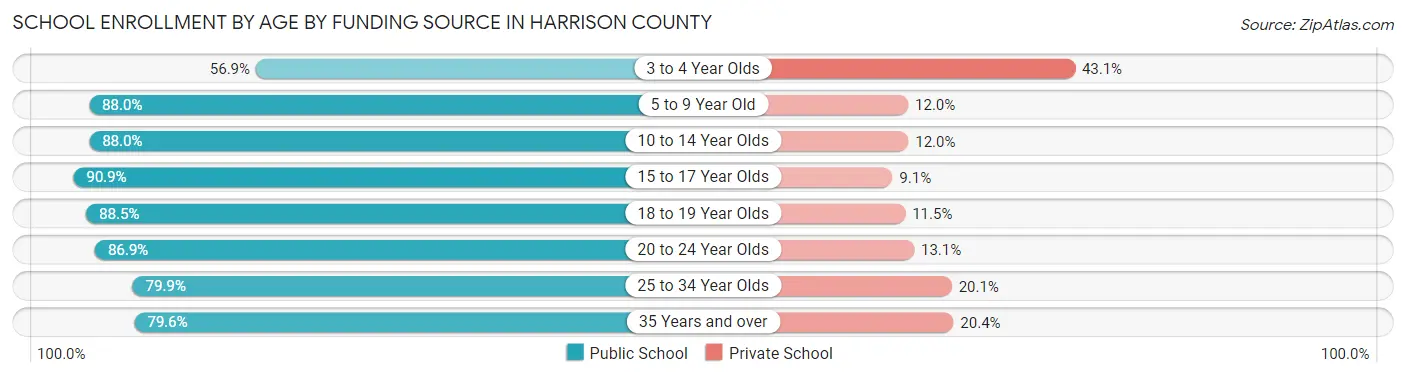
| Age Bracket | Public School | Private School |
| 3 to 4 Year Olds | 1,373 (56.9%) | 1,039 (43.1%) |
| 5 to 9 Year Old | 11,058 (88.0%) | 1,508 (12.0%) |
| 10 to 14 Year Olds | 12,291 (88.0%) | 1,682 (12.0%) |
| 15 to 17 Year Olds | 7,350 (90.9%) | 734 (9.1%) |
| 18 to 19 Year Olds | 2,933 (88.5%) | 380 (11.5%) |
| 20 to 24 Year Olds | 3,209 (86.9%) | 484 (13.1%) |
| 25 to 34 Year Olds | 2,251 (79.9%) | 567 (20.1%) |
| 35 Years and over | 2,503 (79.6%) | 643 (20.4%) |
| Total | 42,954 (85.9%) | 7,051 (14.1%) |
Educational Attainment by Field of Study in Harrison County
Business (7,887 | 21.1%), education (6,411 | 17.2%), science & technology (5,492 | 14.7%), arts & humanities (2,687 | 7.2%), and bio, nature & agricultural (1,949 | 5.2%) are the most common fields of study among 37,332 individuals in Harrison County who have obtained a bachelor's degree or higher.
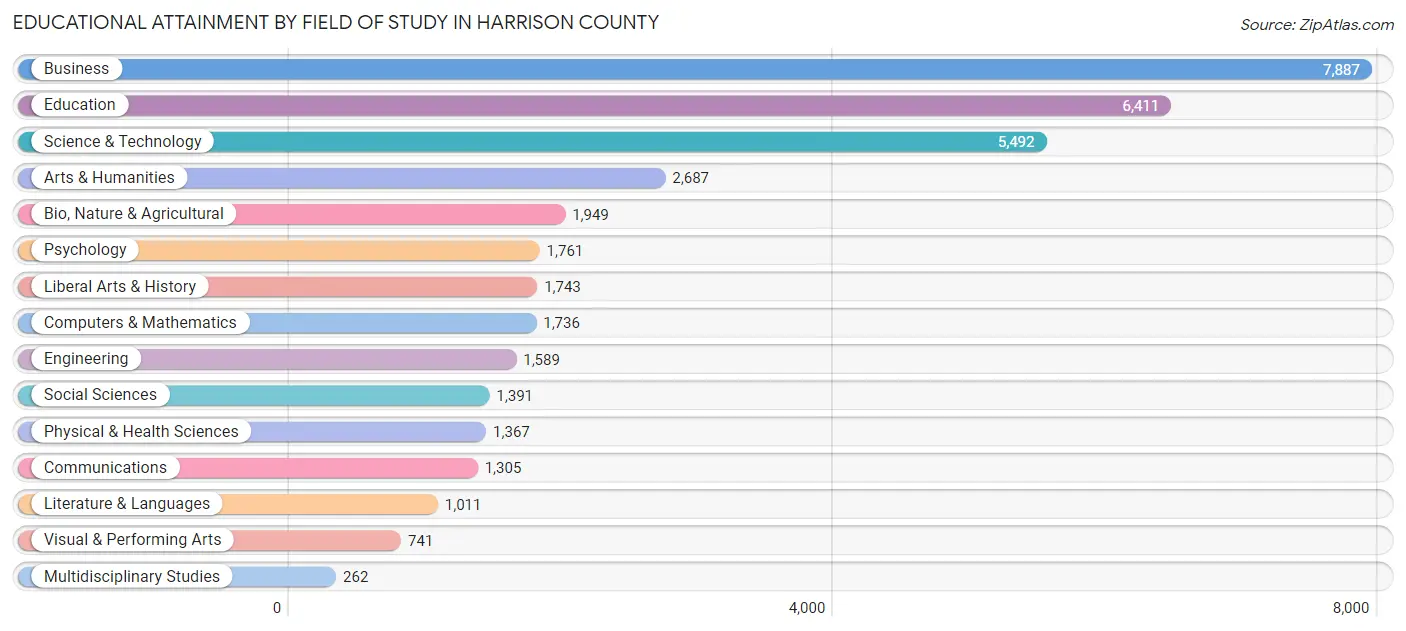
| Field of Study | # Graduates | % Graduates |
| Computers & Mathematics | 1,736 | 4.6% |
| Bio, Nature & Agricultural | 1,949 | 5.2% |
| Physical & Health Sciences | 1,367 | 3.7% |
| Psychology | 1,761 | 4.7% |
| Social Sciences | 1,391 | 3.7% |
| Engineering | 1,589 | 4.3% |
| Multidisciplinary Studies | 262 | 0.7% |
| Science & Technology | 5,492 | 14.7% |
| Business | 7,887 | 21.1% |
| Education | 6,411 | 17.2% |
| Literature & Languages | 1,011 | 2.7% |
| Liberal Arts & History | 1,743 | 4.7% |
| Visual & Performing Arts | 741 | 2.0% |
| Communications | 1,305 | 3.5% |
| Arts & Humanities | 2,687 | 7.2% |
| Total | 37,332 | 100.0% |
Transportation & Commute in Harrison County
Vehicle Availability by Sex in Harrison County
The most prevalent vehicle ownership categories in Harrison County are males with 2 vehicles (18,437, accounting for 40.7%) and females with 2 vehicles (16,820, making up 42.2%).
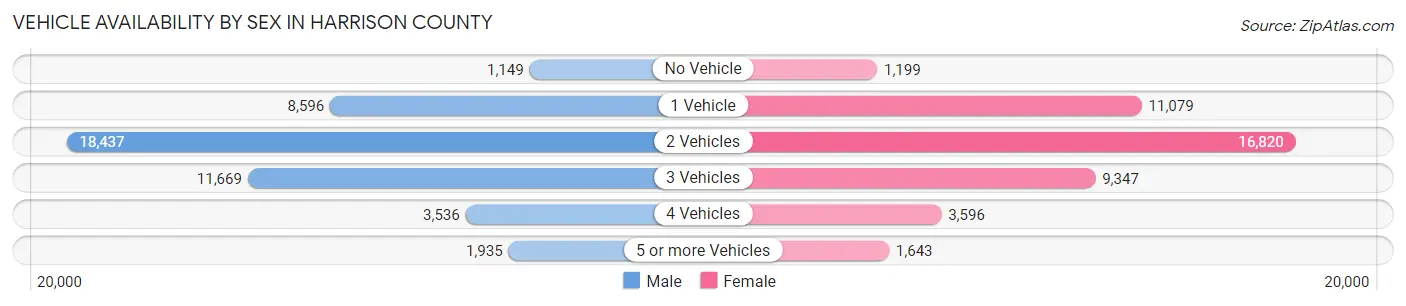
| Vehicles Available | Male | Female |
| No Vehicle | 1,149 (2.5%) | 1,199 (2.7%) |
| 1 Vehicle | 8,596 (19.0%) | 11,079 (25.4%) |
| 2 Vehicles | 18,437 (40.7%) | 16,820 (38.5%) |
| 3 Vehicles | 11,669 (25.8%) | 9,347 (21.4%) |
| 4 Vehicles | 3,536 (7.8%) | 3,596 (8.2%) |
| 5 or more Vehicles | 1,935 (4.3%) | 1,643 (3.8%) |
| Total | 45,322 (100.0%) | 43,684 (100.0%) |
Commute Time in Harrison County
The most frequently occuring commute durations in Harrison County are 15 to 19 minutes (16,242 commuters, 18.7%), 20 to 24 minutes (15,560 commuters, 17.9%), and 10 to 14 minutes (12,114 commuters, 13.9%).
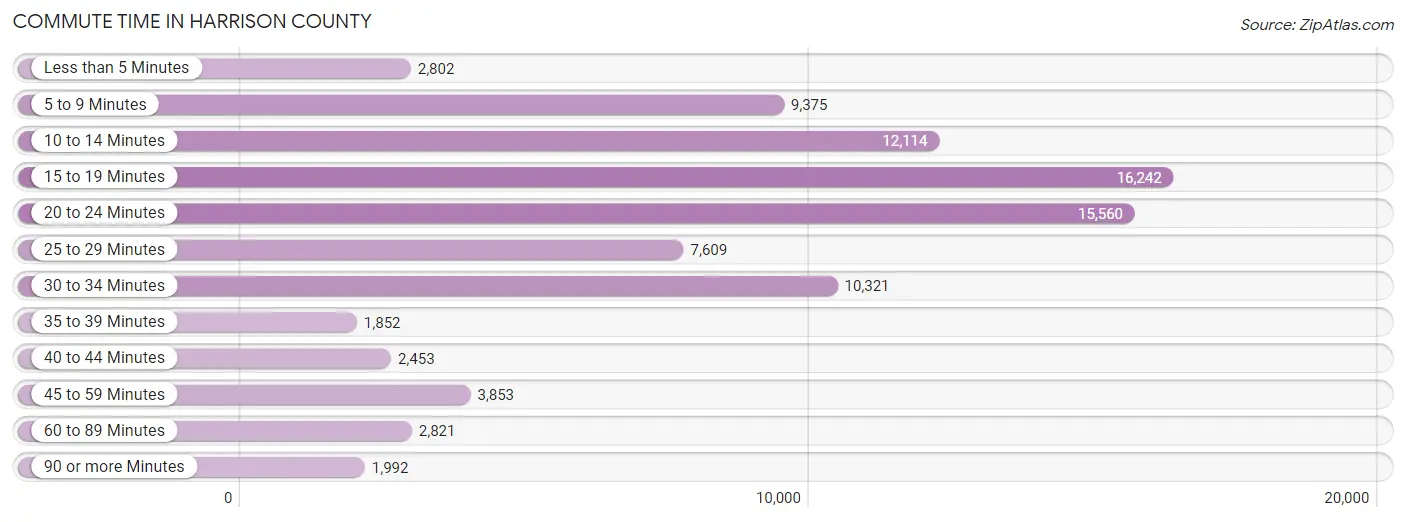
| Commute Time | # Commuters | % Commuters |
| Less than 5 Minutes | 2,802 | 3.2% |
| 5 to 9 Minutes | 9,375 | 10.8% |
| 10 to 14 Minutes | 12,114 | 13.9% |
| 15 to 19 Minutes | 16,242 | 18.7% |
| 20 to 24 Minutes | 15,560 | 17.9% |
| 25 to 29 Minutes | 7,609 | 8.7% |
| 30 to 34 Minutes | 10,321 | 11.9% |
| 35 to 39 Minutes | 1,852 | 2.1% |
| 40 to 44 Minutes | 2,453 | 2.8% |
| 45 to 59 Minutes | 3,853 | 4.4% |
| 60 to 89 Minutes | 2,821 | 3.2% |
| 90 or more Minutes | 1,992 | 2.3% |
Commute Time by Sex in Harrison County
The most common commute times in Harrison County are 15 to 19 minutes (8,069 commuters, 17.7%) for males and 15 to 19 minutes (8,173 commuters, 19.7%) for females.
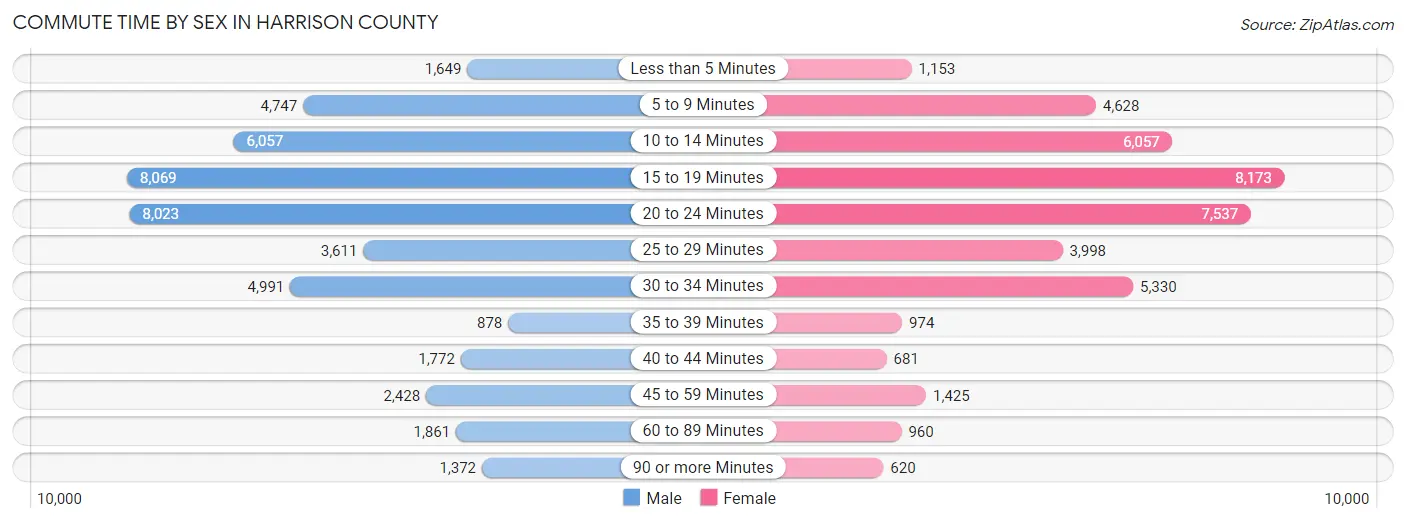
| Commute Time | Male | Female |
| Less than 5 Minutes | 1,649 (3.6%) | 1,153 (2.8%) |
| 5 to 9 Minutes | 4,747 (10.4%) | 4,628 (11.1%) |
| 10 to 14 Minutes | 6,057 (13.3%) | 6,057 (14.6%) |
| 15 to 19 Minutes | 8,069 (17.7%) | 8,173 (19.7%) |
| 20 to 24 Minutes | 8,023 (17.6%) | 7,537 (18.1%) |
| 25 to 29 Minutes | 3,611 (7.9%) | 3,998 (9.6%) |
| 30 to 34 Minutes | 4,991 (11.0%) | 5,330 (12.8%) |
| 35 to 39 Minutes | 878 (1.9%) | 974 (2.3%) |
| 40 to 44 Minutes | 1,772 (3.9%) | 681 (1.6%) |
| 45 to 59 Minutes | 2,428 (5.3%) | 1,425 (3.4%) |
| 60 to 89 Minutes | 1,861 (4.1%) | 960 (2.3%) |
| 90 or more Minutes | 1,372 (3.0%) | 620 (1.5%) |
Time of Departure to Work by Sex in Harrison County
The most frequent times of departure to work in Harrison County are 6:00 AM to 6:29 AM (6,069, 13.4%) for males and 7:00 AM to 7:29 AM (7,341, 17.7%) for females.
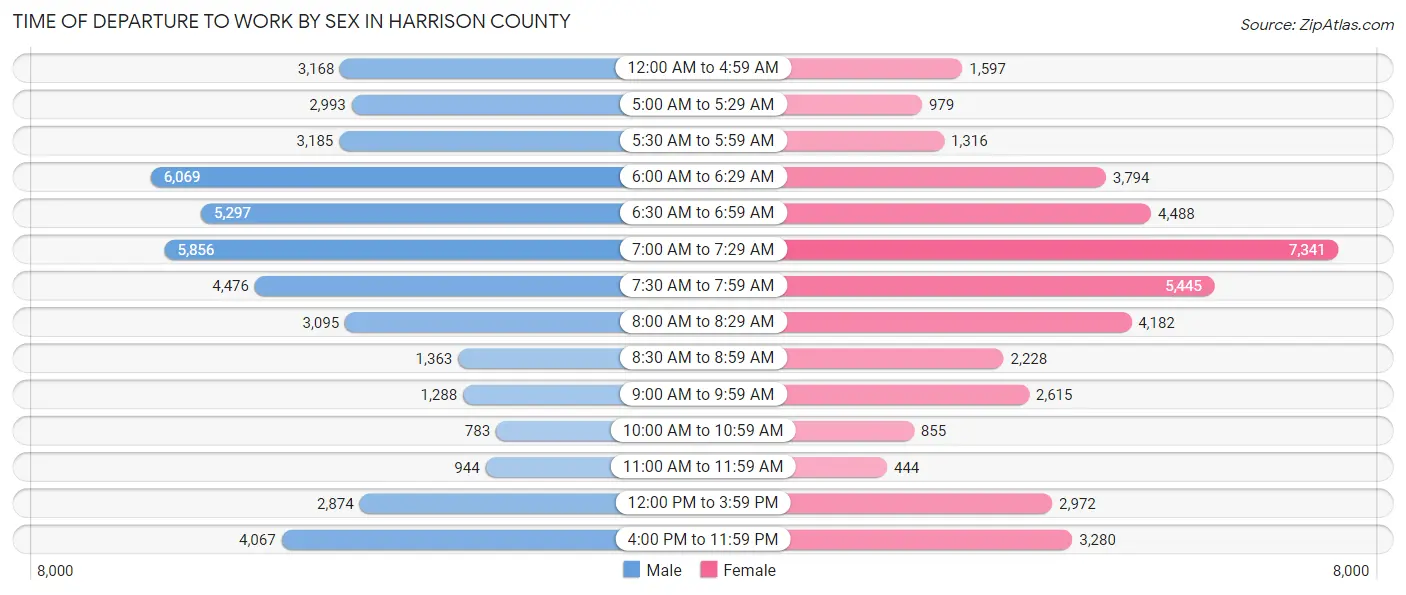
| Time of Departure | Male | Female |
| 12:00 AM to 4:59 AM | 3,168 (7.0%) | 1,597 (3.8%) |
| 5:00 AM to 5:29 AM | 2,993 (6.6%) | 979 (2.4%) |
| 5:30 AM to 5:59 AM | 3,185 (7.0%) | 1,316 (3.2%) |
| 6:00 AM to 6:29 AM | 6,069 (13.4%) | 3,794 (9.1%) |
| 6:30 AM to 6:59 AM | 5,297 (11.7%) | 4,488 (10.8%) |
| 7:00 AM to 7:29 AM | 5,856 (12.9%) | 7,341 (17.7%) |
| 7:30 AM to 7:59 AM | 4,476 (9.9%) | 5,445 (13.1%) |
| 8:00 AM to 8:29 AM | 3,095 (6.8%) | 4,182 (10.1%) |
| 8:30 AM to 8:59 AM | 1,363 (3.0%) | 2,228 (5.4%) |
| 9:00 AM to 9:59 AM | 1,288 (2.8%) | 2,615 (6.3%) |
| 10:00 AM to 10:59 AM | 783 (1.7%) | 855 (2.1%) |
| 11:00 AM to 11:59 AM | 944 (2.1%) | 444 (1.1%) |
| 12:00 PM to 3:59 PM | 2,874 (6.3%) | 2,972 (7.2%) |
| 4:00 PM to 11:59 PM | 4,067 (8.9%) | 3,280 (7.9%) |
| Total | 45,458 (100.0%) | 41,536 (100.0%) |
Housing Occupancy in Harrison County
Occupancy by Ownership in Harrison County
Of the total 80,191 dwellings in Harrison County, owner-occupied units account for 47,827 (59.6%), while renter-occupied units make up 32,364 (40.4%).
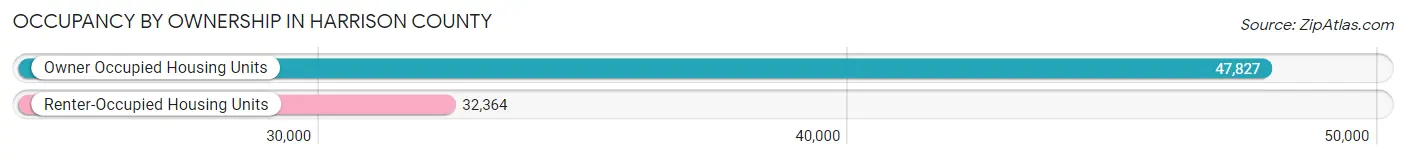
| Occupancy | # Housing Units | % Housing Units |
| Owner Occupied Housing Units | 47,827 | 59.6% |
| Renter-Occupied Housing Units | 32,364 | 40.4% |
| Total Occupied Housing Units | 80,191 | 100.0% |
Occupancy by Household Size in Harrison County
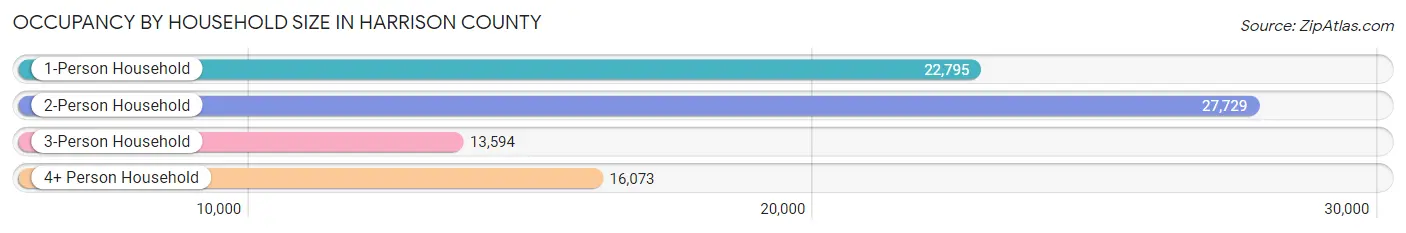
| Household Size | # Housing Units | % Housing Units |
| 1-Person Household | 22,795 | 28.4% |
| 2-Person Household | 27,729 | 34.6% |
| 3-Person Household | 13,594 | 17.0% |
| 4+ Person Household | 16,073 | 20.0% |
| Total Housing Units | 80,191 | 100.0% |
Occupancy by Ownership by Household Size in Harrison County
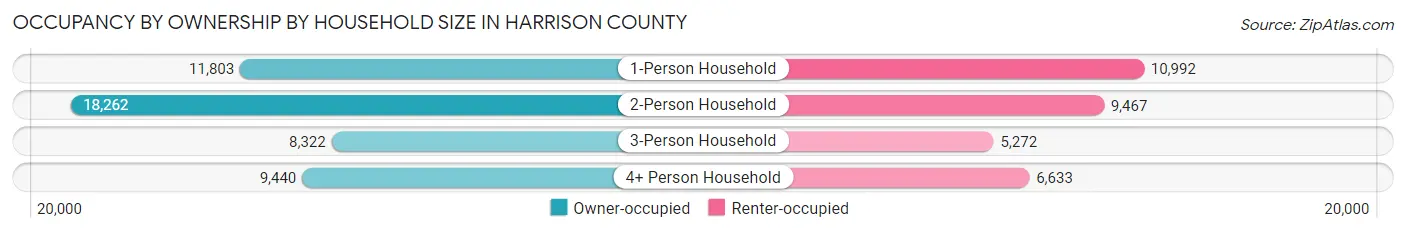
| Household Size | Owner-occupied | Renter-occupied |
| 1-Person Household | 11,803 (51.8%) | 10,992 (48.2%) |
| 2-Person Household | 18,262 (65.9%) | 9,467 (34.1%) |
| 3-Person Household | 8,322 (61.2%) | 5,272 (38.8%) |
| 4+ Person Household | 9,440 (58.7%) | 6,633 (41.3%) |
| Total Housing Units | 47,827 (59.6%) | 32,364 (40.4%) |
Occupancy by Educational Attainment in Harrison County
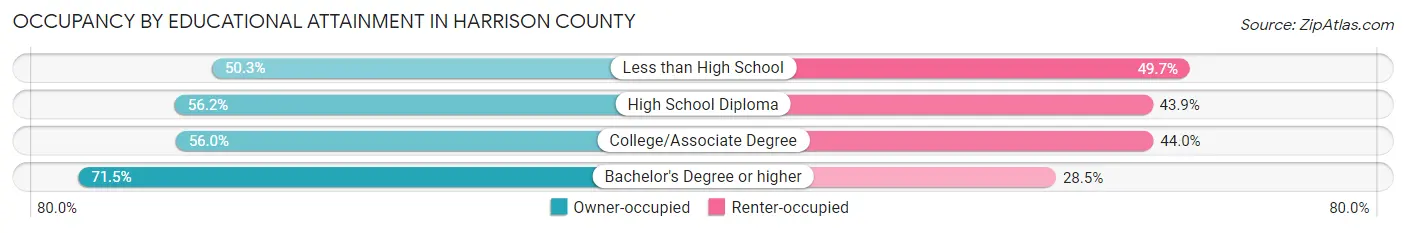
| Household Size | Owner-occupied | Renter-occupied |
| Less than High School | 3,822 (50.3%) | 3,781 (49.7%) |
| High School Diploma | 11,273 (56.1%) | 8,802 (43.9%) |
| College/Associate Degree | 17,418 (56.0%) | 13,670 (44.0%) |
| Bachelor's Degree or higher | 15,314 (71.5%) | 6,111 (28.5%) |
Occupancy by Age of Householder in Harrison County
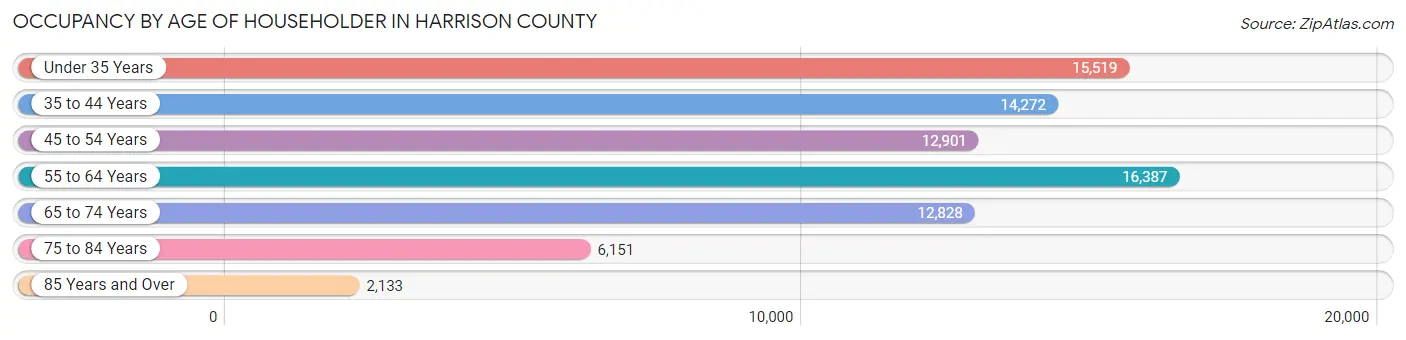
| Age Bracket | # Households | % Households |
| Under 35 Years | 15,519 | 19.4% |
| 35 to 44 Years | 14,272 | 17.8% |
| 45 to 54 Years | 12,901 | 16.1% |
| 55 to 64 Years | 16,387 | 20.4% |
| 65 to 74 Years | 12,828 | 16.0% |
| 75 to 84 Years | 6,151 | 7.7% |
| 85 Years and Over | 2,133 | 2.7% |
| Total | 80,191 | 100.0% |
Housing Finances in Harrison County
Median Income by Occupancy in Harrison County
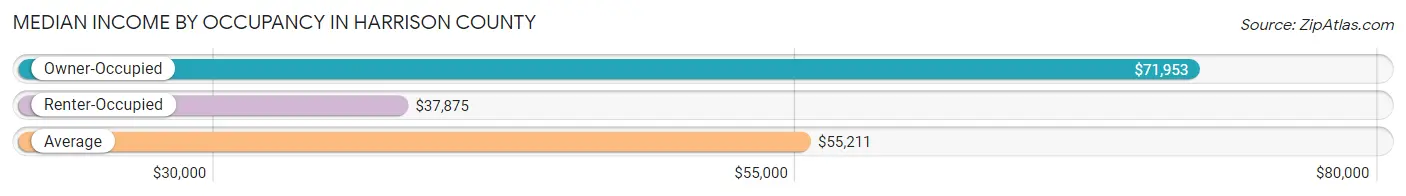
| Occupancy Type | # Households | Median Income |
| Owner-Occupied | 47,827 (59.6%) | $71,953 |
| Renter-Occupied | 32,364 (40.4%) | $37,875 |
| Average | 80,191 (100.0%) | $55,211 |
Occupancy by Householder Income Bracket in Harrison County
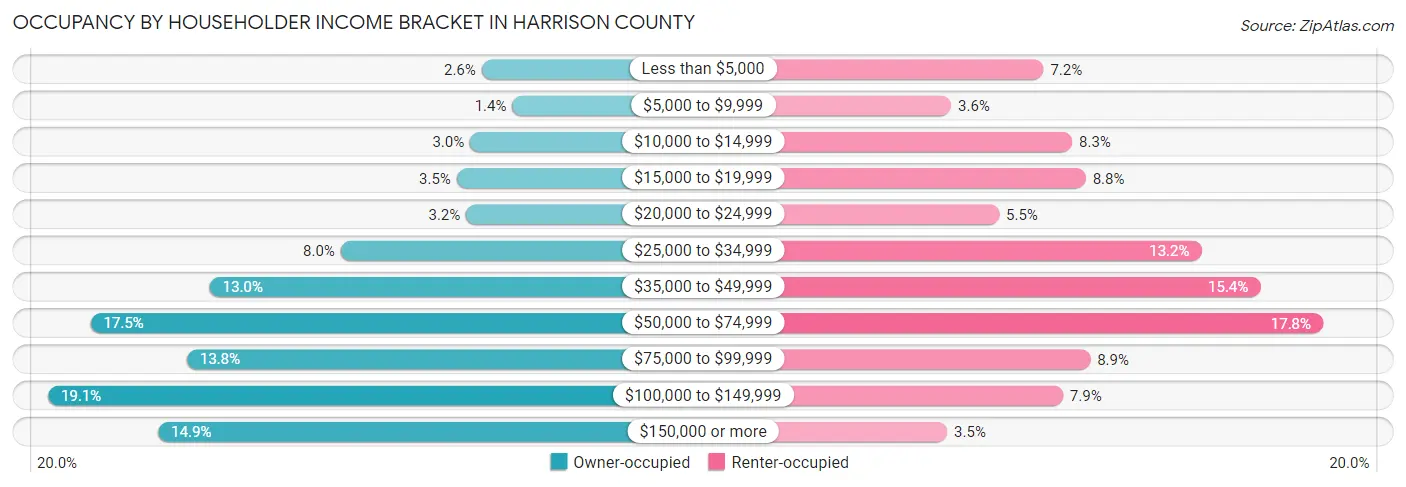
| Income Bracket | Owner-occupied | Renter-occupied |
| Less than $5,000 | 1,241 (2.6%) | 2,318 (7.2%) |
| $5,000 to $9,999 | 680 (1.4%) | 1,178 (3.6%) |
| $10,000 to $14,999 | 1,448 (3.0%) | 2,670 (8.3%) |
| $15,000 to $19,999 | 1,692 (3.5%) | 2,839 (8.8%) |
| $20,000 to $24,999 | 1,519 (3.2%) | 1,771 (5.5%) |
| $25,000 to $34,999 | 3,806 (8.0%) | 4,263 (13.2%) |
| $35,000 to $49,999 | 6,194 (13.0%) | 4,987 (15.4%) |
| $50,000 to $74,999 | 8,366 (17.5%) | 5,760 (17.8%) |
| $75,000 to $99,999 | 6,611 (13.8%) | 2,893 (8.9%) |
| $100,000 to $149,999 | 9,140 (19.1%) | 2,557 (7.9%) |
| $150,000 or more | 7,130 (14.9%) | 1,128 (3.5%) |
| Total | 47,827 (100.0%) | 32,364 (100.0%) |
Monthly Housing Cost Tiers in Harrison County
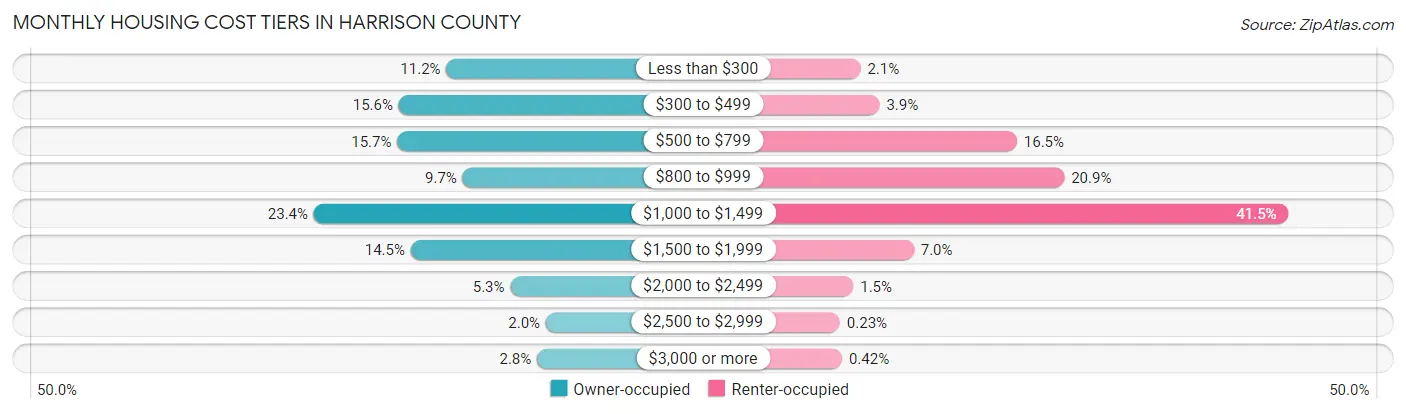
| Monthly Cost | Owner-occupied | Renter-occupied |
| Less than $300 | 5,344 (11.2%) | 687 (2.1%) |
| $300 to $499 | 7,437 (15.5%) | 1,251 (3.9%) |
| $500 to $799 | 7,504 (15.7%) | 5,348 (16.5%) |
| $800 to $999 | 4,623 (9.7%) | 6,758 (20.9%) |
| $1,000 to $1,499 | 11,175 (23.4%) | 13,438 (41.5%) |
| $1,500 to $1,999 | 6,910 (14.4%) | 2,274 (7.0%) |
| $2,000 to $2,499 | 2,526 (5.3%) | 471 (1.5%) |
| $2,500 to $2,999 | 960 (2.0%) | 73 (0.2%) |
| $3,000 or more | 1,348 (2.8%) | 137 (0.4%) |
| Total | 47,827 (100.0%) | 32,364 (100.0%) |
Physical Housing Characteristics in Harrison County
Housing Structures in Harrison County
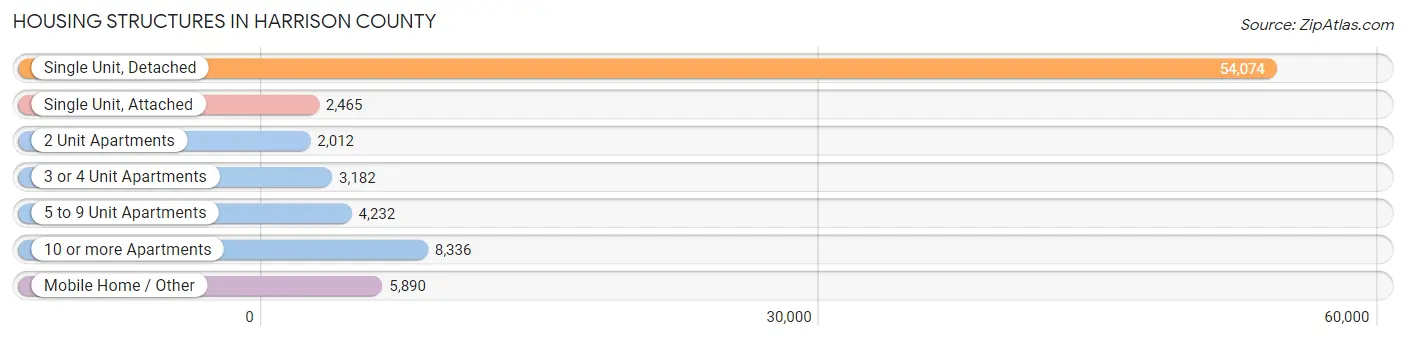
| Structure Type | # Housing Units | % Housing Units |
| Single Unit, Detached | 54,074 | 67.4% |
| Single Unit, Attached | 2,465 | 3.1% |
| 2 Unit Apartments | 2,012 | 2.5% |
| 3 or 4 Unit Apartments | 3,182 | 4.0% |
| 5 to 9 Unit Apartments | 4,232 | 5.3% |
| 10 or more Apartments | 8,336 | 10.4% |
| Mobile Home / Other | 5,890 | 7.3% |
| Total | 80,191 | 100.0% |
Housing Structures by Occupancy in Harrison County
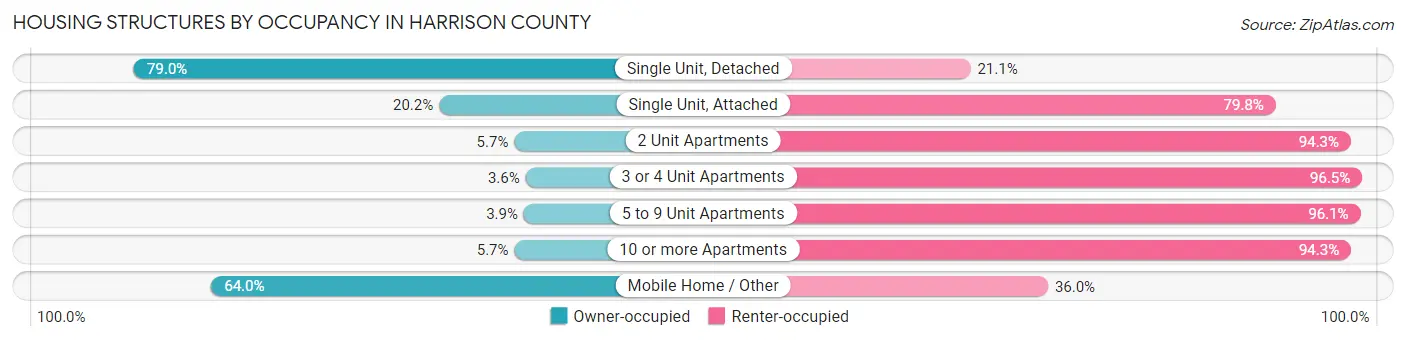
| Structure Type | Owner-occupied | Renter-occupied |
| Single Unit, Detached | 42,690 (78.9%) | 11,384 (21.0%) |
| Single Unit, Attached | 498 (20.2%) | 1,967 (79.8%) |
| 2 Unit Apartments | 115 (5.7%) | 1,897 (94.3%) |
| 3 or 4 Unit Apartments | 113 (3.5%) | 3,069 (96.5%) |
| 5 to 9 Unit Apartments | 164 (3.9%) | 4,068 (96.1%) |
| 10 or more Apartments | 475 (5.7%) | 7,861 (94.3%) |
| Mobile Home / Other | 3,772 (64.0%) | 2,118 (36.0%) |
| Total | 47,827 (59.6%) | 32,364 (40.4%) |
Housing Structures by Number of Rooms in Harrison County
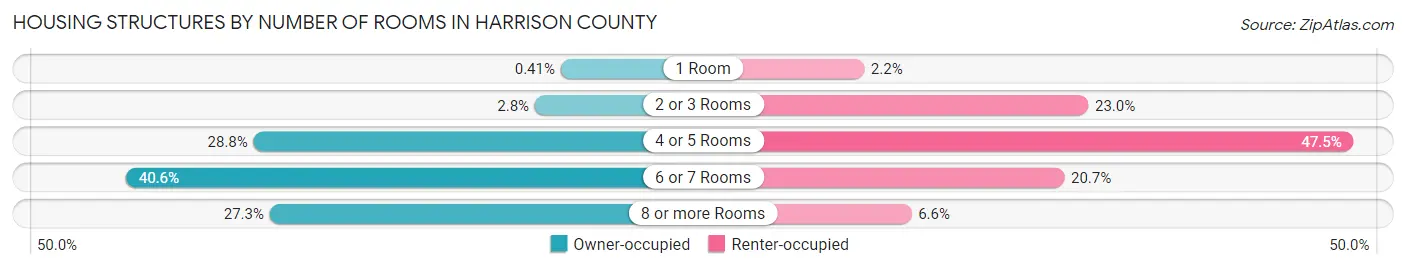
| Number of Rooms | Owner-occupied | Renter-occupied |
| 1 Room | 197 (0.4%) | 720 (2.2%) |
| 2 or 3 Rooms | 1,340 (2.8%) | 7,428 (23.0%) |
| 4 or 5 Rooms | 13,784 (28.8%) | 15,372 (47.5%) |
| 6 or 7 Rooms | 19,439 (40.6%) | 6,710 (20.7%) |
| 8 or more Rooms | 13,067 (27.3%) | 2,134 (6.6%) |
| Total | 47,827 (100.0%) | 32,364 (100.0%) |
Housing Structure by Heating Type in Harrison County
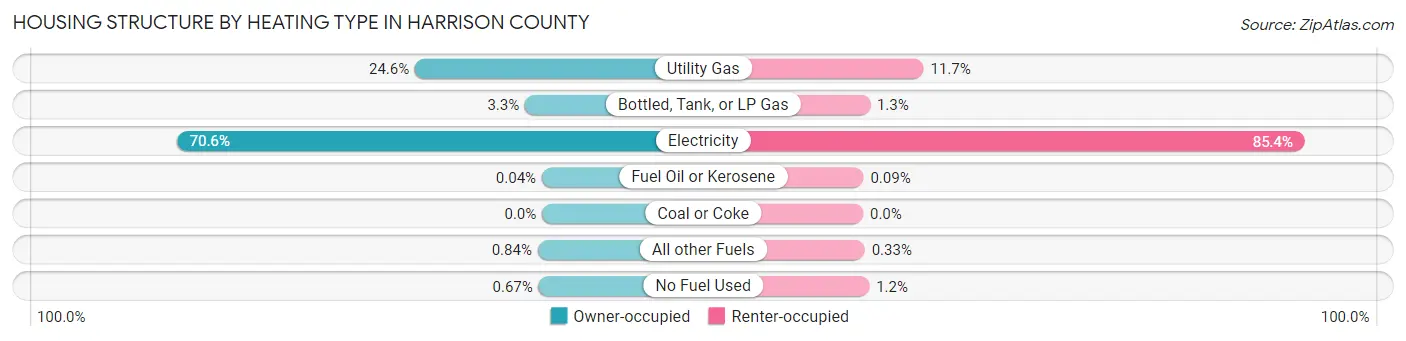
| Heating Type | Owner-occupied | Renter-occupied |
| Utility Gas | 11,743 (24.5%) | 3,784 (11.7%) |
| Bottled, Tank, or LP Gas | 1,572 (3.3%) | 429 (1.3%) |
| Electricity | 33,775 (70.6%) | 27,626 (85.4%) |
| Fuel Oil or Kerosene | 17 (0.0%) | 30 (0.1%) |
| Coal or Coke | 0 (0.0%) | 0 (0.0%) |
| All other Fuels | 400 (0.8%) | 107 (0.3%) |
| No Fuel Used | 320 (0.7%) | 388 (1.2%) |
| Total | 47,827 (100.0%) | 32,364 (100.0%) |
Household Vehicle Usage in Harrison County
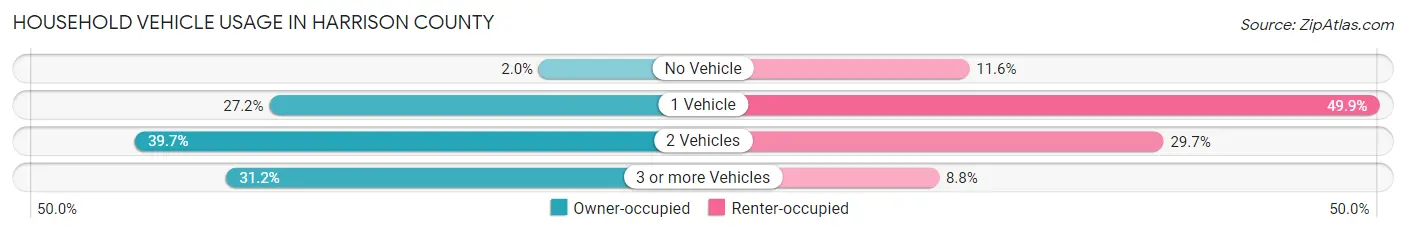
| Vehicles per Household | Owner-occupied | Renter-occupied |
| No Vehicle | 954 (2.0%) | 3,756 (11.6%) |
| 1 Vehicle | 12,987 (27.2%) | 16,139 (49.9%) |
| 2 Vehicles | 18,984 (39.7%) | 9,626 (29.7%) |
| 3 or more Vehicles | 14,902 (31.2%) | 2,843 (8.8%) |
| Total | 47,827 (100.0%) | 32,364 (100.0%) |
Real Estate & Mortgages in Harrison County
Real Estate and Mortgage Overview in Harrison County
| Characteristic | Without Mortgage | With Mortgage |
| Housing Units | 20,136 | 27,691 |
| Median Property Value | $163,700 | $196,100 |
| Median Household Income | $56,132 | $4,971 |
| Monthly Housing Costs | $434 | $1,327 |
| Real Estate Taxes | $943 | $3,395 |
Property Value by Mortgage Status in Harrison County
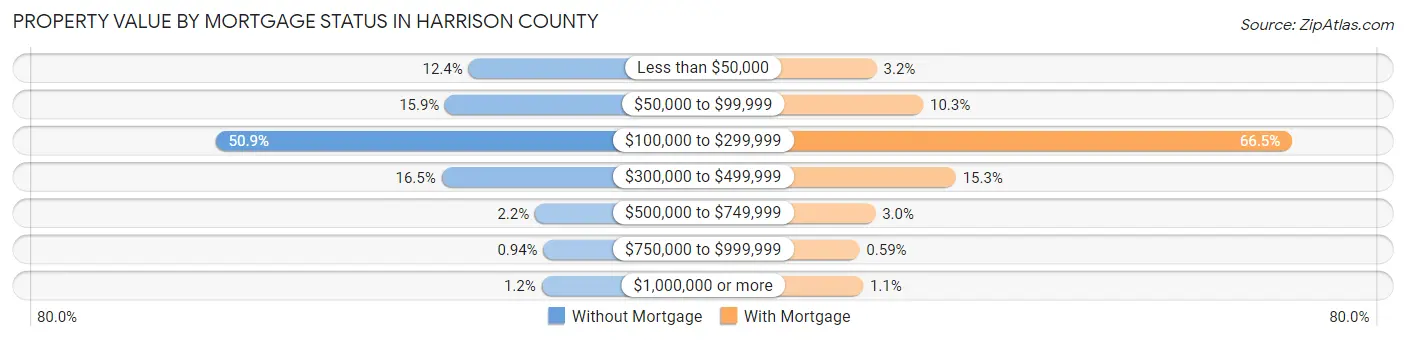
| Property Value | Without Mortgage | With Mortgage |
| Less than $50,000 | 2,486 (12.3%) | 889 (3.2%) |
| $50,000 to $99,999 | 3,203 (15.9%) | 2,849 (10.3%) |
| $100,000 to $299,999 | 10,245 (50.9%) | 18,421 (66.5%) |
| $300,000 to $499,999 | 3,316 (16.5%) | 4,226 (15.3%) |
| $500,000 to $749,999 | 448 (2.2%) | 831 (3.0%) |
| $750,000 to $999,999 | 190 (0.9%) | 162 (0.6%) |
| $1,000,000 or more | 248 (1.2%) | 313 (1.1%) |
| Total | 20,136 (100.0%) | 27,691 (100.0%) |
Household Income by Mortgage Status in Harrison County
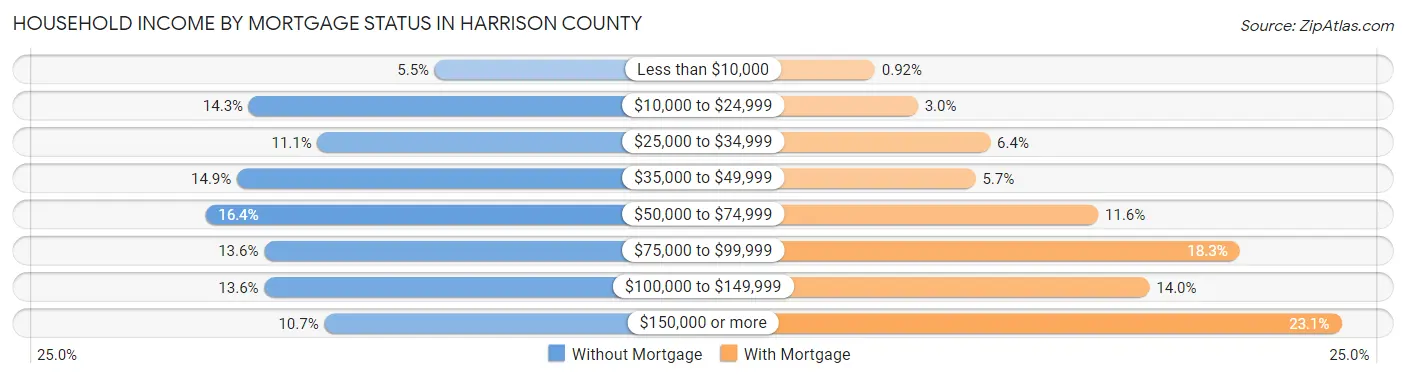
| Household Income | Without Mortgage | With Mortgage |
| Less than $10,000 | 1,100 (5.5%) | 254 (0.9%) |
| $10,000 to $24,999 | 2,883 (14.3%) | 821 (3.0%) |
| $25,000 to $34,999 | 2,225 (11.1%) | 1,776 (6.4%) |
| $35,000 to $49,999 | 2,996 (14.9%) | 1,581 (5.7%) |
| $50,000 to $74,999 | 3,301 (16.4%) | 3,198 (11.6%) |
| $75,000 to $99,999 | 2,737 (13.6%) | 5,065 (18.3%) |
| $100,000 to $149,999 | 2,735 (13.6%) | 3,874 (14.0%) |
| $150,000 or more | 2,159 (10.7%) | 6,405 (23.1%) |
| Total | 20,136 (100.0%) | 27,691 (100.0%) |
Property Value to Household Income Ratio in Harrison County
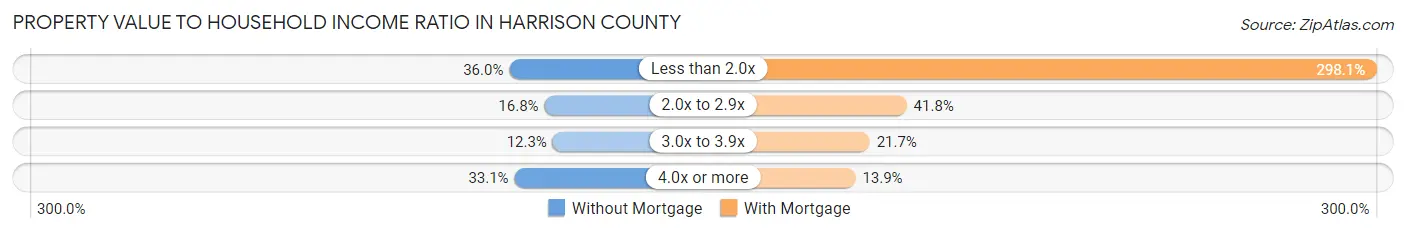
| Value-to-Income Ratio | Without Mortgage | With Mortgage |
| Less than 2.0x | 7,238 (35.9%) | 82,535 (298.1%) |
| 2.0x to 2.9x | 3,383 (16.8%) | 11,574 (41.8%) |
| 3.0x to 3.9x | 2,473 (12.3%) | 6,000 (21.7%) |
| 4.0x or more | 6,667 (33.1%) | 3,849 (13.9%) |
| Total | 20,136 (100.0%) | 27,691 (100.0%) |
Real Estate Taxes by Mortgage Status in Harrison County
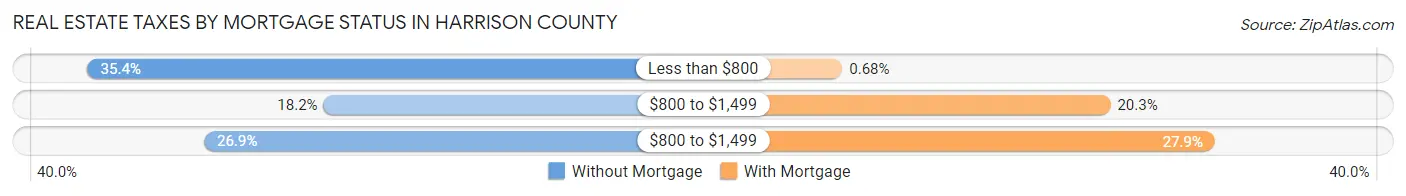
| Property Taxes | Without Mortgage | With Mortgage |
| Less than $800 | 7,126 (35.4%) | 188 (0.7%) |
| $800 to $1,499 | 3,659 (18.2%) | 5,614 (20.3%) |
| $800 to $1,499 | 5,415 (26.9%) | 7,723 (27.9%) |
| Total | 20,136 (100.0%) | 27,691 (100.0%) |
Health & Disability in Harrison County
Health Insurance Coverage by Age in Harrison County
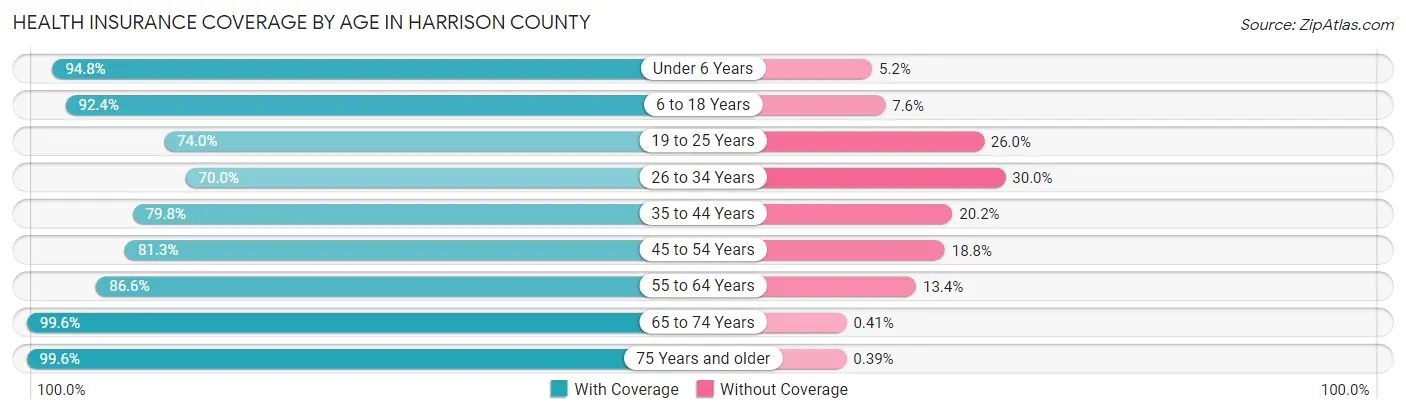
| Age Bracket | With Coverage | Without Coverage |
| Under 6 Years | 15,143 (94.8%) | 831 (5.2%) |
| 6 to 18 Years | 33,124 (92.4%) | 2,741 (7.6%) |
| 19 to 25 Years | 12,940 (74.0%) | 4,550 (26.0%) |
| 26 to 34 Years | 16,179 (70.0%) | 6,947 (30.0%) |
| 35 to 44 Years | 20,008 (79.8%) | 5,051 (20.2%) |
| 45 to 54 Years | 19,904 (81.2%) | 4,593 (18.8%) |
| 55 to 64 Years | 23,463 (86.6%) | 3,623 (13.4%) |
| 65 to 74 Years | 19,950 (99.6%) | 83 (0.4%) |
| 75 Years and older | 12,193 (99.6%) | 48 (0.4%) |
| Total | 172,904 (85.9%) | 28,467 (14.1%) |
Health Insurance Coverage by Citizenship Status in Harrison County
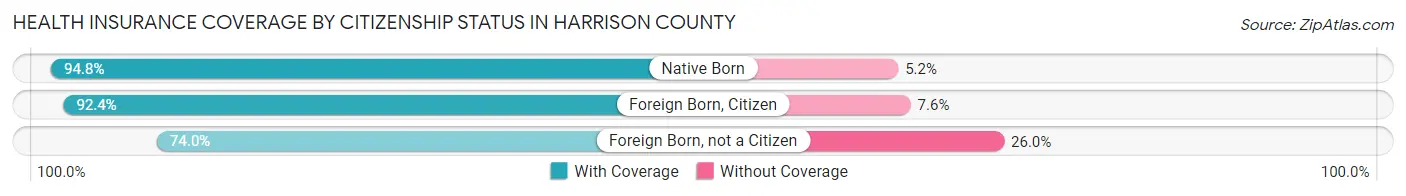
| Citizenship Status | With Coverage | Without Coverage |
| Native Born | 15,143 (94.8%) | 831 (5.2%) |
| Foreign Born, Citizen | 33,124 (92.4%) | 2,741 (7.6%) |
| Foreign Born, not a Citizen | 12,940 (74.0%) | 4,550 (26.0%) |
Health Insurance Coverage by Household Income in Harrison County
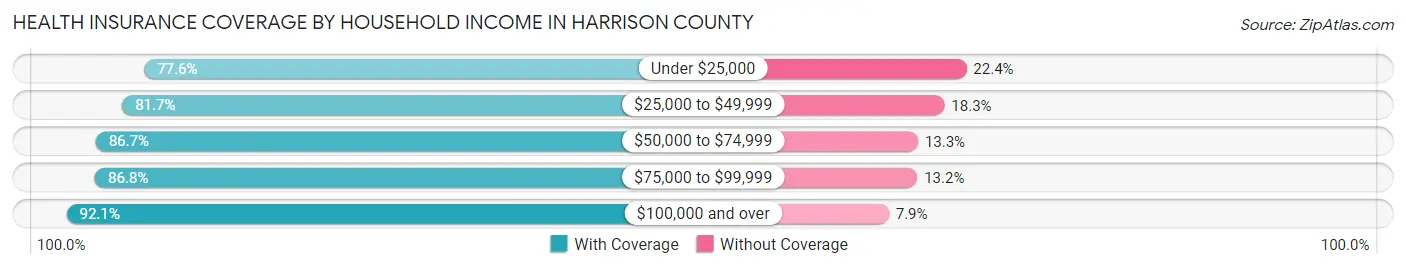
| Household Income | With Coverage | Without Coverage |
| Under $25,000 | 25,397 (77.6%) | 7,336 (22.4%) |
| $25,000 to $49,999 | 34,862 (81.7%) | 7,805 (18.3%) |
| $50,000 to $74,999 | 31,639 (86.7%) | 4,865 (13.3%) |
| $75,000 to $99,999 | 22,815 (86.8%) | 3,470 (13.2%) |
| $100,000 and over | 58,056 (92.1%) | 4,959 (7.9%) |
Public vs Private Health Insurance Coverage by Age in Harrison County
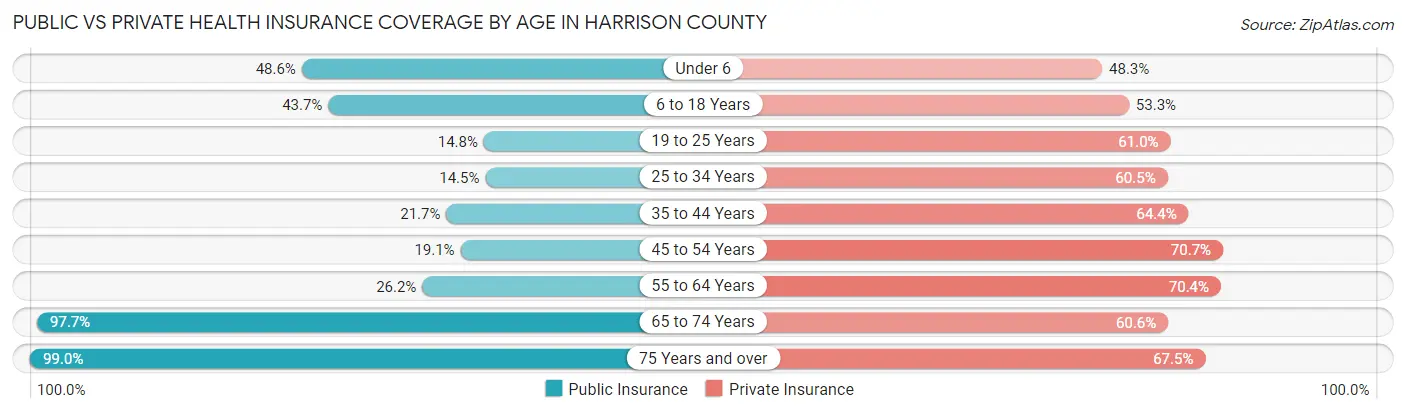
| Age Bracket | Public Insurance | Private Insurance |
| Under 6 | 7,758 (48.6%) | 7,718 (48.3%) |
| 6 to 18 Years | 15,655 (43.6%) | 19,112 (53.3%) |
| 19 to 25 Years | 2,584 (14.8%) | 10,667 (61.0%) |
| 25 to 34 Years | 3,351 (14.5%) | 13,979 (60.5%) |
| 35 to 44 Years | 5,444 (21.7%) | 16,129 (64.4%) |
| 45 to 54 Years | 4,679 (19.1%) | 17,326 (70.7%) |
| 55 to 64 Years | 7,097 (26.2%) | 19,055 (70.4%) |
| 65 to 74 Years | 19,575 (97.7%) | 12,132 (60.6%) |
| 75 Years and over | 12,117 (99.0%) | 8,257 (67.4%) |
| Total | 78,260 (38.9%) | 124,375 (61.8%) |
Disability Status by Sex by Age in Harrison County
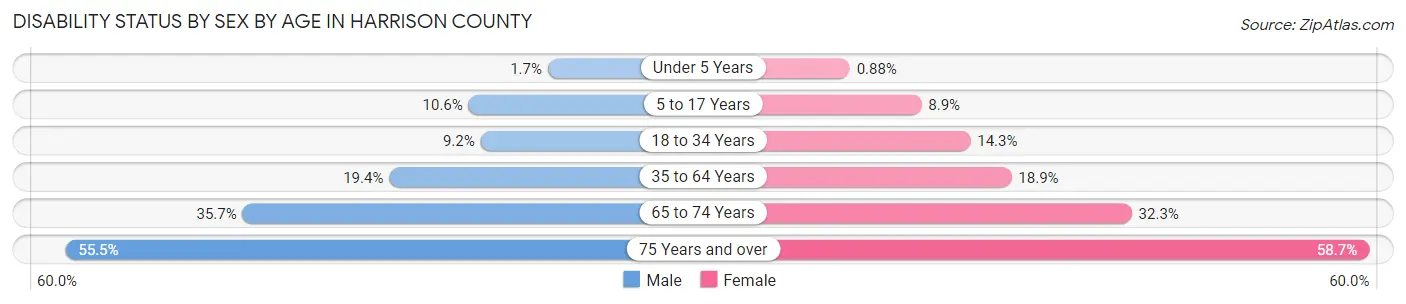
| Age Bracket | Male | Female |
| Under 5 Years | 116 (1.7%) | 56 (0.9%) |
| 5 to 17 Years | 1,970 (10.5%) | 1,573 (8.9%) |
| 18 to 34 Years | 1,879 (9.2%) | 3,239 (14.3%) |
| 35 to 64 Years | 7,078 (19.4%) | 7,583 (18.9%) |
| 65 to 74 Years | 3,344 (35.7%) | 3,446 (32.3%) |
| 75 Years and over | 2,961 (55.5%) | 4,052 (58.7%) |
Disability Class by Sex by Age in Harrison County
Disability Class: Hearing Difficulty
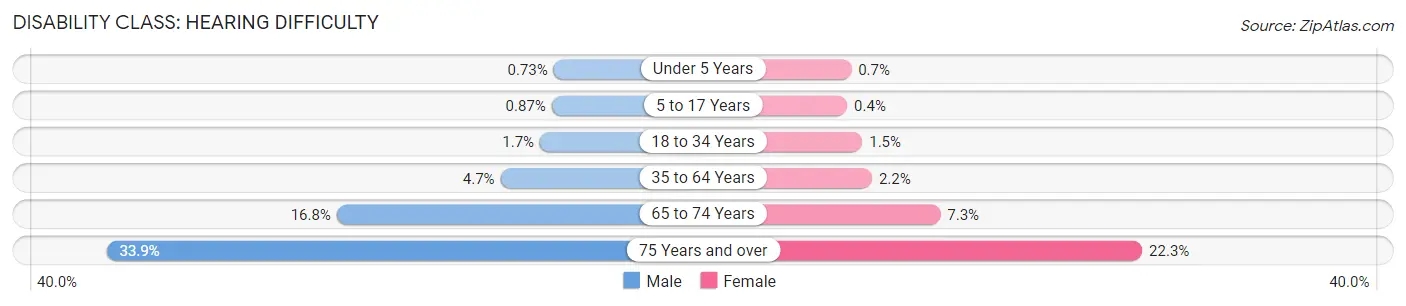
| Age Bracket | Male | Female |
| Under 5 Years | 49 (0.7%) | 44 (0.7%) |
| 5 to 17 Years | 162 (0.9%) | 71 (0.4%) |
| 18 to 34 Years | 355 (1.7%) | 345 (1.5%) |
| 35 to 64 Years | 1,706 (4.7%) | 899 (2.2%) |
| 65 to 74 Years | 1,575 (16.8%) | 781 (7.3%) |
| 75 Years and over | 1,811 (33.9%) | 1,539 (22.3%) |
Disability Class: Vision Difficulty
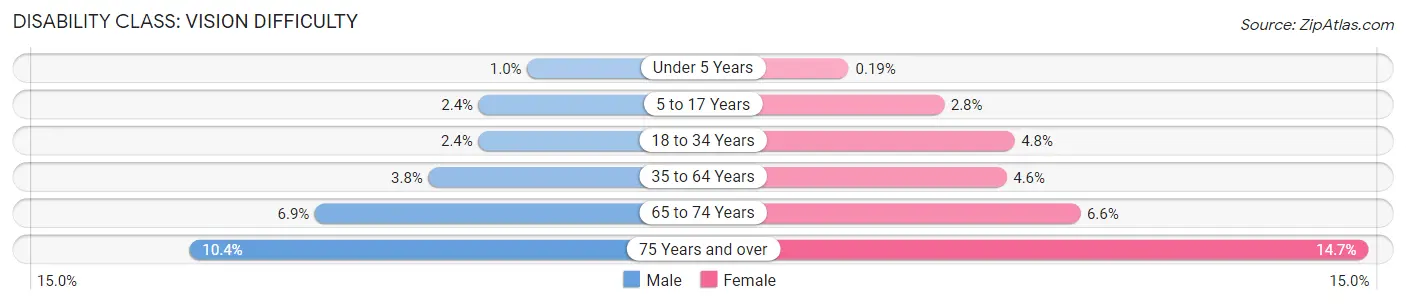
| Age Bracket | Male | Female |
| Under 5 Years | 67 (1.0%) | 12 (0.2%) |
| 5 to 17 Years | 438 (2.4%) | 504 (2.8%) |
| 18 to 34 Years | 482 (2.4%) | 1,085 (4.8%) |
| 35 to 64 Years | 1,367 (3.7%) | 1,840 (4.6%) |
| 65 to 74 Years | 647 (6.9%) | 708 (6.6%) |
| 75 Years and over | 556 (10.4%) | 1,012 (14.7%) |
Disability Class: Cognitive Difficulty
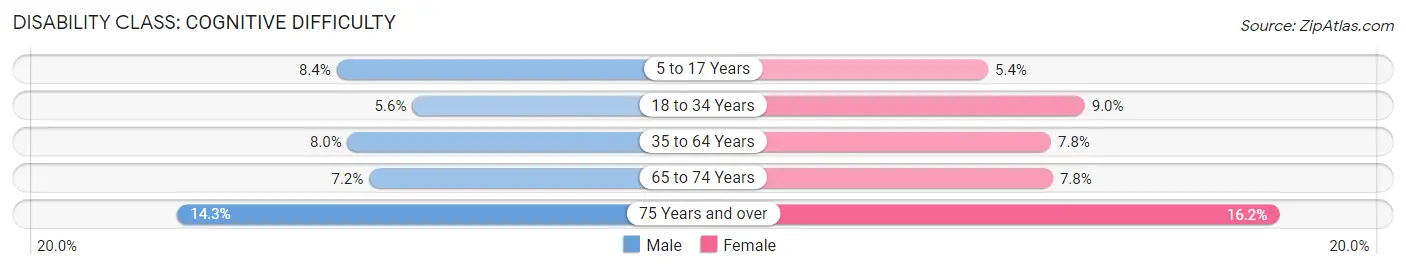
| Age Bracket | Male | Female |
| 5 to 17 Years | 1,571 (8.4%) | 964 (5.4%) |
| 18 to 34 Years | 1,143 (5.6%) | 2,042 (9.0%) |
| 35 to 64 Years | 2,923 (8.0%) | 3,121 (7.8%) |
| 65 to 74 Years | 675 (7.2%) | 837 (7.8%) |
| 75 Years and over | 765 (14.3%) | 1,120 (16.2%) |
Disability Class: Ambulatory Difficulty
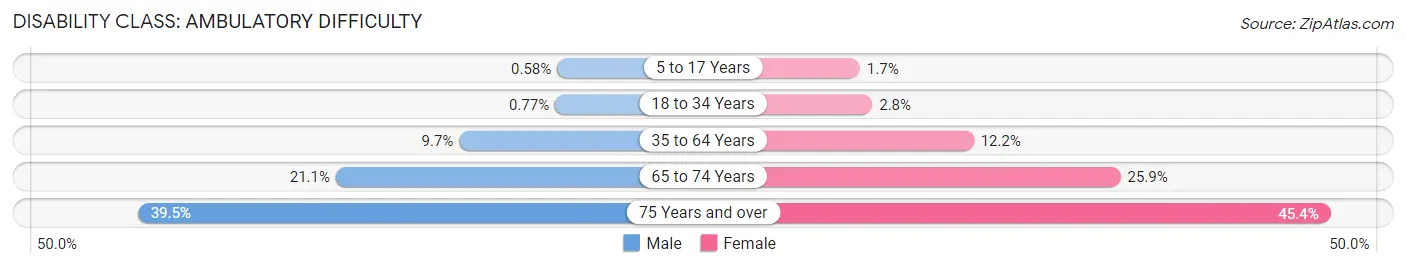
| Age Bracket | Male | Female |
| 5 to 17 Years | 109 (0.6%) | 298 (1.7%) |
| 18 to 34 Years | 156 (0.8%) | 640 (2.8%) |
| 35 to 64 Years | 3,529 (9.7%) | 4,914 (12.2%) |
| 65 to 74 Years | 1,976 (21.1%) | 2,762 (25.9%) |
| 75 Years and over | 2,109 (39.5%) | 3,130 (45.4%) |
Disability Class: Self-Care Difficulty
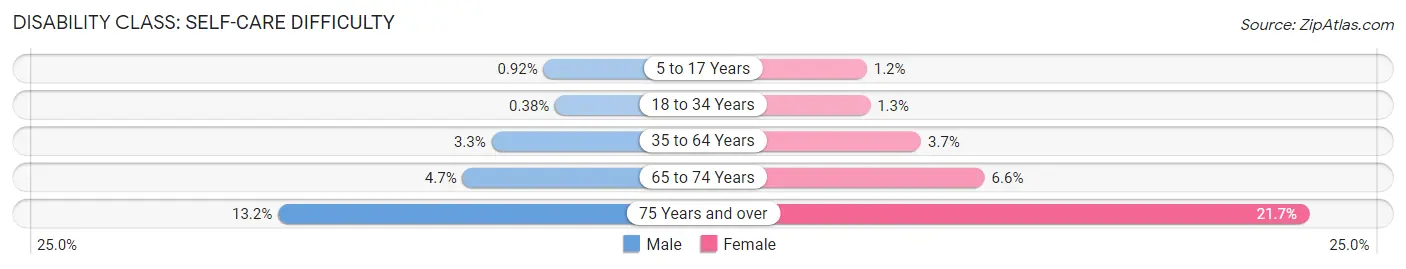
| Age Bracket | Male | Female |
| 5 to 17 Years | 172 (0.9%) | 205 (1.2%) |
| 18 to 34 Years | 77 (0.4%) | 298 (1.3%) |
| 35 to 64 Years | 1,215 (3.3%) | 1,479 (3.7%) |
| 65 to 74 Years | 438 (4.7%) | 708 (6.6%) |
| 75 Years and over | 707 (13.2%) | 1,496 (21.7%) |
Technology Access in Harrison County
Computing Device Access in Harrison County
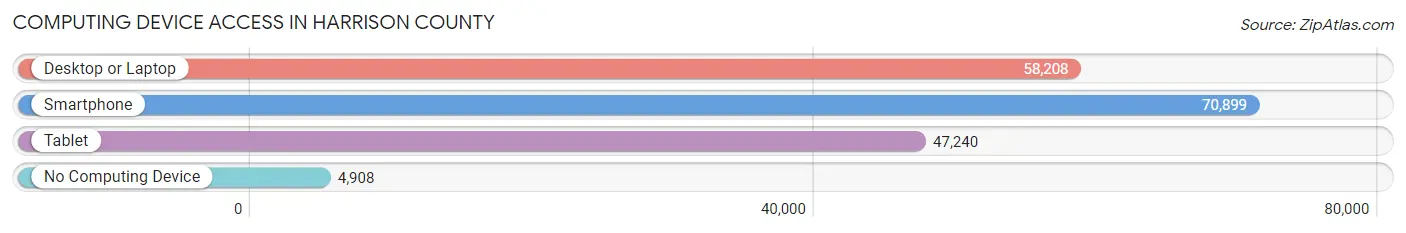
| Device Type | # Households | % Households |
| Desktop or Laptop | 58,208 | 72.6% |
| Smartphone | 70,899 | 88.4% |
| Tablet | 47,240 | 58.9% |
| No Computing Device | 4,908 | 6.1% |
| Total | 80,191 | 100.0% |
Internet Access in Harrison County
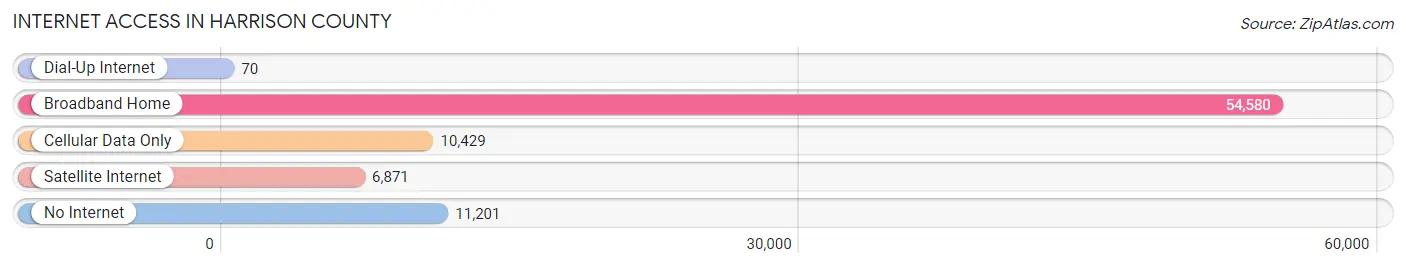
| Internet Type | # Households | % Households |
| Dial-Up Internet | 70 | 0.1% |
| Broadband Home | 54,580 | 68.1% |
| Cellular Data Only | 10,429 | 13.0% |
| Satellite Internet | 6,871 | 8.6% |
| No Internet | 11,201 | 14.0% |
| Total | 80,191 | 100.0% |
Harrison County Summary
Harrison County, Mississippi is located in the southern part of the state, along the Gulf Coast. It is bordered by Jackson County to the east, Hancock County to the west, and Stone County to the north. The county seat is Biloxi, and the county is part of the Gulfport-Biloxi-Pascagoula Metropolitan Statistical Area.
History
Harrison County was established in 1841, and was named for U.S. President William Henry Harrison. The county was originally part of Hancock County, and was created in response to the growing population in the area. The county was divided into two parts, with the eastern part becoming Harrison County and the western part becoming Hancock County.
The county was home to a number of Native American tribes, including the Choctaw, Chickasaw, and Biloxi. The first European settlers arrived in the area in the early 1700s, and the county was officially established in 1841.
The county was heavily impacted by the Civil War, with many battles taking place in the area. After the war, the county experienced a period of economic growth, with the development of the railroad and the timber industry.
Geography
Harrison County is located in the southern part of Mississippi, along the Gulf Coast. It is bordered by Jackson County to the east, Hancock County to the west, and Stone County to the north. The county has a total area of 845 square miles, of which 837 square miles is land and 8 square miles is water.
The county is mostly flat, with some rolling hills in the northern part of the county. The county is drained by the Pearl River, which flows through the county from north to south. The county is also home to several lakes, including Lake Mars, Lake Bogue Homa, and Lake Pascagoula.
Economy
Harrison County has a diverse economy, with a mix of manufacturing, tourism, and service industries. The county is home to several large employers, including Ingalls Shipbuilding, Keesler Air Force Base, and the Gulfport-Biloxi International Airport.
The county is also home to a number of tourist attractions, including the Gulf Islands National Seashore, the Biloxi Lighthouse, and the Biloxi Bay Bridge. The county is also home to several casinos, including the Beau Rivage Resort and Casino and the Hard Rock Hotel and Casino.
Demographics
As of the 2010 census, Harrison County had a population of 187,105. The population was 53.2% White, 41.2% African American, 0.7% Native American, 1.3% Asian, 0.1% Pacific Islander, 1.7% from other races, and 2.1% from two or more races. Hispanic or Latino of any race were 4.2% of the population.
The median income for a household in the county was $41,945, and the median income for a family was $50,945. The per capita income for the county was $22,845. About 17.2% of the population was below the poverty line.
Common Questions
What is Per Capita Income in Harrison County?
Per Capita income in Harrison County is $30,120.
What is the Median Family Income in Harrison County?
Median Family Income in Harrison County is $68,818.
What is the Median Household income in Harrison County?
Median Household Income in Harrison County is $55,211.
What is Income or Wage Gap in Harrison County?
Income or Wage Gap in Harrison County is 25.5%.
Women in Harrison County earn 74.5 cents for every dollar earned by a man.
What is Family Income Deficit in Harrison County?
Family Income Deficit in Harrison County is $11,334.
Families that are below poverty line in Harrison County earn $11,334 less on average than the poverty threshold level.
What is Inequality or Gini Index in Harrison County?
Inequality or Gini Index in Harrison County is 0.46.
What is the Total Population of Harrison County?
Total Population of Harrison County is 208,748.
What is the Total Male Population of Harrison County?
Total Male Population of Harrison County is 102,341.
What is the Total Female Population of Harrison County?
Total Female Population of Harrison County is 106,407.
What is the Ratio of Males per 100 Females in Harrison County?
There are 96.18 Males per 100 Females in Harrison County.
What is the Ratio of Females per 100 Males in Harrison County?
There are 103.97 Females per 100 Males in Harrison County.
What is the Median Population Age in Harrison County?
Median Population Age in Harrison County is 37.6 Years.
What is the Average Family Size in Harrison County
Average Family Size in Harrison County is 3.1 People.
What is the Average Household Size in Harrison County
Average Household Size in Harrison County is 2.5 People.
How Large is the Labor Force in Harrison County?
There are 100,965 People in the Labor Forcein in Harrison County.
What is the Percentage of People in the Labor Force in Harrison County?
61.3% of People are in the Labor Force in Harrison County.
What is the Unemployment Rate in Harrison County?
Unemployment Rate in Harrison County is 8.4%.