Forrest County, MS Map & Demographics
Forrest County Map
Forrest County Overview
$28,197
PER CAPITA INCOME
$62,016
AVG FAMILY INCOME
$49,340
AVG HOUSEHOLD INCOME
31.1%
WAGE / INCOME GAP [ % ]
68.9¢/ $1
WAGE / INCOME GAP [ $ ]
$12,371
FAMILY INCOME DEFICIT
0.50
INEQUALITY / GINI INDEX
77,917
TOTAL POPULATION
36,624
MALE POPULATION
41,293
FEMALE POPULATION
88.69
MALES / 100 FEMALES
112.75
FEMALES / 100 MALES
31.9
MEDIAN AGE
3.2
AVG FAMILY SIZE
2.5
AVG HOUSEHOLD SIZE
39,070
LABOR FORCE [ PEOPLE ]
62.7%
PERCENT IN LABOR FORCE
7.4%
UNEMPLOYMENT RATE
Income in Forrest County
Income Overview in Forrest County
Per Capita Income in Forrest County is $28,197, while median incomes of families and households are $62,016 and $49,340 respectively.
| Characteristic | Number | Measure |
| Per Capita Income | 77,917 | $28,197 |
| Median Family Income | 17,779 | $62,016 |
| Mean Family Income | 17,779 | $87,140 |
| Median Household Income | 29,351 | $49,340 |
| Mean Household Income | 29,351 | $71,069 |
| Income Deficit | 17,779 | $12,371 |
| Wage / Income Gap (%) | 77,917 | 31.07% |
| Wage / Income Gap ($) | 77,917 | 68.93¢ per $1 |
| Gini / Inequality Index | 77,917 | 0.50 |
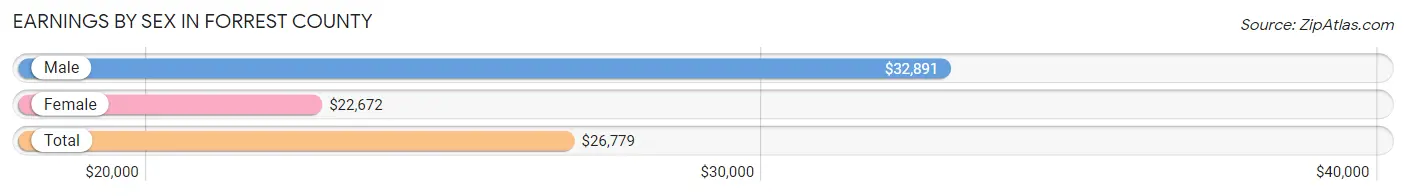
Earnings by Sex in Forrest County
Average Earnings in Forrest County are $26,779, $32,891 for men and $22,672 for women, a difference of 31.1%.
| Sex | Number | Average Earnings |
| Male | 20,153 (49.5%) | $32,891 |
| Female | 20,531 (50.5%) | $22,672 |
| Total | 40,684 (100.0%) | $26,779 |
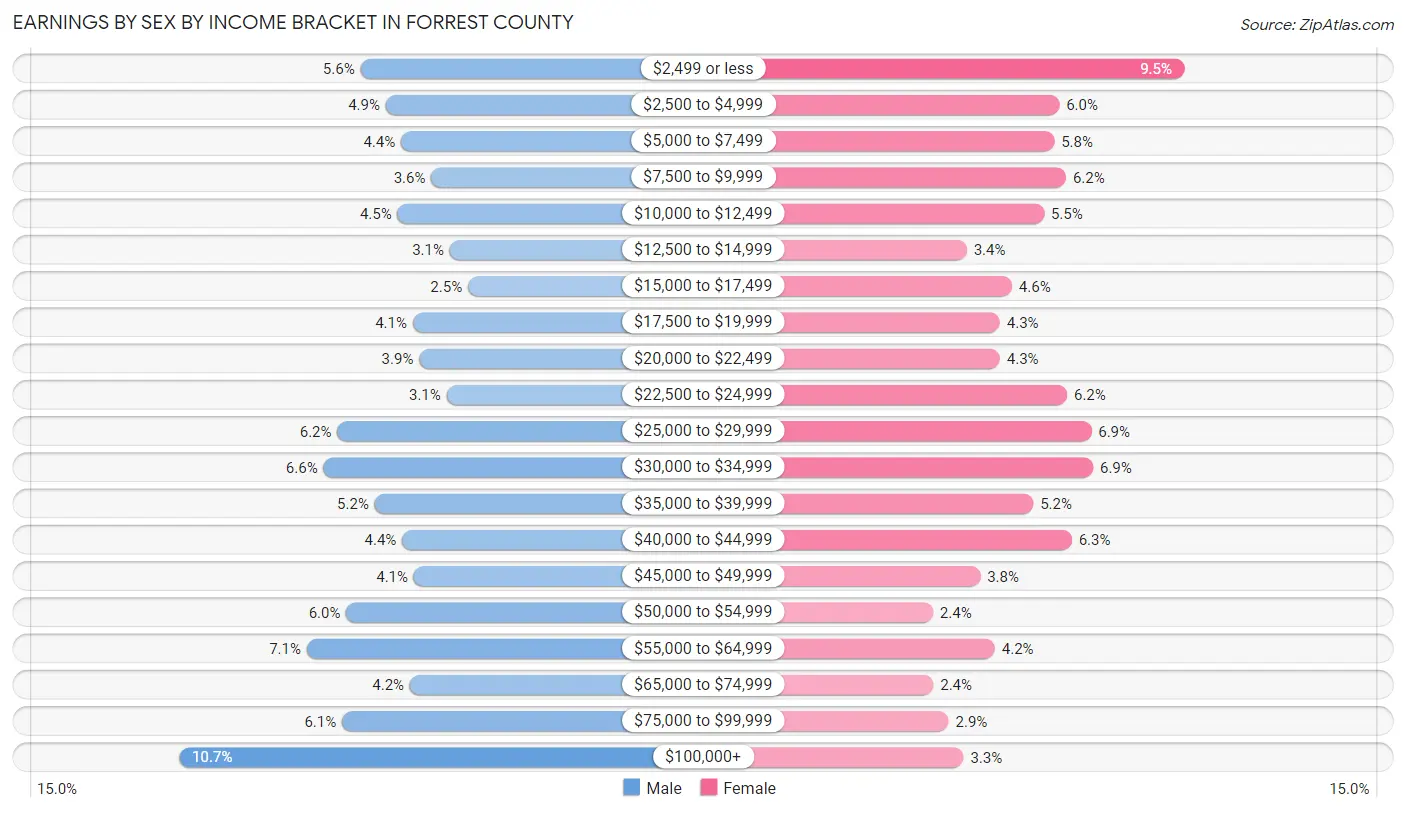
Earnings by Sex by Income Bracket in Forrest County
The most common earnings brackets in Forrest County are $100,000+ for men (2,148 | 10.7%) and $2,499 or less for women (1,945 | 9.5%).
| Income | Male | Female |
| $2,499 or less | 1,121 (5.6%) | 1,945 (9.5%) |
| $2,500 to $4,999 | 978 (4.9%) | 1,225 (6.0%) |
| $5,000 to $7,499 | 890 (4.4%) | 1,196 (5.8%) |
| $7,500 to $9,999 | 720 (3.6%) | 1,264 (6.2%) |
| $10,000 to $12,499 | 910 (4.5%) | 1,138 (5.5%) |
| $12,500 to $14,999 | 614 (3.0%) | 692 (3.4%) |
| $15,000 to $17,499 | 512 (2.5%) | 952 (4.6%) |
| $17,500 to $19,999 | 824 (4.1%) | 883 (4.3%) |
| $20,000 to $22,499 | 787 (3.9%) | 883 (4.3%) |
| $22,500 to $24,999 | 632 (3.1%) | 1,270 (6.2%) |
| $25,000 to $29,999 | 1,251 (6.2%) | 1,410 (6.9%) |
| $30,000 to $34,999 | 1,331 (6.6%) | 1,421 (6.9%) |
| $35,000 to $39,999 | 1,040 (5.2%) | 1,075 (5.2%) |
| $40,000 to $44,999 | 884 (4.4%) | 1,297 (6.3%) |
| $45,000 to $49,999 | 818 (4.1%) | 770 (3.7%) |
| $50,000 to $54,999 | 1,202 (6.0%) | 496 (2.4%) |
| $55,000 to $64,999 | 1,425 (7.1%) | 855 (4.2%) |
| $65,000 to $74,999 | 841 (4.2%) | 499 (2.4%) |
| $75,000 to $99,999 | 1,225 (6.1%) | 587 (2.9%) |
| $100,000+ | 2,148 (10.7%) | 673 (3.3%) |
| Total | 20,153 (100.0%) | 20,531 (100.0%) |
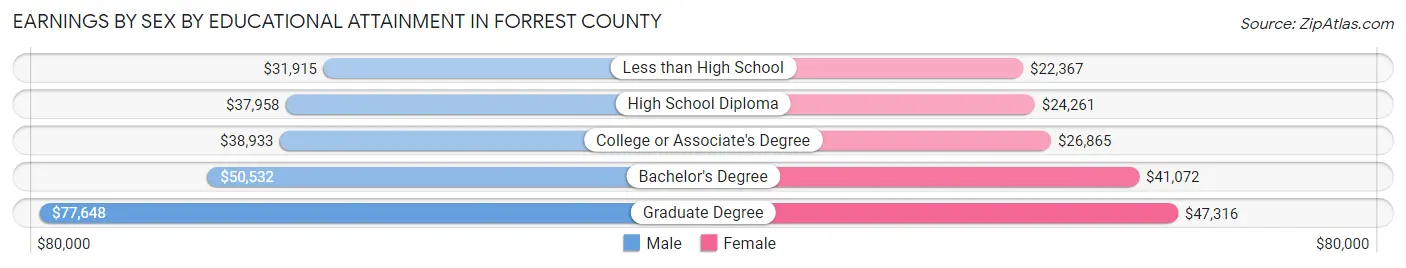
Earnings by Sex by Educational Attainment in Forrest County
Average earnings in Forrest County are $43,187 for men and $30,493 for women, a difference of 29.4%. Men with an educational attainment of graduate degree enjoy the highest average annual earnings of $77,648, while those with less than high school education earn the least with $31,915. Women with an educational attainment of graduate degree earn the most with the average annual earnings of $47,316, while those with less than high school education have the smallest earnings of $22,367.
| Educational Attainment | Male Income | Female Income |
| Less than High School | $31,915 | $22,367 |
| High School Diploma | $37,958 | $24,261 |
| College or Associate's Degree | $38,933 | $26,865 |
| Bachelor's Degree | $50,532 | $41,072 |
| Graduate Degree | $77,648 | $47,316 |
| Total | $43,187 | $30,493 |
Family Income in Forrest County
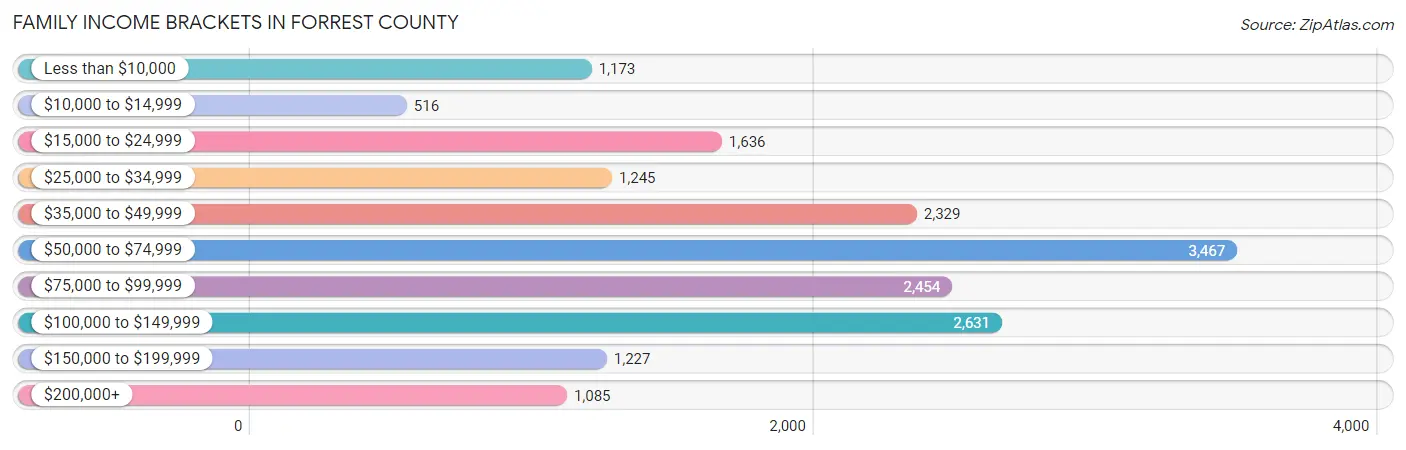
Family Income Brackets in Forrest County
According to the Forrest County family income data, there are 3,467 families falling into the $50,000 to $74,999 income range, which is the most common income bracket and makes up 19.5% of all families. Conversely, the $10,000 to $14,999 income bracket is the least frequent group with only 516 families (2.9%) belonging to this category.
| Income Bracket | # Families | % Families |
| Less than $10,000 | 1,173 | 6.6% |
| $10,000 to $14,999 | 516 | 2.9% |
| $15,000 to $24,999 | 1,636 | 9.2% |
| $25,000 to $34,999 | 1,245 | 7.0% |
| $35,000 to $49,999 | 2,329 | 13.1% |
| $50,000 to $74,999 | 3,467 | 19.5% |
| $75,000 to $99,999 | 2,454 | 13.8% |
| $100,000 to $149,999 | 2,631 | 14.8% |
| $150,000 to $199,999 | 1,227 | 6.9% |
| $200,000+ | 1,085 | 6.1% |
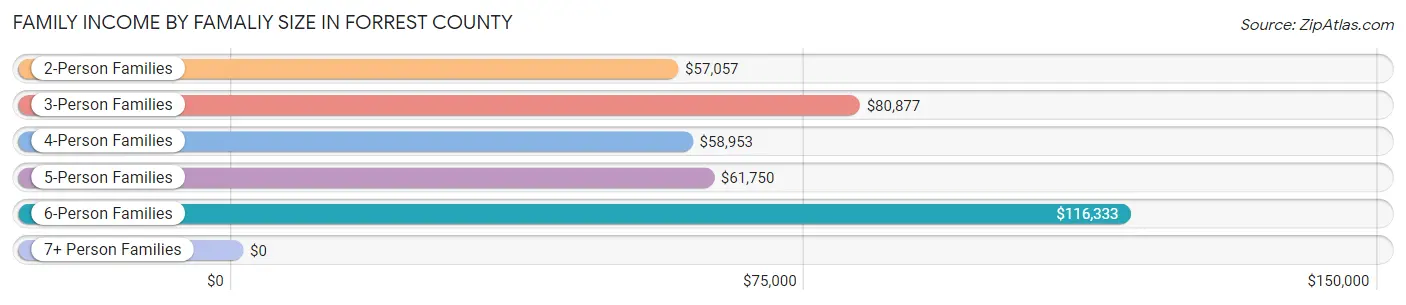
Family Income by Famaliy Size in Forrest County
6-person families (378 | 2.1%) account for the highest median family income in Forrest County with $116,333 per family, while 2-person families (8,198 | 46.1%) have the highest median income of $28,528 per family member.
| Income Bracket | # Families | Median Income |
| 2-Person Families | 8,198 (46.1%) | $57,057 |
| 3-Person Families | 3,584 (20.2%) | $80,877 |
| 4-Person Families | 3,817 (21.5%) | $58,953 |
| 5-Person Families | 1,721 (9.7%) | $61,750 |
| 6-Person Families | 378 (2.1%) | $116,333 |
| 7+ Person Families | 81 (0.5%) | $0 |
| Total | 17,779 (100.0%) | $62,016 |
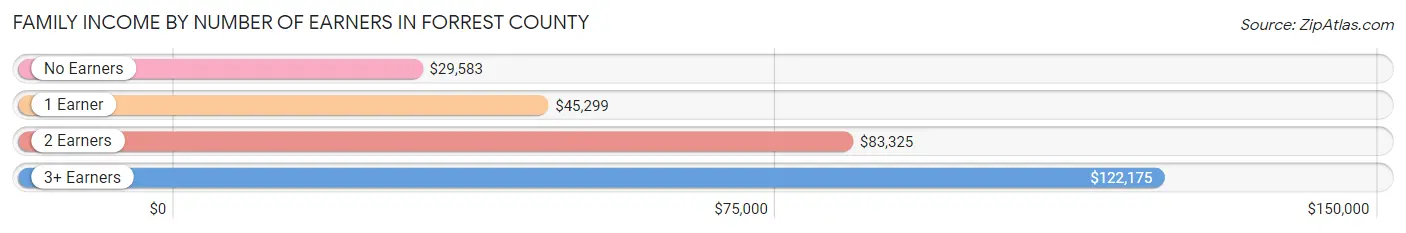
Family Income by Number of Earners in Forrest County
The median family income in Forrest County is $62,016, with families comprising 3+ earners (1,697) having the highest median family income of $122,175, while families with no earners (3,053) have the lowest median family income of $29,583, accounting for 9.5% and 17.2% of families, respectively.
| Number of Earners | # Families | Median Income |
| No Earners | 3,053 (17.2%) | $29,583 |
| 1 Earner | 6,481 (36.4%) | $45,299 |
| 2 Earners | 6,548 (36.8%) | $83,325 |
| 3+ Earners | 1,697 (9.5%) | $122,175 |
| Total | 17,779 (100.0%) | $62,016 |
Household Income in Forrest County
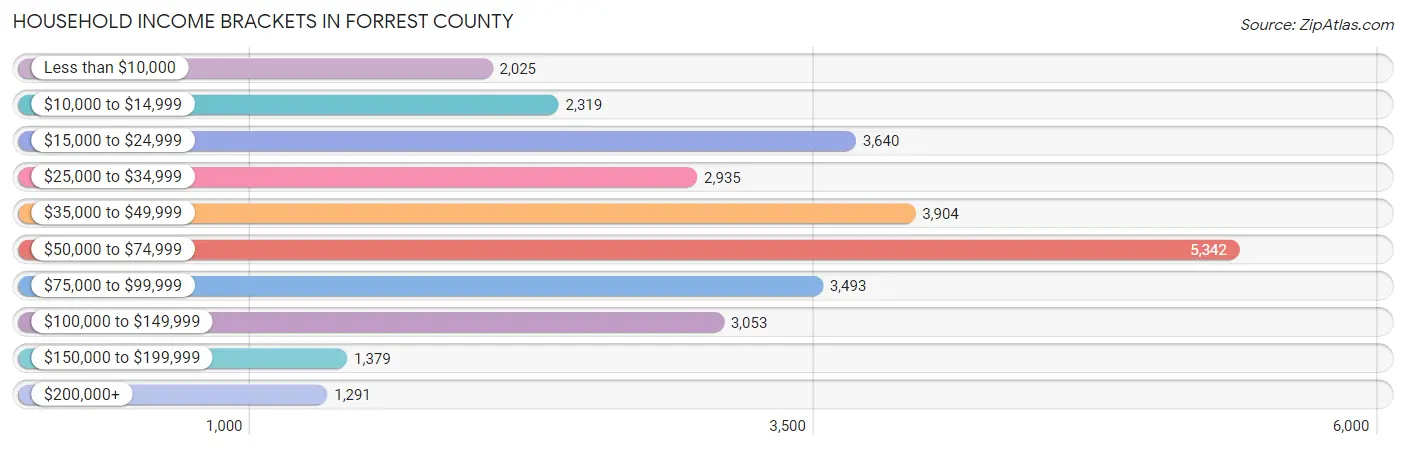
Household Income Brackets in Forrest County
With 5,342 households falling in the category, the $50,000 to $74,999 income range is the most frequent in Forrest County, accounting for 18.2% of all households. In contrast, only 1,291 households (4.4%) fall into the $200,000+ income bracket, making it the least populous group.
| Income Bracket | # Households | % Households |
| Less than $10,000 | 2,025 | 6.9% |
| $10,000 to $14,999 | 2,319 | 7.9% |
| $15,000 to $24,999 | 3,640 | 12.4% |
| $25,000 to $34,999 | 2,935 | 10.0% |
| $35,000 to $49,999 | 3,904 | 13.3% |
| $50,000 to $74,999 | 5,342 | 18.2% |
| $75,000 to $99,999 | 3,493 | 11.9% |
| $100,000 to $149,999 | 3,053 | 10.4% |
| $150,000 to $199,999 | 1,379 | 4.7% |
| $200,000+ | 1,291 | 4.4% |
Household Income by Householder Age in Forrest County
The median household income in Forrest County is $49,340, with the highest median household income of $56,466 found in the 25 to 44 years age bracket for the primary householder. A total of 10,408 households (35.5%) fall into this category. Meanwhile, the 15 to 24 years age bracket for the primary householder has the lowest median household income of $24,676, with 3,058 households (10.4%) in this group.
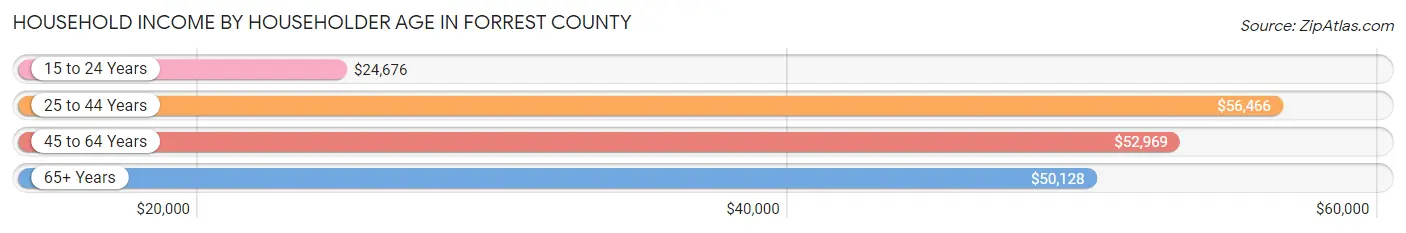
| Income Bracket | # Households | Median Income |
| 15 to 24 Years | 3,058 (10.4%) | $24,676 |
| 25 to 44 Years | 10,408 (35.5%) | $56,466 |
| 45 to 64 Years | 9,290 (31.7%) | $52,969 |
| 65+ Years | 6,595 (22.5%) | $50,128 |
| Total | 29,351 (100.0%) | $49,340 |
Poverty in Forrest County
Income Below Poverty by Sex and Age in Forrest County
With 18.1% poverty level for males and 27.0% for females among the residents of Forrest County, 16 and 17 year old males and 5 year old females are the most vulnerable to poverty, with 366 males (34.9%) and 299 females (55.8%) in their respective age groups living below the poverty level.
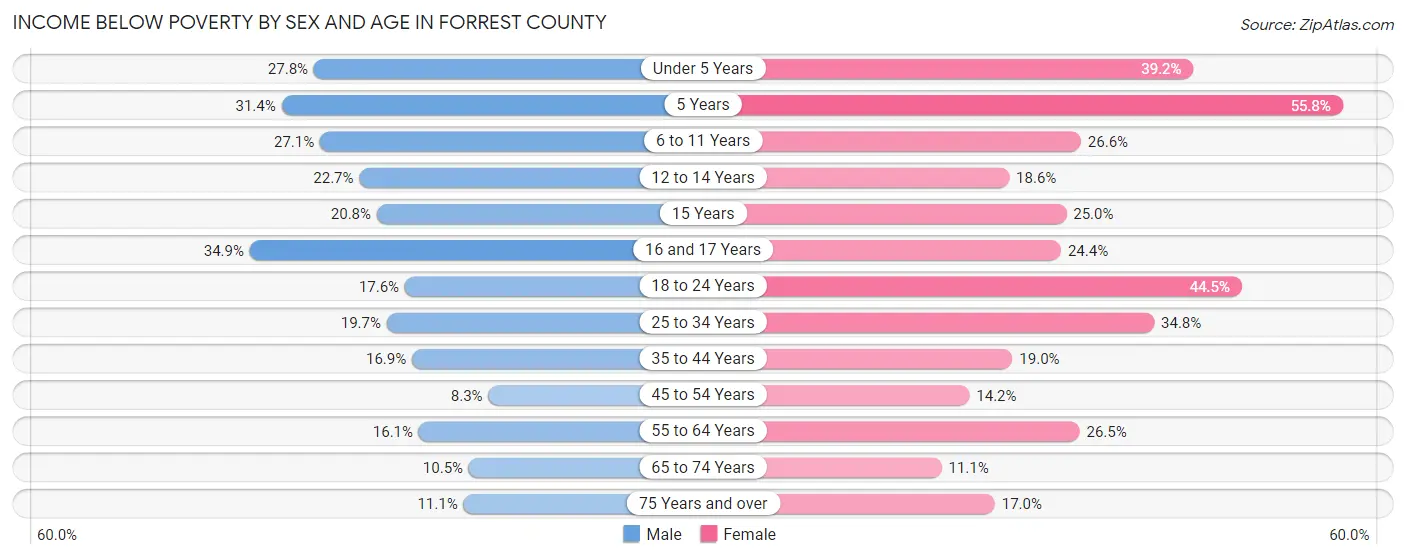
| Age Bracket | Male | Female |
| Under 5 Years | 683 (27.8%) | 924 (39.2%) |
| 5 Years | 91 (31.4%) | 299 (55.8%) |
| 6 to 11 Years | 766 (27.1%) | 669 (26.6%) |
| 12 to 14 Years | 376 (22.7%) | 310 (18.6%) |
| 15 Years | 86 (20.8%) | 133 (25.0%) |
| 16 and 17 Years | 366 (34.9%) | 198 (24.4%) |
| 18 to 24 Years | 769 (17.6%) | 2,570 (44.5%) |
| 25 to 34 Years | 1,029 (19.7%) | 1,974 (34.8%) |
| 35 to 44 Years | 745 (16.9%) | 886 (19.0%) |
| 45 to 54 Years | 324 (8.3%) | 591 (14.2%) |
| 55 to 64 Years | 622 (16.1%) | 1,169 (26.5%) |
| 65 to 74 Years | 282 (10.5%) | 354 (11.1%) |
| 75 Years and over | 195 (11.1%) | 457 (17.0%) |
| Total | 6,334 (18.1%) | 10,534 (27.0%) |
Income Above Poverty by Sex and Age in Forrest County
According to the poverty statistics in Forrest County, males aged 45 to 54 years and females aged 65 to 74 years are the age groups that are most secure financially, with 91.7% of males and 88.9% of females in these age groups living above the poverty line.
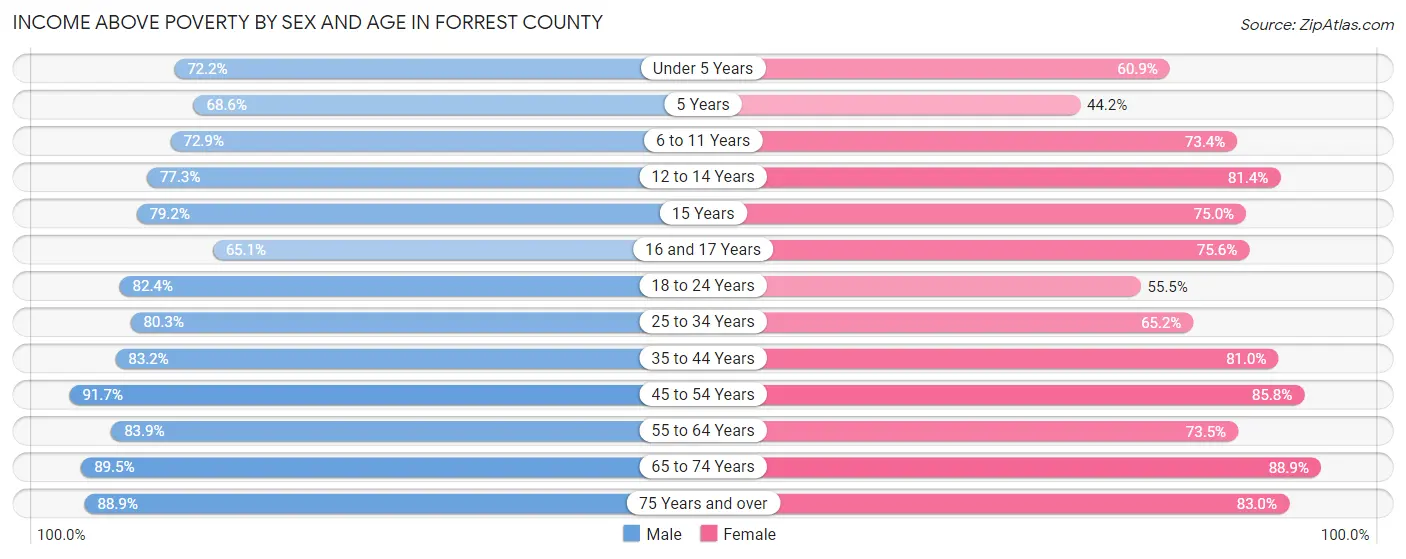
| Age Bracket | Male | Female |
| Under 5 Years | 1,776 (72.2%) | 1,436 (60.9%) |
| 5 Years | 199 (68.6%) | 237 (44.2%) |
| 6 to 11 Years | 2,061 (72.9%) | 1,843 (73.4%) |
| 12 to 14 Years | 1,279 (77.3%) | 1,353 (81.4%) |
| 15 Years | 328 (79.2%) | 399 (75.0%) |
| 16 and 17 Years | 682 (65.1%) | 613 (75.6%) |
| 18 to 24 Years | 3,590 (82.4%) | 3,200 (55.5%) |
| 25 to 34 Years | 4,206 (80.3%) | 3,702 (65.2%) |
| 35 to 44 Years | 3,677 (83.2%) | 3,776 (81.0%) |
| 45 to 54 Years | 3,563 (91.7%) | 3,569 (85.8%) |
| 55 to 64 Years | 3,244 (83.9%) | 3,245 (73.5%) |
| 65 to 74 Years | 2,399 (89.5%) | 2,832 (88.9%) |
| 75 Years and over | 1,559 (88.9%) | 2,225 (83.0%) |
| Total | 28,563 (81.9%) | 28,430 (73.0%) |
Income Below Poverty Among Married-Couple Families in Forrest County
The poverty statistics for married-couple families in Forrest County show that 6.3% or 729 of the total 11,495 families live below the poverty line. Families with 3 or 4 children have the highest poverty rate of 17.3%, comprising of 197 families. On the other hand, families with 1 or 2 children have the lowest poverty rate of 4.3%, which includes 159 families.
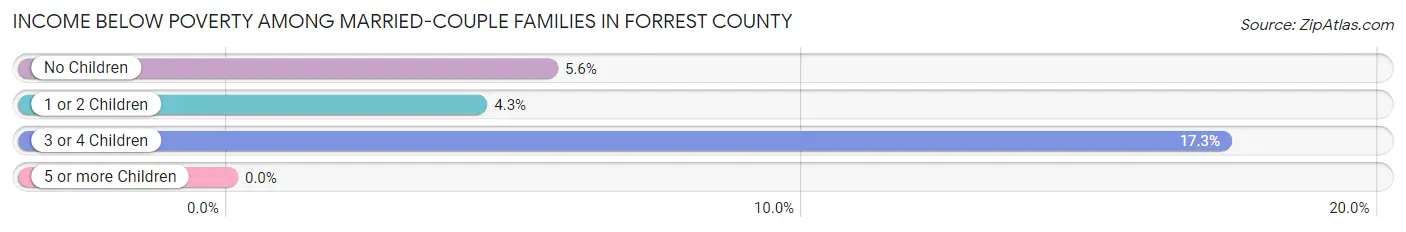
| Children | Above Poverty | Below Poverty |
| No Children | 6,322 (94.4%) | 373 (5.6%) |
| 1 or 2 Children | 3,502 (95.7%) | 159 (4.3%) |
| 3 or 4 Children | 942 (82.7%) | 197 (17.3%) |
| 5 or more Children | 0 (0.0%) | 0 (0.0%) |
| Total | 10,766 (93.7%) | 729 (6.3%) |
Income Below Poverty Among Single-Parent Households in Forrest County
According to the poverty data in Forrest County, 11.5% or 141 single-father households and 43.3% or 2,191 single-mother households are living below the poverty line. Among single-father households, those with 3 or 4 children have the highest poverty rate, with 48 households (68.6%) experiencing poverty. Likewise, among single-mother households, those with 5 or more children have the highest poverty rate, with 31 households (100.0%) falling below the poverty line.
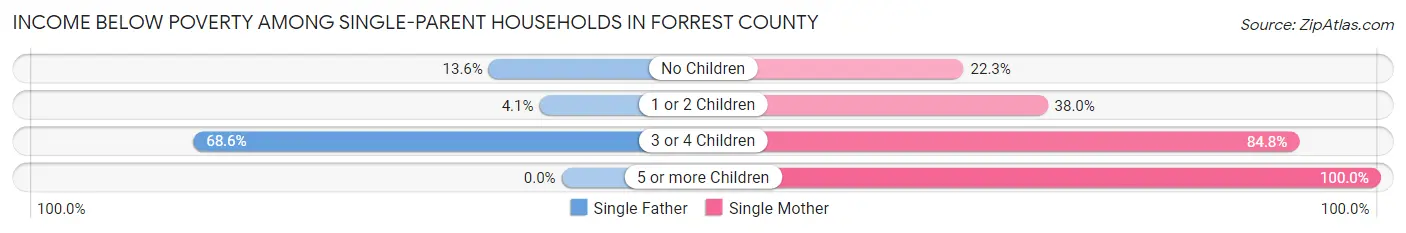
| Children | Single Father | Single Mother |
| No Children | 65 (13.6%) | 338 (22.3%) |
| 1 or 2 Children | 28 (4.1%) | 939 (38.0%) |
| 3 or 4 Children | 48 (68.6%) | 883 (84.8%) |
| 5 or more Children | 0 (0.0%) | 31 (100.0%) |
| Total | 141 (11.5%) | 2,191 (43.3%) |
Income Below Poverty Among Married-Couple vs Single-Parent Households in Forrest County
The poverty data for Forrest County shows that 729 of the married-couple family households (6.3%) and 2,332 of the single-parent households (37.1%) are living below the poverty level. Within the married-couple family households, those with 3 or 4 children have the highest poverty rate, with 197 households (17.3%) falling below the poverty line. Among the single-parent households, those with 5 or more children have the highest poverty rate, with 31 household (100.0%) living below poverty.
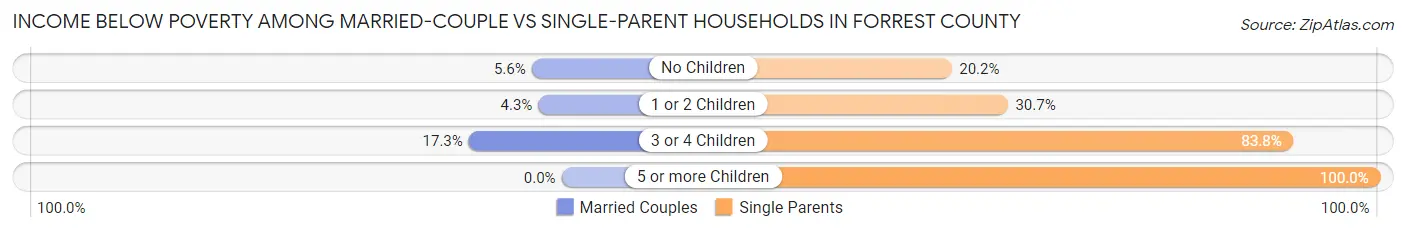
| Children | Married-Couple Families | Single-Parent Households |
| No Children | 373 (5.6%) | 403 (20.2%) |
| 1 or 2 Children | 159 (4.3%) | 967 (30.7%) |
| 3 or 4 Children | 197 (17.3%) | 931 (83.8%) |
| 5 or more Children | 0 (0.0%) | 31 (100.0%) |
| Total | 729 (6.3%) | 2,332 (37.1%) |
Race in Forrest County
The most populous races in Forrest County are White / Caucasian (45,305 | 58.2%), Black / African American (28,140 | 36.1%), and Two or more Races (3,140 | 4.0%).
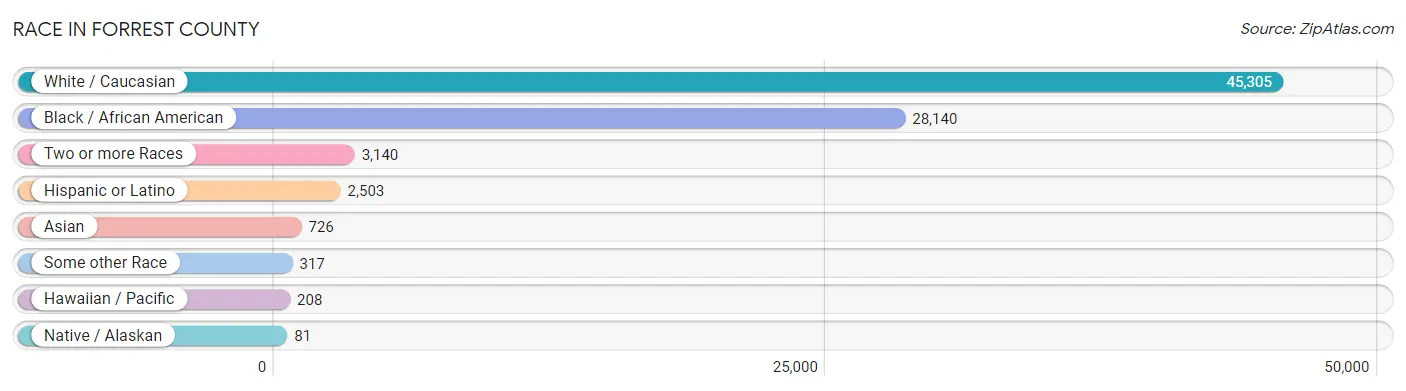
| Race | # Population | % Population |
| Asian | 726 | 0.9% |
| Black / African American | 28,140 | 36.1% |
| Hawaiian / Pacific | 208 | 0.3% |
| Hispanic or Latino | 2,503 | 3.2% |
| Native / Alaskan | 81 | 0.1% |
| White / Caucasian | 45,305 | 58.2% |
| Two or more Races | 3,140 | 4.0% |
| Some other Race | 317 | 0.4% |
| Total | 77,917 | 100.0% |
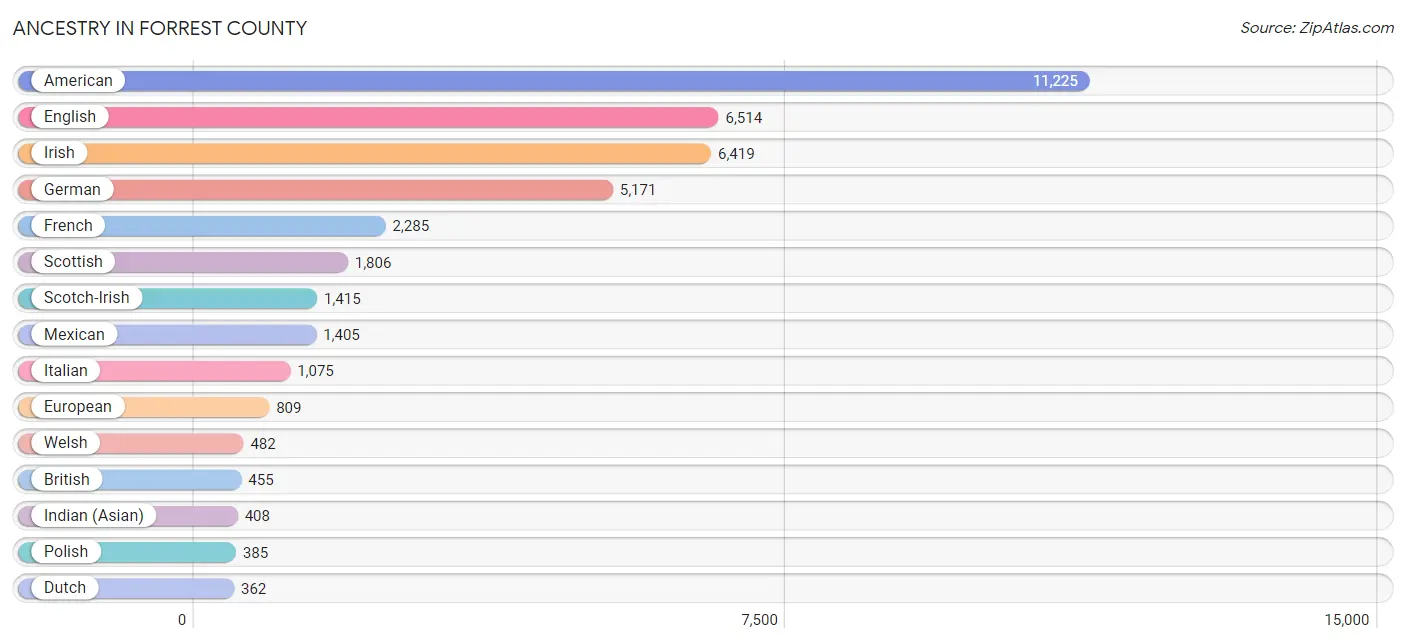
Ancestry in Forrest County
The most populous ancestries reported in Forrest County are American (11,225 | 14.4%), English (6,514 | 8.4%), Irish (6,419 | 8.2%), German (5,171 | 6.6%), and French (2,285 | 2.9%), together accounting for 40.6% of all Forrest County residents.
| Ancestry | # Population | % Population |
| African | 177 | 0.2% |
| American | 11,225 | 14.4% |
| Arab | 60 | 0.1% |
| Austrian | 73 | 0.1% |
| Bahamian | 5 | 0.0% |
| Bhutanese | 130 | 0.2% |
| Blackfeet | 4 | 0.0% |
| Brazilian | 37 | 0.1% |
| British | 455 | 0.6% |
| Burmese | 157 | 0.2% |
| Cajun | 29 | 0.0% |
| Canadian | 15 | 0.0% |
| Celtic | 4 | 0.0% |
| Central American | 151 | 0.2% |
| Central American Indian | 14 | 0.0% |
| Cherokee | 107 | 0.1% |
| Chickasaw | 11 | 0.0% |
| Choctaw | 173 | 0.2% |
| Colombian | 73 | 0.1% |
| Creek | 8 | 0.0% |
| Croatian | 32 | 0.0% |
| Cuban | 94 | 0.1% |
| Czech | 49 | 0.1% |
| Czechoslovakian | 11 | 0.0% |
| Danish | 12 | 0.0% |
| Dominican | 10 | 0.0% |
| Dutch | 362 | 0.5% |
| Eastern European | 52 | 0.1% |
| Ecuadorian | 17 | 0.0% |
| Egyptian | 26 | 0.0% |
| English | 6,514 | 8.4% |
| European | 809 | 1.0% |
| Fijian | 155 | 0.2% |
| Finnish | 19 | 0.0% |
| French | 2,285 | 2.9% |
| French Canadian | 51 | 0.1% |
| German | 5,171 | 6.6% |
| Ghanaian | 16 | 0.0% |
| Greek | 264 | 0.3% |
| Guatemalan | 68 | 0.1% |
| Honduran | 56 | 0.1% |
| Hungarian | 59 | 0.1% |
| Indian (Asian) | 408 | 0.5% |
| Iranian | 28 | 0.0% |
| Irish | 6,419 | 8.2% |
| Israeli | 7 | 0.0% |
| Italian | 1,075 | 1.4% |
| Jamaican | 15 | 0.0% |
| Japanese | 36 | 0.1% |
| Korean | 204 | 0.3% |
| Laotian | 4 | 0.0% |
| Lebanese | 29 | 0.0% |
| Lithuanian | 16 | 0.0% |
| Mexican | 1,405 | 1.8% |
| Native Hawaiian | 11 | 0.0% |
| Nigerian | 23 | 0.0% |
| Northern European | 226 | 0.3% |
| Norwegian | 322 | 0.4% |
| Panamanian | 12 | 0.0% |
| Pennsylvania German | 82 | 0.1% |
| Peruvian | 25 | 0.0% |
| Polish | 385 | 0.5% |
| Portuguese | 37 | 0.1% |
| Puerto Rican | 359 | 0.5% |
| Russian | 40 | 0.1% |
| Salvadoran | 15 | 0.0% |
| Samoan | 7 | 0.0% |
| Scandinavian | 24 | 0.0% |
| Scotch-Irish | 1,415 | 1.8% |
| Scottish | 1,806 | 2.3% |
| Sioux | 13 | 0.0% |
| Slovak | 40 | 0.1% |
| South American | 122 | 0.2% |
| South American Indian | 5 | 0.0% |
| Spaniard | 173 | 0.2% |
| Spanish | 53 | 0.1% |
| Spanish American | 29 | 0.0% |
| Sri Lankan | 281 | 0.4% |
| Subsaharan African | 216 | 0.3% |
| Swedish | 157 | 0.2% |
| Swiss | 15 | 0.0% |
| Syrian | 5 | 0.0% |
| Thai | 58 | 0.1% |
| Ukrainian | 20 | 0.0% |
| Venezuelan | 7 | 0.0% |
| Welsh | 482 | 0.6% |
| West Indian | 4 | 0.0% |
| Yugoslavian | 111 | 0.1% | View All 88 Rows |
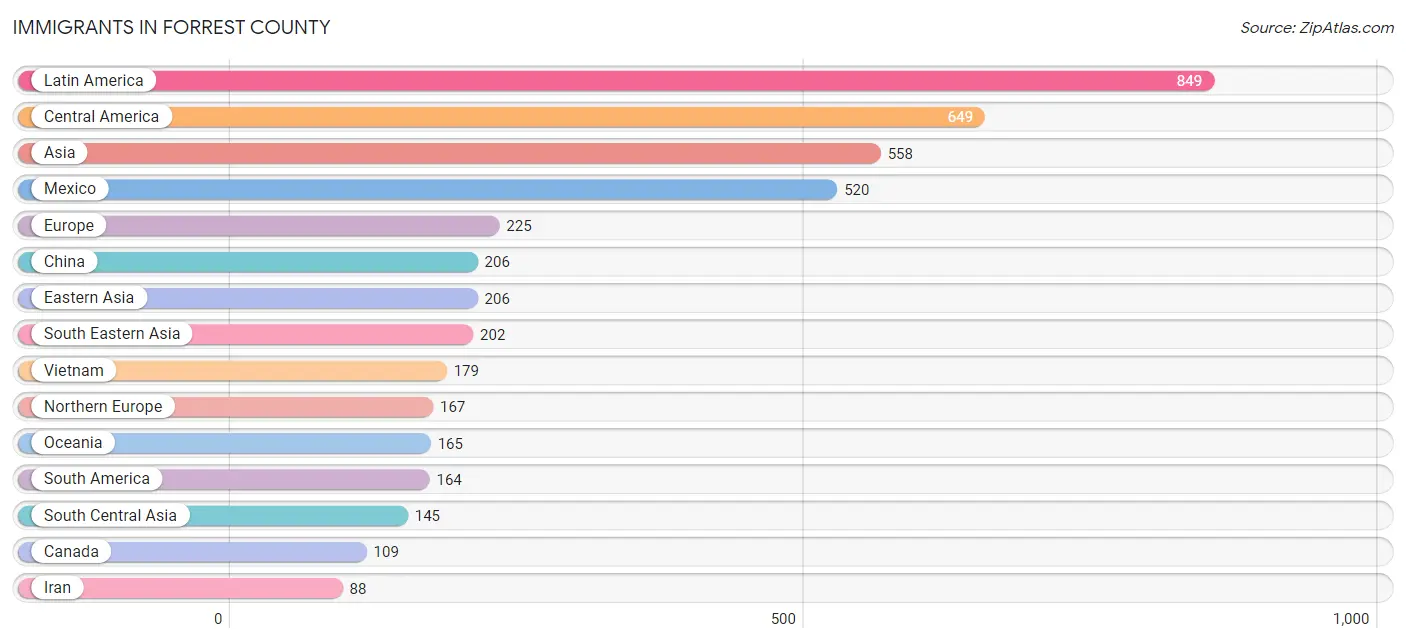
Immigrants in Forrest County
The most numerous immigrant groups reported in Forrest County came from Latin America (849 | 1.1%), Central America (649 | 0.8%), Asia (558 | 0.7%), Mexico (520 | 0.7%), and Europe (225 | 0.3%), together accounting for 3.6% of all Forrest County residents.
| Immigration Origin | # Population | % Population |
| Africa | 30 | 0.0% |
| Asia | 558 | 0.7% |
| Bahamas | 5 | 0.0% |
| Brazil | 85 | 0.1% |
| Canada | 109 | 0.1% |
| Caribbean | 36 | 0.1% |
| Central America | 649 | 0.8% |
| China | 206 | 0.3% |
| Colombia | 57 | 0.1% |
| Congo | 1 | 0.0% |
| Cuba | 6 | 0.0% |
| Dominican Republic | 10 | 0.0% |
| Eastern Africa | 1 | 0.0% |
| Eastern Asia | 206 | 0.3% |
| Eastern Europe | 4 | 0.0% |
| El Salvador | 15 | 0.0% |
| England | 28 | 0.0% |
| Europe | 225 | 0.3% |
| France | 8 | 0.0% |
| Germany | 21 | 0.0% |
| Ghana | 16 | 0.0% |
| Guatemala | 56 | 0.1% |
| Honduras | 46 | 0.1% |
| India | 1 | 0.0% |
| Iran | 88 | 0.1% |
| Ireland | 55 | 0.1% |
| Jamaica | 15 | 0.0% |
| Latin America | 849 | 1.1% |
| Mexico | 520 | 0.7% |
| Middle Africa | 1 | 0.0% |
| Nepal | 56 | 0.1% |
| Netherlands | 17 | 0.0% |
| Nigeria | 12 | 0.0% |
| Northern Europe | 167 | 0.2% |
| Oceania | 165 | 0.2% |
| Panama | 12 | 0.0% |
| Peru | 15 | 0.0% |
| Philippines | 23 | 0.0% |
| Scotland | 44 | 0.1% |
| South America | 164 | 0.2% |
| South Central Asia | 145 | 0.2% |
| South Eastern Asia | 202 | 0.3% |
| Southern Europe | 8 | 0.0% |
| Spain | 8 | 0.0% |
| Syria | 5 | 0.0% |
| Ukraine | 4 | 0.0% |
| Venezuela | 7 | 0.0% |
| Vietnam | 179 | 0.2% |
| Western Africa | 28 | 0.0% |
| Western Asia | 5 | 0.0% |
| Western Europe | 46 | 0.1% | View All 51 Rows |
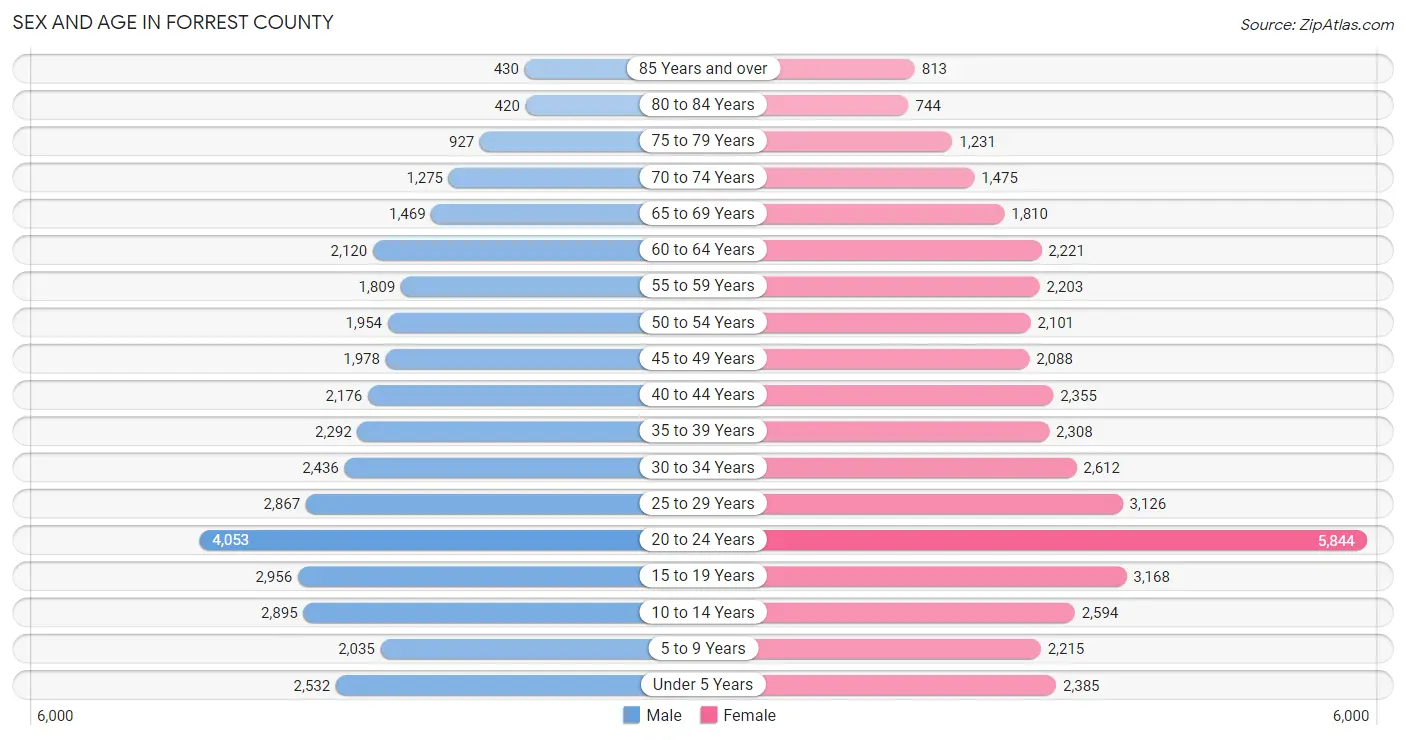
Sex and Age in Forrest County
Sex and Age in Forrest County
The most populous age groups in Forrest County are 20 to 24 Years (4,053 | 11.1%) for men and 20 to 24 Years (5,844 | 14.1%) for women.
| Age Bracket | Male | Female |
| Under 5 Years | 2,532 (6.9%) | 2,385 (5.8%) |
| 5 to 9 Years | 2,035 (5.6%) | 2,215 (5.4%) |
| 10 to 14 Years | 2,895 (7.9%) | 2,594 (6.3%) |
| 15 to 19 Years | 2,956 (8.1%) | 3,168 (7.7%) |
| 20 to 24 Years | 4,053 (11.1%) | 5,844 (14.1%) |
| 25 to 29 Years | 2,867 (7.8%) | 3,126 (7.6%) |
| 30 to 34 Years | 2,436 (6.7%) | 2,612 (6.3%) |
| 35 to 39 Years | 2,292 (6.3%) | 2,308 (5.6%) |
| 40 to 44 Years | 2,176 (5.9%) | 2,355 (5.7%) |
| 45 to 49 Years | 1,978 (5.4%) | 2,088 (5.1%) |
| 50 to 54 Years | 1,954 (5.3%) | 2,101 (5.1%) |
| 55 to 59 Years | 1,809 (4.9%) | 2,203 (5.3%) |
| 60 to 64 Years | 2,120 (5.8%) | 2,221 (5.4%) |
| 65 to 69 Years | 1,469 (4.0%) | 1,810 (4.4%) |
| 70 to 74 Years | 1,275 (3.5%) | 1,475 (3.6%) |
| 75 to 79 Years | 927 (2.5%) | 1,231 (3.0%) |
| 80 to 84 Years | 420 (1.1%) | 744 (1.8%) |
| 85 Years and over | 430 (1.2%) | 813 (2.0%) |
| Total | 36,624 (100.0%) | 41,293 (100.0%) |
Families and Households in Forrest County
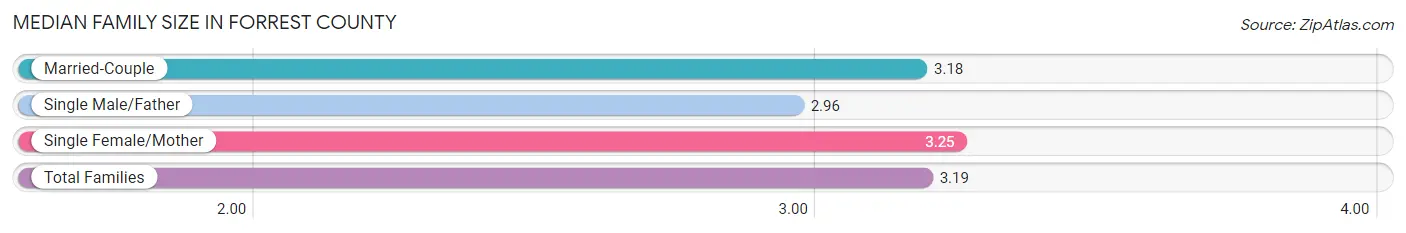
Median Family Size in Forrest County
The median family size in Forrest County is 3.19 persons per family, with single female/mother families (5,057 | 28.4%) accounting for the largest median family size of 3.25 persons per family. On the other hand, single male/father families (1,227 | 6.9%) represent the smallest median family size with 2.96 persons per family.
| Family Type | # Families | Family Size |
| Married-Couple | 11,495 (64.6%) | 3.18 |
| Single Male/Father | 1,227 (6.9%) | 2.96 |
| Single Female/Mother | 5,057 (28.4%) | 3.25 |
| Total Families | 17,779 (100.0%) | 3.19 |
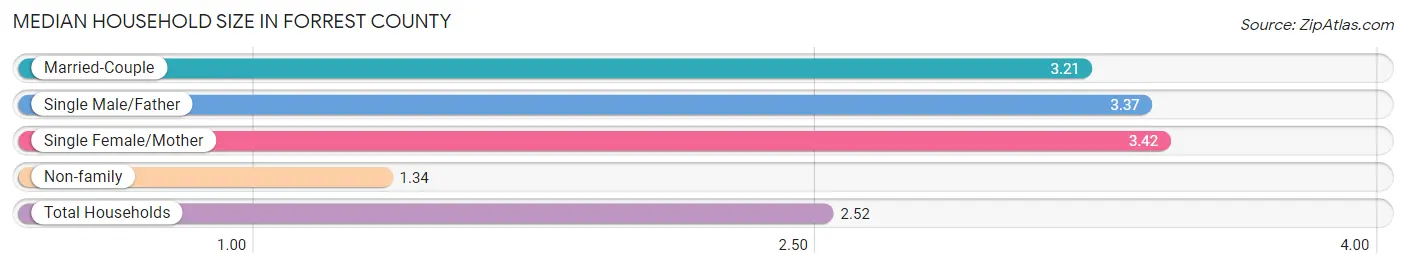
Median Household Size in Forrest County
The median household size in Forrest County is 2.52 persons per household, with single female/mother households (5,057 | 17.2%) accounting for the largest median household size of 3.42 persons per household. non-family households (11,572 | 39.4%) represent the smallest median household size with 1.34 persons per household.
| Household Type | # Households | Household Size |
| Married-Couple | 11,495 (39.2%) | 3.21 |
| Single Male/Father | 1,227 (4.2%) | 3.37 |
| Single Female/Mother | 5,057 (17.2%) | 3.42 |
| Non-family | 11,572 (39.4%) | 1.34 |
| Total Households | 29,351 (100.0%) | 2.52 |
Household Size by Marriage Status in Forrest County
Out of a total of 29,351 households in Forrest County, 17,779 (60.6%) are family households, while 11,572 (39.4%) are nonfamily households. The most numerous type of family households are 2-person households, comprising 7,664, and the most common type of nonfamily households are 1-person households, comprising 9,050.
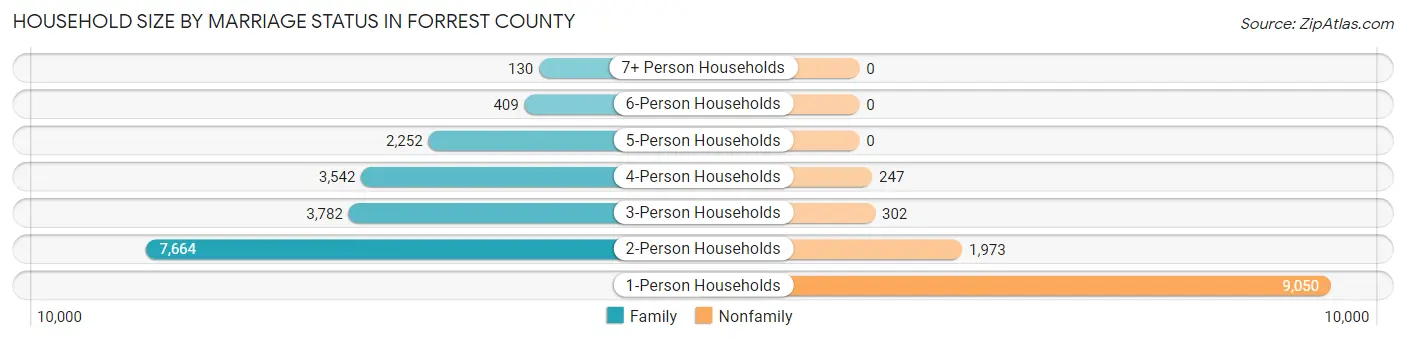
| Household Size | Family Households | Nonfamily Households |
| 1-Person Households | - | 9,050 (30.8%) |
| 2-Person Households | 7,664 (26.1%) | 1,973 (6.7%) |
| 3-Person Households | 3,782 (12.9%) | 302 (1.0%) |
| 4-Person Households | 3,542 (12.1%) | 247 (0.8%) |
| 5-Person Households | 2,252 (7.7%) | 0 (0.0%) |
| 6-Person Households | 409 (1.4%) | 0 (0.0%) |
| 7+ Person Households | 130 (0.4%) | 0 (0.0%) |
| Total | 17,779 (60.6%) | 11,572 (39.4%) |
Female Fertility in Forrest County
Fertility by Age in Forrest County
Average fertility rate in Forrest County is 64.0 births per 1,000 women. Women in the age bracket of 20 to 34 years have the highest fertility rate with 103.0 births per 1,000 women. Women in the age bracket of 20 to 34 years acount for 85.3% of all women with births.
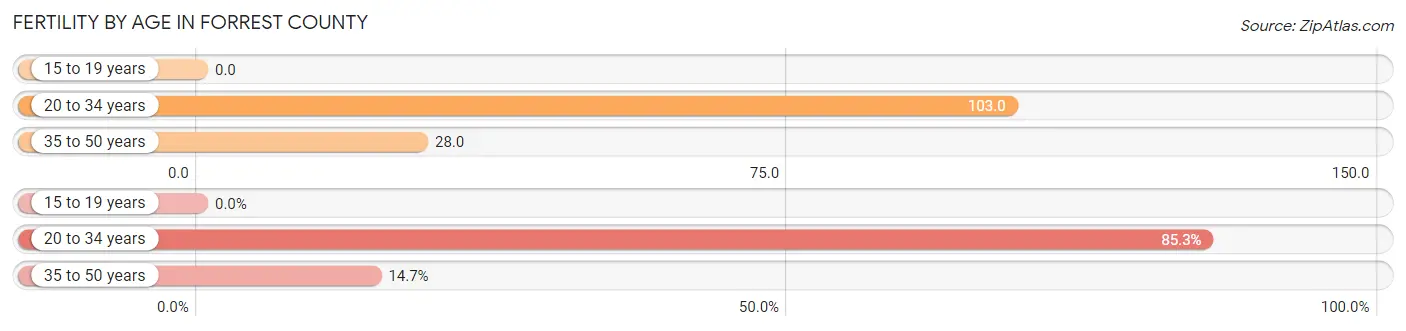
| Age Bracket | Women with Births | Births / 1,000 Women |
| 15 to 19 years | 0 (0.0%) | 0.0 |
| 20 to 34 years | 1,194 (85.3%) | 103.0 |
| 35 to 50 years | 206 (14.7%) | 28.0 |
| Total | 1,400 (100.0%) | 64.0 |
Fertility by Age by Marriage Status in Forrest County
48.5% of women with births (1,400) in Forrest County are married. The highest percentage of unmarried women with births falls into 20 to 34 years age bracket with 55.7% of them unmarried at the time of birth, while the lowest percentage of unmarried women with births belong to 35 to 50 years age bracket with 27.2% of them unmarried.
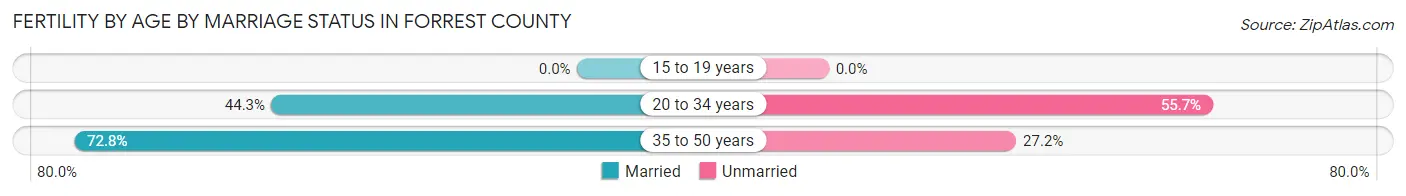
| Age Bracket | Married | Unmarried |
| 15 to 19 years | 0 (0.0%) | 0 (0.0%) |
| 20 to 34 years | 529 (44.3%) | 665 (55.7%) |
| 35 to 50 years | 150 (72.8%) | 56 (27.2%) |
| Total | 679 (48.5%) | 721 (51.5%) |
Fertility by Education in Forrest County
Average fertility rate in Forrest County is 64.0 births per 1,000 women. Women with the education attainment of graduate degree have the highest fertility rate of 141.0 births per 1,000 women, while women with the education attainment of bachelor's degree have the lowest fertility at 31.0 births per 1,000 women. Women with the education attainment of college or associate's degree represent 47.8% of all women with births.
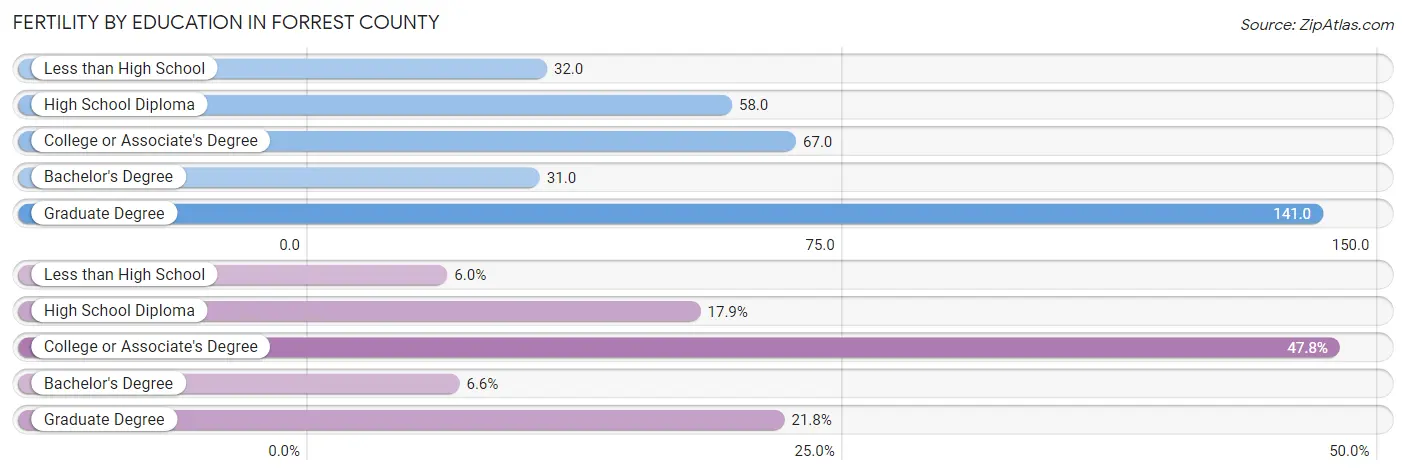
| Educational Attainment | Women with Births | Births / 1,000 Women |
| Less than High School | 84 (6.0%) | 32.0 |
| High School Diploma | 250 (17.9%) | 58.0 |
| College or Associate's Degree | 669 (47.8%) | 67.0 |
| Bachelor's Degree | 92 (6.6%) | 31.0 |
| Graduate Degree | 305 (21.8%) | 141.0 |
| Total | 1,400 (100.0%) | 64.0 |
Fertility by Education by Marriage Status in Forrest County
51.5% of women with births in Forrest County are unmarried. Women with the educational attainment of less than high school are most likely to be married with 66.7% of them married at childbirth, while women with the educational attainment of college or associate's degree are least likely to be married with 60.5% of them unmarried at childbirth.
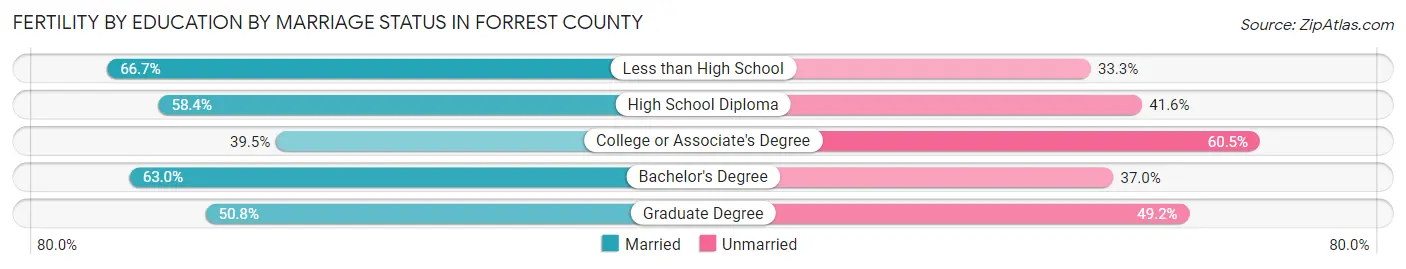
| Educational Attainment | Married | Unmarried |
| Less than High School | 56 (66.7%) | 28 (33.3%) |
| High School Diploma | 146 (58.4%) | 104 (41.6%) |
| College or Associate's Degree | 264 (39.5%) | 405 (60.5%) |
| Bachelor's Degree | 58 (63.0%) | 34 (37.0%) |
| Graduate Degree | 155 (50.8%) | 150 (49.2%) |
| Total | 679 (48.5%) | 721 (51.5%) |
Employment Characteristics in Forrest County
Employment by Class of Employer in Forrest County
Among the 35,362 employed individuals in Forrest County, private company employees (24,103 | 68.2%), state government employees (3,392 | 9.6%), and not-for-profit organizations (2,129 | 6.0%) make up the most common classes of employment.
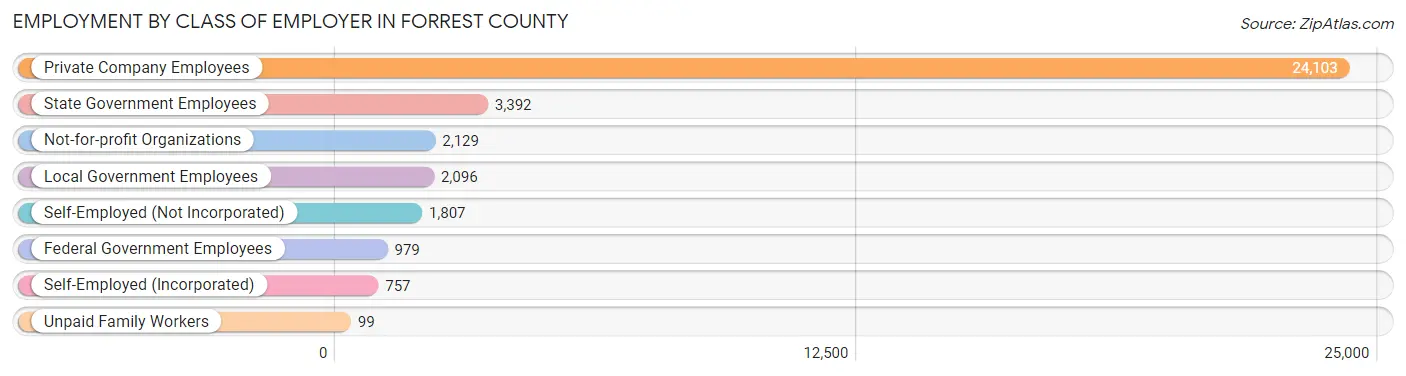
| Employer Class | # Employees | % Employees |
| Private Company Employees | 24,103 | 68.2% |
| Self-Employed (Incorporated) | 757 | 2.1% |
| Self-Employed (Not Incorporated) | 1,807 | 5.1% |
| Not-for-profit Organizations | 2,129 | 6.0% |
| Local Government Employees | 2,096 | 5.9% |
| State Government Employees | 3,392 | 9.6% |
| Federal Government Employees | 979 | 2.8% |
| Unpaid Family Workers | 99 | 0.3% |
| Total | 35,362 | 100.0% |
Employment Status by Age in Forrest County
According to the labor force statistics for Forrest County, out of the total population over 16 years of age (62,312), 62.7% or 39,070 individuals are in the labor force, with 7.4% or 2,891 of them unemployed. The age group with the highest labor force participation rate is 35 to 44 years, with 83.9% or 7,661 individuals in the labor force. Within the labor force, the 16 to 19 years age range has the highest percentage of unemployed individuals, with 15.7% or 381 of them being unemployed.
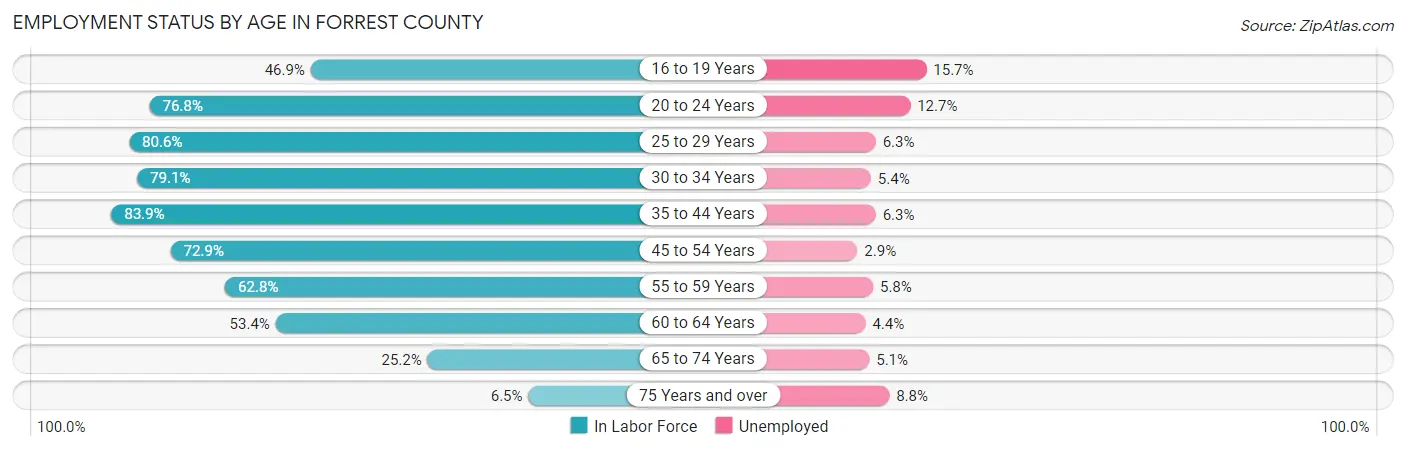
| Age Bracket | In Labor Force | Unemployed |
| 16 to 19 Years | 2,427 (46.9%) | 381 (15.7%) |
| 20 to 24 Years | 7,601 (76.8%) | 965 (12.7%) |
| 25 to 29 Years | 4,830 (80.6%) | 304 (6.3%) |
| 30 to 34 Years | 3,993 (79.1%) | 216 (5.4%) |
| 35 to 44 Years | 7,661 (83.9%) | 483 (6.3%) |
| 45 to 54 Years | 5,920 (72.9%) | 172 (2.9%) |
| 55 to 59 Years | 2,520 (62.8%) | 146 (5.8%) |
| 60 to 64 Years | 2,318 (53.4%) | 102 (4.4%) |
| 65 to 74 Years | 1,519 (25.2%) | 77 (5.1%) |
| 75 Years and over | 297 (6.5%) | 26 (8.8%) |
| Total | 39,070 (62.7%) | 2,891 (7.4%) |
Employment Status by Educational Attainment in Forrest County
According to labor force statistics for Forrest County, 74.3% of individuals (27,228) out of the total population between 25 and 64 years of age (36,646) are in the labor force, with 5.2% or 1,416 of them being unemployed. The group with the highest labor force participation rate are those with the educational attainment of bachelor's degree or higher, with 83.1% or 8,740 individuals in the labor force. Within the labor force, individuals with less than high school education have the highest percentage of unemployment, with 9.5% or 179 of them being unemployed.
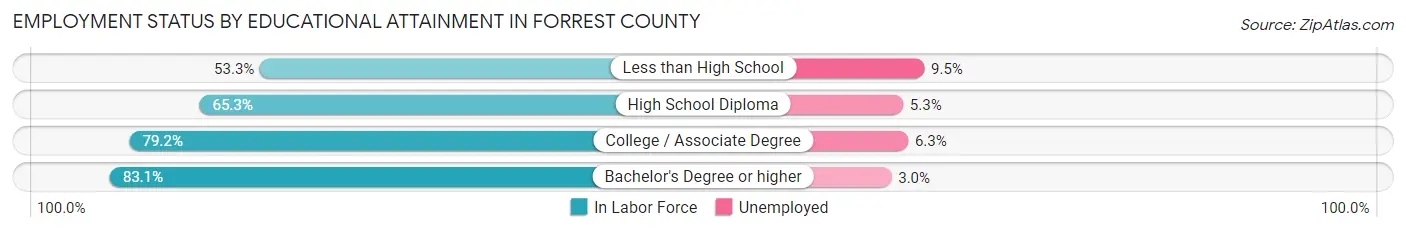
| Educational Attainment | In Labor Force | Unemployed |
| Less than High School | 1,881 (53.3%) | 335 (9.5%) |
| High School Diploma | 5,992 (65.3%) | 486 (5.3%) |
| College / Associate Degree | 10,630 (79.2%) | 846 (6.3%) |
| Bachelor's Degree or higher | 8,740 (83.1%) | 316 (3.0%) |
| Total | 27,228 (74.3%) | 1,906 (5.2%) |
Employment Occupations by Sex in Forrest County
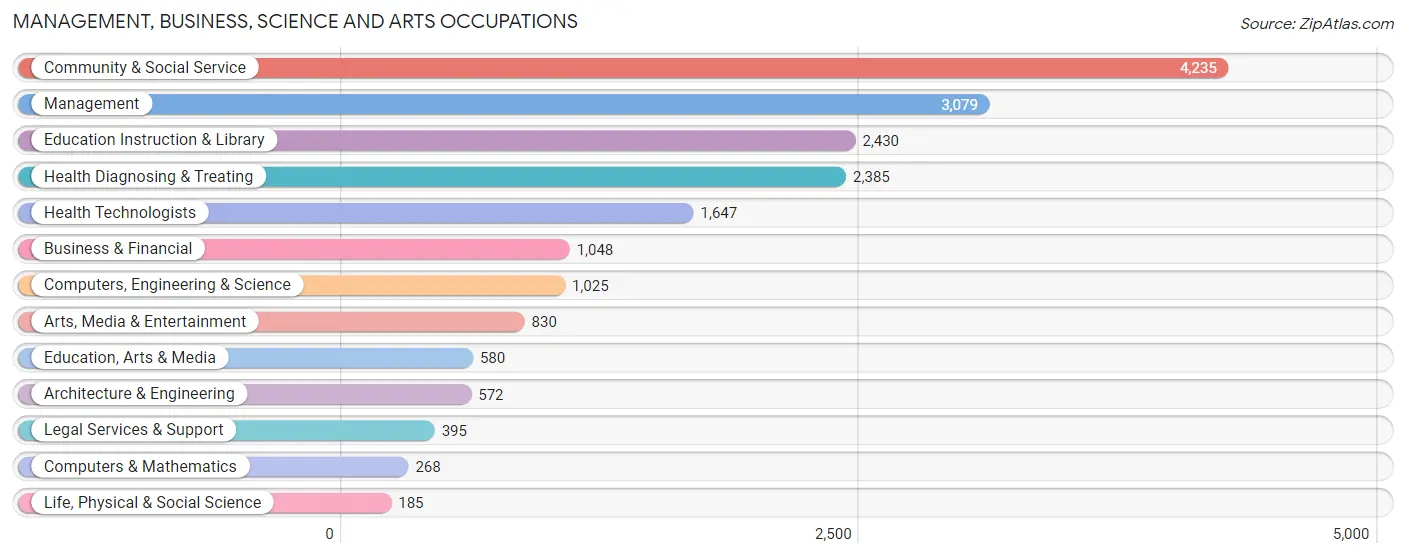
Management, Business, Science and Arts Occupations
The most common Management, Business, Science and Arts occupations in Forrest County are Community & Social Service (4,235 | 11.8%), Management (3,079 | 8.6%), Education Instruction & Library (2,430 | 6.8%), Health Diagnosing & Treating (2,385 | 6.6%), and Health Technologists (1,647 | 4.6%).
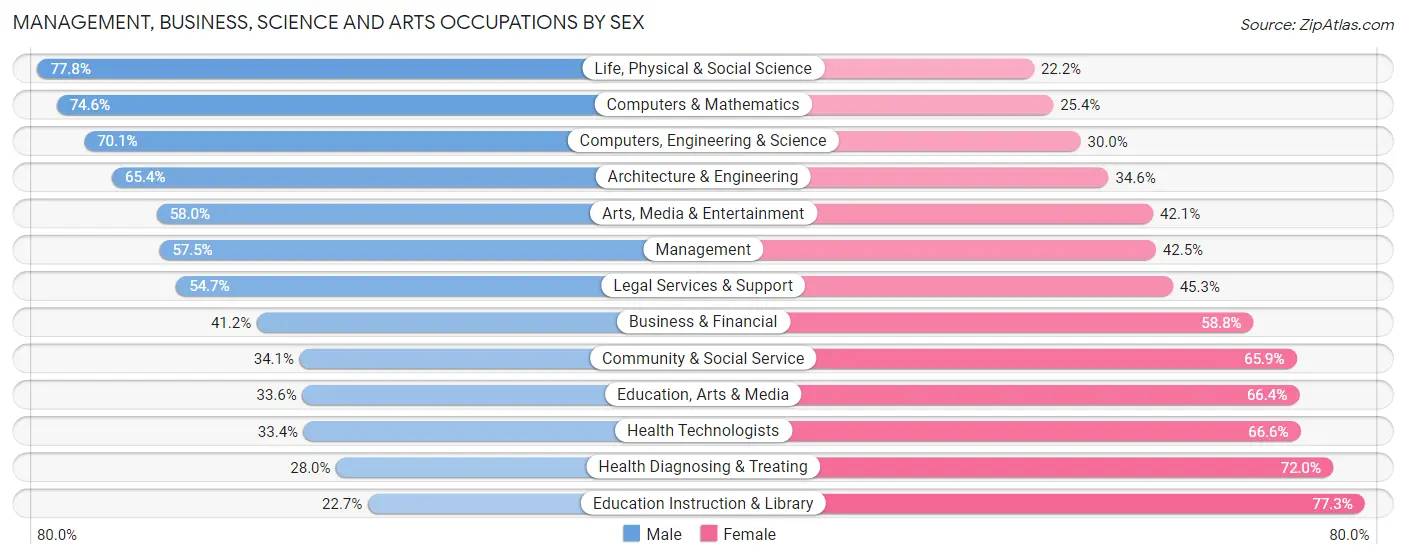
Management, Business, Science and Arts Occupations by Sex
Within the Management, Business, Science and Arts occupations in Forrest County, the most male-oriented occupations are Life, Physical & Social Science (77.8%), Computers & Mathematics (74.6%), and Computers, Engineering & Science (70.1%), while the most female-oriented occupations are Education Instruction & Library (77.3%), Health Diagnosing & Treating (72.0%), and Health Technologists (66.6%).
| Occupation | Male | Female |
| Management | 1,770 (57.5%) | 1,309 (42.5%) |
| Business & Financial | 432 (41.2%) | 616 (58.8%) |
| Computers, Engineering & Science | 718 (70.1%) | 307 (29.9%) |
| Computers & Mathematics | 200 (74.6%) | 68 (25.4%) |
| Architecture & Engineering | 374 (65.4%) | 198 (34.6%) |
| Life, Physical & Social Science | 144 (77.8%) | 41 (22.2%) |
| Community & Social Service | 1,443 (34.1%) | 2,792 (65.9%) |
| Education, Arts & Media | 195 (33.6%) | 385 (66.4%) |
| Legal Services & Support | 216 (54.7%) | 179 (45.3%) |
| Education Instruction & Library | 551 (22.7%) | 1,879 (77.3%) |
| Arts, Media & Entertainment | 481 (58.0%) | 349 (42.0%) |
| Health Diagnosing & Treating | 667 (28.0%) | 1,718 (72.0%) |
| Health Technologists | 550 (33.4%) | 1,097 (66.6%) |
| Total (Category) | 5,030 (42.7%) | 6,742 (57.3%) |
| Total (Overall) | 17,779 (49.4%) | 18,231 (50.6%) |
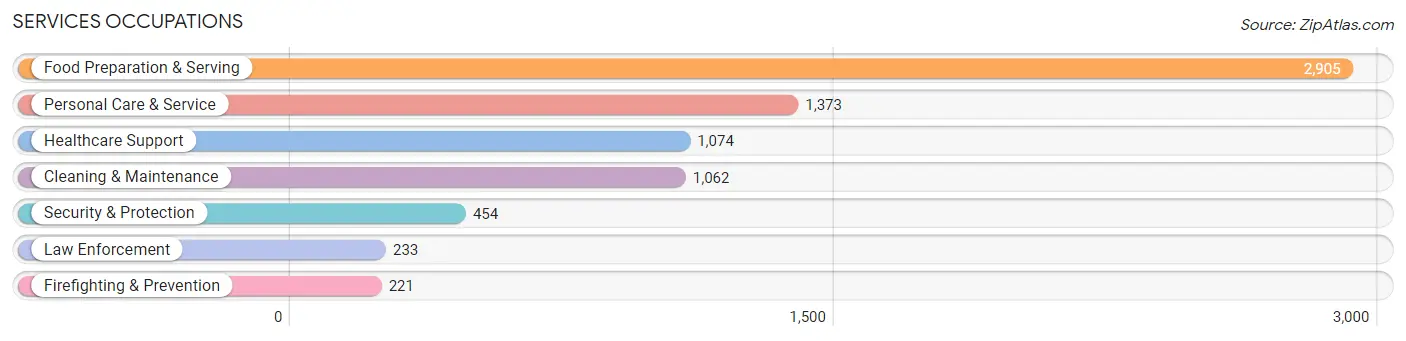
Services Occupations
The most common Services occupations in Forrest County are Food Preparation & Serving (2,905 | 8.1%), Personal Care & Service (1,373 | 3.8%), Healthcare Support (1,074 | 3.0%), Cleaning & Maintenance (1,062 | 2.9%), and Security & Protection (454 | 1.3%).
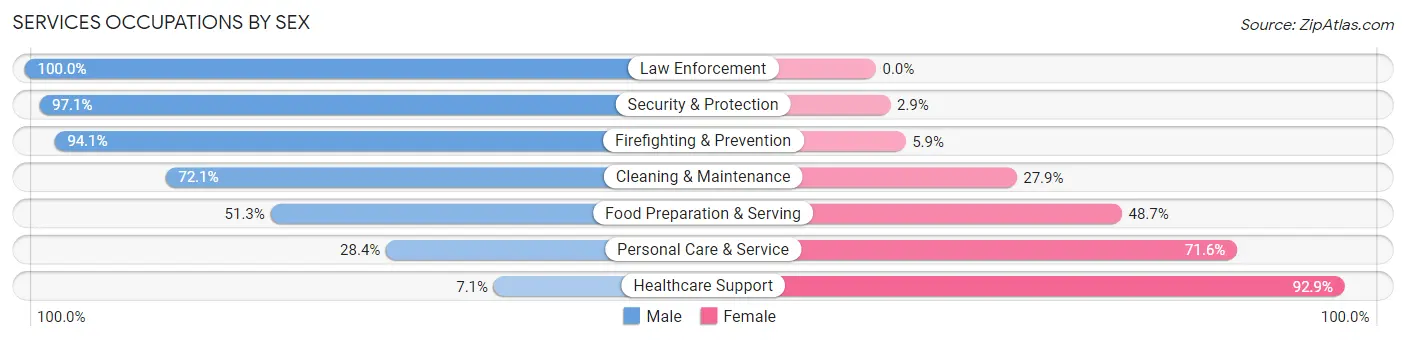
Services Occupations by Sex
Within the Services occupations in Forrest County, the most male-oriented occupations are Law Enforcement (100.0%), Security & Protection (97.1%), and Firefighting & Prevention (94.1%), while the most female-oriented occupations are Healthcare Support (92.9%), Personal Care & Service (71.6%), and Food Preparation & Serving (48.7%).
| Occupation | Male | Female |
| Healthcare Support | 76 (7.1%) | 998 (92.9%) |
| Security & Protection | 441 (97.1%) | 13 (2.9%) |
| Firefighting & Prevention | 208 (94.1%) | 13 (5.9%) |
| Law Enforcement | 233 (100.0%) | 0 (0.0%) |
| Food Preparation & Serving | 1,490 (51.3%) | 1,415 (48.7%) |
| Cleaning & Maintenance | 766 (72.1%) | 296 (27.9%) |
| Personal Care & Service | 390 (28.4%) | 983 (71.6%) |
| Total (Category) | 3,163 (46.1%) | 3,705 (53.9%) |
| Total (Overall) | 17,779 (49.4%) | 18,231 (50.6%) |
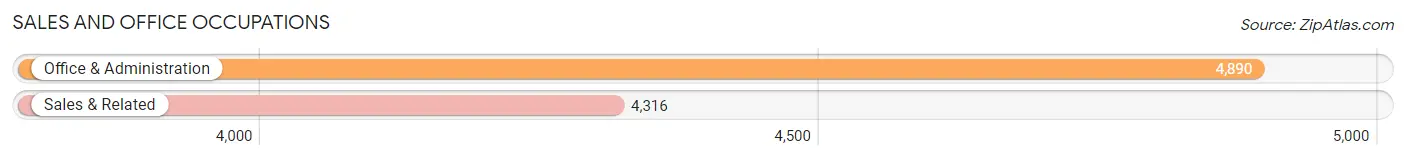
Sales and Office Occupations
The most common Sales and Office occupations in Forrest County are Office & Administration (4,890 | 13.6%), and Sales & Related (4,316 | 12.0%).
Sales and Office Occupations by Sex
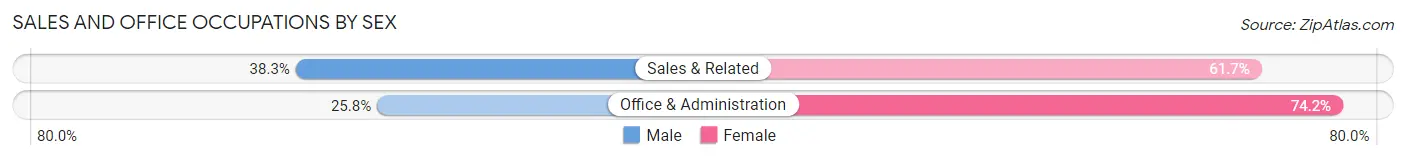
| Occupation | Male | Female |
| Sales & Related | 1,653 (38.3%) | 2,663 (61.7%) |
| Office & Administration | 1,261 (25.8%) | 3,629 (74.2%) |
| Total (Category) | 2,914 (31.7%) | 6,292 (68.3%) |
| Total (Overall) | 17,779 (49.4%) | 18,231 (50.6%) |
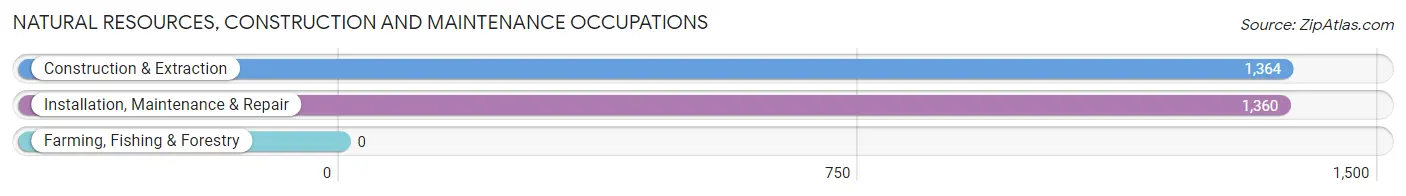
Natural Resources, Construction and Maintenance Occupations
The most common Natural Resources, Construction and Maintenance occupations in Forrest County are Construction & Extraction (1,364 | 3.8%), and Installation, Maintenance & Repair (1,360 | 3.8%).
Natural Resources, Construction and Maintenance Occupations by Sex
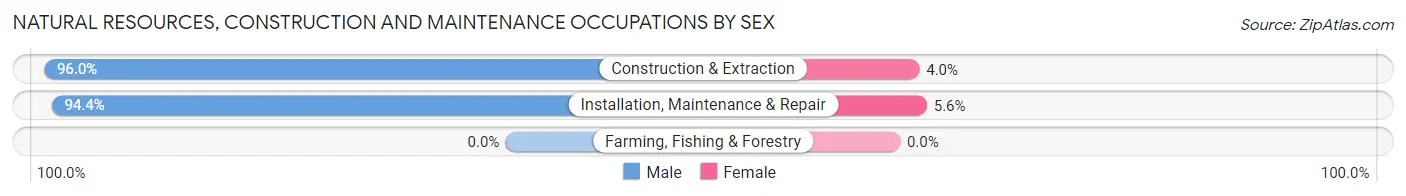
| Occupation | Male | Female |
| Farming, Fishing & Forestry | 0 (0.0%) | 0 (0.0%) |
| Construction & Extraction | 1,309 (96.0%) | 55 (4.0%) |
| Installation, Maintenance & Repair | 1,284 (94.4%) | 76 (5.6%) |
| Total (Category) | 2,593 (95.2%) | 131 (4.8%) |
| Total (Overall) | 17,779 (49.4%) | 18,231 (50.6%) |
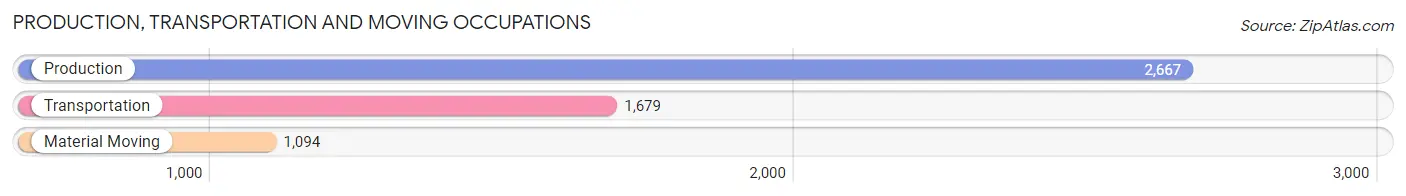
Production, Transportation and Moving Occupations
The most common Production, Transportation and Moving occupations in Forrest County are Production (2,667 | 7.4%), Transportation (1,679 | 4.7%), and Material Moving (1,094 | 3.0%).
Production, Transportation and Moving Occupations by Sex
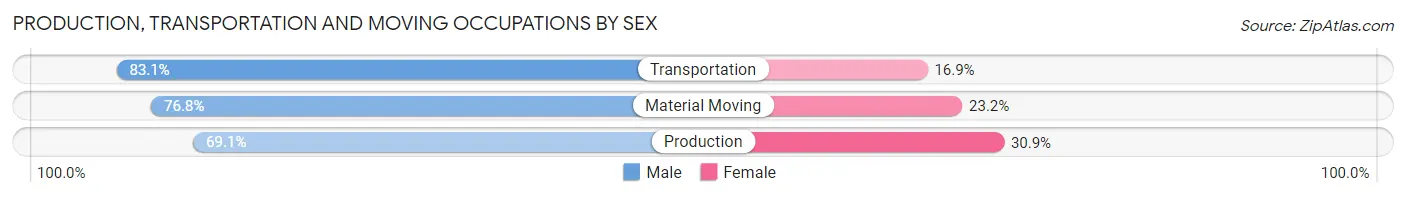
| Occupation | Male | Female |
| Production | 1,843 (69.1%) | 824 (30.9%) |
| Transportation | 1,396 (83.1%) | 283 (16.9%) |
| Material Moving | 840 (76.8%) | 254 (23.2%) |
| Total (Category) | 4,079 (75.0%) | 1,361 (25.0%) |
| Total (Overall) | 17,779 (49.4%) | 18,231 (50.6%) |
Employment Industries by Sex in Forrest County
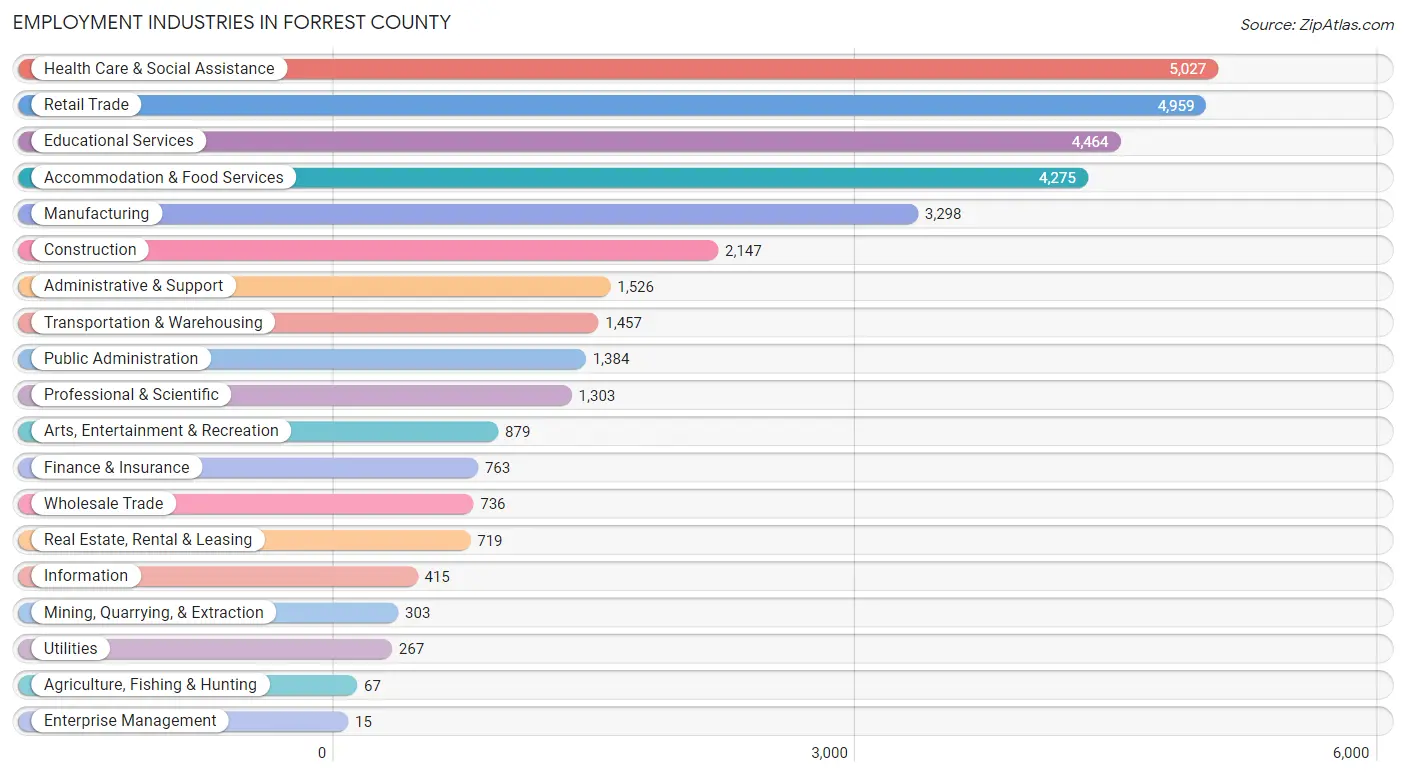
Employment Industries in Forrest County
The major employment industries in Forrest County include Health Care & Social Assistance (5,027 | 14.0%), Retail Trade (4,959 | 13.8%), Educational Services (4,464 | 12.4%), Accommodation & Food Services (4,275 | 11.9%), and Manufacturing (3,298 | 9.2%).
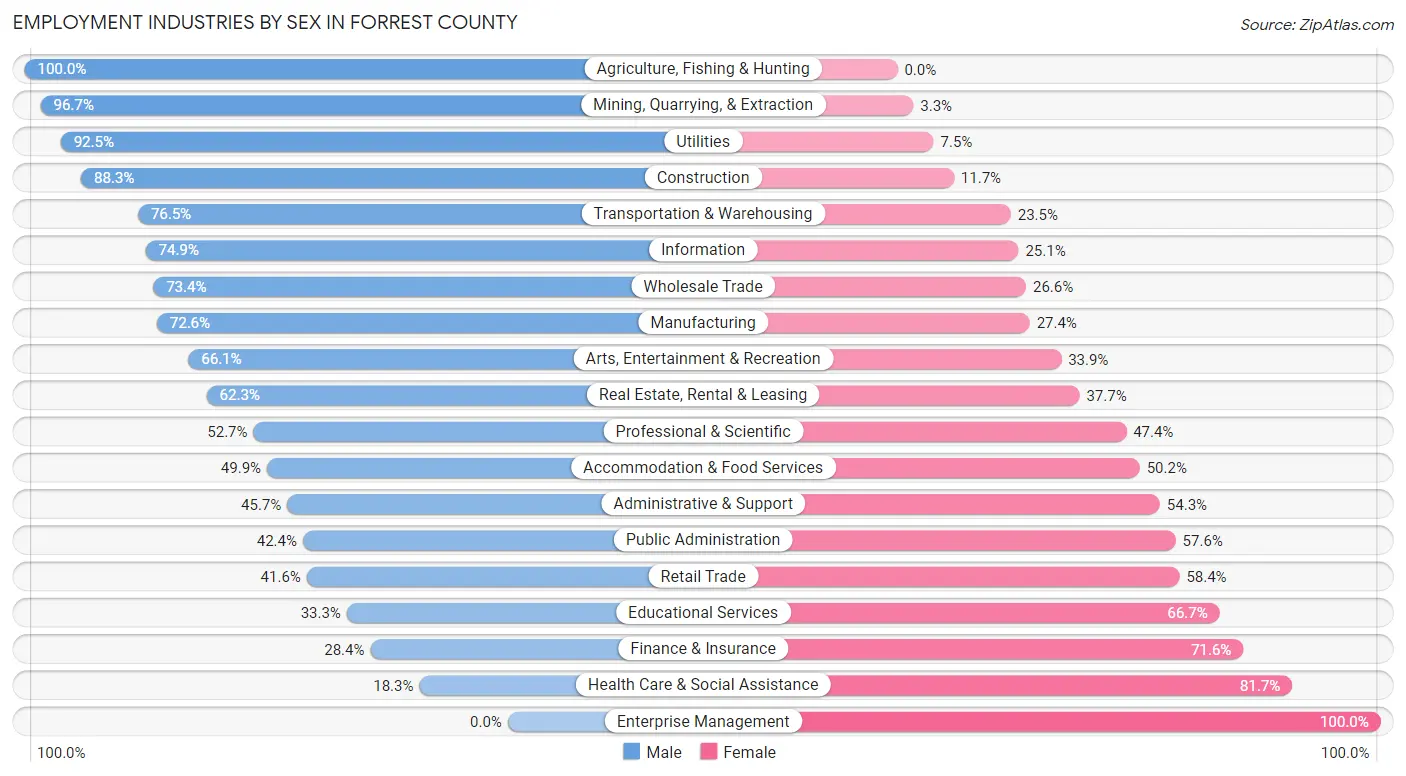
Employment Industries by Sex in Forrest County
The Forrest County industries that see more men than women are Agriculture, Fishing & Hunting (100.0%), Mining, Quarrying, & Extraction (96.7%), and Utilities (92.5%), whereas the industries that tend to have a higher number of women are Enterprise Management (100.0%), Health Care & Social Assistance (81.7%), and Finance & Insurance (71.6%).
| Industry | Male | Female |
| Agriculture, Fishing & Hunting | 67 (100.0%) | 0 (0.0%) |
| Mining, Quarrying, & Extraction | 293 (96.7%) | 10 (3.3%) |
| Construction | 1,896 (88.3%) | 251 (11.7%) |
| Manufacturing | 2,395 (72.6%) | 903 (27.4%) |
| Wholesale Trade | 540 (73.4%) | 196 (26.6%) |
| Retail Trade | 2,064 (41.6%) | 2,895 (58.4%) |
| Transportation & Warehousing | 1,115 (76.5%) | 342 (23.5%) |
| Utilities | 247 (92.5%) | 20 (7.5%) |
| Information | 311 (74.9%) | 104 (25.1%) |
| Finance & Insurance | 217 (28.4%) | 546 (71.6%) |
| Real Estate, Rental & Leasing | 448 (62.3%) | 271 (37.7%) |
| Professional & Scientific | 686 (52.6%) | 617 (47.3%) |
| Enterprise Management | 0 (0.0%) | 15 (100.0%) |
| Administrative & Support | 697 (45.7%) | 829 (54.3%) |
| Educational Services | 1,488 (33.3%) | 2,976 (66.7%) |
| Health Care & Social Assistance | 920 (18.3%) | 4,107 (81.7%) |
| Arts, Entertainment & Recreation | 581 (66.1%) | 298 (33.9%) |
| Accommodation & Food Services | 2,131 (49.8%) | 2,144 (50.1%) |
| Public Administration | 587 (42.4%) | 797 (57.6%) |
| Total | 17,779 (49.4%) | 18,231 (50.6%) |
Education in Forrest County
School Enrollment in Forrest County
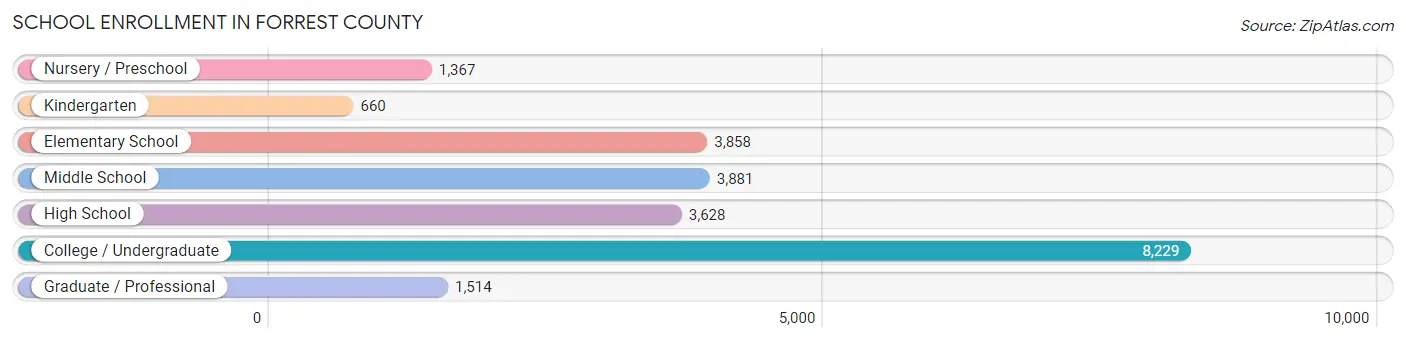
The most common levels of schooling among the 23,137 students in Forrest County are college / undergraduate (8,229 | 35.6%), middle school (3,881 | 16.8%), and elementary school (3,858 | 16.7%).
| School Level | # Students | % Students |
| Nursery / Preschool | 1,367 | 5.9% |
| Kindergarten | 660 | 2.9% |
| Elementary School | 3,858 | 16.7% |
| Middle School | 3,881 | 16.8% |
| High School | 3,628 | 15.7% |
| College / Undergraduate | 8,229 | 35.6% |
| Graduate / Professional | 1,514 | 6.5% |
| Total | 23,137 | 100.0% |
School Enrollment by Age by Funding Source in Forrest County
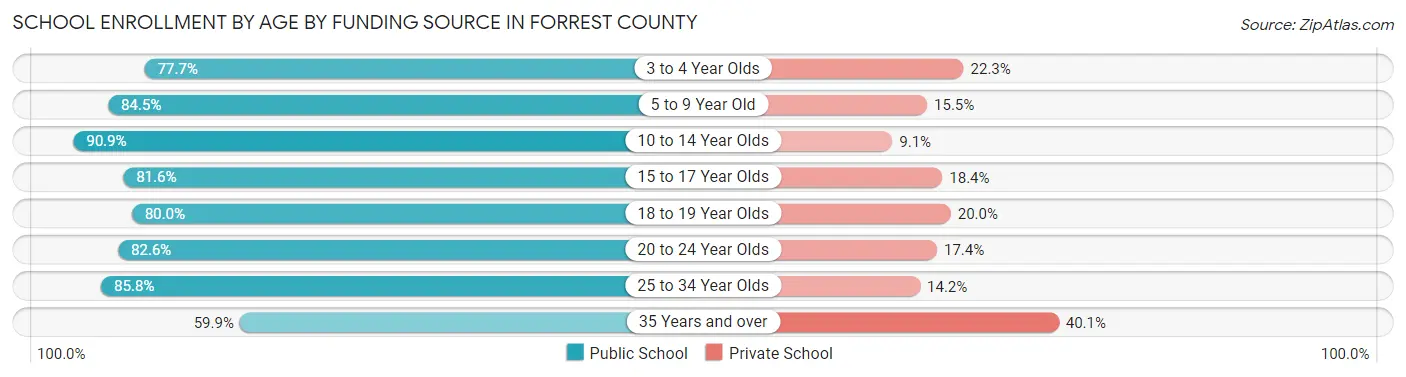
Out of a total of 23,137 students who are enrolled in schools in Forrest County, 3,725 (16.1%) attend a private institution, while the remaining 19,412 (83.9%) are enrolled in public schools. The age group of 35 years and over has the highest likelihood of being enrolled in private schools, with 214 (40.1% in the age bracket) enrolled. Conversely, the age group of 10 to 14 year olds has the lowest likelihood of being enrolled in a private school, with 4,832 (90.9% in the age bracket) attending a public institution.
| Age Bracket | Public School | Private School |
| 3 to 4 Year Olds | 935 (77.7%) | 269 (22.3%) |
| 5 to 9 Year Old | 3,175 (84.5%) | 584 (15.5%) |
| 10 to 14 Year Olds | 4,832 (90.9%) | 482 (9.1%) |
| 15 to 17 Year Olds | 2,242 (81.6%) | 505 (18.4%) |
| 18 to 19 Year Olds | 2,162 (80.0%) | 539 (20.0%) |
| 20 to 24 Year Olds | 4,005 (82.6%) | 843 (17.4%) |
| 25 to 34 Year Olds | 1,741 (85.8%) | 289 (14.2%) |
| 35 Years and over | 320 (59.9%) | 214 (40.1%) |
| Total | 19,412 (83.9%) | 3,725 (16.1%) |
Educational Attainment by Field of Study in Forrest County
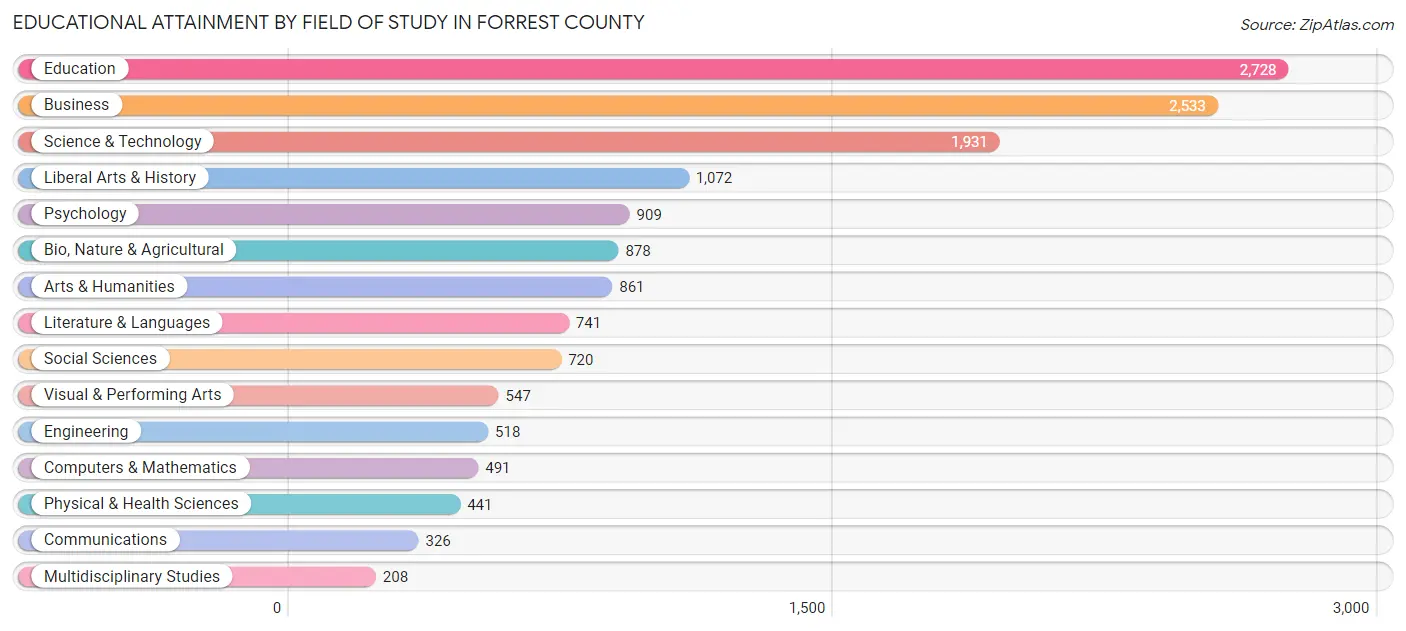
Education (2,728 | 18.3%), business (2,533 | 17.0%), science & technology (1,931 | 13.0%), liberal arts & history (1,072 | 7.2%), and psychology (909 | 6.1%) are the most common fields of study among 14,904 individuals in Forrest County who have obtained a bachelor's degree or higher.
| Field of Study | # Graduates | % Graduates |
| Computers & Mathematics | 491 | 3.3% |
| Bio, Nature & Agricultural | 878 | 5.9% |
| Physical & Health Sciences | 441 | 3.0% |
| Psychology | 909 | 6.1% |
| Social Sciences | 720 | 4.8% |
| Engineering | 518 | 3.5% |
| Multidisciplinary Studies | 208 | 1.4% |
| Science & Technology | 1,931 | 13.0% |
| Business | 2,533 | 17.0% |
| Education | 2,728 | 18.3% |
| Literature & Languages | 741 | 5.0% |
| Liberal Arts & History | 1,072 | 7.2% |
| Visual & Performing Arts | 547 | 3.7% |
| Communications | 326 | 2.2% |
| Arts & Humanities | 861 | 5.8% |
| Total | 14,904 | 100.0% |
Transportation & Commute in Forrest County
Vehicle Availability by Sex in Forrest County
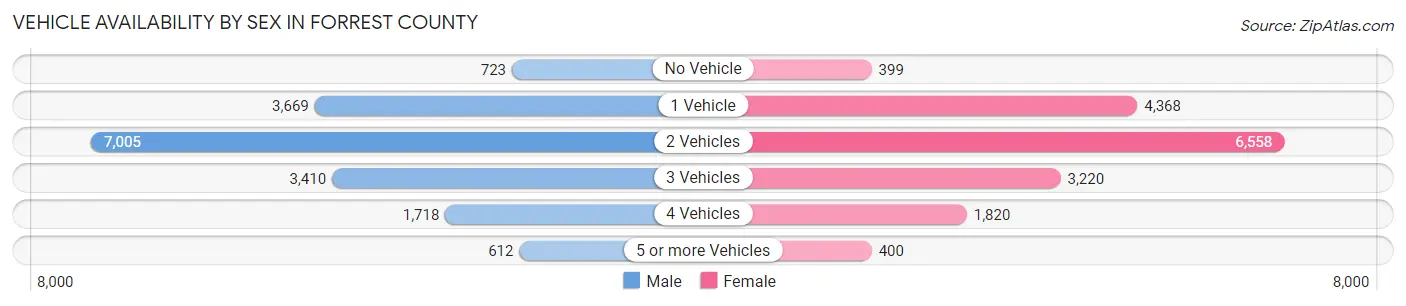
The most prevalent vehicle ownership categories in Forrest County are males with 2 vehicles (7,005, accounting for 40.9%) and females with 2 vehicles (6,558, making up 41.8%).
| Vehicles Available | Male | Female |
| No Vehicle | 723 (4.2%) | 399 (2.4%) |
| 1 Vehicle | 3,669 (21.4%) | 4,368 (26.1%) |
| 2 Vehicles | 7,005 (40.9%) | 6,558 (39.1%) |
| 3 Vehicles | 3,410 (19.9%) | 3,220 (19.2%) |
| 4 Vehicles | 1,718 (10.0%) | 1,820 (10.9%) |
| 5 or more Vehicles | 612 (3.6%) | 400 (2.4%) |
| Total | 17,137 (100.0%) | 16,765 (100.0%) |
Commute Time in Forrest County
The most frequently occuring commute durations in Forrest County are 10 to 14 minutes (8,264 commuters, 23.9%), 15 to 19 minutes (6,600 commuters, 19.1%), and 5 to 9 minutes (4,751 commuters, 13.8%).
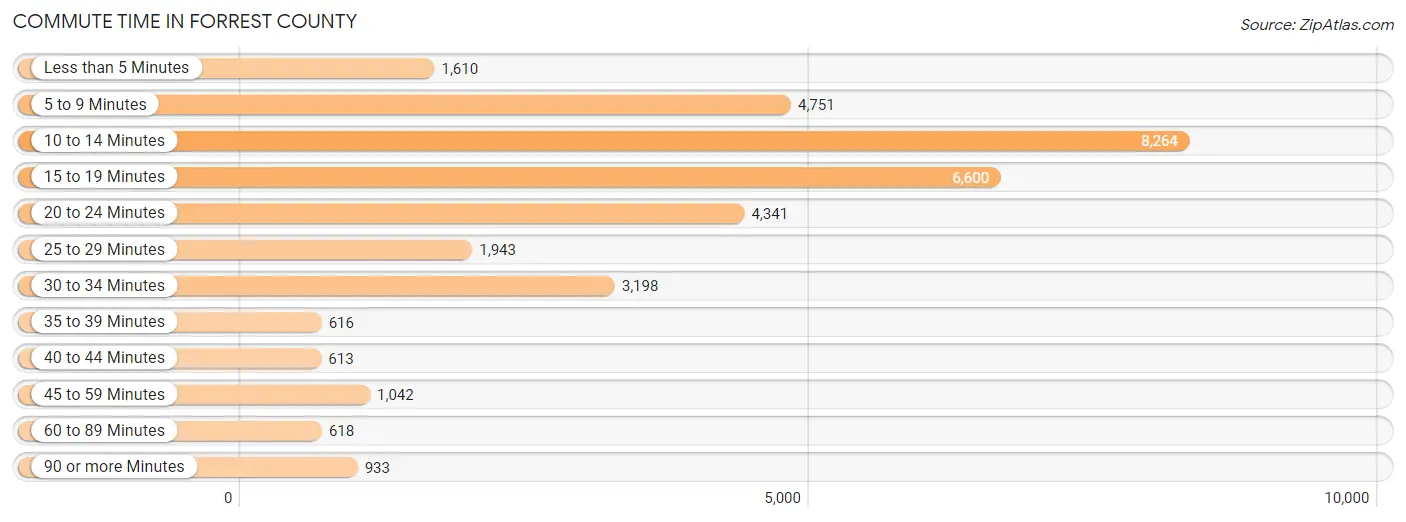
| Commute Time | # Commuters | % Commuters |
| Less than 5 Minutes | 1,610 | 4.7% |
| 5 to 9 Minutes | 4,751 | 13.8% |
| 10 to 14 Minutes | 8,264 | 23.9% |
| 15 to 19 Minutes | 6,600 | 19.1% |
| 20 to 24 Minutes | 4,341 | 12.6% |
| 25 to 29 Minutes | 1,943 | 5.6% |
| 30 to 34 Minutes | 3,198 | 9.3% |
| 35 to 39 Minutes | 616 | 1.8% |
| 40 to 44 Minutes | 613 | 1.8% |
| 45 to 59 Minutes | 1,042 | 3.0% |
| 60 to 89 Minutes | 618 | 1.8% |
| 90 or more Minutes | 933 | 2.7% |
Commute Time by Sex in Forrest County
The most common commute times in Forrest County are 10 to 14 minutes (4,449 commuters, 25.8%) for males and 10 to 14 minutes (3,815 commuters, 22.1%) for females.
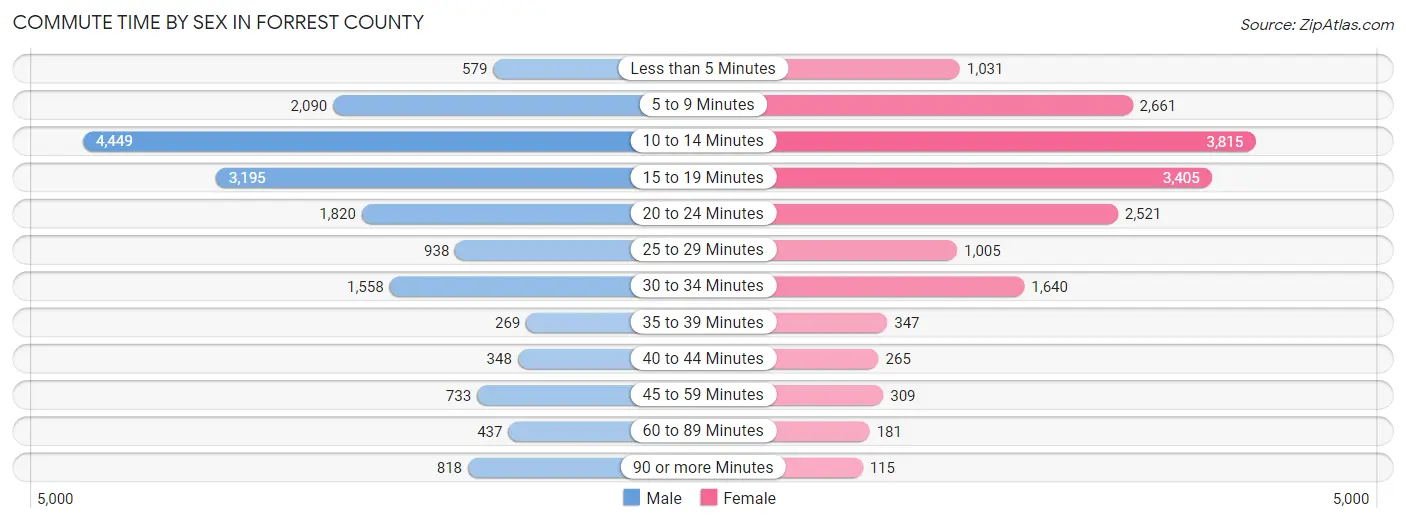
| Commute Time | Male | Female |
| Less than 5 Minutes | 579 (3.4%) | 1,031 (6.0%) |
| 5 to 9 Minutes | 2,090 (12.1%) | 2,661 (15.4%) |
| 10 to 14 Minutes | 4,449 (25.8%) | 3,815 (22.1%) |
| 15 to 19 Minutes | 3,195 (18.5%) | 3,405 (19.7%) |
| 20 to 24 Minutes | 1,820 (10.6%) | 2,521 (14.6%) |
| 25 to 29 Minutes | 938 (5.4%) | 1,005 (5.8%) |
| 30 to 34 Minutes | 1,558 (9.0%) | 1,640 (9.5%) |
| 35 to 39 Minutes | 269 (1.6%) | 347 (2.0%) |
| 40 to 44 Minutes | 348 (2.0%) | 265 (1.5%) |
| 45 to 59 Minutes | 733 (4.3%) | 309 (1.8%) |
| 60 to 89 Minutes | 437 (2.5%) | 181 (1.1%) |
| 90 or more Minutes | 818 (4.8%) | 115 (0.7%) |
Time of Departure to Work by Sex in Forrest County
The most frequent times of departure to work in Forrest County are 6:00 AM to 6:29 AM (2,257, 13.1%) for males and 7:30 AM to 7:59 AM (3,919, 22.7%) for females.
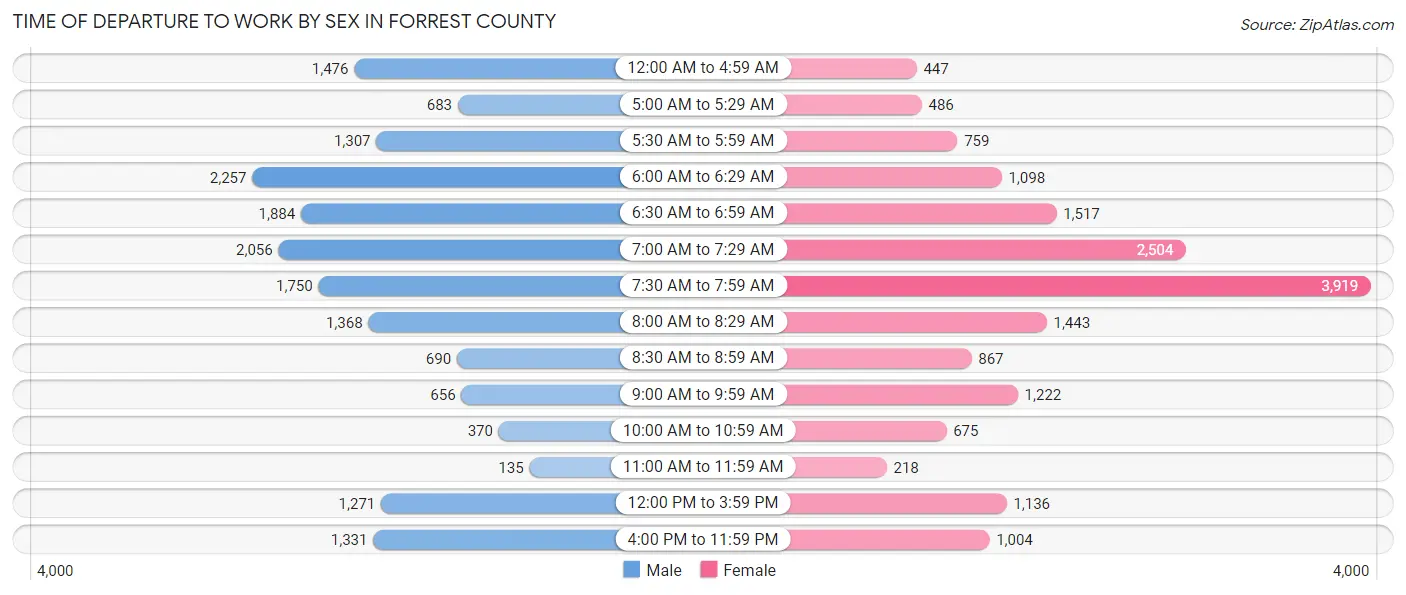
| Time of Departure | Male | Female |
| 12:00 AM to 4:59 AM | 1,476 (8.6%) | 447 (2.6%) |
| 5:00 AM to 5:29 AM | 683 (4.0%) | 486 (2.8%) |
| 5:30 AM to 5:59 AM | 1,307 (7.6%) | 759 (4.4%) |
| 6:00 AM to 6:29 AM | 2,257 (13.1%) | 1,098 (6.4%) |
| 6:30 AM to 6:59 AM | 1,884 (10.9%) | 1,517 (8.8%) |
| 7:00 AM to 7:29 AM | 2,056 (11.9%) | 2,504 (14.5%) |
| 7:30 AM to 7:59 AM | 1,750 (10.2%) | 3,919 (22.7%) |
| 8:00 AM to 8:29 AM | 1,368 (7.9%) | 1,443 (8.3%) |
| 8:30 AM to 8:59 AM | 690 (4.0%) | 867 (5.0%) |
| 9:00 AM to 9:59 AM | 656 (3.8%) | 1,222 (7.1%) |
| 10:00 AM to 10:59 AM | 370 (2.1%) | 675 (3.9%) |
| 11:00 AM to 11:59 AM | 135 (0.8%) | 218 (1.3%) |
| 12:00 PM to 3:59 PM | 1,271 (7.4%) | 1,136 (6.6%) |
| 4:00 PM to 11:59 PM | 1,331 (7.7%) | 1,004 (5.8%) |
| Total | 17,234 (100.0%) | 17,295 (100.0%) |
Housing Occupancy in Forrest County
Occupancy by Ownership in Forrest County
Of the total 29,351 dwellings in Forrest County, owner-occupied units account for 16,406 (55.9%), while renter-occupied units make up 12,945 (44.1%).
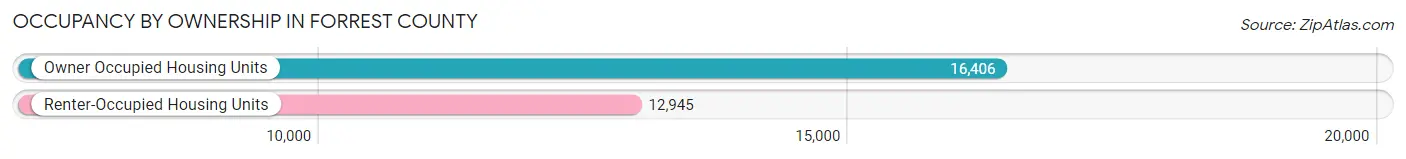
| Occupancy | # Housing Units | % Housing Units |
| Owner Occupied Housing Units | 16,406 | 55.9% |
| Renter-Occupied Housing Units | 12,945 | 44.1% |
| Total Occupied Housing Units | 29,351 | 100.0% |
Occupancy by Household Size in Forrest County
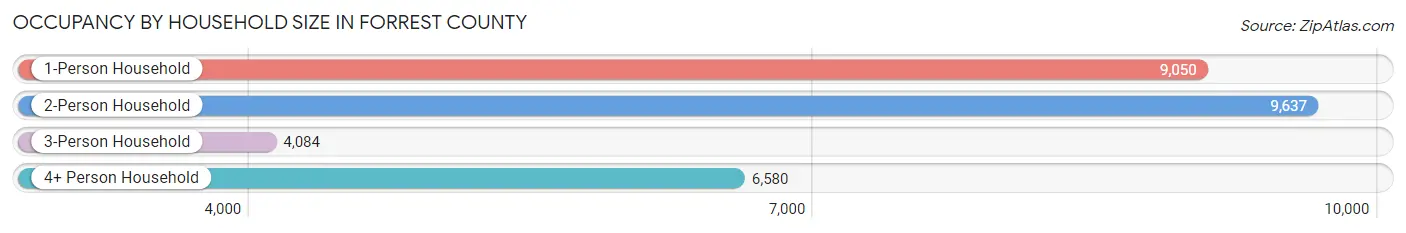
| Household Size | # Housing Units | % Housing Units |
| 1-Person Household | 9,050 | 30.8% |
| 2-Person Household | 9,637 | 32.8% |
| 3-Person Household | 4,084 | 13.9% |
| 4+ Person Household | 6,580 | 22.4% |
| Total Housing Units | 29,351 | 100.0% |
Occupancy by Ownership by Household Size in Forrest County
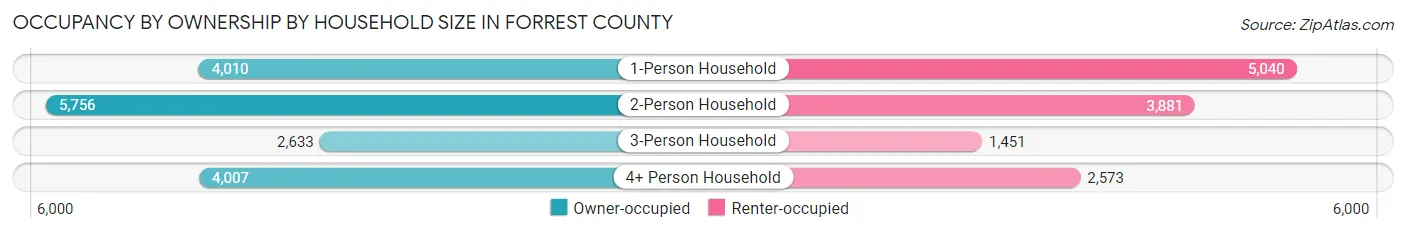
| Household Size | Owner-occupied | Renter-occupied |
| 1-Person Household | 4,010 (44.3%) | 5,040 (55.7%) |
| 2-Person Household | 5,756 (59.7%) | 3,881 (40.3%) |
| 3-Person Household | 2,633 (64.5%) | 1,451 (35.5%) |
| 4+ Person Household | 4,007 (60.9%) | 2,573 (39.1%) |
| Total Housing Units | 16,406 (55.9%) | 12,945 (44.1%) |
Occupancy by Educational Attainment in Forrest County
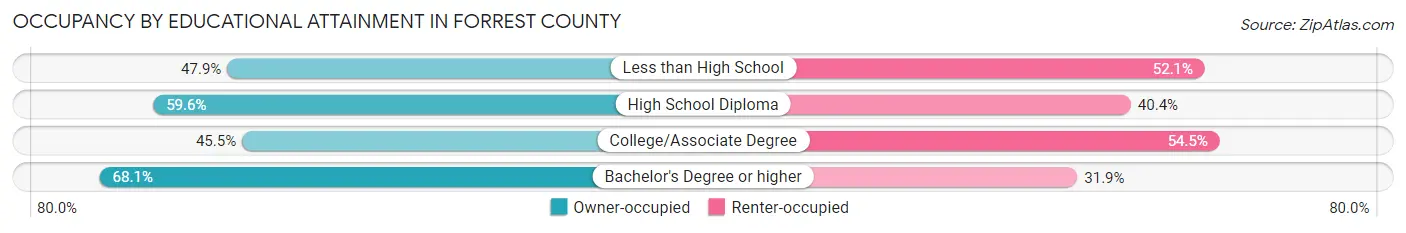
| Household Size | Owner-occupied | Renter-occupied |
| Less than High School | 1,279 (47.9%) | 1,393 (52.1%) |
| High School Diploma | 3,979 (59.6%) | 2,697 (40.4%) |
| College/Associate Degree | 4,984 (45.5%) | 5,966 (54.5%) |
| Bachelor's Degree or higher | 6,164 (68.1%) | 2,889 (31.9%) |
Occupancy by Age of Householder in Forrest County
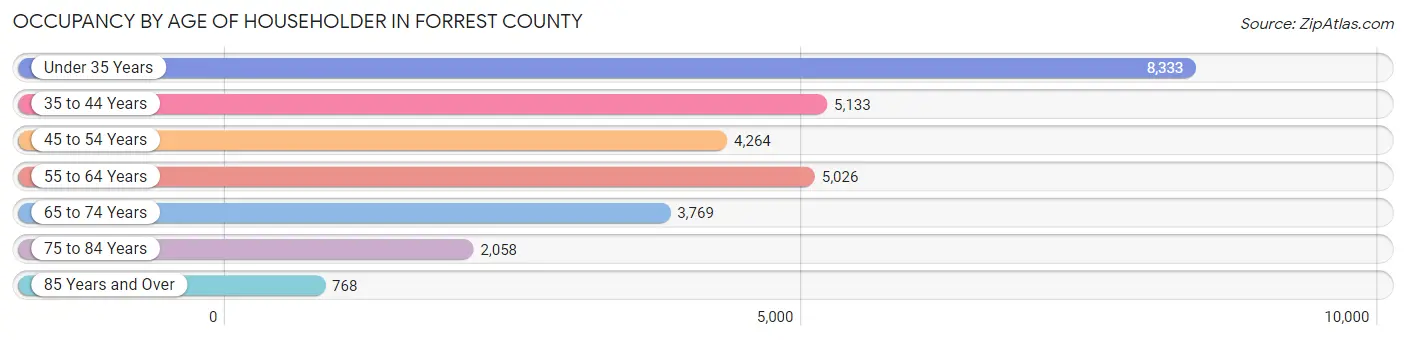
| Age Bracket | # Households | % Households |
| Under 35 Years | 8,333 | 28.4% |
| 35 to 44 Years | 5,133 | 17.5% |
| 45 to 54 Years | 4,264 | 14.5% |
| 55 to 64 Years | 5,026 | 17.1% |
| 65 to 74 Years | 3,769 | 12.8% |
| 75 to 84 Years | 2,058 | 7.0% |
| 85 Years and Over | 768 | 2.6% |
| Total | 29,351 | 100.0% |
Housing Finances in Forrest County
Median Income by Occupancy in Forrest County
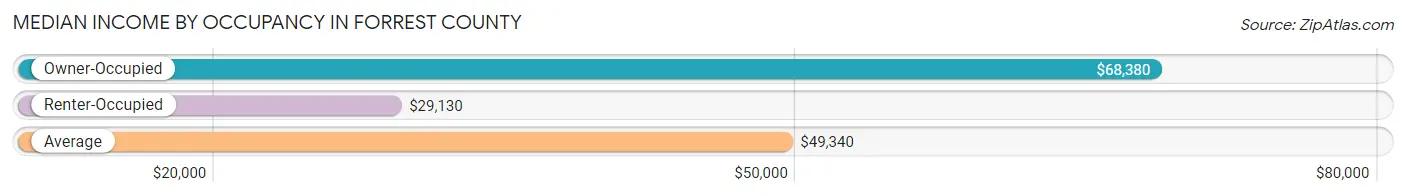
| Occupancy Type | # Households | Median Income |
| Owner-Occupied | 16,406 (55.9%) | $68,380 |
| Renter-Occupied | 12,945 (44.1%) | $29,130 |
| Average | 29,351 (100.0%) | $49,340 |
Occupancy by Householder Income Bracket in Forrest County
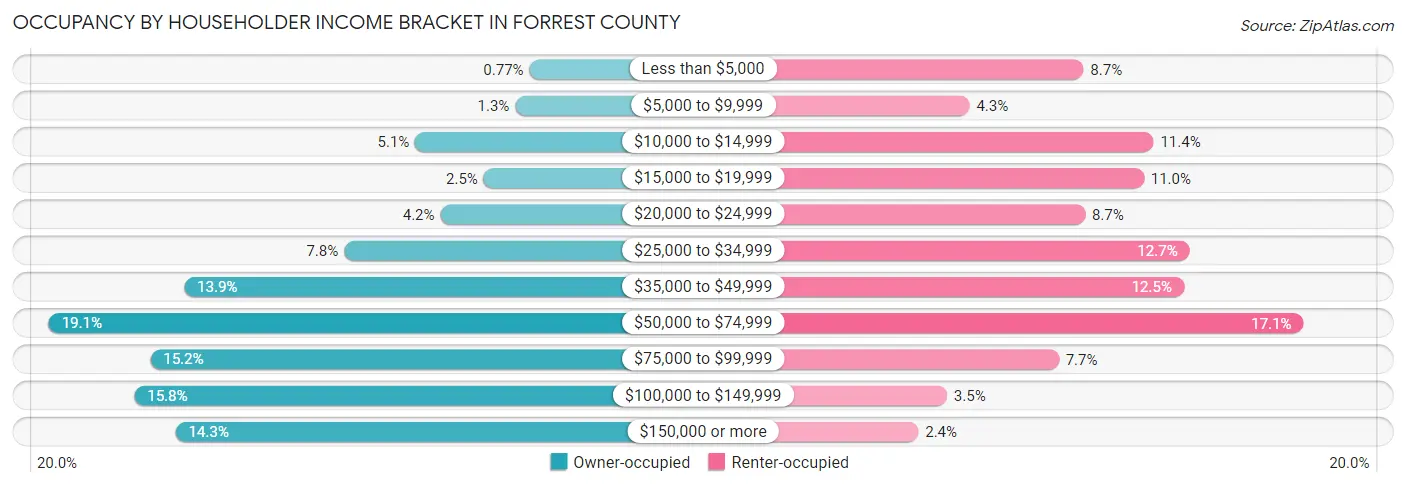
| Income Bracket | Owner-occupied | Renter-occupied |
| Less than $5,000 | 126 (0.8%) | 1,124 (8.7%) |
| $5,000 to $9,999 | 215 (1.3%) | 562 (4.3%) |
| $10,000 to $14,999 | 840 (5.1%) | 1,469 (11.4%) |
| $15,000 to $19,999 | 412 (2.5%) | 1,421 (11.0%) |
| $20,000 to $24,999 | 683 (4.2%) | 1,132 (8.7%) |
| $25,000 to $34,999 | 1,285 (7.8%) | 1,647 (12.7%) |
| $35,000 to $49,999 | 2,284 (13.9%) | 1,618 (12.5%) |
| $50,000 to $74,999 | 3,131 (19.1%) | 2,209 (17.1%) |
| $75,000 to $99,999 | 2,496 (15.2%) | 1,002 (7.7%) |
| $100,000 to $149,999 | 2,596 (15.8%) | 451 (3.5%) |
| $150,000 or more | 2,338 (14.2%) | 310 (2.4%) |
| Total | 16,406 (100.0%) | 12,945 (100.0%) |
Monthly Housing Cost Tiers in Forrest County
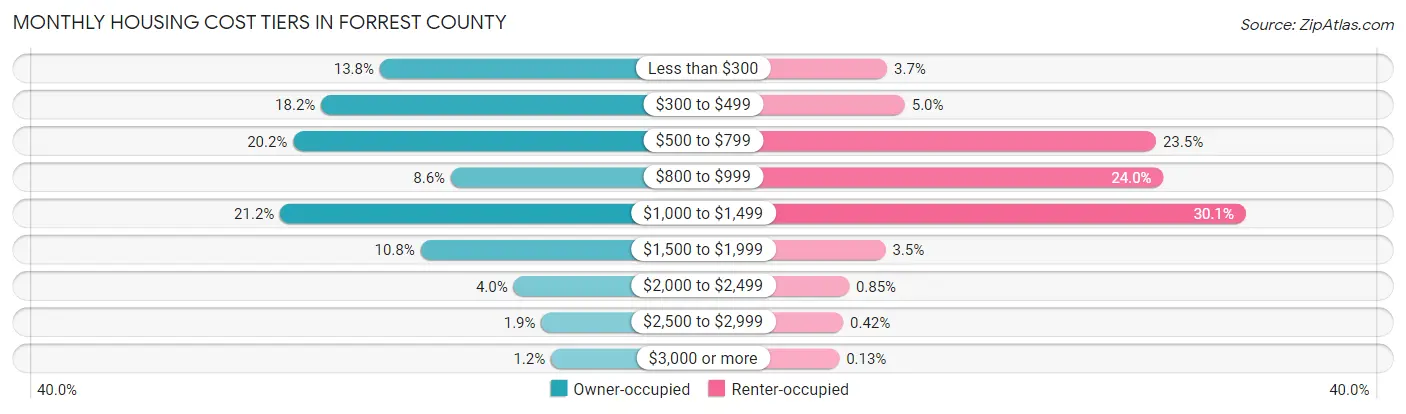
| Monthly Cost | Owner-occupied | Renter-occupied |
| Less than $300 | 2,270 (13.8%) | 474 (3.7%) |
| $300 to $499 | 2,979 (18.2%) | 642 (5.0%) |
| $500 to $799 | 3,317 (20.2%) | 3,037 (23.5%) |
| $800 to $999 | 1,411 (8.6%) | 3,108 (24.0%) |
| $1,000 to $1,499 | 3,475 (21.2%) | 3,892 (30.1%) |
| $1,500 to $1,999 | 1,779 (10.8%) | 458 (3.5%) |
| $2,000 to $2,499 | 655 (4.0%) | 110 (0.9%) |
| $2,500 to $2,999 | 318 (1.9%) | 55 (0.4%) |
| $3,000 or more | 202 (1.2%) | 17 (0.1%) |
| Total | 16,406 (100.0%) | 12,945 (100.0%) |
Physical Housing Characteristics in Forrest County
Housing Structures in Forrest County
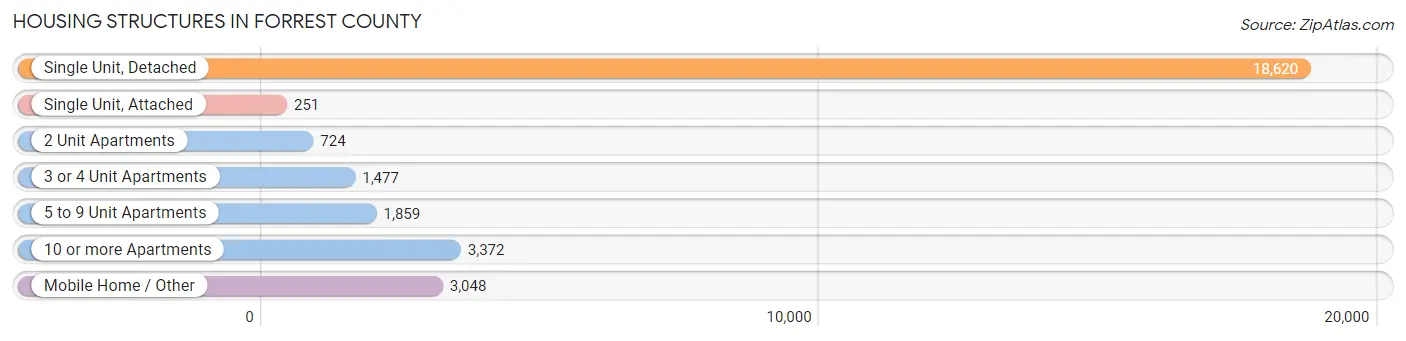
| Structure Type | # Housing Units | % Housing Units |
| Single Unit, Detached | 18,620 | 63.4% |
| Single Unit, Attached | 251 | 0.9% |
| 2 Unit Apartments | 724 | 2.5% |
| 3 or 4 Unit Apartments | 1,477 | 5.0% |
| 5 to 9 Unit Apartments | 1,859 | 6.3% |
| 10 or more Apartments | 3,372 | 11.5% |
| Mobile Home / Other | 3,048 | 10.4% |
| Total | 29,351 | 100.0% |
Housing Structures by Occupancy in Forrest County
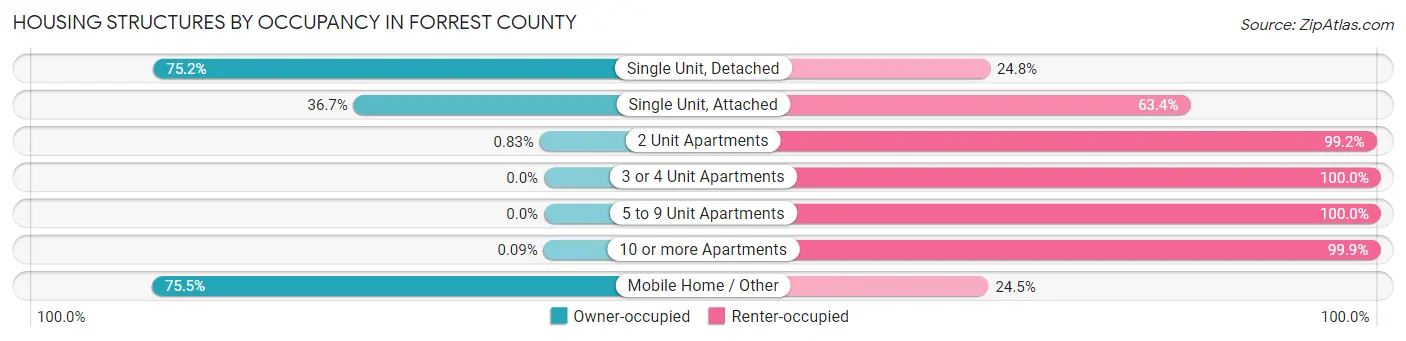
| Structure Type | Owner-occupied | Renter-occupied |
| Single Unit, Detached | 14,004 (75.2%) | 4,616 (24.8%) |
| Single Unit, Attached | 92 (36.6%) | 159 (63.3%) |
| 2 Unit Apartments | 6 (0.8%) | 718 (99.2%) |
| 3 or 4 Unit Apartments | 0 (0.0%) | 1,477 (100.0%) |
| 5 to 9 Unit Apartments | 0 (0.0%) | 1,859 (100.0%) |
| 10 or more Apartments | 3 (0.1%) | 3,369 (99.9%) |
| Mobile Home / Other | 2,301 (75.5%) | 747 (24.5%) |
| Total | 16,406 (55.9%) | 12,945 (44.1%) |
Housing Structures by Number of Rooms in Forrest County
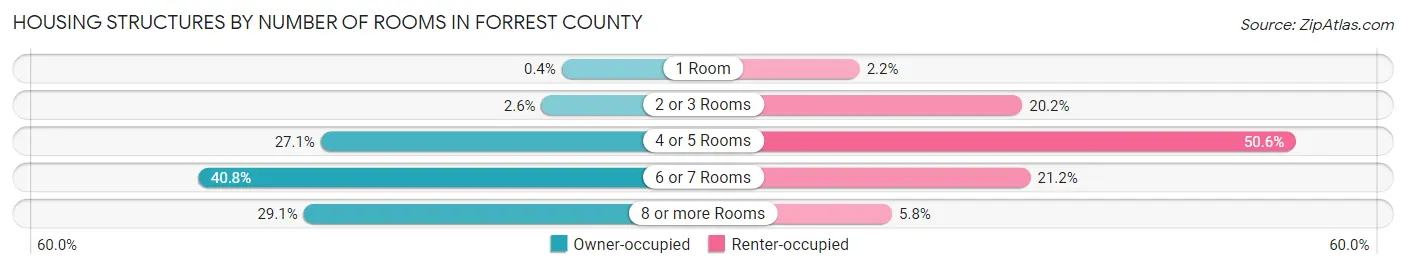
| Number of Rooms | Owner-occupied | Renter-occupied |
| 1 Room | 66 (0.4%) | 285 (2.2%) |
| 2 or 3 Rooms | 433 (2.6%) | 2,620 (20.2%) |
| 4 or 5 Rooms | 4,452 (27.1%) | 6,552 (50.6%) |
| 6 or 7 Rooms | 6,689 (40.8%) | 2,739 (21.2%) |
| 8 or more Rooms | 4,766 (29.0%) | 749 (5.8%) |
| Total | 16,406 (100.0%) | 12,945 (100.0%) |
Housing Structure by Heating Type in Forrest County
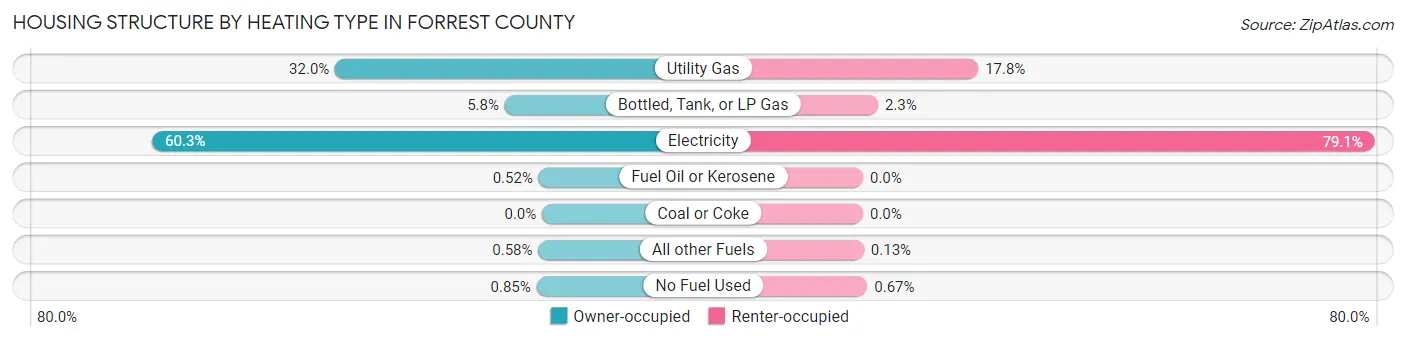
| Heating Type | Owner-occupied | Renter-occupied |
| Utility Gas | 5,249 (32.0%) | 2,304 (17.8%) |
| Bottled, Tank, or LP Gas | 947 (5.8%) | 299 (2.3%) |
| Electricity | 9,889 (60.3%) | 10,238 (79.1%) |
| Fuel Oil or Kerosene | 86 (0.5%) | 0 (0.0%) |
| Coal or Coke | 0 (0.0%) | 0 (0.0%) |
| All other Fuels | 95 (0.6%) | 17 (0.1%) |
| No Fuel Used | 140 (0.9%) | 87 (0.7%) |
| Total | 16,406 (100.0%) | 12,945 (100.0%) |
Household Vehicle Usage in Forrest County
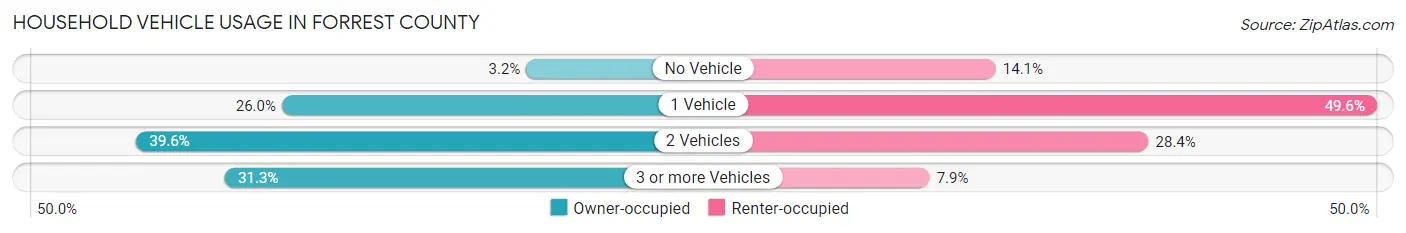
| Vehicles per Household | Owner-occupied | Renter-occupied |
| No Vehicle | 521 (3.2%) | 1,824 (14.1%) |
| 1 Vehicle | 4,264 (26.0%) | 6,426 (49.6%) |
| 2 Vehicles | 6,490 (39.6%) | 3,670 (28.3%) |
| 3 or more Vehicles | 5,131 (31.3%) | 1,025 (7.9%) |
| Total | 16,406 (100.0%) | 12,945 (100.0%) |
Real Estate & Mortgages in Forrest County
Real Estate and Mortgage Overview in Forrest County
| Characteristic | Without Mortgage | With Mortgage |
| Housing Units | 7,617 | 8,789 |
| Median Property Value | $112,100 | $163,100 |
| Median Household Income | $59,169 | $1,742 |
| Monthly Housing Costs | $409 | $202 |
| Real Estate Taxes | $822 | $1,414 |
Property Value by Mortgage Status in Forrest County
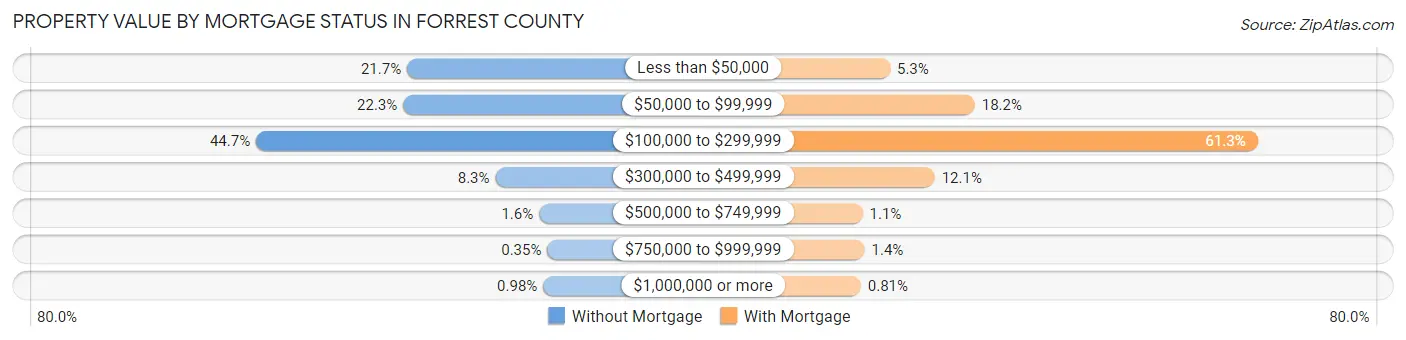
| Property Value | Without Mortgage | With Mortgage |
| Less than $50,000 | 1,655 (21.7%) | 461 (5.2%) |
| $50,000 to $99,999 | 1,700 (22.3%) | 1,597 (18.2%) |
| $100,000 to $299,999 | 3,408 (44.7%) | 5,384 (61.3%) |
| $300,000 to $499,999 | 629 (8.3%) | 1,061 (12.1%) |
| $500,000 to $749,999 | 123 (1.6%) | 94 (1.1%) |
| $750,000 to $999,999 | 27 (0.4%) | 121 (1.4%) |
| $1,000,000 or more | 75 (1.0%) | 71 (0.8%) |
| Total | 7,617 (100.0%) | 8,789 (100.0%) |
Household Income by Mortgage Status in Forrest County
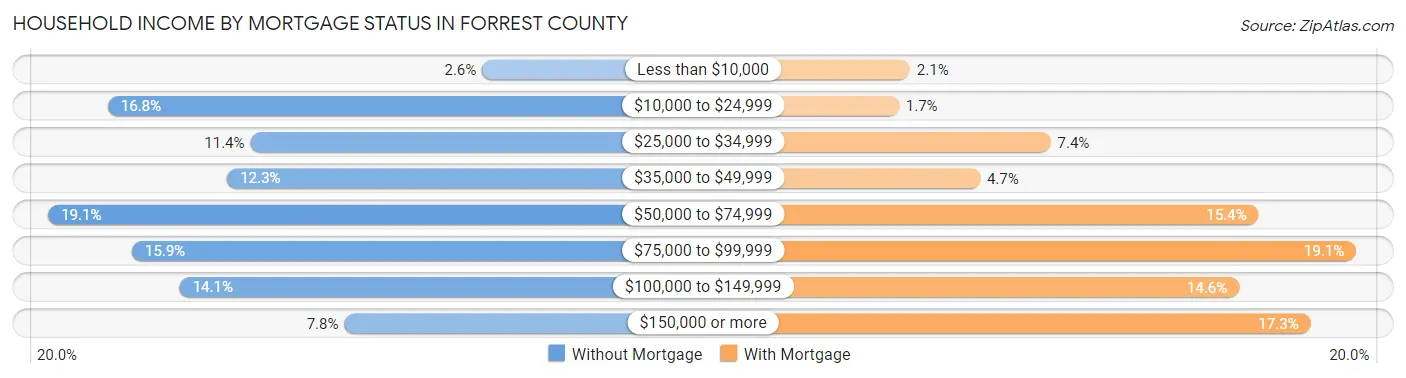
| Household Income | Without Mortgage | With Mortgage |
| Less than $10,000 | 196 (2.6%) | 182 (2.1%) |
| $10,000 to $24,999 | 1,282 (16.8%) | 145 (1.7%) |
| $25,000 to $34,999 | 868 (11.4%) | 653 (7.4%) |
| $35,000 to $49,999 | 935 (12.3%) | 417 (4.7%) |
| $50,000 to $74,999 | 1,455 (19.1%) | 1,349 (15.3%) |
| $75,000 to $99,999 | 1,212 (15.9%) | 1,676 (19.1%) |
| $100,000 to $149,999 | 1,073 (14.1%) | 1,284 (14.6%) |
| $150,000 or more | 596 (7.8%) | 1,523 (17.3%) |
| Total | 7,617 (100.0%) | 8,789 (100.0%) |
Property Value to Household Income Ratio in Forrest County
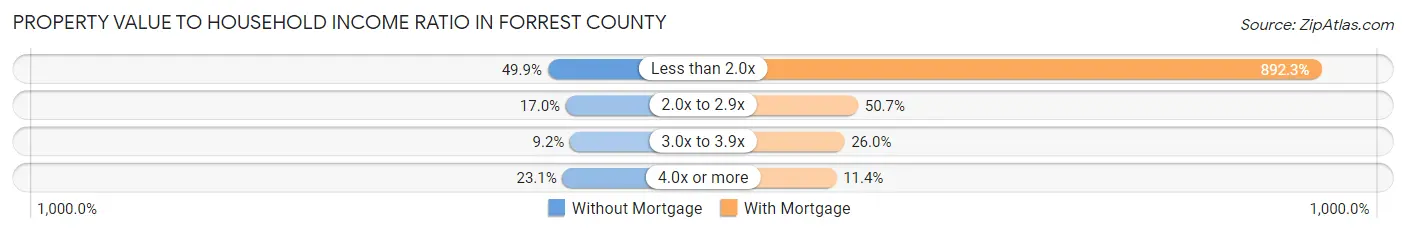
| Value-to-Income Ratio | Without Mortgage | With Mortgage |
| Less than 2.0x | 3,804 (49.9%) | 78,421 (892.3%) |
| 2.0x to 2.9x | 1,291 (17.0%) | 4,453 (50.7%) |
| 3.0x to 3.9x | 698 (9.2%) | 2,288 (26.0%) |
| 4.0x or more | 1,757 (23.1%) | 1,001 (11.4%) |
| Total | 7,617 (100.0%) | 8,789 (100.0%) |
Real Estate Taxes by Mortgage Status in Forrest County
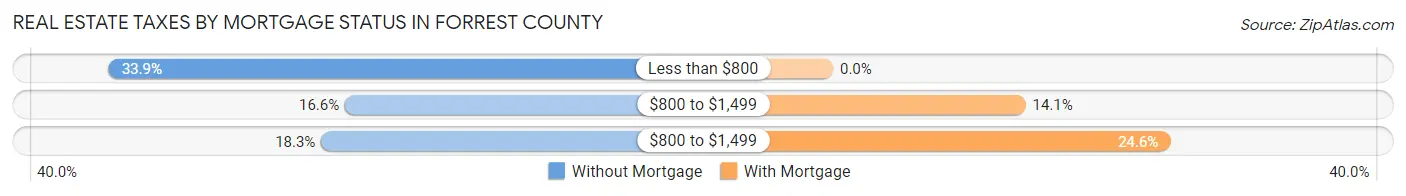
| Property Taxes | Without Mortgage | With Mortgage |
| Less than $800 | 2,578 (33.9%) | 0 (0.0%) |
| $800 to $1,499 | 1,264 (16.6%) | 1,237 (14.1%) |
| $800 to $1,499 | 1,396 (18.3%) | 2,165 (24.6%) |
| Total | 7,617 (100.0%) | 8,789 (100.0%) |
Health & Disability in Forrest County
Health Insurance Coverage by Age in Forrest County
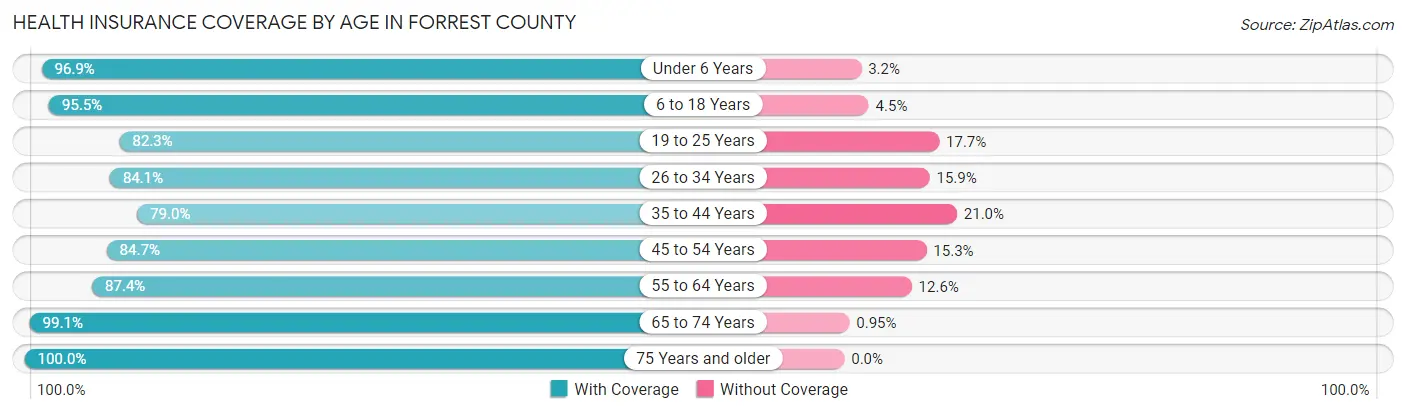
| Age Bracket | With Coverage | Without Coverage |
| Under 6 Years | 5,562 (96.9%) | 181 (3.2%) |
| 6 to 18 Years | 12,647 (95.5%) | 601 (4.5%) |
| 19 to 25 Years | 10,715 (82.3%) | 2,302 (17.7%) |
| 26 to 34 Years | 8,047 (84.1%) | 1,521 (15.9%) |
| 35 to 44 Years | 7,118 (79.0%) | 1,891 (21.0%) |
| 45 to 54 Years | 6,753 (84.7%) | 1,221 (15.3%) |
| 55 to 64 Years | 7,237 (87.4%) | 1,040 (12.6%) |
| 65 to 74 Years | 5,811 (99.1%) | 56 (0.9%) |
| 75 Years and older | 4,436 (100.0%) | 0 (0.0%) |
| Total | 68,326 (88.6%) | 8,813 (11.4%) |
Health Insurance Coverage by Citizenship Status in Forrest County
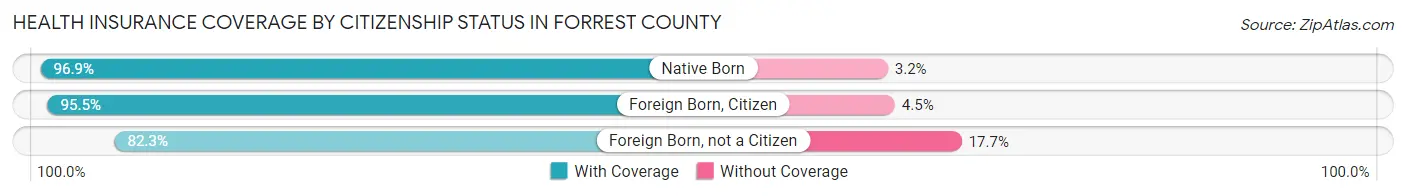
| Citizenship Status | With Coverage | Without Coverage |
| Native Born | 5,562 (96.9%) | 181 (3.2%) |
| Foreign Born, Citizen | 12,647 (95.5%) | 601 (4.5%) |
| Foreign Born, not a Citizen | 10,715 (82.3%) | 2,302 (17.7%) |
Health Insurance Coverage by Household Income in Forrest County
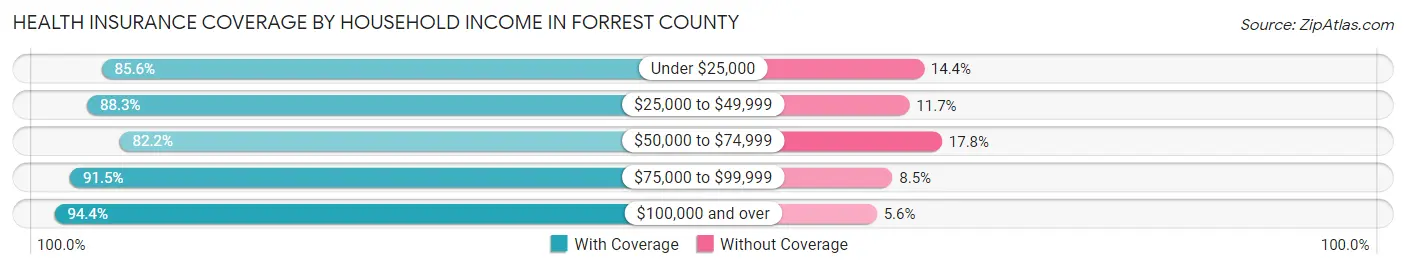
| Household Income | With Coverage | Without Coverage |
| Under $25,000 | 13,105 (85.6%) | 2,211 (14.4%) |
| $25,000 to $49,999 | 13,939 (88.3%) | 1,853 (11.7%) |
| $50,000 to $74,999 | 11,326 (82.2%) | 2,454 (17.8%) |
| $75,000 to $99,999 | 9,380 (91.5%) | 876 (8.5%) |
| $100,000 and over | 17,504 (94.4%) | 1,041 (5.6%) |
Public vs Private Health Insurance Coverage by Age in Forrest County
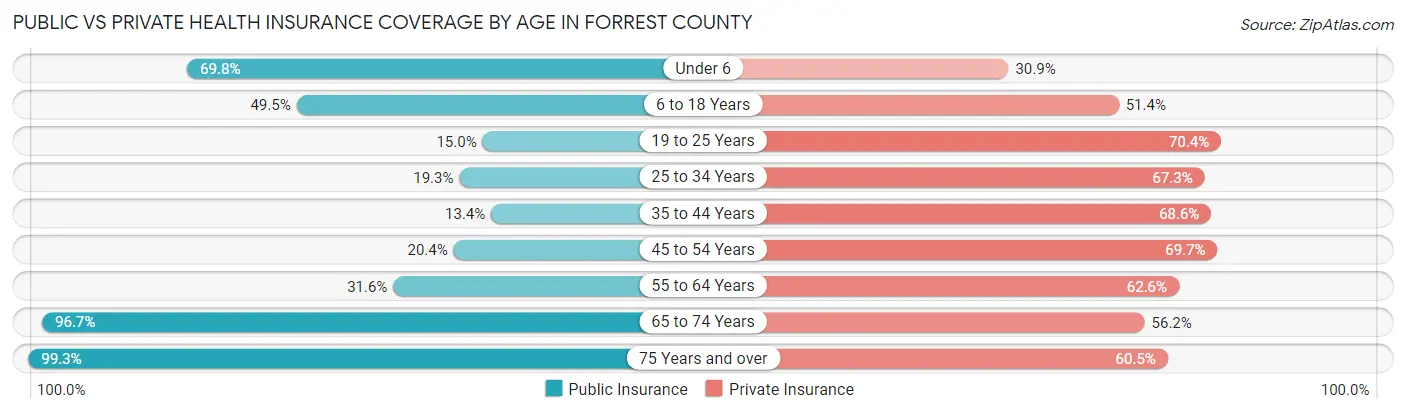
| Age Bracket | Public Insurance | Private Insurance |
| Under 6 | 4,010 (69.8%) | 1,777 (30.9%) |
| 6 to 18 Years | 6,562 (49.5%) | 6,810 (51.4%) |
| 19 to 25 Years | 1,954 (15.0%) | 9,164 (70.4%) |
| 25 to 34 Years | 1,849 (19.3%) | 6,442 (67.3%) |
| 35 to 44 Years | 1,208 (13.4%) | 6,177 (68.6%) |
| 45 to 54 Years | 1,625 (20.4%) | 5,559 (69.7%) |
| 55 to 64 Years | 2,614 (31.6%) | 5,178 (62.6%) |
| 65 to 74 Years | 5,676 (96.7%) | 3,298 (56.2%) |
| 75 Years and over | 4,405 (99.3%) | 2,683 (60.5%) |
| Total | 29,903 (38.8%) | 47,088 (61.0%) |
Disability Status by Sex by Age in Forrest County
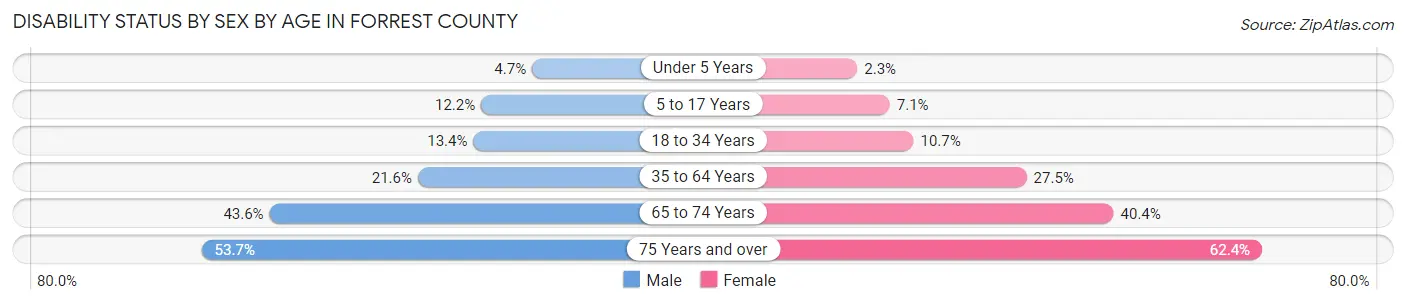
| Age Bracket | Male | Female |
| Under 5 Years | 118 (4.7%) | 55 (2.3%) |
| 5 to 17 Years | 782 (12.2%) | 440 (7.1%) |
| 18 to 34 Years | 1,438 (13.4%) | 1,423 (10.7%) |
| 35 to 64 Years | 2,598 (21.6%) | 3,633 (27.5%) |
| 65 to 74 Years | 1,170 (43.6%) | 1,286 (40.4%) |
| 75 Years and over | 942 (53.7%) | 1,673 (62.4%) |
Disability Class by Sex by Age in Forrest County
Disability Class: Hearing Difficulty
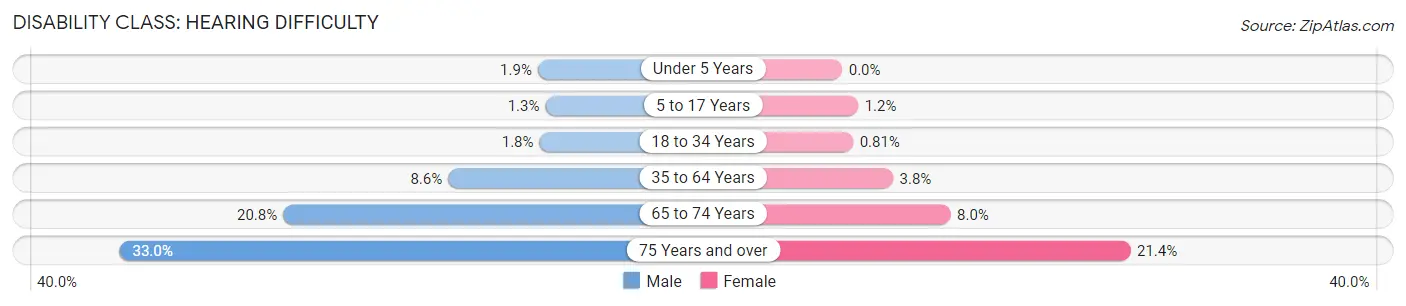
| Age Bracket | Male | Female |
| Under 5 Years | 48 (1.9%) | 0 (0.0%) |
| 5 to 17 Years | 86 (1.3%) | 73 (1.2%) |
| 18 to 34 Years | 191 (1.8%) | 108 (0.8%) |
| 35 to 64 Years | 1,029 (8.6%) | 499 (3.8%) |
| 65 to 74 Years | 558 (20.8%) | 256 (8.0%) |
| 75 Years and over | 578 (33.0%) | 574 (21.4%) |
Disability Class: Vision Difficulty
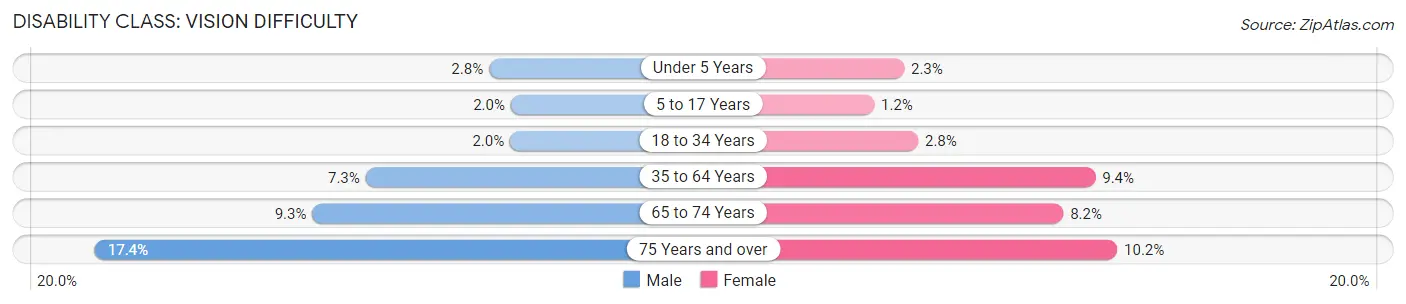
| Age Bracket | Male | Female |
| Under 5 Years | 70 (2.8%) | 55 (2.3%) |
| 5 to 17 Years | 125 (1.9%) | 74 (1.2%) |
| 18 to 34 Years | 213 (2.0%) | 377 (2.8%) |
| 35 to 64 Years | 882 (7.3%) | 1,245 (9.4%) |
| 65 to 74 Years | 250 (9.3%) | 262 (8.2%) |
| 75 Years and over | 305 (17.4%) | 274 (10.2%) |
Disability Class: Cognitive Difficulty
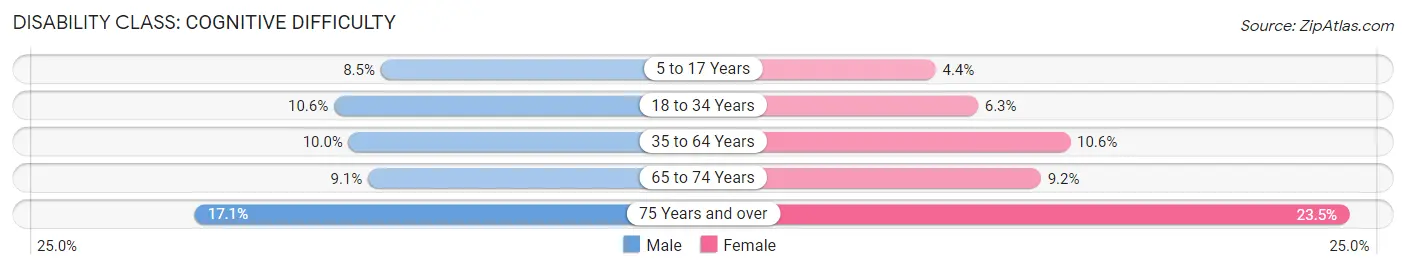
| Age Bracket | Male | Female |
| 5 to 17 Years | 542 (8.5%) | 268 (4.3%) |
| 18 to 34 Years | 1,144 (10.6%) | 842 (6.3%) |
| 35 to 64 Years | 1,197 (10.0%) | 1,402 (10.6%) |
| 65 to 74 Years | 243 (9.1%) | 294 (9.2%) |
| 75 Years and over | 300 (17.1%) | 631 (23.5%) |
Disability Class: Ambulatory Difficulty
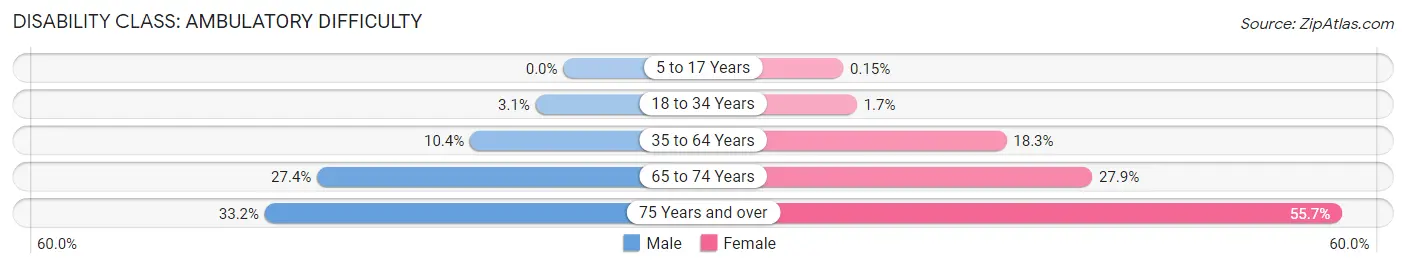
| Age Bracket | Male | Female |
| 5 to 17 Years | 0 (0.0%) | 9 (0.2%) |
| 18 to 34 Years | 331 (3.1%) | 221 (1.7%) |
| 35 to 64 Years | 1,249 (10.4%) | 2,426 (18.3%) |
| 65 to 74 Years | 735 (27.4%) | 888 (27.9%) |
| 75 Years and over | 583 (33.2%) | 1,494 (55.7%) |
Disability Class: Self-Care Difficulty
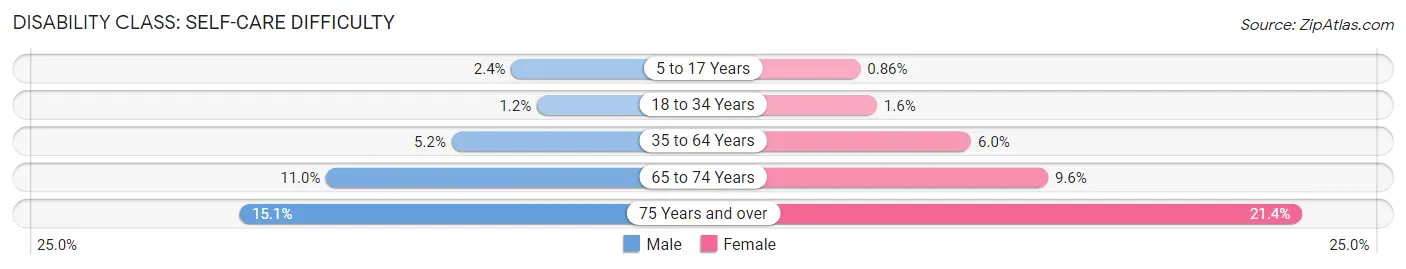
| Age Bracket | Male | Female |
| 5 to 17 Years | 154 (2.4%) | 53 (0.9%) |
| 18 to 34 Years | 131 (1.2%) | 218 (1.6%) |
| 35 to 64 Years | 623 (5.2%) | 794 (6.0%) |
| 65 to 74 Years | 295 (11.0%) | 305 (9.6%) |
| 75 Years and over | 264 (15.0%) | 573 (21.4%) |
Technology Access in Forrest County
Computing Device Access in Forrest County
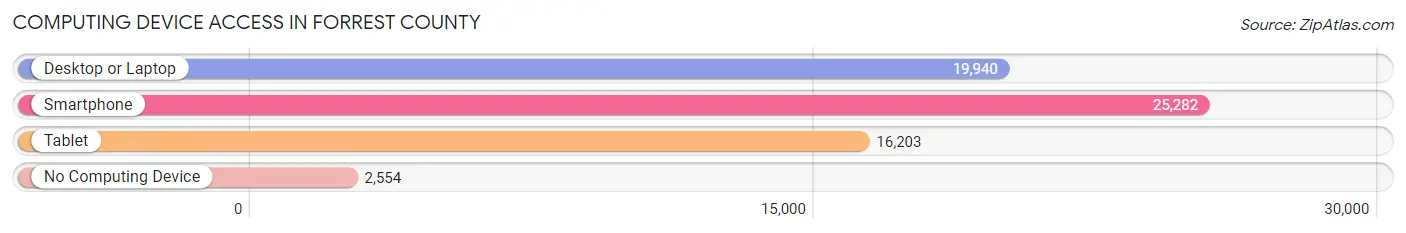
| Device Type | # Households | % Households |
| Desktop or Laptop | 19,940 | 67.9% |
| Smartphone | 25,282 | 86.1% |
| Tablet | 16,203 | 55.2% |
| No Computing Device | 2,554 | 8.7% |
| Total | 29,351 | 100.0% |
Internet Access in Forrest County
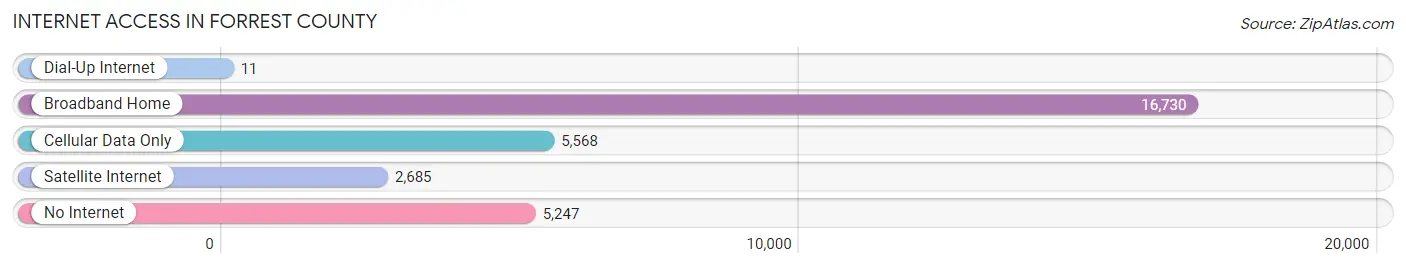
| Internet Type | # Households | % Households |
| Dial-Up Internet | 11 | 0.0% |
| Broadband Home | 16,730 | 57.0% |
| Cellular Data Only | 5,568 | 19.0% |
| Satellite Internet | 2,685 | 9.1% |
| No Internet | 5,247 | 17.9% |
| Total | 29,351 | 100.0% |
Forrest County Summary
Forrest County is located in the southeastern corner of Mississippi, and is part of the Hattiesburg, MS Metropolitan Statistical Area. The county was established in 1908 and is named after Nathan Bedford Forrest, a Confederate general and early leader of the Ku Klux Klan. The county seat is Hattiesburg, and the population was estimated to be 75,837 in 2019.
Geography
Forrest County is located in the southeastern corner of Mississippi, and is bordered by Lamar County to the north, Perry County to the east, Greene County to the south, and Jones County to the west. The county covers an area of 545 square miles, and is mostly flat with some rolling hills. The county is drained by the Leaf and Bouie Rivers, and is part of the Gulf Coastal Plain. The county is home to several state parks, including De Soto National Forest, Paul B. Johnson State Park, and Percy Quin State Park.
Economy
Forrest County has a diverse economy, with the largest employers being the University of Southern Mississippi, Forrest General Hospital, and the Hattiesburg Public School District. Other major employers include the Hattiesburg American newspaper, the Hattiesburg Clinic, and the Hattiesburg Zoo. The county is also home to several manufacturing companies, including the American Greetings Corporation, the Georgia-Pacific Corporation, and the International Paper Company.
Demographics
As of the 2010 census, the population of Forrest County was 74,934, with a population density of 137 people per square mile. The racial makeup of the county was 68.2% White, 28.3% African American, 0.5% Native American, 1.2% Asian, 0.1% Pacific Islander, 0.7% from other races, and 1.9% from two or more races. Hispanic or Latino of any race were 2.2% of the population.
The median income for a household in the county was $37,945, and the median income for a family was $45,945. The per capita income for the county was $20,845. About 17.2% of the population was below the poverty line.
Education
Forrest County is served by the Hattiesburg Public School District, which includes 10 elementary schools, four middle schools, and two high schools. The county is also home to the University of Southern Mississippi, which is a public research university with an enrollment of over 14,000 students. The county is also home to several private schools, including Sacred Heart Catholic School, Presbyterian Christian School, and Oak Grove Academy.
Conclusion
Forrest County is a diverse and vibrant county located in the southeastern corner of Mississippi. The county is home to a diverse economy, with the largest employers being the University of Southern Mississippi, Forrest General Hospital, and the Hattiesburg Public School District. The population of the county is mostly White, with African Americans making up the largest minority group. The county is served by the Hattiesburg Public School District, as well as several private schools and the University of Southern Mississippi.
Common Questions
What is Per Capita Income in Forrest County?
Per Capita income in Forrest County is $28,197.
What is the Median Family Income in Forrest County?
Median Family Income in Forrest County is $62,016.
What is the Median Household income in Forrest County?
Median Household Income in Forrest County is $49,340.
What is Income or Wage Gap in Forrest County?
Income or Wage Gap in Forrest County is 31.1%.
Women in Forrest County earn 68.9 cents for every dollar earned by a man.
What is Family Income Deficit in Forrest County?
Family Income Deficit in Forrest County is $12,371.
Families that are below poverty line in Forrest County earn $12,371 less on average than the poverty threshold level.
What is Inequality or Gini Index in Forrest County?
Inequality or Gini Index in Forrest County is 0.50.
What is the Total Population of Forrest County?
Total Population of Forrest County is 77,917.
What is the Total Male Population of Forrest County?
Total Male Population of Forrest County is 36,624.
What is the Total Female Population of Forrest County?
Total Female Population of Forrest County is 41,293.
What is the Ratio of Males per 100 Females in Forrest County?
There are 88.69 Males per 100 Females in Forrest County.
What is the Ratio of Females per 100 Males in Forrest County?
There are 112.75 Females per 100 Males in Forrest County.
What is the Median Population Age in Forrest County?
Median Population Age in Forrest County is 31.9 Years.
What is the Average Family Size in Forrest County
Average Family Size in Forrest County is 3.2 People.
What is the Average Household Size in Forrest County
Average Household Size in Forrest County is 2.5 People.
How Large is the Labor Force in Forrest County?
There are 39,070 People in the Labor Forcein in Forrest County.
What is the Percentage of People in the Labor Force in Forrest County?
62.7% of People are in the Labor Force in Forrest County.
What is the Unemployment Rate in Forrest County?
Unemployment Rate in Forrest County is 7.4%.