DeSoto County, MS Map & Demographics
DeSoto County Overview
$34,989
PER CAPITA INCOME
$90,760
AVG FAMILY INCOME
$79,666
AVG HOUSEHOLD INCOME
22.4%
WAGE / INCOME GAP [ % ]
77.6¢/ $1
WAGE / INCOME GAP [ $ ]
$13,222
FAMILY INCOME DEFICIT
0.40
INEQUALITY / GINI INDEX
186,214
TOTAL POPULATION
90,194
MALE POPULATION
96,020
FEMALE POPULATION
93.93
MALES / 100 FEMALES
106.46
FEMALES / 100 MALES
37.1
MEDIAN AGE
3.2
AVG FAMILY SIZE
2.7
AVG HOUSEHOLD SIZE
98,063
LABOR FORCE [ PEOPLE ]
67.6%
PERCENT IN LABOR FORCE
4.4%
UNEMPLOYMENT RATE
DeSoto County Area Codes
Income in DeSoto County
Income Overview in DeSoto County
Per Capita Income in DeSoto County is $34,989, while median incomes of families and households are $90,760 and $79,666 respectively.
| Characteristic | Number | Measure |
| Per Capita Income | 186,214 | $34,989 |
| Median Family Income | 50,427 | $90,760 |
| Mean Family Income | 50,427 | $105,149 |
| Median Household Income | 68,353 | $79,666 |
| Mean Household Income | 68,353 | $94,033 |
| Income Deficit | 50,427 | $13,222 |
| Wage / Income Gap (%) | 186,214 | 22.37% |
| Wage / Income Gap ($) | 186,214 | 77.63¢ per $1 |
| Gini / Inequality Index | 186,214 | 0.40 |
Earnings by Sex in DeSoto County
Average Earnings in DeSoto County are $44,040, $49,123 for men and $38,136 for women, a difference of 22.4%.
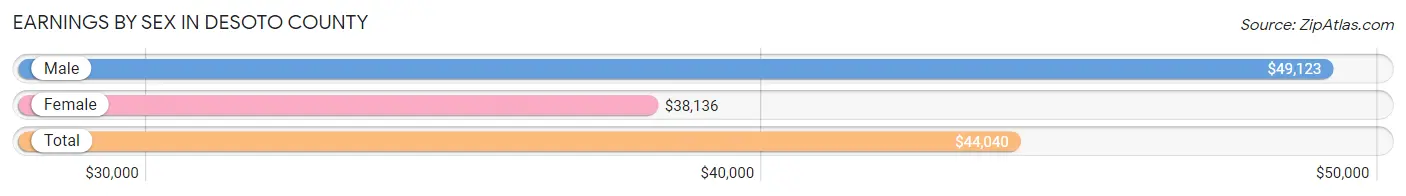
| Sex | Number | Average Earnings |
| Male | 52,771 (51.6%) | $49,123 |
| Female | 49,526 (48.4%) | $38,136 |
| Total | 102,297 (100.0%) | $44,040 |
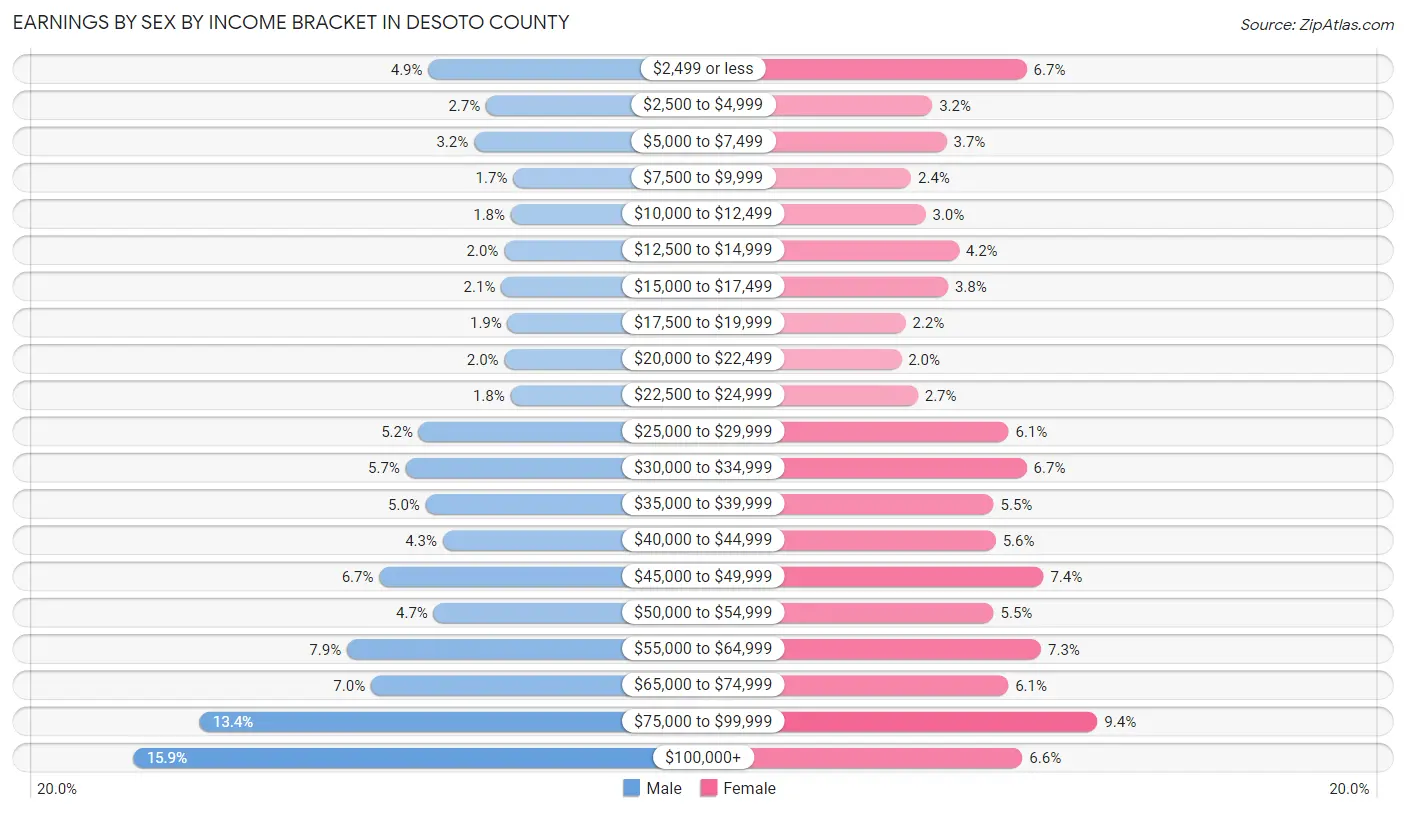
Earnings by Sex by Income Bracket in DeSoto County
The most common earnings brackets in DeSoto County are $100,000+ for men (8,397 | 15.9%) and $75,000 to $99,999 for women (4,650 | 9.4%).
| Income | Male | Female |
| $2,499 or less | 2,568 (4.9%) | 3,338 (6.7%) |
| $2,500 to $4,999 | 1,429 (2.7%) | 1,586 (3.2%) |
| $5,000 to $7,499 | 1,670 (3.2%) | 1,852 (3.7%) |
| $7,500 to $9,999 | 892 (1.7%) | 1,192 (2.4%) |
| $10,000 to $12,499 | 938 (1.8%) | 1,462 (2.9%) |
| $12,500 to $14,999 | 1,071 (2.0%) | 2,082 (4.2%) |
| $15,000 to $17,499 | 1,130 (2.1%) | 1,878 (3.8%) |
| $17,500 to $19,999 | 1,002 (1.9%) | 1,090 (2.2%) |
| $20,000 to $22,499 | 1,066 (2.0%) | 1,011 (2.0%) |
| $22,500 to $24,999 | 944 (1.8%) | 1,319 (2.7%) |
| $25,000 to $29,999 | 2,760 (5.2%) | 3,001 (6.1%) |
| $30,000 to $34,999 | 3,016 (5.7%) | 3,338 (6.7%) |
| $35,000 to $39,999 | 2,623 (5.0%) | 2,723 (5.5%) |
| $40,000 to $44,999 | 2,285 (4.3%) | 2,765 (5.6%) |
| $45,000 to $49,999 | 3,543 (6.7%) | 3,650 (7.4%) |
| $50,000 to $54,999 | 2,464 (4.7%) | 2,726 (5.5%) |
| $55,000 to $64,999 | 4,180 (7.9%) | 3,607 (7.3%) |
| $65,000 to $74,999 | 3,705 (7.0%) | 2,998 (6.0%) |
| $75,000 to $99,999 | 7,088 (13.4%) | 4,650 (9.4%) |
| $100,000+ | 8,397 (15.9%) | 3,258 (6.6%) |
| Total | 52,771 (100.0%) | 49,526 (100.0%) |
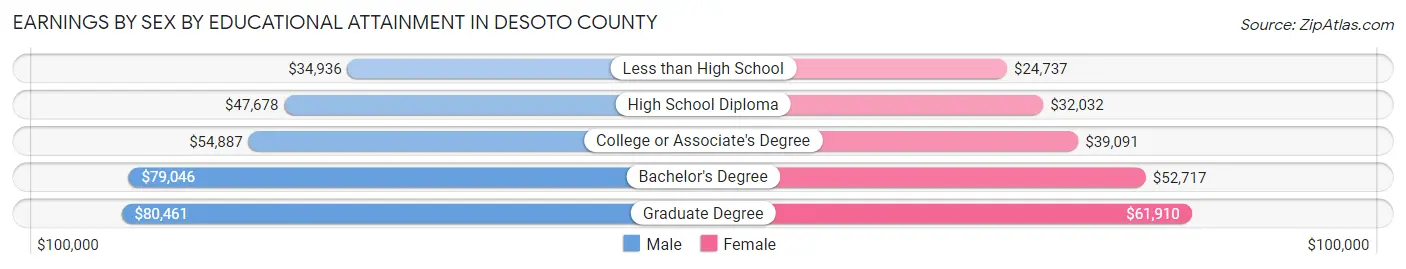
Earnings by Sex by Educational Attainment in DeSoto County
Average earnings in DeSoto County are $55,894 for men and $43,822 for women, a difference of 21.6%. Men with an educational attainment of graduate degree enjoy the highest average annual earnings of $80,461, while those with less than high school education earn the least with $34,936. Women with an educational attainment of graduate degree earn the most with the average annual earnings of $61,910, while those with less than high school education have the smallest earnings of $24,737.
| Educational Attainment | Male Income | Female Income |
| Less than High School | $34,936 | $24,737 |
| High School Diploma | $47,678 | $32,032 |
| College or Associate's Degree | $54,887 | $39,091 |
| Bachelor's Degree | $79,046 | $52,717 |
| Graduate Degree | $80,461 | $61,910 |
| Total | $55,894 | $43,822 |
Family Income in DeSoto County
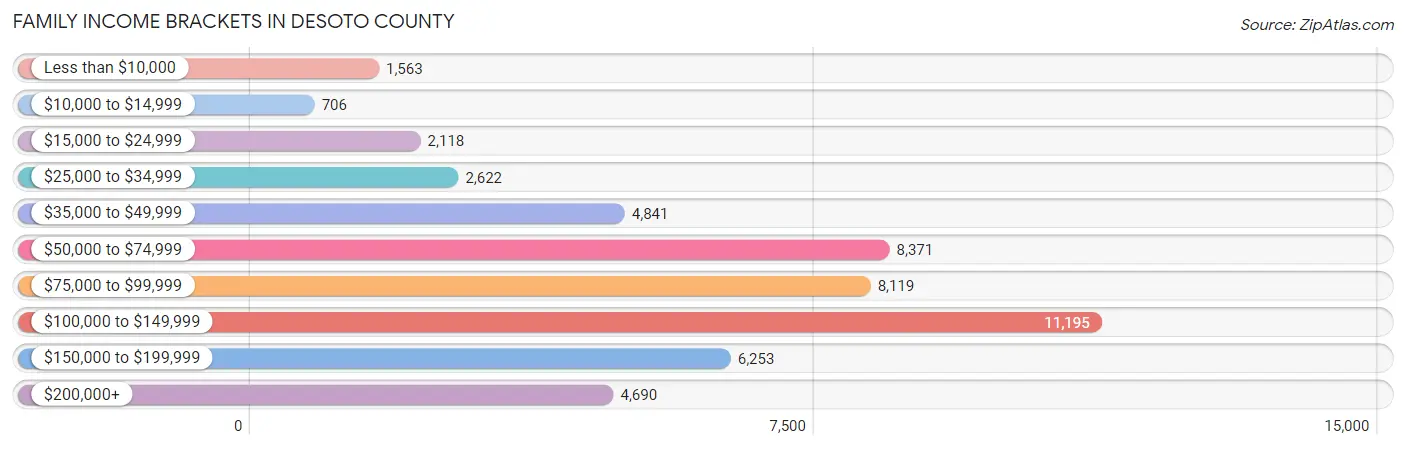
Family Income Brackets in DeSoto County
According to the DeSoto County family income data, there are 11,195 families falling into the $100,000 to $149,999 income range, which is the most common income bracket and makes up 22.2% of all families. Conversely, the $10,000 to $14,999 income bracket is the least frequent group with only 706 families (1.4%) belonging to this category.
| Income Bracket | # Families | % Families |
| Less than $10,000 | 1,563 | 3.1% |
| $10,000 to $14,999 | 706 | 1.4% |
| $15,000 to $24,999 | 2,118 | 4.2% |
| $25,000 to $34,999 | 2,622 | 5.2% |
| $35,000 to $49,999 | 4,841 | 9.6% |
| $50,000 to $74,999 | 8,371 | 16.6% |
| $75,000 to $99,999 | 8,119 | 16.1% |
| $100,000 to $149,999 | 11,195 | 22.2% |
| $150,000 to $199,999 | 6,253 | 12.4% |
| $200,000+ | 4,690 | 9.3% |
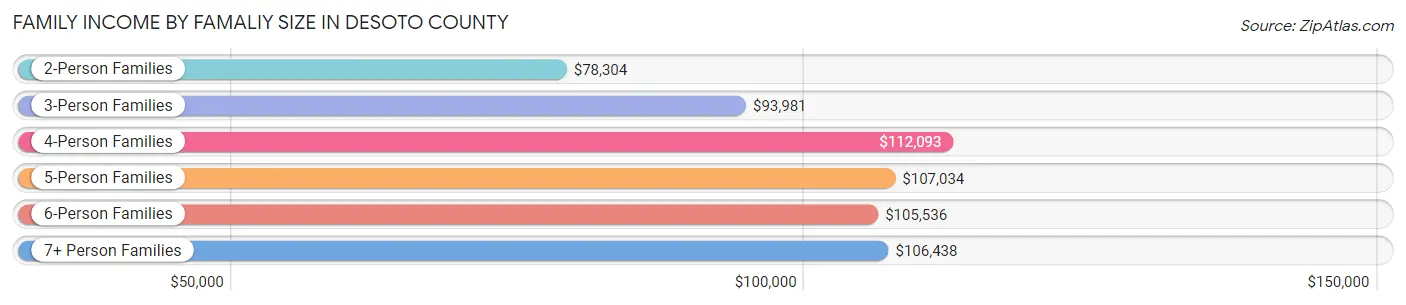
Family Income by Famaliy Size in DeSoto County
4-person families (9,924 | 19.7%) account for the highest median family income in DeSoto County with $112,093 per family, while 2-person families (20,456 | 40.6%) have the highest median income of $39,152 per family member.
| Income Bracket | # Families | Median Income |
| 2-Person Families | 20,456 (40.6%) | $78,304 |
| 3-Person Families | 12,629 (25.0%) | $93,981 |
| 4-Person Families | 9,924 (19.7%) | $112,093 |
| 5-Person Families | 4,883 (9.7%) | $107,034 |
| 6-Person Families | 1,600 (3.2%) | $105,536 |
| 7+ Person Families | 935 (1.8%) | $106,438 |
| Total | 50,427 (100.0%) | $90,760 |
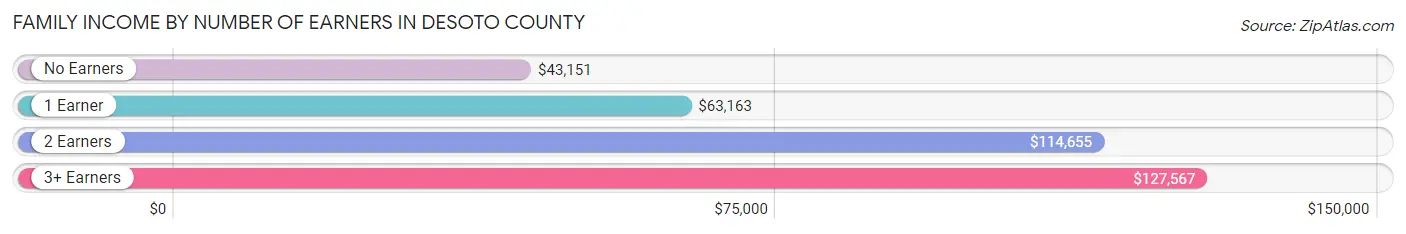
Family Income by Number of Earners in DeSoto County
The median family income in DeSoto County is $90,760, with families comprising 3+ earners (7,087) having the highest median family income of $127,567, while families with no earners (5,408) have the lowest median family income of $43,151, accounting for 14.1% and 10.7% of families, respectively.
| Number of Earners | # Families | Median Income |
| No Earners | 5,408 (10.7%) | $43,151 |
| 1 Earner | 16,293 (32.3%) | $63,163 |
| 2 Earners | 21,639 (42.9%) | $114,655 |
| 3+ Earners | 7,087 (14.1%) | $127,567 |
| Total | 50,427 (100.0%) | $90,760 |
Household Income in DeSoto County
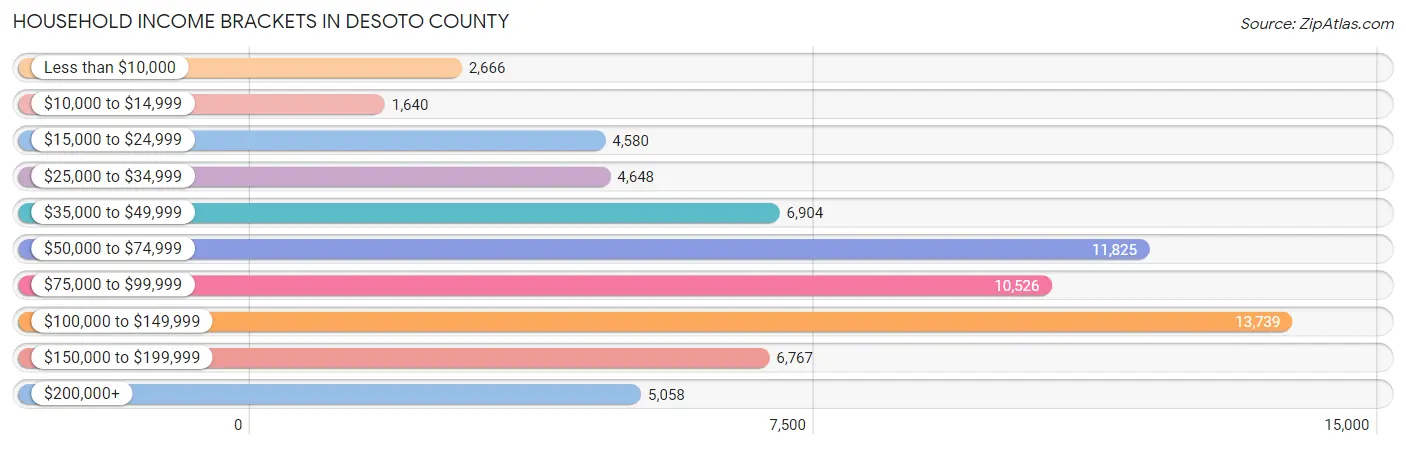
Household Income Brackets in DeSoto County
With 13,739 households falling in the category, the $100,000 to $149,999 income range is the most frequent in DeSoto County, accounting for 20.1% of all households. In contrast, only 1,640 households (2.4%) fall into the $10,000 to $14,999 income bracket, making it the least populous group.
| Income Bracket | # Households | % Households |
| Less than $10,000 | 2,666 | 3.9% |
| $10,000 to $14,999 | 1,640 | 2.4% |
| $15,000 to $24,999 | 4,580 | 6.7% |
| $25,000 to $34,999 | 4,648 | 6.8% |
| $35,000 to $49,999 | 6,904 | 10.1% |
| $50,000 to $74,999 | 11,825 | 17.3% |
| $75,000 to $99,999 | 10,526 | 15.4% |
| $100,000 to $149,999 | 13,739 | 20.1% |
| $150,000 to $199,999 | 6,767 | 9.9% |
| $200,000+ | 5,058 | 7.4% |
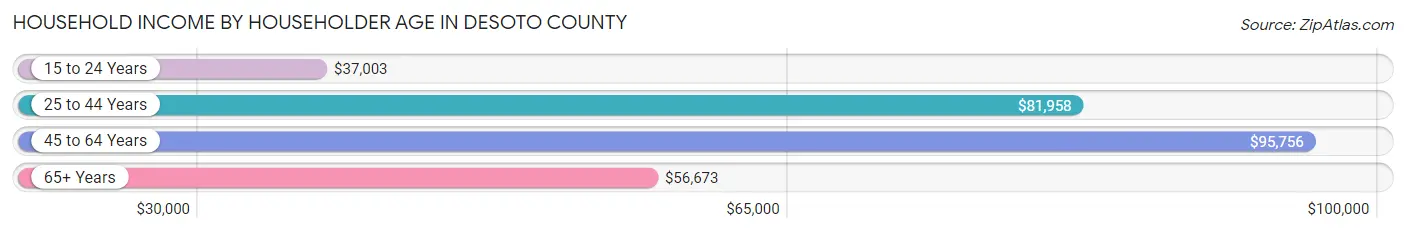
Household Income by Householder Age in DeSoto County
The median household income in DeSoto County is $79,666, with the highest median household income of $95,756 found in the 45 to 64 years age bracket for the primary householder. A total of 26,774 households (39.2%) fall into this category. Meanwhile, the 15 to 24 years age bracket for the primary householder has the lowest median household income of $37,003, with 1,971 households (2.9%) in this group.
| Income Bracket | # Households | Median Income |
| 15 to 24 Years | 1,971 (2.9%) | $37,003 |
| 25 to 44 Years | 24,864 (36.4%) | $81,958 |
| 45 to 64 Years | 26,774 (39.2%) | $95,756 |
| 65+ Years | 14,744 (21.6%) | $56,673 |
| Total | 68,353 (100.0%) | $79,666 |
Poverty in DeSoto County
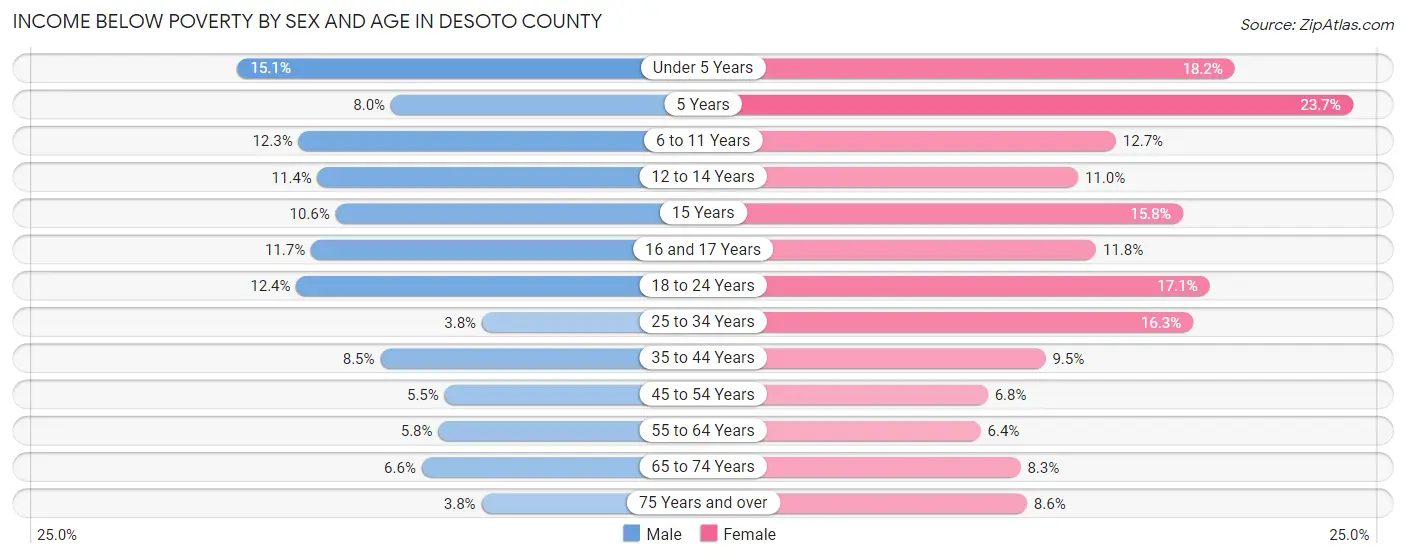
Income Below Poverty by Sex and Age in DeSoto County
With 8.2% poverty level for males and 11.3% for females among the residents of DeSoto County, under 5 year old males and 5 year old females are the most vulnerable to poverty, with 819 males (15.1%) and 365 females (23.7%) in their respective age groups living below the poverty level.
| Age Bracket | Male | Female |
| Under 5 Years | 819 (15.1%) | 913 (18.2%) |
| 5 Years | 71 (8.0%) | 365 (23.7%) |
| 6 to 11 Years | 955 (12.3%) | 911 (12.7%) |
| 12 to 14 Years | 556 (11.4%) | 479 (11.0%) |
| 15 Years | 200 (10.6%) | 222 (15.8%) |
| 16 and 17 Years | 326 (11.7%) | 347 (11.8%) |
| 18 to 24 Years | 1,069 (12.4%) | 1,396 (17.1%) |
| 25 to 34 Years | 429 (3.8%) | 2,006 (16.3%) |
| 35 to 44 Years | 1,032 (8.5%) | 1,311 (9.5%) |
| 45 to 54 Years | 675 (5.5%) | 909 (6.8%) |
| 55 to 64 Years | 624 (5.8%) | 729 (6.4%) |
| 65 to 74 Years | 454 (6.6%) | 679 (8.3%) |
| 75 Years and over | 139 (3.8%) | 467 (8.6%) |
| Total | 7,349 (8.2%) | 10,734 (11.3%) |
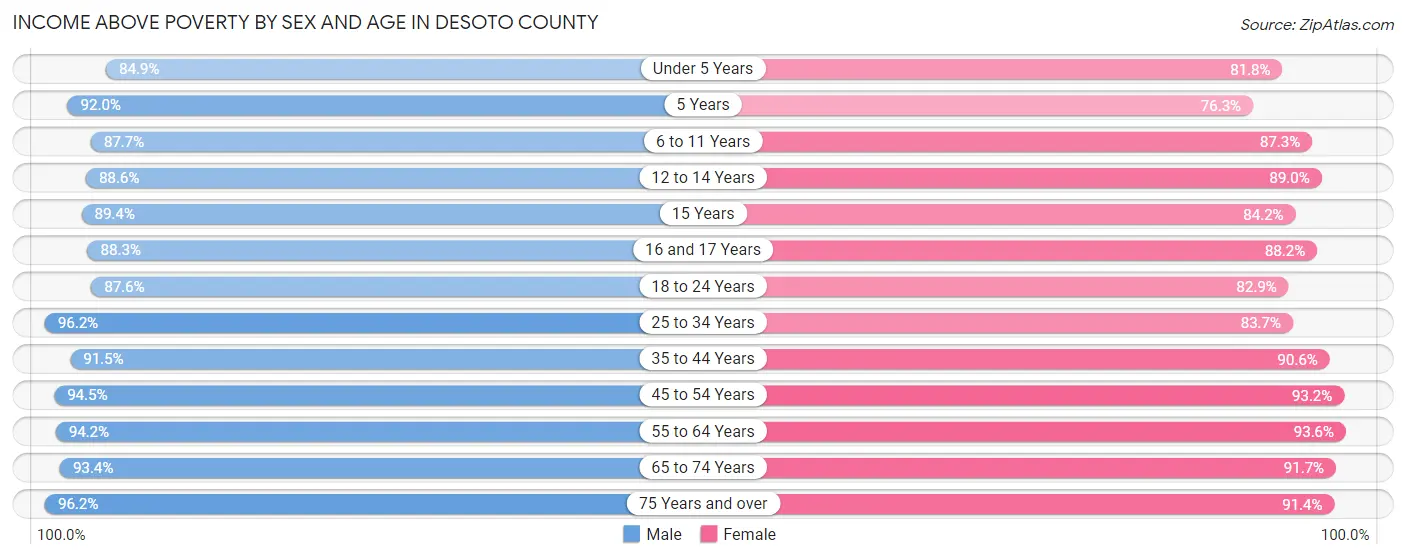
Income Above Poverty by Sex and Age in DeSoto County
According to the poverty statistics in DeSoto County, males aged 25 to 34 years and females aged 55 to 64 years are the age groups that are most secure financially, with 96.2% of males and 93.6% of females in these age groups living above the poverty line.
| Age Bracket | Male | Female |
| Under 5 Years | 4,597 (84.9%) | 4,095 (81.8%) |
| 5 Years | 817 (92.0%) | 1,175 (76.3%) |
| 6 to 11 Years | 6,815 (87.7%) | 6,253 (87.3%) |
| 12 to 14 Years | 4,321 (88.6%) | 3,892 (89.0%) |
| 15 Years | 1,693 (89.4%) | 1,182 (84.2%) |
| 16 and 17 Years | 2,458 (88.3%) | 2,594 (88.2%) |
| 18 to 24 Years | 7,557 (87.6%) | 6,789 (82.9%) |
| 25 to 34 Years | 10,928 (96.2%) | 10,302 (83.7%) |
| 35 to 44 Years | 11,118 (91.5%) | 12,569 (90.5%) |
| 45 to 54 Years | 11,566 (94.5%) | 12,517 (93.2%) |
| 55 to 64 Years | 10,128 (94.2%) | 10,588 (93.6%) |
| 65 to 74 Years | 6,454 (93.4%) | 7,512 (91.7%) |
| 75 Years and over | 3,519 (96.2%) | 4,969 (91.4%) |
| Total | 81,971 (91.8%) | 84,437 (88.7%) |
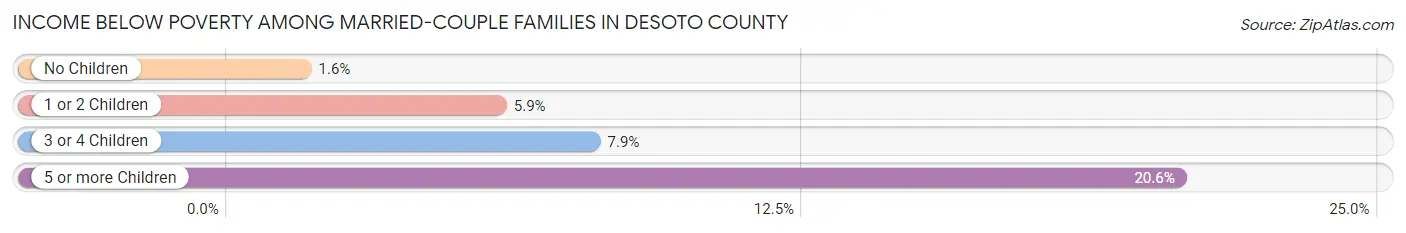
Income Below Poverty Among Married-Couple Families in DeSoto County
The poverty statistics for married-couple families in DeSoto County show that 4.0% or 1,428 of the total 36,096 families live below the poverty line. Families with 5 or more children have the highest poverty rate of 20.6%, comprising of 71 families. On the other hand, families with no children have the lowest poverty rate of 1.6%, which includes 303 families.
| Children | Above Poverty | Below Poverty |
| No Children | 18,612 (98.4%) | 303 (1.6%) |
| 1 or 2 Children | 12,654 (94.2%) | 786 (5.9%) |
| 3 or 4 Children | 3,129 (92.1%) | 268 (7.9%) |
| 5 or more Children | 273 (79.4%) | 71 (20.6%) |
| Total | 34,668 (96.0%) | 1,428 (4.0%) |
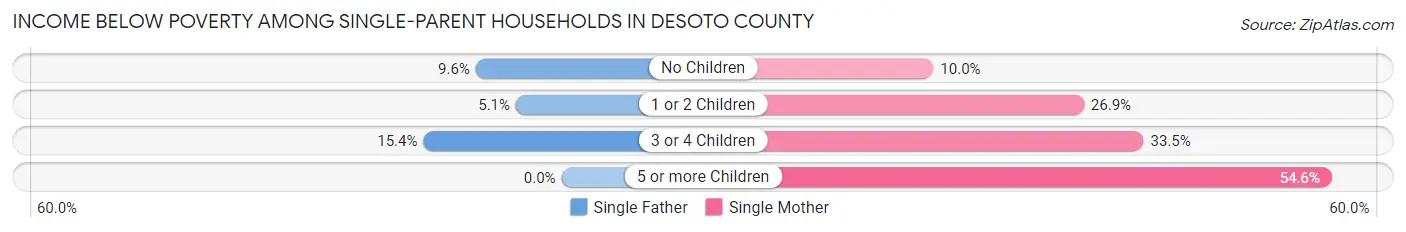
Income Below Poverty Among Single-Parent Households in DeSoto County
According to the poverty data in DeSoto County, 7.9% or 347 single-father households and 22.1% or 2,192 single-mother households are living below the poverty line. Among single-father households, those with 3 or 4 children have the highest poverty rate, with 40 households (15.4%) experiencing poverty. Likewise, among single-mother households, those with 5 or more children have the highest poverty rate, with 42 households (54.5%) falling below the poverty line.
| Children | Single Father | Single Mother |
| No Children | 204 (9.6%) | 330 (10.0%) |
| 1 or 2 Children | 103 (5.1%) | 1,521 (26.9%) |
| 3 or 4 Children | 40 (15.4%) | 299 (33.5%) |
| 5 or more Children | 0 (0.0%) | 42 (54.5%) |
| Total | 347 (7.9%) | 2,192 (22.1%) |
Income Below Poverty Among Married-Couple vs Single-Parent Households in DeSoto County
The poverty data for DeSoto County shows that 1,428 of the married-couple family households (4.0%) and 2,539 of the single-parent households (17.7%) are living below the poverty level. Within the married-couple family households, those with 5 or more children have the highest poverty rate, with 71 households (20.6%) falling below the poverty line. Among the single-parent households, those with 5 or more children have the highest poverty rate, with 42 household (54.5%) living below poverty.
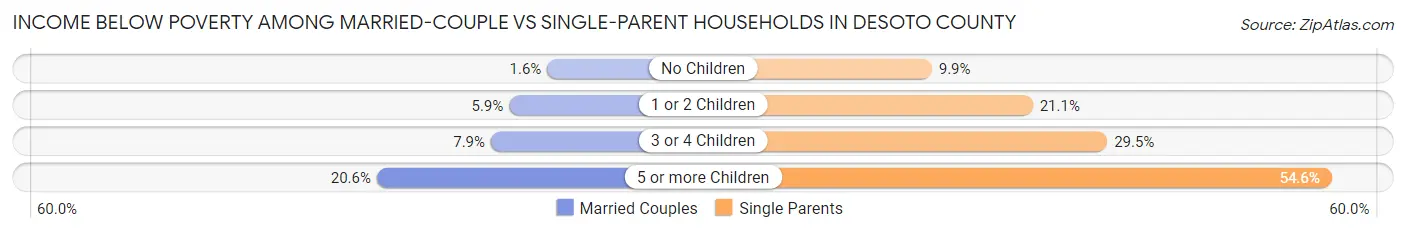
| Children | Married-Couple Families | Single-Parent Households |
| No Children | 303 (1.6%) | 534 (9.9%) |
| 1 or 2 Children | 786 (5.9%) | 1,624 (21.1%) |
| 3 or 4 Children | 268 (7.9%) | 339 (29.4%) |
| 5 or more Children | 71 (20.6%) | 42 (54.5%) |
| Total | 1,428 (4.0%) | 2,539 (17.7%) |
Race in DeSoto County
The most populous races in DeSoto County are White / Caucasian (114,180 | 61.3%), Black / African American (57,584 | 30.9%), and Hispanic or Latino (9,693 | 5.2%).
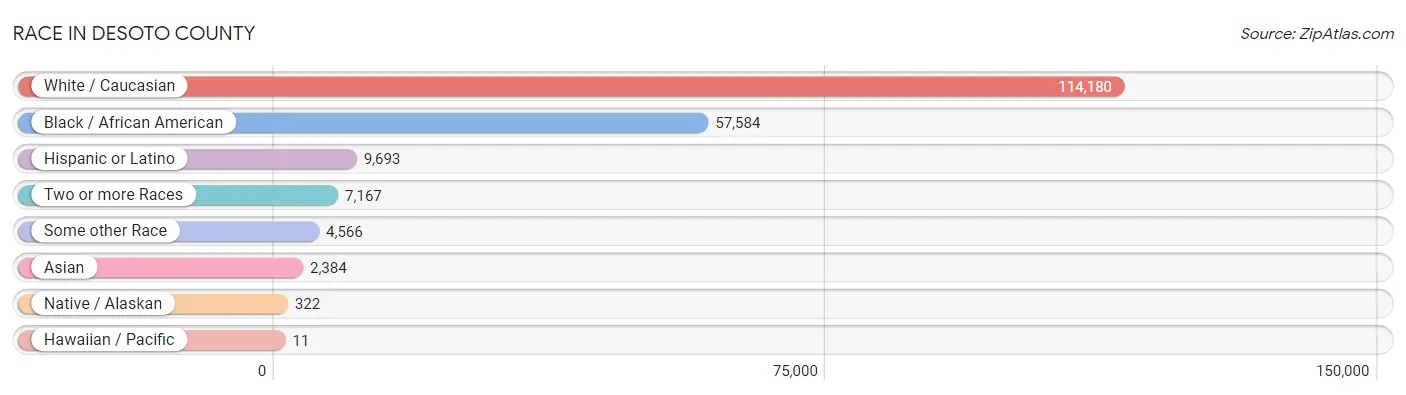
| Race | # Population | % Population |
| Asian | 2,384 | 1.3% |
| Black / African American | 57,584 | 30.9% |
| Hawaiian / Pacific | 11 | 0.0% |
| Hispanic or Latino | 9,693 | 5.2% |
| Native / Alaskan | 322 | 0.2% |
| White / Caucasian | 114,180 | 61.3% |
| Two or more Races | 7,167 | 3.8% |
| Some other Race | 4,566 | 2.5% |
| Total | 186,214 | 100.0% |
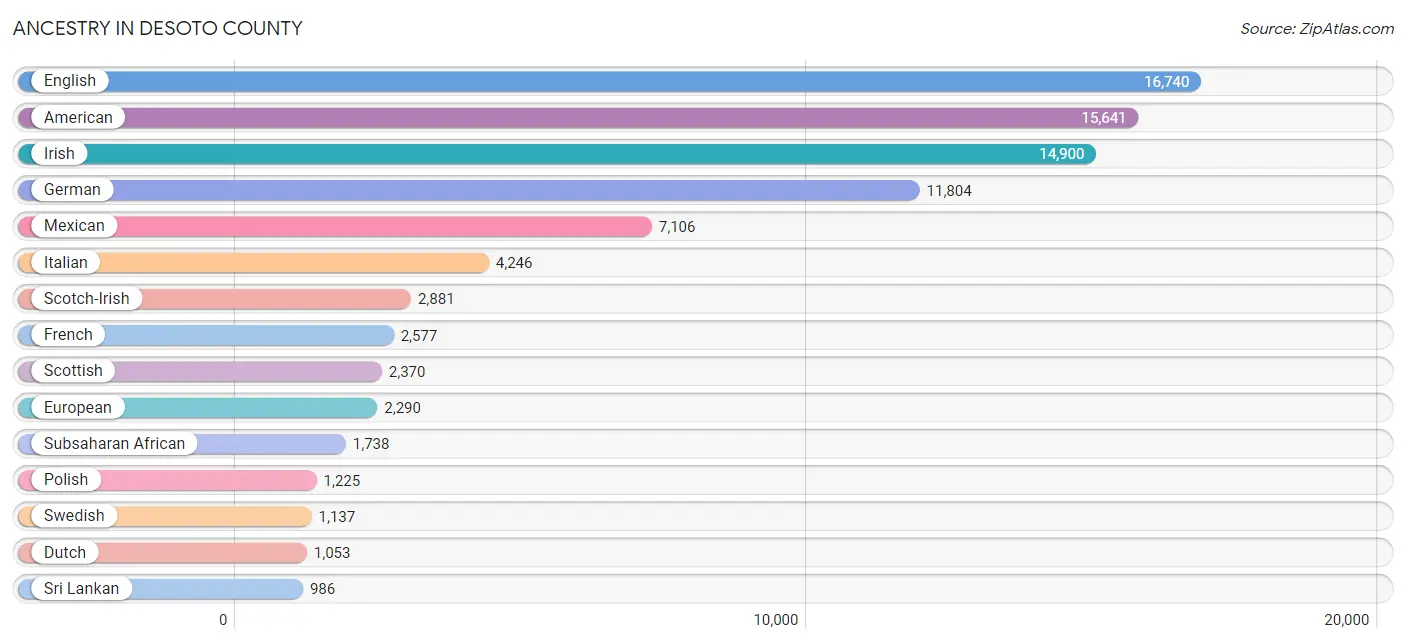
Ancestry in DeSoto County
The most populous ancestries reported in DeSoto County are English (16,740 | 9.0%), American (15,641 | 8.4%), Irish (14,900 | 8.0%), German (11,804 | 6.3%), and Mexican (7,106 | 3.8%), together accounting for 35.6% of all DeSoto County residents.
| Ancestry | # Population | % Population |
| African | 944 | 0.5% |
| Alsatian | 19 | 0.0% |
| American | 15,641 | 8.4% |
| Apache | 13 | 0.0% |
| Arab | 609 | 0.3% |
| Argentinean | 11 | 0.0% |
| Australian | 10 | 0.0% |
| Austrian | 14 | 0.0% |
| Belgian | 60 | 0.0% |
| Bhutanese | 346 | 0.2% |
| Blackfeet | 46 | 0.0% |
| Bolivian | 14 | 0.0% |
| British | 679 | 0.4% |
| Bulgarian | 11 | 0.0% |
| Burmese | 198 | 0.1% |
| Cajun | 21 | 0.0% |
| Canadian | 123 | 0.1% |
| Celtic | 24 | 0.0% |
| Central American | 740 | 0.4% |
| Central American Indian | 89 | 0.1% |
| Cherokee | 308 | 0.2% |
| Chickasaw | 12 | 0.0% |
| Chilean | 28 | 0.0% |
| Choctaw | 55 | 0.0% |
| Colombian | 257 | 0.1% |
| Costa Rican | 58 | 0.0% |
| Cree | 3 | 0.0% |
| Creek | 20 | 0.0% |
| Crow | 1 | 0.0% |
| Cuban | 244 | 0.1% |
| Czech | 48 | 0.0% |
| Czechoslovakian | 98 | 0.1% |
| Danish | 245 | 0.1% |
| Dominican | 170 | 0.1% |
| Dutch | 1,053 | 0.6% |
| Eastern European | 106 | 0.1% |
| Ecuadorian | 61 | 0.0% |
| English | 16,740 | 9.0% |
| Ethiopian | 99 | 0.1% |
| European | 2,290 | 1.2% |
| Filipino | 9 | 0.0% |
| Finnish | 27 | 0.0% |
| French | 2,577 | 1.4% |
| French Canadian | 383 | 0.2% |
| German | 11,804 | 6.3% |
| Greek | 219 | 0.1% |
| Guamanian / Chamorro | 13 | 0.0% |
| Guatemalan | 180 | 0.1% |
| Guyanese | 323 | 0.2% |
| Honduran | 166 | 0.1% |
| Hopi | 18 | 0.0% |
| Hungarian | 70 | 0.0% |
| Icelander | 10 | 0.0% |
| Indian (Asian) | 448 | 0.2% |
| Iranian | 22 | 0.0% |
| Irish | 14,900 | 8.0% |
| Iroquois | 4 | 0.0% |
| Italian | 4,246 | 2.3% |
| Jamaican | 212 | 0.1% |
| Japanese | 163 | 0.1% |
| Kenyan | 14 | 0.0% |
| Korean | 786 | 0.4% |
| Laotian | 75 | 0.0% |
| Lebanese | 259 | 0.1% |
| Lithuanian | 31 | 0.0% |
| Maltese | 8 | 0.0% |
| Mexican | 7,106 | 3.8% |
| Moroccan | 73 | 0.0% |
| Native Hawaiian | 217 | 0.1% |
| New Zealander | 129 | 0.1% |
| Nicaraguan | 48 | 0.0% |
| Nigerian | 71 | 0.0% |
| Northern European | 116 | 0.1% |
| Norwegian | 479 | 0.3% |
| Pakistani | 28 | 0.0% |
| Panamanian | 13 | 0.0% |
| Pennsylvania German | 3 | 0.0% |
| Peruvian | 115 | 0.1% |
| Polish | 1,225 | 0.7% |
| Portuguese | 109 | 0.1% |
| Puerto Rican | 560 | 0.3% |
| Puget Sound Salish | 62 | 0.0% |
| Romanian | 63 | 0.0% |
| Russian | 359 | 0.2% |
| Salvadoran | 275 | 0.2% |
| Scandinavian | 246 | 0.1% |
| Scotch-Irish | 2,881 | 1.5% |
| Scottish | 2,370 | 1.3% |
| Seminole | 1 | 0.0% |
| Senegalese | 11 | 0.0% |
| Sioux | 30 | 0.0% |
| Slovak | 22 | 0.0% |
| South African | 37 | 0.0% |
| South American | 491 | 0.3% |
| Spaniard | 180 | 0.1% |
| Spanish | 105 | 0.1% |
| Sri Lankan | 986 | 0.5% |
| Subsaharan African | 1,738 | 0.9% |
| Swedish | 1,137 | 0.6% |
| Swiss | 137 | 0.1% |
| Syrian | 19 | 0.0% |
| Thai | 409 | 0.2% |
| Ukrainian | 50 | 0.0% |
| Uruguayan | 5 | 0.0% |
| Welsh | 936 | 0.5% |
| Yugoslavian | 10 | 0.0% | View All 106 Rows |
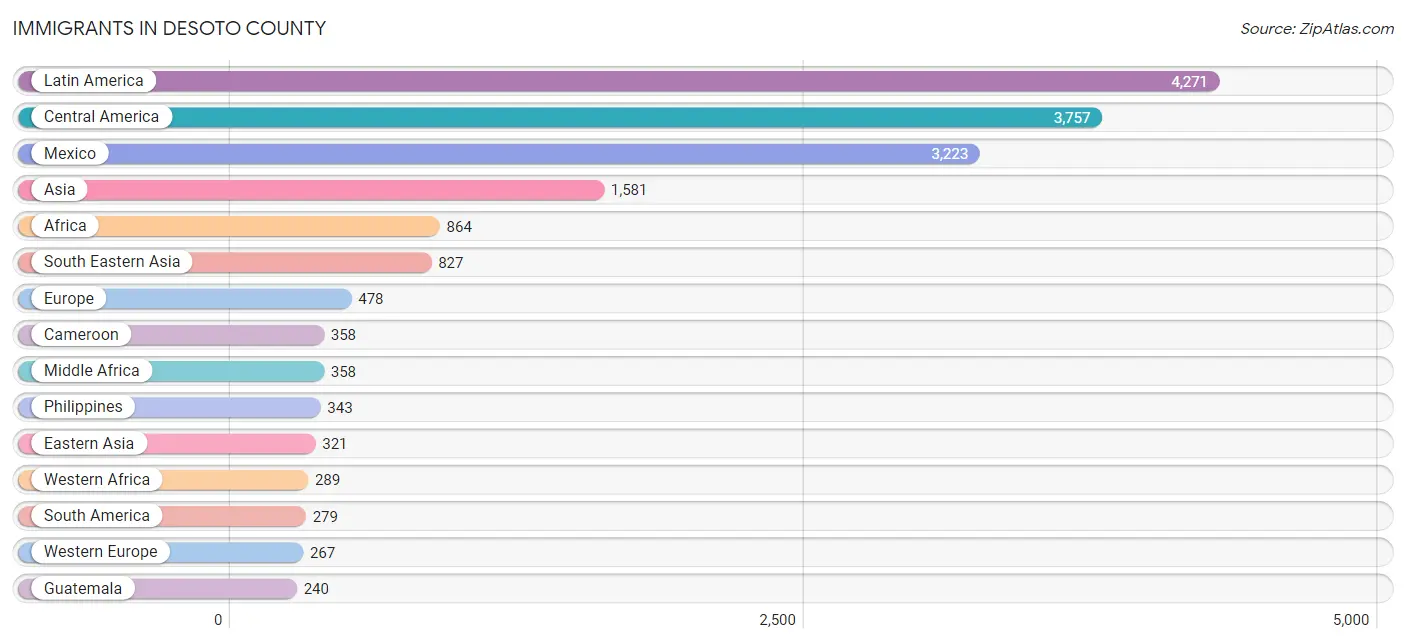
Immigrants in DeSoto County
The most numerous immigrant groups reported in DeSoto County came from Latin America (4,271 | 2.3%), Central America (3,757 | 2.0%), Mexico (3,223 | 1.7%), Asia (1,581 | 0.9%), and Africa (864 | 0.5%), together accounting for 7.3% of all DeSoto County residents.
| Immigration Origin | # Population | % Population |
| Africa | 864 | 0.5% |
| Argentina | 11 | 0.0% |
| Asia | 1,581 | 0.9% |
| Australia | 46 | 0.0% |
| Bolivia | 7 | 0.0% |
| Brazil | 2 | 0.0% |
| Cambodia | 111 | 0.1% |
| Cameroon | 358 | 0.2% |
| Canada | 116 | 0.1% |
| Caribbean | 235 | 0.1% |
| Central America | 3,757 | 2.0% |
| Chile | 28 | 0.0% |
| China | 217 | 0.1% |
| Colombia | 156 | 0.1% |
| Costa Rica | 28 | 0.0% |
| Cuba | 143 | 0.1% |
| Czechoslovakia | 7 | 0.0% |
| Dominica | 10 | 0.0% |
| Dominican Republic | 66 | 0.0% |
| Eastern Africa | 93 | 0.1% |
| Eastern Asia | 321 | 0.2% |
| Eastern Europe | 175 | 0.1% |
| Ecuador | 11 | 0.0% |
| El Salvador | 99 | 0.1% |
| England | 24 | 0.0% |
| Ethiopia | 46 | 0.0% |
| Europe | 478 | 0.3% |
| Germany | 206 | 0.1% |
| Guatemala | 240 | 0.1% |
| Haiti | 10 | 0.0% |
| Honduras | 145 | 0.1% |
| Hong Kong | 5 | 0.0% |
| India | 181 | 0.1% |
| Indonesia | 42 | 0.0% |
| Iran | 18 | 0.0% |
| Ireland | 3 | 0.0% |
| Jamaica | 6 | 0.0% |
| Japan | 99 | 0.1% |
| Jordan | 139 | 0.1% |
| Kenya | 26 | 0.0% |
| Korea | 5 | 0.0% |
| Laos | 1 | 0.0% |
| Latin America | 4,271 | 2.3% |
| Malaysia | 49 | 0.0% |
| Mexico | 3,223 | 1.7% |
| Middle Africa | 358 | 0.2% |
| Morocco | 111 | 0.1% |
| Netherlands | 61 | 0.0% |
| Nicaragua | 22 | 0.0% |
| Northern Africa | 111 | 0.1% |
| Northern Europe | 36 | 0.0% |
| Oceania | 120 | 0.1% |
| Peru | 59 | 0.0% |
| Philippines | 343 | 0.2% |
| Poland | 15 | 0.0% |
| Romania | 63 | 0.0% |
| Russia | 85 | 0.1% |
| Senegal | 66 | 0.0% |
| Sierra Leone | 35 | 0.0% |
| Singapore | 32 | 0.0% |
| South Africa | 9 | 0.0% |
| South America | 279 | 0.2% |
| South Central Asia | 199 | 0.1% |
| South Eastern Asia | 827 | 0.4% |
| Taiwan | 98 | 0.1% |
| Thailand | 37 | 0.0% |
| Ukraine | 5 | 0.0% |
| Uruguay | 5 | 0.0% |
| Vietnam | 212 | 0.1% |
| Western Africa | 289 | 0.2% |
| Western Asia | 234 | 0.1% |
| Western Europe | 267 | 0.1% |
| Yemen | 95 | 0.1% | View All 73 Rows |
Sex and Age in DeSoto County
Sex and Age in DeSoto County
The most populous age groups in DeSoto County are 10 to 14 Years (7,610 | 8.4%) for men and 40 to 44 Years (7,079 | 7.4%) for women.
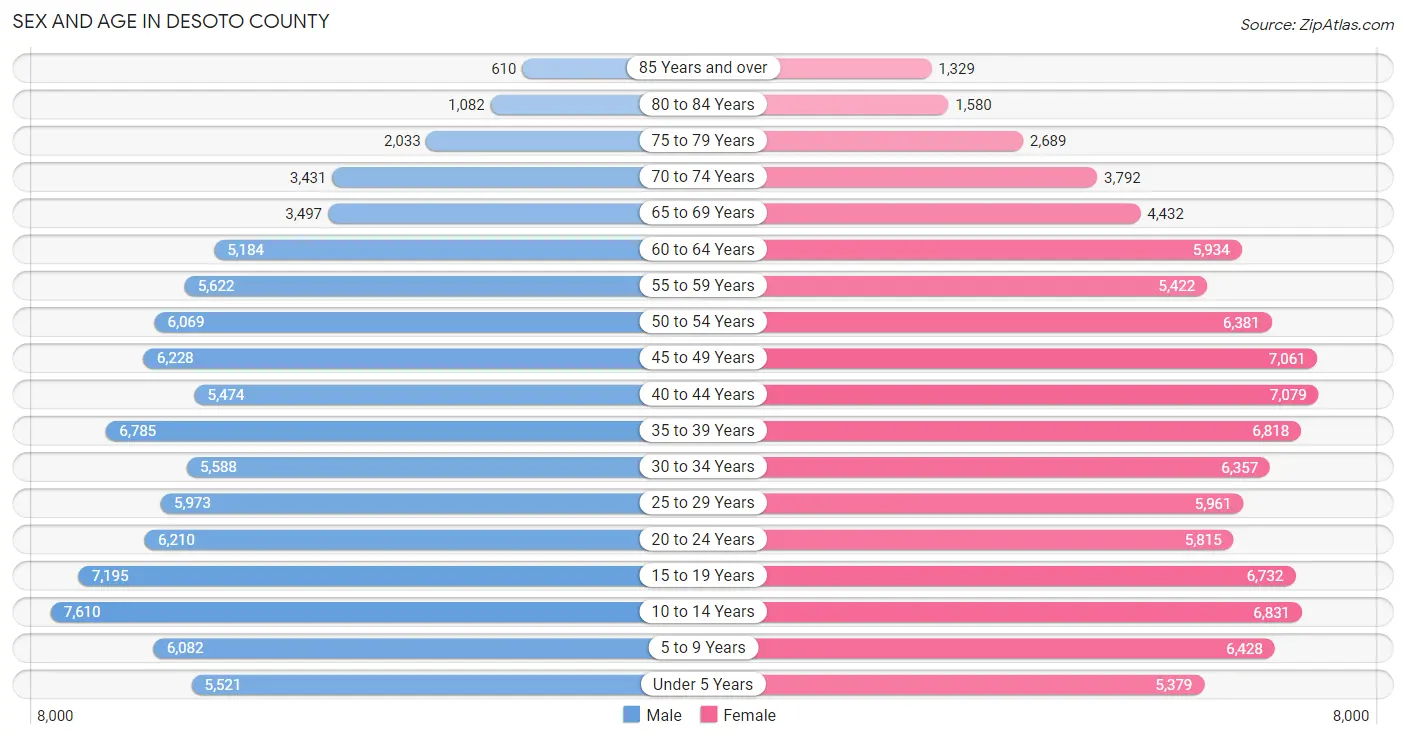
| Age Bracket | Male | Female |
| Under 5 Years | 5,521 (6.1%) | 5,379 (5.6%) |
| 5 to 9 Years | 6,082 (6.7%) | 6,428 (6.7%) |
| 10 to 14 Years | 7,610 (8.4%) | 6,831 (7.1%) |
| 15 to 19 Years | 7,195 (8.0%) | 6,732 (7.0%) |
| 20 to 24 Years | 6,210 (6.9%) | 5,815 (6.1%) |
| 25 to 29 Years | 5,973 (6.6%) | 5,961 (6.2%) |
| 30 to 34 Years | 5,588 (6.2%) | 6,357 (6.6%) |
| 35 to 39 Years | 6,785 (7.5%) | 6,818 (7.1%) |
| 40 to 44 Years | 5,474 (6.1%) | 7,079 (7.4%) |
| 45 to 49 Years | 6,228 (6.9%) | 7,061 (7.3%) |
| 50 to 54 Years | 6,069 (6.7%) | 6,381 (6.7%) |
| 55 to 59 Years | 5,622 (6.2%) | 5,422 (5.7%) |
| 60 to 64 Years | 5,184 (5.8%) | 5,934 (6.2%) |
| 65 to 69 Years | 3,497 (3.9%) | 4,432 (4.6%) |
| 70 to 74 Years | 3,431 (3.8%) | 3,792 (4.0%) |
| 75 to 79 Years | 2,033 (2.2%) | 2,689 (2.8%) |
| 80 to 84 Years | 1,082 (1.2%) | 1,580 (1.7%) |
| 85 Years and over | 610 (0.7%) | 1,329 (1.4%) |
| Total | 90,194 (100.0%) | 96,020 (100.0%) |
Families and Households in DeSoto County
Median Family Size in DeSoto County
The median family size in DeSoto County is 3.18 persons per family, with married-couple families (36,096 | 71.6%) accounting for the largest median family size of 3.25 persons per family. On the other hand, single male/father families (4,406 | 8.7%) represent the smallest median family size with 2.81 persons per family.
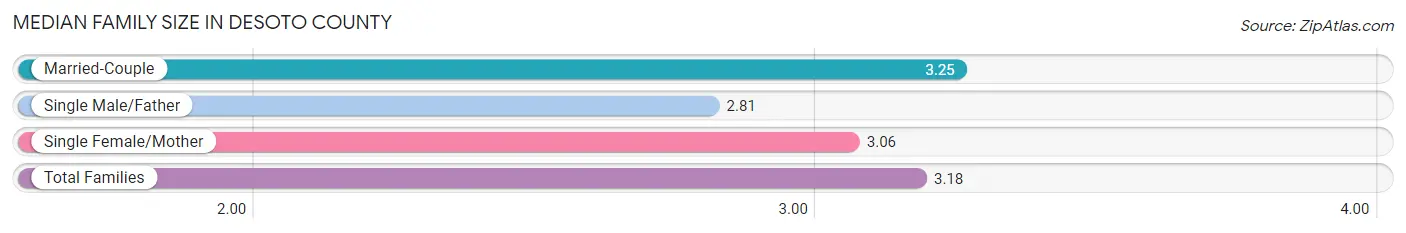
| Family Type | # Families | Family Size |
| Married-Couple | 36,096 (71.6%) | 3.25 |
| Single Male/Father | 4,406 (8.7%) | 2.81 |
| Single Female/Mother | 9,925 (19.7%) | 3.06 |
| Total Families | 50,427 (100.0%) | 3.18 |
Median Household Size in DeSoto County
The median household size in DeSoto County is 2.71 persons per household, with married-couple households (36,096 | 52.8%) accounting for the largest median household size of 3.28 persons per household. non-family households (17,926 | 26.2%) represent the smallest median household size with 1.22 persons per household.
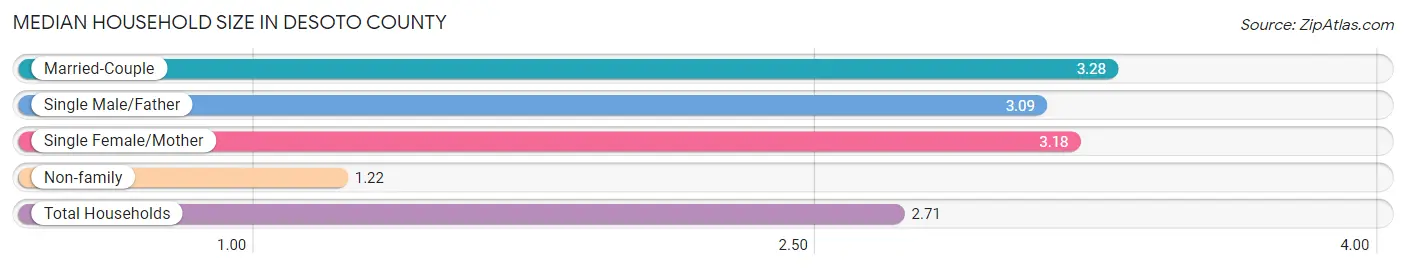
| Household Type | # Households | Household Size |
| Married-Couple | 36,096 (52.8%) | 3.28 |
| Single Male/Father | 4,406 (6.5%) | 3.09 |
| Single Female/Mother | 9,925 (14.5%) | 3.18 |
| Non-family | 17,926 (26.2%) | 1.22 |
| Total Households | 68,353 (100.0%) | 2.71 |
Household Size by Marriage Status in DeSoto County
Out of a total of 68,353 households in DeSoto County, 50,427 (73.8%) are family households, while 17,926 (26.2%) are nonfamily households. The most numerous type of family households are 2-person households, comprising 18,890, and the most common type of nonfamily households are 1-person households, comprising 15,063.
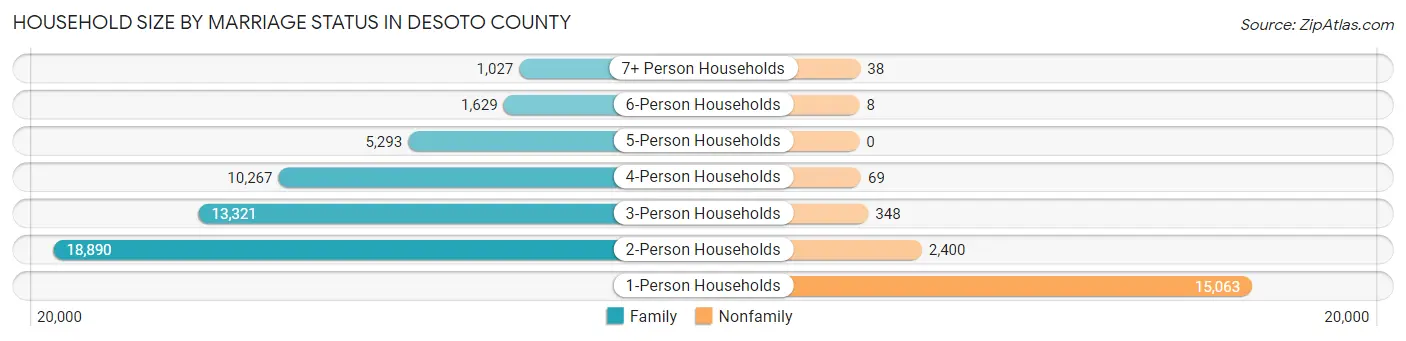
| Household Size | Family Households | Nonfamily Households |
| 1-Person Households | - | 15,063 (22.0%) |
| 2-Person Households | 18,890 (27.6%) | 2,400 (3.5%) |
| 3-Person Households | 13,321 (19.5%) | 348 (0.5%) |
| 4-Person Households | 10,267 (15.0%) | 69 (0.1%) |
| 5-Person Households | 5,293 (7.7%) | 0 (0.0%) |
| 6-Person Households | 1,629 (2.4%) | 8 (0.0%) |
| 7+ Person Households | 1,027 (1.5%) | 38 (0.1%) |
| Total | 50,427 (73.8%) | 17,926 (26.2%) |
Female Fertility in DeSoto County
Fertility by Age in DeSoto County
Average fertility rate in DeSoto County is 59.0 births per 1,000 women. Women in the age bracket of 20 to 34 years have the highest fertility rate with 126.0 births per 1,000 women. Women in the age bracket of 20 to 34 years acount for 81.4% of all women with births.
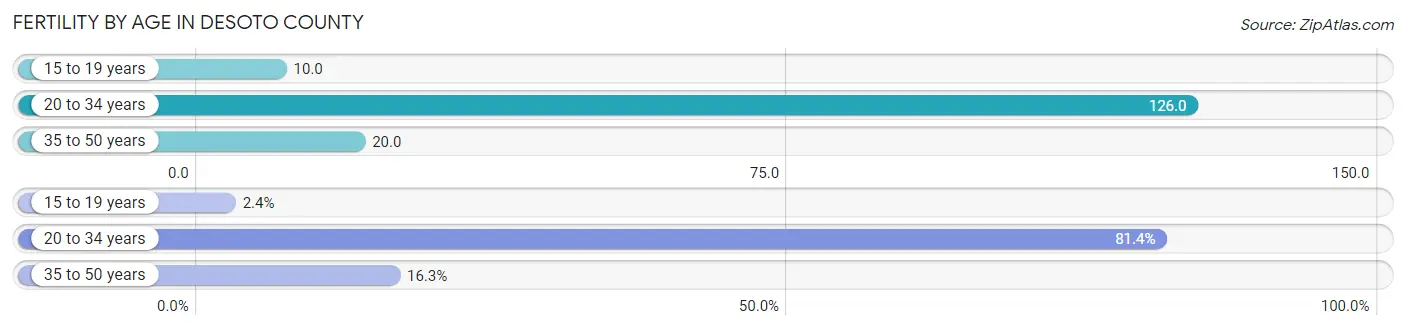
| Age Bracket | Women with Births | Births / 1,000 Women |
| 15 to 19 years | 66 (2.4%) | 10.0 |
| 20 to 34 years | 2,288 (81.4%) | 126.0 |
| 35 to 50 years | 458 (16.3%) | 20.0 |
| Total | 2,812 (100.0%) | 59.0 |
Fertility by Age by Marriage Status in DeSoto County
68.9% of women with births (2,812) in DeSoto County are married. The highest percentage of unmarried women with births falls into 15 to 19 years age bracket with 56.1% of them unmarried at the time of birth, while the lowest percentage of unmarried women with births belong to 35 to 50 years age bracket with 25.1% of them unmarried.
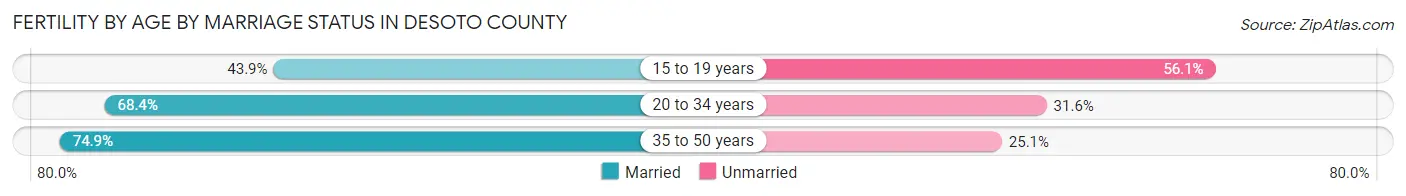
| Age Bracket | Married | Unmarried |
| 15 to 19 years | 29 (43.9%) | 37 (56.1%) |
| 20 to 34 years | 1,565 (68.4%) | 723 (31.6%) |
| 35 to 50 years | 343 (74.9%) | 115 (25.1%) |
| Total | 1,937 (68.9%) | 875 (31.1%) |
Fertility by Education in DeSoto County
Average fertility rate in DeSoto County is 59.0 births per 1,000 women. Women with the education attainment of college or associate's degree have the highest fertility rate of 76.0 births per 1,000 women, while women with the education attainment of high school diploma have the lowest fertility at 38.0 births per 1,000 women. Women with the education attainment of college or associate's degree represent 43.7% of all women with births.
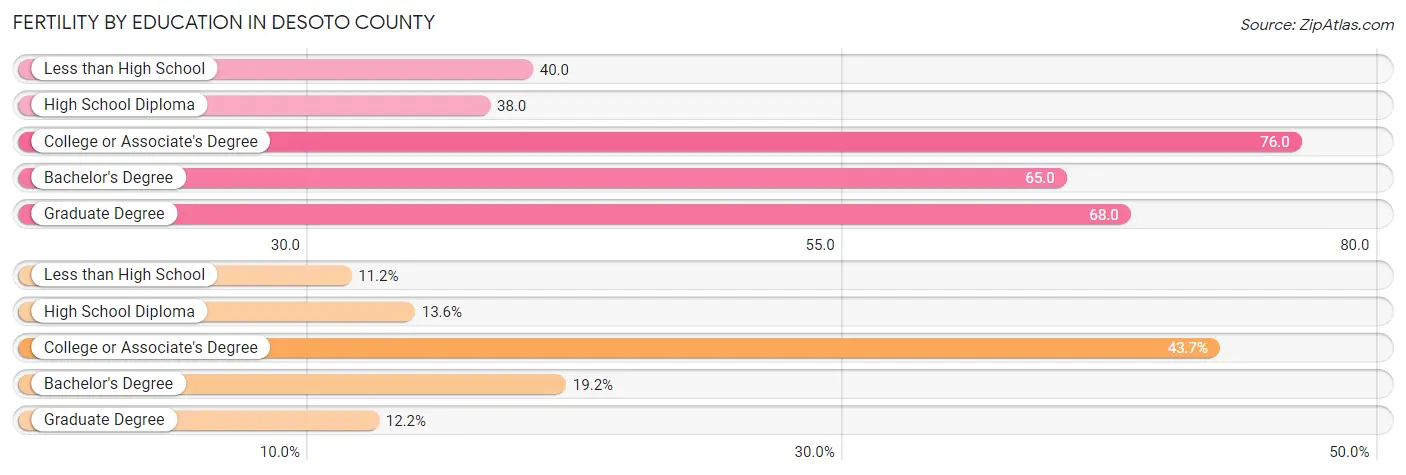
| Educational Attainment | Women with Births | Births / 1,000 Women |
| Less than High School | 315 (11.2%) | 40.0 |
| High School Diploma | 382 (13.6%) | 38.0 |
| College or Associate's Degree | 1,230 (43.7%) | 76.0 |
| Bachelor's Degree | 541 (19.2%) | 65.0 |
| Graduate Degree | 344 (12.2%) | 68.0 |
| Total | 2,812 (100.0%) | 59.0 |
Fertility by Education by Marriage Status in DeSoto County
31.1% of women with births in DeSoto County are unmarried. Women with the educational attainment of graduate degree are most likely to be married with 100.0% of them married at childbirth, while women with the educational attainment of high school diploma are least likely to be married with 58.1% of them unmarried at childbirth.
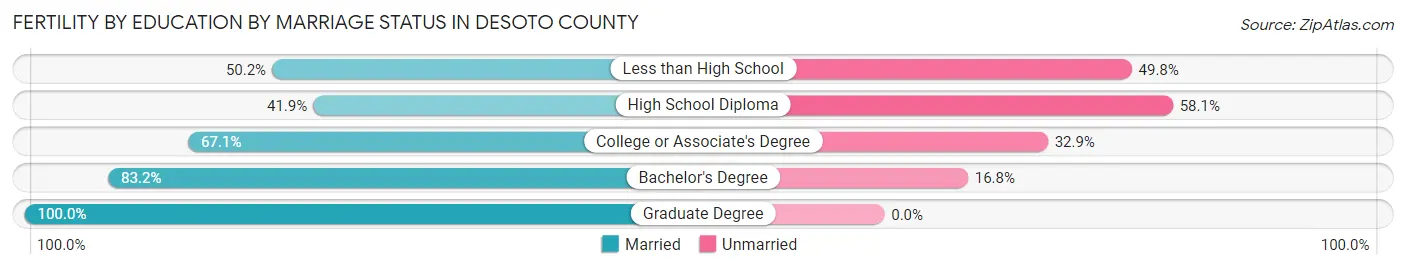
| Educational Attainment | Married | Unmarried |
| Less than High School | 158 (50.2%) | 157 (49.8%) |
| High School Diploma | 160 (41.9%) | 222 (58.1%) |
| College or Associate's Degree | 825 (67.1%) | 405 (32.9%) |
| Bachelor's Degree | 450 (83.2%) | 91 (16.8%) |
| Graduate Degree | 344 (100.0%) | 0 (0.0%) |
| Total | 1,937 (68.9%) | 875 (31.1%) |
Employment Characteristics in DeSoto County
Employment by Class of Employer in DeSoto County
Among the 92,131 employed individuals in DeSoto County, private company employees (65,486 | 71.1%), not-for-profit organizations (6,940 | 7.5%), and local government employees (6,157 | 6.7%) make up the most common classes of employment.
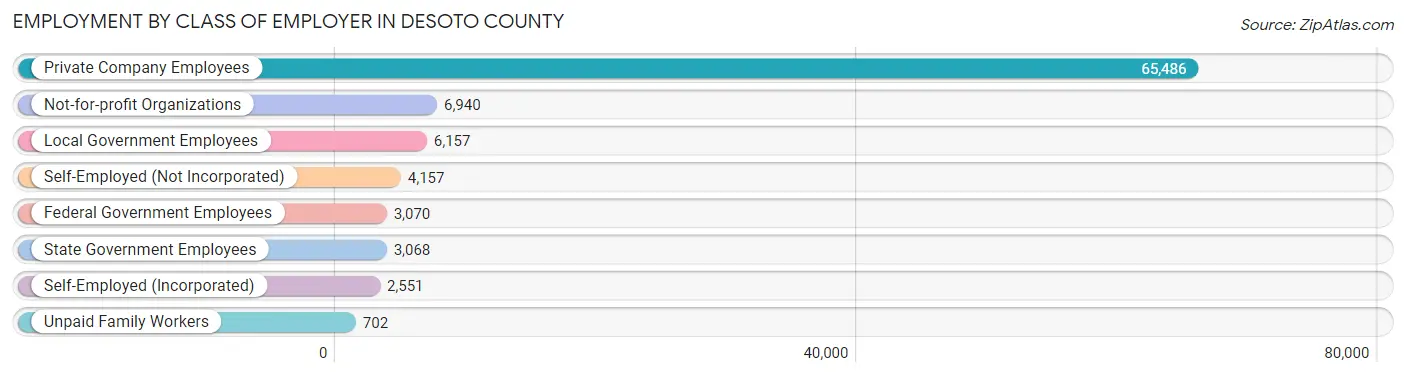
| Employer Class | # Employees | % Employees |
| Private Company Employees | 65,486 | 71.1% |
| Self-Employed (Incorporated) | 2,551 | 2.8% |
| Self-Employed (Not Incorporated) | 4,157 | 4.5% |
| Not-for-profit Organizations | 6,940 | 7.5% |
| Local Government Employees | 6,157 | 6.7% |
| State Government Employees | 3,068 | 3.3% |
| Federal Government Employees | 3,070 | 3.3% |
| Unpaid Family Workers | 702 | 0.8% |
| Total | 92,131 | 100.0% |
Employment Status by Age in DeSoto County
According to the labor force statistics for DeSoto County, out of the total population over 16 years of age (145,064), 67.6% or 98,063 individuals are in the labor force, with 4.4% or 4,315 of them unemployed. The age group with the highest labor force participation rate is 35 to 44 years, with 86.7% or 22,677 individuals in the labor force. Within the labor force, the 16 to 19 years age range has the highest percentage of unemployed individuals, with 15.5% or 718 of them being unemployed.
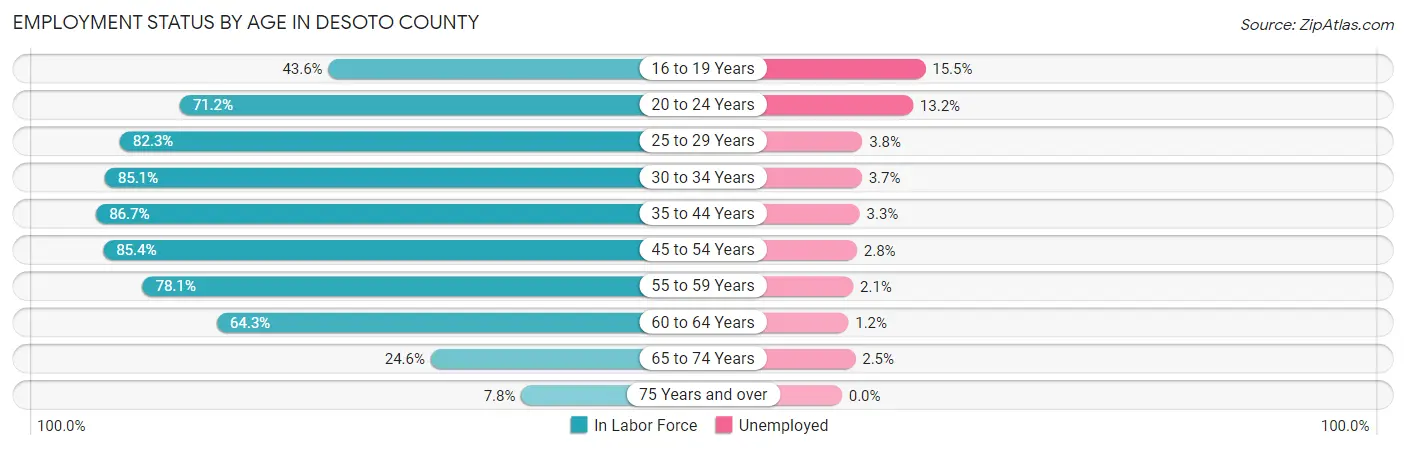
| Age Bracket | In Labor Force | Unemployed |
| 16 to 19 Years | 4,634 (43.6%) | 718 (15.5%) |
| 20 to 24 Years | 8,562 (71.2%) | 1,130 (13.2%) |
| 25 to 29 Years | 9,822 (82.3%) | 373 (3.8%) |
| 30 to 34 Years | 10,165 (85.1%) | 376 (3.7%) |
| 35 to 44 Years | 22,677 (86.7%) | 748 (3.3%) |
| 45 to 54 Years | 21,981 (85.4%) | 615 (2.8%) |
| 55 to 59 Years | 8,625 (78.1%) | 181 (2.1%) |
| 60 to 64 Years | 7,149 (64.3%) | 86 (1.2%) |
| 65 to 74 Years | 3,727 (24.6%) | 93 (2.5%) |
| 75 Years and over | 727 (7.8%) | 0 (0.0%) |
| Total | 98,063 (67.6%) | 4,315 (4.4%) |
Employment Status by Educational Attainment in DeSoto County
According to labor force statistics for DeSoto County, 82.1% of individuals (80,405) out of the total population between 25 and 64 years of age (97,936) are in the labor force, with 3.0% or 2,412 of them being unemployed. The group with the highest labor force participation rate are those with the educational attainment of bachelor's degree or higher, with 90.5% or 26,187 individuals in the labor force. Within the labor force, individuals with less than high school education have the highest percentage of unemployment, with 6.5% or 322 of them being unemployed.
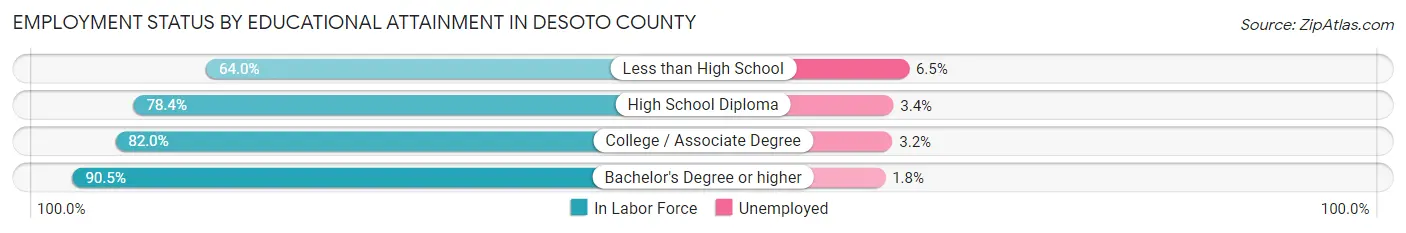
| Educational Attainment | In Labor Force | Unemployed |
| Less than High School | 4,961 (64.0%) | 504 (6.5%) |
| High School Diploma | 20,557 (78.4%) | 892 (3.4%) |
| College / Associate Degree | 28,722 (82.0%) | 1,121 (3.2%) |
| Bachelor's Degree or higher | 26,187 (90.5%) | 521 (1.8%) |
| Total | 80,405 (82.1%) | 2,938 (3.0%) |
Employment Occupations by Sex in DeSoto County
Management, Business, Science and Arts Occupations
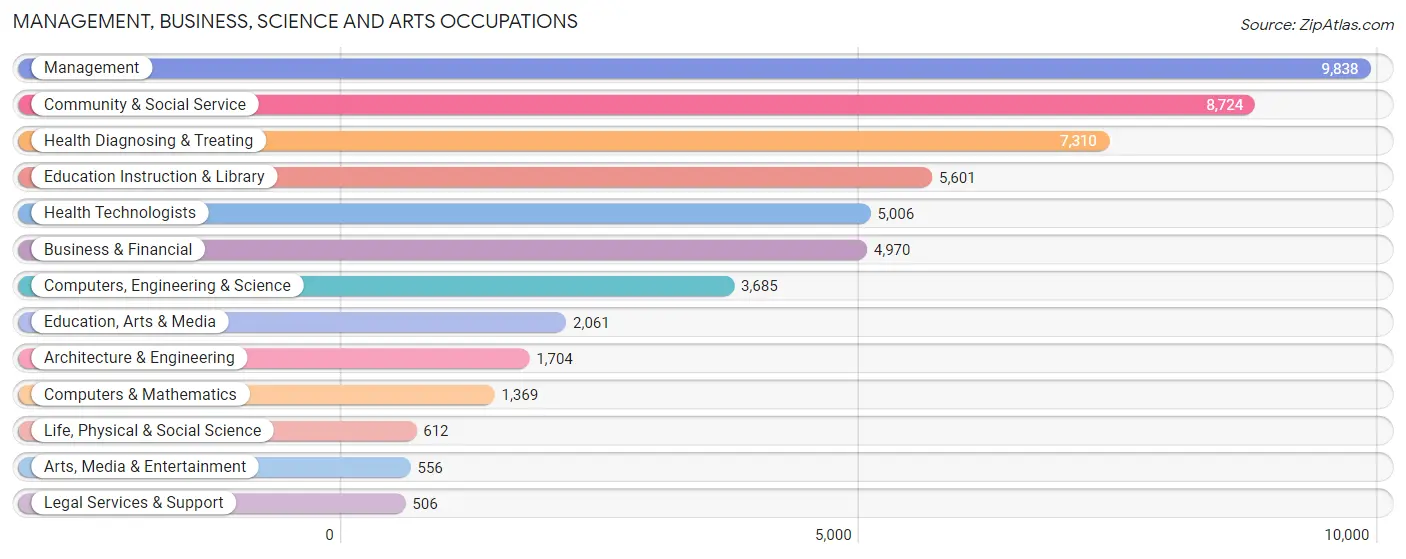
The most common Management, Business, Science and Arts occupations in DeSoto County are Management (9,838 | 10.5%), Community & Social Service (8,724 | 9.3%), Health Diagnosing & Treating (7,310 | 7.8%), Education Instruction & Library (5,601 | 6.0%), and Health Technologists (5,006 | 5.4%).
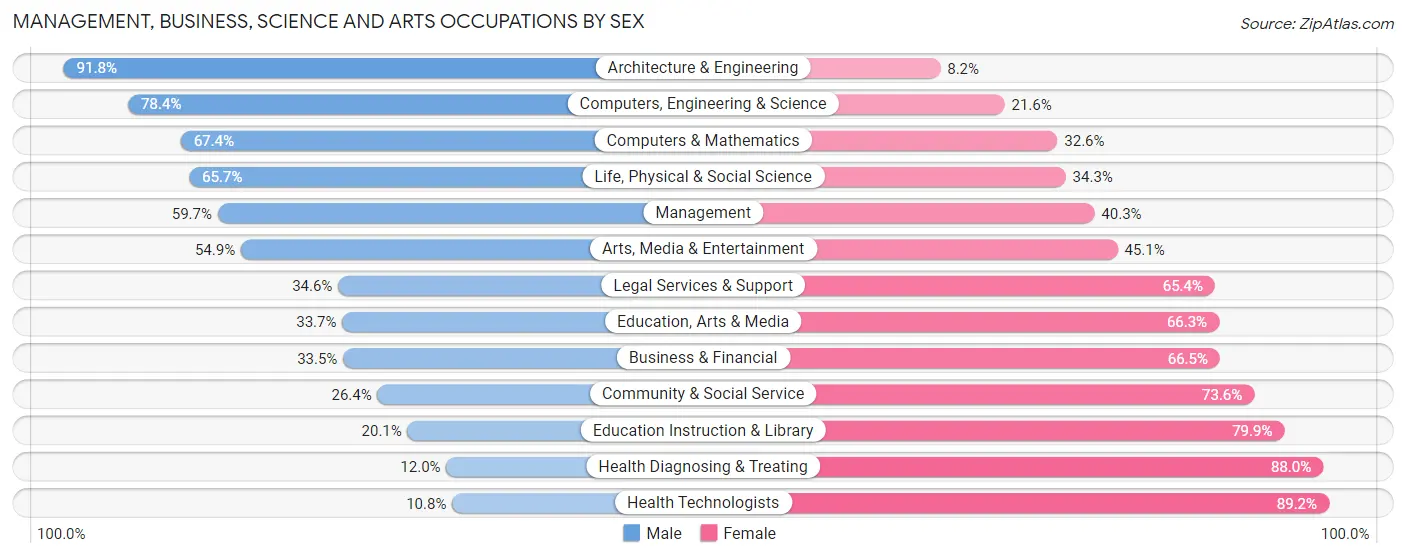
Management, Business, Science and Arts Occupations by Sex
Within the Management, Business, Science and Arts occupations in DeSoto County, the most male-oriented occupations are Architecture & Engineering (91.8%), Computers, Engineering & Science (78.4%), and Computers & Mathematics (67.4%), while the most female-oriented occupations are Health Technologists (89.2%), Health Diagnosing & Treating (88.0%), and Education Instruction & Library (79.9%).
| Occupation | Male | Female |
| Management | 5,872 (59.7%) | 3,966 (40.3%) |
| Business & Financial | 1,667 (33.5%) | 3,303 (66.5%) |
| Computers, Engineering & Science | 2,890 (78.4%) | 795 (21.6%) |
| Computers & Mathematics | 923 (67.4%) | 446 (32.6%) |
| Architecture & Engineering | 1,565 (91.8%) | 139 (8.2%) |
| Life, Physical & Social Science | 402 (65.7%) | 210 (34.3%) |
| Community & Social Service | 2,301 (26.4%) | 6,423 (73.6%) |
| Education, Arts & Media | 695 (33.7%) | 1,366 (66.3%) |
| Legal Services & Support | 175 (34.6%) | 331 (65.4%) |
| Education Instruction & Library | 1,126 (20.1%) | 4,475 (79.9%) |
| Arts, Media & Entertainment | 305 (54.9%) | 251 (45.1%) |
| Health Diagnosing & Treating | 878 (12.0%) | 6,432 (88.0%) |
| Health Technologists | 540 (10.8%) | 4,466 (89.2%) |
| Total (Category) | 13,608 (39.4%) | 20,919 (60.6%) |
| Total (Overall) | 48,781 (52.2%) | 44,652 (47.8%) |
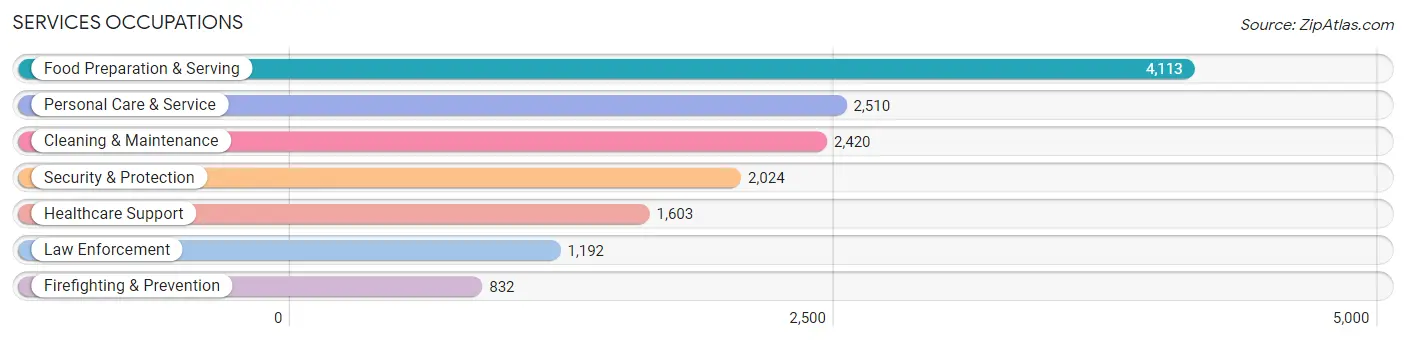
Services Occupations
The most common Services occupations in DeSoto County are Food Preparation & Serving (4,113 | 4.4%), Personal Care & Service (2,510 | 2.7%), Cleaning & Maintenance (2,420 | 2.6%), Security & Protection (2,024 | 2.2%), and Healthcare Support (1,603 | 1.7%).
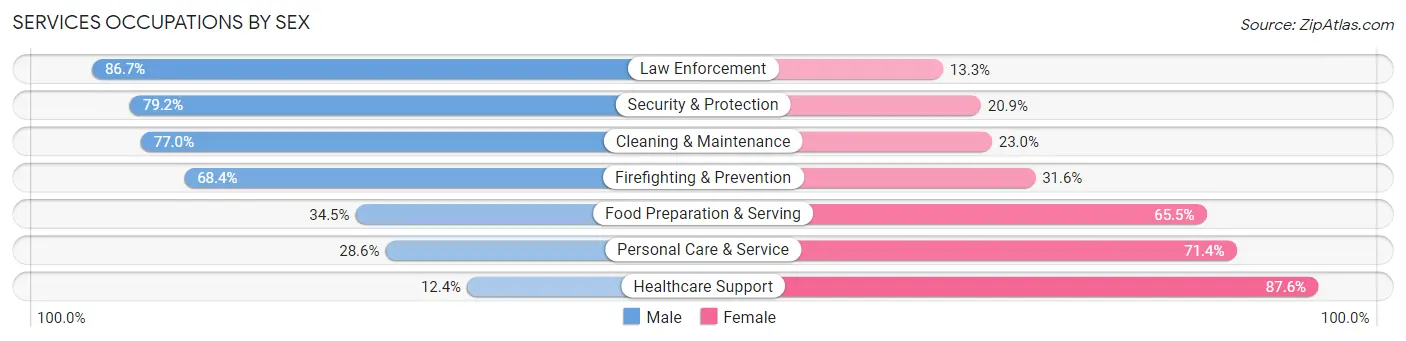
Services Occupations by Sex
Within the Services occupations in DeSoto County, the most male-oriented occupations are Law Enforcement (86.7%), Security & Protection (79.1%), and Cleaning & Maintenance (77.0%), while the most female-oriented occupations are Healthcare Support (87.6%), Personal Care & Service (71.4%), and Food Preparation & Serving (65.5%).
| Occupation | Male | Female |
| Healthcare Support | 199 (12.4%) | 1,404 (87.6%) |
| Security & Protection | 1,602 (79.1%) | 422 (20.8%) |
| Firefighting & Prevention | 569 (68.4%) | 263 (31.6%) |
| Law Enforcement | 1,033 (86.7%) | 159 (13.3%) |
| Food Preparation & Serving | 1,419 (34.5%) | 2,694 (65.5%) |
| Cleaning & Maintenance | 1,863 (77.0%) | 557 (23.0%) |
| Personal Care & Service | 717 (28.6%) | 1,793 (71.4%) |
| Total (Category) | 5,800 (45.8%) | 6,870 (54.2%) |
| Total (Overall) | 48,781 (52.2%) | 44,652 (47.8%) |
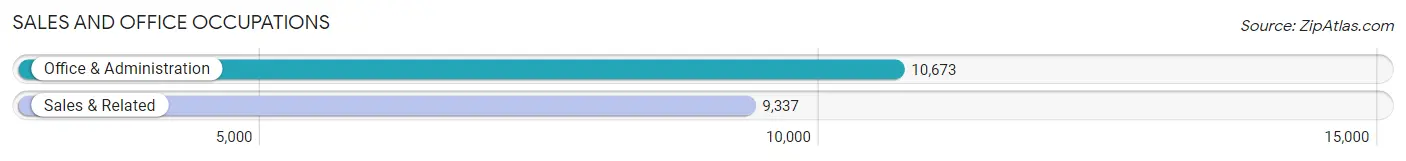
Sales and Office Occupations
The most common Sales and Office occupations in DeSoto County are Office & Administration (10,673 | 11.4%), and Sales & Related (9,337 | 10.0%).
Sales and Office Occupations by Sex
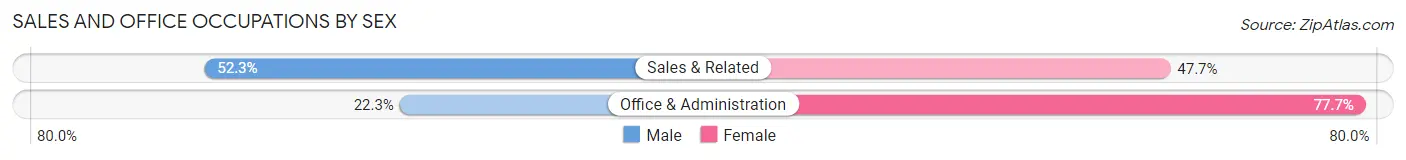
| Occupation | Male | Female |
| Sales & Related | 4,887 (52.3%) | 4,450 (47.7%) |
| Office & Administration | 2,379 (22.3%) | 8,294 (77.7%) |
| Total (Category) | 7,266 (36.3%) | 12,744 (63.7%) |
| Total (Overall) | 48,781 (52.2%) | 44,652 (47.8%) |
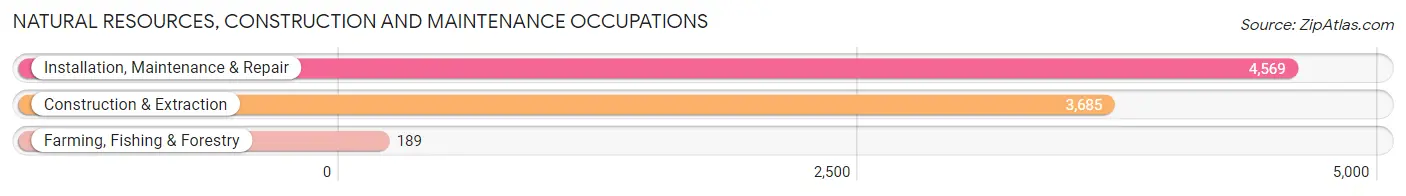
Natural Resources, Construction and Maintenance Occupations
The most common Natural Resources, Construction and Maintenance occupations in DeSoto County are Installation, Maintenance & Repair (4,569 | 4.9%), Construction & Extraction (3,685 | 3.9%), and Farming, Fishing & Forestry (189 | 0.2%).
Natural Resources, Construction and Maintenance Occupations by Sex
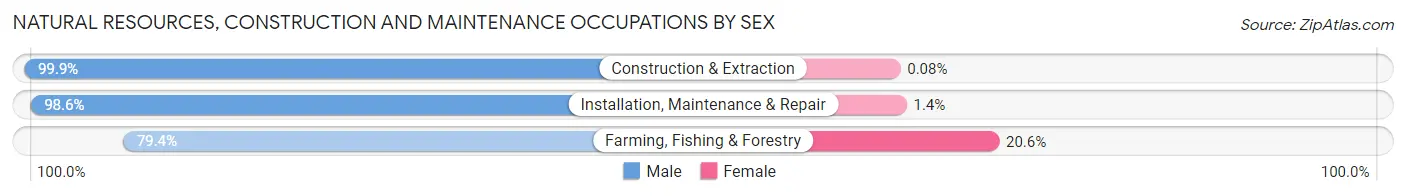
| Occupation | Male | Female |
| Farming, Fishing & Forestry | 150 (79.4%) | 39 (20.6%) |
| Construction & Extraction | 3,682 (99.9%) | 3 (0.1%) |
| Installation, Maintenance & Repair | 4,506 (98.6%) | 63 (1.4%) |
| Total (Category) | 8,338 (98.8%) | 105 (1.2%) |
| Total (Overall) | 48,781 (52.2%) | 44,652 (47.8%) |
Production, Transportation and Moving Occupations
The most common Production, Transportation and Moving occupations in DeSoto County are Material Moving (6,857 | 7.3%), Transportation (5,890 | 6.3%), and Production (5,036 | 5.4%).

Production, Transportation and Moving Occupations by Sex
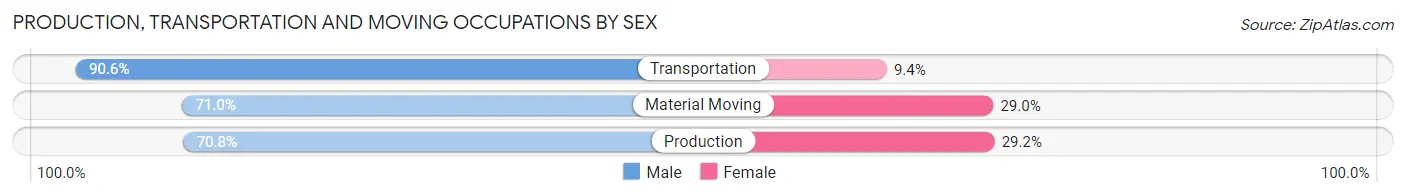
| Occupation | Male | Female |
| Production | 3,565 (70.8%) | 1,471 (29.2%) |
| Transportation | 5,334 (90.6%) | 556 (9.4%) |
| Material Moving | 4,870 (71.0%) | 1,987 (29.0%) |
| Total (Category) | 13,769 (77.4%) | 4,014 (22.6%) |
| Total (Overall) | 48,781 (52.2%) | 44,652 (47.8%) |
Employment Industries by Sex in DeSoto County
Employment Industries in DeSoto County
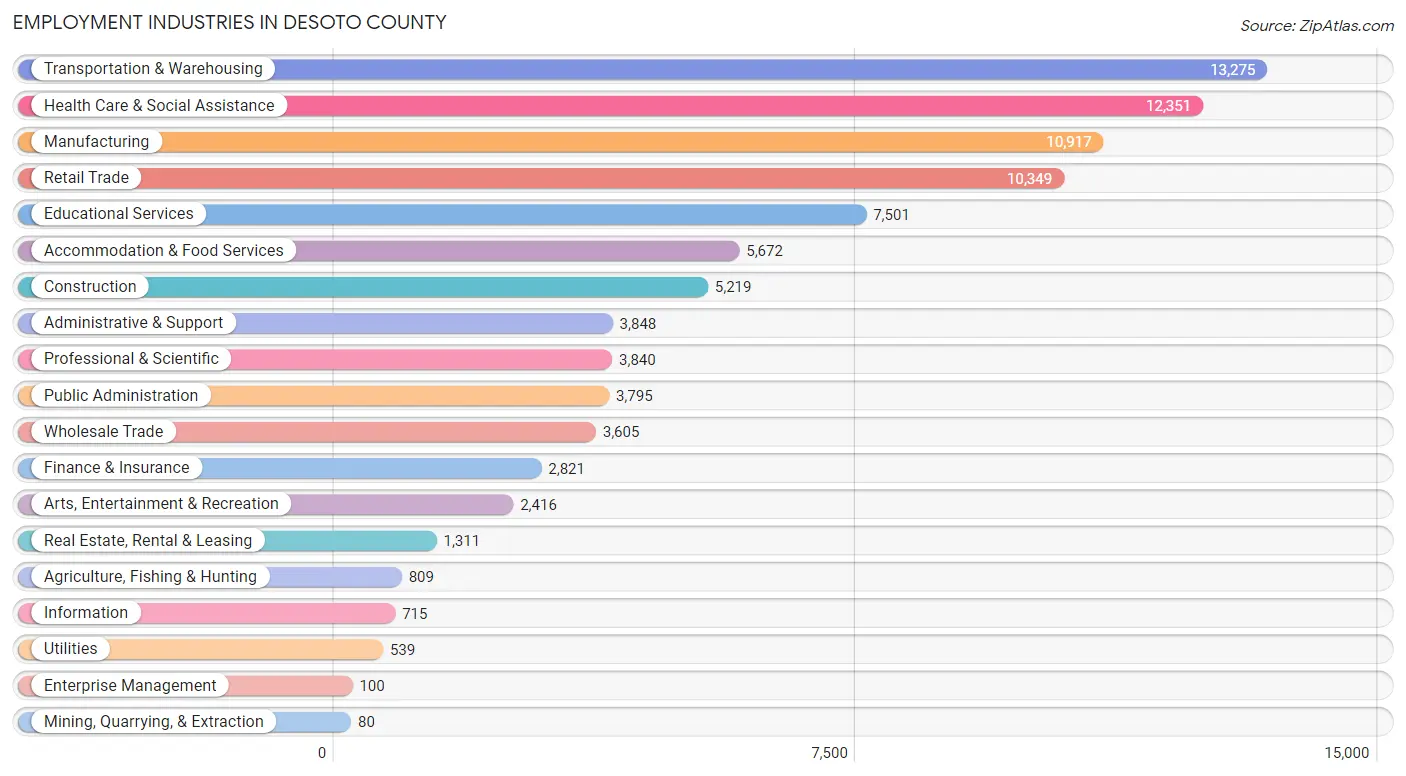
The major employment industries in DeSoto County include Transportation & Warehousing (13,275 | 14.2%), Health Care & Social Assistance (12,351 | 13.2%), Manufacturing (10,917 | 11.7%), Retail Trade (10,349 | 11.1%), and Educational Services (7,501 | 8.0%).
Employment Industries by Sex in DeSoto County
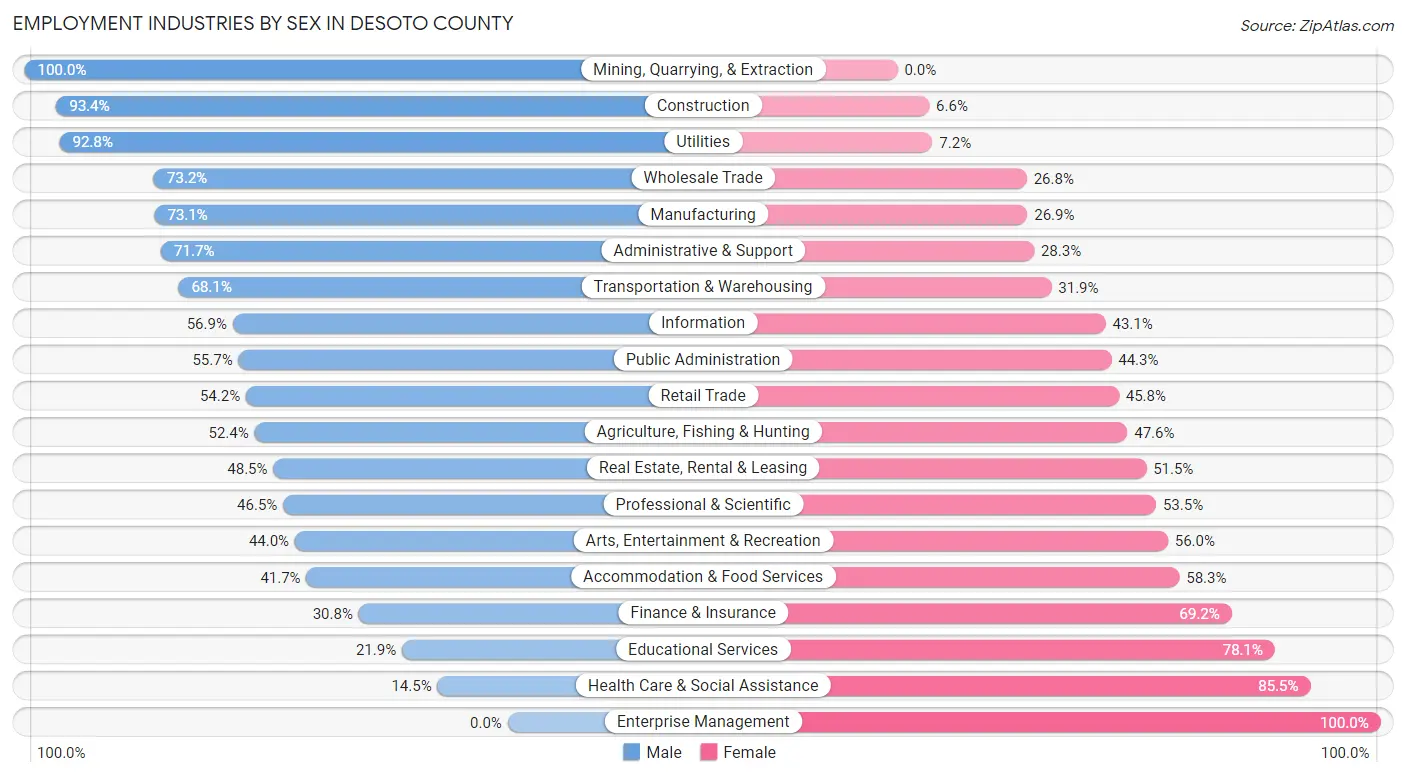
The DeSoto County industries that see more men than women are Mining, Quarrying, & Extraction (100.0%), Construction (93.4%), and Utilities (92.8%), whereas the industries that tend to have a higher number of women are Enterprise Management (100.0%), Health Care & Social Assistance (85.5%), and Educational Services (78.1%).
| Industry | Male | Female |
| Agriculture, Fishing & Hunting | 424 (52.4%) | 385 (47.6%) |
| Mining, Quarrying, & Extraction | 80 (100.0%) | 0 (0.0%) |
| Construction | 4,876 (93.4%) | 343 (6.6%) |
| Manufacturing | 7,982 (73.1%) | 2,935 (26.9%) |
| Wholesale Trade | 2,640 (73.2%) | 965 (26.8%) |
| Retail Trade | 5,607 (54.2%) | 4,742 (45.8%) |
| Transportation & Warehousing | 9,045 (68.1%) | 4,230 (31.9%) |
| Utilities | 500 (92.8%) | 39 (7.2%) |
| Information | 407 (56.9%) | 308 (43.1%) |
| Finance & Insurance | 870 (30.8%) | 1,951 (69.2%) |
| Real Estate, Rental & Leasing | 636 (48.5%) | 675 (51.5%) |
| Professional & Scientific | 1,785 (46.5%) | 2,055 (53.5%) |
| Enterprise Management | 0 (0.0%) | 100 (100.0%) |
| Administrative & Support | 2,760 (71.7%) | 1,088 (28.3%) |
| Educational Services | 1,642 (21.9%) | 5,859 (78.1%) |
| Health Care & Social Assistance | 1,796 (14.5%) | 10,555 (85.5%) |
| Arts, Entertainment & Recreation | 1,064 (44.0%) | 1,352 (56.0%) |
| Accommodation & Food Services | 2,363 (41.7%) | 3,309 (58.3%) |
| Public Administration | 2,115 (55.7%) | 1,680 (44.3%) |
| Total | 48,781 (52.2%) | 44,652 (47.8%) |
Education in DeSoto County
School Enrollment in DeSoto County
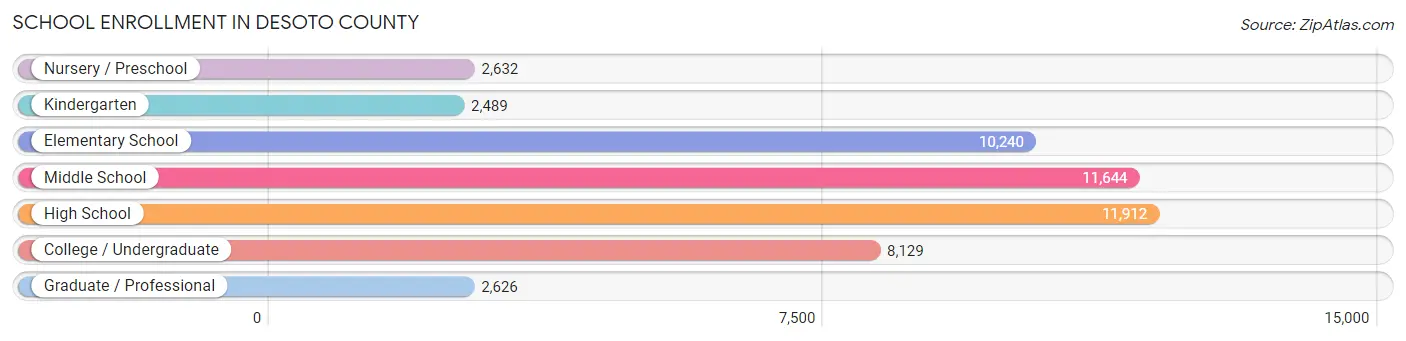
The most common levels of schooling among the 49,672 students in DeSoto County are high school (11,912 | 24.0%), middle school (11,644 | 23.4%), and elementary school (10,240 | 20.6%).
| School Level | # Students | % Students |
| Nursery / Preschool | 2,632 | 5.3% |
| Kindergarten | 2,489 | 5.0% |
| Elementary School | 10,240 | 20.6% |
| Middle School | 11,644 | 23.4% |
| High School | 11,912 | 24.0% |
| College / Undergraduate | 8,129 | 16.4% |
| Graduate / Professional | 2,626 | 5.3% |
| Total | 49,672 | 100.0% |
School Enrollment by Age by Funding Source in DeSoto County
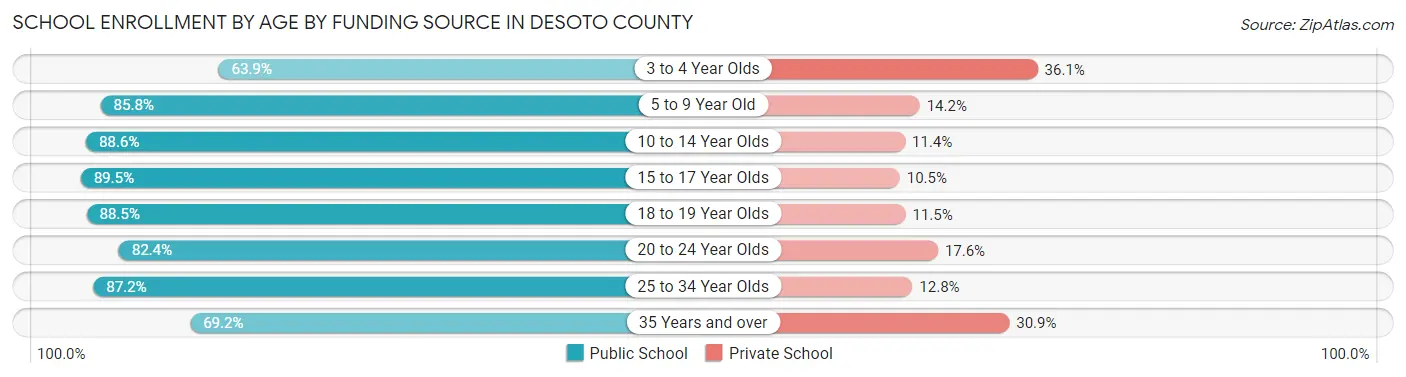
Out of a total of 49,672 students who are enrolled in schools in DeSoto County, 7,351 (14.8%) attend a private institution, while the remaining 42,321 (85.2%) are enrolled in public schools. The age group of 3 to 4 year olds has the highest likelihood of being enrolled in private schools, with 746 (36.1% in the age bracket) enrolled. Conversely, the age group of 15 to 17 year olds has the lowest likelihood of being enrolled in a private school, with 7,883 (89.5% in the age bracket) attending a public institution.
| Age Bracket | Public School | Private School |
| 3 to 4 Year Olds | 1,319 (63.9%) | 746 (36.1%) |
| 5 to 9 Year Old | 10,048 (85.8%) | 1,659 (14.2%) |
| 10 to 14 Year Olds | 12,585 (88.6%) | 1,625 (11.4%) |
| 15 to 17 Year Olds | 7,883 (89.5%) | 921 (10.5%) |
| 18 to 19 Year Olds | 2,986 (88.5%) | 389 (11.5%) |
| 20 to 24 Year Olds | 3,323 (82.4%) | 708 (17.6%) |
| 25 to 34 Year Olds | 1,907 (87.2%) | 280 (12.8%) |
| 35 Years and over | 2,277 (69.2%) | 1,016 (30.8%) |
| Total | 42,321 (85.2%) | 7,351 (14.8%) |
Educational Attainment by Field of Study in DeSoto County
Business (9,014 | 25.2%), education (5,659 | 15.8%), science & technology (5,073 | 14.2%), arts & humanities (3,290 | 9.2%), and bio, nature & agricultural (2,018 | 5.7%) are the most common fields of study among 35,722 individuals in DeSoto County who have obtained a bachelor's degree or higher.
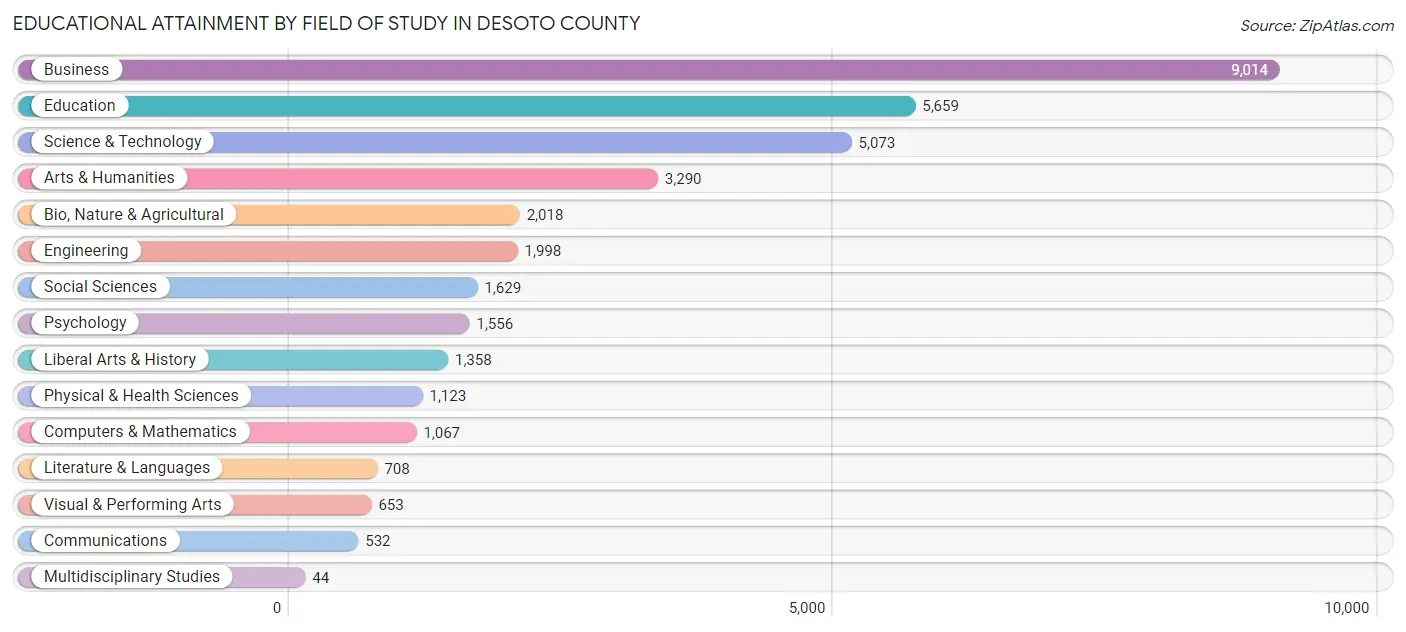
| Field of Study | # Graduates | % Graduates |
| Computers & Mathematics | 1,067 | 3.0% |
| Bio, Nature & Agricultural | 2,018 | 5.7% |
| Physical & Health Sciences | 1,123 | 3.1% |
| Psychology | 1,556 | 4.4% |
| Social Sciences | 1,629 | 4.6% |
| Engineering | 1,998 | 5.6% |
| Multidisciplinary Studies | 44 | 0.1% |
| Science & Technology | 5,073 | 14.2% |
| Business | 9,014 | 25.2% |
| Education | 5,659 | 15.8% |
| Literature & Languages | 708 | 2.0% |
| Liberal Arts & History | 1,358 | 3.8% |
| Visual & Performing Arts | 653 | 1.8% |
| Communications | 532 | 1.5% |
| Arts & Humanities | 3,290 | 9.2% |
| Total | 35,722 | 100.0% |
Transportation & Commute in DeSoto County
Vehicle Availability by Sex in DeSoto County
The most prevalent vehicle ownership categories in DeSoto County are males with 2 vehicles (19,143, accounting for 39.9%) and females with 2 vehicles (18,136, making up 43.4%).
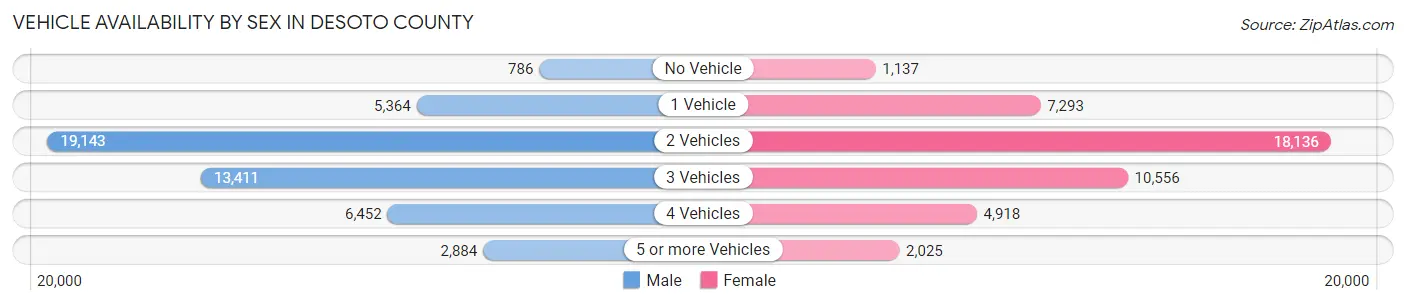
| Vehicles Available | Male | Female |
| No Vehicle | 786 (1.6%) | 1,137 (2.6%) |
| 1 Vehicle | 5,364 (11.2%) | 7,293 (16.6%) |
| 2 Vehicles | 19,143 (39.9%) | 18,136 (41.2%) |
| 3 Vehicles | 13,411 (27.9%) | 10,556 (24.0%) |
| 4 Vehicles | 6,452 (13.4%) | 4,918 (11.2%) |
| 5 or more Vehicles | 2,884 (6.0%) | 2,025 (4.6%) |
| Total | 48,040 (100.0%) | 44,065 (100.0%) |
Commute Time in DeSoto County
The most frequently occuring commute durations in DeSoto County are 30 to 34 minutes (15,679 commuters, 18.1%), 20 to 24 minutes (12,890 commuters, 14.9%), and 15 to 19 minutes (12,123 commuters, 14.0%).
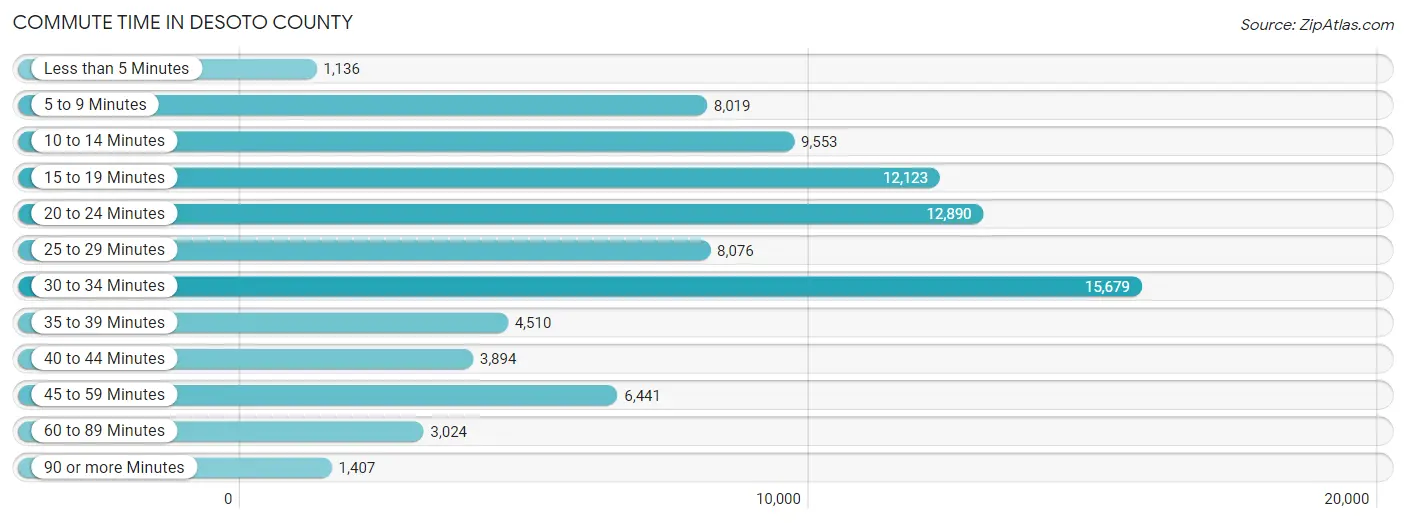
| Commute Time | # Commuters | % Commuters |
| Less than 5 Minutes | 1,136 | 1.3% |
| 5 to 9 Minutes | 8,019 | 9.2% |
| 10 to 14 Minutes | 9,553 | 11.0% |
| 15 to 19 Minutes | 12,123 | 14.0% |
| 20 to 24 Minutes | 12,890 | 14.9% |
| 25 to 29 Minutes | 8,076 | 9.3% |
| 30 to 34 Minutes | 15,679 | 18.1% |
| 35 to 39 Minutes | 4,510 | 5.2% |
| 40 to 44 Minutes | 3,894 | 4.5% |
| 45 to 59 Minutes | 6,441 | 7.4% |
| 60 to 89 Minutes | 3,024 | 3.5% |
| 90 or more Minutes | 1,407 | 1.6% |
Commute Time by Sex in DeSoto County
The most common commute times in DeSoto County are 30 to 34 minutes (8,922 commuters, 19.5%) for males and 30 to 34 minutes (6,757 commuters, 16.5%) for females.
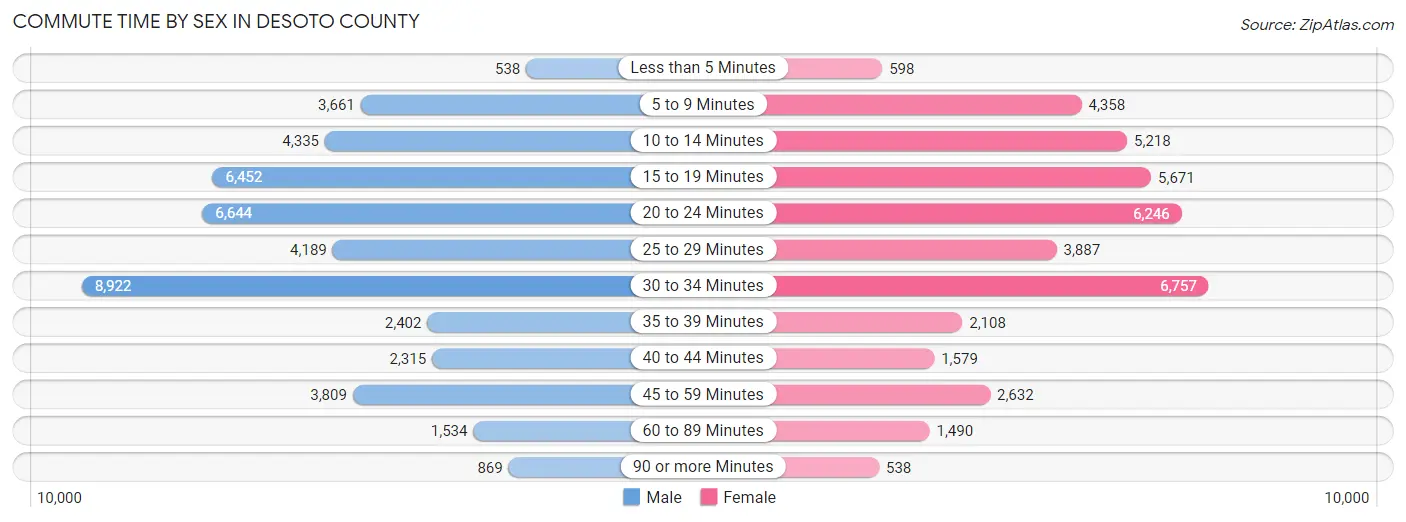
| Commute Time | Male | Female |
| Less than 5 Minutes | 538 (1.2%) | 598 (1.5%) |
| 5 to 9 Minutes | 3,661 (8.0%) | 4,358 (10.6%) |
| 10 to 14 Minutes | 4,335 (9.5%) | 5,218 (12.7%) |
| 15 to 19 Minutes | 6,452 (14.1%) | 5,671 (13.8%) |
| 20 to 24 Minutes | 6,644 (14.5%) | 6,246 (15.2%) |
| 25 to 29 Minutes | 4,189 (9.2%) | 3,887 (9.5%) |
| 30 to 34 Minutes | 8,922 (19.5%) | 6,757 (16.5%) |
| 35 to 39 Minutes | 2,402 (5.3%) | 2,108 (5.1%) |
| 40 to 44 Minutes | 2,315 (5.1%) | 1,579 (3.8%) |
| 45 to 59 Minutes | 3,809 (8.3%) | 2,632 (6.4%) |
| 60 to 89 Minutes | 1,534 (3.4%) | 1,490 (3.6%) |
| 90 or more Minutes | 869 (1.9%) | 538 (1.3%) |
Time of Departure to Work by Sex in DeSoto County
The most frequent times of departure to work in DeSoto County are 7:00 AM to 7:29 AM (7,019, 15.4%) for males and 7:00 AM to 7:29 AM (8,156, 19.9%) for females.
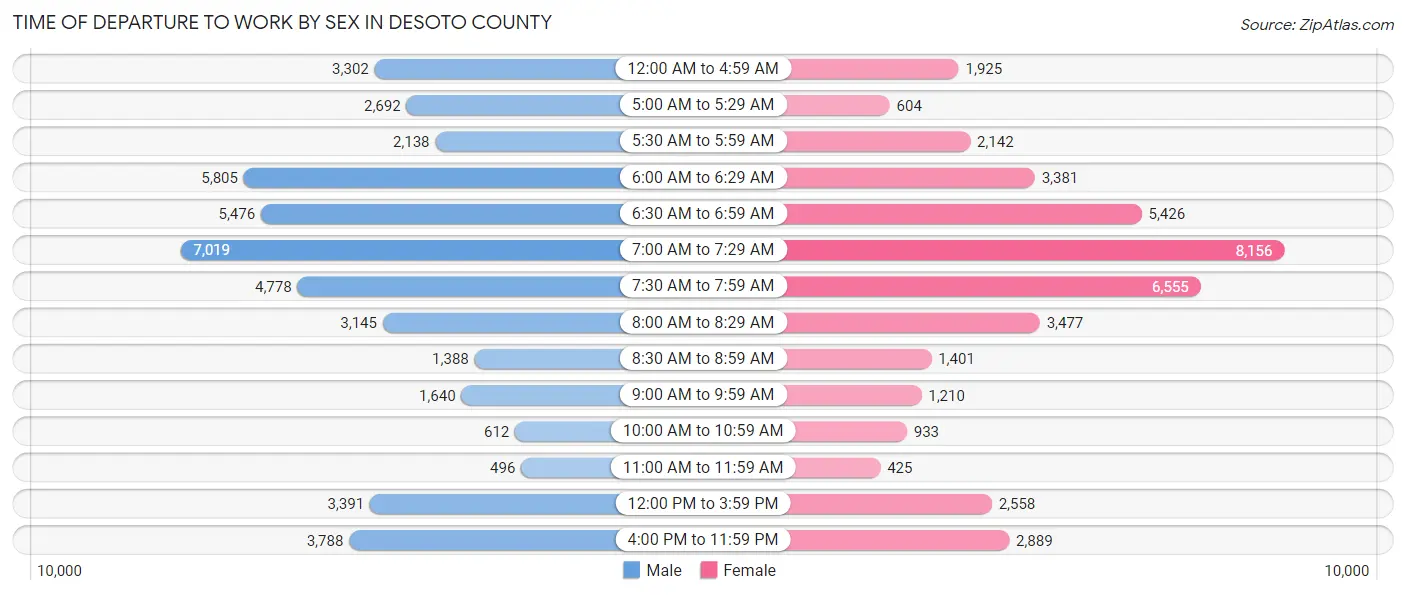
| Time of Departure | Male | Female |
| 12:00 AM to 4:59 AM | 3,302 (7.2%) | 1,925 (4.7%) |
| 5:00 AM to 5:29 AM | 2,692 (5.9%) | 604 (1.5%) |
| 5:30 AM to 5:59 AM | 2,138 (4.7%) | 2,142 (5.2%) |
| 6:00 AM to 6:29 AM | 5,805 (12.7%) | 3,381 (8.2%) |
| 6:30 AM to 6:59 AM | 5,476 (12.0%) | 5,426 (13.2%) |
| 7:00 AM to 7:29 AM | 7,019 (15.4%) | 8,156 (19.9%) |
| 7:30 AM to 7:59 AM | 4,778 (10.5%) | 6,555 (16.0%) |
| 8:00 AM to 8:29 AM | 3,145 (6.9%) | 3,477 (8.5%) |
| 8:30 AM to 8:59 AM | 1,388 (3.0%) | 1,401 (3.4%) |
| 9:00 AM to 9:59 AM | 1,640 (3.6%) | 1,210 (2.9%) |
| 10:00 AM to 10:59 AM | 612 (1.3%) | 933 (2.3%) |
| 11:00 AM to 11:59 AM | 496 (1.1%) | 425 (1.0%) |
| 12:00 PM to 3:59 PM | 3,391 (7.4%) | 2,558 (6.2%) |
| 4:00 PM to 11:59 PM | 3,788 (8.3%) | 2,889 (7.0%) |
| Total | 45,670 (100.0%) | 41,082 (100.0%) |
Housing Occupancy in DeSoto County
Occupancy by Ownership in DeSoto County
Of the total 68,353 dwellings in DeSoto County, owner-occupied units account for 52,255 (76.4%), while renter-occupied units make up 16,098 (23.5%).
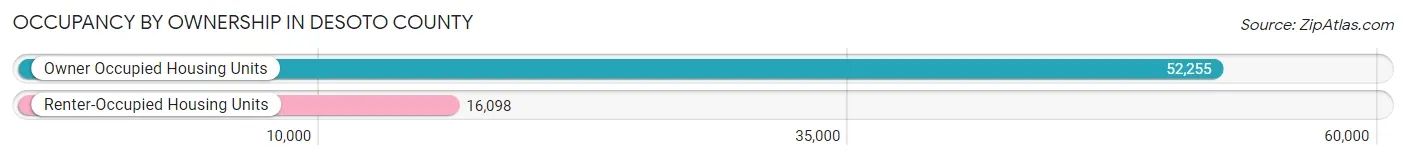
| Occupancy | # Housing Units | % Housing Units |
| Owner Occupied Housing Units | 52,255 | 76.4% |
| Renter-Occupied Housing Units | 16,098 | 23.5% |
| Total Occupied Housing Units | 68,353 | 100.0% |
Occupancy by Household Size in DeSoto County
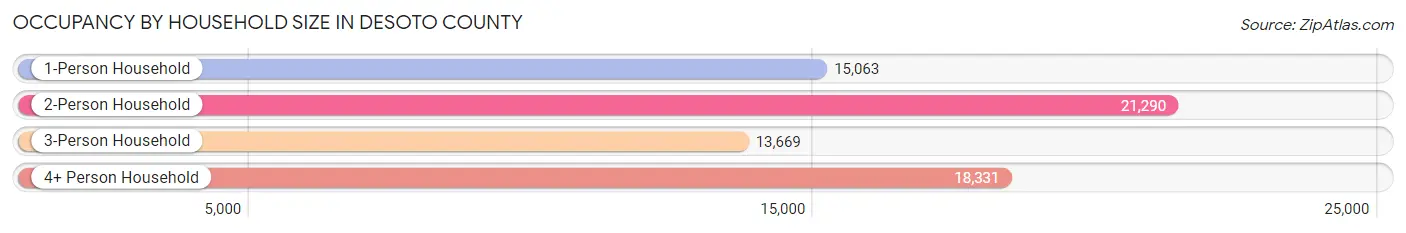
| Household Size | # Housing Units | % Housing Units |
| 1-Person Household | 15,063 | 22.0% |
| 2-Person Household | 21,290 | 31.1% |
| 3-Person Household | 13,669 | 20.0% |
| 4+ Person Household | 18,331 | 26.8% |
| Total Housing Units | 68,353 | 100.0% |
Occupancy by Ownership by Household Size in DeSoto County
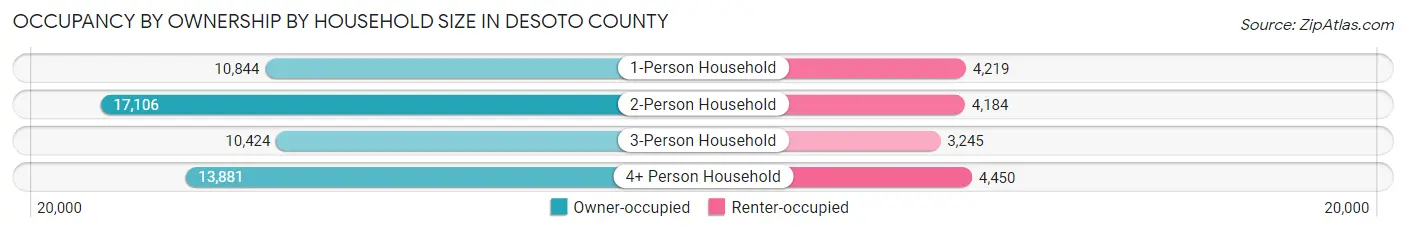
| Household Size | Owner-occupied | Renter-occupied |
| 1-Person Household | 10,844 (72.0%) | 4,219 (28.0%) |
| 2-Person Household | 17,106 (80.3%) | 4,184 (19.7%) |
| 3-Person Household | 10,424 (76.3%) | 3,245 (23.7%) |
| 4+ Person Household | 13,881 (75.7%) | 4,450 (24.3%) |
| Total Housing Units | 52,255 (76.4%) | 16,098 (23.5%) |
Occupancy by Educational Attainment in DeSoto County
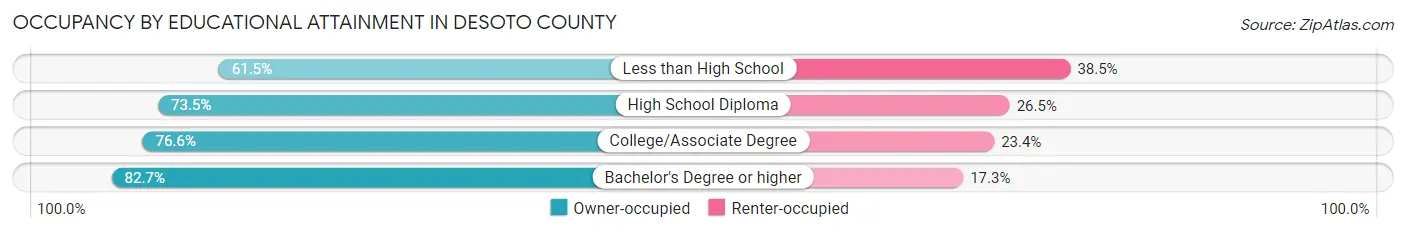
| Household Size | Owner-occupied | Renter-occupied |
| Less than High School | 3,281 (61.5%) | 2,056 (38.5%) |
| High School Diploma | 13,314 (73.5%) | 4,795 (26.5%) |
| College/Associate Degree | 18,644 (76.6%) | 5,697 (23.4%) |
| Bachelor's Degree or higher | 17,016 (82.7%) | 3,550 (17.3%) |
Occupancy by Age of Householder in DeSoto County
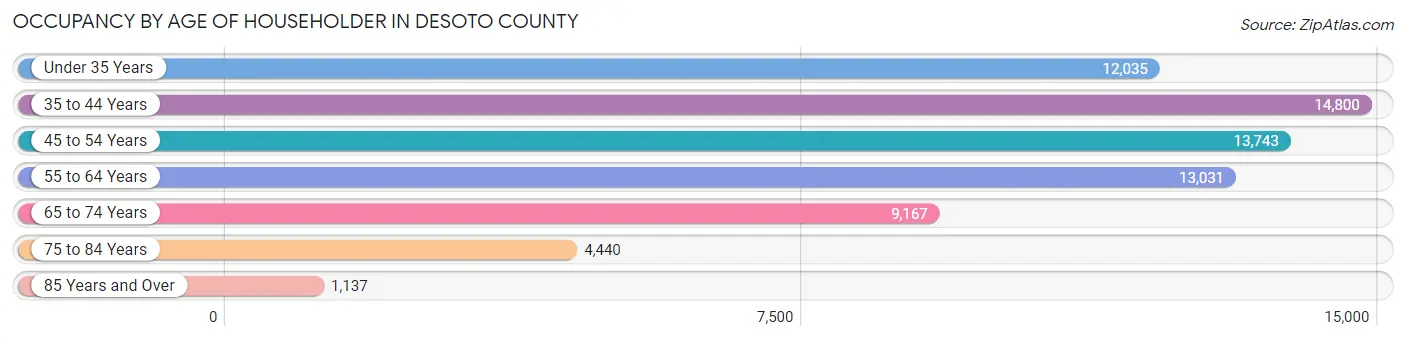
| Age Bracket | # Households | % Households |
| Under 35 Years | 12,035 | 17.6% |
| 35 to 44 Years | 14,800 | 21.6% |
| 45 to 54 Years | 13,743 | 20.1% |
| 55 to 64 Years | 13,031 | 19.1% |
| 65 to 74 Years | 9,167 | 13.4% |
| 75 to 84 Years | 4,440 | 6.5% |
| 85 Years and Over | 1,137 | 1.7% |
| Total | 68,353 | 100.0% |
Housing Finances in DeSoto County
Median Income by Occupancy in DeSoto County
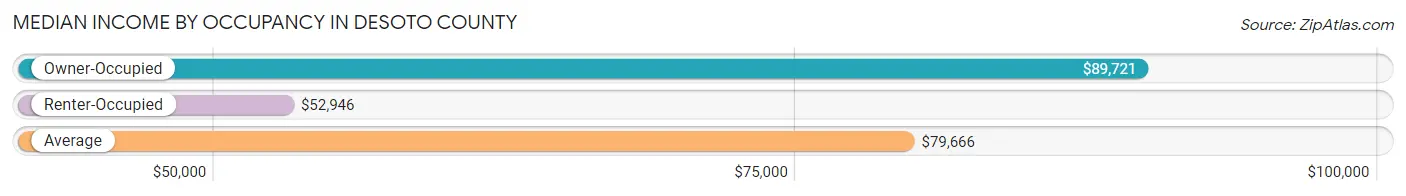
| Occupancy Type | # Households | Median Income |
| Owner-Occupied | 52,255 (76.4%) | $89,721 |
| Renter-Occupied | 16,098 (23.5%) | $52,946 |
| Average | 68,353 (100.0%) | $79,666 |
Occupancy by Householder Income Bracket in DeSoto County
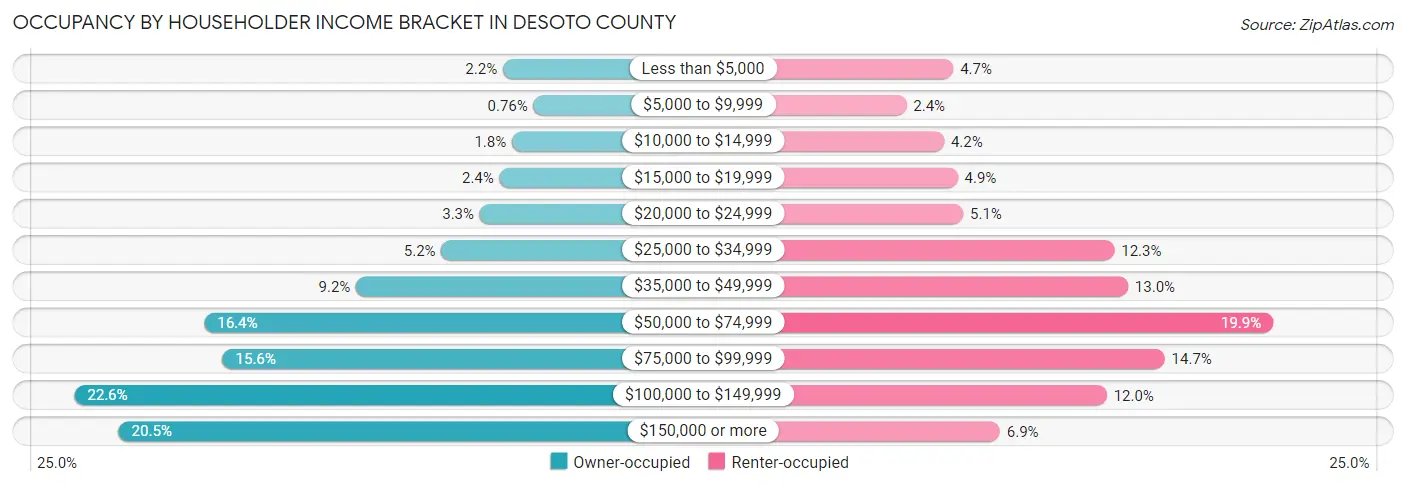
| Income Bracket | Owner-occupied | Renter-occupied |
| Less than $5,000 | 1,160 (2.2%) | 749 (4.6%) |
| $5,000 to $9,999 | 399 (0.8%) | 390 (2.4%) |
| $10,000 to $14,999 | 936 (1.8%) | 677 (4.2%) |
| $15,000 to $19,999 | 1,246 (2.4%) | 783 (4.9%) |
| $20,000 to $24,999 | 1,737 (3.3%) | 825 (5.1%) |
| $25,000 to $34,999 | 2,691 (5.1%) | 1,983 (12.3%) |
| $35,000 to $49,999 | 4,814 (9.2%) | 2,088 (13.0%) |
| $50,000 to $74,999 | 8,591 (16.4%) | 3,201 (19.9%) |
| $75,000 to $99,999 | 8,135 (15.6%) | 2,370 (14.7%) |
| $100,000 to $149,999 | 11,823 (22.6%) | 1,926 (12.0%) |
| $150,000 or more | 10,723 (20.5%) | 1,106 (6.9%) |
| Total | 52,255 (100.0%) | 16,098 (100.0%) |
Monthly Housing Cost Tiers in DeSoto County
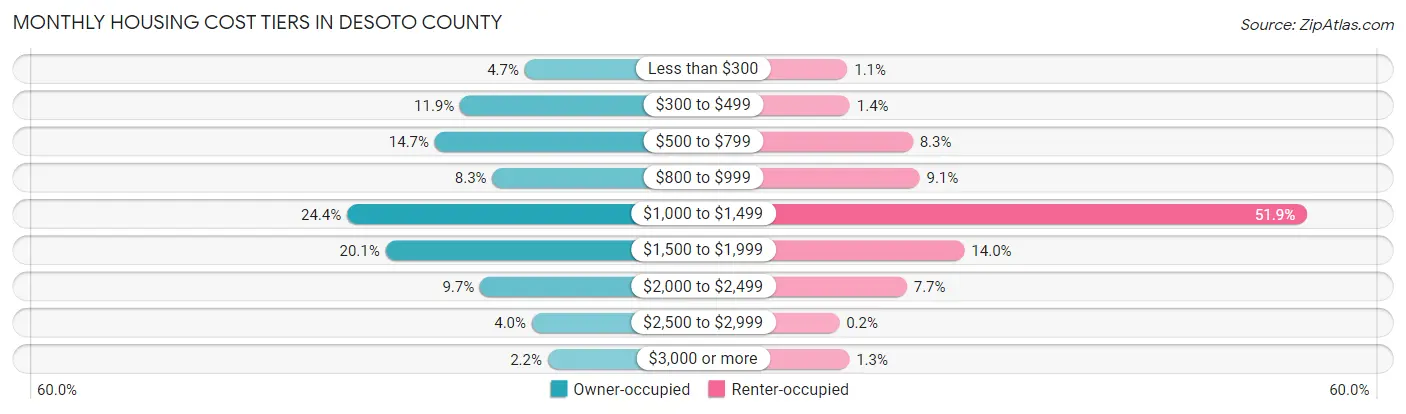
| Monthly Cost | Owner-occupied | Renter-occupied |
| Less than $300 | 2,479 (4.7%) | 175 (1.1%) |
| $300 to $499 | 6,215 (11.9%) | 220 (1.4%) |
| $500 to $799 | 7,670 (14.7%) | 1,339 (8.3%) |
| $800 to $999 | 4,347 (8.3%) | 1,460 (9.1%) |
| $1,000 to $1,499 | 12,740 (24.4%) | 8,351 (51.9%) |
| $1,500 to $1,999 | 10,517 (20.1%) | 2,258 (14.0%) |
| $2,000 to $2,499 | 5,065 (9.7%) | 1,233 (7.7%) |
| $2,500 to $2,999 | 2,070 (4.0%) | 33 (0.2%) |
| $3,000 or more | 1,152 (2.2%) | 210 (1.3%) |
| Total | 52,255 (100.0%) | 16,098 (100.0%) |
Physical Housing Characteristics in DeSoto County
Housing Structures in DeSoto County
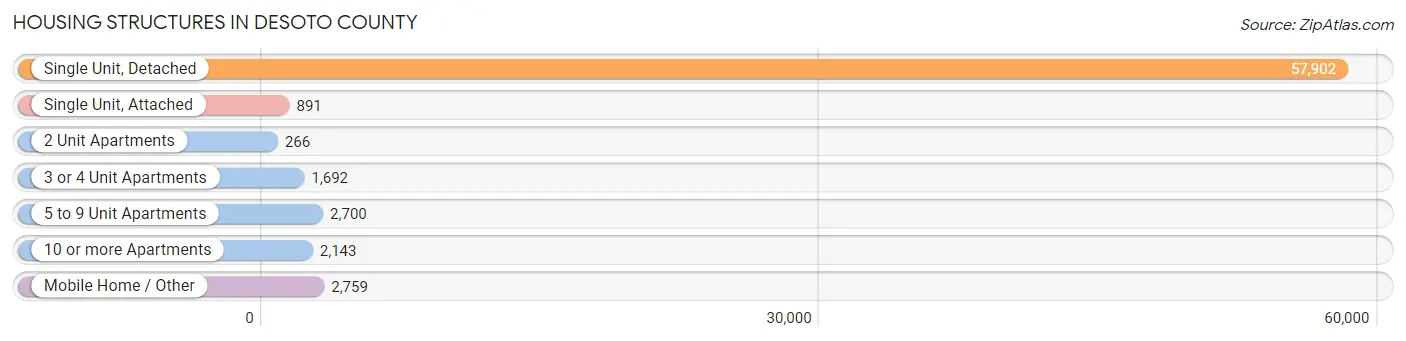
| Structure Type | # Housing Units | % Housing Units |
| Single Unit, Detached | 57,902 | 84.7% |
| Single Unit, Attached | 891 | 1.3% |
| 2 Unit Apartments | 266 | 0.4% |
| 3 or 4 Unit Apartments | 1,692 | 2.5% |
| 5 to 9 Unit Apartments | 2,700 | 4.0% |
| 10 or more Apartments | 2,143 | 3.1% |
| Mobile Home / Other | 2,759 | 4.0% |
| Total | 68,353 | 100.0% |
Housing Structures by Occupancy in DeSoto County
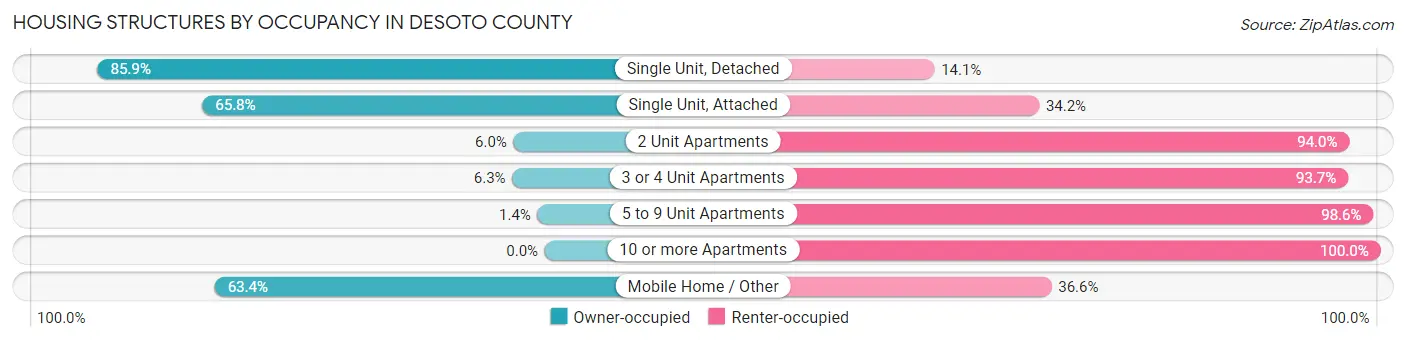
| Structure Type | Owner-occupied | Renter-occupied |
| Single Unit, Detached | 49,760 (85.9%) | 8,142 (14.1%) |
| Single Unit, Attached | 586 (65.8%) | 305 (34.2%) |
| 2 Unit Apartments | 16 (6.0%) | 250 (94.0%) |
| 3 or 4 Unit Apartments | 106 (6.3%) | 1,586 (93.7%) |
| 5 to 9 Unit Apartments | 38 (1.4%) | 2,662 (98.6%) |
| 10 or more Apartments | 0 (0.0%) | 2,143 (100.0%) |
| Mobile Home / Other | 1,749 (63.4%) | 1,010 (36.6%) |
| Total | 52,255 (76.4%) | 16,098 (23.5%) |
Housing Structures by Number of Rooms in DeSoto County
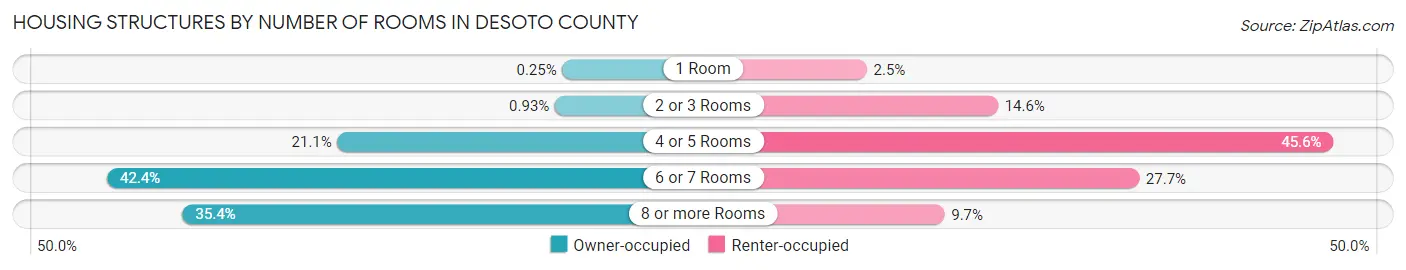
| Number of Rooms | Owner-occupied | Renter-occupied |
| 1 Room | 129 (0.3%) | 398 (2.5%) |
| 2 or 3 Rooms | 487 (0.9%) | 2,348 (14.6%) |
| 4 or 5 Rooms | 10,999 (21.0%) | 7,347 (45.6%) |
| 6 or 7 Rooms | 22,144 (42.4%) | 4,451 (27.7%) |
| 8 or more Rooms | 18,496 (35.4%) | 1,554 (9.7%) |
| Total | 52,255 (100.0%) | 16,098 (100.0%) |
Housing Structure by Heating Type in DeSoto County
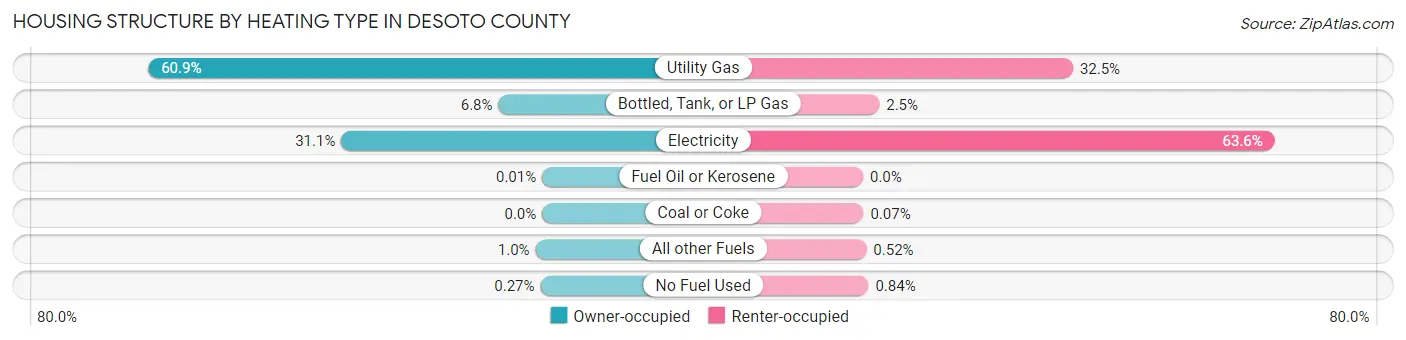
| Heating Type | Owner-occupied | Renter-occupied |
| Utility Gas | 31,811 (60.9%) | 5,223 (32.5%) |
| Bottled, Tank, or LP Gas | 3,533 (6.8%) | 404 (2.5%) |
| Electricity | 16,224 (31.0%) | 10,241 (63.6%) |
| Fuel Oil or Kerosene | 5 (0.0%) | 0 (0.0%) |
| Coal or Coke | 0 (0.0%) | 11 (0.1%) |
| All other Fuels | 539 (1.0%) | 83 (0.5%) |
| No Fuel Used | 143 (0.3%) | 136 (0.8%) |
| Total | 52,255 (100.0%) | 16,098 (100.0%) |
Household Vehicle Usage in DeSoto County
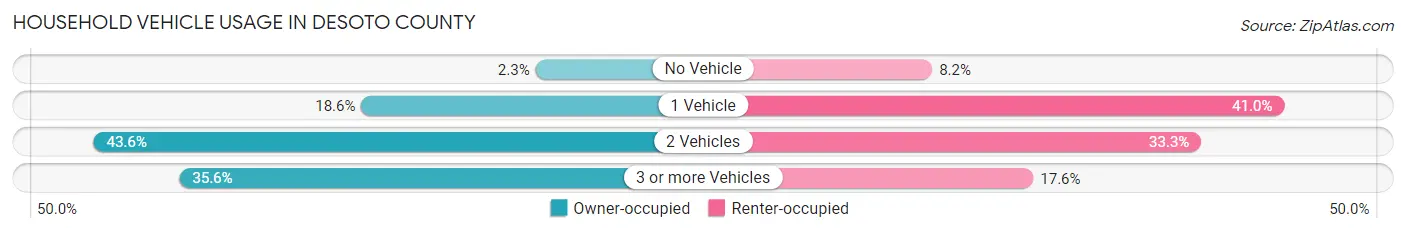
| Vehicles per Household | Owner-occupied | Renter-occupied |
| No Vehicle | 1,208 (2.3%) | 1,312 (8.2%) |
| 1 Vehicle | 9,706 (18.6%) | 6,602 (41.0%) |
| 2 Vehicles | 22,762 (43.6%) | 5,352 (33.3%) |
| 3 or more Vehicles | 18,579 (35.5%) | 2,832 (17.6%) |
| Total | 52,255 (100.0%) | 16,098 (100.0%) |
Real Estate & Mortgages in DeSoto County
Real Estate and Mortgage Overview in DeSoto County
| Characteristic | Without Mortgage | With Mortgage |
| Housing Units | 15,873 | 36,382 |
| Median Property Value | $210,600 | $235,100 |
| Median Household Income | $62,390 | $8,386 |
| Monthly Housing Costs | $481 | $1,117 |
| Real Estate Taxes | $1,284 | $2,724 |
Property Value by Mortgage Status in DeSoto County
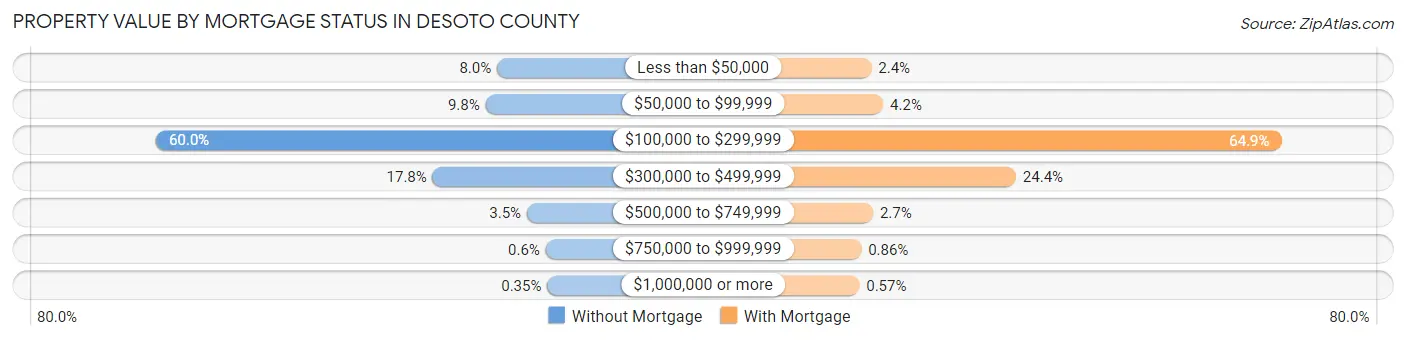
| Property Value | Without Mortgage | With Mortgage |
| Less than $50,000 | 1,272 (8.0%) | 875 (2.4%) |
| $50,000 to $99,999 | 1,549 (9.8%) | 1,530 (4.2%) |
| $100,000 to $299,999 | 9,521 (60.0%) | 23,603 (64.9%) |
| $300,000 to $499,999 | 2,830 (17.8%) | 8,891 (24.4%) |
| $500,000 to $749,999 | 549 (3.5%) | 963 (2.6%) |
| $750,000 to $999,999 | 96 (0.6%) | 313 (0.9%) |
| $1,000,000 or more | 56 (0.4%) | 207 (0.6%) |
| Total | 15,873 (100.0%) | 36,382 (100.0%) |
Household Income by Mortgage Status in DeSoto County
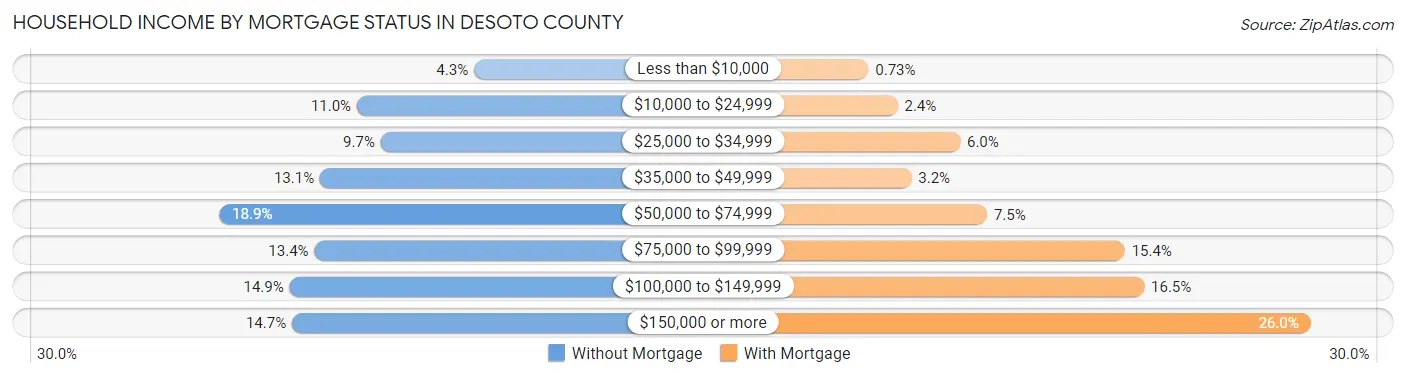
| Household Income | Without Mortgage | With Mortgage |
| Less than $10,000 | 685 (4.3%) | 264 (0.7%) |
| $10,000 to $24,999 | 1,747 (11.0%) | 874 (2.4%) |
| $25,000 to $34,999 | 1,531 (9.7%) | 2,172 (6.0%) |
| $35,000 to $49,999 | 2,083 (13.1%) | 1,160 (3.2%) |
| $50,000 to $74,999 | 2,997 (18.9%) | 2,731 (7.5%) |
| $75,000 to $99,999 | 2,134 (13.4%) | 5,594 (15.4%) |
| $100,000 to $149,999 | 2,359 (14.9%) | 6,001 (16.5%) |
| $150,000 or more | 2,337 (14.7%) | 9,464 (26.0%) |
| Total | 15,873 (100.0%) | 36,382 (100.0%) |
Property Value to Household Income Ratio in DeSoto County
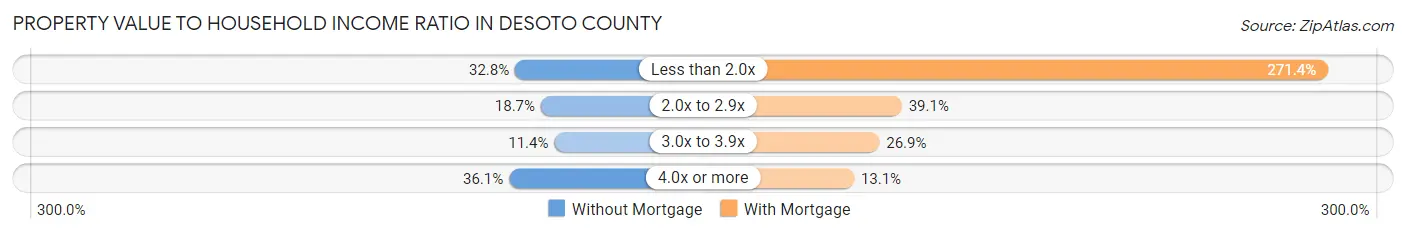
| Value-to-Income Ratio | Without Mortgage | With Mortgage |
| Less than 2.0x | 5,206 (32.8%) | 98,731 (271.4%) |
| 2.0x to 2.9x | 2,970 (18.7%) | 14,233 (39.1%) |
| 3.0x to 3.9x | 1,812 (11.4%) | 9,781 (26.9%) |
| 4.0x or more | 5,725 (36.1%) | 4,761 (13.1%) |
| Total | 15,873 (100.0%) | 36,382 (100.0%) |
Real Estate Taxes by Mortgage Status in DeSoto County
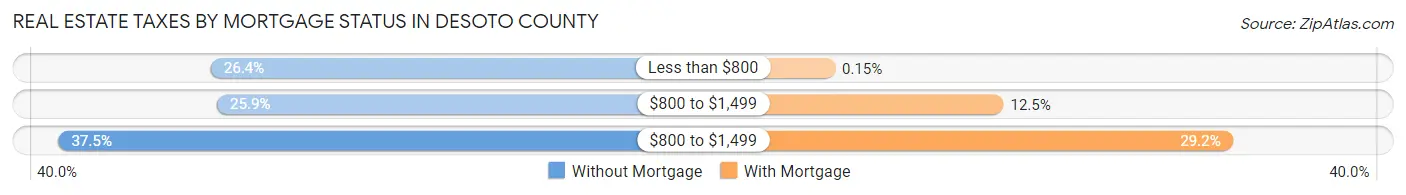
| Property Taxes | Without Mortgage | With Mortgage |
| Less than $800 | 4,189 (26.4%) | 53 (0.2%) |
| $800 to $1,499 | 4,116 (25.9%) | 4,535 (12.5%) |
| $800 to $1,499 | 5,956 (37.5%) | 10,617 (29.2%) |
| Total | 15,873 (100.0%) | 36,382 (100.0%) |
Health & Disability in DeSoto County
Health Insurance Coverage by Age in DeSoto County
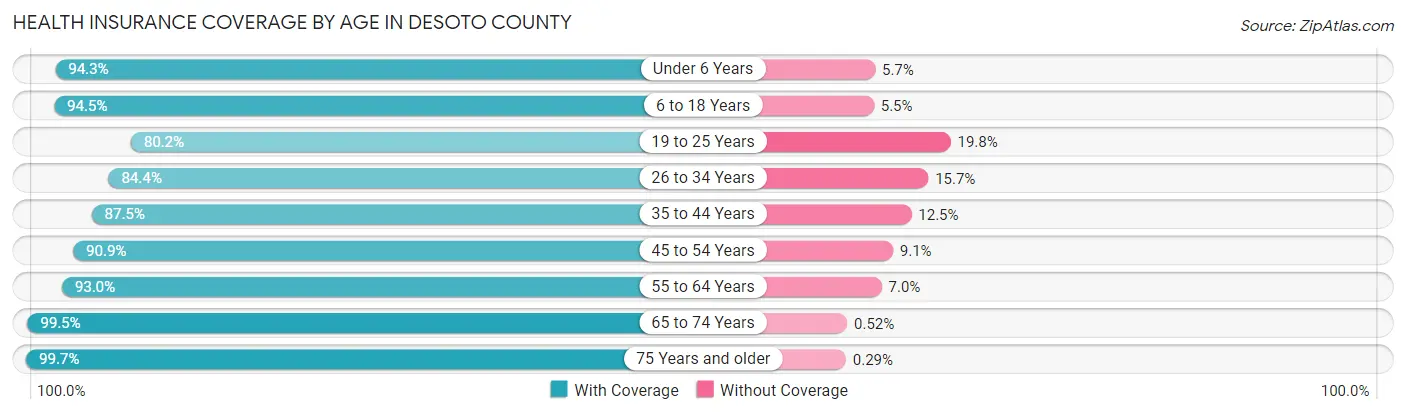
| Age Bracket | With Coverage | Without Coverage |
| Under 6 Years | 12,579 (94.3%) | 765 (5.7%) |
| 6 to 18 Years | 34,104 (94.5%) | 1,983 (5.5%) |
| 19 to 25 Years | 13,031 (80.2%) | 3,220 (19.8%) |
| 26 to 34 Years | 18,053 (84.4%) | 3,350 (15.7%) |
| 35 to 44 Years | 22,768 (87.5%) | 3,252 (12.5%) |
| 45 to 54 Years | 23,290 (90.9%) | 2,321 (9.1%) |
| 55 to 64 Years | 20,532 (93.0%) | 1,537 (7.0%) |
| 65 to 74 Years | 15,020 (99.5%) | 79 (0.5%) |
| 75 Years and older | 9,068 (99.7%) | 26 (0.3%) |
| Total | 168,445 (91.1%) | 16,533 (8.9%) |
Health Insurance Coverage by Citizenship Status in DeSoto County
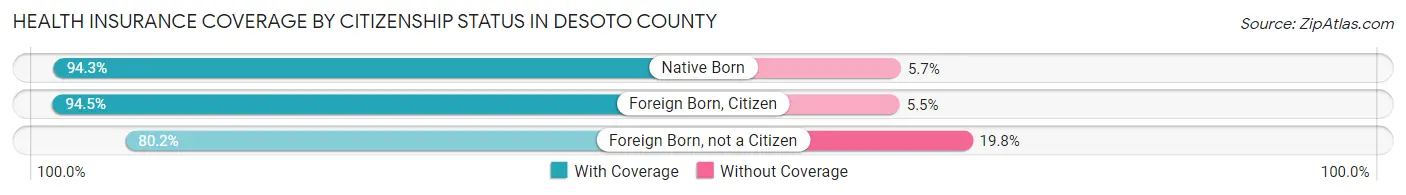
| Citizenship Status | With Coverage | Without Coverage |
| Native Born | 12,579 (94.3%) | 765 (5.7%) |
| Foreign Born, Citizen | 34,104 (94.5%) | 1,983 (5.5%) |
| Foreign Born, not a Citizen | 13,031 (80.2%) | 3,220 (19.8%) |
Health Insurance Coverage by Household Income in DeSoto County
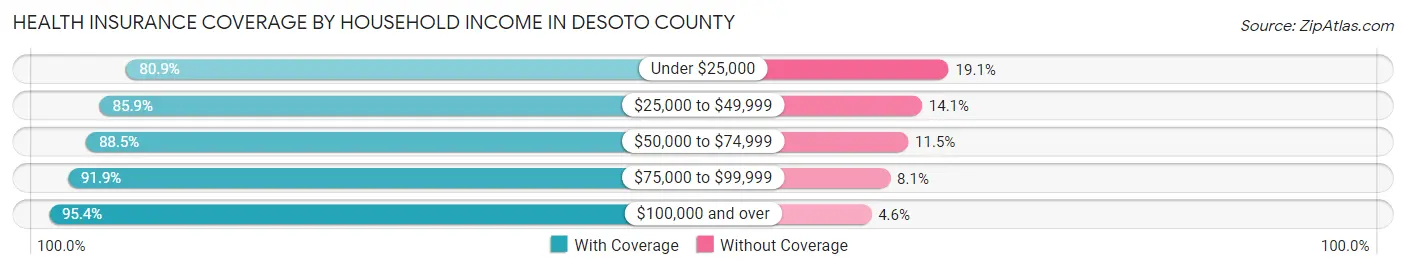
| Household Income | With Coverage | Without Coverage |
| Under $25,000 | 14,755 (80.9%) | 3,479 (19.1%) |
| $25,000 to $49,999 | 21,234 (85.9%) | 3,473 (14.1%) |
| $50,000 to $74,999 | 26,272 (88.5%) | 3,415 (11.5%) |
| $75,000 to $99,999 | 26,714 (91.9%) | 2,360 (8.1%) |
| $100,000 and over | 79,435 (95.4%) | 3,803 (4.6%) |
Public vs Private Health Insurance Coverage by Age in DeSoto County
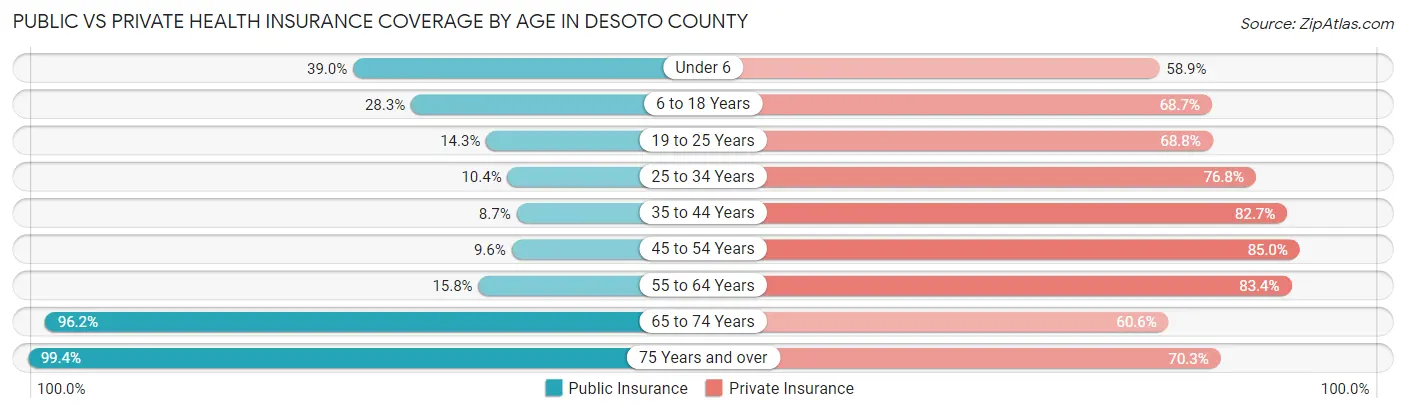
| Age Bracket | Public Insurance | Private Insurance |
| Under 6 | 5,208 (39.0%) | 7,865 (58.9%) |
| 6 to 18 Years | 10,204 (28.3%) | 24,777 (68.7%) |
| 19 to 25 Years | 2,326 (14.3%) | 11,183 (68.8%) |
| 25 to 34 Years | 2,219 (10.4%) | 16,443 (76.8%) |
| 35 to 44 Years | 2,264 (8.7%) | 21,505 (82.7%) |
| 45 to 54 Years | 2,460 (9.6%) | 21,768 (85.0%) |
| 55 to 64 Years | 3,477 (15.8%) | 18,415 (83.4%) |
| 65 to 74 Years | 14,532 (96.2%) | 9,156 (60.6%) |
| 75 Years and over | 9,041 (99.4%) | 6,392 (70.3%) |
| Total | 51,731 (28.0%) | 137,504 (74.3%) |
Disability Status by Sex by Age in DeSoto County
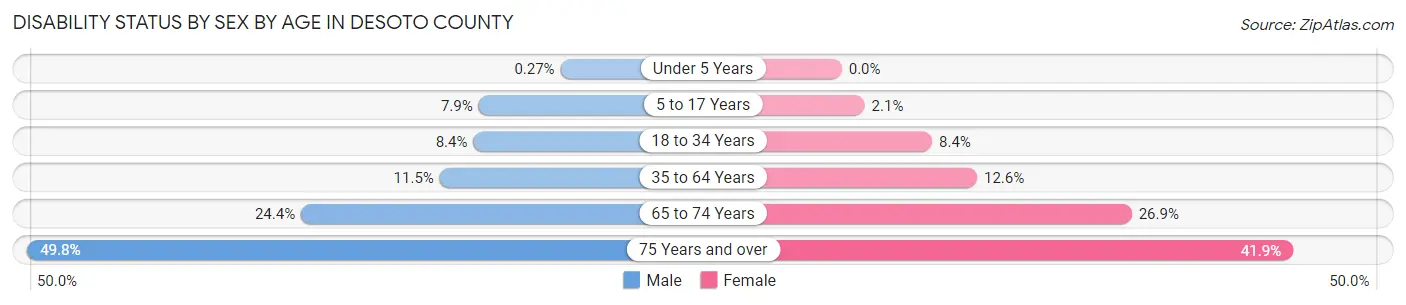
| Age Bracket | Male | Female |
| Under 5 Years | 15 (0.3%) | 0 (0.0%) |
| 5 to 17 Years | 1,445 (7.9%) | 374 (2.1%) |
| 18 to 34 Years | 1,650 (8.4%) | 1,716 (8.4%) |
| 35 to 64 Years | 4,029 (11.5%) | 4,844 (12.6%) |
| 65 to 74 Years | 1,682 (24.3%) | 2,204 (26.9%) |
| 75 Years and over | 1,820 (49.7%) | 2,276 (41.9%) |
Disability Class by Sex by Age in DeSoto County
Disability Class: Hearing Difficulty
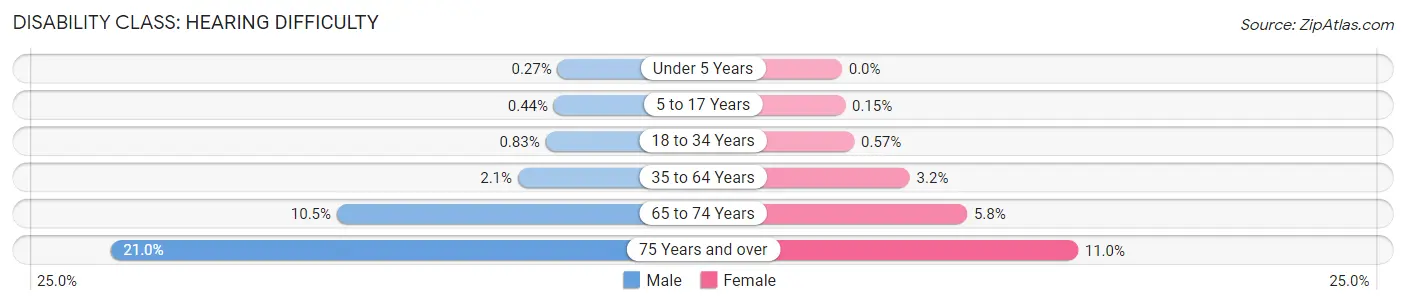
| Age Bracket | Male | Female |
| Under 5 Years | 15 (0.3%) | 0 (0.0%) |
| 5 to 17 Years | 81 (0.4%) | 27 (0.2%) |
| 18 to 34 Years | 164 (0.8%) | 117 (0.6%) |
| 35 to 64 Years | 739 (2.1%) | 1,214 (3.2%) |
| 65 to 74 Years | 726 (10.5%) | 476 (5.8%) |
| 75 Years and over | 769 (21.0%) | 595 (11.0%) |
Disability Class: Vision Difficulty
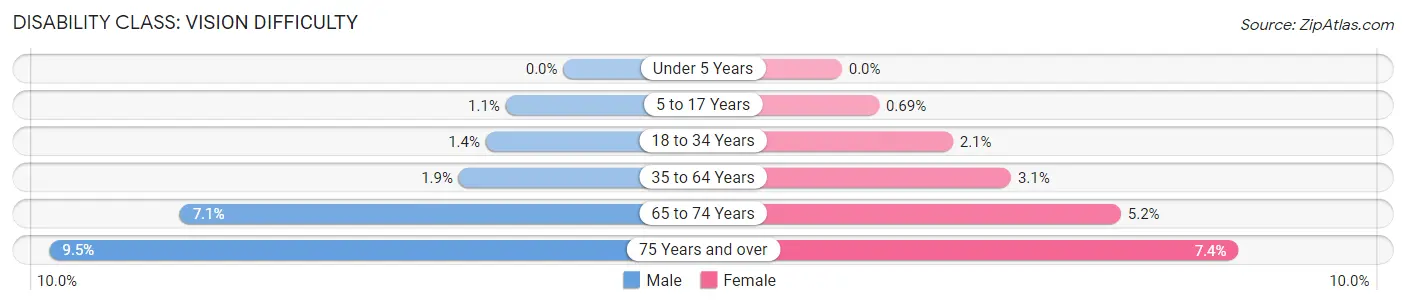
| Age Bracket | Male | Female |
| Under 5 Years | 0 (0.0%) | 0 (0.0%) |
| 5 to 17 Years | 196 (1.1%) | 122 (0.7%) |
| 18 to 34 Years | 285 (1.4%) | 423 (2.1%) |
| 35 to 64 Years | 682 (1.9%) | 1,213 (3.1%) |
| 65 to 74 Years | 492 (7.1%) | 424 (5.2%) |
| 75 Years and over | 349 (9.5%) | 400 (7.4%) |
Disability Class: Cognitive Difficulty
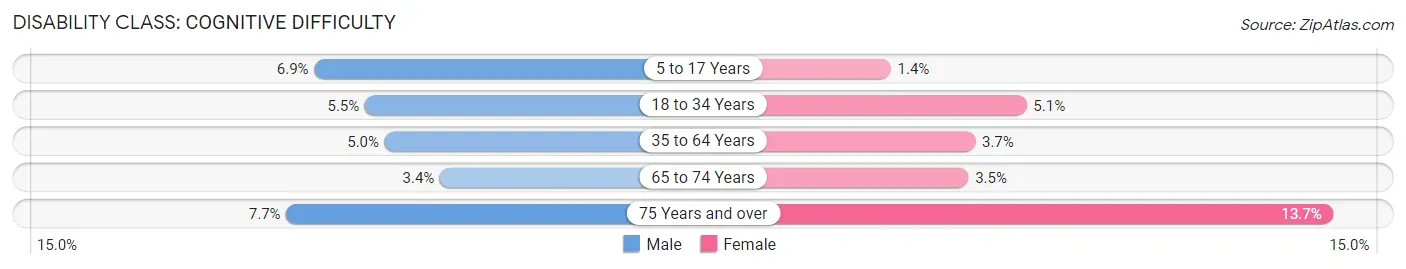
| Age Bracket | Male | Female |
| 5 to 17 Years | 1,272 (6.9%) | 240 (1.4%) |
| 18 to 34 Years | 1,090 (5.5%) | 1,053 (5.1%) |
| 35 to 64 Years | 1,745 (5.0%) | 1,433 (3.7%) |
| 65 to 74 Years | 237 (3.4%) | 288 (3.5%) |
| 75 Years and over | 282 (7.7%) | 744 (13.7%) |
Disability Class: Ambulatory Difficulty
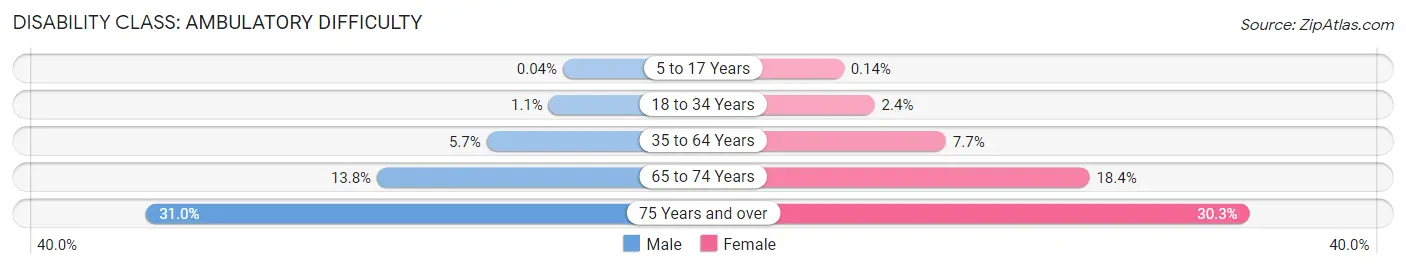
| Age Bracket | Male | Female |
| 5 to 17 Years | 7 (0.0%) | 24 (0.1%) |
| 18 to 34 Years | 215 (1.1%) | 499 (2.4%) |
| 35 to 64 Years | 2,000 (5.7%) | 2,982 (7.7%) |
| 65 to 74 Years | 956 (13.8%) | 1,506 (18.4%) |
| 75 Years and over | 1,133 (31.0%) | 1,645 (30.3%) |
Disability Class: Self-Care Difficulty
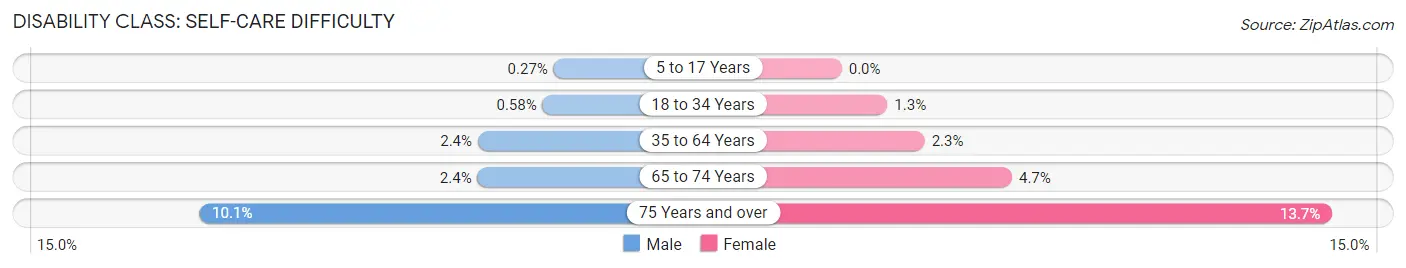
| Age Bracket | Male | Female |
| 5 to 17 Years | 50 (0.3%) | 0 (0.0%) |
| 18 to 34 Years | 115 (0.6%) | 261 (1.3%) |
| 35 to 64 Years | 834 (2.4%) | 892 (2.3%) |
| 65 to 74 Years | 165 (2.4%) | 388 (4.7%) |
| 75 Years and over | 371 (10.1%) | 742 (13.7%) |
Technology Access in DeSoto County
Computing Device Access in DeSoto County
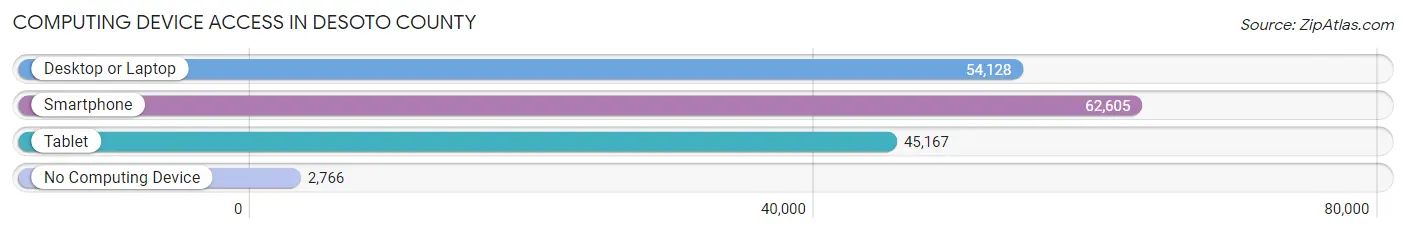
| Device Type | # Households | % Households |
| Desktop or Laptop | 54,128 | 79.2% |
| Smartphone | 62,605 | 91.6% |
| Tablet | 45,167 | 66.1% |
| No Computing Device | 2,766 | 4.1% |
| Total | 68,353 | 100.0% |
Internet Access in DeSoto County
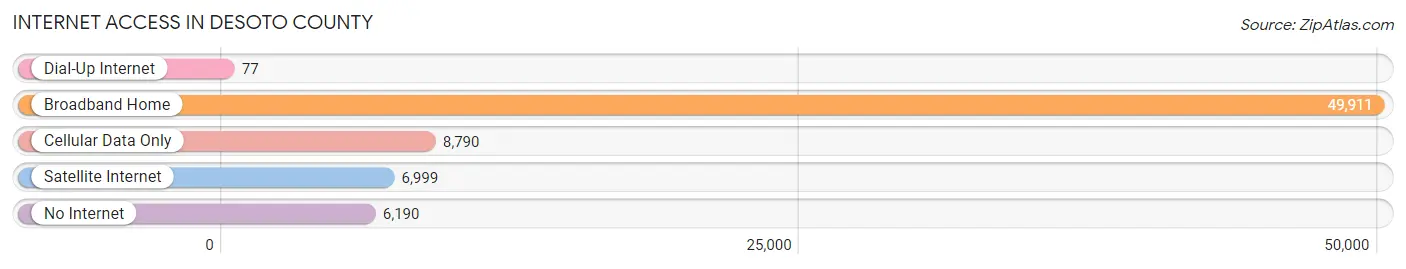
| Internet Type | # Households | % Households |
| Dial-Up Internet | 77 | 0.1% |
| Broadband Home | 49,911 | 73.0% |
| Cellular Data Only | 8,790 | 12.9% |
| Satellite Internet | 6,999 | 10.2% |
| No Internet | 6,190 | 9.1% |
| Total | 68,353 | 100.0% |
DeSoto County Summary
DeSoto County, Mississippi is located in the northwest corner of the state and is part of the Memphis metropolitan area. It is bordered by Tate County to the north, Marshall County to the east, Tunica County to the south, and Crittenden County, Arkansas to the west. The county seat is Hernando, and the largest city is Southaven. As of the 2010 census, the population of DeSoto County was 161,252, making it the third most populous county in Mississippi.
History
DeSoto County was established in 1836 and named after the Spanish explorer Hernando de Soto. The county was originally part of the Chickasaw Nation, and the area was home to several Native American tribes, including the Chickasaw, Choctaw, and Cherokee. The first European settlers arrived in the area in the early 1800s, and the county was officially organized in 1836.
During the Civil War, DeSoto County was a major site of conflict. The Battle of Brices Cross Roads was fought in the county in 1864, and the Battle of Harrisburg was fought in the county in 1865. After the war, the county experienced a period of economic growth, with the development of cotton plantations and the construction of the Memphis and Charleston Railroad.
Geography
DeSoto County covers an area of 576 square miles and is located in the northwest corner of Mississippi. It is bordered by Tate County to the north, Marshall County to the east, Tunica County to the south, and Crittenden County, Arkansas to the west. The county is located in the Mississippi Delta region and is part of the Memphis metropolitan area.
The terrain of DeSoto County is mostly flat, with some rolling hills in the northern part of the county. The county is drained by the Coldwater, Loosahatchie, and Wolf Rivers. The county is home to several state parks, including the DeSoto National Forest, the Holly Springs National Forest, and the John W. Kyle State Park.
Economy
DeSoto County has a diverse economy, with a mix of manufacturing, retail, and service industries. The county is home to several major employers, including FedEx, Nike, and the DeSoto County School District. The county is also home to several large shopping centers, including the Southaven Towne Center and the Tanger Outlets.
The county is also home to several agricultural operations, including cotton, soybeans, and corn. The county is also home to several wineries and vineyards, including the DeSoto Cellars Winery and the Old South Winery.
Demographics
As of the 2010 census, the population of DeSoto County was 161,252, making it the third most populous county in Mississippi. The population is spread out, with 48.3% of the population under the age of 18, and 51.7% over the age of 18. The median age is 34.7 years.
The racial makeup of the county is 79.2% White, 17.3% African American, 0.7% Native American, 1.2% Asian, 0.1% Pacific Islander, 0.7% from other races, and 1.0% from two or more races. The Hispanic or Latino population of the county is 2.3%.
The median household income in DeSoto County is $60,945, and the median family income is $71,845. The per capita income is $27,845. The poverty rate is 11.3%.
Common Questions
What is Per Capita Income in DeSoto County?
Per Capita income in DeSoto County is $34,989.
What is the Median Family Income in DeSoto County?
Median Family Income in DeSoto County is $90,760.
What is the Median Household income in DeSoto County?
Median Household Income in DeSoto County is $79,666.
What is Income or Wage Gap in DeSoto County?
Income or Wage Gap in DeSoto County is 22.4%.
Women in DeSoto County earn 77.6 cents for every dollar earned by a man.
What is Family Income Deficit in DeSoto County?
Family Income Deficit in DeSoto County is $13,222.
Families that are below poverty line in DeSoto County earn $13,222 less on average than the poverty threshold level.
What is Inequality or Gini Index in DeSoto County?
Inequality or Gini Index in DeSoto County is 0.40.
What is the Total Population of DeSoto County?
Total Population of DeSoto County is 186,214.
What is the Total Male Population of DeSoto County?
Total Male Population of DeSoto County is 90,194.
What is the Total Female Population of DeSoto County?
Total Female Population of DeSoto County is 96,020.
What is the Ratio of Males per 100 Females in DeSoto County?
There are 93.93 Males per 100 Females in DeSoto County.
What is the Ratio of Females per 100 Males in DeSoto County?
There are 106.46 Females per 100 Males in DeSoto County.
What is the Median Population Age in DeSoto County?
Median Population Age in DeSoto County is 37.1 Years.
What is the Average Family Size in DeSoto County
Average Family Size in DeSoto County is 3.2 People.
What is the Average Household Size in DeSoto County
Average Household Size in DeSoto County is 2.7 People.
How Large is the Labor Force in DeSoto County?
There are 98,063 People in the Labor Forcein in DeSoto County.
What is the Percentage of People in the Labor Force in DeSoto County?
67.6% of People are in the Labor Force in DeSoto County.
What is the Unemployment Rate in DeSoto County?
Unemployment Rate in DeSoto County is 4.4%.