Copiah County, MS Map & Demographics
Copiah County Map
Copiah County Overview
$28,072
PER CAPITA INCOME
$60,159
AVG FAMILY INCOME
$46,889
AVG HOUSEHOLD INCOME
39.5%
WAGE / INCOME GAP [ % ]
60.5¢/ $1
WAGE / INCOME GAP [ $ ]
$10,966
FAMILY INCOME DEFICIT
0.54
INEQUALITY / GINI INDEX
28,210
TOTAL POPULATION
13,135
MALE POPULATION
15,075
FEMALE POPULATION
87.13
MALES / 100 FEMALES
114.77
FEMALES / 100 MALES
39.6
MEDIAN AGE
3.5
AVG FAMILY SIZE
2.8
AVG HOUSEHOLD SIZE
11,370
LABOR FORCE [ PEOPLE ]
50.1%
PERCENT IN LABOR FORCE
5.2%
UNEMPLOYMENT RATE
Income in Copiah County
Income Overview in Copiah County
Per Capita Income in Copiah County is $28,072, while median incomes of families and households are $60,159 and $46,889 respectively.
| Characteristic | Number | Measure |
| Per Capita Income | 28,210 | $28,072 |
| Median Family Income | 6,679 | $60,159 |
| Mean Family Income | 6,679 | $90,761 |
| Median Household Income | 9,841 | $46,889 |
| Mean Household Income | 9,841 | $75,649 |
| Income Deficit | 6,679 | $10,966 |
| Wage / Income Gap (%) | 28,210 | 39.50% |
| Wage / Income Gap ($) | 28,210 | 60.50¢ per $1 |
| Gini / Inequality Index | 28,210 | 0.54 |
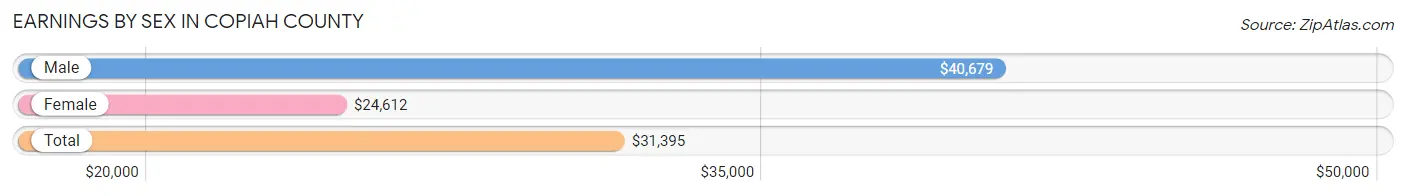
Earnings by Sex in Copiah County
Average Earnings in Copiah County are $31,395, $40,679 for men and $24,612 for women, a difference of 39.5%.
| Sex | Number | Average Earnings |
| Male | 6,139 (51.3%) | $40,679 |
| Female | 5,832 (48.7%) | $24,612 |
| Total | 11,971 (100.0%) | $31,395 |
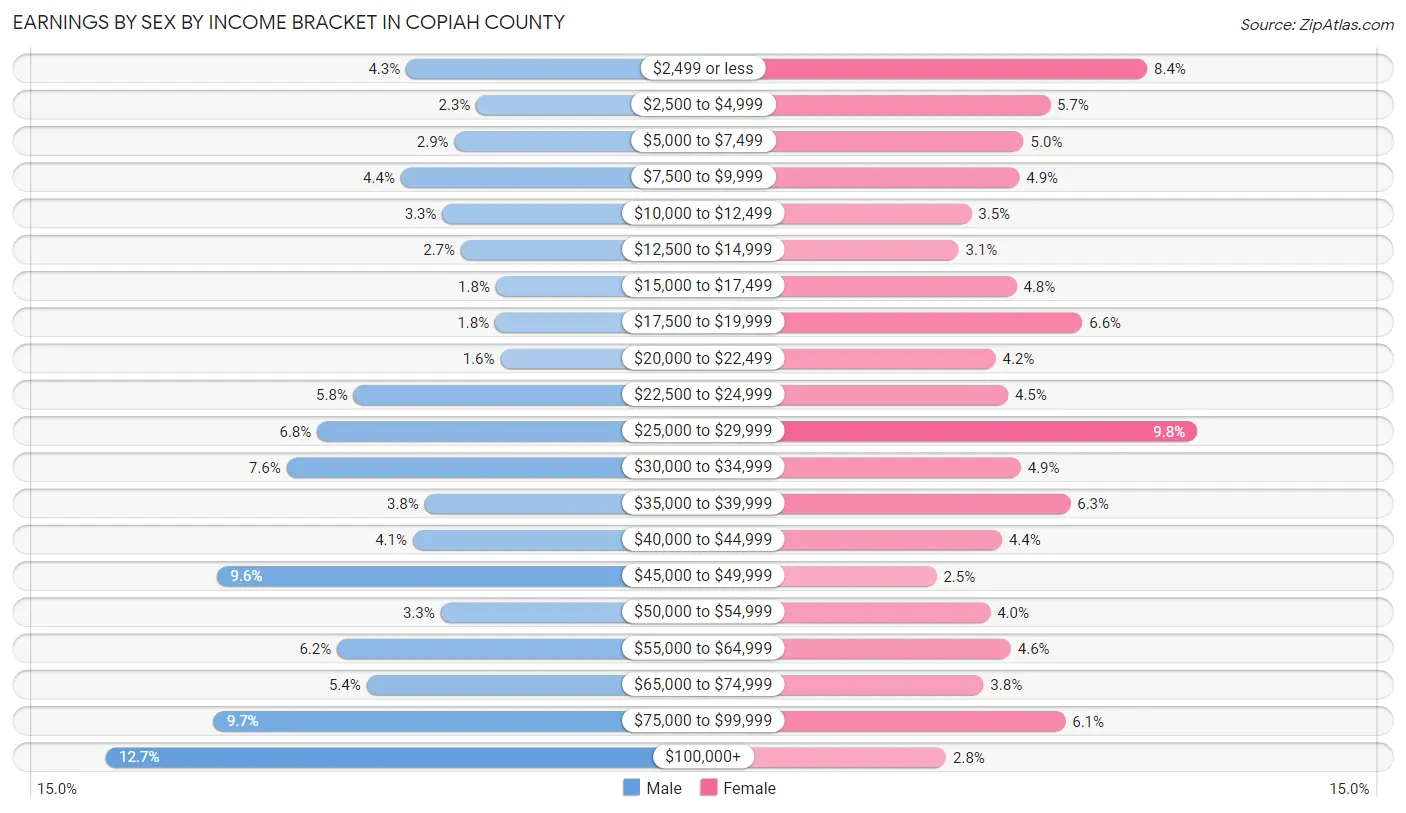
Earnings by Sex by Income Bracket in Copiah County
The most common earnings brackets in Copiah County are $100,000+ for men (780 | 12.7%) and $25,000 to $29,999 for women (574 | 9.8%).
| Income | Male | Female |
| $2,499 or less | 263 (4.3%) | 492 (8.4%) |
| $2,500 to $4,999 | 142 (2.3%) | 333 (5.7%) |
| $5,000 to $7,499 | 179 (2.9%) | 290 (5.0%) |
| $7,500 to $9,999 | 272 (4.4%) | 283 (4.9%) |
| $10,000 to $12,499 | 200 (3.3%) | 204 (3.5%) |
| $12,500 to $14,999 | 168 (2.7%) | 183 (3.1%) |
| $15,000 to $17,499 | 108 (1.8%) | 278 (4.8%) |
| $17,500 to $19,999 | 109 (1.8%) | 386 (6.6%) |
| $20,000 to $22,499 | 100 (1.6%) | 244 (4.2%) |
| $22,500 to $24,999 | 353 (5.8%) | 264 (4.5%) |
| $25,000 to $29,999 | 416 (6.8%) | 574 (9.8%) |
| $30,000 to $34,999 | 469 (7.6%) | 285 (4.9%) |
| $35,000 to $39,999 | 231 (3.8%) | 366 (6.3%) |
| $40,000 to $44,999 | 251 (4.1%) | 254 (4.4%) |
| $45,000 to $49,999 | 588 (9.6%) | 147 (2.5%) |
| $50,000 to $54,999 | 203 (3.3%) | 235 (4.0%) |
| $55,000 to $64,999 | 382 (6.2%) | 269 (4.6%) |
| $65,000 to $74,999 | 331 (5.4%) | 224 (3.8%) |
| $75,000 to $99,999 | 594 (9.7%) | 358 (6.1%) |
| $100,000+ | 780 (12.7%) | 163 (2.8%) |
| Total | 6,139 (100.0%) | 5,832 (100.0%) |
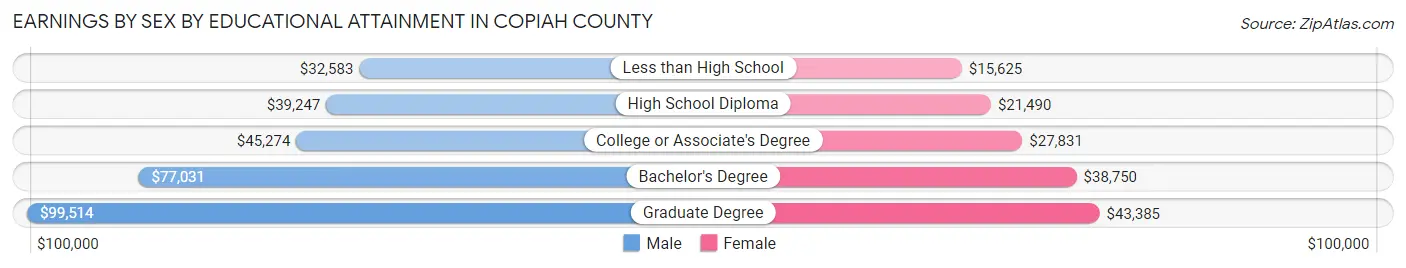
Earnings by Sex by Educational Attainment in Copiah County
Average earnings in Copiah County are $45,418 for men and $28,538 for women, a difference of 37.2%. Men with an educational attainment of graduate degree enjoy the highest average annual earnings of $99,514, while those with less than high school education earn the least with $32,583. Women with an educational attainment of graduate degree earn the most with the average annual earnings of $43,385, while those with less than high school education have the smallest earnings of $15,625.
| Educational Attainment | Male Income | Female Income |
| Less than High School | $32,583 | $15,625 |
| High School Diploma | $39,247 | $21,490 |
| College or Associate's Degree | $45,274 | $27,831 |
| Bachelor's Degree | $77,031 | $38,750 |
| Graduate Degree | $99,514 | $43,385 |
| Total | $45,418 | $28,538 |
Family Income in Copiah County
Family Income Brackets in Copiah County
According to the Copiah County family income data, there are 1,142 families falling into the $50,000 to $74,999 income range, which is the most common income bracket and makes up 17.1% of all families. Conversely, the $10,000 to $14,999 income bracket is the least frequent group with only 87 families (1.3%) belonging to this category.
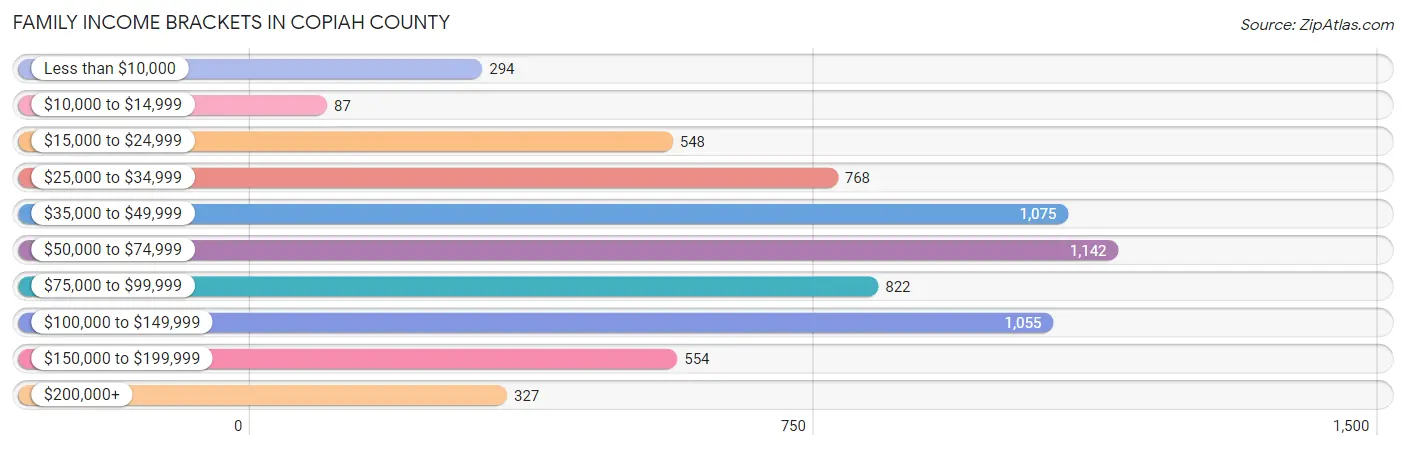
| Income Bracket | # Families | % Families |
| Less than $10,000 | 294 | 4.4% |
| $10,000 to $14,999 | 87 | 1.3% |
| $15,000 to $24,999 | 548 | 8.2% |
| $25,000 to $34,999 | 768 | 11.5% |
| $35,000 to $49,999 | 1,075 | 16.1% |
| $50,000 to $74,999 | 1,142 | 17.1% |
| $75,000 to $99,999 | 822 | 12.3% |
| $100,000 to $149,999 | 1,055 | 15.8% |
| $150,000 to $199,999 | 554 | 8.3% |
| $200,000+ | 327 | 4.9% |
Family Income by Famaliy Size in Copiah County
3-person families (1,816 | 27.2%) account for the highest median family income in Copiah County with $71,149 per family, while 2-person families (2,983 | 44.7%) have the highest median income of $27,421 per family member.
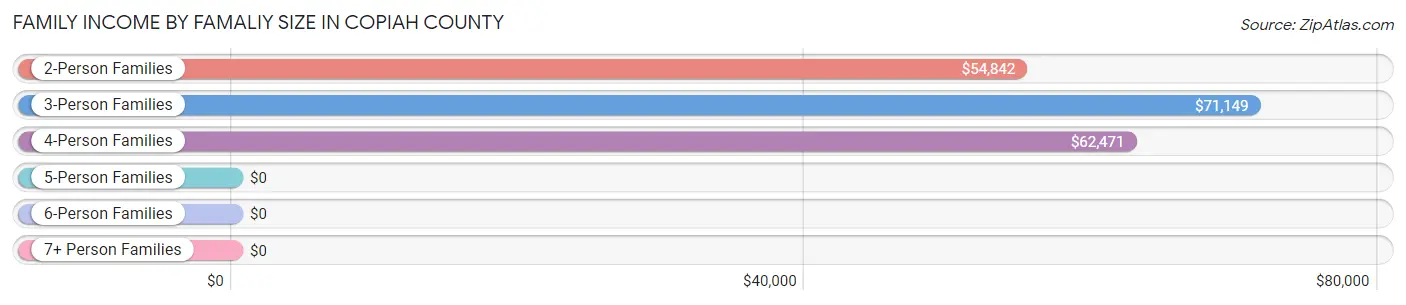
| Income Bracket | # Families | Median Income |
| 2-Person Families | 2,983 (44.7%) | $54,842 |
| 3-Person Families | 1,816 (27.2%) | $71,149 |
| 4-Person Families | 1,139 (17.1%) | $62,471 |
| 5-Person Families | 376 (5.6%) | $0 |
| 6-Person Families | 270 (4.0%) | $0 |
| 7+ Person Families | 95 (1.4%) | $0 |
| Total | 6,679 (100.0%) | $60,159 |
Family Income by Number of Earners in Copiah County
The median family income in Copiah County is $60,159, with families comprising 3+ earners (649) having the highest median family income of $103,714, while families with no earners (1,353) have the lowest median family income of $30,016, accounting for 9.7% and 20.3% of families, respectively.
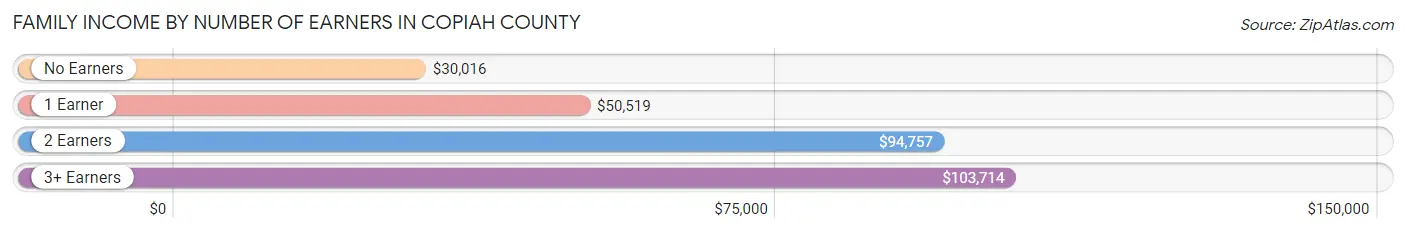
| Number of Earners | # Families | Median Income |
| No Earners | 1,353 (20.3%) | $30,016 |
| 1 Earner | 2,413 (36.1%) | $50,519 |
| 2 Earners | 2,264 (33.9%) | $94,757 |
| 3+ Earners | 649 (9.7%) | $103,714 |
| Total | 6,679 (100.0%) | $60,159 |
Household Income in Copiah County
Household Income Brackets in Copiah County
With 1,604 households falling in the category, the $35,000 to $49,999 income range is the most frequent in Copiah County, accounting for 16.3% of all households. In contrast, only 374 households (3.8%) fall into the $200,000+ income bracket, making it the least populous group.
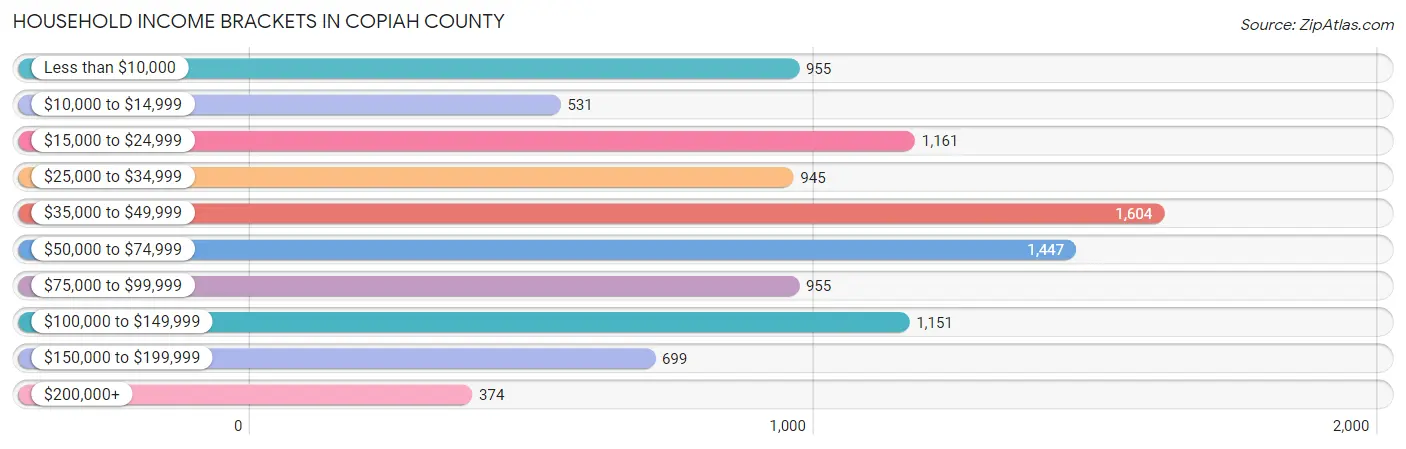
| Income Bracket | # Households | % Households |
| Less than $10,000 | 955 | 9.7% |
| $10,000 to $14,999 | 531 | 5.4% |
| $15,000 to $24,999 | 1,161 | 11.8% |
| $25,000 to $34,999 | 945 | 9.6% |
| $35,000 to $49,999 | 1,604 | 16.3% |
| $50,000 to $74,999 | 1,447 | 14.7% |
| $75,000 to $99,999 | 955 | 9.7% |
| $100,000 to $149,999 | 1,151 | 11.7% |
| $150,000 to $199,999 | 699 | 7.1% |
| $200,000+ | 374 | 3.8% |
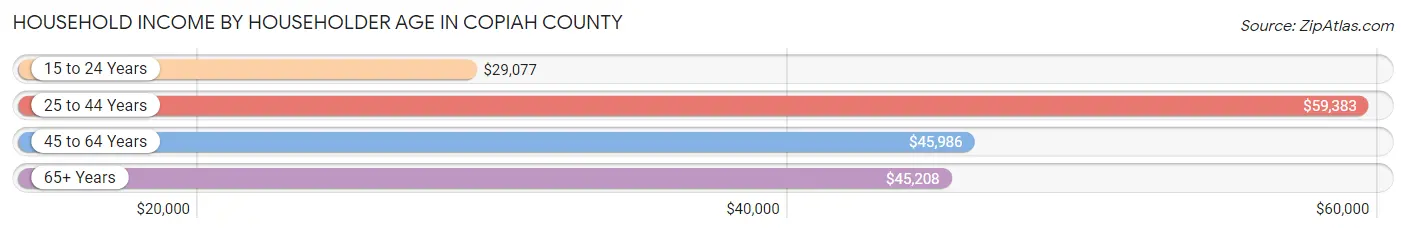
Household Income by Householder Age in Copiah County
The median household income in Copiah County is $46,889, with the highest median household income of $59,383 found in the 25 to 44 years age bracket for the primary householder. A total of 2,616 households (26.6%) fall into this category. Meanwhile, the 15 to 24 years age bracket for the primary householder has the lowest median household income of $29,077, with 241 households (2.5%) in this group.
| Income Bracket | # Households | Median Income |
| 15 to 24 Years | 241 (2.5%) | $29,077 |
| 25 to 44 Years | 2,616 (26.6%) | $59,383 |
| 45 to 64 Years | 3,922 (39.9%) | $45,986 |
| 65+ Years | 3,062 (31.1%) | $45,208 |
| Total | 9,841 (100.0%) | $46,889 |
Poverty in Copiah County
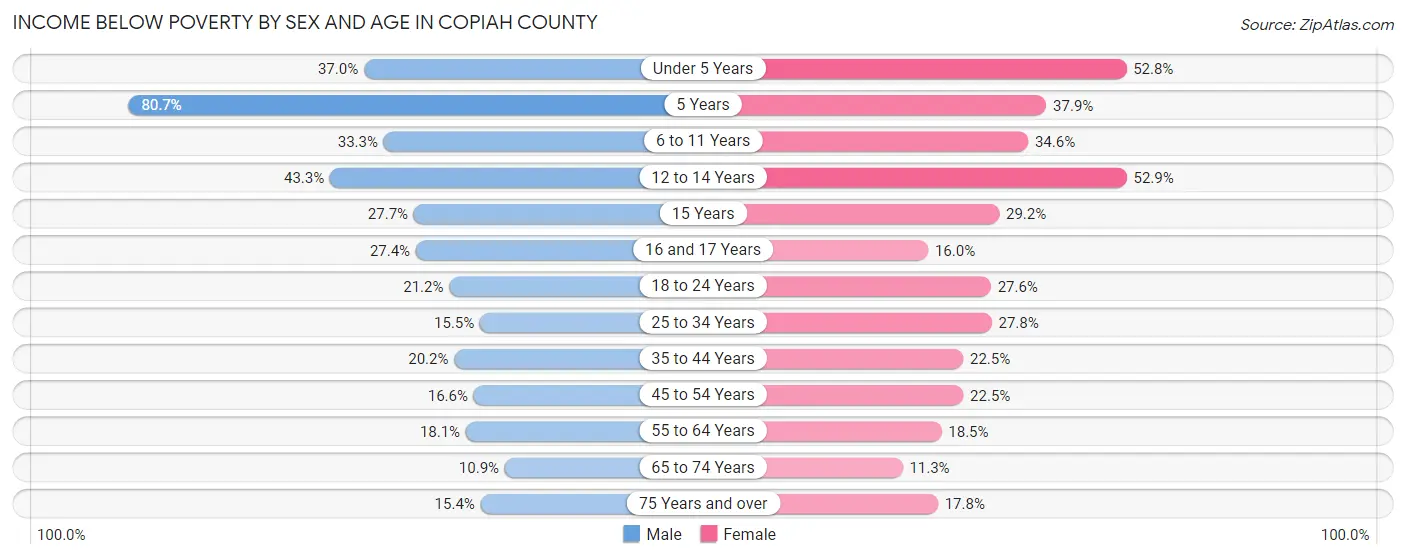
Income Below Poverty by Sex and Age in Copiah County
With 21.5% poverty level for males and 25.2% for females among the residents of Copiah County, 5 year old males and 12 to 14 year old females are the most vulnerable to poverty, with 134 males (80.7%) and 240 females (52.9%) in their respective age groups living below the poverty level.
| Age Bracket | Male | Female |
| Under 5 Years | 252 (37.0%) | 501 (52.8%) |
| 5 Years | 134 (80.7%) | 55 (37.9%) |
| 6 to 11 Years | 340 (33.3%) | 423 (34.6%) |
| 12 to 14 Years | 230 (43.3%) | 240 (52.9%) |
| 15 Years | 38 (27.7%) | 47 (29.2%) |
| 16 and 17 Years | 58 (27.4%) | 100 (16.0%) |
| 18 to 24 Years | 249 (21.2%) | 353 (27.6%) |
| 25 to 34 Years | 263 (15.4%) | 366 (27.8%) |
| 35 to 44 Years | 298 (20.2%) | 372 (22.5%) |
| 45 to 54 Years | 251 (16.6%) | 394 (22.5%) |
| 55 to 64 Years | 346 (18.1%) | 375 (18.5%) |
| 65 to 74 Years | 152 (10.8%) | 184 (11.3%) |
| 75 Years and over | 122 (15.3%) | 210 (17.8%) |
| Total | 2,733 (21.5%) | 3,620 (25.2%) |
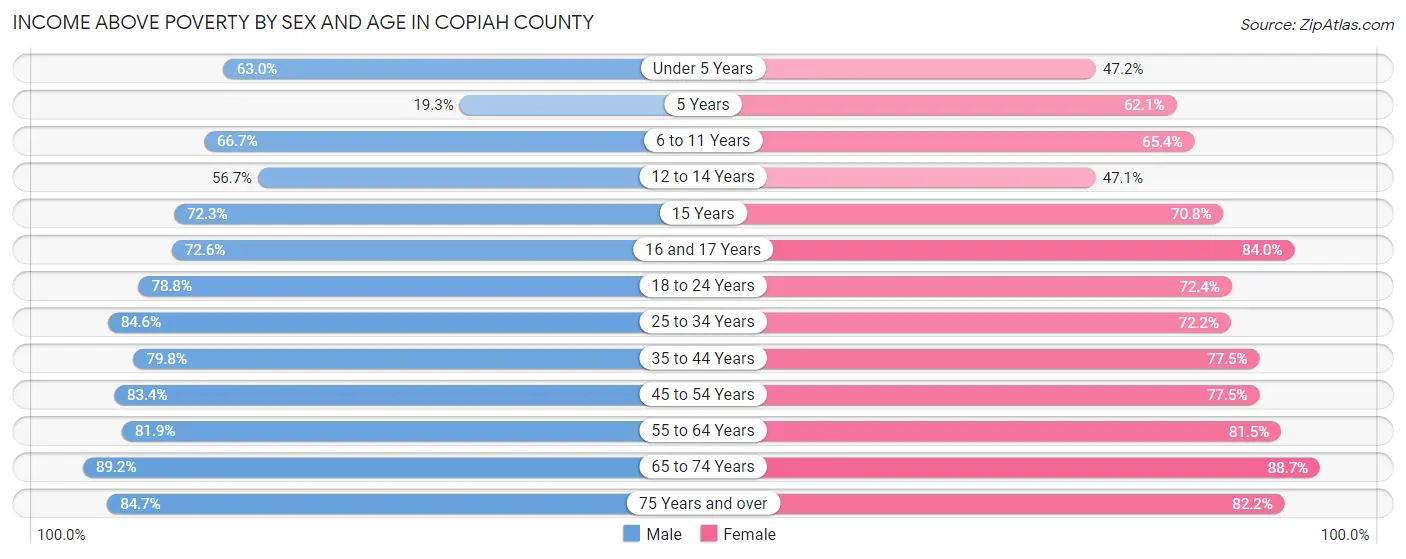
Income Above Poverty by Sex and Age in Copiah County
According to the poverty statistics in Copiah County, males aged 65 to 74 years and females aged 65 to 74 years are the age groups that are most secure financially, with 89.1% of males and 88.7% of females in these age groups living above the poverty line.
| Age Bracket | Male | Female |
| Under 5 Years | 429 (63.0%) | 448 (47.2%) |
| 5 Years | 32 (19.3%) | 90 (62.1%) |
| 6 to 11 Years | 680 (66.7%) | 801 (65.4%) |
| 12 to 14 Years | 301 (56.7%) | 214 (47.1%) |
| 15 Years | 99 (72.3%) | 114 (70.8%) |
| 16 and 17 Years | 154 (72.6%) | 525 (84.0%) |
| 18 to 24 Years | 927 (78.8%) | 924 (72.4%) |
| 25 to 34 Years | 1,439 (84.6%) | 951 (72.2%) |
| 35 to 44 Years | 1,174 (79.8%) | 1,281 (77.5%) |
| 45 to 54 Years | 1,259 (83.4%) | 1,355 (77.5%) |
| 55 to 64 Years | 1,568 (81.9%) | 1,654 (81.5%) |
| 65 to 74 Years | 1,249 (89.1%) | 1,450 (88.7%) |
| 75 Years and over | 673 (84.7%) | 969 (82.2%) |
| Total | 9,984 (78.5%) | 10,776 (74.9%) |
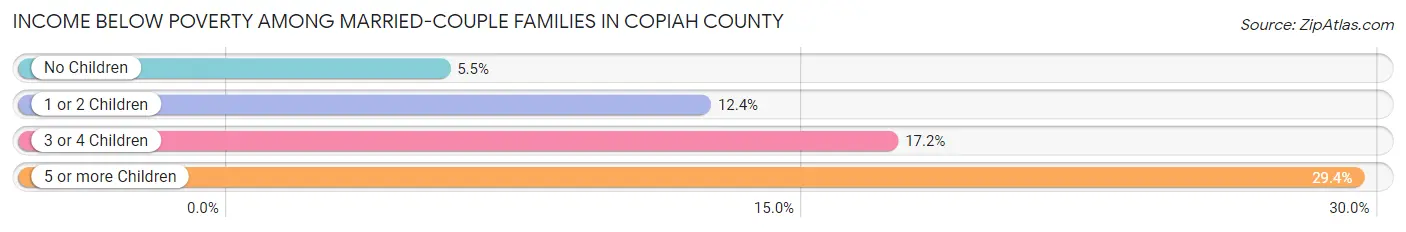
Income Below Poverty Among Married-Couple Families in Copiah County
The poverty statistics for married-couple families in Copiah County show that 8.4% or 375 of the total 4,451 families live below the poverty line. Families with 5 or more children have the highest poverty rate of 29.4%, comprising of 5 families. On the other hand, families with no children have the lowest poverty rate of 5.5%, which includes 155 families.
| Children | Above Poverty | Below Poverty |
| No Children | 2,641 (94.5%) | 155 (5.5%) |
| 1 or 2 Children | 1,207 (87.6%) | 170 (12.3%) |
| 3 or 4 Children | 216 (82.8%) | 45 (17.2%) |
| 5 or more Children | 12 (70.6%) | 5 (29.4%) |
| Total | 4,076 (91.6%) | 375 (8.4%) |
Income Below Poverty Among Single-Parent Households in Copiah County
According to the poverty data in Copiah County, 19.6% or 68 single-father households and 28.3% or 532 single-mother households are living below the poverty line. Among single-father households, those with no children have the highest poverty rate, with 64 households (33.2%) experiencing poverty. Likewise, among single-mother households, those with 5 or more children have the highest poverty rate, with 70 households (98.6%) falling below the poverty line.
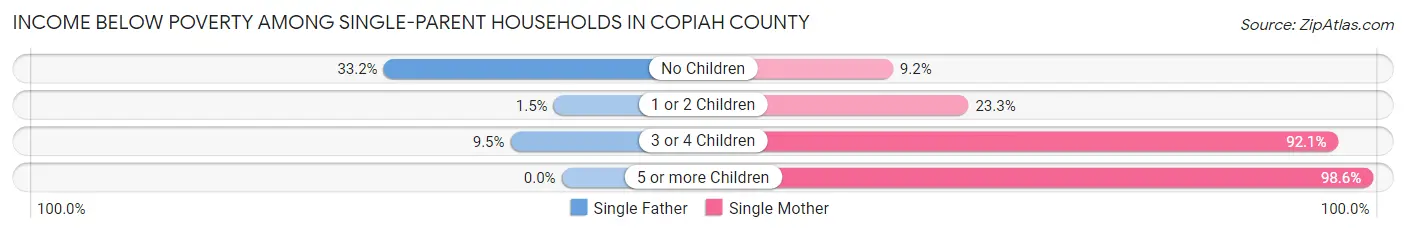
| Children | Single Father | Single Mother |
| No Children | 64 (33.2%) | 93 (9.2%) |
| 1 or 2 Children | 2 (1.5%) | 123 (23.3%) |
| 3 or 4 Children | 2 (9.5%) | 246 (92.1%) |
| 5 or more Children | 0 (0.0%) | 70 (98.6%) |
| Total | 68 (19.6%) | 532 (28.3%) |
Income Below Poverty Among Married-Couple vs Single-Parent Households in Copiah County
The poverty data for Copiah County shows that 375 of the married-couple family households (8.4%) and 600 of the single-parent households (26.9%) are living below the poverty level. Within the married-couple family households, those with 5 or more children have the highest poverty rate, with 5 households (29.4%) falling below the poverty line. Among the single-parent households, those with 5 or more children have the highest poverty rate, with 70 household (98.6%) living below poverty.
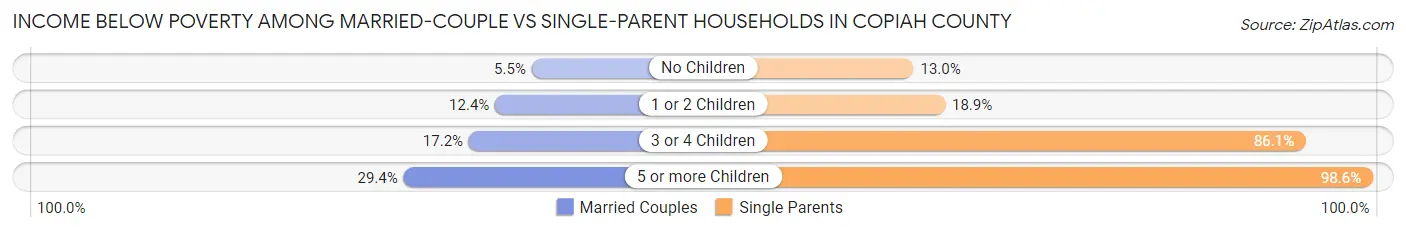
| Children | Married-Couple Families | Single-Parent Households |
| No Children | 155 (5.5%) | 157 (13.0%) |
| 1 or 2 Children | 170 (12.3%) | 125 (18.9%) |
| 3 or 4 Children | 45 (17.2%) | 248 (86.1%) |
| 5 or more Children | 5 (29.4%) | 70 (98.6%) |
| Total | 375 (8.4%) | 600 (26.9%) |
Race in Copiah County
The most populous races in Copiah County are Black / African American (14,400 | 51.0%), White / Caucasian (12,424 | 44.0%), and Hispanic or Latino (1,030 | 3.6%).
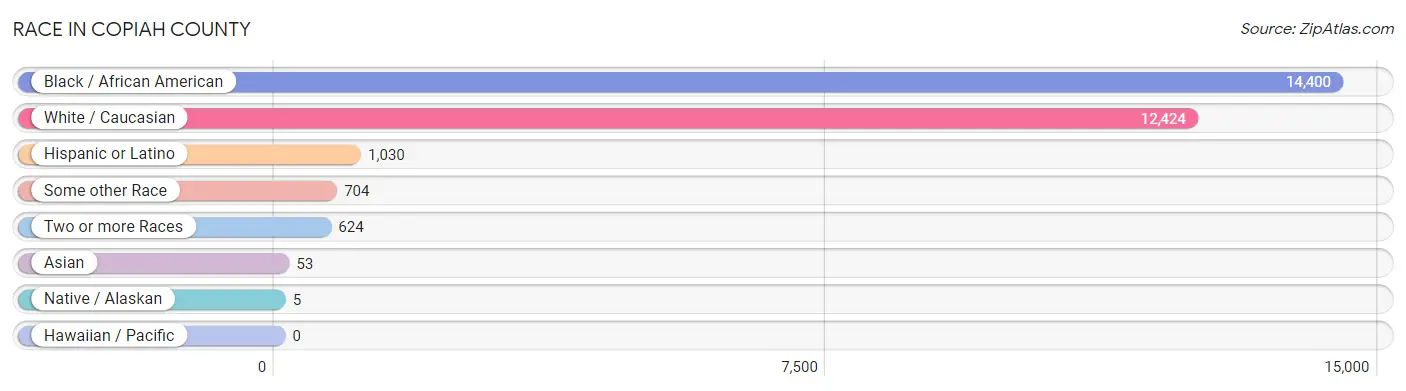
| Race | # Population | % Population |
| Asian | 53 | 0.2% |
| Black / African American | 14,400 | 51.0% |
| Hawaiian / Pacific | 0 | 0.0% |
| Hispanic or Latino | 1,030 | 3.6% |
| Native / Alaskan | 5 | 0.0% |
| White / Caucasian | 12,424 | 44.0% |
| Two or more Races | 624 | 2.2% |
| Some other Race | 704 | 2.5% |
| Total | 28,210 | 100.0% |
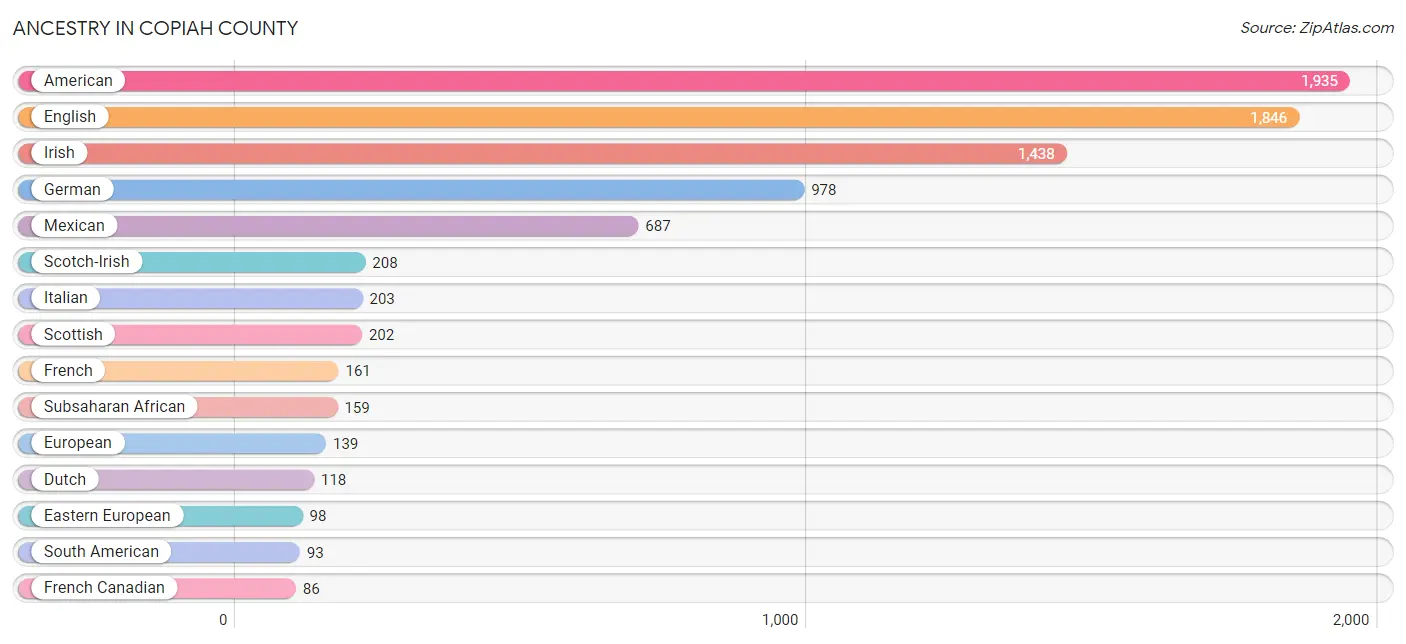
Ancestry in Copiah County
The most populous ancestries reported in Copiah County are American (1,935 | 6.9%), English (1,846 | 6.5%), Irish (1,438 | 5.1%), German (978 | 3.5%), and Mexican (687 | 2.4%), together accounting for 24.4% of all Copiah County residents.
| Ancestry | # Population | % Population |
| African | 81 | 0.3% |
| American | 1,935 | 6.9% |
| Arab | 11 | 0.0% |
| Bhutanese | 12 | 0.0% |
| British | 68 | 0.2% |
| Burmese | 4 | 0.0% |
| Cajun | 9 | 0.0% |
| Central American | 65 | 0.2% |
| Cherokee | 36 | 0.1% |
| Choctaw | 44 | 0.2% |
| Colombian | 83 | 0.3% |
| Czechoslovakian | 23 | 0.1% |
| Dutch | 118 | 0.4% |
| Eastern European | 98 | 0.4% |
| English | 1,846 | 6.5% |
| European | 139 | 0.5% |
| French | 161 | 0.6% |
| French Canadian | 86 | 0.3% |
| German | 978 | 3.5% |
| Greek | 12 | 0.0% |
| Guatemalan | 61 | 0.2% |
| Houma | 2 | 0.0% |
| Hungarian | 12 | 0.0% |
| Indian (Asian) | 17 | 0.1% |
| Irish | 1,438 | 5.1% |
| Iroquois | 13 | 0.1% |
| Italian | 203 | 0.7% |
| Korean | 55 | 0.2% |
| Mexican | 687 | 2.4% |
| Nigerian | 60 | 0.2% |
| Northern European | 3 | 0.0% |
| Norwegian | 24 | 0.1% |
| Polish | 34 | 0.1% |
| Puerto Rican | 10 | 0.0% |
| Russian | 73 | 0.3% |
| Salvadoran | 4 | 0.0% |
| Scotch-Irish | 208 | 0.7% |
| Scottish | 202 | 0.7% |
| South American | 93 | 0.3% |
| Spaniard | 7 | 0.0% |
| Subsaharan African | 159 | 0.6% |
| Venezuelan | 10 | 0.0% |
| Welsh | 60 | 0.2% | View All 43 Rows |
Immigrants in Copiah County
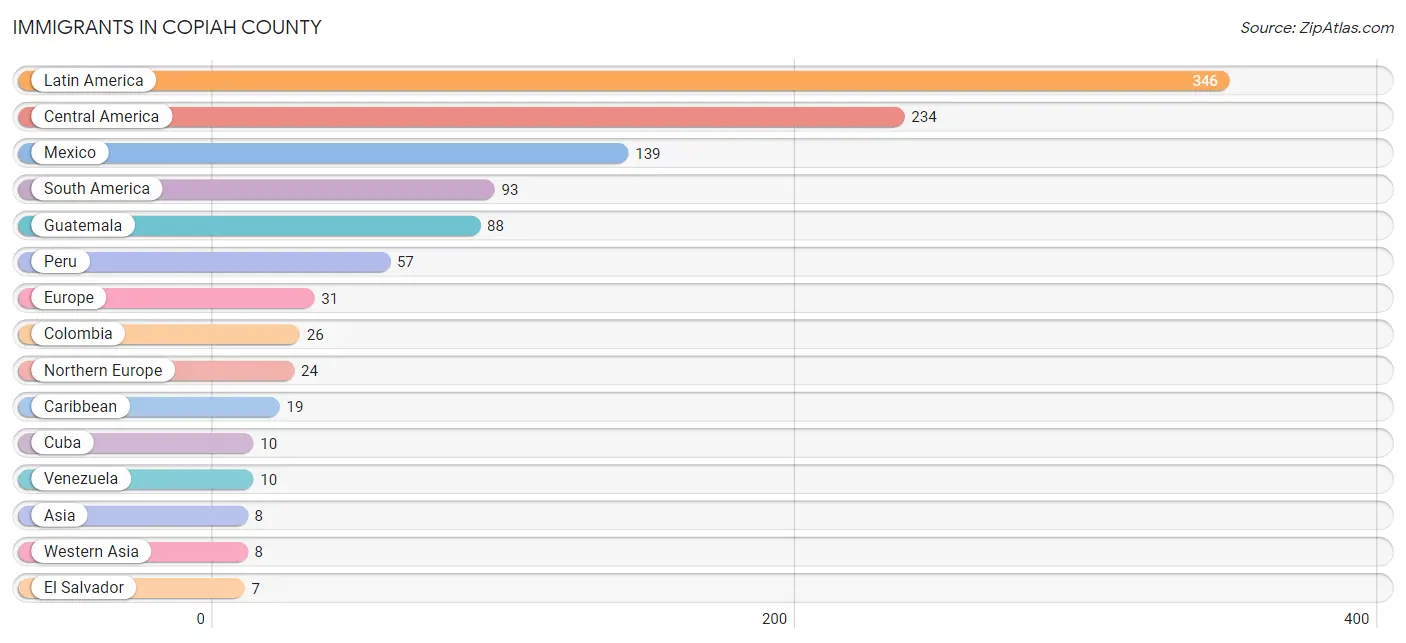
The most numerous immigrant groups reported in Copiah County came from Latin America (346 | 1.2%), Central America (234 | 0.8%), Mexico (139 | 0.5%), South America (93 | 0.3%), and Guatemala (88 | 0.3%), together accounting for 3.2% of all Copiah County residents.
| Immigration Origin | # Population | % Population |
| Asia | 8 | 0.0% |
| Caribbean | 19 | 0.1% |
| Central America | 234 | 0.8% |
| Colombia | 26 | 0.1% |
| Cuba | 10 | 0.0% |
| Dominican Republic | 6 | 0.0% |
| El Salvador | 7 | 0.0% |
| Europe | 31 | 0.1% |
| Guatemala | 88 | 0.3% |
| Haiti | 3 | 0.0% |
| Latin America | 346 | 1.2% |
| Mexico | 139 | 0.5% |
| Northern Europe | 24 | 0.1% |
| Peru | 57 | 0.2% |
| South America | 93 | 0.3% |
| Southern Europe | 7 | 0.0% |
| Spain | 7 | 0.0% |
| Syria | 3 | 0.0% |
| Venezuela | 10 | 0.0% |
| Western Asia | 8 | 0.0% | View All 20 Rows |
Sex and Age in Copiah County
Sex and Age in Copiah County
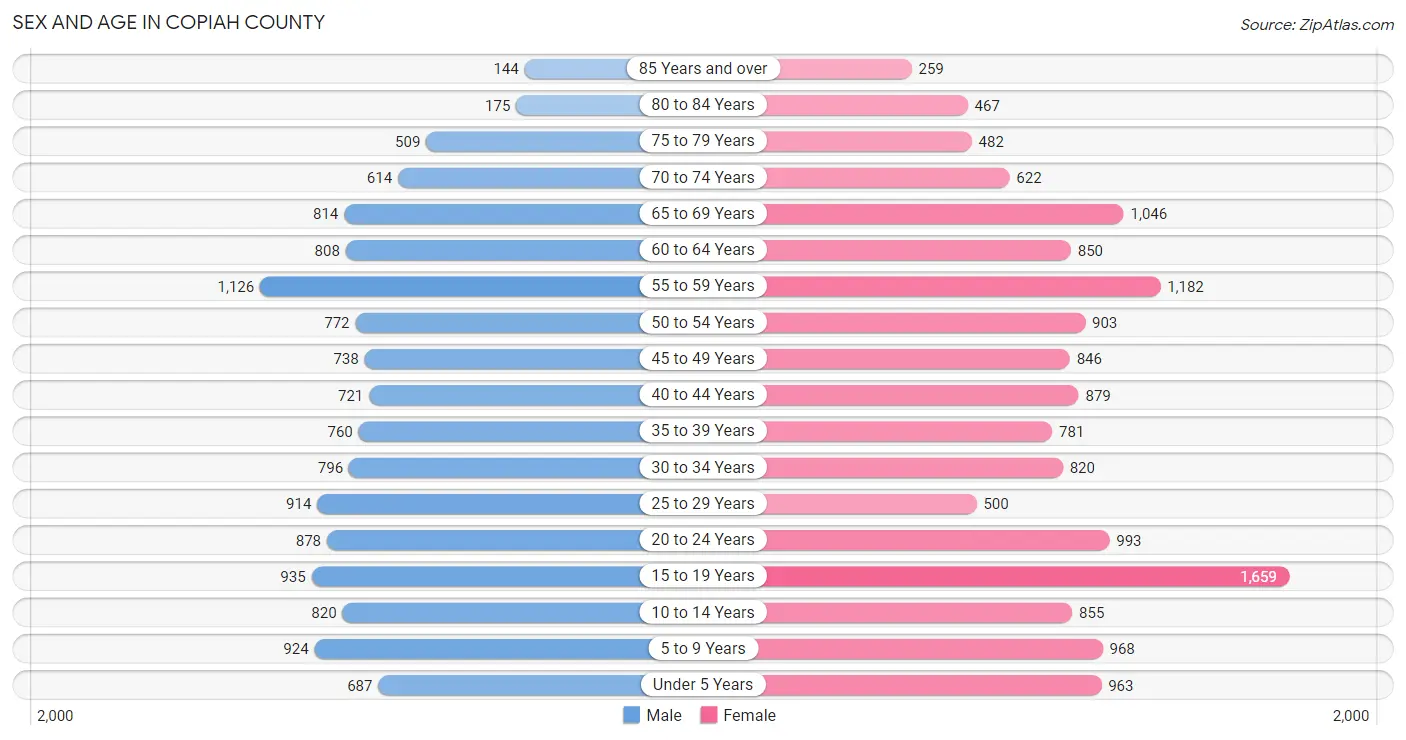
The most populous age groups in Copiah County are 55 to 59 Years (1,126 | 8.6%) for men and 15 to 19 Years (1,659 | 11.0%) for women.
| Age Bracket | Male | Female |
| Under 5 Years | 687 (5.2%) | 963 (6.4%) |
| 5 to 9 Years | 924 (7.0%) | 968 (6.4%) |
| 10 to 14 Years | 820 (6.2%) | 855 (5.7%) |
| 15 to 19 Years | 935 (7.1%) | 1,659 (11.0%) |
| 20 to 24 Years | 878 (6.7%) | 993 (6.6%) |
| 25 to 29 Years | 914 (7.0%) | 500 (3.3%) |
| 30 to 34 Years | 796 (6.1%) | 820 (5.4%) |
| 35 to 39 Years | 760 (5.8%) | 781 (5.2%) |
| 40 to 44 Years | 721 (5.5%) | 879 (5.8%) |
| 45 to 49 Years | 738 (5.6%) | 846 (5.6%) |
| 50 to 54 Years | 772 (5.9%) | 903 (6.0%) |
| 55 to 59 Years | 1,126 (8.6%) | 1,182 (7.8%) |
| 60 to 64 Years | 808 (6.1%) | 850 (5.6%) |
| 65 to 69 Years | 814 (6.2%) | 1,046 (6.9%) |
| 70 to 74 Years | 614 (4.7%) | 622 (4.1%) |
| 75 to 79 Years | 509 (3.9%) | 482 (3.2%) |
| 80 to 84 Years | 175 (1.3%) | 467 (3.1%) |
| 85 Years and over | 144 (1.1%) | 259 (1.7%) |
| Total | 13,135 (100.0%) | 15,075 (100.0%) |
Families and Households in Copiah County
Median Family Size in Copiah County
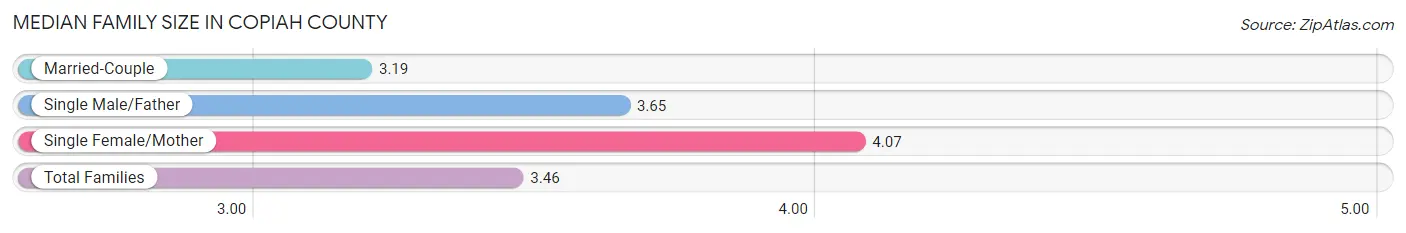
The median family size in Copiah County is 3.46 persons per family, with single female/mother families (1,881 | 28.2%) accounting for the largest median family size of 4.07 persons per family. On the other hand, married-couple families (4,451 | 66.6%) represent the smallest median family size with 3.19 persons per family.
| Family Type | # Families | Family Size |
| Married-Couple | 4,451 (66.6%) | 3.19 |
| Single Male/Father | 347 (5.2%) | 3.65 |
| Single Female/Mother | 1,881 (28.2%) | 4.07 |
| Total Families | 6,679 (100.0%) | 3.46 |
Median Household Size in Copiah County
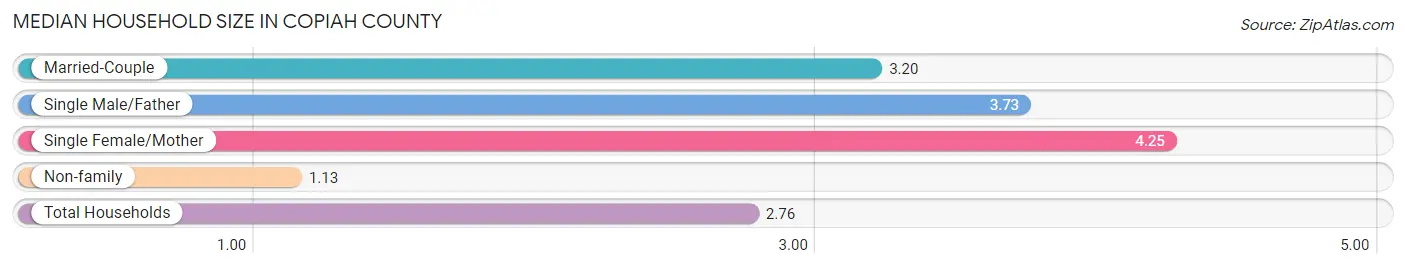
The median household size in Copiah County is 2.76 persons per household, with single female/mother households (1,881 | 19.1%) accounting for the largest median household size of 4.25 persons per household. non-family households (3,162 | 32.1%) represent the smallest median household size with 1.13 persons per household.
| Household Type | # Households | Household Size |
| Married-Couple | 4,451 (45.2%) | 3.20 |
| Single Male/Father | 347 (3.5%) | 3.73 |
| Single Female/Mother | 1,881 (19.1%) | 4.25 |
| Non-family | 3,162 (32.1%) | 1.13 |
| Total Households | 9,841 (100.0%) | 2.76 |
Household Size by Marriage Status in Copiah County
Out of a total of 9,841 households in Copiah County, 6,679 (67.9%) are family households, while 3,162 (32.1%) are nonfamily households. The most numerous type of family households are 2-person households, comprising 2,744, and the most common type of nonfamily households are 1-person households, comprising 2,870.
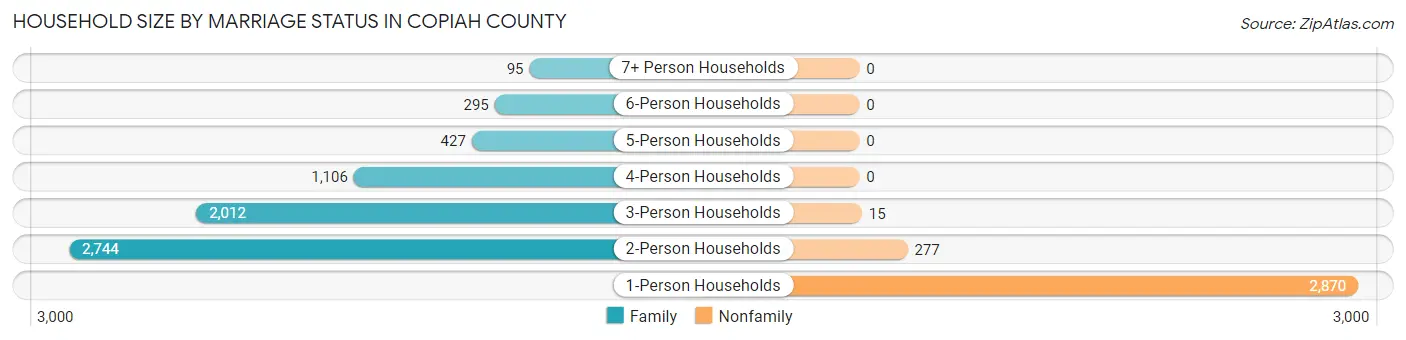
| Household Size | Family Households | Nonfamily Households |
| 1-Person Households | - | 2,870 (29.2%) |
| 2-Person Households | 2,744 (27.9%) | 277 (2.8%) |
| 3-Person Households | 2,012 (20.4%) | 15 (0.2%) |
| 4-Person Households | 1,106 (11.2%) | 0 (0.0%) |
| 5-Person Households | 427 (4.3%) | 0 (0.0%) |
| 6-Person Households | 295 (3.0%) | 0 (0.0%) |
| 7+ Person Households | 95 (1.0%) | 0 (0.0%) |
| Total | 6,679 (67.9%) | 3,162 (32.1%) |
Female Fertility in Copiah County
Fertility by Age in Copiah County
Average fertility rate in Copiah County is 23.0 births per 1,000 women. Women in the age bracket of 20 to 34 years have the highest fertility rate with 48.0 births per 1,000 women. Women in the age bracket of 20 to 34 years acount for 72.4% of all women with births.
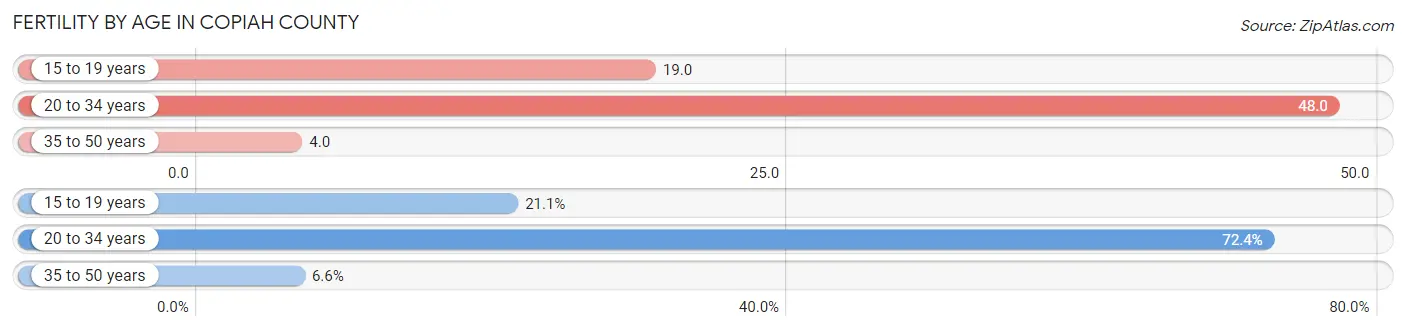
| Age Bracket | Women with Births | Births / 1,000 Women |
| 15 to 19 years | 32 (21.0%) | 19.0 |
| 20 to 34 years | 110 (72.4%) | 48.0 |
| 35 to 50 years | 10 (6.6%) | 4.0 |
| Total | 152 (100.0%) | 23.0 |
Fertility by Age by Marriage Status in Copiah County
75.7% of women with births (152) in Copiah County are married. The highest percentage of unmarried women with births falls into 20 to 34 years age bracket with 27.3% of them unmarried at the time of birth, while the lowest percentage of unmarried women with births belong to 35 to 50 years age bracket with 0.0% of them unmarried.
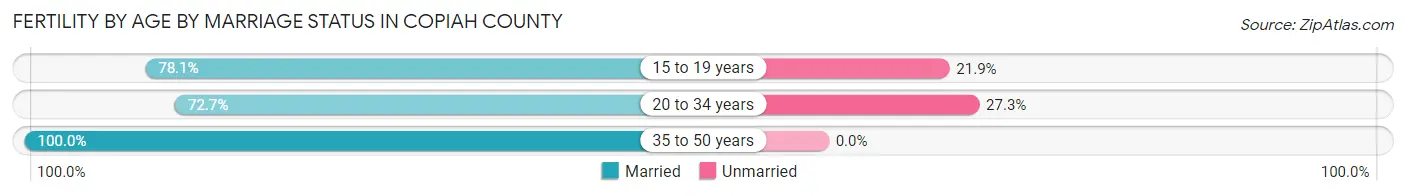
| Age Bracket | Married | Unmarried |
| 15 to 19 years | 25 (78.1%) | 7 (21.9%) |
| 20 to 34 years | 80 (72.7%) | 30 (27.3%) |
| 35 to 50 years | 10 (100.0%) | 0 (0.0%) |
| Total | 115 (75.7%) | 37 (24.3%) |
Fertility by Education in Copiah County
Average fertility rate in Copiah County is 23.0 births per 1,000 women. Women with the education attainment of bachelor's degree have the highest fertility rate of 57.0 births per 1,000 women, while women with the education attainment of college or associate's degree have the lowest fertility at 2.0 births per 1,000 women. Women with the education attainment of bachelor's degree represent 44.1% of all women with births.
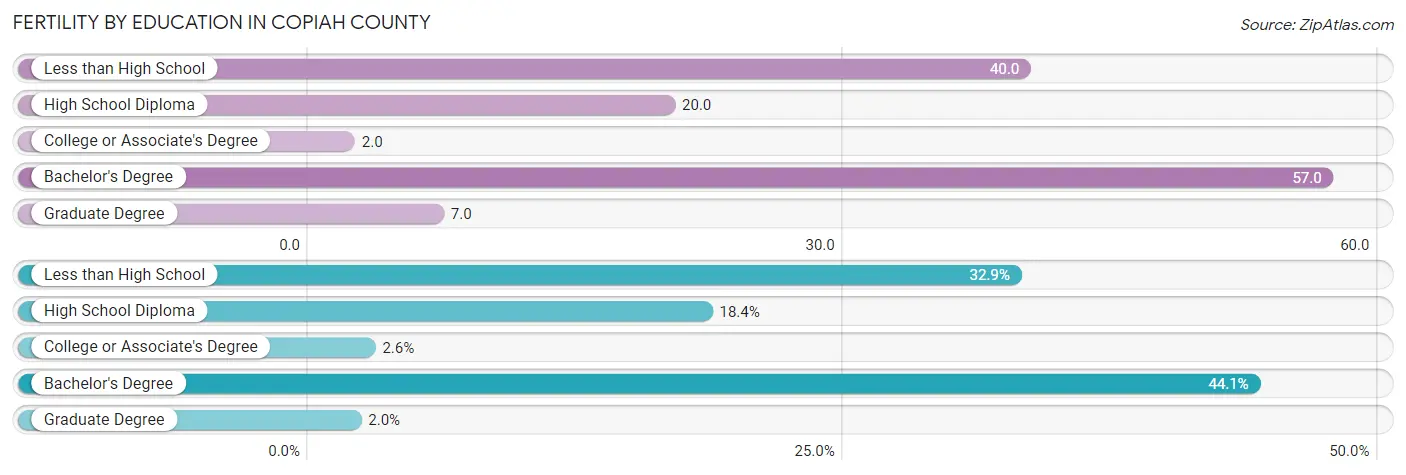
| Educational Attainment | Women with Births | Births / 1,000 Women |
| Less than High School | 50 (32.9%) | 40.0 |
| High School Diploma | 28 (18.4%) | 20.0 |
| College or Associate's Degree | 4 (2.6%) | 2.0 |
| Bachelor's Degree | 67 (44.1%) | 57.0 |
| Graduate Degree | 3 (2.0%) | 7.0 |
| Total | 152 (100.0%) | 23.0 |
Fertility by Education by Marriage Status in Copiah County
24.3% of women with births in Copiah County are unmarried. Women with the educational attainment of bachelor's degree are most likely to be married with 100.0% of them married at childbirth, while women with the educational attainment of college or associate's degree are least likely to be married with 100.0% of them unmarried at childbirth.
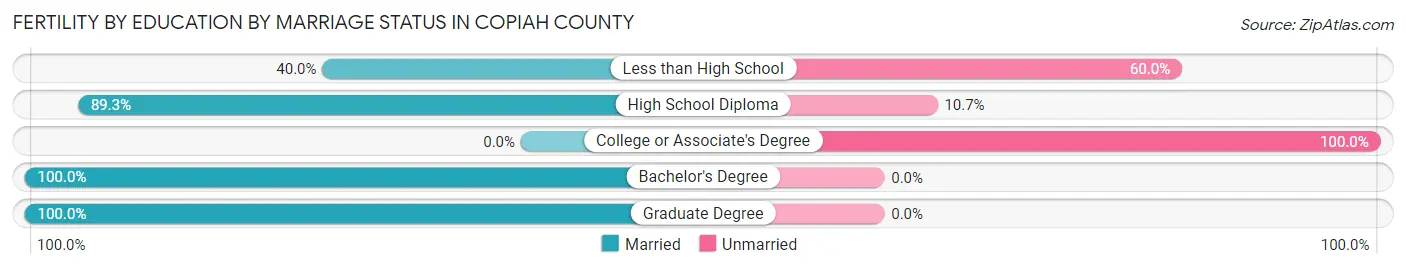
| Educational Attainment | Married | Unmarried |
| Less than High School | 20 (40.0%) | 30 (60.0%) |
| High School Diploma | 25 (89.3%) | 3 (10.7%) |
| College or Associate's Degree | 0 (0.0%) | 4 (100.0%) |
| Bachelor's Degree | 67 (100.0%) | 0 (0.0%) |
| Graduate Degree | 3 (100.0%) | 0 (0.0%) |
| Total | 115 (75.7%) | 37 (24.3%) |
Employment Characteristics in Copiah County
Employment by Class of Employer in Copiah County
Among the 10,527 employed individuals in Copiah County, private company employees (7,392 | 70.2%), not-for-profit organizations (936 | 8.9%), and state government employees (819 | 7.8%) make up the most common classes of employment.
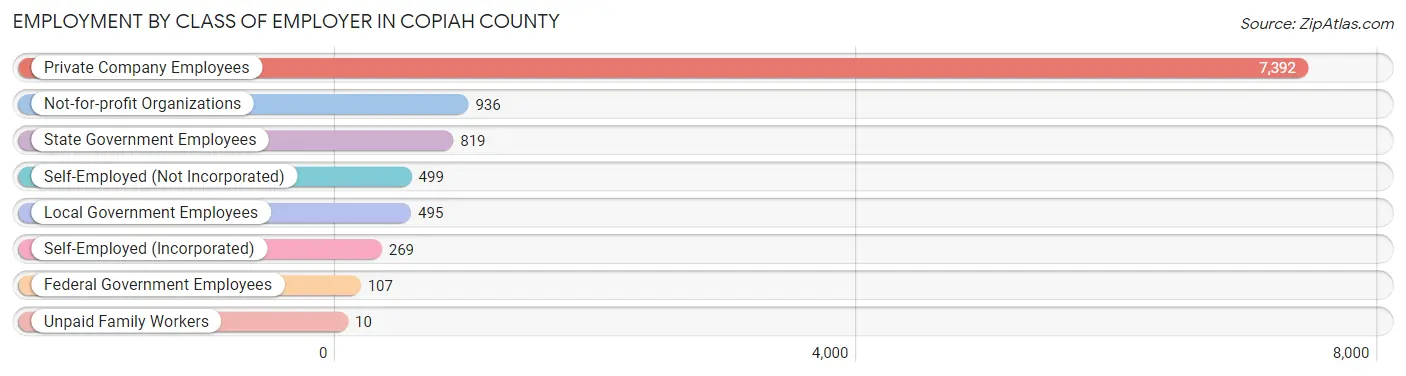
| Employer Class | # Employees | % Employees |
| Private Company Employees | 7,392 | 70.2% |
| Self-Employed (Incorporated) | 269 | 2.6% |
| Self-Employed (Not Incorporated) | 499 | 4.7% |
| Not-for-profit Organizations | 936 | 8.9% |
| Local Government Employees | 495 | 4.7% |
| State Government Employees | 819 | 7.8% |
| Federal Government Employees | 107 | 1.0% |
| Unpaid Family Workers | 10 | 0.1% |
| Total | 10,527 | 100.0% |
Employment Status by Age in Copiah County
According to the labor force statistics for Copiah County, out of the total population over 16 years of age (22,695), 50.1% or 11,370 individuals are in the labor force, with 5.2% or 591 of them unemployed. The age group with the highest labor force participation rate is 30 to 34 years, with 82.3% or 1,330 individuals in the labor force. Within the labor force, the 16 to 19 years age range has the highest percentage of unemployed individuals, with 10.1% or 40 of them being unemployed.
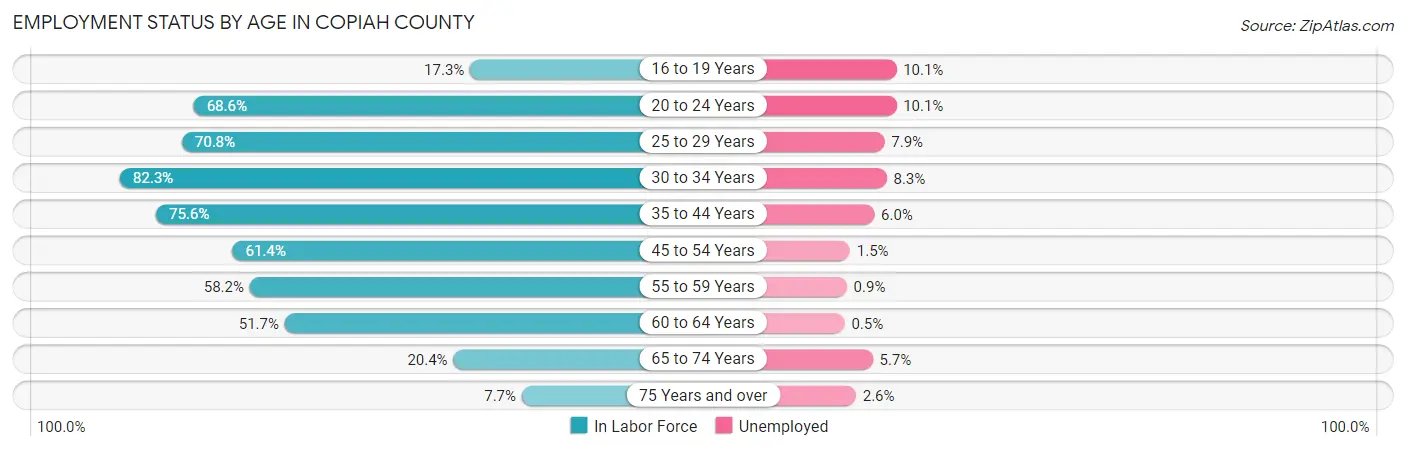
| Age Bracket | In Labor Force | Unemployed |
| 16 to 19 Years | 397 (17.3%) | 40 (10.1%) |
| 20 to 24 Years | 1,284 (68.6%) | 130 (10.1%) |
| 25 to 29 Years | 1,001 (70.8%) | 79 (7.9%) |
| 30 to 34 Years | 1,330 (82.3%) | 110 (8.3%) |
| 35 to 44 Years | 2,375 (75.6%) | 142 (6.0%) |
| 45 to 54 Years | 2,001 (61.4%) | 30 (1.5%) |
| 55 to 59 Years | 1,343 (58.2%) | 12 (0.9%) |
| 60 to 64 Years | 857 (51.7%) | 4 (0.5%) |
| 65 to 74 Years | 632 (20.4%) | 36 (5.7%) |
| 75 Years and over | 157 (7.7%) | 4 (2.6%) |
| Total | 11,370 (50.1%) | 591 (5.2%) |
Employment Status by Educational Attainment in Copiah County
According to labor force statistics for Copiah County, 66.5% of individuals (8,908) out of the total population between 25 and 64 years of age (13,396) are in the labor force, with 4.3% or 383 of them being unemployed. The group with the highest labor force participation rate are those with the educational attainment of college / associate degree, with 77.3% or 3,390 individuals in the labor force. Within the labor force, individuals with less than high school education have the highest percentage of unemployment, with 8.7% or 66 of them being unemployed.
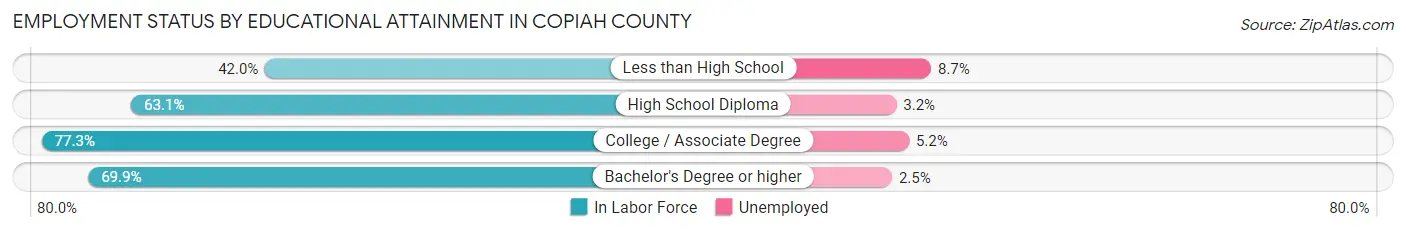
| Educational Attainment | In Labor Force | Unemployed |
| Less than High School | 756 (42.0%) | 157 (8.7%) |
| High School Diploma | 2,575 (63.1%) | 131 (3.2%) |
| College / Associate Degree | 3,390 (77.3%) | 228 (5.2%) |
| Bachelor's Degree or higher | 2,189 (69.9%) | 78 (2.5%) |
| Total | 8,908 (66.5%) | 576 (4.3%) |
Employment Occupations by Sex in Copiah County
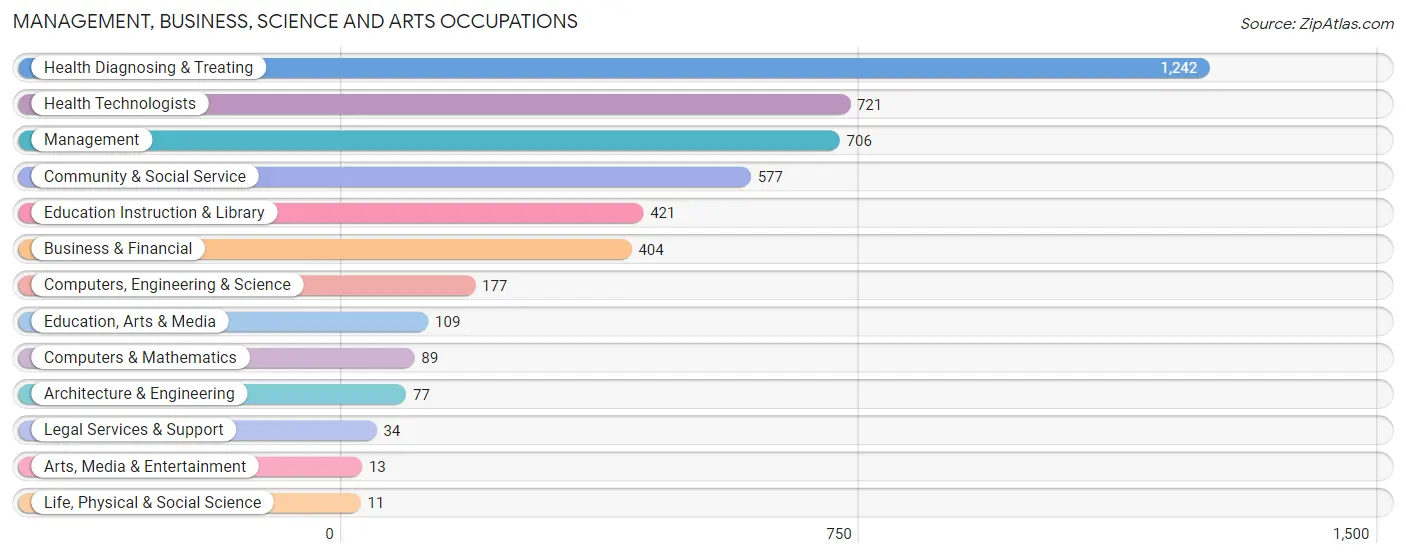
Management, Business, Science and Arts Occupations
The most common Management, Business, Science and Arts occupations in Copiah County are Health Diagnosing & Treating (1,242 | 11.5%), Health Technologists (721 | 6.7%), Management (706 | 6.6%), Community & Social Service (577 | 5.3%), and Education Instruction & Library (421 | 3.9%).
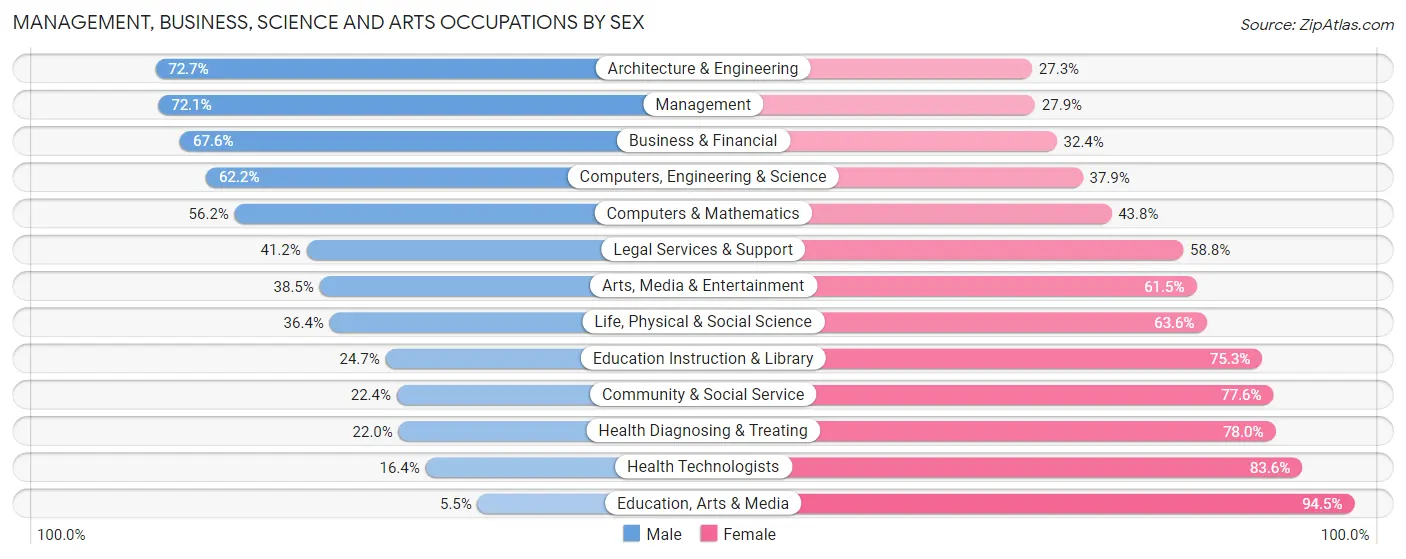
Management, Business, Science and Arts Occupations by Sex
Within the Management, Business, Science and Arts occupations in Copiah County, the most male-oriented occupations are Architecture & Engineering (72.7%), Management (72.1%), and Business & Financial (67.6%), while the most female-oriented occupations are Education, Arts & Media (94.5%), Health Technologists (83.6%), and Health Diagnosing & Treating (78.0%).
| Occupation | Male | Female |
| Management | 509 (72.1%) | 197 (27.9%) |
| Business & Financial | 273 (67.6%) | 131 (32.4%) |
| Computers, Engineering & Science | 110 (62.2%) | 67 (37.9%) |
| Computers & Mathematics | 50 (56.2%) | 39 (43.8%) |
| Architecture & Engineering | 56 (72.7%) | 21 (27.3%) |
| Life, Physical & Social Science | 4 (36.4%) | 7 (63.6%) |
| Community & Social Service | 129 (22.4%) | 448 (77.6%) |
| Education, Arts & Media | 6 (5.5%) | 103 (94.5%) |
| Legal Services & Support | 14 (41.2%) | 20 (58.8%) |
| Education Instruction & Library | 104 (24.7%) | 317 (75.3%) |
| Arts, Media & Entertainment | 5 (38.5%) | 8 (61.5%) |
| Health Diagnosing & Treating | 273 (22.0%) | 969 (78.0%) |
| Health Technologists | 118 (16.4%) | 603 (83.6%) |
| Total (Category) | 1,294 (41.7%) | 1,812 (58.3%) |
| Total (Overall) | 5,709 (53.0%) | 5,071 (47.0%) |
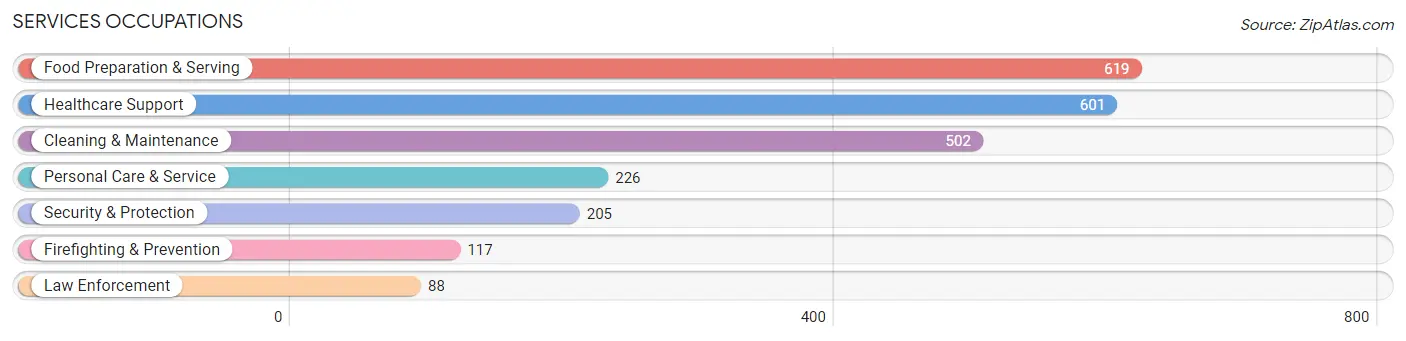
Services Occupations
The most common Services occupations in Copiah County are Food Preparation & Serving (619 | 5.7%), Healthcare Support (601 | 5.6%), Cleaning & Maintenance (502 | 4.7%), Personal Care & Service (226 | 2.1%), and Security & Protection (205 | 1.9%).
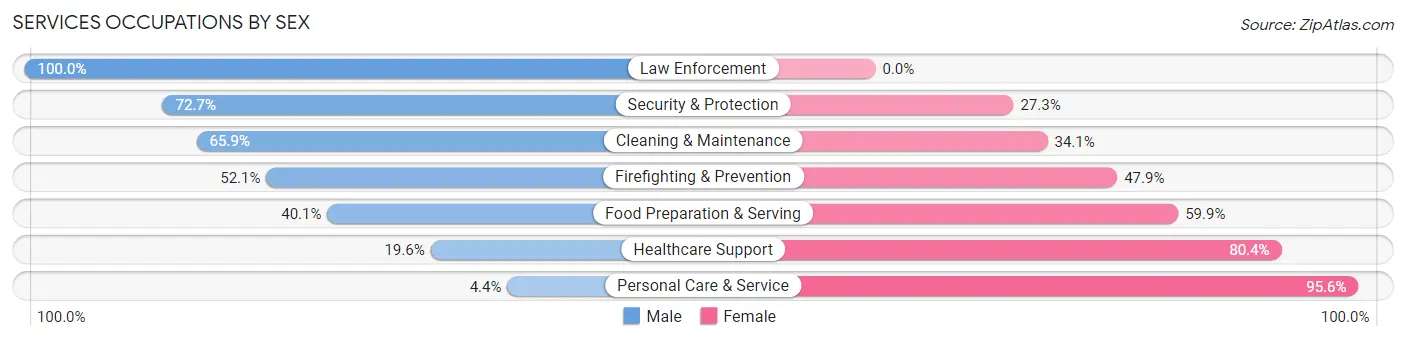
Services Occupations by Sex
Within the Services occupations in Copiah County, the most male-oriented occupations are Law Enforcement (100.0%), Security & Protection (72.7%), and Cleaning & Maintenance (65.9%), while the most female-oriented occupations are Personal Care & Service (95.6%), Healthcare Support (80.4%), and Food Preparation & Serving (59.9%).
| Occupation | Male | Female |
| Healthcare Support | 118 (19.6%) | 483 (80.4%) |
| Security & Protection | 149 (72.7%) | 56 (27.3%) |
| Firefighting & Prevention | 61 (52.1%) | 56 (47.9%) |
| Law Enforcement | 88 (100.0%) | 0 (0.0%) |
| Food Preparation & Serving | 248 (40.1%) | 371 (59.9%) |
| Cleaning & Maintenance | 331 (65.9%) | 171 (34.1%) |
| Personal Care & Service | 10 (4.4%) | 216 (95.6%) |
| Total (Category) | 856 (39.8%) | 1,297 (60.2%) |
| Total (Overall) | 5,709 (53.0%) | 5,071 (47.0%) |
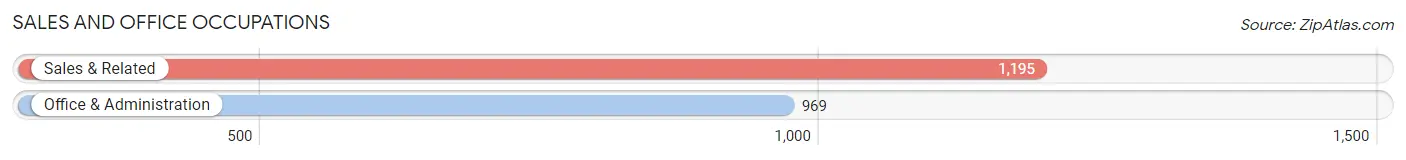
Sales and Office Occupations
The most common Sales and Office occupations in Copiah County are Sales & Related (1,195 | 11.1%), and Office & Administration (969 | 9.0%).
Sales and Office Occupations by Sex
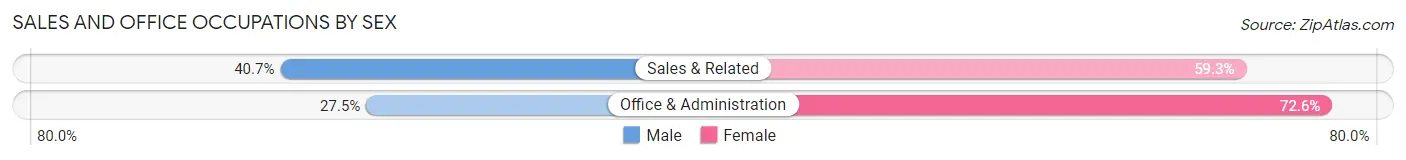
| Occupation | Male | Female |
| Sales & Related | 486 (40.7%) | 709 (59.3%) |
| Office & Administration | 266 (27.5%) | 703 (72.6%) |
| Total (Category) | 752 (34.7%) | 1,412 (65.2%) |
| Total (Overall) | 5,709 (53.0%) | 5,071 (47.0%) |
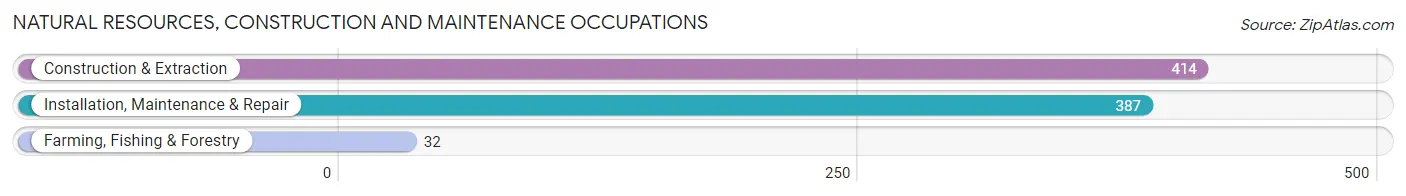
Natural Resources, Construction and Maintenance Occupations
The most common Natural Resources, Construction and Maintenance occupations in Copiah County are Construction & Extraction (414 | 3.8%), Installation, Maintenance & Repair (387 | 3.6%), and Farming, Fishing & Forestry (32 | 0.3%).
Natural Resources, Construction and Maintenance Occupations by Sex
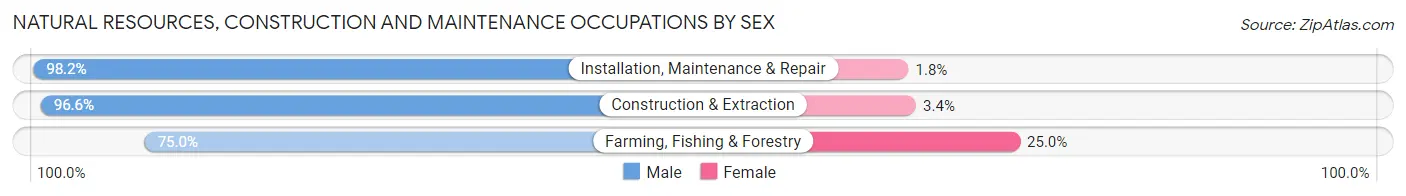
| Occupation | Male | Female |
| Farming, Fishing & Forestry | 24 (75.0%) | 8 (25.0%) |
| Construction & Extraction | 400 (96.6%) | 14 (3.4%) |
| Installation, Maintenance & Repair | 380 (98.2%) | 7 (1.8%) |
| Total (Category) | 804 (96.5%) | 29 (3.5%) |
| Total (Overall) | 5,709 (53.0%) | 5,071 (47.0%) |
Production, Transportation and Moving Occupations
The most common Production, Transportation and Moving occupations in Copiah County are Transportation (1,046 | 9.7%), Production (997 | 9.2%), and Material Moving (481 | 4.5%).
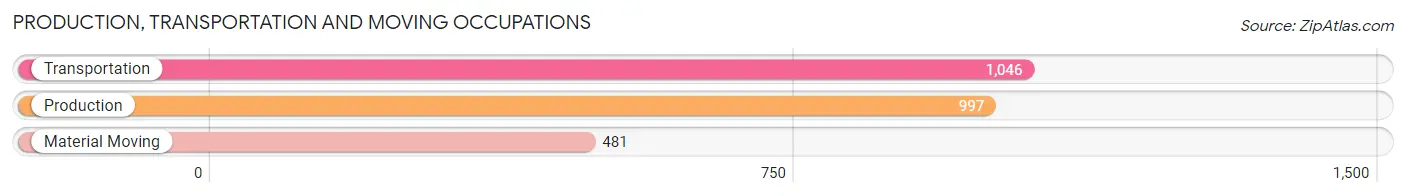
Production, Transportation and Moving Occupations by Sex
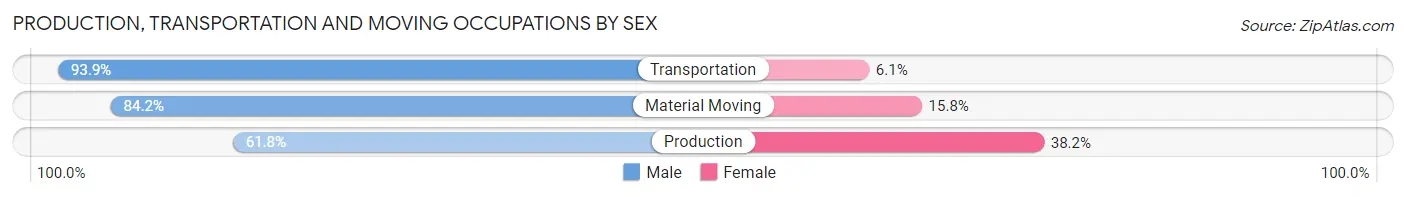
| Occupation | Male | Female |
| Production | 616 (61.8%) | 381 (38.2%) |
| Transportation | 982 (93.9%) | 64 (6.1%) |
| Material Moving | 405 (84.2%) | 76 (15.8%) |
| Total (Category) | 2,003 (79.4%) | 521 (20.6%) |
| Total (Overall) | 5,709 (53.0%) | 5,071 (47.0%) |
Employment Industries by Sex in Copiah County
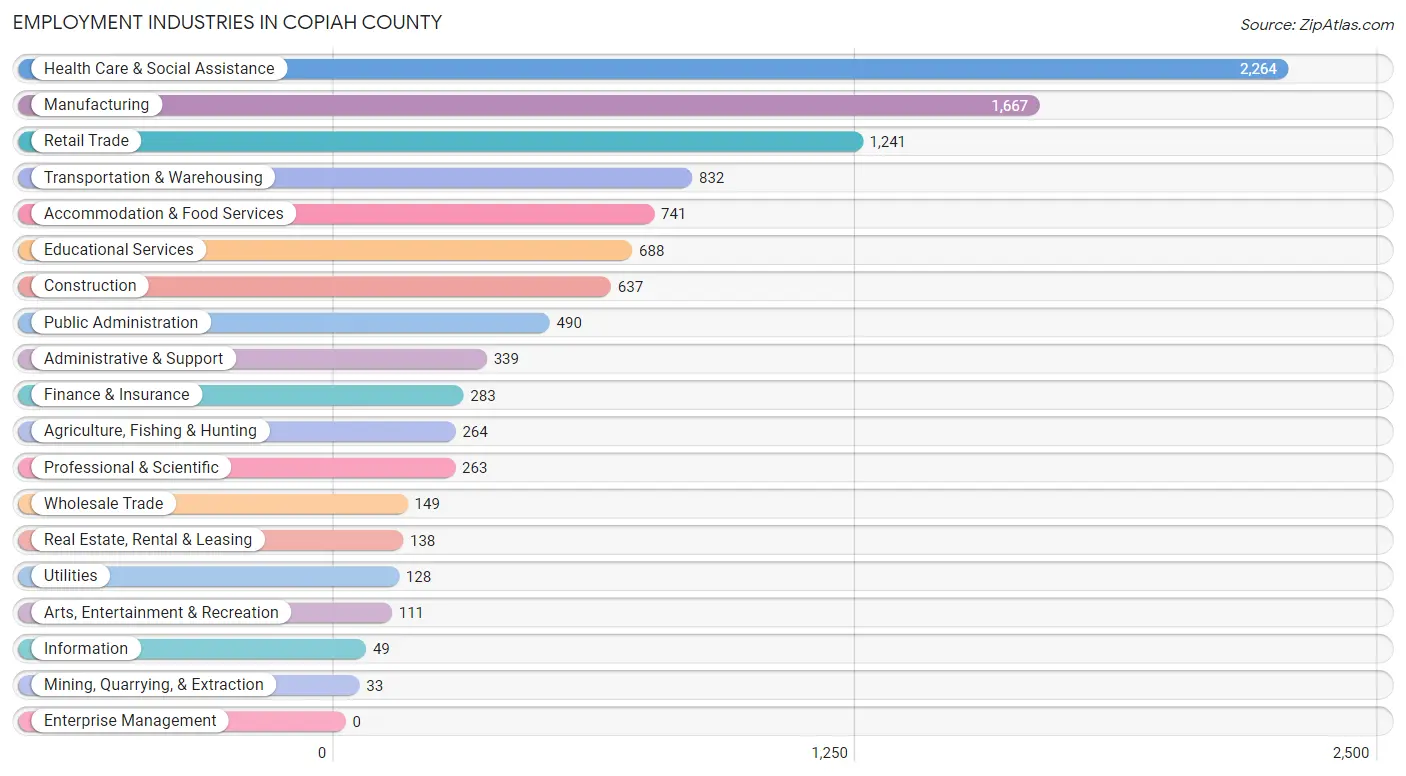
Employment Industries in Copiah County
The major employment industries in Copiah County include Health Care & Social Assistance (2,264 | 21.0%), Manufacturing (1,667 | 15.5%), Retail Trade (1,241 | 11.5%), Transportation & Warehousing (832 | 7.7%), and Accommodation & Food Services (741 | 6.9%).
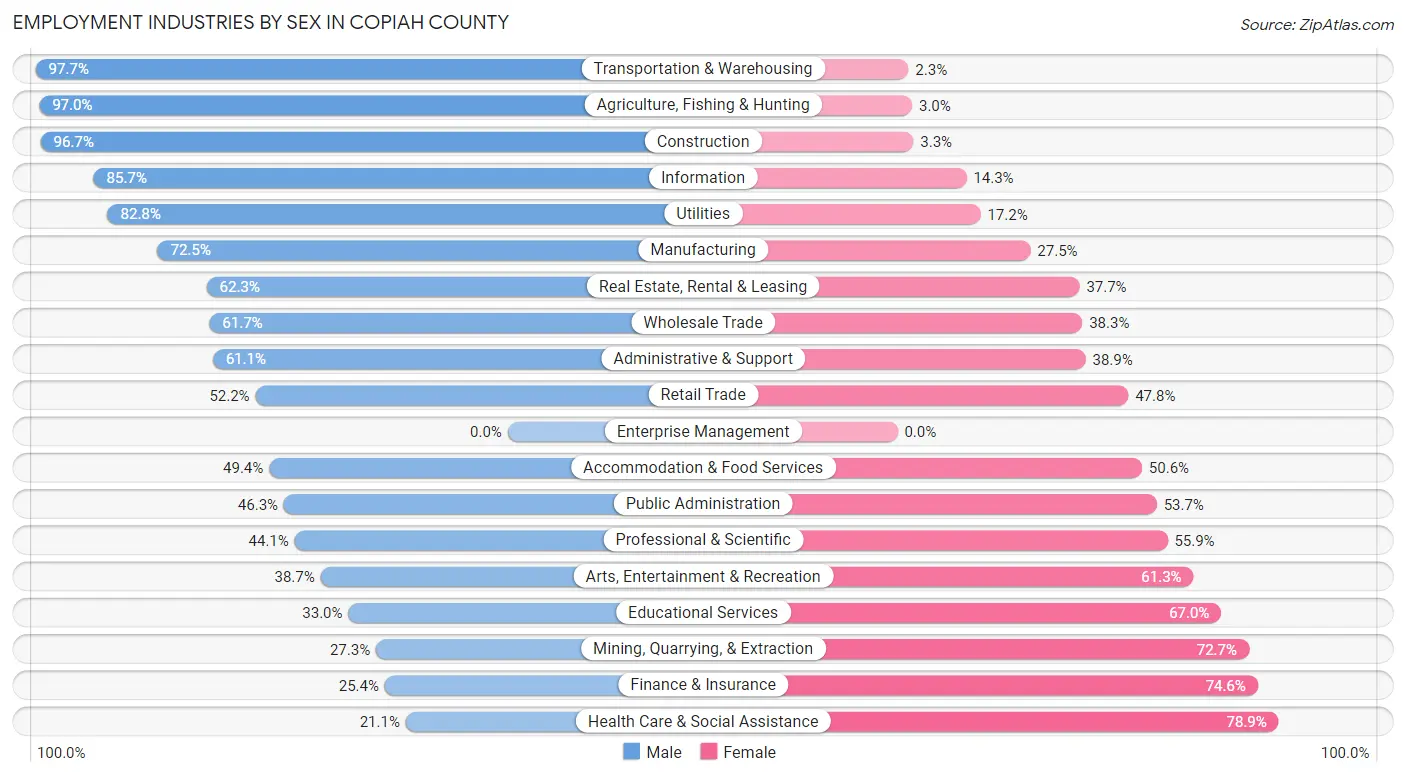
Employment Industries by Sex in Copiah County
The Copiah County industries that see more men than women are Transportation & Warehousing (97.7%), Agriculture, Fishing & Hunting (97.0%), and Construction (96.7%), whereas the industries that tend to have a higher number of women are Health Care & Social Assistance (78.9%), Finance & Insurance (74.6%), and Mining, Quarrying, & Extraction (72.7%).
| Industry | Male | Female |
| Agriculture, Fishing & Hunting | 256 (97.0%) | 8 (3.0%) |
| Mining, Quarrying, & Extraction | 9 (27.3%) | 24 (72.7%) |
| Construction | 616 (96.7%) | 21 (3.3%) |
| Manufacturing | 1,208 (72.5%) | 459 (27.5%) |
| Wholesale Trade | 92 (61.7%) | 57 (38.3%) |
| Retail Trade | 648 (52.2%) | 593 (47.8%) |
| Transportation & Warehousing | 813 (97.7%) | 19 (2.3%) |
| Utilities | 106 (82.8%) | 22 (17.2%) |
| Information | 42 (85.7%) | 7 (14.3%) |
| Finance & Insurance | 72 (25.4%) | 211 (74.6%) |
| Real Estate, Rental & Leasing | 86 (62.3%) | 52 (37.7%) |
| Professional & Scientific | 116 (44.1%) | 147 (55.9%) |
| Enterprise Management | 0 (0.0%) | 0 (0.0%) |
| Administrative & Support | 207 (61.1%) | 132 (38.9%) |
| Educational Services | 227 (33.0%) | 461 (67.0%) |
| Health Care & Social Assistance | 478 (21.1%) | 1,786 (78.9%) |
| Arts, Entertainment & Recreation | 43 (38.7%) | 68 (61.3%) |
| Accommodation & Food Services | 366 (49.4%) | 375 (50.6%) |
| Public Administration | 227 (46.3%) | 263 (53.7%) |
| Total | 5,709 (53.0%) | 5,071 (47.0%) |
Education in Copiah County
School Enrollment in Copiah County
The most common levels of schooling among the 6,873 students in Copiah County are college / undergraduate (1,755 | 25.5%), middle school (1,594 | 23.2%), and elementary school (1,459 | 21.2%).
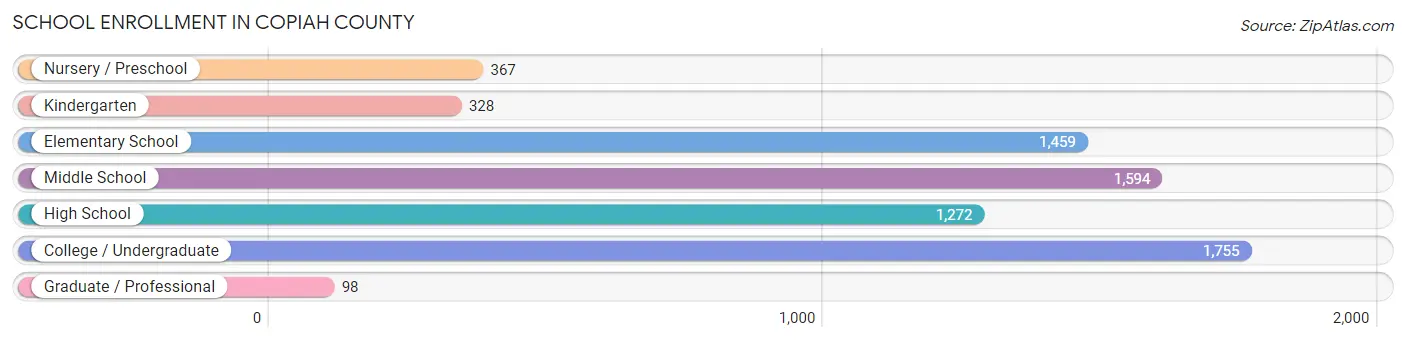
| School Level | # Students | % Students |
| Nursery / Preschool | 367 | 5.3% |
| Kindergarten | 328 | 4.8% |
| Elementary School | 1,459 | 21.2% |
| Middle School | 1,594 | 23.2% |
| High School | 1,272 | 18.5% |
| College / Undergraduate | 1,755 | 25.5% |
| Graduate / Professional | 98 | 1.4% |
| Total | 6,873 | 100.0% |
School Enrollment by Age by Funding Source in Copiah County
Out of a total of 6,873 students who are enrolled in schools in Copiah County, 928 (13.5%) attend a private institution, while the remaining 5,945 (86.5%) are enrolled in public schools. The age group of 3 to 4 year olds has the highest likelihood of being enrolled in private schools, with 79 (21.8% in the age bracket) enrolled. Conversely, the age group of 25 to 34 year olds has the lowest likelihood of being enrolled in a private school, with 55 (100.0% in the age bracket) attending a public institution.
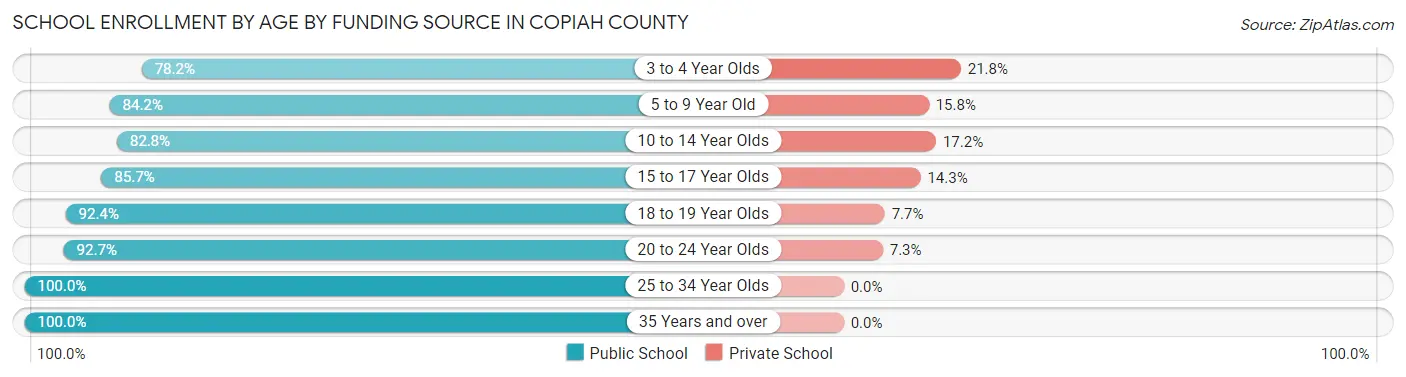
| Age Bracket | Public School | Private School |
| 3 to 4 Year Olds | 283 (78.2%) | 79 (21.8%) |
| 5 to 9 Year Old | 1,413 (84.2%) | 266 (15.8%) |
| 10 to 14 Year Olds | 1,387 (82.8%) | 288 (17.2%) |
| 15 to 17 Year Olds | 880 (85.7%) | 147 (14.3%) |
| 18 to 19 Year Olds | 1,074 (92.3%) | 89 (7.6%) |
| 20 to 24 Year Olds | 713 (92.7%) | 56 (7.3%) |
| 25 to 34 Year Olds | 55 (100.0%) | 0 (0.0%) |
| 35 Years and over | 143 (100.0%) | 0 (0.0%) |
| Total | 5,945 (86.5%) | 928 (13.5%) |
Educational Attainment by Field of Study in Copiah County
Science & technology (853 | 21.0%), business (686 | 16.9%), education (523 | 12.9%), arts & humanities (379 | 9.3%), and liberal arts & history (377 | 9.3%) are the most common fields of study among 4,064 individuals in Copiah County who have obtained a bachelor's degree or higher.
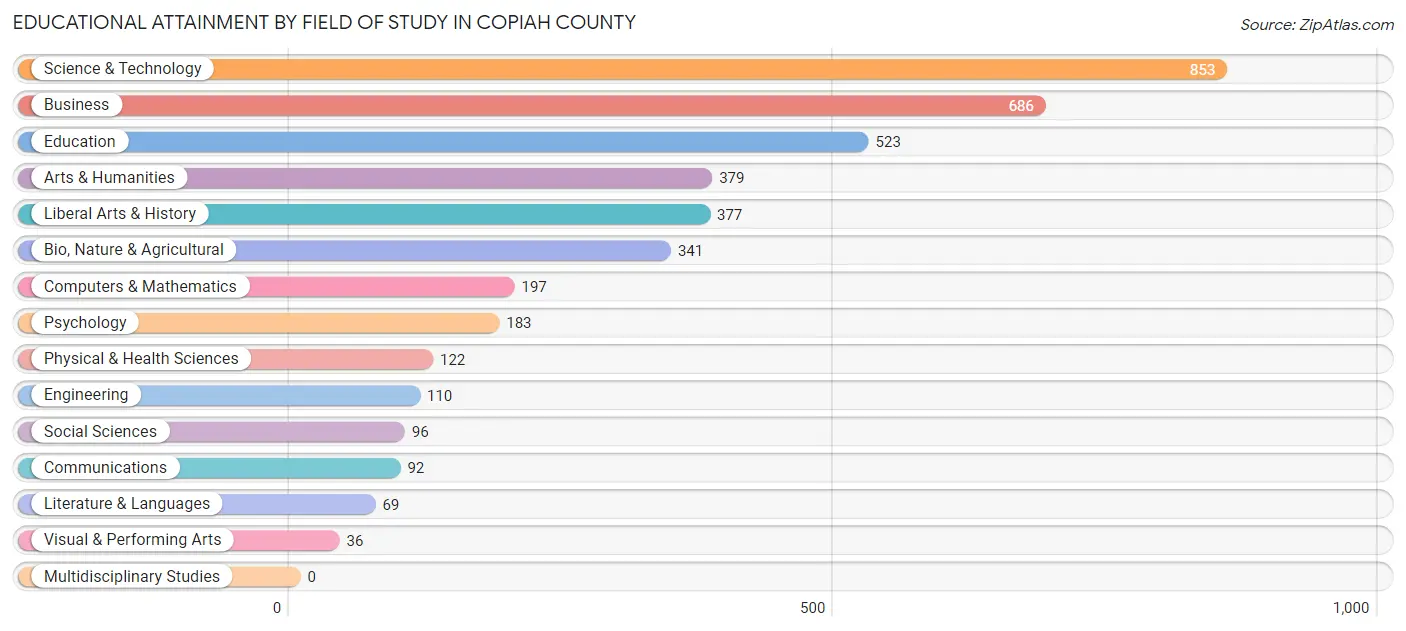
| Field of Study | # Graduates | % Graduates |
| Computers & Mathematics | 197 | 4.9% |
| Bio, Nature & Agricultural | 341 | 8.4% |
| Physical & Health Sciences | 122 | 3.0% |
| Psychology | 183 | 4.5% |
| Social Sciences | 96 | 2.4% |
| Engineering | 110 | 2.7% |
| Multidisciplinary Studies | 0 | 0.0% |
| Science & Technology | 853 | 21.0% |
| Business | 686 | 16.9% |
| Education | 523 | 12.9% |
| Literature & Languages | 69 | 1.7% |
| Liberal Arts & History | 377 | 9.3% |
| Visual & Performing Arts | 36 | 0.9% |
| Communications | 92 | 2.3% |
| Arts & Humanities | 379 | 9.3% |
| Total | 4,064 | 100.0% |
Transportation & Commute in Copiah County
Vehicle Availability by Sex in Copiah County
The most prevalent vehicle ownership categories in Copiah County are males with 2 vehicles (2,130, accounting for 38.5%) and females with 2 vehicles (2,103, making up 43.8%).
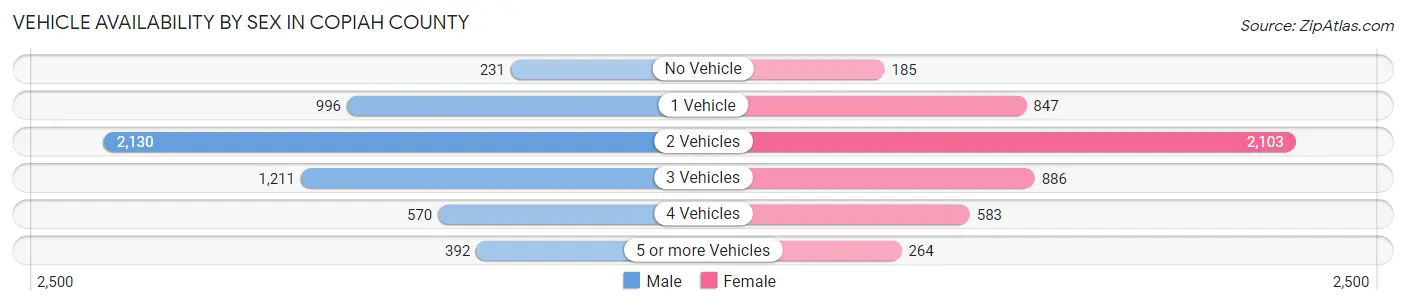
| Vehicles Available | Male | Female |
| No Vehicle | 231 (4.2%) | 185 (3.8%) |
| 1 Vehicle | 996 (18.0%) | 847 (17.4%) |
| 2 Vehicles | 2,130 (38.5%) | 2,103 (43.2%) |
| 3 Vehicles | 1,211 (21.9%) | 886 (18.2%) |
| 4 Vehicles | 570 (10.3%) | 583 (12.0%) |
| 5 or more Vehicles | 392 (7.1%) | 264 (5.4%) |
| Total | 5,530 (100.0%) | 4,868 (100.0%) |
Commute Time in Copiah County
The most frequently occuring commute durations in Copiah County are 45 to 59 minutes (1,547 commuters, 15.1%), 15 to 19 minutes (1,345 commuters, 13.2%), and 20 to 24 minutes (1,153 commuters, 11.3%).
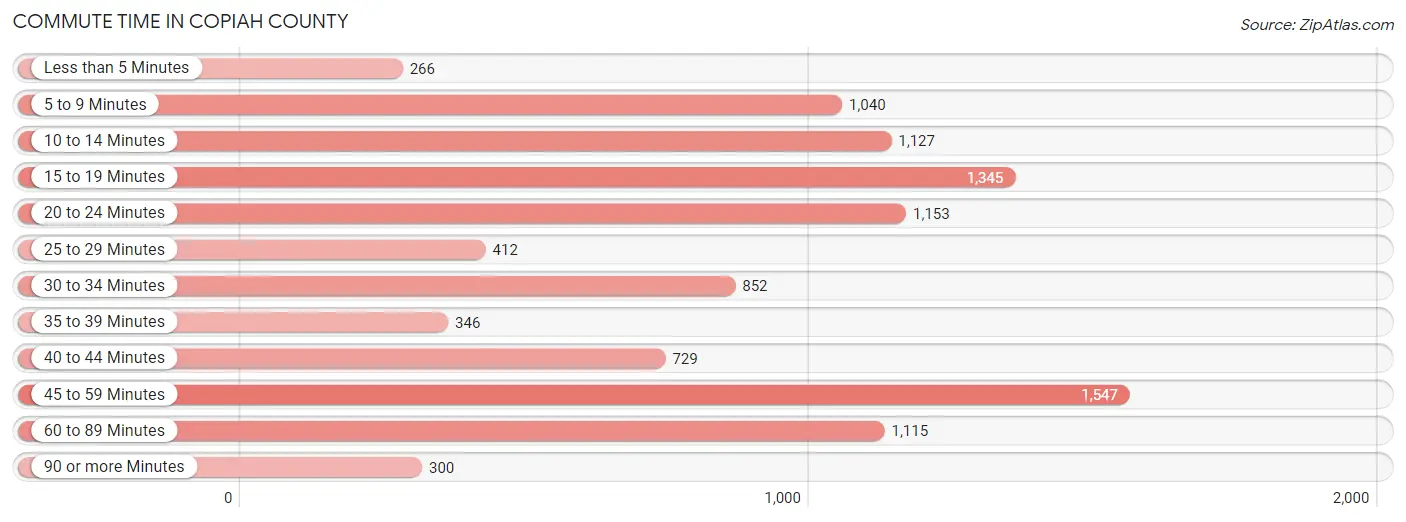
| Commute Time | # Commuters | % Commuters |
| Less than 5 Minutes | 266 | 2.6% |
| 5 to 9 Minutes | 1,040 | 10.2% |
| 10 to 14 Minutes | 1,127 | 11.0% |
| 15 to 19 Minutes | 1,345 | 13.2% |
| 20 to 24 Minutes | 1,153 | 11.3% |
| 25 to 29 Minutes | 412 | 4.0% |
| 30 to 34 Minutes | 852 | 8.3% |
| 35 to 39 Minutes | 346 | 3.4% |
| 40 to 44 Minutes | 729 | 7.1% |
| 45 to 59 Minutes | 1,547 | 15.1% |
| 60 to 89 Minutes | 1,115 | 10.9% |
| 90 or more Minutes | 300 | 2.9% |
Commute Time by Sex in Copiah County
The most common commute times in Copiah County are 60 to 89 minutes (788 commuters, 14.6%) for males and 15 to 19 minutes (850 commuters, 17.6%) for females.
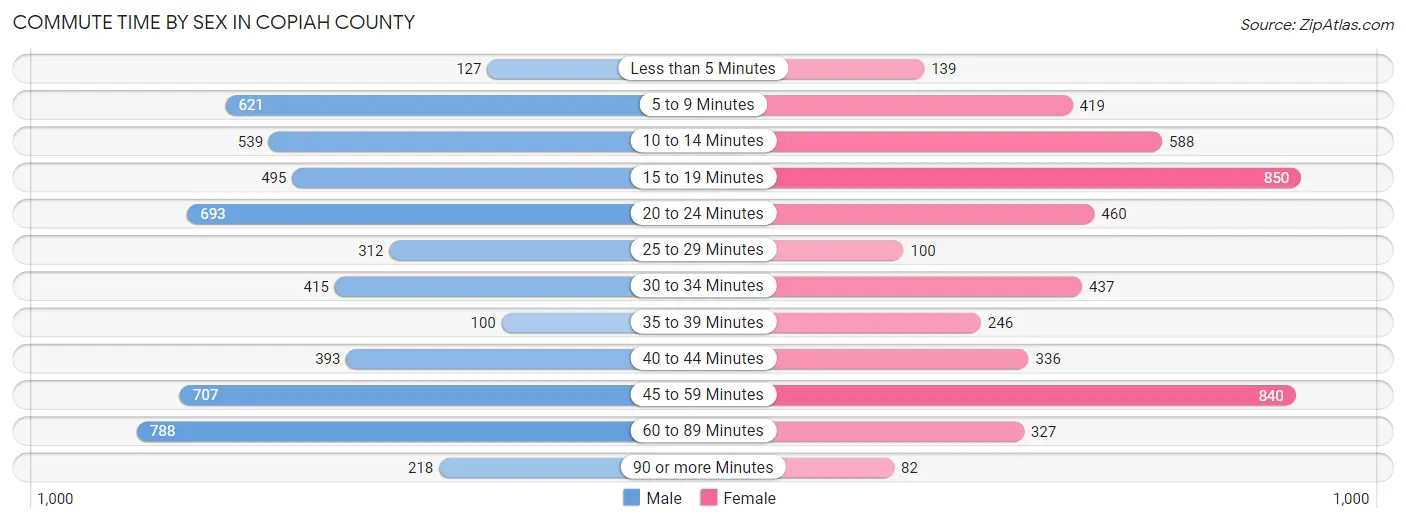
| Commute Time | Male | Female |
| Less than 5 Minutes | 127 (2.4%) | 139 (2.9%) |
| 5 to 9 Minutes | 621 (11.5%) | 419 (8.7%) |
| 10 to 14 Minutes | 539 (10.0%) | 588 (12.2%) |
| 15 to 19 Minutes | 495 (9.1%) | 850 (17.6%) |
| 20 to 24 Minutes | 693 (12.8%) | 460 (9.5%) |
| 25 to 29 Minutes | 312 (5.8%) | 100 (2.1%) |
| 30 to 34 Minutes | 415 (7.7%) | 437 (9.1%) |
| 35 to 39 Minutes | 100 (1.8%) | 246 (5.1%) |
| 40 to 44 Minutes | 393 (7.3%) | 336 (7.0%) |
| 45 to 59 Minutes | 707 (13.1%) | 840 (17.4%) |
| 60 to 89 Minutes | 788 (14.6%) | 327 (6.8%) |
| 90 or more Minutes | 218 (4.0%) | 82 (1.7%) |
Time of Departure to Work by Sex in Copiah County
The most frequent times of departure to work in Copiah County are 7:00 AM to 7:29 AM (974, 18.0%) for males and 7:30 AM to 7:59 AM (750, 15.5%) for females.
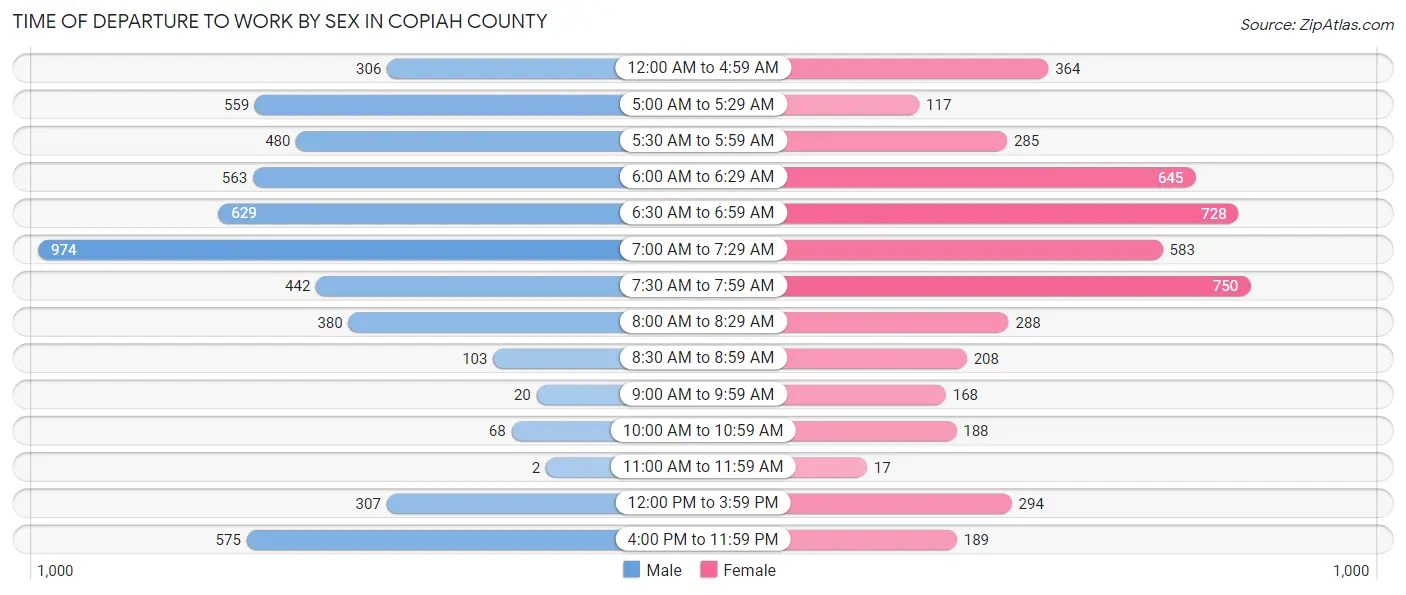
| Time of Departure | Male | Female |
| 12:00 AM to 4:59 AM | 306 (5.7%) | 364 (7.5%) |
| 5:00 AM to 5:29 AM | 559 (10.3%) | 117 (2.4%) |
| 5:30 AM to 5:59 AM | 480 (8.9%) | 285 (5.9%) |
| 6:00 AM to 6:29 AM | 563 (10.4%) | 645 (13.4%) |
| 6:30 AM to 6:59 AM | 629 (11.6%) | 728 (15.1%) |
| 7:00 AM to 7:29 AM | 974 (18.0%) | 583 (12.1%) |
| 7:30 AM to 7:59 AM | 442 (8.2%) | 750 (15.5%) |
| 8:00 AM to 8:29 AM | 380 (7.0%) | 288 (6.0%) |
| 8:30 AM to 8:59 AM | 103 (1.9%) | 208 (4.3%) |
| 9:00 AM to 9:59 AM | 20 (0.4%) | 168 (3.5%) |
| 10:00 AM to 10:59 AM | 68 (1.3%) | 188 (3.9%) |
| 11:00 AM to 11:59 AM | 2 (0.0%) | 17 (0.4%) |
| 12:00 PM to 3:59 PM | 307 (5.7%) | 294 (6.1%) |
| 4:00 PM to 11:59 PM | 575 (10.6%) | 189 (3.9%) |
| Total | 5,408 (100.0%) | 4,824 (100.0%) |
Housing Occupancy in Copiah County
Occupancy by Ownership in Copiah County
Of the total 9,841 dwellings in Copiah County, owner-occupied units account for 7,505 (76.3%), while renter-occupied units make up 2,336 (23.7%).
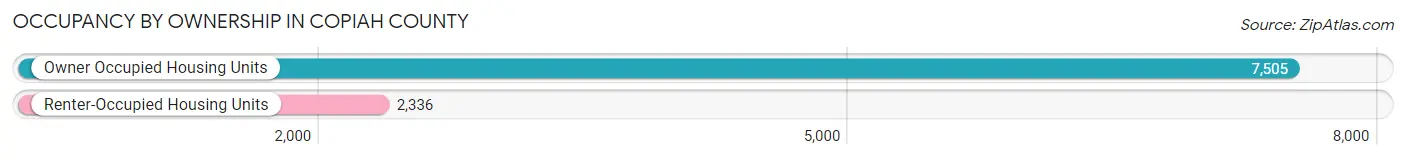
| Occupancy | # Housing Units | % Housing Units |
| Owner Occupied Housing Units | 7,505 | 76.3% |
| Renter-Occupied Housing Units | 2,336 | 23.7% |
| Total Occupied Housing Units | 9,841 | 100.0% |
Occupancy by Household Size in Copiah County
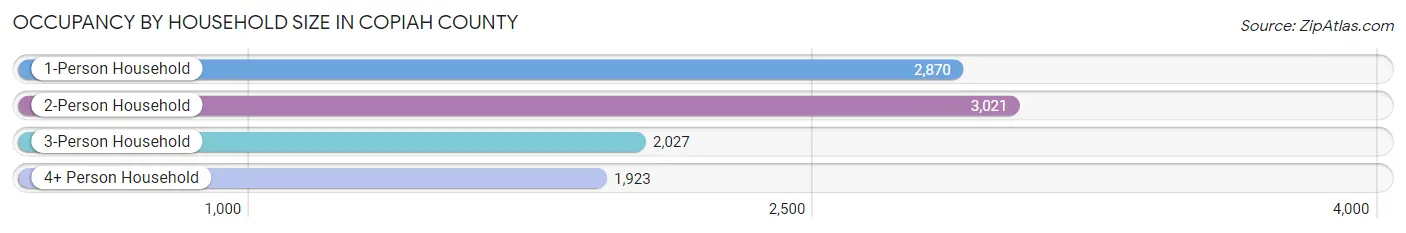
| Household Size | # Housing Units | % Housing Units |
| 1-Person Household | 2,870 | 29.2% |
| 2-Person Household | 3,021 | 30.7% |
| 3-Person Household | 2,027 | 20.6% |
| 4+ Person Household | 1,923 | 19.5% |
| Total Housing Units | 9,841 | 100.0% |
Occupancy by Ownership by Household Size in Copiah County
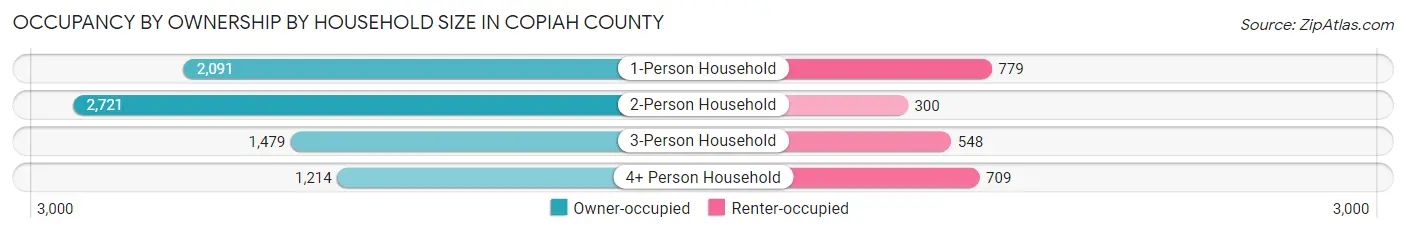
| Household Size | Owner-occupied | Renter-occupied |
| 1-Person Household | 2,091 (72.9%) | 779 (27.1%) |
| 2-Person Household | 2,721 (90.1%) | 300 (9.9%) |
| 3-Person Household | 1,479 (73.0%) | 548 (27.0%) |
| 4+ Person Household | 1,214 (63.1%) | 709 (36.9%) |
| Total Housing Units | 7,505 (76.3%) | 2,336 (23.7%) |
Occupancy by Educational Attainment in Copiah County
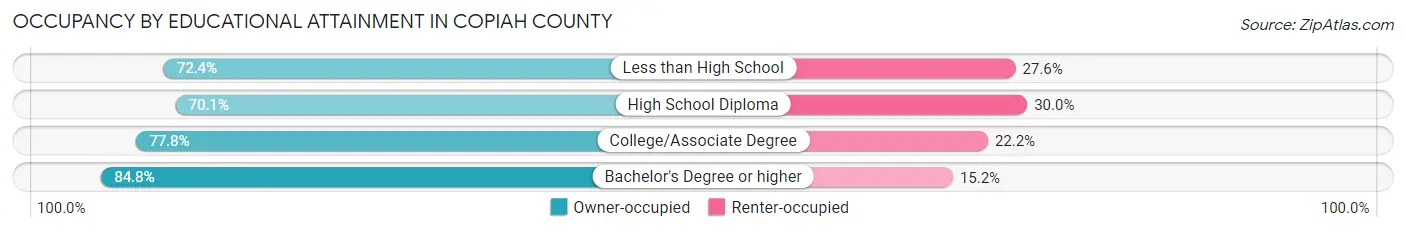
| Household Size | Owner-occupied | Renter-occupied |
| Less than High School | 857 (72.4%) | 327 (27.6%) |
| High School Diploma | 2,152 (70.1%) | 920 (29.9%) |
| College/Associate Degree | 2,680 (77.8%) | 763 (22.2%) |
| Bachelor's Degree or higher | 1,816 (84.8%) | 326 (15.2%) |
Occupancy by Age of Householder in Copiah County
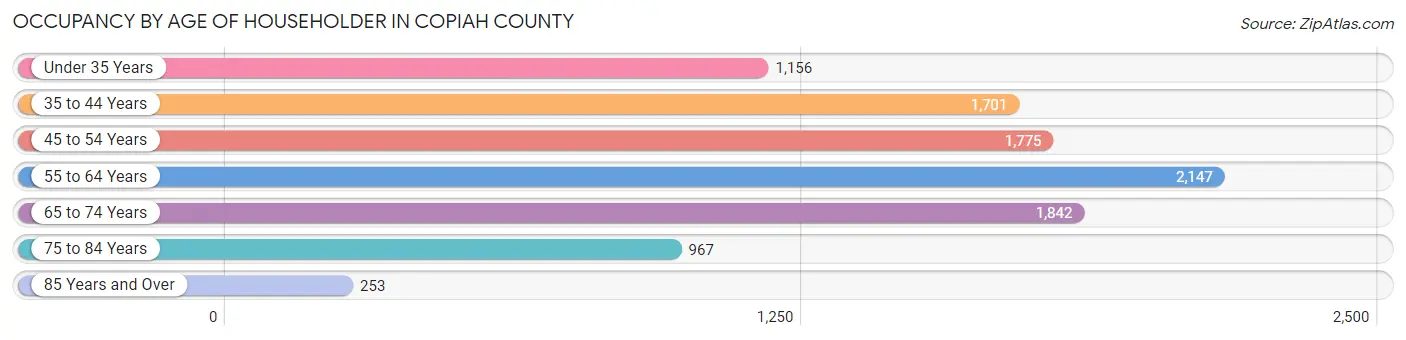
| Age Bracket | # Households | % Households |
| Under 35 Years | 1,156 | 11.7% |
| 35 to 44 Years | 1,701 | 17.3% |
| 45 to 54 Years | 1,775 | 18.0% |
| 55 to 64 Years | 2,147 | 21.8% |
| 65 to 74 Years | 1,842 | 18.7% |
| 75 to 84 Years | 967 | 9.8% |
| 85 Years and Over | 253 | 2.6% |
| Total | 9,841 | 100.0% |
Housing Finances in Copiah County
Median Income by Occupancy in Copiah County
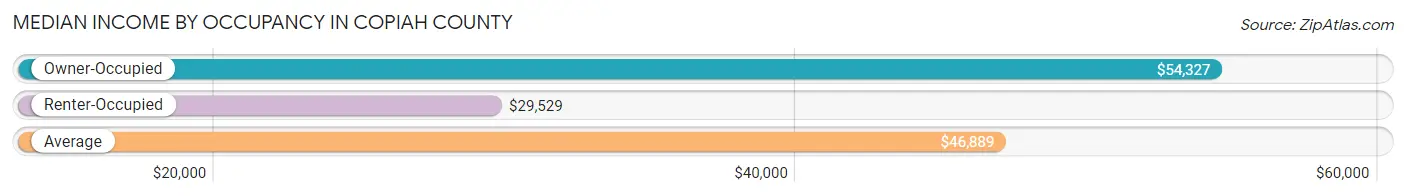
| Occupancy Type | # Households | Median Income |
| Owner-Occupied | 7,505 (76.3%) | $54,327 |
| Renter-Occupied | 2,336 (23.7%) | $29,529 |
| Average | 9,841 (100.0%) | $46,889 |
Occupancy by Householder Income Bracket in Copiah County
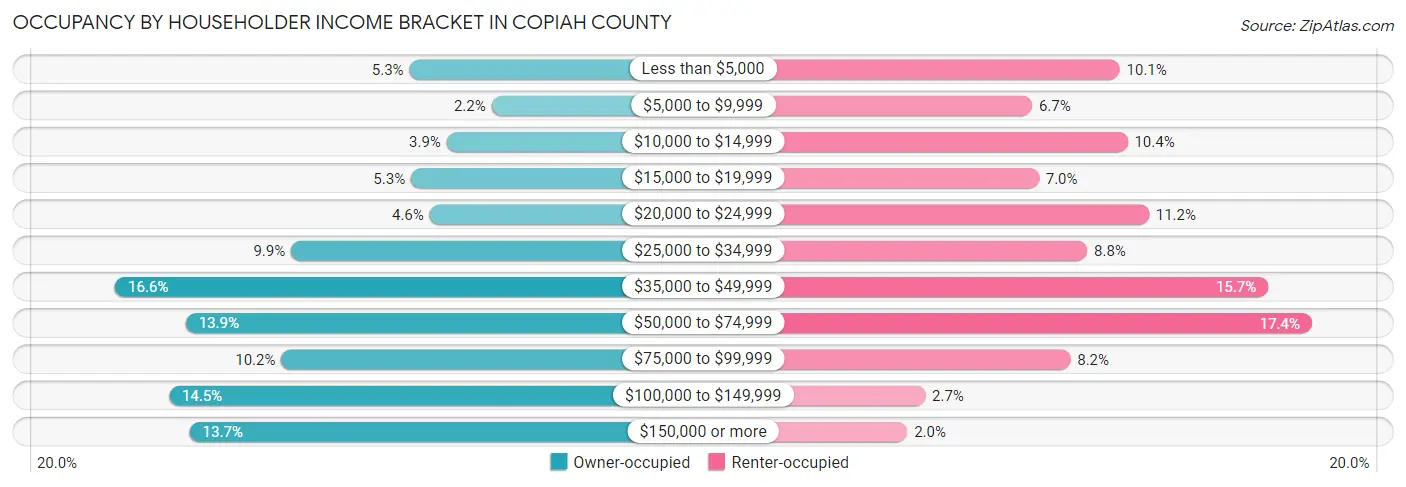
| Income Bracket | Owner-occupied | Renter-occupied |
| Less than $5,000 | 401 (5.3%) | 235 (10.1%) |
| $5,000 to $9,999 | 166 (2.2%) | 157 (6.7%) |
| $10,000 to $14,999 | 294 (3.9%) | 242 (10.4%) |
| $15,000 to $19,999 | 396 (5.3%) | 163 (7.0%) |
| $20,000 to $24,999 | 343 (4.6%) | 261 (11.2%) |
| $25,000 to $34,999 | 739 (9.9%) | 206 (8.8%) |
| $35,000 to $49,999 | 1,242 (16.6%) | 367 (15.7%) |
| $50,000 to $74,999 | 1,040 (13.9%) | 406 (17.4%) |
| $75,000 to $99,999 | 767 (10.2%) | 191 (8.2%) |
| $100,000 to $149,999 | 1,088 (14.5%) | 62 (2.6%) |
| $150,000 or more | 1,029 (13.7%) | 46 (2.0%) |
| Total | 7,505 (100.0%) | 2,336 (100.0%) |
Monthly Housing Cost Tiers in Copiah County
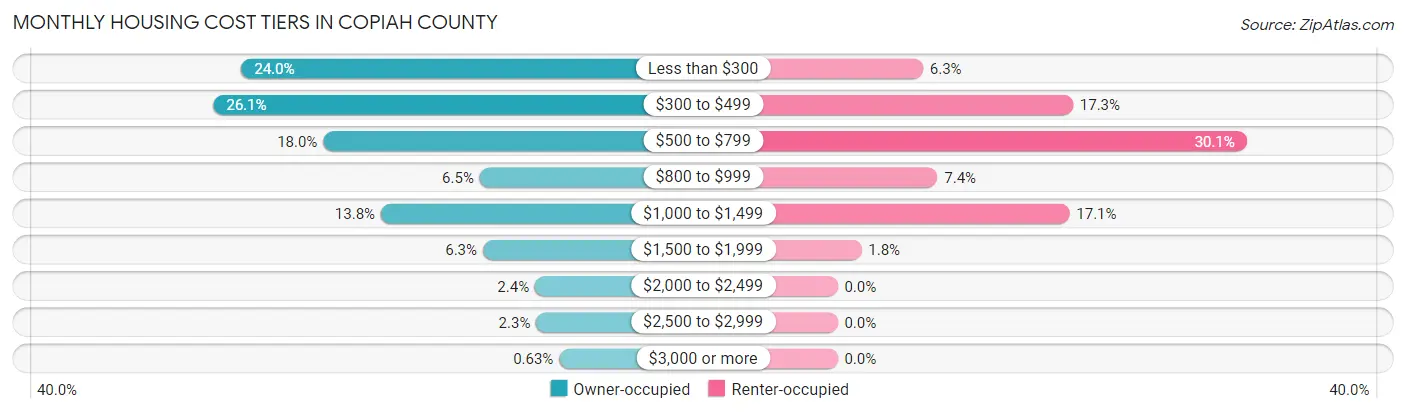
| Monthly Cost | Owner-occupied | Renter-occupied |
| Less than $300 | 1,804 (24.0%) | 147 (6.3%) |
| $300 to $499 | 1,959 (26.1%) | 405 (17.3%) |
| $500 to $799 | 1,352 (18.0%) | 704 (30.1%) |
| $800 to $999 | 486 (6.5%) | 172 (7.4%) |
| $1,000 to $1,499 | 1,033 (13.8%) | 399 (17.1%) |
| $1,500 to $1,999 | 469 (6.2%) | 41 (1.8%) |
| $2,000 to $2,499 | 181 (2.4%) | 0 (0.0%) |
| $2,500 to $2,999 | 174 (2.3%) | 0 (0.0%) |
| $3,000 or more | 47 (0.6%) | 0 (0.0%) |
| Total | 7,505 (100.0%) | 2,336 (100.0%) |
Physical Housing Characteristics in Copiah County
Housing Structures in Copiah County
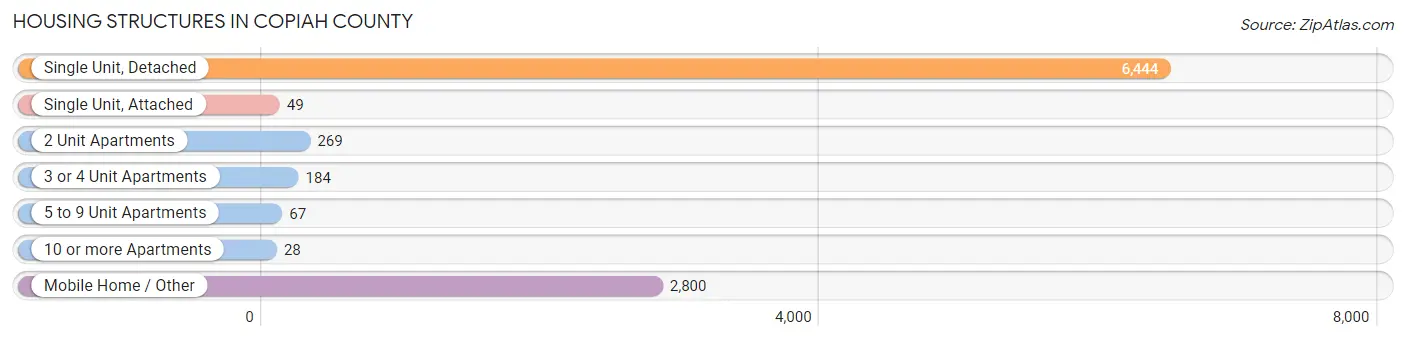
| Structure Type | # Housing Units | % Housing Units |
| Single Unit, Detached | 6,444 | 65.5% |
| Single Unit, Attached | 49 | 0.5% |
| 2 Unit Apartments | 269 | 2.7% |
| 3 or 4 Unit Apartments | 184 | 1.9% |
| 5 to 9 Unit Apartments | 67 | 0.7% |
| 10 or more Apartments | 28 | 0.3% |
| Mobile Home / Other | 2,800 | 28.4% |
| Total | 9,841 | 100.0% |
Housing Structures by Occupancy in Copiah County
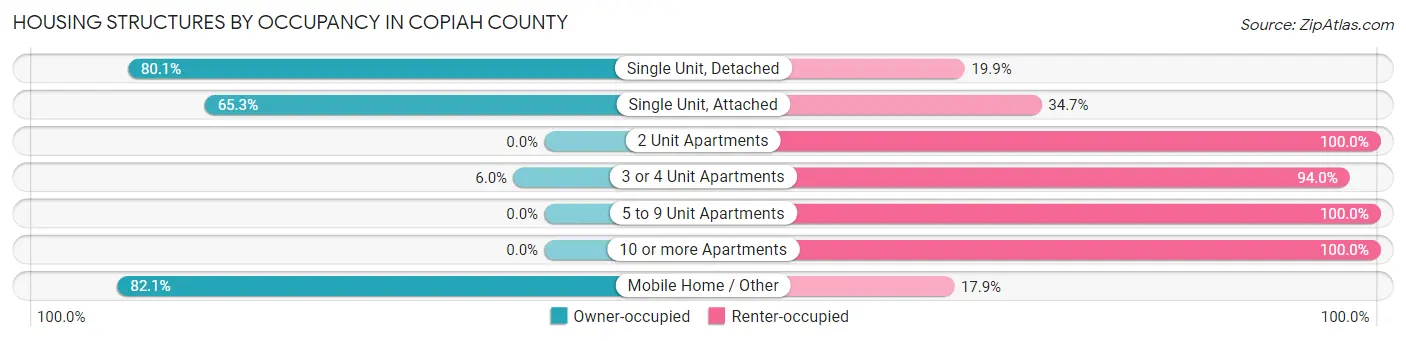
| Structure Type | Owner-occupied | Renter-occupied |
| Single Unit, Detached | 5,162 (80.1%) | 1,282 (19.9%) |
| Single Unit, Attached | 32 (65.3%) | 17 (34.7%) |
| 2 Unit Apartments | 0 (0.0%) | 269 (100.0%) |
| 3 or 4 Unit Apartments | 11 (6.0%) | 173 (94.0%) |
| 5 to 9 Unit Apartments | 0 (0.0%) | 67 (100.0%) |
| 10 or more Apartments | 0 (0.0%) | 28 (100.0%) |
| Mobile Home / Other | 2,300 (82.1%) | 500 (17.9%) |
| Total | 7,505 (76.3%) | 2,336 (23.7%) |
Housing Structures by Number of Rooms in Copiah County
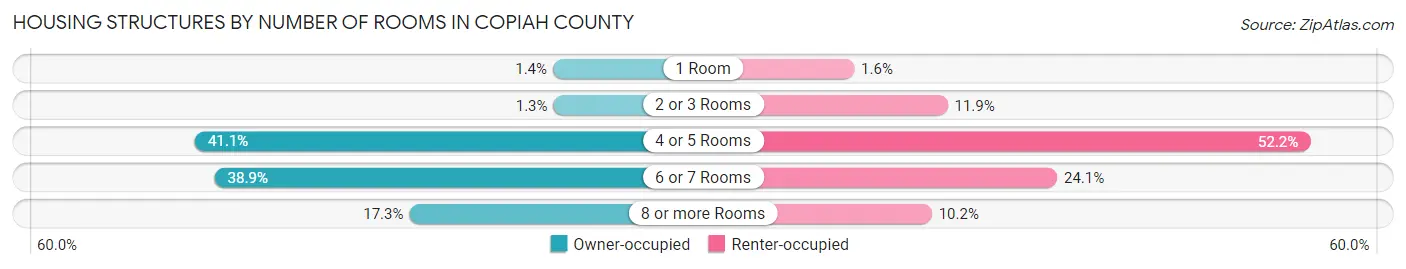
| Number of Rooms | Owner-occupied | Renter-occupied |
| 1 Room | 103 (1.4%) | 37 (1.6%) |
| 2 or 3 Rooms | 99 (1.3%) | 279 (11.9%) |
| 4 or 5 Rooms | 3,084 (41.1%) | 1,219 (52.2%) |
| 6 or 7 Rooms | 2,920 (38.9%) | 563 (24.1%) |
| 8 or more Rooms | 1,299 (17.3%) | 238 (10.2%) |
| Total | 7,505 (100.0%) | 2,336 (100.0%) |
Housing Structure by Heating Type in Copiah County
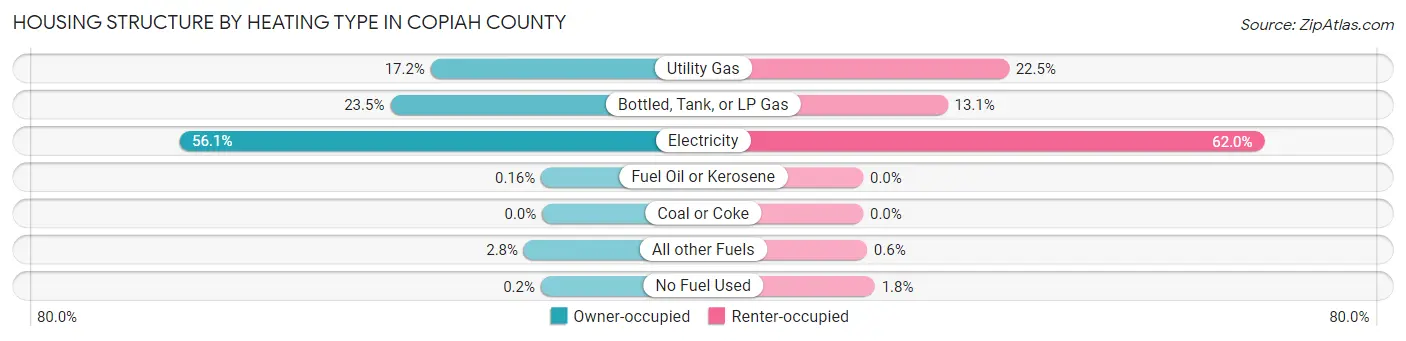
| Heating Type | Owner-occupied | Renter-occupied |
| Utility Gas | 1,292 (17.2%) | 526 (22.5%) |
| Bottled, Tank, or LP Gas | 1,762 (23.5%) | 305 (13.1%) |
| Electricity | 4,212 (56.1%) | 1,449 (62.0%) |
| Fuel Oil or Kerosene | 12 (0.2%) | 0 (0.0%) |
| Coal or Coke | 0 (0.0%) | 0 (0.0%) |
| All other Fuels | 212 (2.8%) | 14 (0.6%) |
| No Fuel Used | 15 (0.2%) | 42 (1.8%) |
| Total | 7,505 (100.0%) | 2,336 (100.0%) |
Household Vehicle Usage in Copiah County
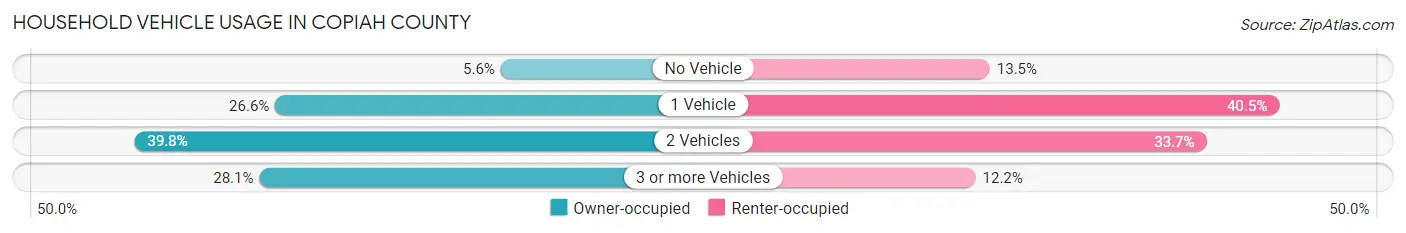
| Vehicles per Household | Owner-occupied | Renter-occupied |
| No Vehicle | 417 (5.6%) | 316 (13.5%) |
| 1 Vehicle | 1,997 (26.6%) | 947 (40.5%) |
| 2 Vehicles | 2,983 (39.8%) | 788 (33.7%) |
| 3 or more Vehicles | 2,108 (28.1%) | 285 (12.2%) |
| Total | 7,505 (100.0%) | 2,336 (100.0%) |
Real Estate & Mortgages in Copiah County
Real Estate and Mortgage Overview in Copiah County
| Characteristic | Without Mortgage | With Mortgage |
| Housing Units | 4,914 | 2,591 |
| Median Property Value | $79,600 | $134,400 |
| Median Household Income | $46,471 | $609 |
| Monthly Housing Costs | $347 | $47 |
| Real Estate Taxes | $528 | $518 |
Property Value by Mortgage Status in Copiah County
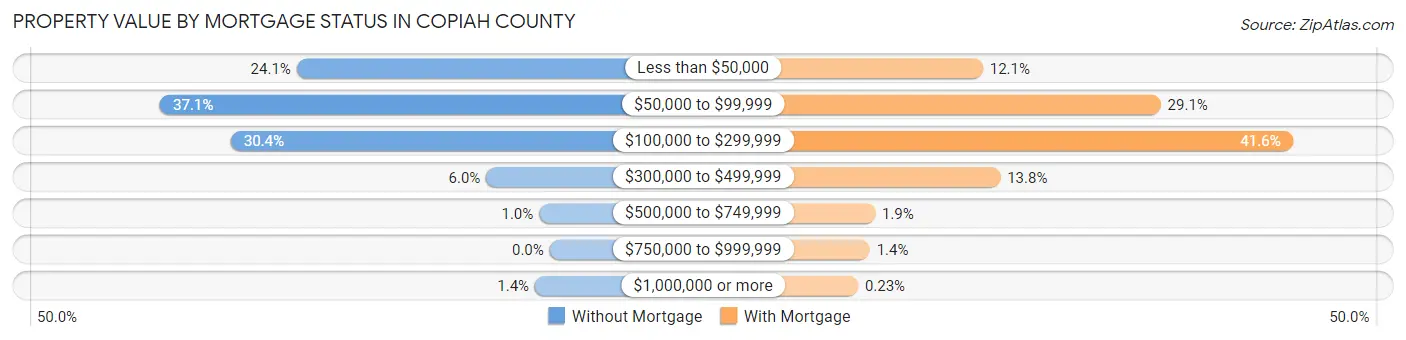
| Property Value | Without Mortgage | With Mortgage |
| Less than $50,000 | 1,184 (24.1%) | 314 (12.1%) |
| $50,000 to $99,999 | 1,823 (37.1%) | 753 (29.1%) |
| $100,000 to $299,999 | 1,492 (30.4%) | 1,078 (41.6%) |
| $300,000 to $499,999 | 297 (6.0%) | 357 (13.8%) |
| $500,000 to $749,999 | 49 (1.0%) | 48 (1.8%) |
| $750,000 to $999,999 | 0 (0.0%) | 35 (1.3%) |
| $1,000,000 or more | 69 (1.4%) | 6 (0.2%) |
| Total | 4,914 (100.0%) | 2,591 (100.0%) |
Household Income by Mortgage Status in Copiah County
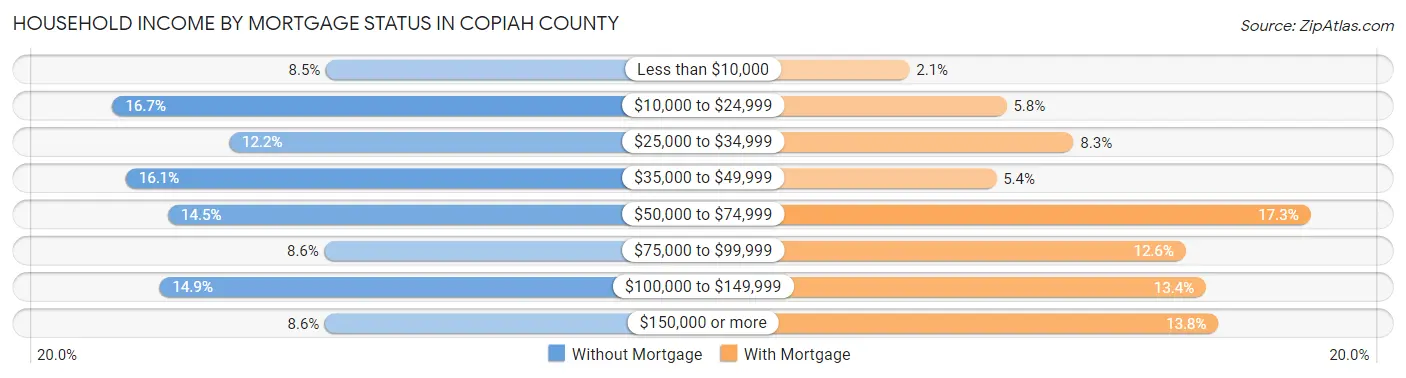
| Household Income | Without Mortgage | With Mortgage |
| Less than $10,000 | 418 (8.5%) | 53 (2.1%) |
| $10,000 to $24,999 | 818 (16.7%) | 149 (5.8%) |
| $25,000 to $34,999 | 600 (12.2%) | 215 (8.3%) |
| $35,000 to $49,999 | 793 (16.1%) | 139 (5.4%) |
| $50,000 to $74,999 | 714 (14.5%) | 449 (17.3%) |
| $75,000 to $99,999 | 421 (8.6%) | 326 (12.6%) |
| $100,000 to $149,999 | 730 (14.9%) | 346 (13.4%) |
| $150,000 or more | 420 (8.6%) | 358 (13.8%) |
| Total | 4,914 (100.0%) | 2,591 (100.0%) |
Property Value to Household Income Ratio in Copiah County
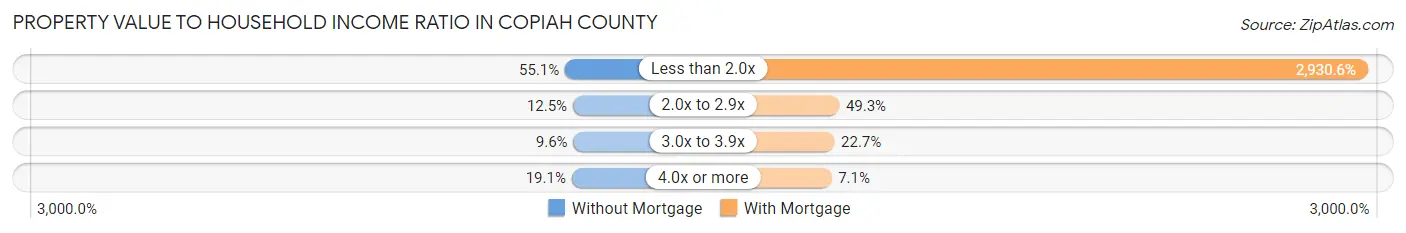
| Value-to-Income Ratio | Without Mortgage | With Mortgage |
| Less than 2.0x | 2,705 (55.0%) | 75,931 (2,930.6%) |
| 2.0x to 2.9x | 616 (12.5%) | 1,276 (49.2%) |
| 3.0x to 3.9x | 471 (9.6%) | 589 (22.7%) |
| 4.0x or more | 937 (19.1%) | 183 (7.1%) |
| Total | 4,914 (100.0%) | 2,591 (100.0%) |
Real Estate Taxes by Mortgage Status in Copiah County
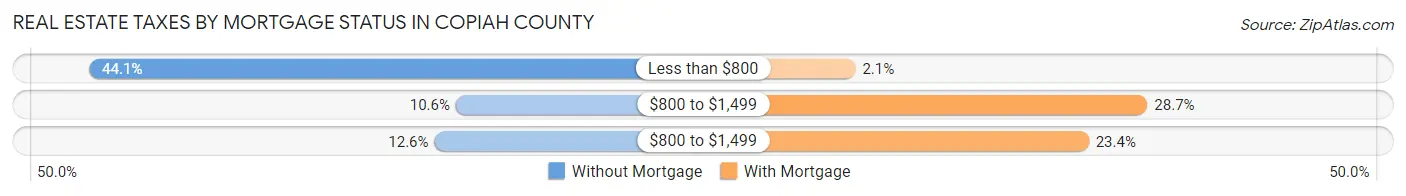
| Property Taxes | Without Mortgage | With Mortgage |
| Less than $800 | 2,167 (44.1%) | 53 (2.1%) |
| $800 to $1,499 | 522 (10.6%) | 744 (28.7%) |
| $800 to $1,499 | 618 (12.6%) | 605 (23.4%) |
| Total | 4,914 (100.0%) | 2,591 (100.0%) |
Health & Disability in Copiah County
Health Insurance Coverage by Age in Copiah County
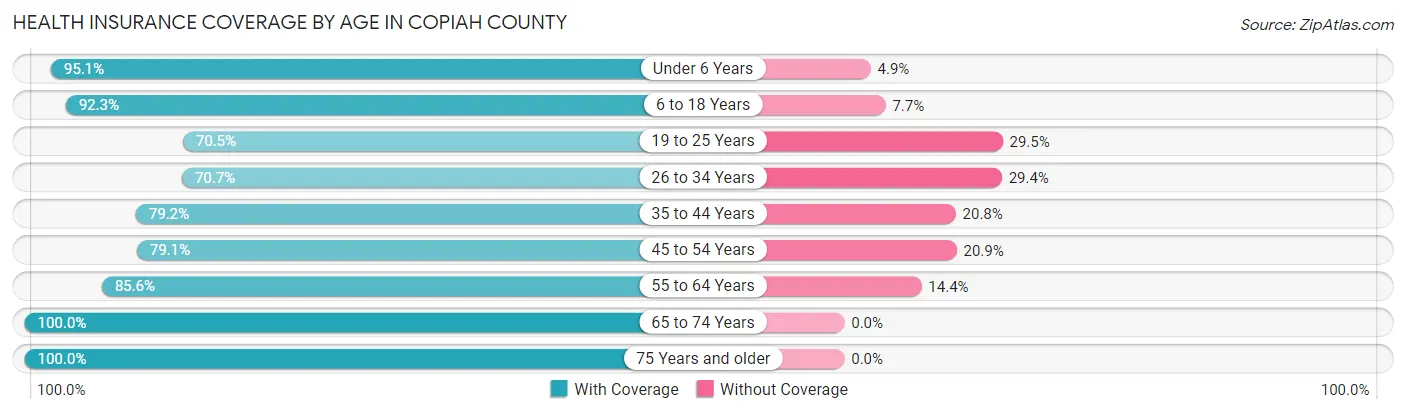
| Age Bracket | With Coverage | Without Coverage |
| Under 6 Years | 1,865 (95.1%) | 96 (4.9%) |
| 6 to 18 Years | 4,703 (92.3%) | 391 (7.7%) |
| 19 to 25 Years | 2,018 (70.5%) | 845 (29.5%) |
| 26 to 34 Years | 1,964 (70.7%) | 816 (29.3%) |
| 35 to 44 Years | 2,470 (79.2%) | 647 (20.8%) |
| 45 to 54 Years | 2,577 (79.1%) | 682 (20.9%) |
| 55 to 64 Years | 3,376 (85.6%) | 567 (14.4%) |
| 65 to 74 Years | 3,035 (100.0%) | 0 (0.0%) |
| 75 Years and older | 1,974 (100.0%) | 0 (0.0%) |
| Total | 23,982 (85.6%) | 4,044 (14.4%) |
Health Insurance Coverage by Citizenship Status in Copiah County
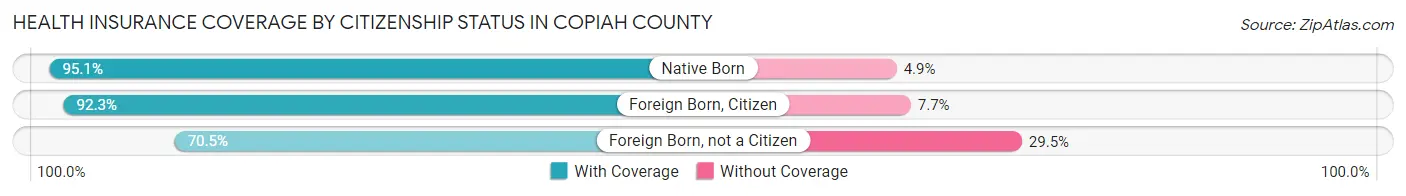
| Citizenship Status | With Coverage | Without Coverage |
| Native Born | 1,865 (95.1%) | 96 (4.9%) |
| Foreign Born, Citizen | 4,703 (92.3%) | 391 (7.7%) |
| Foreign Born, not a Citizen | 2,018 (70.5%) | 845 (29.5%) |
Health Insurance Coverage by Household Income in Copiah County
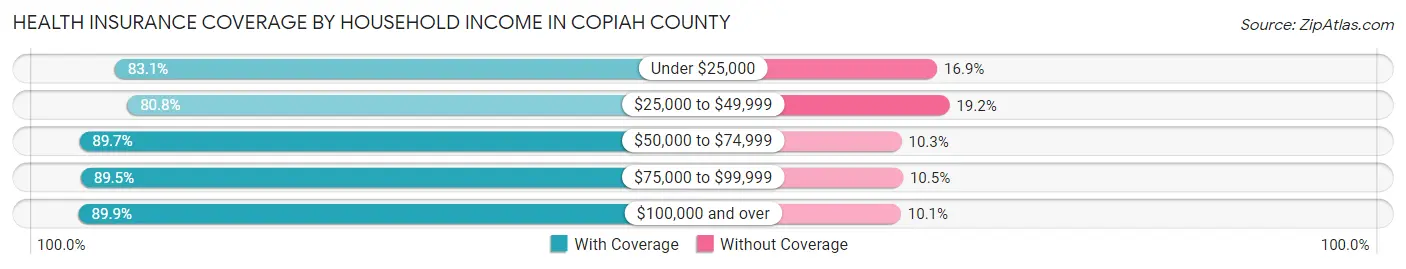
| Household Income | With Coverage | Without Coverage |
| Under $25,000 | 4,705 (83.1%) | 959 (16.9%) |
| $25,000 to $49,999 | 5,558 (80.8%) | 1,324 (19.2%) |
| $50,000 to $74,999 | 3,499 (89.7%) | 400 (10.3%) |
| $75,000 to $99,999 | 2,456 (89.5%) | 289 (10.5%) |
| $100,000 and over | 7,118 (89.9%) | 802 (10.1%) |
Public vs Private Health Insurance Coverage by Age in Copiah County
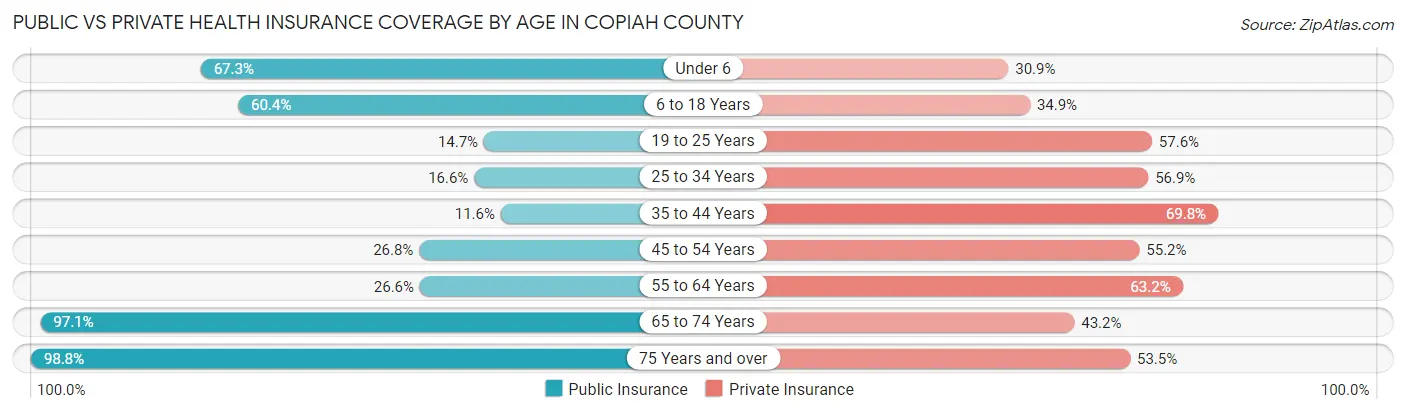
| Age Bracket | Public Insurance | Private Insurance |
| Under 6 | 1,320 (67.3%) | 606 (30.9%) |
| 6 to 18 Years | 3,075 (60.4%) | 1,779 (34.9%) |
| 19 to 25 Years | 422 (14.7%) | 1,648 (57.6%) |
| 25 to 34 Years | 460 (16.6%) | 1,581 (56.9%) |
| 35 to 44 Years | 362 (11.6%) | 2,176 (69.8%) |
| 45 to 54 Years | 872 (26.8%) | 1,800 (55.2%) |
| 55 to 64 Years | 1,050 (26.6%) | 2,493 (63.2%) |
| 65 to 74 Years | 2,946 (97.1%) | 1,310 (43.2%) |
| 75 Years and over | 1,951 (98.8%) | 1,056 (53.5%) |
| Total | 12,458 (44.5%) | 14,449 (51.6%) |
Disability Status by Sex by Age in Copiah County
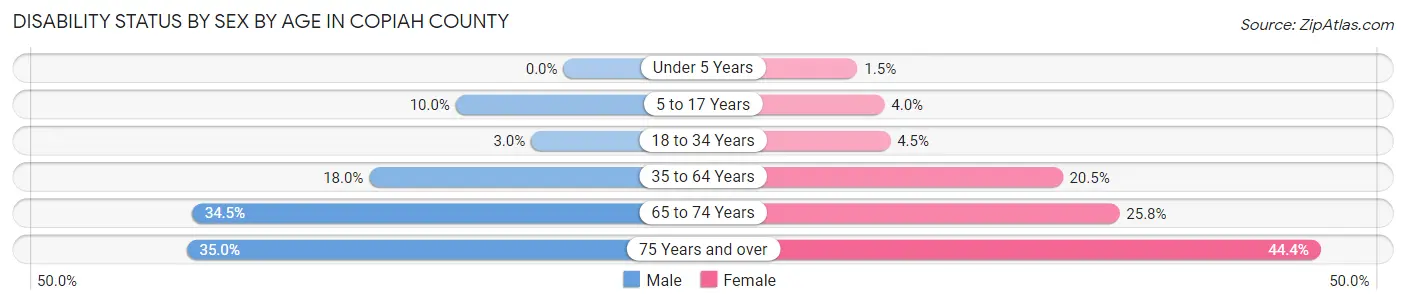
| Age Bracket | Male | Female |
| Under 5 Years | 0 (0.0%) | 14 (1.5%) |
| 5 to 17 Years | 209 (10.0%) | 103 (4.0%) |
| 18 to 34 Years | 95 (3.0%) | 143 (4.5%) |
| 35 to 64 Years | 881 (18.0%) | 1,112 (20.5%) |
| 65 to 74 Years | 483 (34.5%) | 421 (25.8%) |
| 75 Years and over | 278 (35.0%) | 524 (44.4%) |
Disability Class by Sex by Age in Copiah County
Disability Class: Hearing Difficulty
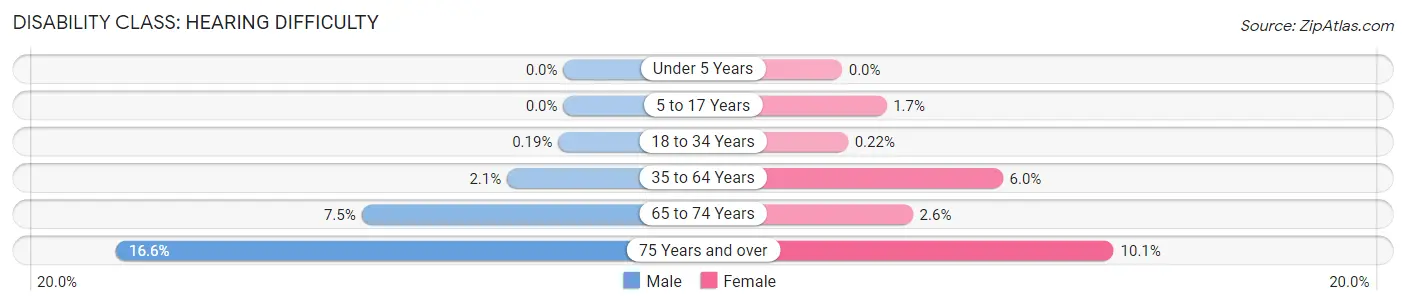
| Age Bracket | Male | Female |
| Under 5 Years | 0 (0.0%) | 0 (0.0%) |
| 5 to 17 Years | 0 (0.0%) | 43 (1.7%) |
| 18 to 34 Years | 6 (0.2%) | 7 (0.2%) |
| 35 to 64 Years | 102 (2.1%) | 324 (6.0%) |
| 65 to 74 Years | 105 (7.5%) | 43 (2.6%) |
| 75 Years and over | 132 (16.6%) | 119 (10.1%) |
Disability Class: Vision Difficulty
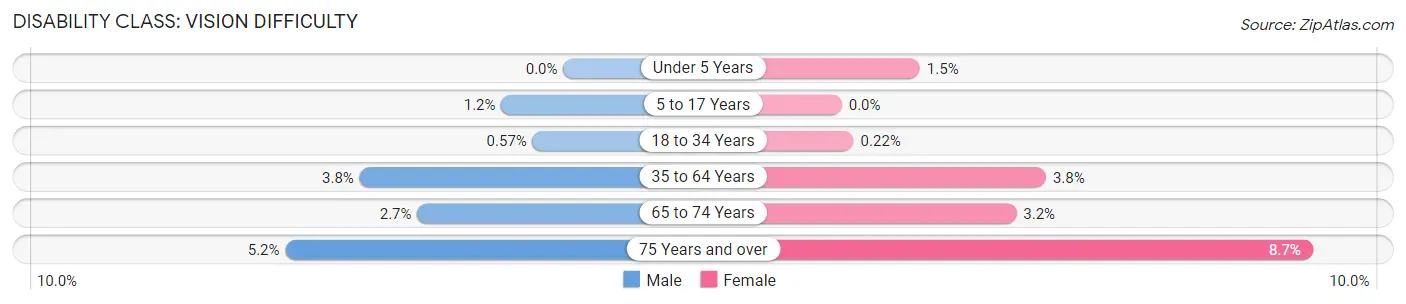
| Age Bracket | Male | Female |
| Under 5 Years | 0 (0.0%) | 14 (1.5%) |
| 5 to 17 Years | 24 (1.1%) | 0 (0.0%) |
| 18 to 34 Years | 18 (0.6%) | 7 (0.2%) |
| 35 to 64 Years | 185 (3.8%) | 206 (3.8%) |
| 65 to 74 Years | 38 (2.7%) | 53 (3.2%) |
| 75 Years and over | 41 (5.2%) | 103 (8.7%) |
Disability Class: Cognitive Difficulty
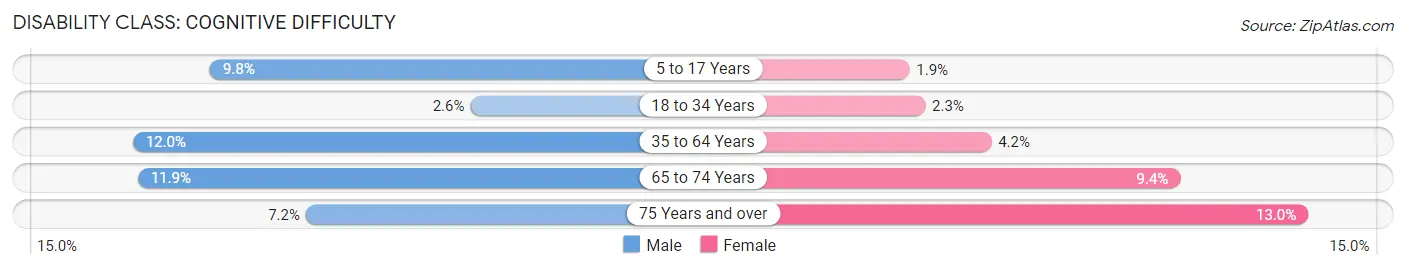
| Age Bracket | Male | Female |
| 5 to 17 Years | 206 (9.8%) | 49 (1.9%) |
| 18 to 34 Years | 82 (2.6%) | 74 (2.3%) |
| 35 to 64 Years | 586 (12.0%) | 226 (4.2%) |
| 65 to 74 Years | 166 (11.8%) | 154 (9.4%) |
| 75 Years and over | 57 (7.2%) | 153 (13.0%) |
Disability Class: Ambulatory Difficulty
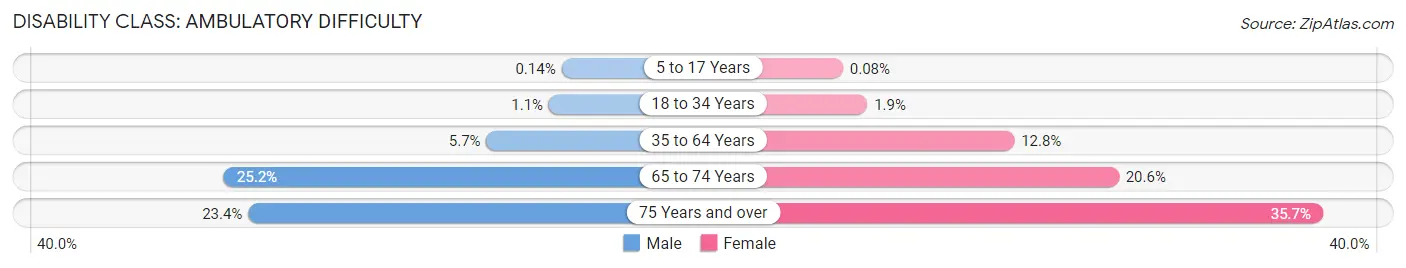
| Age Bracket | Male | Female |
| 5 to 17 Years | 3 (0.1%) | 2 (0.1%) |
| 18 to 34 Years | 34 (1.1%) | 60 (1.9%) |
| 35 to 64 Years | 279 (5.7%) | 695 (12.8%) |
| 65 to 74 Years | 353 (25.2%) | 336 (20.6%) |
| 75 Years and over | 186 (23.4%) | 421 (35.7%) |
Disability Class: Self-Care Difficulty
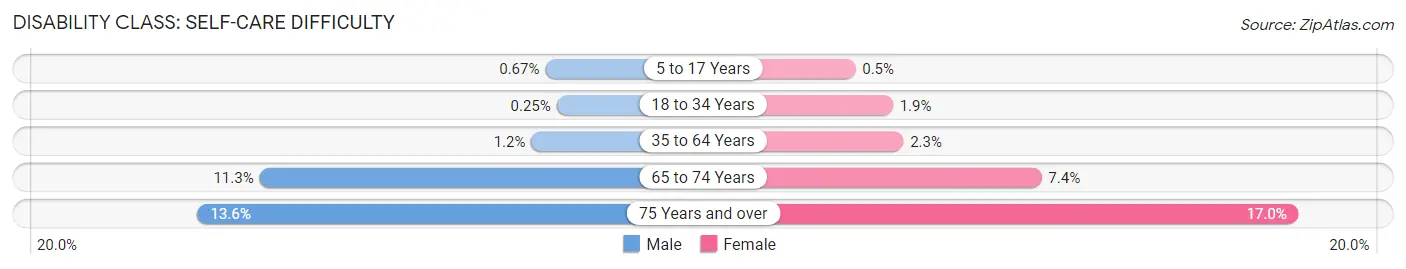
| Age Bracket | Male | Female |
| 5 to 17 Years | 14 (0.7%) | 13 (0.5%) |
| 18 to 34 Years | 8 (0.3%) | 60 (1.9%) |
| 35 to 64 Years | 58 (1.2%) | 124 (2.3%) |
| 65 to 74 Years | 158 (11.3%) | 121 (7.4%) |
| 75 Years and over | 108 (13.6%) | 200 (17.0%) |
Technology Access in Copiah County
Computing Device Access in Copiah County
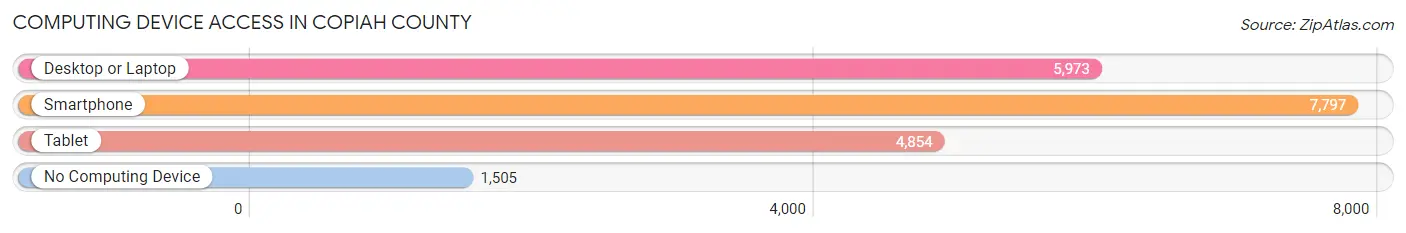
| Device Type | # Households | % Households |
| Desktop or Laptop | 5,973 | 60.7% |
| Smartphone | 7,797 | 79.2% |
| Tablet | 4,854 | 49.3% |
| No Computing Device | 1,505 | 15.3% |
| Total | 9,841 | 100.0% |
Internet Access in Copiah County
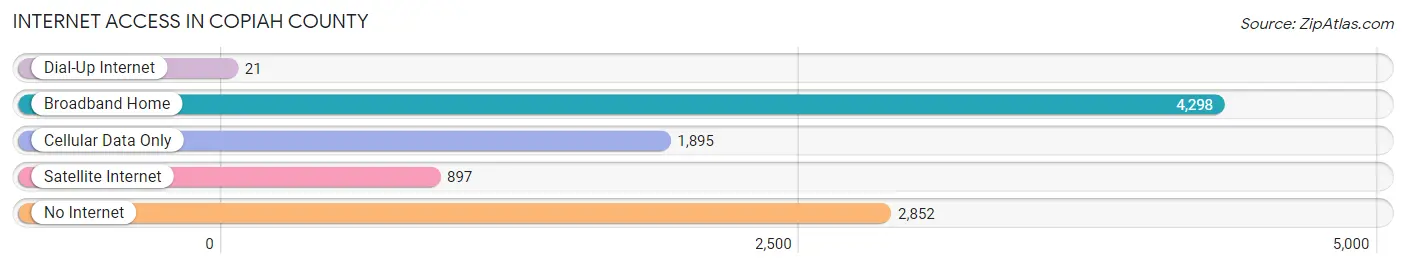
| Internet Type | # Households | % Households |
| Dial-Up Internet | 21 | 0.2% |
| Broadband Home | 4,298 | 43.7% |
| Cellular Data Only | 1,895 | 19.3% |
| Satellite Internet | 897 | 9.1% |
| No Internet | 2,852 | 29.0% |
| Total | 9,841 | 100.0% |
Copiah County Summary
Coahoma County is located in the northwestern corner of Mississippi, and is bordered by the states of Arkansas and Tennessee. It is part of the Mississippi Delta region, and is home to a population of 28,619 people, according to the 2010 census. The county seat is the city of Hazlehurst.
History
Coahoma County was established in 1836, and was named after the Choctaw word for “red panther.” The county was originally part of the Chickasaw Cession of 1832, and was part of the Yazoo Purchase of 1835. The county was originally part of the larger Tunica County, but was split off in 1836.
The county was home to a large population of African Americans, and was the site of several important events in the civil rights movement. In 1955, the county was the site of the first Freedom Ride, which was organized by the Congress of Racial Equality (CORE). The Freedom Ride was a protest against segregation on public buses, and was a major event in the civil rights movement.
Geography
Coahoma County is located in the northwestern corner of Mississippi, and is bordered by the states of Arkansas and Tennessee. It is part of the Mississippi Delta region, and is home to a population of 28,619 people, according to the 2010 census. The county seat is the city of Hazlehurst.
The county is mostly flat, with an elevation of around 200 feet above sea level. The terrain is mostly composed of alluvial soils, which are ideal for agriculture. The county is drained by the Yazoo River, which flows through the county from north to south.
Economy
Coahoma County’s economy is largely based on agriculture. The county is home to a large number of farms, and is a major producer of cotton, soybeans, corn, and other crops. The county is also home to a number of manufacturing and processing plants, including a Tyson Foods plant in Clarksdale.
The county is also home to a number of casinos, which are located in the cities of Tunica and Lula. These casinos attract a large number of visitors from across the region, and provide a significant boost to the local economy.
Demographics
According to the 2010 census, Coahoma County had a population of 28,619 people. The population was 57.3% African American, 40.2% White, 0.3% Native American, 0.2% Asian, 0.1% Pacific Islander, and 1.9% from other races. The median household income was $25,945, and the median family income was $31,945.
The county is home to a large number of African Americans, and is the site of several important events in the civil rights movement. The county is also home to a large number of churches, and is a major center of African American culture and history.
Common Questions
What is Per Capita Income in Copiah County?
Per Capita income in Copiah County is $28,072.
What is the Median Family Income in Copiah County?
Median Family Income in Copiah County is $60,159.
What is the Median Household income in Copiah County?
Median Household Income in Copiah County is $46,889.
What is Income or Wage Gap in Copiah County?
Income or Wage Gap in Copiah County is 39.5%.
Women in Copiah County earn 60.5 cents for every dollar earned by a man.
What is Family Income Deficit in Copiah County?
Family Income Deficit in Copiah County is $10,966.
Families that are below poverty line in Copiah County earn $10,966 less on average than the poverty threshold level.
What is Inequality or Gini Index in Copiah County?
Inequality or Gini Index in Copiah County is 0.54.
What is the Total Population of Copiah County?
Total Population of Copiah County is 28,210.
What is the Total Male Population of Copiah County?
Total Male Population of Copiah County is 13,135.
What is the Total Female Population of Copiah County?
Total Female Population of Copiah County is 15,075.
What is the Ratio of Males per 100 Females in Copiah County?
There are 87.13 Males per 100 Females in Copiah County.
What is the Ratio of Females per 100 Males in Copiah County?
There are 114.77 Females per 100 Males in Copiah County.
What is the Median Population Age in Copiah County?
Median Population Age in Copiah County is 39.6 Years.
What is the Average Family Size in Copiah County
Average Family Size in Copiah County is 3.5 People.
What is the Average Household Size in Copiah County
Average Household Size in Copiah County is 2.8 People.
How Large is the Labor Force in Copiah County?
There are 11,370 People in the Labor Forcein in Copiah County.
What is the Percentage of People in the Labor Force in Copiah County?
50.1% of People are in the Labor Force in Copiah County.
What is the Unemployment Rate in Copiah County?
Unemployment Rate in Copiah County is 5.2%.