Byhalia, MS Map & Demographics
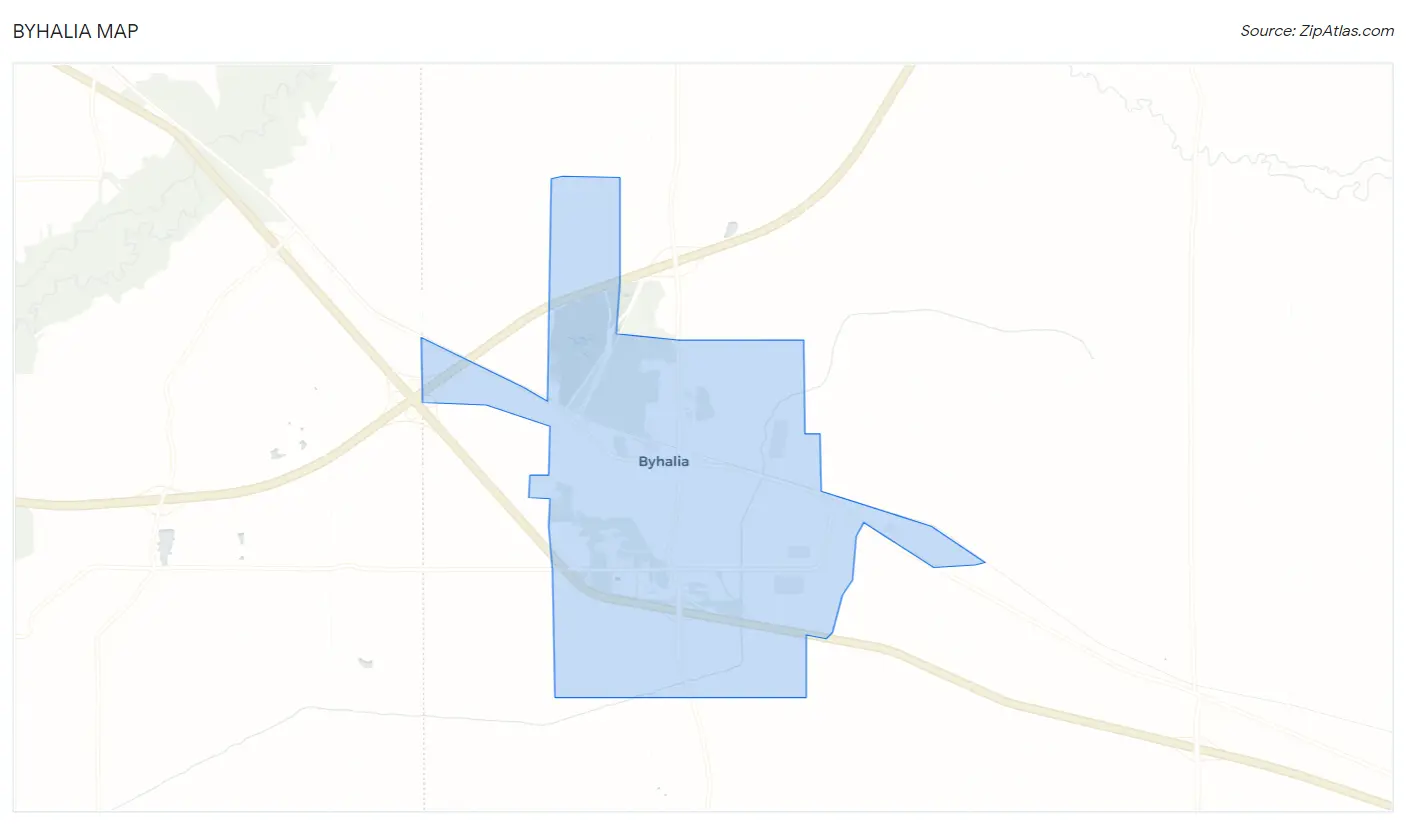
Byhalia Map
Byhalia Overview
$22,478
PER CAPITA INCOME
$39,125
AVG FAMILY INCOME
$38,614
AVG HOUSEHOLD INCOME
27.8%
WAGE / INCOME GAP [ % ]
72.2¢/ $1
WAGE / INCOME GAP [ $ ]
0.41
INEQUALITY / GINI INDEX
1,990
TOTAL POPULATION
933
MALE POPULATION
1,057
FEMALE POPULATION
88.27
MALES / 100 FEMALES
113.29
FEMALES / 100 MALES
40.8
MEDIAN AGE
2.7
AVG FAMILY SIZE
2.2
AVG HOUSEHOLD SIZE
809
LABOR FORCE [ PEOPLE ]
50.4%
PERCENT IN LABOR FORCE
4.8%
UNEMPLOYMENT RATE
Byhalia Zip Codes
Byhalia Area Codes
Income in Byhalia
Income Overview in Byhalia
Per Capita Income in Byhalia is $22,478, while median incomes of families and households are $39,125 and $38,614 respectively.
| Characteristic | Number | Measure |
| Per Capita Income | 1,990 | $22,478 |
| Median Family Income | 561 | $39,125 |
| Mean Family Income | 561 | $55,946 |
| Median Household Income | 848 | $38,614 |
| Mean Household Income | 848 | $49,916 |
| Income Deficit | 561 | $0 |
| Wage / Income Gap (%) | 1,990 | 27.78% |
| Wage / Income Gap ($) | 1,990 | 72.22¢ per $1 |
| Gini / Inequality Index | 1,990 | 0.41 |
Earnings by Sex in Byhalia
Average Earnings in Byhalia are $33,309, $39,826 for men and $28,763 for women, a difference of 27.8%.
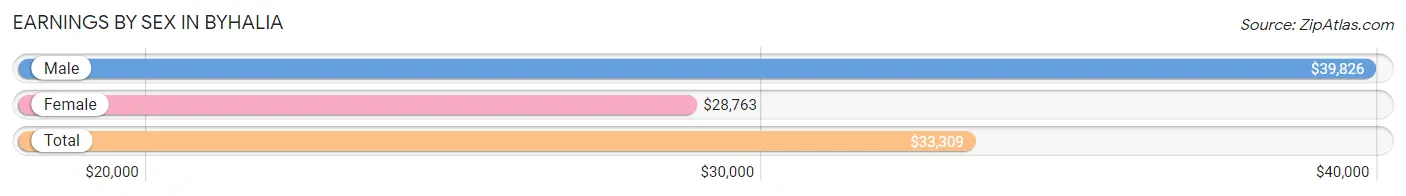
| Sex | Number | Average Earnings |
| Male | 551 (60.9%) | $39,826 |
| Female | 354 (39.1%) | $28,763 |
| Total | 905 (100.0%) | $33,309 |
Earnings by Sex by Income Bracket in Byhalia
The most common earnings brackets in Byhalia are $10,000 to $12,499 for men (98 | 17.8%) and $25,000 to $29,999 for women (108 | 30.5%).
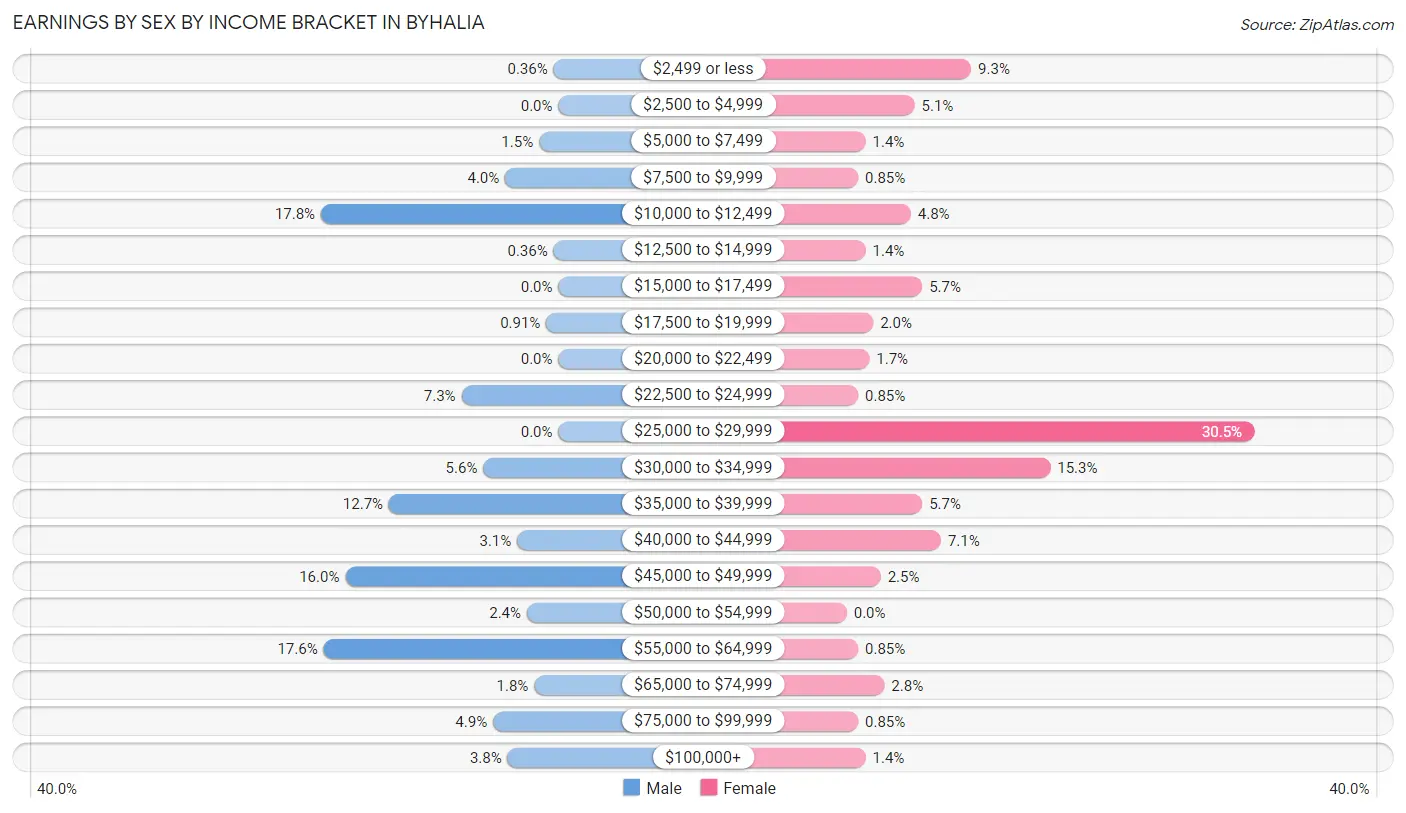
| Income | Male | Female |
| $2,499 or less | 2 (0.4%) | 33 (9.3%) |
| $2,500 to $4,999 | 0 (0.0%) | 18 (5.1%) |
| $5,000 to $7,499 | 8 (1.5%) | 5 (1.4%) |
| $7,500 to $9,999 | 22 (4.0%) | 3 (0.9%) |
| $10,000 to $12,499 | 98 (17.8%) | 17 (4.8%) |
| $12,500 to $14,999 | 2 (0.4%) | 5 (1.4%) |
| $15,000 to $17,499 | 0 (0.0%) | 20 (5.7%) |
| $17,500 to $19,999 | 5 (0.9%) | 7 (2.0%) |
| $20,000 to $22,499 | 0 (0.0%) | 6 (1.7%) |
| $22,500 to $24,999 | 40 (7.3%) | 3 (0.9%) |
| $25,000 to $29,999 | 0 (0.0%) | 108 (30.5%) |
| $30,000 to $34,999 | 31 (5.6%) | 54 (15.2%) |
| $35,000 to $39,999 | 70 (12.7%) | 20 (5.7%) |
| $40,000 to $44,999 | 17 (3.1%) | 25 (7.1%) |
| $45,000 to $49,999 | 88 (16.0%) | 9 (2.5%) |
| $50,000 to $54,999 | 13 (2.4%) | 0 (0.0%) |
| $55,000 to $64,999 | 97 (17.6%) | 3 (0.9%) |
| $65,000 to $74,999 | 10 (1.8%) | 10 (2.8%) |
| $75,000 to $99,999 | 27 (4.9%) | 3 (0.9%) |
| $100,000+ | 21 (3.8%) | 5 (1.4%) |
| Total | 551 (100.0%) | 354 (100.0%) |
Earnings by Sex by Educational Attainment in Byhalia
Average earnings in Byhalia are $46,313 for men and $28,879 for women, a difference of 37.6%. Men with an educational attainment of bachelor's degree enjoy the highest average annual earnings of $105,313, while those with college or associate's degree education earn the least with $36,667. Women with an educational attainment of bachelor's degree earn the most with the average annual earnings of $35,893, while those with less than high school education have the smallest earnings of $28,378.
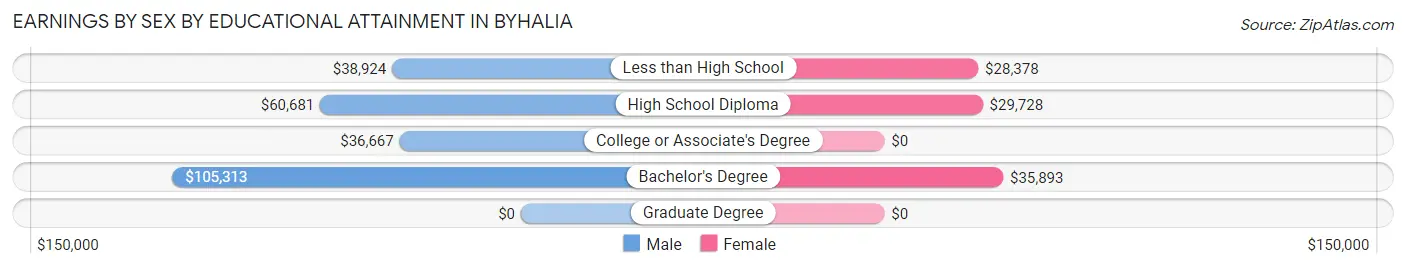
| Educational Attainment | Male Income | Female Income |
| Less than High School | $38,924 | $28,378 |
| High School Diploma | $60,681 | $29,728 |
| College or Associate's Degree | $36,667 | $0 |
| Bachelor's Degree | $105,313 | $35,893 |
| Graduate Degree | - | - |
| Total | $46,313 | $28,879 |
Family Income in Byhalia
Family Income Brackets in Byhalia
According to the Byhalia family income data, there are 148 families falling into the $35,000 to $49,999 income range, which is the most common income bracket and makes up 26.4% of all families. Conversely, the $10,000 to $14,999 income bracket is the least frequent group with only 5 families (0.9%) belonging to this category.
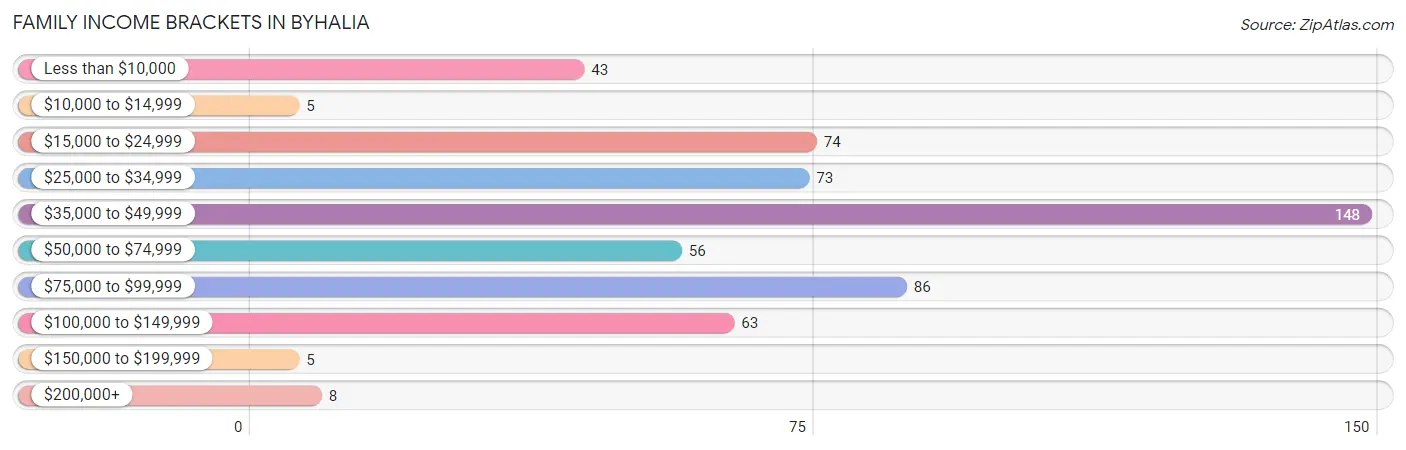
| Income Bracket | # Families | % Families |
| Less than $10,000 | 43 | 7.7% |
| $10,000 to $14,999 | 5 | 0.9% |
| $15,000 to $24,999 | 74 | 13.2% |
| $25,000 to $34,999 | 73 | 13.0% |
| $35,000 to $49,999 | 148 | 26.4% |
| $50,000 to $74,999 | 56 | 10.0% |
| $75,000 to $99,999 | 86 | 15.3% |
| $100,000 to $149,999 | 63 | 11.2% |
| $150,000 to $199,999 | 5 | 0.9% |
| $200,000+ | 8 | 1.4% |
Family Income by Famaliy Size in Byhalia
3-person families (102 | 18.2%) account for the highest median family income in Byhalia with $68,750 per family, while 3-person families (102 | 18.2%) have the highest median income of $22,917 per family member.
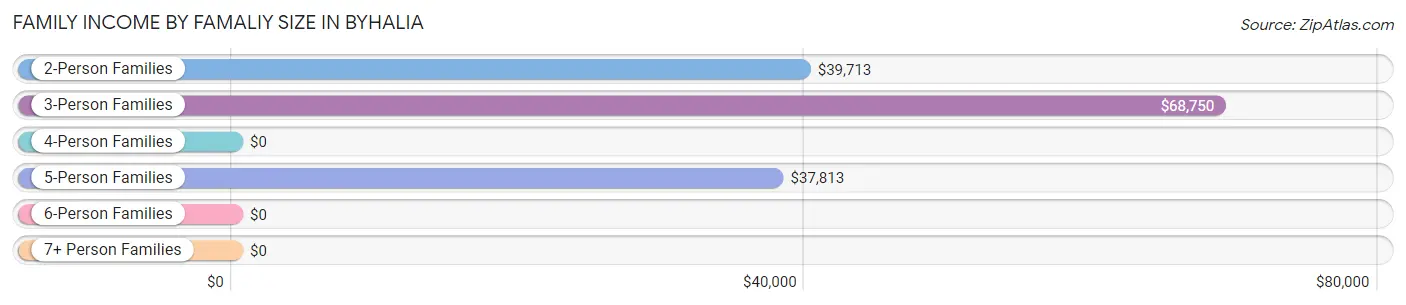
| Income Bracket | # Families | Median Income |
| 2-Person Families | 257 (45.8%) | $39,713 |
| 3-Person Families | 102 (18.2%) | $68,750 |
| 4-Person Families | 95 (16.9%) | $0 |
| 5-Person Families | 89 (15.9%) | $37,813 |
| 6-Person Families | 18 (3.2%) | $0 |
| 7+ Person Families | 0 (0.0%) | $0 |
| Total | 561 (100.0%) | $39,125 |
Family Income by Number of Earners in Byhalia
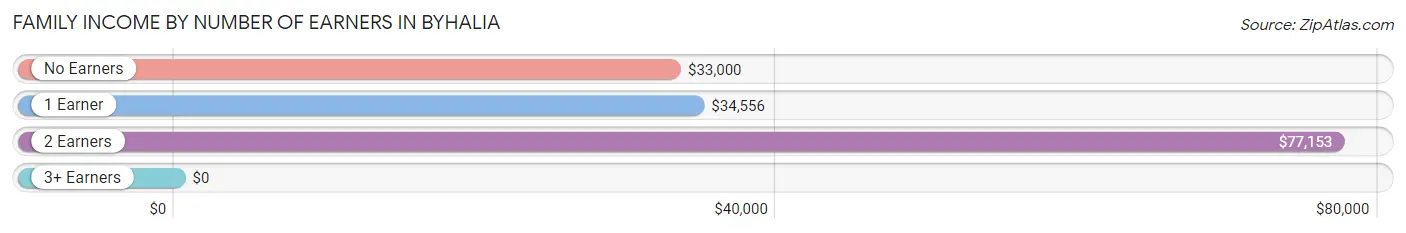
| Number of Earners | # Families | Median Income |
| No Earners | 92 (16.4%) | $33,000 |
| 1 Earner | 241 (43.0%) | $34,556 |
| 2 Earners | 227 (40.5%) | $77,153 |
| 3+ Earners | 1 (0.2%) | $0 |
| Total | 561 (100.0%) | $39,125 |
Household Income in Byhalia
Household Income Brackets in Byhalia
With 166 households falling in the category, the $35,000 to $49,999 income range is the most frequent in Byhalia, accounting for 19.6% of all households. In contrast, only 5 households (0.6%) fall into the $150,000 to $199,999 income bracket, making it the least populous group.
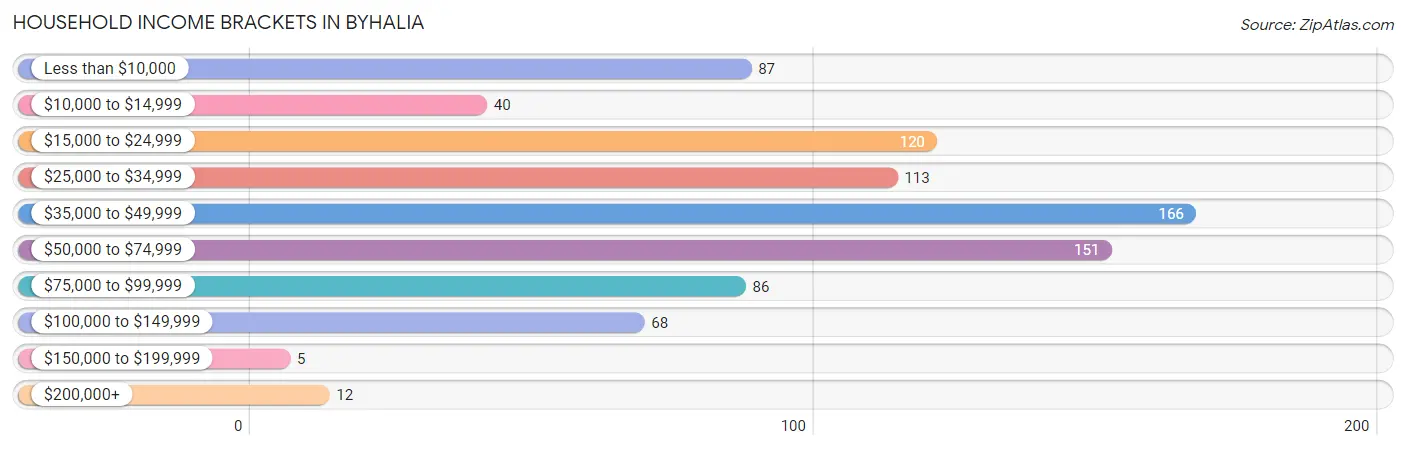
| Income Bracket | # Households | % Households |
| Less than $10,000 | 87 | 10.3% |
| $10,000 to $14,999 | 40 | 4.7% |
| $15,000 to $24,999 | 120 | 14.2% |
| $25,000 to $34,999 | 113 | 13.3% |
| $35,000 to $49,999 | 166 | 19.6% |
| $50,000 to $74,999 | 151 | 17.8% |
| $75,000 to $99,999 | 86 | 10.1% |
| $100,000 to $149,999 | 68 | 8.0% |
| $150,000 to $199,999 | 5 | 0.6% |
| $200,000+ | 12 | 1.4% |
Household Income by Householder Age in Byhalia
The median household income in Byhalia is $38,614, with the highest median household income of $60,340 found in the 25 to 44 years age bracket for the primary householder. A total of 273 households (32.2%) fall into this category.
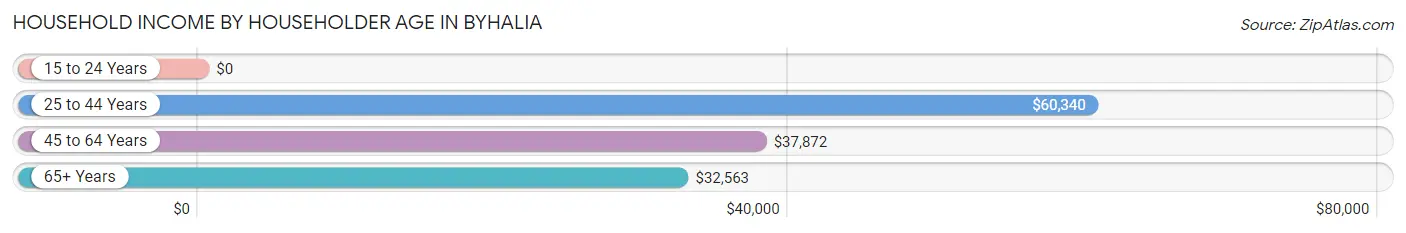
| Income Bracket | # Households | Median Income |
| 15 to 24 Years | 0 (0.0%) | $0 |
| 25 to 44 Years | 273 (32.2%) | $60,340 |
| 45 to 64 Years | 318 (37.5%) | $37,872 |
| 65+ Years | 257 (30.3%) | $32,563 |
| Total | 848 (100.0%) | $38,614 |
Poverty in Byhalia
Income Below Poverty by Sex and Age in Byhalia
With 17.0% poverty level for males and 34.6% for females among the residents of Byhalia, 16 and 17 year old males and 5 year old females are the most vulnerable to poverty, with 29 males (76.3%) and 13 females (100.0%) in their respective age groups living below the poverty level.
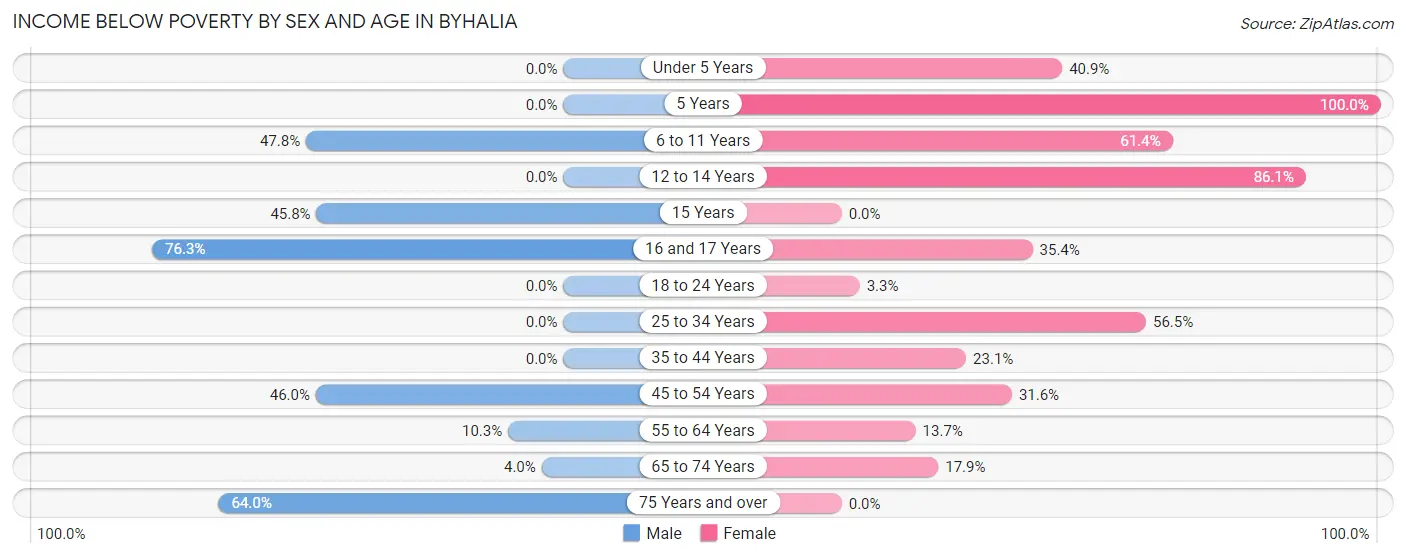
| Age Bracket | Male | Female |
| Under 5 Years | 0 (0.0%) | 27 (40.9%) |
| 5 Years | 0 (0.0%) | 13 (100.0%) |
| 6 to 11 Years | 32 (47.8%) | 62 (61.4%) |
| 12 to 14 Years | 0 (0.0%) | 62 (86.1%) |
| 15 Years | 11 (45.8%) | 0 (0.0%) |
| 16 and 17 Years | 29 (76.3%) | 17 (35.4%) |
| 18 to 24 Years | 0 (0.0%) | 1 (3.3%) |
| 25 to 34 Years | 0 (0.0%) | 61 (56.5%) |
| 35 to 44 Years | 0 (0.0%) | 18 (23.1%) |
| 45 to 54 Years | 51 (46.0%) | 24 (31.6%) |
| 55 to 64 Years | 8 (10.3%) | 27 (13.7%) |
| 65 to 74 Years | 6 (4.0%) | 24 (17.9%) |
| 75 Years and over | 16 (64.0%) | 0 (0.0%) |
| Total | 153 (17.0%) | 336 (34.6%) |
Income Above Poverty by Sex and Age in Byhalia
According to the poverty statistics in Byhalia, males aged under 5 years and females aged 15 years are the age groups that are most secure financially, with 100.0% of males and 100.0% of females in these age groups living above the poverty line.
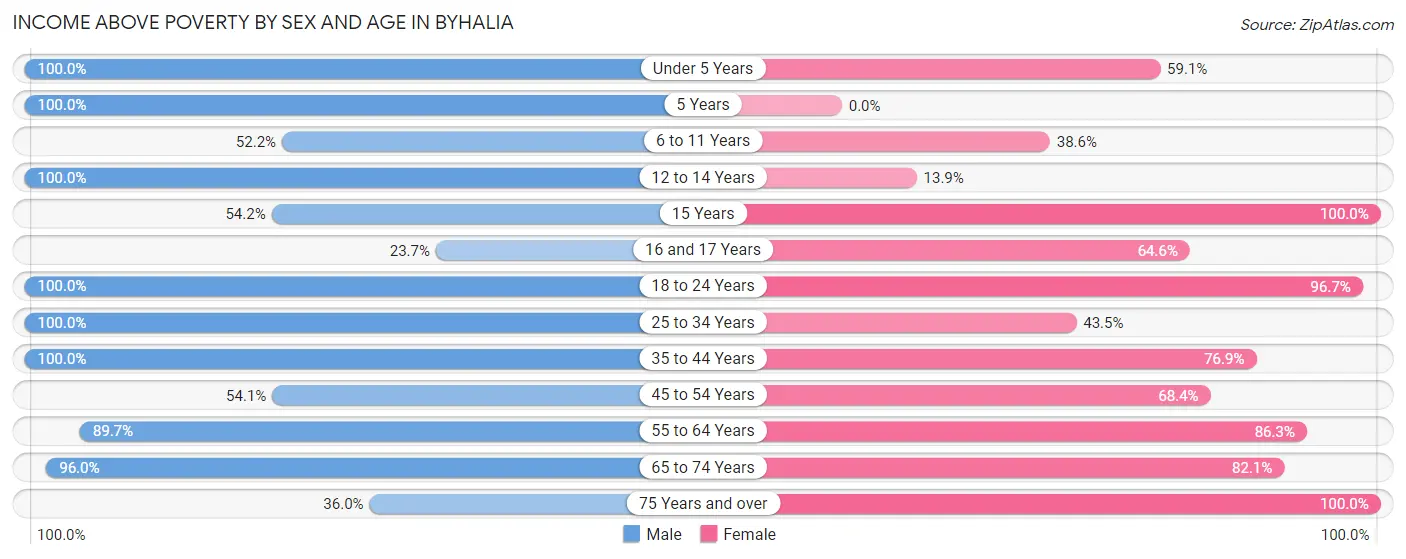
| Age Bracket | Male | Female |
| Under 5 Years | 15 (100.0%) | 39 (59.1%) |
| 5 Years | 4 (100.0%) | 0 (0.0%) |
| 6 to 11 Years | 35 (52.2%) | 39 (38.6%) |
| 12 to 14 Years | 13 (100.0%) | 10 (13.9%) |
| 15 Years | 13 (54.2%) | 10 (100.0%) |
| 16 and 17 Years | 9 (23.7%) | 31 (64.6%) |
| 18 to 24 Years | 115 (100.0%) | 29 (96.7%) |
| 25 to 34 Years | 140 (100.0%) | 47 (43.5%) |
| 35 to 44 Years | 119 (100.0%) | 60 (76.9%) |
| 45 to 54 Years | 60 (54.0%) | 52 (68.4%) |
| 55 to 64 Years | 70 (89.7%) | 170 (86.3%) |
| 65 to 74 Years | 143 (96.0%) | 110 (82.1%) |
| 75 Years and over | 9 (36.0%) | 38 (100.0%) |
| Total | 745 (83.0%) | 635 (65.4%) |
Income Below Poverty Among Married-Couple Families in Byhalia
The poverty statistics for married-couple families in Byhalia show that 15.0% or 46 of the total 307 families live below the poverty line. Families with 3 or 4 children have the highest poverty rate of 46.5%, comprising of 40 families. On the other hand, families with 1 or 2 children have the lowest poverty rate of 0.0%, which includes 0 families.
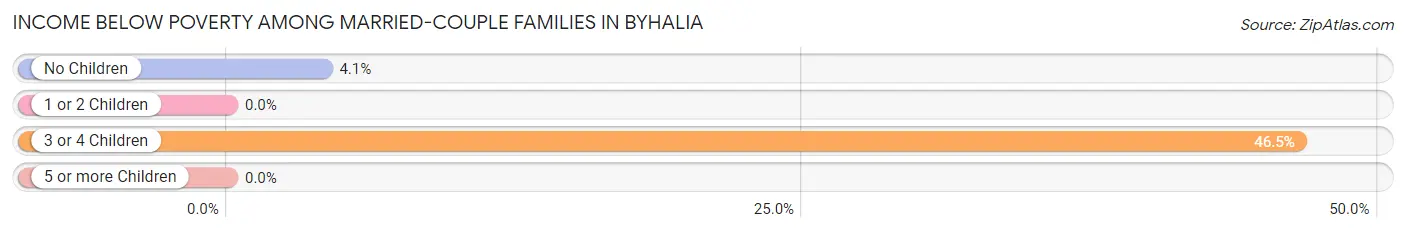
| Children | Above Poverty | Below Poverty |
| No Children | 140 (95.9%) | 6 (4.1%) |
| 1 or 2 Children | 75 (100.0%) | 0 (0.0%) |
| 3 or 4 Children | 46 (53.5%) | 40 (46.5%) |
| 5 or more Children | 0 (0.0%) | 0 (0.0%) |
| Total | 261 (85.0%) | 46 (15.0%) |
Income Below Poverty Among Single-Parent Households in Byhalia
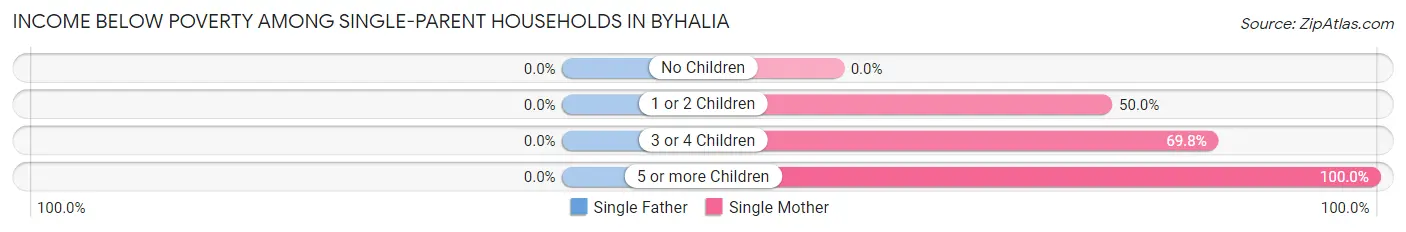
| Children | Single Father | Single Mother |
| No Children | 0 (0.0%) | 0 (0.0%) |
| 1 or 2 Children | 0 (0.0%) | 10 (50.0%) |
| 3 or 4 Children | 0 (0.0%) | 37 (69.8%) |
| 5 or more Children | 0 (0.0%) | 13 (100.0%) |
| Total | 0 (0.0%) | 60 (31.9%) |
Income Below Poverty Among Married-Couple vs Single-Parent Households in Byhalia
The poverty data for Byhalia shows that 46 of the married-couple family households (15.0%) and 60 of the single-parent households (23.6%) are living below the poverty level. Within the married-couple family households, those with 3 or 4 children have the highest poverty rate, with 40 households (46.5%) falling below the poverty line. Among the single-parent households, those with 5 or more children have the highest poverty rate, with 13 household (100.0%) living below poverty.
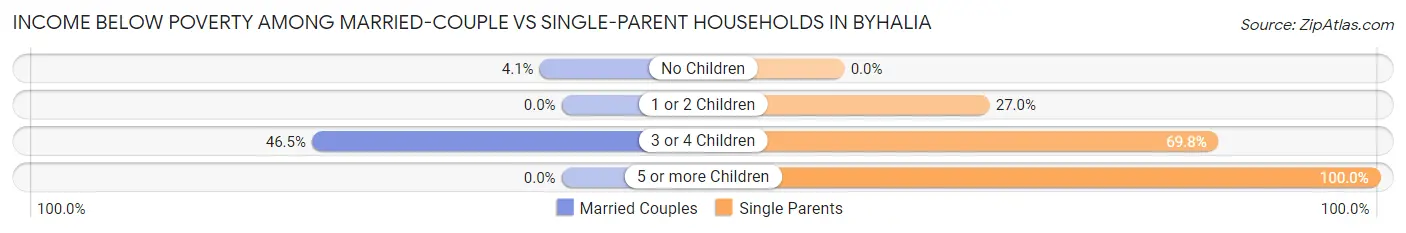
| Children | Married-Couple Families | Single-Parent Households |
| No Children | 6 (4.1%) | 0 (0.0%) |
| 1 or 2 Children | 0 (0.0%) | 10 (27.0%) |
| 3 or 4 Children | 40 (46.5%) | 37 (69.8%) |
| 5 or more Children | 0 (0.0%) | 13 (100.0%) |
| Total | 46 (15.0%) | 60 (23.6%) |
Race in Byhalia
The most populous races in Byhalia are Black / African American (805 | 40.5%), White / Caucasian (782 | 39.3%), and Hispanic or Latino (439 | 22.1%).
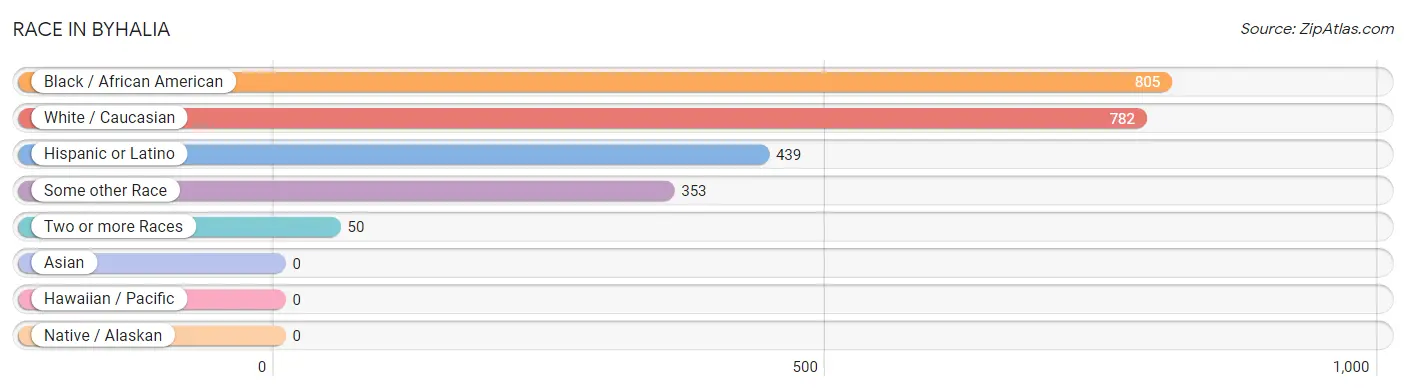
| Race | # Population | % Population |
| Asian | 0 | 0.0% |
| Black / African American | 805 | 40.5% |
| Hawaiian / Pacific | 0 | 0.0% |
| Hispanic or Latino | 439 | 22.1% |
| Native / Alaskan | 0 | 0.0% |
| White / Caucasian | 782 | 39.3% |
| Two or more Races | 50 | 2.5% |
| Some other Race | 353 | 17.7% |
| Total | 1,990 | 100.0% |
Ancestry in Byhalia
The most populous ancestries reported in Byhalia are Mexican (389 | 19.6%), Irish (103 | 5.2%), English (96 | 4.8%), American (73 | 3.7%), and German (49 | 2.5%), together accounting for 35.7% of all Byhalia residents.
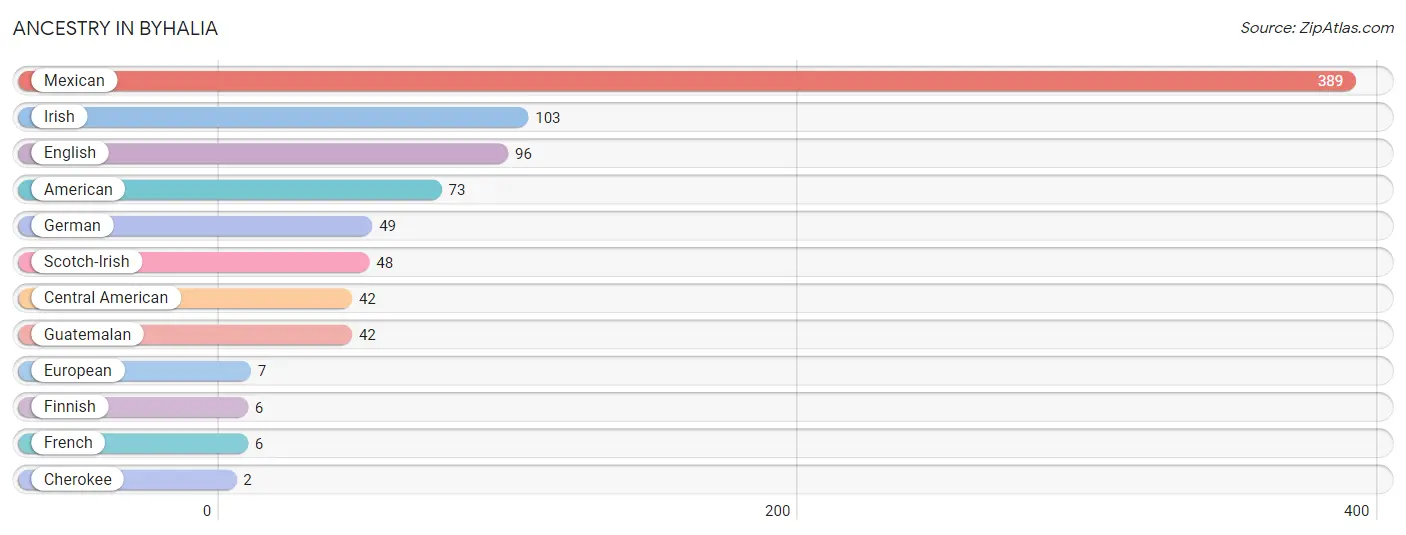
| Ancestry | # Population | % Population |
| American | 73 | 3.7% |
| Central American | 42 | 2.1% |
| Cherokee | 2 | 0.1% |
| English | 96 | 4.8% |
| European | 7 | 0.4% |
| Finnish | 6 | 0.3% |
| French | 6 | 0.3% |
| German | 49 | 2.5% |
| Guatemalan | 42 | 2.1% |
| Irish | 103 | 5.2% |
| Mexican | 389 | 19.6% |
| Scotch-Irish | 48 | 2.4% | View All 12 Rows |
Immigrants in Byhalia
The most numerous immigrant groups reported in Byhalia came from Central America (189 | 9.5%), Latin America (189 | 9.5%), and Mexico (189 | 9.5%), together accounting for 28.5% of all Byhalia residents.
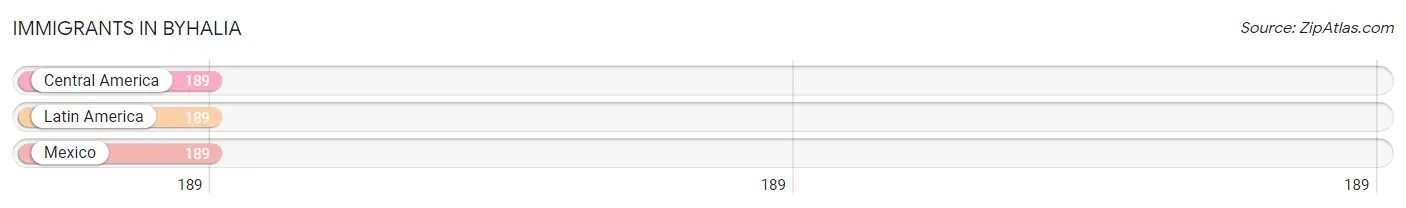
| Immigration Origin | # Population | % Population |
| Central America | 189 | 9.5% |
| Latin America | 189 | 9.5% |
| Mexico | 189 | 9.5% | View All 3 Rows |
Sex and Age in Byhalia
Sex and Age in Byhalia
The most populous age groups in Byhalia are 20 to 24 Years (115 | 12.3%) for men and 60 to 64 Years (163 | 15.4%) for women.
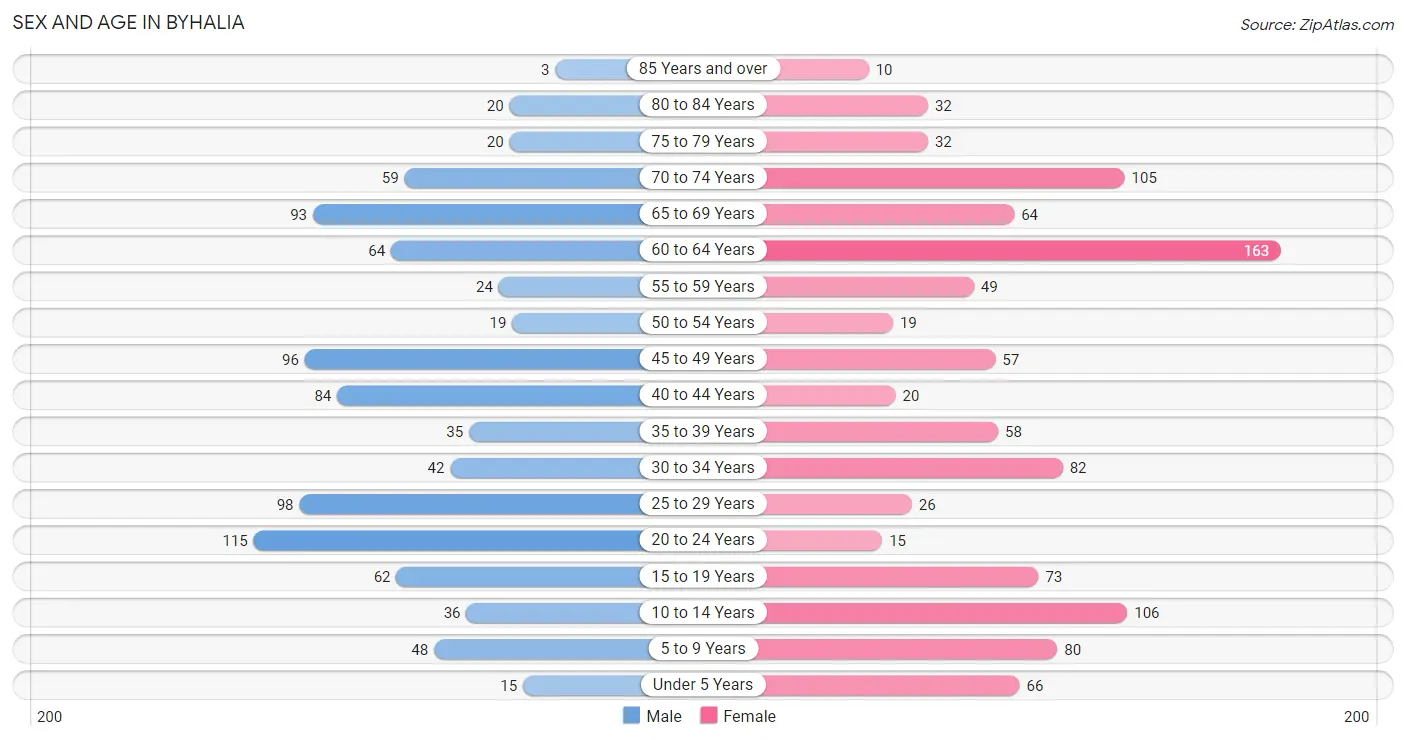
| Age Bracket | Male | Female |
| Under 5 Years | 15 (1.6%) | 66 (6.2%) |
| 5 to 9 Years | 48 (5.1%) | 80 (7.6%) |
| 10 to 14 Years | 36 (3.9%) | 106 (10.0%) |
| 15 to 19 Years | 62 (6.7%) | 73 (6.9%) |
| 20 to 24 Years | 115 (12.3%) | 15 (1.4%) |
| 25 to 29 Years | 98 (10.5%) | 26 (2.5%) |
| 30 to 34 Years | 42 (4.5%) | 82 (7.8%) |
| 35 to 39 Years | 35 (3.7%) | 58 (5.5%) |
| 40 to 44 Years | 84 (9.0%) | 20 (1.9%) |
| 45 to 49 Years | 96 (10.3%) | 57 (5.4%) |
| 50 to 54 Years | 19 (2.0%) | 19 (1.8%) |
| 55 to 59 Years | 24 (2.6%) | 49 (4.6%) |
| 60 to 64 Years | 64 (6.9%) | 163 (15.4%) |
| 65 to 69 Years | 93 (10.0%) | 64 (6.0%) |
| 70 to 74 Years | 59 (6.3%) | 105 (9.9%) |
| 75 to 79 Years | 20 (2.1%) | 32 (3.0%) |
| 80 to 84 Years | 20 (2.1%) | 32 (3.0%) |
| 85 Years and over | 3 (0.3%) | 10 (0.9%) |
| Total | 933 (100.0%) | 1,057 (100.0%) |
Families and Households in Byhalia
Median Family Size in Byhalia
The median family size in Byhalia is 2.74 persons per family, with single female/mother families (188 | 33.5%) accounting for the largest median family size of 3.09 persons per family. On the other hand, single male/father families (66 | 11.8%) represent the smallest median family size with 1.86 persons per family.
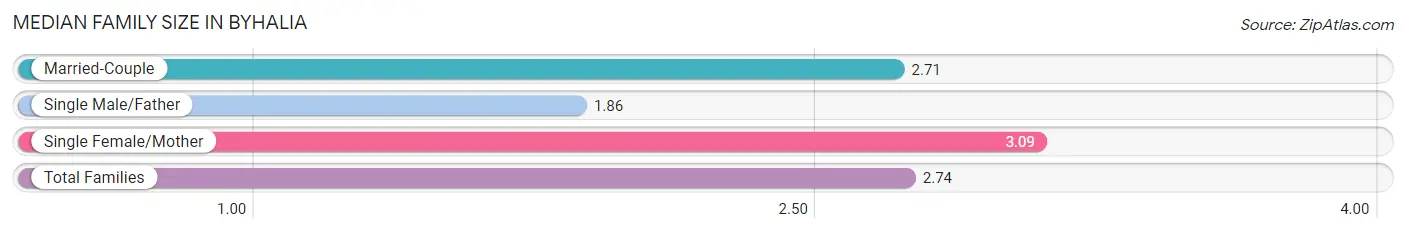
| Family Type | # Families | Family Size |
| Married-Couple | 307 (54.7%) | 2.71 |
| Single Male/Father | 66 (11.8%) | 1.86 |
| Single Female/Mother | 188 (33.5%) | 3.09 |
| Total Families | 561 (100.0%) | 2.74 |
Median Household Size in Byhalia
The median household size in Byhalia is 2.20 persons per household, with single female/mother households (188 | 22.2%) accounting for the largest median household size of 3.22 persons per household. non-family households (287 | 33.8%) represent the smallest median household size with 1.07 persons per household.
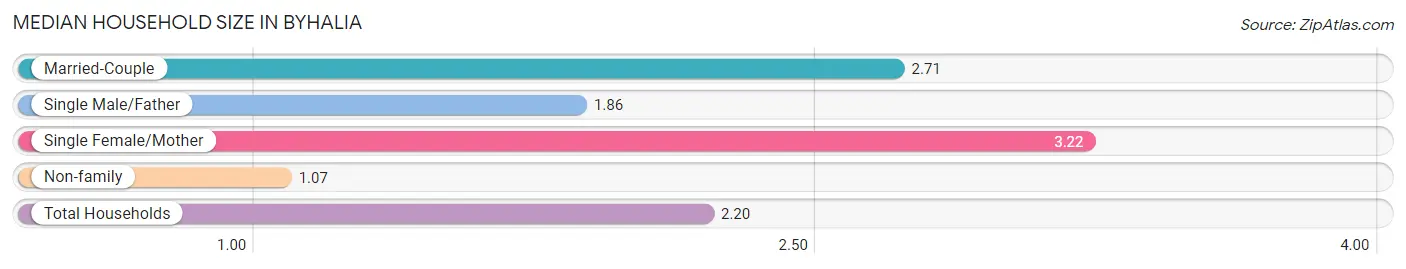
| Household Type | # Households | Household Size |
| Married-Couple | 307 (36.2%) | 2.71 |
| Single Male/Father | 66 (7.8%) | 1.86 |
| Single Female/Mother | 188 (22.2%) | 3.22 |
| Non-family | 287 (33.8%) | 1.07 |
| Total Households | 848 (100.0%) | 2.20 |
Household Size by Marriage Status in Byhalia
Out of a total of 848 households in Byhalia, 561 (66.2%) are family households, while 287 (33.8%) are nonfamily households. The most numerous type of family households are 2-person households, comprising 257, and the most common type of nonfamily households are 1-person households, comprising 270.
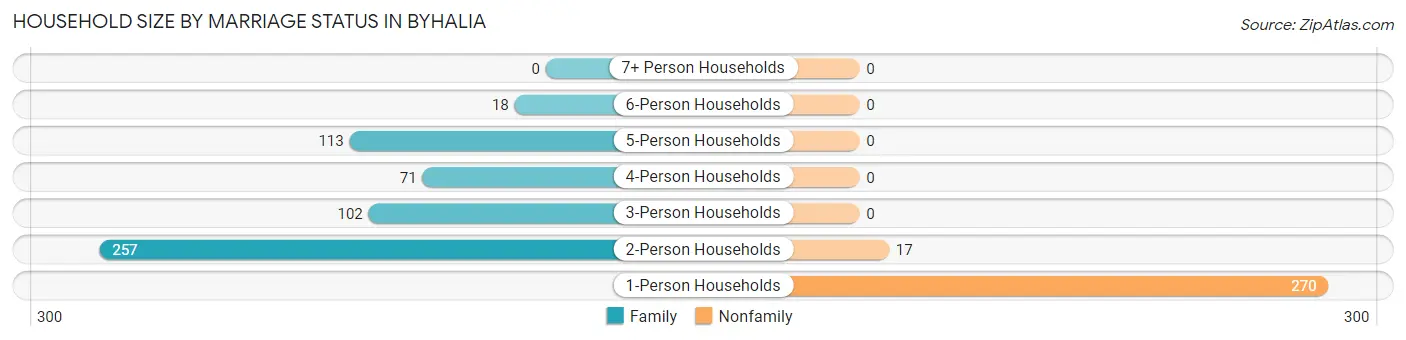
| Household Size | Family Households | Nonfamily Households |
| 1-Person Households | - | 270 (31.8%) |
| 2-Person Households | 257 (30.3%) | 17 (2.0%) |
| 3-Person Households | 102 (12.0%) | 0 (0.0%) |
| 4-Person Households | 71 (8.4%) | 0 (0.0%) |
| 5-Person Households | 113 (13.3%) | 0 (0.0%) |
| 6-Person Households | 18 (2.1%) | 0 (0.0%) |
| 7+ Person Households | 0 (0.0%) | 0 (0.0%) |
| Total | 561 (66.2%) | 287 (33.8%) |
Female Fertility in Byhalia
Fertility by Age in Byhalia
| Age Bracket | Women with Births | Births / 1,000 Women |
| 15 to 19 years | 0 (0.0%) | 0.0 |
| 20 to 34 years | 0 (0.0%) | 0.0 |
| 35 to 50 years | 0 (0.0%) | 0.0 |
| Total | 0 (0.0%) | 0.0 |
Fertility by Age by Marriage Status in Byhalia
| Age Bracket | Married | Unmarried |
| 15 to 19 years | 0 (0.0%) | 0 (0.0%) |
| 20 to 34 years | 0 (0.0%) | 0 (0.0%) |
| 35 to 50 years | 0 (0.0%) | 0 (0.0%) |
| Total | 0 (0.0%) | 0 (0.0%) |
Fertility by Education in Byhalia
| Educational Attainment | Women with Births | Births / 1,000 Women |
| Less than High School | 0 (0.0%) | 0.0 |
| High School Diploma | 0 (0.0%) | 0.0 |
| College or Associate's Degree | 0 (0.0%) | 0.0 |
| Bachelor's Degree | 0 (0.0%) | 0.0 |
| Graduate Degree | 0 (0.0%) | 0.0 |
| Total | 0 (0.0%) | 0.0 |
Fertility by Education by Marriage Status in Byhalia
| Educational Attainment | Married | Unmarried |
| Less than High School | 0 (0.0%) | 0 (0.0%) |
| High School Diploma | 0 (0.0%) | 0 (0.0%) |
| College or Associate's Degree | 0 (0.0%) | 0 (0.0%) |
| Bachelor's Degree | 0 (0.0%) | 0 (0.0%) |
| Graduate Degree | 0 (0.0%) | 0 (0.0%) |
| Total | 0 (0.0%) | 0 (0.0%) |
Employment Characteristics in Byhalia
Employment by Class of Employer in Byhalia
Among the 767 employed individuals in Byhalia, private company employees (598 | 78.0%), not-for-profit organizations (106 | 13.8%), and self-employed (incorporated) (26 | 3.4%) make up the most common classes of employment.
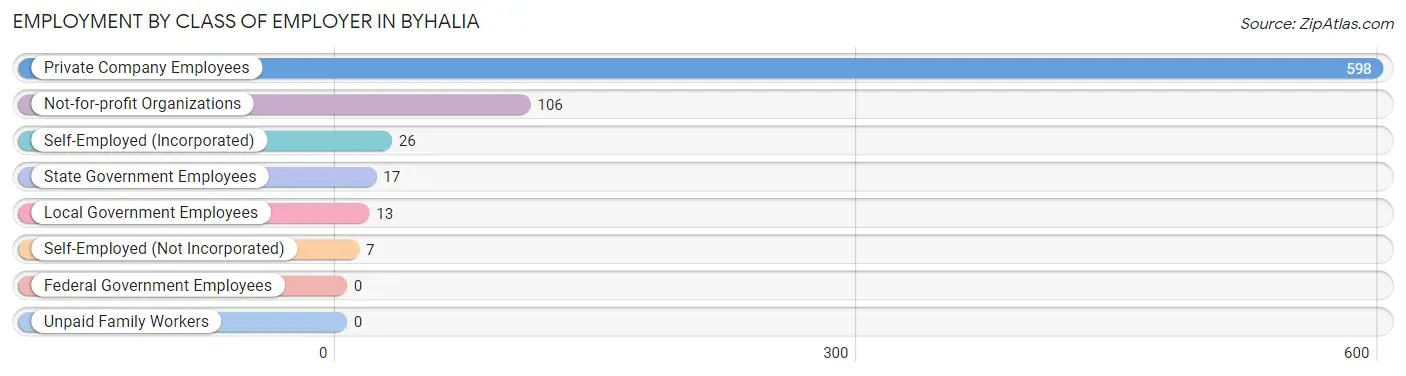
| Employer Class | # Employees | % Employees |
| Private Company Employees | 598 | 78.0% |
| Self-Employed (Incorporated) | 26 | 3.4% |
| Self-Employed (Not Incorporated) | 7 | 0.9% |
| Not-for-profit Organizations | 106 | 13.8% |
| Local Government Employees | 13 | 1.7% |
| State Government Employees | 17 | 2.2% |
| Federal Government Employees | 0 | 0.0% |
| Unpaid Family Workers | 0 | 0.0% |
| Total | 767 | 100.0% |
Employment Status by Age in Byhalia
According to the labor force statistics for Byhalia, out of the total population over 16 years of age (1,605), 50.4% or 809 individuals are in the labor force, with 4.8% or 39 of them unemployed. The age group with the highest labor force participation rate is 25 to 29 years, with 92.7% or 115 individuals in the labor force. Within the labor force, the 30 to 34 years age range has the highest percentage of unemployed individuals, with 19.4% or 13 of them being unemployed.
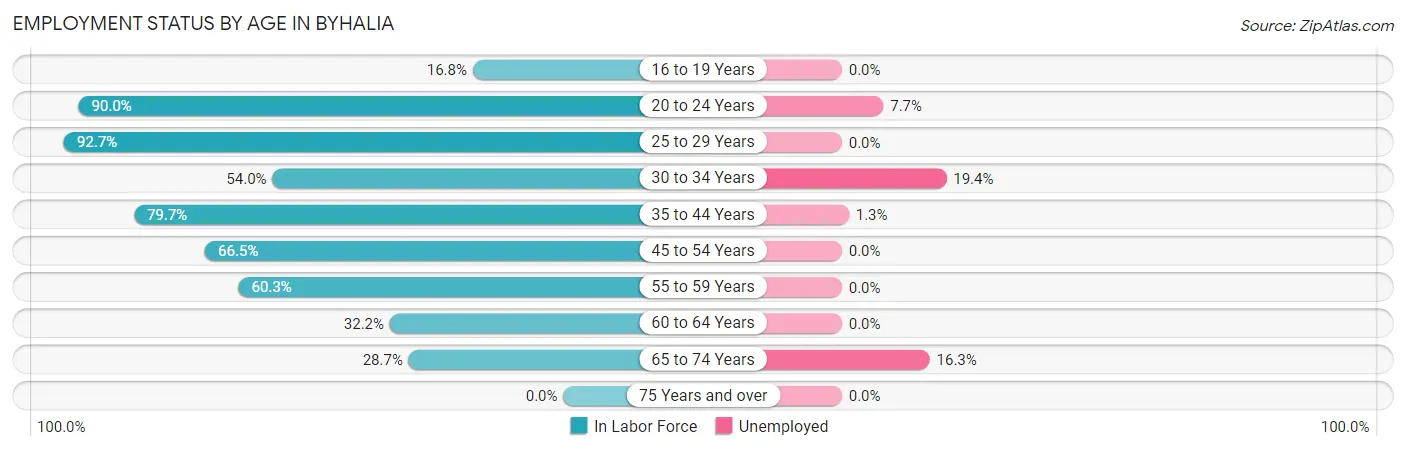
| Age Bracket | In Labor Force | Unemployed |
| 16 to 19 Years | 17 (16.8%) | 0 (0.0%) |
| 20 to 24 Years | 117 (90.0%) | 9 (7.7%) |
| 25 to 29 Years | 115 (92.7%) | 0 (0.0%) |
| 30 to 34 Years | 67 (54.0%) | 13 (19.4%) |
| 35 to 44 Years | 157 (79.7%) | 2 (1.3%) |
| 45 to 54 Years | 127 (66.5%) | 0 (0.0%) |
| 55 to 59 Years | 44 (60.3%) | 0 (0.0%) |
| 60 to 64 Years | 73 (32.2%) | 0 (0.0%) |
| 65 to 74 Years | 92 (28.7%) | 15 (16.3%) |
| 75 Years and over | 0 (0.0%) | 0 (0.0%) |
| Total | 809 (50.4%) | 39 (4.8%) |
Employment Status by Educational Attainment in Byhalia
According to labor force statistics for Byhalia, 62.3% of individuals (583) out of the total population between 25 and 64 years of age (936) are in the labor force, with 2.6% or 15 of them being unemployed. The group with the highest labor force participation rate are those with the educational attainment of high school diploma, with 74.7% or 219 individuals in the labor force. Within the labor force, individuals with less than high school education have the highest percentage of unemployment, with 7.6% or 13 of them being unemployed.
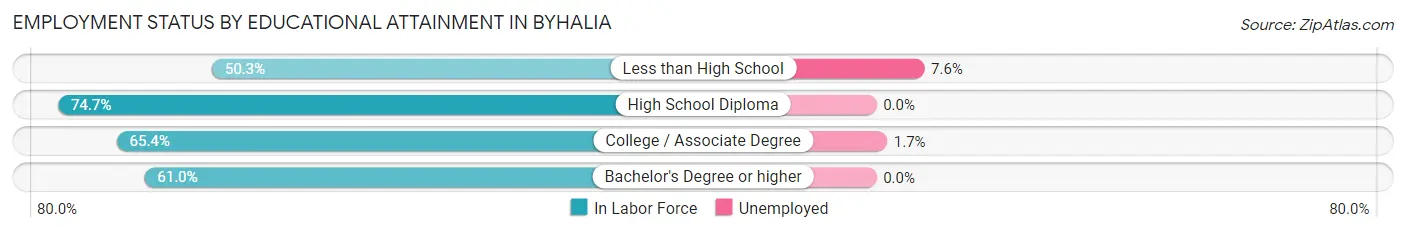
| Educational Attainment | In Labor Force | Unemployed |
| Less than High School | 171 (50.3%) | 26 (7.6%) |
| High School Diploma | 219 (74.7%) | 0 (0.0%) |
| College / Associate Degree | 121 (65.4%) | 3 (1.7%) |
| Bachelor's Degree or higher | 72 (61.0%) | 0 (0.0%) |
| Total | 583 (62.3%) | 24 (2.6%) |
Employment Occupations by Sex in Byhalia
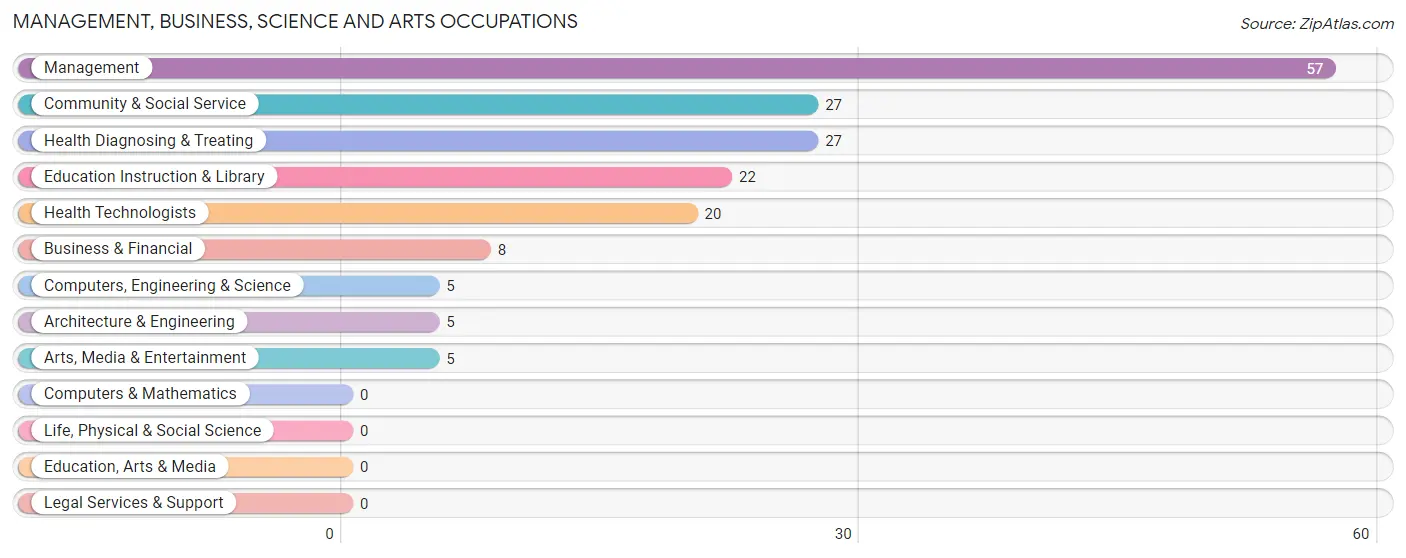
Management, Business, Science and Arts Occupations
The most common Management, Business, Science and Arts occupations in Byhalia are Management (57 | 7.4%), Community & Social Service (27 | 3.5%), Health Diagnosing & Treating (27 | 3.5%), Education Instruction & Library (22 | 2.9%), and Health Technologists (20 | 2.6%).
Management, Business, Science and Arts Occupations by Sex
Within the Management, Business, Science and Arts occupations in Byhalia, the most male-oriented occupations are Arts, Media & Entertainment (100.0%), Community & Social Service (48.1%), and Education Instruction & Library (36.4%), while the most female-oriented occupations are Computers, Engineering & Science (100.0%), Architecture & Engineering (100.0%), and Health Technologists (100.0%).
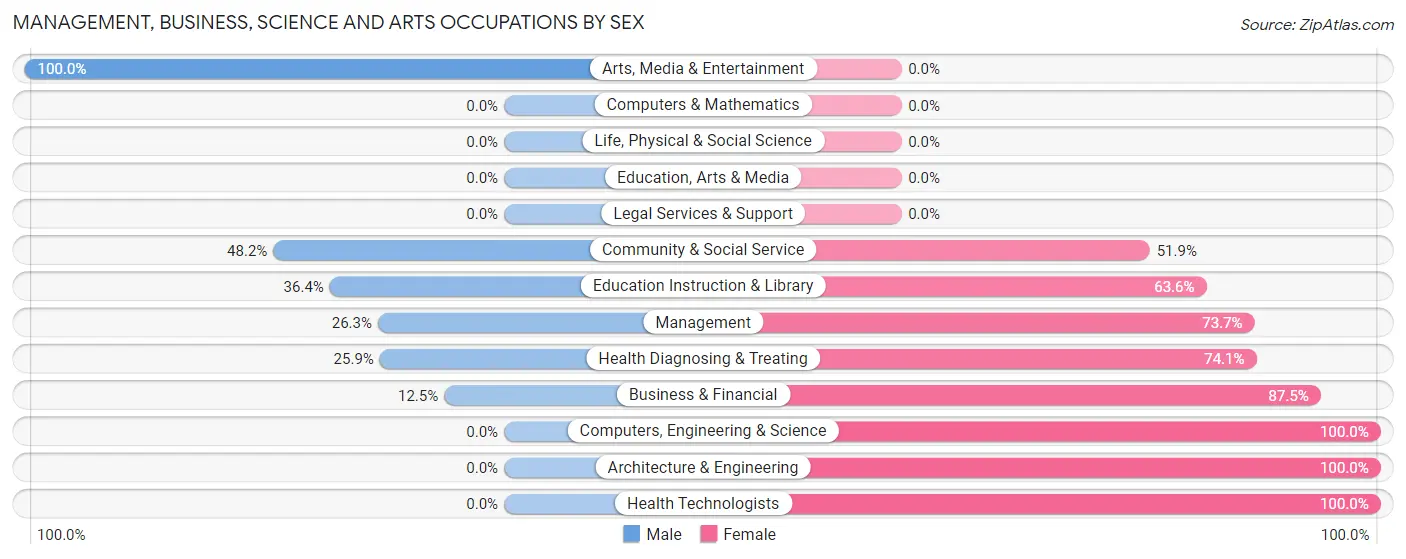
| Occupation | Male | Female |
| Management | 15 (26.3%) | 42 (73.7%) |
| Business & Financial | 1 (12.5%) | 7 (87.5%) |
| Computers, Engineering & Science | 0 (0.0%) | 5 (100.0%) |
| Computers & Mathematics | 0 (0.0%) | 0 (0.0%) |
| Architecture & Engineering | 0 (0.0%) | 5 (100.0%) |
| Life, Physical & Social Science | 0 (0.0%) | 0 (0.0%) |
| Community & Social Service | 13 (48.1%) | 14 (51.8%) |
| Education, Arts & Media | 0 (0.0%) | 0 (0.0%) |
| Legal Services & Support | 0 (0.0%) | 0 (0.0%) |
| Education Instruction & Library | 8 (36.4%) | 14 (63.6%) |
| Arts, Media & Entertainment | 5 (100.0%) | 0 (0.0%) |
| Health Diagnosing & Treating | 7 (25.9%) | 20 (74.1%) |
| Health Technologists | 0 (0.0%) | 20 (100.0%) |
| Total (Category) | 36 (29.0%) | 88 (71.0%) |
| Total (Overall) | 536 (69.6%) | 234 (30.4%) |
Services Occupations
The most common Services occupations in Byhalia are Cleaning & Maintenance (49 | 6.4%), Food Preparation & Serving (19 | 2.5%), Personal Care & Service (5 | 0.6%), Security & Protection (3 | 0.4%), and Law Enforcement (3 | 0.4%).
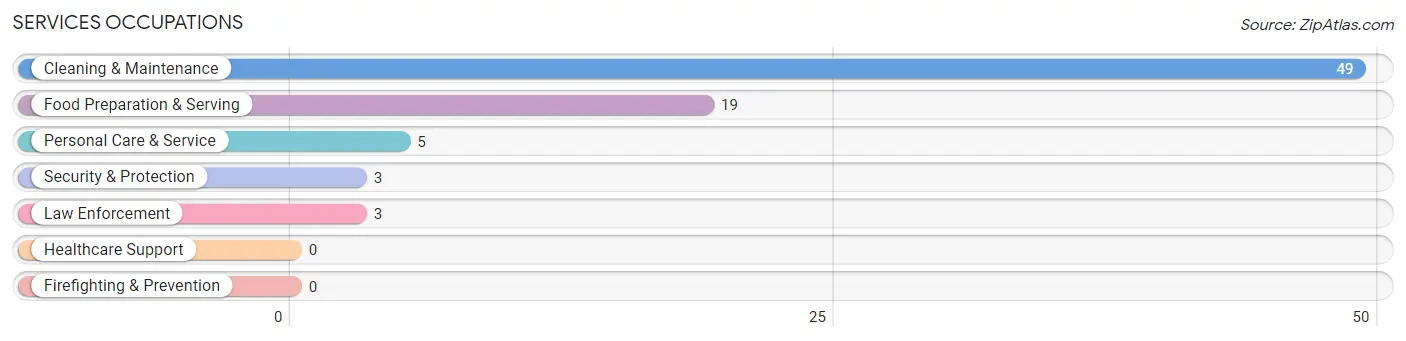
Services Occupations by Sex
Within the Services occupations in Byhalia, the most male-oriented occupations are Security & Protection (100.0%), Law Enforcement (100.0%), and Cleaning & Maintenance (100.0%), while the most female-oriented occupations are Food Preparation & Serving (100.0%), and Personal Care & Service (100.0%).
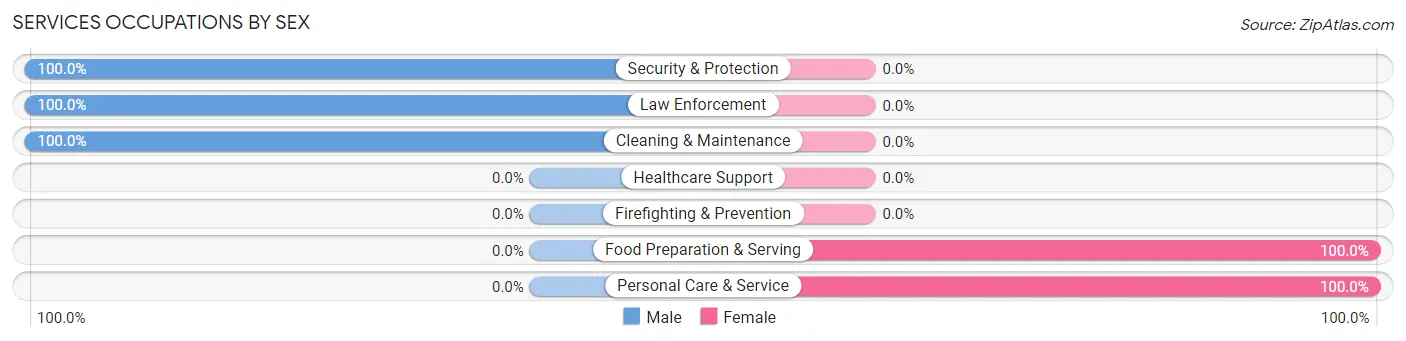
| Occupation | Male | Female |
| Healthcare Support | 0 (0.0%) | 0 (0.0%) |
| Security & Protection | 3 (100.0%) | 0 (0.0%) |
| Firefighting & Prevention | 0 (0.0%) | 0 (0.0%) |
| Law Enforcement | 3 (100.0%) | 0 (0.0%) |
| Food Preparation & Serving | 0 (0.0%) | 19 (100.0%) |
| Cleaning & Maintenance | 49 (100.0%) | 0 (0.0%) |
| Personal Care & Service | 0 (0.0%) | 5 (100.0%) |
| Total (Category) | 52 (68.4%) | 24 (31.6%) |
| Total (Overall) | 536 (69.6%) | 234 (30.4%) |
Sales and Office Occupations
The most common Sales and Office occupations in Byhalia are Office & Administration (59 | 7.7%), and Sales & Related (50 | 6.5%).
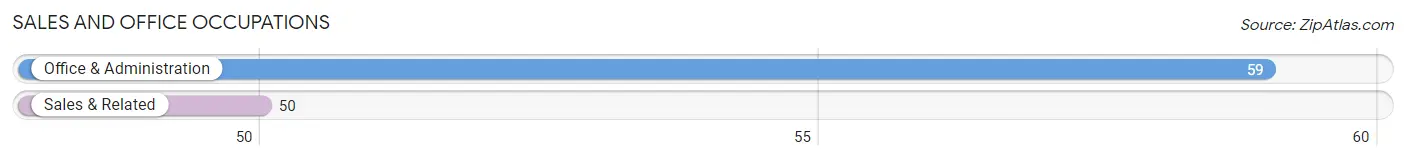
Sales and Office Occupations by Sex
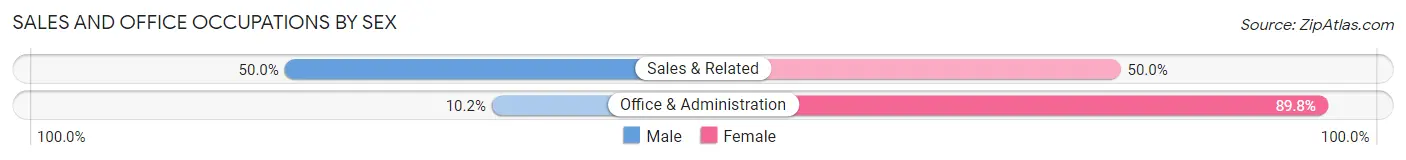
| Occupation | Male | Female |
| Sales & Related | 25 (50.0%) | 25 (50.0%) |
| Office & Administration | 6 (10.2%) | 53 (89.8%) |
| Total (Category) | 31 (28.4%) | 78 (71.6%) |
| Total (Overall) | 536 (69.6%) | 234 (30.4%) |
Natural Resources, Construction and Maintenance Occupations
The most common Natural Resources, Construction and Maintenance occupations in Byhalia are Installation, Maintenance & Repair (88 | 11.4%), and Construction & Extraction (73 | 9.5%).
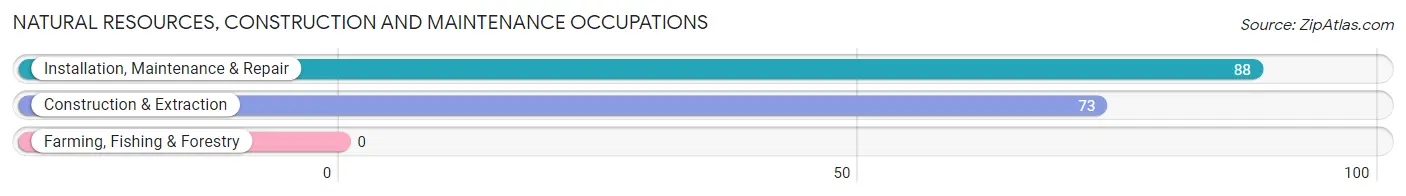
Natural Resources, Construction and Maintenance Occupations by Sex

| Occupation | Male | Female |
| Farming, Fishing & Forestry | 0 (0.0%) | 0 (0.0%) |
| Construction & Extraction | 73 (100.0%) | 0 (0.0%) |
| Installation, Maintenance & Repair | 88 (100.0%) | 0 (0.0%) |
| Total (Category) | 161 (100.0%) | 0 (0.0%) |
| Total (Overall) | 536 (69.6%) | 234 (30.4%) |
Production, Transportation and Moving Occupations
The most common Production, Transportation and Moving occupations in Byhalia are Material Moving (143 | 18.6%), Transportation (114 | 14.8%), and Production (43 | 5.6%).
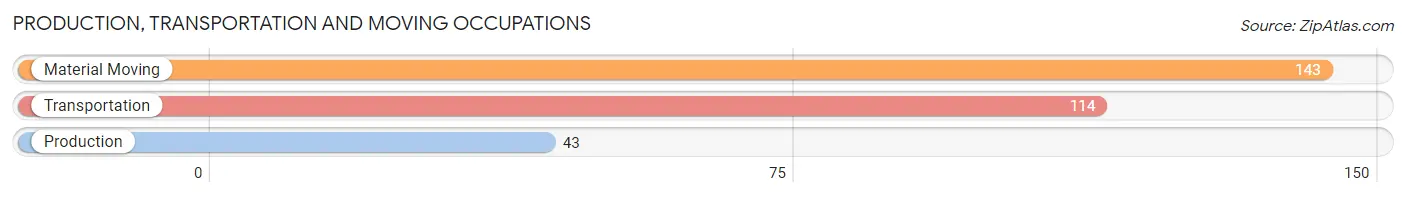
Production, Transportation and Moving Occupations by Sex
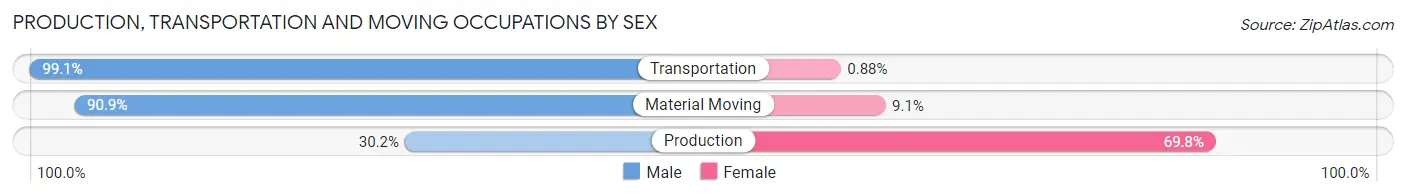
| Occupation | Male | Female |
| Production | 13 (30.2%) | 30 (69.8%) |
| Transportation | 113 (99.1%) | 1 (0.9%) |
| Material Moving | 130 (90.9%) | 13 (9.1%) |
| Total (Category) | 256 (85.3%) | 44 (14.7%) |
| Total (Overall) | 536 (69.6%) | 234 (30.4%) |
Employment Industries by Sex in Byhalia
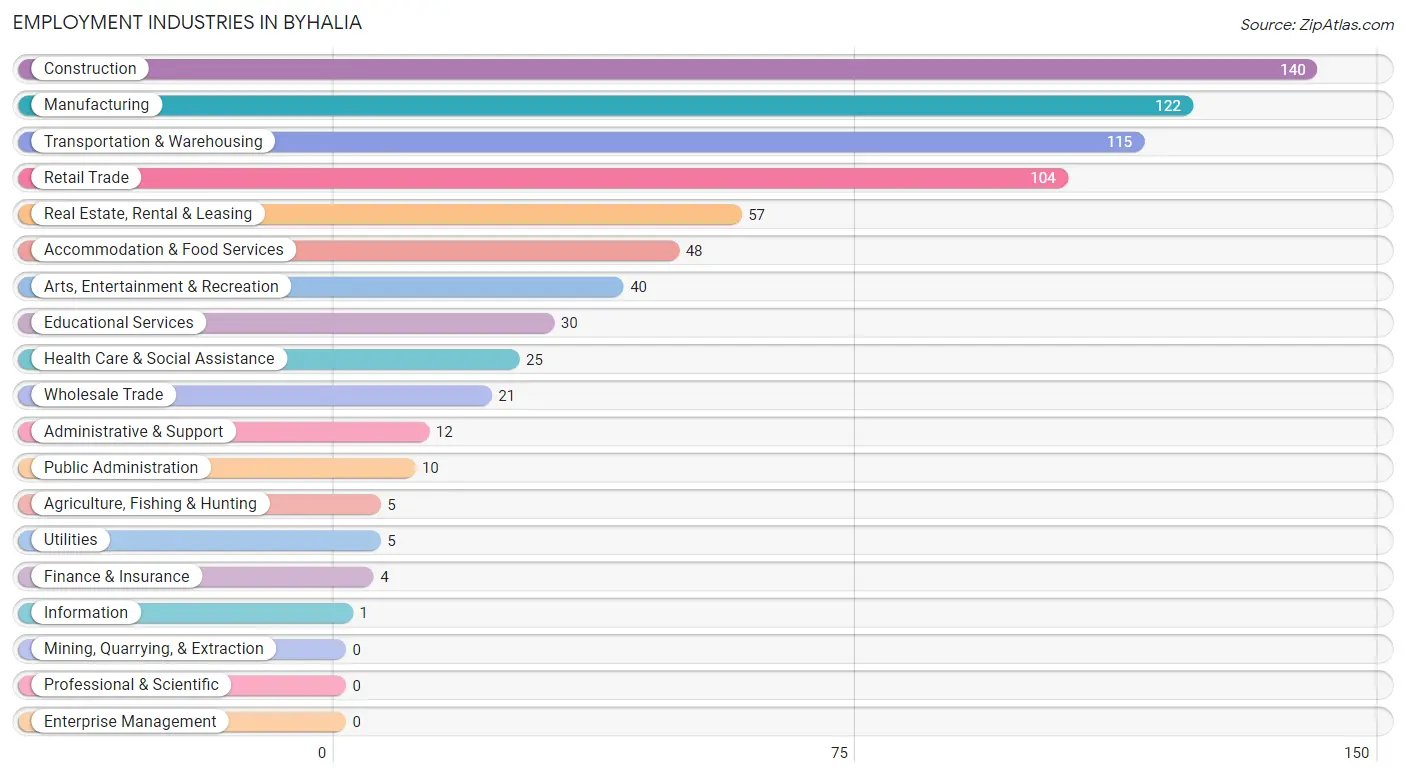
Employment Industries in Byhalia
The major employment industries in Byhalia include Construction (140 | 18.2%), Manufacturing (122 | 15.8%), Transportation & Warehousing (115 | 14.9%), Retail Trade (104 | 13.5%), and Real Estate, Rental & Leasing (57 | 7.4%).
Employment Industries by Sex in Byhalia
The Byhalia industries that see more men than women are Agriculture, Fishing & Hunting (100.0%), Utilities (100.0%), and Finance & Insurance (100.0%), whereas the industries that tend to have a higher number of women are Information (100.0%), Health Care & Social Assistance (100.0%), and Accommodation & Food Services (100.0%).
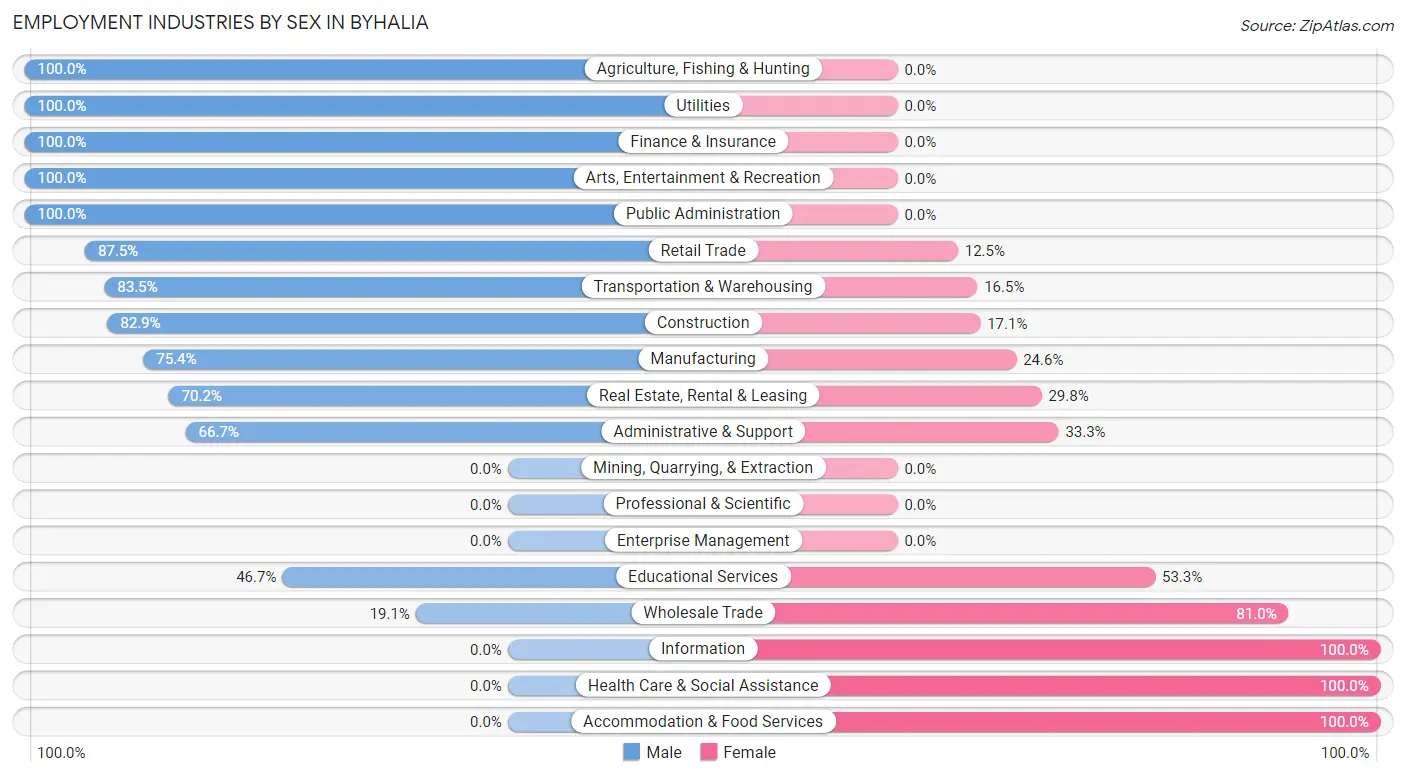
| Industry | Male | Female |
| Agriculture, Fishing & Hunting | 5 (100.0%) | 0 (0.0%) |
| Mining, Quarrying, & Extraction | 0 (0.0%) | 0 (0.0%) |
| Construction | 116 (82.9%) | 24 (17.1%) |
| Manufacturing | 92 (75.4%) | 30 (24.6%) |
| Wholesale Trade | 4 (19.1%) | 17 (80.9%) |
| Retail Trade | 91 (87.5%) | 13 (12.5%) |
| Transportation & Warehousing | 96 (83.5%) | 19 (16.5%) |
| Utilities | 5 (100.0%) | 0 (0.0%) |
| Information | 0 (0.0%) | 1 (100.0%) |
| Finance & Insurance | 4 (100.0%) | 0 (0.0%) |
| Real Estate, Rental & Leasing | 40 (70.2%) | 17 (29.8%) |
| Professional & Scientific | 0 (0.0%) | 0 (0.0%) |
| Enterprise Management | 0 (0.0%) | 0 (0.0%) |
| Administrative & Support | 8 (66.7%) | 4 (33.3%) |
| Educational Services | 14 (46.7%) | 16 (53.3%) |
| Health Care & Social Assistance | 0 (0.0%) | 25 (100.0%) |
| Arts, Entertainment & Recreation | 40 (100.0%) | 0 (0.0%) |
| Accommodation & Food Services | 0 (0.0%) | 48 (100.0%) |
| Public Administration | 10 (100.0%) | 0 (0.0%) |
| Total | 536 (69.6%) | 234 (30.4%) |
Education in Byhalia
School Enrollment in Byhalia
The most common levels of schooling among the 422 students in Byhalia are high school (130 | 30.8%), middle school (125 | 29.6%), and elementary school (119 | 28.2%).
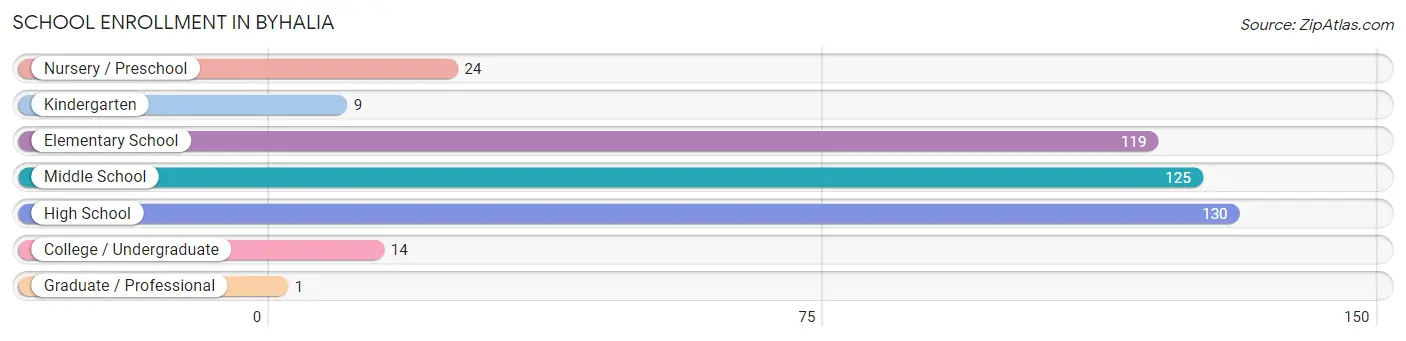
| School Level | # Students | % Students |
| Nursery / Preschool | 24 | 5.7% |
| Kindergarten | 9 | 2.1% |
| Elementary School | 119 | 28.2% |
| Middle School | 125 | 29.6% |
| High School | 130 | 30.8% |
| College / Undergraduate | 14 | 3.3% |
| Graduate / Professional | 1 | 0.2% |
| Total | 422 | 100.0% |
School Enrollment by Age by Funding Source in Byhalia
Out of a total of 422 students who are enrolled in schools in Byhalia, 18 (4.3%) attend a private institution, while the remaining 404 (95.7%) are enrolled in public schools. The age group of 3 to 4 year olds has the highest likelihood of being enrolled in private schools, with 7 (63.6% in the age bracket) enrolled. Conversely, the age group of 15 to 17 year olds has the lowest likelihood of being enrolled in a private school, with 108 (100.0% in the age bracket) attending a public institution.
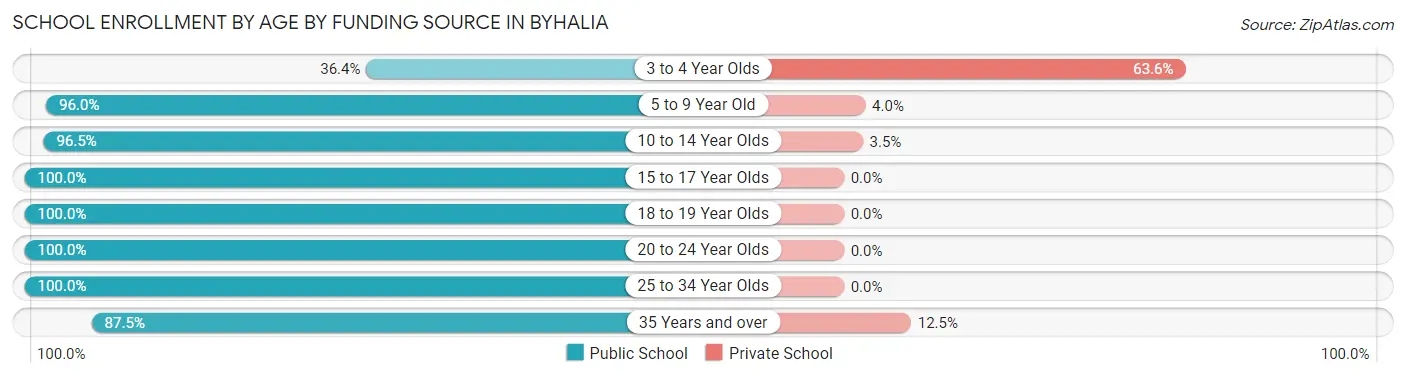
| Age Bracket | Public School | Private School |
| 3 to 4 Year Olds | 4 (36.4%) | 7 (63.6%) |
| 5 to 9 Year Old | 120 (96.0%) | 5 (4.0%) |
| 10 to 14 Year Olds | 137 (96.5%) | 5 (3.5%) |
| 15 to 17 Year Olds | 108 (100.0%) | 0 (0.0%) |
| 18 to 19 Year Olds | 15 (100.0%) | 0 (0.0%) |
| 20 to 24 Year Olds | 11 (100.0%) | 0 (0.0%) |
| 25 to 34 Year Olds | 2 (100.0%) | 0 (0.0%) |
| 35 Years and over | 7 (87.5%) | 1 (12.5%) |
| Total | 404 (95.7%) | 18 (4.3%) |
Educational Attainment by Field of Study in Byhalia
Business (47 | 28.3%), bio, nature & agricultural (36 | 21.7%), science & technology (31 | 18.7%), education (17 | 10.2%), and engineering (13 | 7.8%) are the most common fields of study among 166 individuals in Byhalia who have obtained a bachelor's degree or higher.
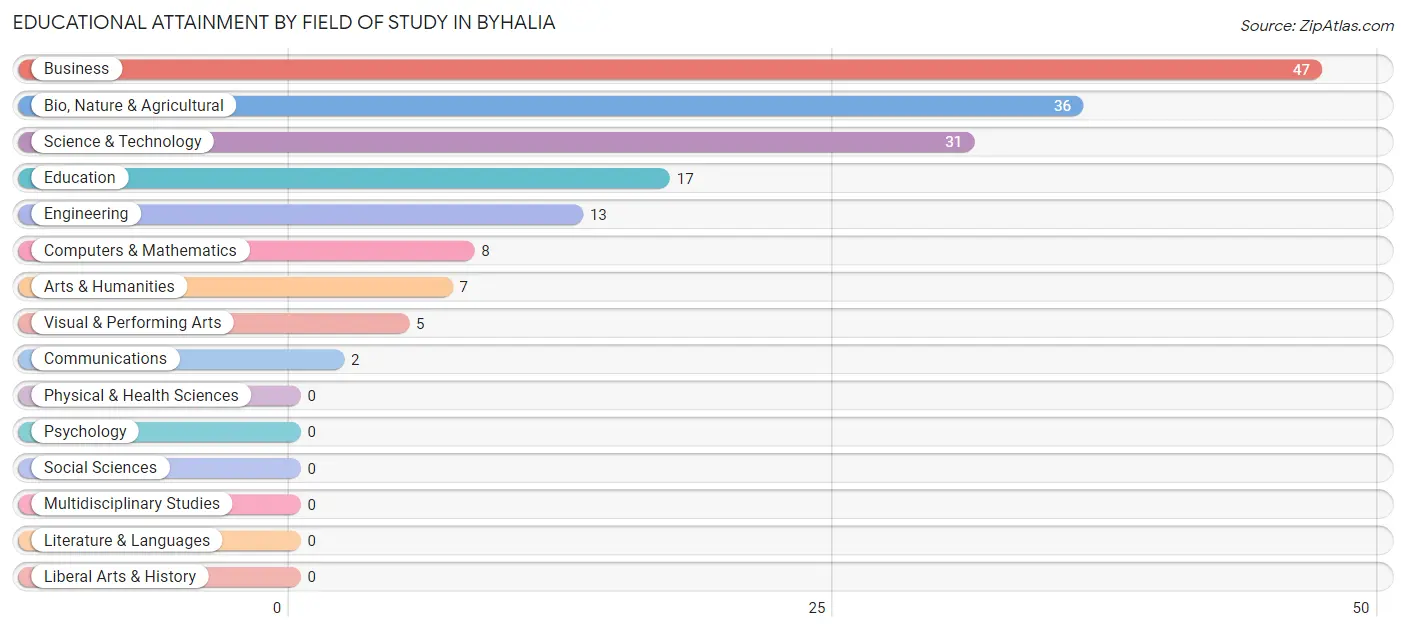
| Field of Study | # Graduates | % Graduates |
| Computers & Mathematics | 8 | 4.8% |
| Bio, Nature & Agricultural | 36 | 21.7% |
| Physical & Health Sciences | 0 | 0.0% |
| Psychology | 0 | 0.0% |
| Social Sciences | 0 | 0.0% |
| Engineering | 13 | 7.8% |
| Multidisciplinary Studies | 0 | 0.0% |
| Science & Technology | 31 | 18.7% |
| Business | 47 | 28.3% |
| Education | 17 | 10.2% |
| Literature & Languages | 0 | 0.0% |
| Liberal Arts & History | 0 | 0.0% |
| Visual & Performing Arts | 5 | 3.0% |
| Communications | 2 | 1.2% |
| Arts & Humanities | 7 | 4.2% |
| Total | 166 | 100.0% |
Transportation & Commute in Byhalia
Vehicle Availability by Sex in Byhalia
The most prevalent vehicle ownership categories in Byhalia are males with 1 vehicle (204, accounting for 38.1%) and females with 1 vehicle (94, making up 88.3%).
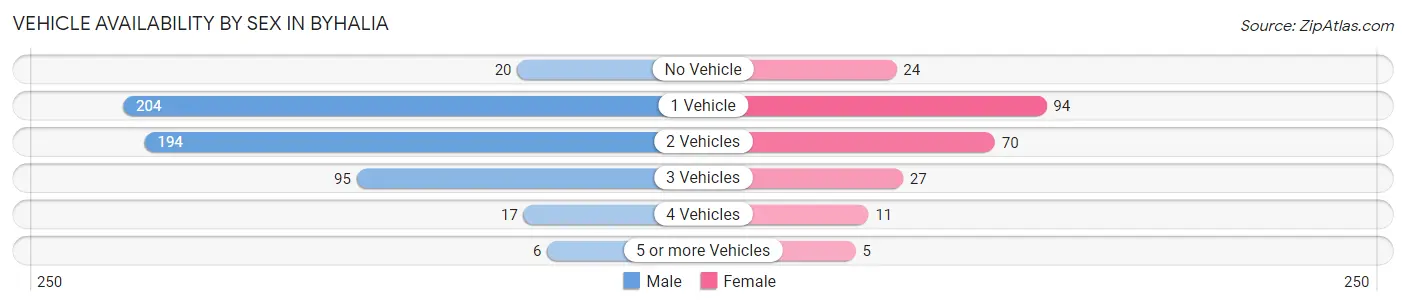
| Vehicles Available | Male | Female |
| No Vehicle | 20 (3.7%) | 24 (10.4%) |
| 1 Vehicle | 204 (38.1%) | 94 (40.7%) |
| 2 Vehicles | 194 (36.2%) | 70 (30.3%) |
| 3 Vehicles | 95 (17.7%) | 27 (11.7%) |
| 4 Vehicles | 17 (3.2%) | 11 (4.8%) |
| 5 or more Vehicles | 6 (1.1%) | 5 (2.2%) |
| Total | 536 (100.0%) | 231 (100.0%) |
Commute Time in Byhalia
The most frequently occuring commute durations in Byhalia are 20 to 24 minutes (212 commuters, 29.6%), 10 to 14 minutes (155 commuters, 21.6%), and 5 to 9 minutes (115 commuters, 16.0%).
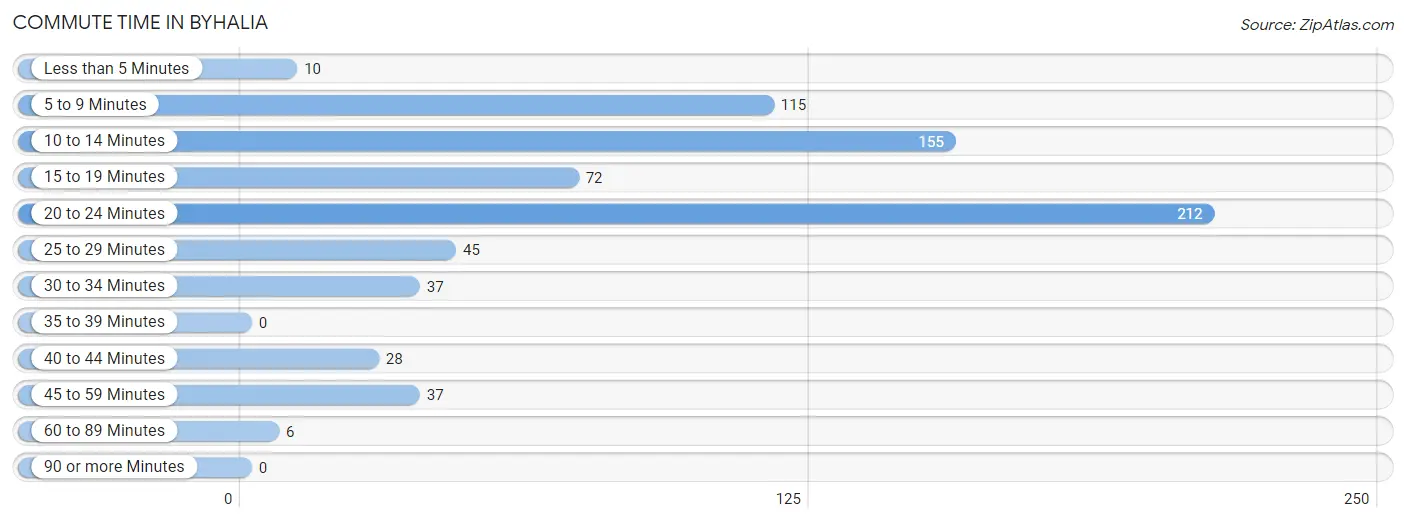
| Commute Time | # Commuters | % Commuters |
| Less than 5 Minutes | 10 | 1.4% |
| 5 to 9 Minutes | 115 | 16.0% |
| 10 to 14 Minutes | 155 | 21.6% |
| 15 to 19 Minutes | 72 | 10.0% |
| 20 to 24 Minutes | 212 | 29.6% |
| 25 to 29 Minutes | 45 | 6.3% |
| 30 to 34 Minutes | 37 | 5.2% |
| 35 to 39 Minutes | 0 | 0.0% |
| 40 to 44 Minutes | 28 | 3.9% |
| 45 to 59 Minutes | 37 | 5.2% |
| 60 to 89 Minutes | 6 | 0.8% |
| 90 or more Minutes | 0 | 0.0% |
Commute Time by Sex in Byhalia
The most common commute times in Byhalia are 20 to 24 minutes (188 commuters, 36.0%) for males and 15 to 19 minutes (40 commuters, 20.5%) for females.
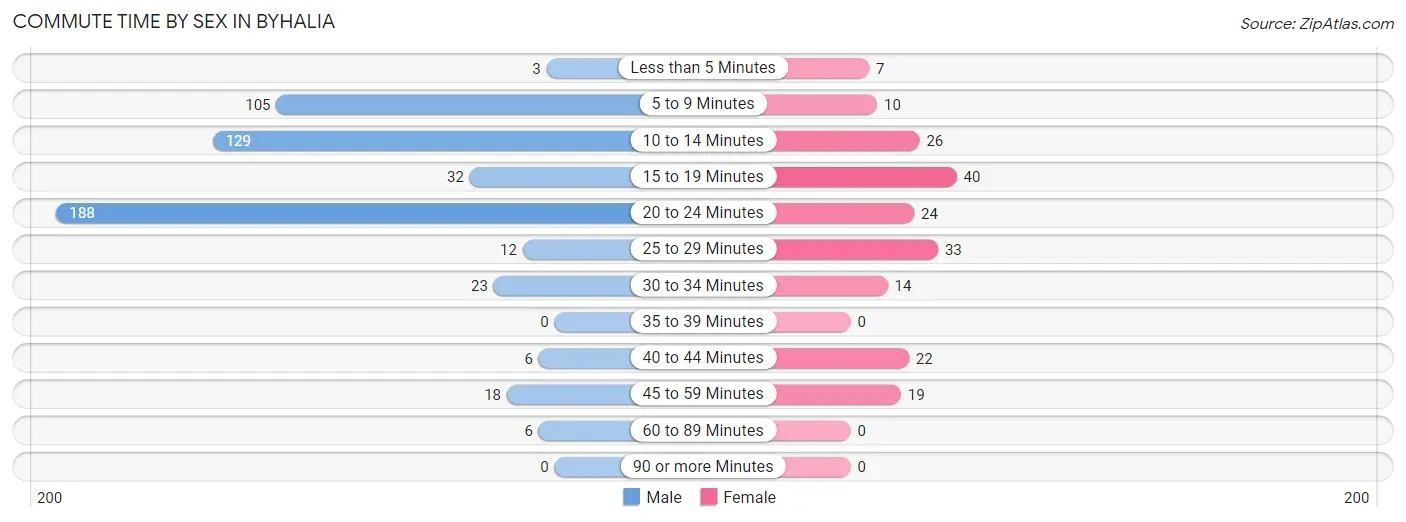
| Commute Time | Male | Female |
| Less than 5 Minutes | 3 (0.6%) | 7 (3.6%) |
| 5 to 9 Minutes | 105 (20.1%) | 10 (5.1%) |
| 10 to 14 Minutes | 129 (24.7%) | 26 (13.3%) |
| 15 to 19 Minutes | 32 (6.1%) | 40 (20.5%) |
| 20 to 24 Minutes | 188 (36.0%) | 24 (12.3%) |
| 25 to 29 Minutes | 12 (2.3%) | 33 (16.9%) |
| 30 to 34 Minutes | 23 (4.4%) | 14 (7.2%) |
| 35 to 39 Minutes | 0 (0.0%) | 0 (0.0%) |
| 40 to 44 Minutes | 6 (1.1%) | 22 (11.3%) |
| 45 to 59 Minutes | 18 (3.5%) | 19 (9.7%) |
| 60 to 89 Minutes | 6 (1.1%) | 0 (0.0%) |
| 90 or more Minutes | 0 (0.0%) | 0 (0.0%) |
Time of Departure to Work by Sex in Byhalia
The most frequent times of departure to work in Byhalia are 6:00 AM to 6:29 AM (137, 26.3%) for males and 6:30 AM to 6:59 AM (32, 16.4%) for females.
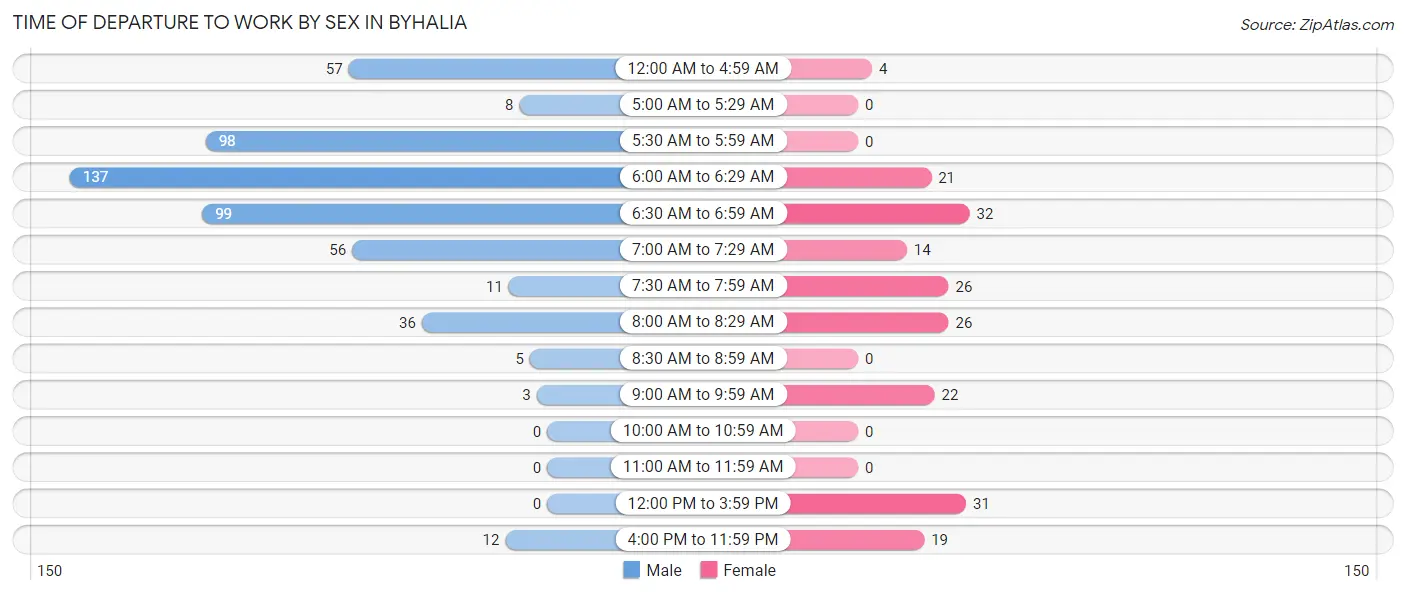
| Time of Departure | Male | Female |
| 12:00 AM to 4:59 AM | 57 (10.9%) | 4 (2.1%) |
| 5:00 AM to 5:29 AM | 8 (1.5%) | 0 (0.0%) |
| 5:30 AM to 5:59 AM | 98 (18.8%) | 0 (0.0%) |
| 6:00 AM to 6:29 AM | 137 (26.3%) | 21 (10.8%) |
| 6:30 AM to 6:59 AM | 99 (19.0%) | 32 (16.4%) |
| 7:00 AM to 7:29 AM | 56 (10.7%) | 14 (7.2%) |
| 7:30 AM to 7:59 AM | 11 (2.1%) | 26 (13.3%) |
| 8:00 AM to 8:29 AM | 36 (6.9%) | 26 (13.3%) |
| 8:30 AM to 8:59 AM | 5 (1.0%) | 0 (0.0%) |
| 9:00 AM to 9:59 AM | 3 (0.6%) | 22 (11.3%) |
| 10:00 AM to 10:59 AM | 0 (0.0%) | 0 (0.0%) |
| 11:00 AM to 11:59 AM | 0 (0.0%) | 0 (0.0%) |
| 12:00 PM to 3:59 PM | 0 (0.0%) | 31 (15.9%) |
| 4:00 PM to 11:59 PM | 12 (2.3%) | 19 (9.7%) |
| Total | 522 (100.0%) | 195 (100.0%) |
Housing Occupancy in Byhalia
Occupancy by Ownership in Byhalia
Of the total 848 dwellings in Byhalia, owner-occupied units account for 551 (65.0%), while renter-occupied units make up 297 (35.0%).
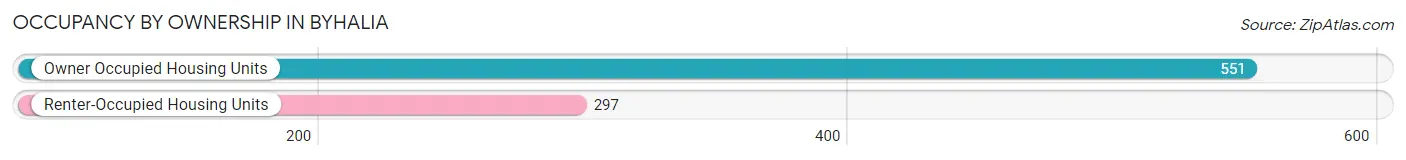
| Occupancy | # Housing Units | % Housing Units |
| Owner Occupied Housing Units | 551 | 65.0% |
| Renter-Occupied Housing Units | 297 | 35.0% |
| Total Occupied Housing Units | 848 | 100.0% |
Occupancy by Household Size in Byhalia
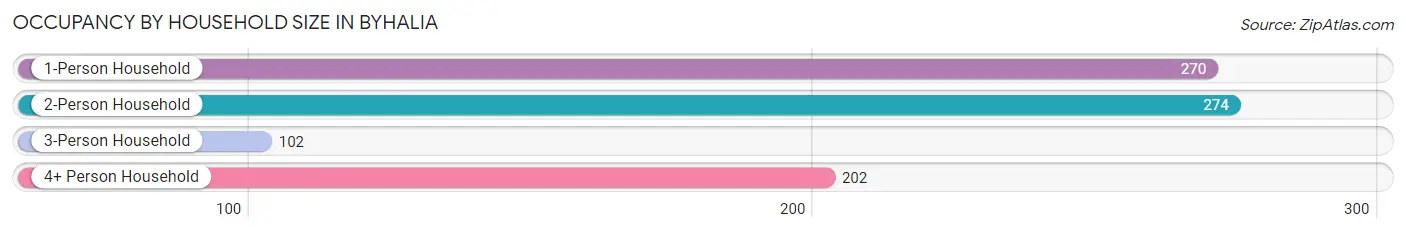
| Household Size | # Housing Units | % Housing Units |
| 1-Person Household | 270 | 31.8% |
| 2-Person Household | 274 | 32.3% |
| 3-Person Household | 102 | 12.0% |
| 4+ Person Household | 202 | 23.8% |
| Total Housing Units | 848 | 100.0% |
Occupancy by Ownership by Household Size in Byhalia
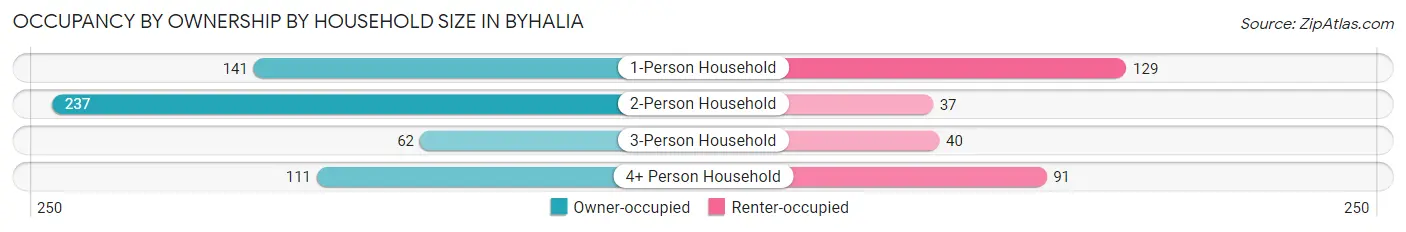
| Household Size | Owner-occupied | Renter-occupied |
| 1-Person Household | 141 (52.2%) | 129 (47.8%) |
| 2-Person Household | 237 (86.5%) | 37 (13.5%) |
| 3-Person Household | 62 (60.8%) | 40 (39.2%) |
| 4+ Person Household | 111 (54.9%) | 91 (45.1%) |
| Total Housing Units | 551 (65.0%) | 297 (35.0%) |
Occupancy by Educational Attainment in Byhalia
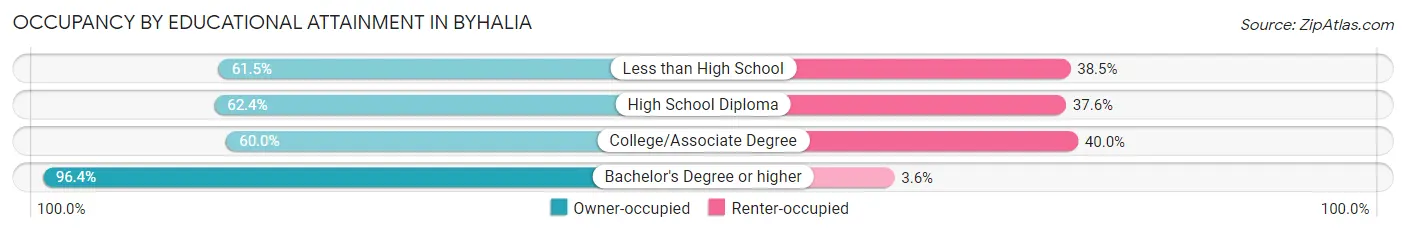
| Household Size | Owner-occupied | Renter-occupied |
| Less than High School | 179 (61.5%) | 112 (38.5%) |
| High School Diploma | 199 (62.4%) | 120 (37.6%) |
| College/Associate Degree | 93 (60.0%) | 62 (40.0%) |
| Bachelor's Degree or higher | 80 (96.4%) | 3 (3.6%) |
Occupancy by Age of Householder in Byhalia
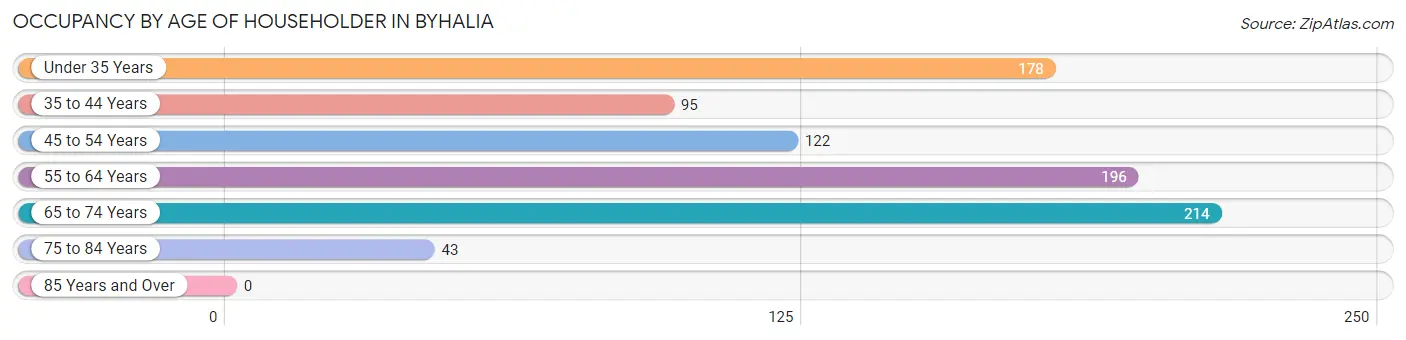
| Age Bracket | # Households | % Households |
| Under 35 Years | 178 | 21.0% |
| 35 to 44 Years | 95 | 11.2% |
| 45 to 54 Years | 122 | 14.4% |
| 55 to 64 Years | 196 | 23.1% |
| 65 to 74 Years | 214 | 25.2% |
| 75 to 84 Years | 43 | 5.1% |
| 85 Years and Over | 0 | 0.0% |
| Total | 848 | 100.0% |
Housing Finances in Byhalia
Median Income by Occupancy in Byhalia
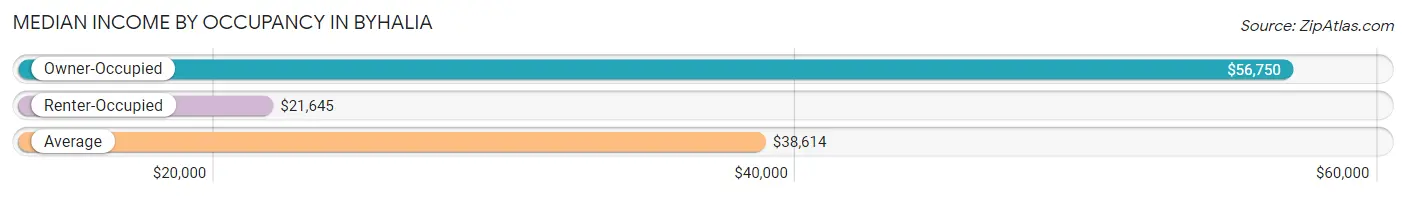
| Occupancy Type | # Households | Median Income |
| Owner-Occupied | 551 (65.0%) | $56,750 |
| Renter-Occupied | 297 (35.0%) | $21,645 |
| Average | 848 (100.0%) | $38,614 |
Occupancy by Householder Income Bracket in Byhalia
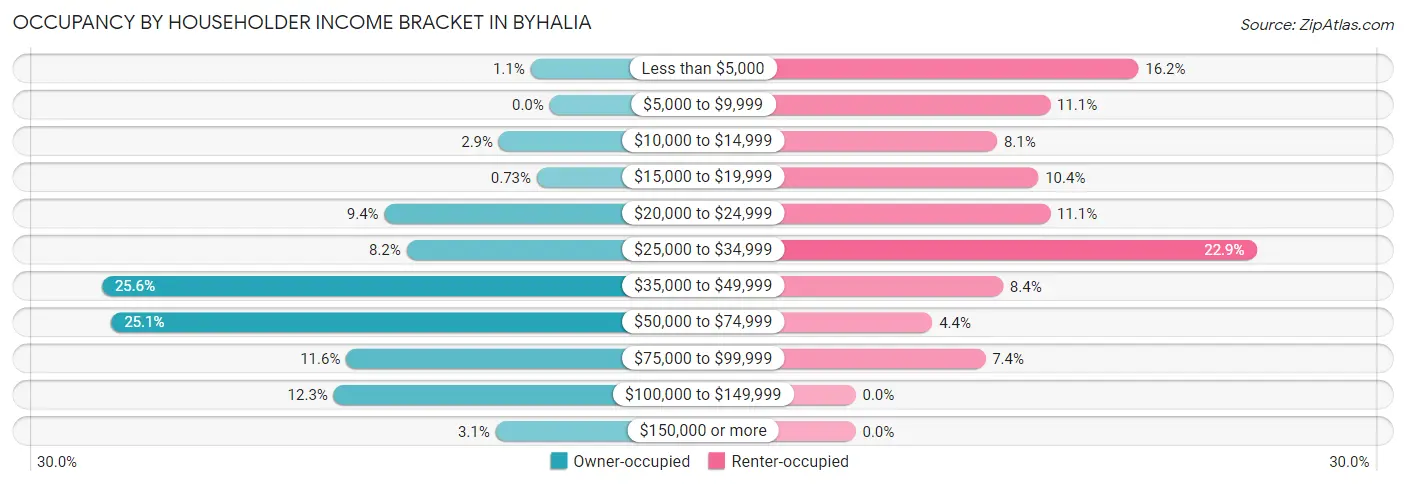
| Income Bracket | Owner-occupied | Renter-occupied |
| Less than $5,000 | 6 (1.1%) | 48 (16.2%) |
| $5,000 to $9,999 | 0 (0.0%) | 33 (11.1%) |
| $10,000 to $14,999 | 16 (2.9%) | 24 (8.1%) |
| $15,000 to $19,999 | 4 (0.7%) | 31 (10.4%) |
| $20,000 to $24,999 | 52 (9.4%) | 33 (11.1%) |
| $25,000 to $34,999 | 45 (8.2%) | 68 (22.9%) |
| $35,000 to $49,999 | 141 (25.6%) | 25 (8.4%) |
| $50,000 to $74,999 | 138 (25.1%) | 13 (4.4%) |
| $75,000 to $99,999 | 64 (11.6%) | 22 (7.4%) |
| $100,000 to $149,999 | 68 (12.3%) | 0 (0.0%) |
| $150,000 or more | 17 (3.1%) | 0 (0.0%) |
| Total | 551 (100.0%) | 297 (100.0%) |
Monthly Housing Cost Tiers in Byhalia
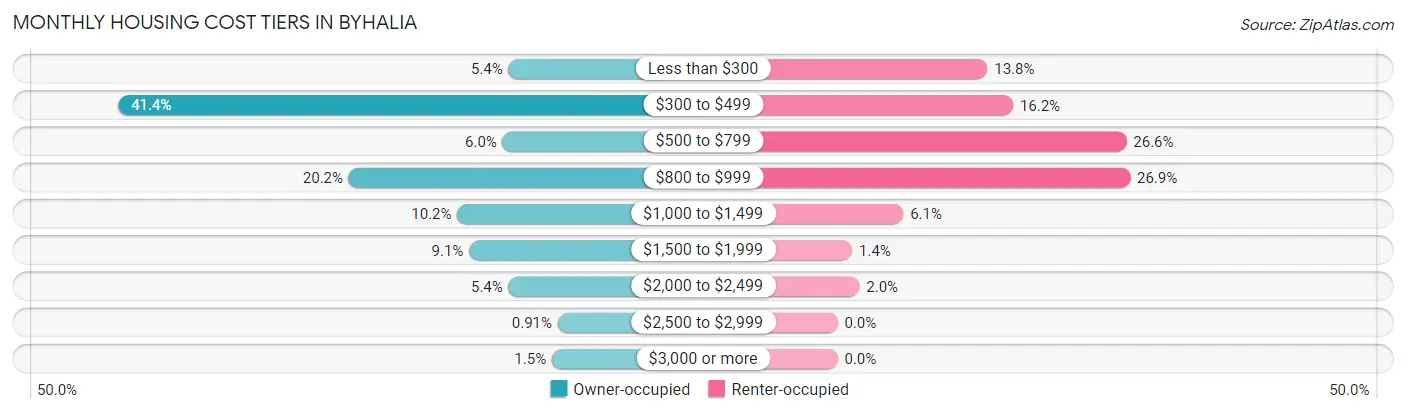
| Monthly Cost | Owner-occupied | Renter-occupied |
| Less than $300 | 30 (5.4%) | 41 (13.8%) |
| $300 to $499 | 228 (41.4%) | 48 (16.2%) |
| $500 to $799 | 33 (6.0%) | 79 (26.6%) |
| $800 to $999 | 111 (20.2%) | 80 (26.9%) |
| $1,000 to $1,499 | 56 (10.2%) | 18 (6.1%) |
| $1,500 to $1,999 | 50 (9.1%) | 4 (1.3%) |
| $2,000 to $2,499 | 30 (5.4%) | 6 (2.0%) |
| $2,500 to $2,999 | 5 (0.9%) | 0 (0.0%) |
| $3,000 or more | 8 (1.5%) | 0 (0.0%) |
| Total | 551 (100.0%) | 297 (100.0%) |
Physical Housing Characteristics in Byhalia
Housing Structures in Byhalia
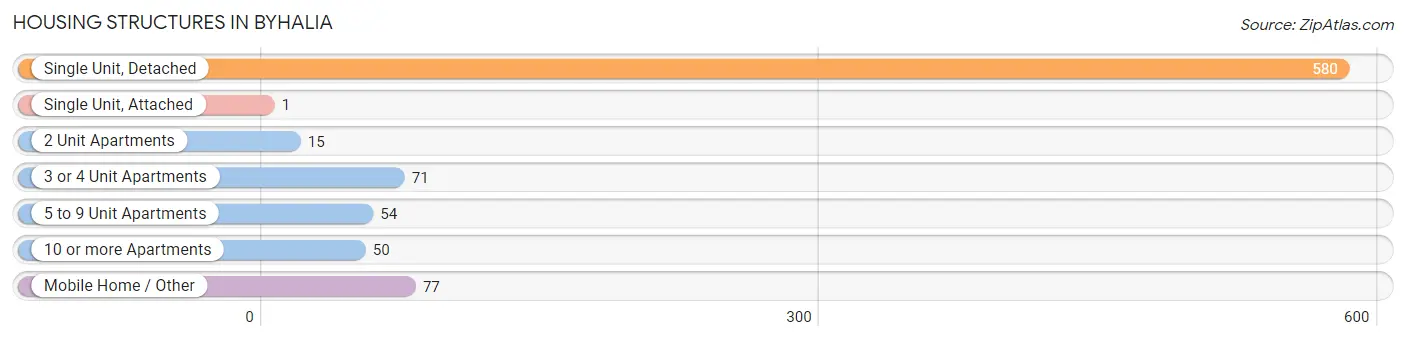
| Structure Type | # Housing Units | % Housing Units |
| Single Unit, Detached | 580 | 68.4% |
| Single Unit, Attached | 1 | 0.1% |
| 2 Unit Apartments | 15 | 1.8% |
| 3 or 4 Unit Apartments | 71 | 8.4% |
| 5 to 9 Unit Apartments | 54 | 6.4% |
| 10 or more Apartments | 50 | 5.9% |
| Mobile Home / Other | 77 | 9.1% |
| Total | 848 | 100.0% |
Housing Structures by Occupancy in Byhalia
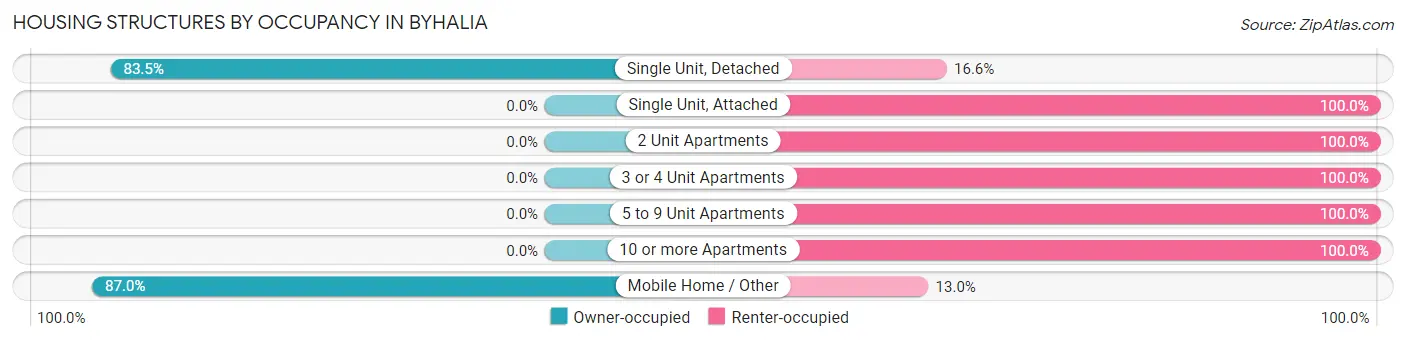
| Structure Type | Owner-occupied | Renter-occupied |
| Single Unit, Detached | 484 (83.5%) | 96 (16.6%) |
| Single Unit, Attached | 0 (0.0%) | 1 (100.0%) |
| 2 Unit Apartments | 0 (0.0%) | 15 (100.0%) |
| 3 or 4 Unit Apartments | 0 (0.0%) | 71 (100.0%) |
| 5 to 9 Unit Apartments | 0 (0.0%) | 54 (100.0%) |
| 10 or more Apartments | 0 (0.0%) | 50 (100.0%) |
| Mobile Home / Other | 67 (87.0%) | 10 (13.0%) |
| Total | 551 (65.0%) | 297 (35.0%) |
Housing Structures by Number of Rooms in Byhalia
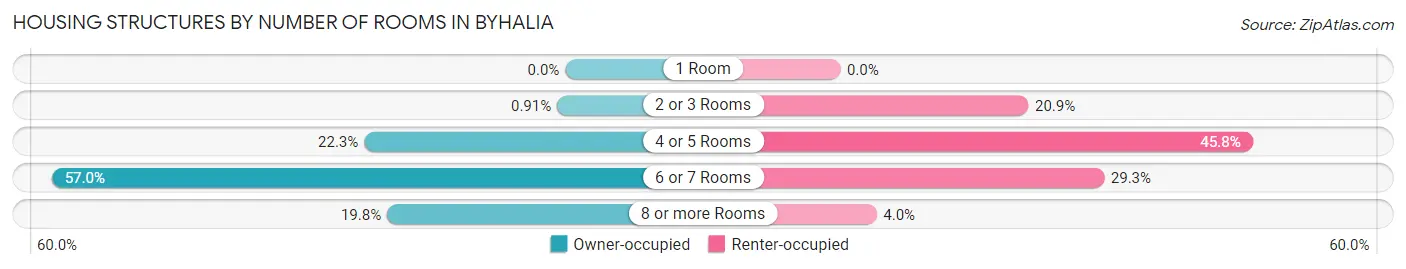
| Number of Rooms | Owner-occupied | Renter-occupied |
| 1 Room | 0 (0.0%) | 0 (0.0%) |
| 2 or 3 Rooms | 5 (0.9%) | 62 (20.9%) |
| 4 or 5 Rooms | 123 (22.3%) | 136 (45.8%) |
| 6 or 7 Rooms | 314 (57.0%) | 87 (29.3%) |
| 8 or more Rooms | 109 (19.8%) | 12 (4.0%) |
| Total | 551 (100.0%) | 297 (100.0%) |
Housing Structure by Heating Type in Byhalia
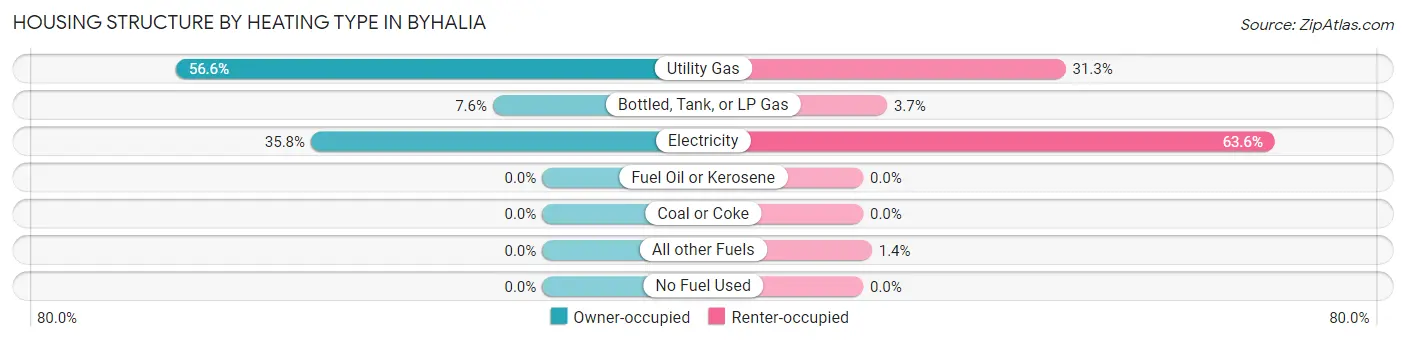
| Heating Type | Owner-occupied | Renter-occupied |
| Utility Gas | 312 (56.6%) | 93 (31.3%) |
| Bottled, Tank, or LP Gas | 42 (7.6%) | 11 (3.7%) |
| Electricity | 197 (35.7%) | 189 (63.6%) |
| Fuel Oil or Kerosene | 0 (0.0%) | 0 (0.0%) |
| Coal or Coke | 0 (0.0%) | 0 (0.0%) |
| All other Fuels | 0 (0.0%) | 4 (1.3%) |
| No Fuel Used | 0 (0.0%) | 0 (0.0%) |
| Total | 551 (100.0%) | 297 (100.0%) |
Household Vehicle Usage in Byhalia
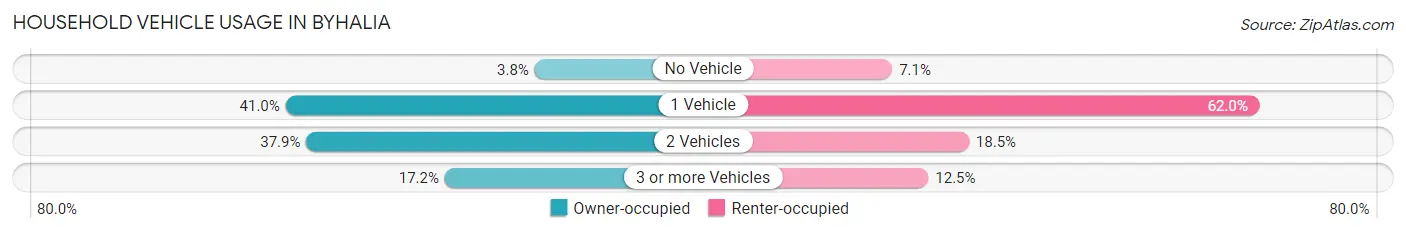
| Vehicles per Household | Owner-occupied | Renter-occupied |
| No Vehicle | 21 (3.8%) | 21 (7.1%) |
| 1 Vehicle | 226 (41.0%) | 184 (62.0%) |
| 2 Vehicles | 209 (37.9%) | 55 (18.5%) |
| 3 or more Vehicles | 95 (17.2%) | 37 (12.5%) |
| Total | 551 (100.0%) | 297 (100.0%) |
Real Estate & Mortgages in Byhalia
Real Estate and Mortgage Overview in Byhalia
| Characteristic | Without Mortgage | With Mortgage |
| Housing Units | 274 | 277 |
| Median Property Value | $101,600 | $134,200 |
| Median Household Income | $42,750 | $17 |
| Monthly Housing Costs | $426 | $8 |
| Real Estate Taxes | $1,081 | $112 |
Property Value by Mortgage Status in Byhalia
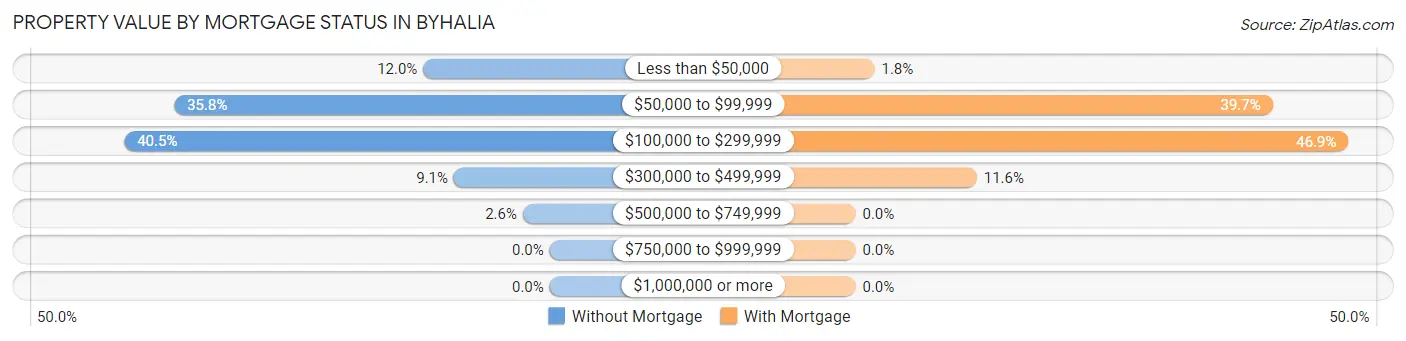
| Property Value | Without Mortgage | With Mortgage |
| Less than $50,000 | 33 (12.0%) | 5 (1.8%) |
| $50,000 to $99,999 | 98 (35.8%) | 110 (39.7%) |
| $100,000 to $299,999 | 111 (40.5%) | 130 (46.9%) |
| $300,000 to $499,999 | 25 (9.1%) | 32 (11.6%) |
| $500,000 to $749,999 | 7 (2.5%) | 0 (0.0%) |
| $750,000 to $999,999 | 0 (0.0%) | 0 (0.0%) |
| $1,000,000 or more | 0 (0.0%) | 0 (0.0%) |
| Total | 274 (100.0%) | 277 (100.0%) |
Household Income by Mortgage Status in Byhalia
| Household Income | Without Mortgage | With Mortgage |
| Less than $10,000 | 6 (2.2%) | 0 (0.0%) |
| $10,000 to $24,999 | 64 (23.4%) | 0 (0.0%) |
| $25,000 to $34,999 | 29 (10.6%) | 8 (2.9%) |
| $35,000 to $49,999 | 47 (17.2%) | 16 (5.8%) |
| $50,000 to $74,999 | 92 (33.6%) | 94 (33.9%) |
| $75,000 to $99,999 | 33 (12.0%) | 46 (16.6%) |
| $100,000 to $149,999 | 3 (1.1%) | 31 (11.2%) |
| $150,000 or more | 0 (0.0%) | 65 (23.5%) |
| Total | 274 (100.0%) | 277 (100.0%) |
Property Value to Household Income Ratio in Byhalia
| Value-to-Income Ratio | Without Mortgage | With Mortgage |
| Less than 2.0x | 125 (45.6%) | 66,375 (23,962.1%) |
| 2.0x to 2.9x | 39 (14.2%) | 173 (62.5%) |
| 3.0x to 3.9x | 50 (18.2%) | 18 (6.5%) |
| 4.0x or more | 54 (19.7%) | 60 (21.7%) |
| Total | 274 (100.0%) | 277 (100.0%) |
Real Estate Taxes by Mortgage Status in Byhalia
| Property Taxes | Without Mortgage | With Mortgage |
| Less than $800 | 45 (16.4%) | 0 (0.0%) |
| $800 to $1,499 | 126 (46.0%) | 37 (13.4%) |
| $800 to $1,499 | 20 (7.3%) | 62 (22.4%) |
| Total | 274 (100.0%) | 277 (100.0%) |
Health & Disability in Byhalia
Health Insurance Coverage by Age in Byhalia
| Age Bracket | With Coverage | Without Coverage |
| Under 6 Years | 98 (100.0%) | 0 (0.0%) |
| 6 to 18 Years | 375 (96.9%) | 12 (3.1%) |
| 19 to 25 Years | 125 (56.0%) | 98 (44.0%) |
| 26 to 34 Years | 115 (73.7%) | 41 (26.3%) |
| 35 to 44 Years | 125 (63.4%) | 72 (36.5%) |
| 45 to 54 Years | 59 (31.6%) | 128 (68.4%) |
| 55 to 64 Years | 232 (84.4%) | 43 (15.6%) |
| 65 to 74 Years | 283 (100.0%) | 0 (0.0%) |
| 75 Years and older | 63 (100.0%) | 0 (0.0%) |
| Total | 1,475 (78.9%) | 394 (21.1%) |
Health Insurance Coverage by Citizenship Status in Byhalia
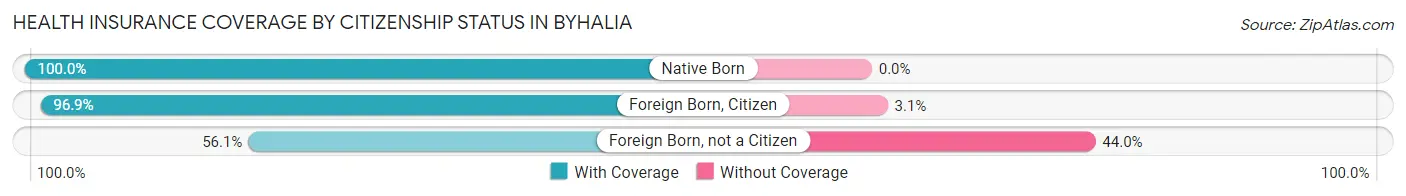
| Citizenship Status | With Coverage | Without Coverage |
| Native Born | 98 (100.0%) | 0 (0.0%) |
| Foreign Born, Citizen | 375 (96.9%) | 12 (3.1%) |
| Foreign Born, not a Citizen | 125 (56.0%) | 98 (44.0%) |
Health Insurance Coverage by Household Income in Byhalia
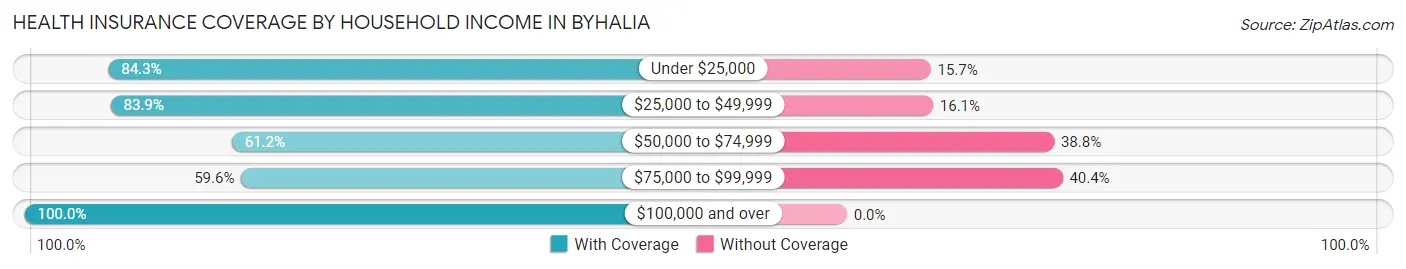
| Household Income | With Coverage | Without Coverage |
| Under $25,000 | 489 (84.3%) | 91 (15.7%) |
| $25,000 to $49,999 | 463 (83.9%) | 89 (16.1%) |
| $50,000 to $74,999 | 145 (61.2%) | 92 (38.8%) |
| $75,000 to $99,999 | 180 (59.6%) | 122 (40.4%) |
| $100,000 and over | 198 (100.0%) | 0 (0.0%) |
Public vs Private Health Insurance Coverage by Age in Byhalia
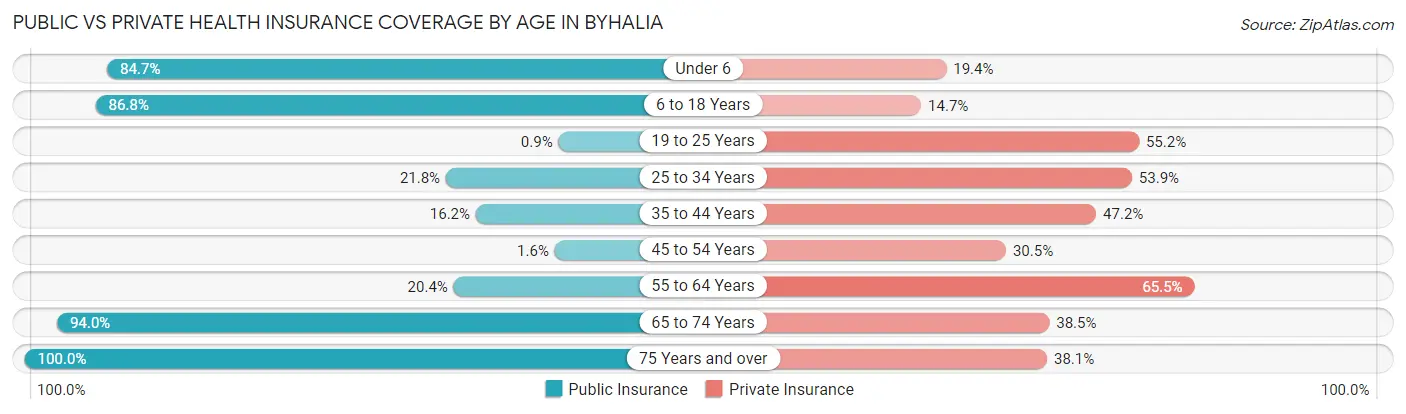
| Age Bracket | Public Insurance | Private Insurance |
| Under 6 | 83 (84.7%) | 19 (19.4%) |
| 6 to 18 Years | 336 (86.8%) | 57 (14.7%) |
| 19 to 25 Years | 2 (0.9%) | 123 (55.2%) |
| 25 to 34 Years | 34 (21.8%) | 84 (53.8%) |
| 35 to 44 Years | 32 (16.2%) | 93 (47.2%) |
| 45 to 54 Years | 3 (1.6%) | 57 (30.5%) |
| 55 to 64 Years | 56 (20.4%) | 180 (65.4%) |
| 65 to 74 Years | 266 (94.0%) | 109 (38.5%) |
| 75 Years and over | 63 (100.0%) | 24 (38.1%) |
| Total | 875 (46.8%) | 746 (39.9%) |
Disability Status by Sex by Age in Byhalia
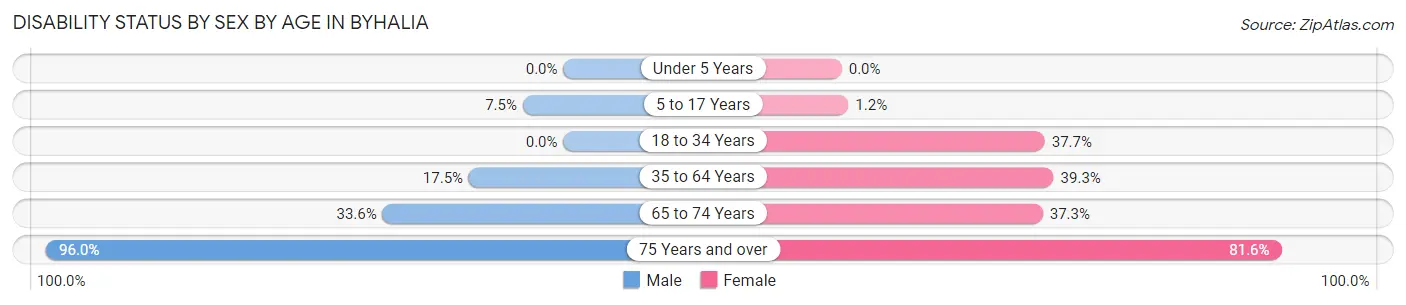
| Age Bracket | Male | Female |
| Under 5 Years | 0 (0.0%) | 0 (0.0%) |
| 5 to 17 Years | 11 (7.5%) | 3 (1.2%) |
| 18 to 34 Years | 0 (0.0%) | 52 (37.7%) |
| 35 to 64 Years | 54 (17.5%) | 138 (39.3%) |
| 65 to 74 Years | 50 (33.6%) | 50 (37.3%) |
| 75 Years and over | 24 (96.0%) | 31 (81.6%) |
Disability Class by Sex by Age in Byhalia
Disability Class: Hearing Difficulty
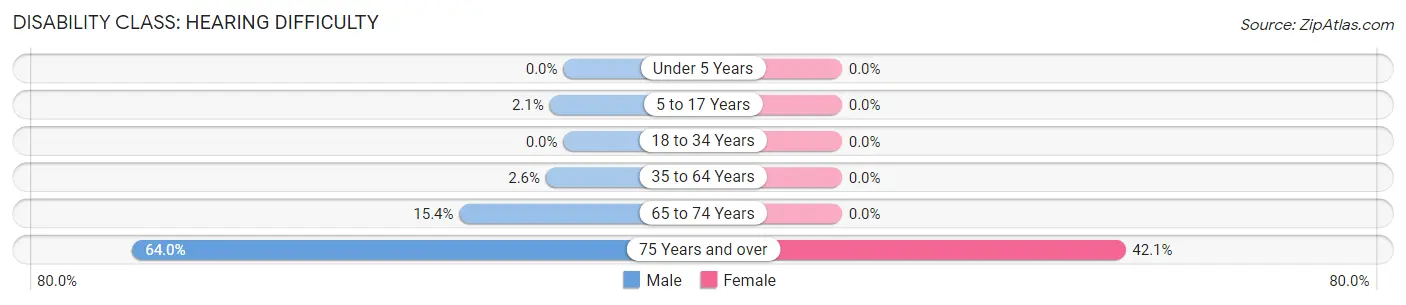
| Age Bracket | Male | Female |
| Under 5 Years | 0 (0.0%) | 0 (0.0%) |
| 5 to 17 Years | 3 (2.1%) | 0 (0.0%) |
| 18 to 34 Years | 0 (0.0%) | 0 (0.0%) |
| 35 to 64 Years | 8 (2.6%) | 0 (0.0%) |
| 65 to 74 Years | 23 (15.4%) | 0 (0.0%) |
| 75 Years and over | 16 (64.0%) | 16 (42.1%) |
Disability Class: Vision Difficulty
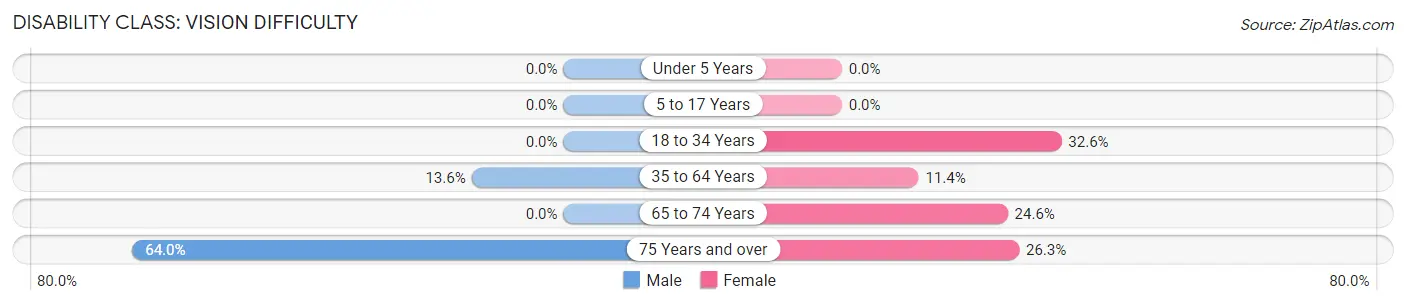
| Age Bracket | Male | Female |
| Under 5 Years | 0 (0.0%) | 0 (0.0%) |
| 5 to 17 Years | 0 (0.0%) | 0 (0.0%) |
| 18 to 34 Years | 0 (0.0%) | 45 (32.6%) |
| 35 to 64 Years | 42 (13.6%) | 40 (11.4%) |
| 65 to 74 Years | 0 (0.0%) | 33 (24.6%) |
| 75 Years and over | 16 (64.0%) | 10 (26.3%) |
Disability Class: Cognitive Difficulty
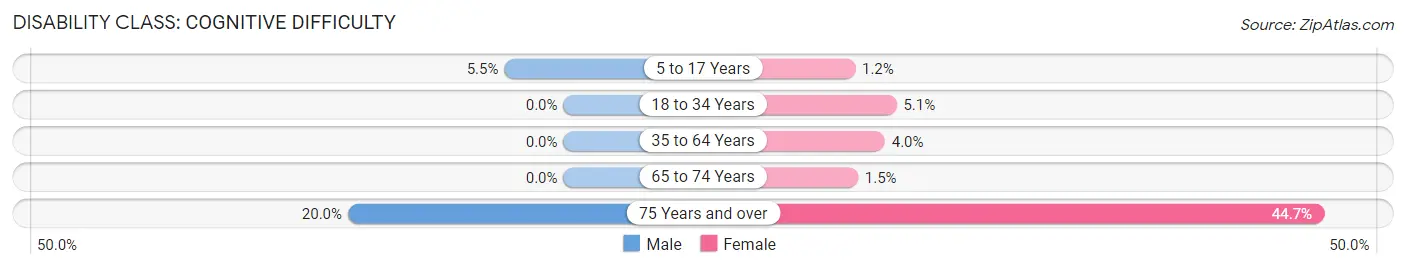
| Age Bracket | Male | Female |
| 5 to 17 Years | 8 (5.5%) | 3 (1.2%) |
| 18 to 34 Years | 0 (0.0%) | 7 (5.1%) |
| 35 to 64 Years | 0 (0.0%) | 14 (4.0%) |
| 65 to 74 Years | 0 (0.0%) | 2 (1.5%) |
| 75 Years and over | 5 (20.0%) | 17 (44.7%) |
Disability Class: Ambulatory Difficulty
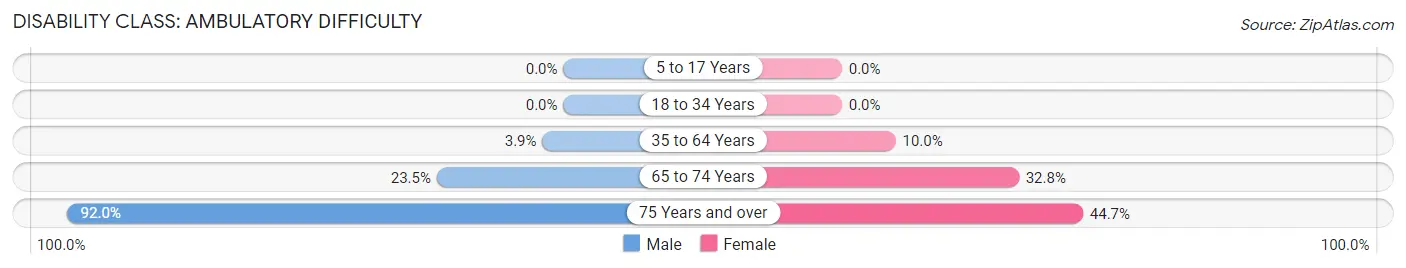
| Age Bracket | Male | Female |
| 5 to 17 Years | 0 (0.0%) | 0 (0.0%) |
| 18 to 34 Years | 0 (0.0%) | 0 (0.0%) |
| 35 to 64 Years | 12 (3.9%) | 35 (10.0%) |
| 65 to 74 Years | 35 (23.5%) | 44 (32.8%) |
| 75 Years and over | 23 (92.0%) | 17 (44.7%) |
Disability Class: Self-Care Difficulty
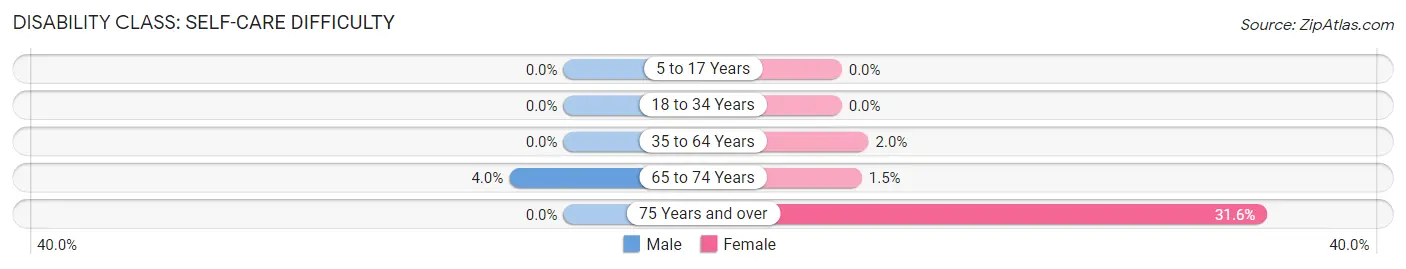
| Age Bracket | Male | Female |
| 5 to 17 Years | 0 (0.0%) | 0 (0.0%) |
| 18 to 34 Years | 0 (0.0%) | 0 (0.0%) |
| 35 to 64 Years | 0 (0.0%) | 7 (2.0%) |
| 65 to 74 Years | 6 (4.0%) | 2 (1.5%) |
| 75 Years and over | 0 (0.0%) | 12 (31.6%) |
Technology Access in Byhalia
Computing Device Access in Byhalia
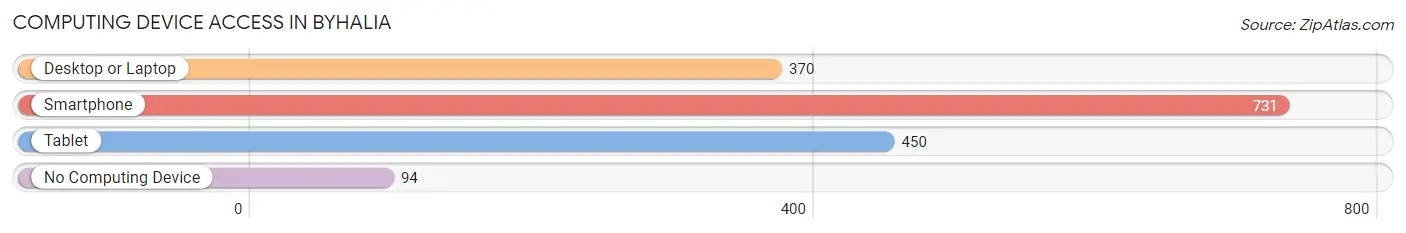
| Device Type | # Households | % Households |
| Desktop or Laptop | 370 | 43.6% |
| Smartphone | 731 | 86.2% |
| Tablet | 450 | 53.1% |
| No Computing Device | 94 | 11.1% |
| Total | 848 | 100.0% |
Internet Access in Byhalia
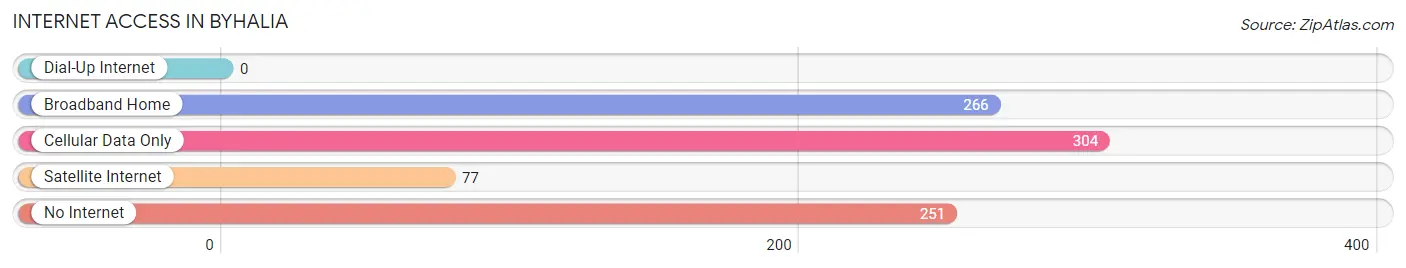
| Internet Type | # Households | % Households |
| Dial-Up Internet | 0 | 0.0% |
| Broadband Home | 266 | 31.4% |
| Cellular Data Only | 304 | 35.8% |
| Satellite Internet | 77 | 9.1% |
| No Internet | 251 | 29.6% |
| Total | 848 | 100.0% |
Byhalia Summary
Byhalia is a small town located in Marshall County, Mississippi, United States. It is situated in the northern part of the state, approximately 30 miles southeast of Memphis, Tennessee. The population of Byhalia was 1,741 at the 2010 census.
Geography
Byhalia is located at 34°45'25" North, 89°30'25" West (34.756944, -89.506944). It is situated in the northern part of the state, approximately 30 miles southeast of Memphis, Tennessee. The town is located in the foothills of the Appalachian Mountains and is surrounded by rolling hills and forests. The town is situated on the banks of the Hatchie River, which flows through the town and provides a source of recreation for the locals.
History
Byhalia was founded in 1836 by a group of settlers from North Carolina. The town was named after the nearby Byhalia Creek, which was named after a Chickasaw Indian chief. The town was incorporated in 1837 and quickly became a thriving agricultural center. The town was home to several cotton plantations and was a major producer of cotton during the Civil War. After the war, the town continued to grow and by the early 1900s, it had become a major trading center for the surrounding area.
Economy
Byhalia’s economy is largely based on agriculture and manufacturing. The town is home to several large farms that produce cotton, soybeans, corn, and other crops. The town is also home to several manufacturing plants, including a furniture factory, a plastics factory, and a paper mill. In addition, the town is home to several small businesses, including restaurants, shops, and other services.
Demographics
As of the 2010 census, the population of Byhalia was 1,741. The racial makeup of the town was 79.2% White, 18.2% African American, 0.3% Native American, 0.2% Asian, 0.1% Pacific Islander, 0.7% from other races, and 1.5% from two or more races. Hispanic or Latino of any race were 1.7% of the population.
The median income for a household in Byhalia was $31,250, and the median income for a family was $37,500. The per capita income for the town was $15,945. About 17.2% of families and 20.2% of the population were below the poverty line, including 28.3% of those under age 18 and 15.2% of those age 65 or over.
Conclusion
Byhalia is a small town located in Marshall County, Mississippi, United States. It is situated in the northern part of the state, approximately 30 miles southeast of Memphis, Tennessee. The population of Byhalia was 1,741 at the 2010 census. The town’s economy is largely based on agriculture and manufacturing, and the town is home to several large farms and manufacturing plants. The racial makeup of the town was 79.2% White, 18.2% African American, 0.3% Native American, 0.2% Asian, 0.1% Pacific Islander, 0.7% from other races, and 1.5% from two or more races. The median income for a household in Byhalia was $31,250, and the median income for a family was $37,500. The per capita income for the town was $15,945. About 17.2% of families and 20.2% of the population were below the poverty line.
Common Questions
What is Per Capita Income in Byhalia?
Per Capita income in Byhalia is $22,478.
What is the Median Family Income in Byhalia?
Median Family Income in Byhalia is $39,125.
What is the Median Household income in Byhalia?
Median Household Income in Byhalia is $38,614.
What is Income or Wage Gap in Byhalia?
Income or Wage Gap in Byhalia is 27.8%.
Women in Byhalia earn 72.2 cents for every dollar earned by a man.
What is Inequality or Gini Index in Byhalia?
Inequality or Gini Index in Byhalia is 0.41.
What is the Total Population of Byhalia?
Total Population of Byhalia is 1,990.
What is the Total Male Population of Byhalia?
Total Male Population of Byhalia is 933.
What is the Total Female Population of Byhalia?
Total Female Population of Byhalia is 1,057.
What is the Ratio of Males per 100 Females in Byhalia?
There are 88.27 Males per 100 Females in Byhalia.
What is the Ratio of Females per 100 Males in Byhalia?
There are 113.29 Females per 100 Males in Byhalia.
What is the Median Population Age in Byhalia?
Median Population Age in Byhalia is 40.8 Years.
What is the Average Family Size in Byhalia
Average Family Size in Byhalia is 2.7 People.
What is the Average Household Size in Byhalia
Average Household Size in Byhalia is 2.2 People.
How Large is the Labor Force in Byhalia?
There are 809 People in the Labor Forcein in Byhalia.
What is the Percentage of People in the Labor Force in Byhalia?
50.4% of People are in the Labor Force in Byhalia.
What is the Unemployment Rate in Byhalia?
Unemployment Rate in Byhalia is 4.8%.