Bruce, MS Map & Demographics
Bruce Map
Bruce Overview
$22,623
PER CAPITA INCOME
$65,089
AVG FAMILY INCOME
$30,094
AVG HOUSEHOLD INCOME
2.6%
WAGE / INCOME GAP [ % ]
97.4¢/ $1
WAGE / INCOME GAP [ $ ]
0.50
INEQUALITY / GINI INDEX
1,523
TOTAL POPULATION
691
MALE POPULATION
832
FEMALE POPULATION
83.05
MALES / 100 FEMALES
120.41
FEMALES / 100 MALES
36.1
MEDIAN AGE
3.1
AVG FAMILY SIZE
2.1
AVG HOUSEHOLD SIZE
518
LABOR FORCE [ PEOPLE ]
45.7%
PERCENT IN LABOR FORCE
3.3%
UNEMPLOYMENT RATE
Bruce Zip Codes
Bruce Area Codes
Income in Bruce
Income Overview in Bruce
Per Capita Income in Bruce is $22,623, while median incomes of families and households are $65,089 and $30,094 respectively.
| Characteristic | Number | Measure |
| Per Capita Income | 1,523 | $22,623 |
| Median Family Income | 347 | $65,089 |
| Mean Family Income | 347 | $71,004 |
| Median Household Income | 725 | $30,094 |
| Mean Household Income | 725 | $47,641 |
| Income Deficit | 347 | $0 |
| Wage / Income Gap (%) | 1,523 | 2.57% |
| Wage / Income Gap ($) | 1,523 | 97.43¢ per $1 |
| Gini / Inequality Index | 1,523 | 0.50 |
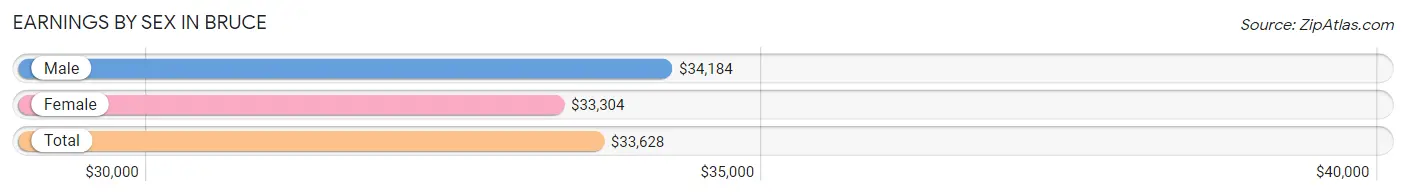
Earnings by Sex in Bruce
Average Earnings in Bruce are $33,628, $34,184 for men and $33,304 for women, a difference of 2.6%.
| Sex | Number | Average Earnings |
| Male | 252 (45.3%) | $34,184 |
| Female | 304 (54.7%) | $33,304 |
| Total | 556 (100.0%) | $33,628 |
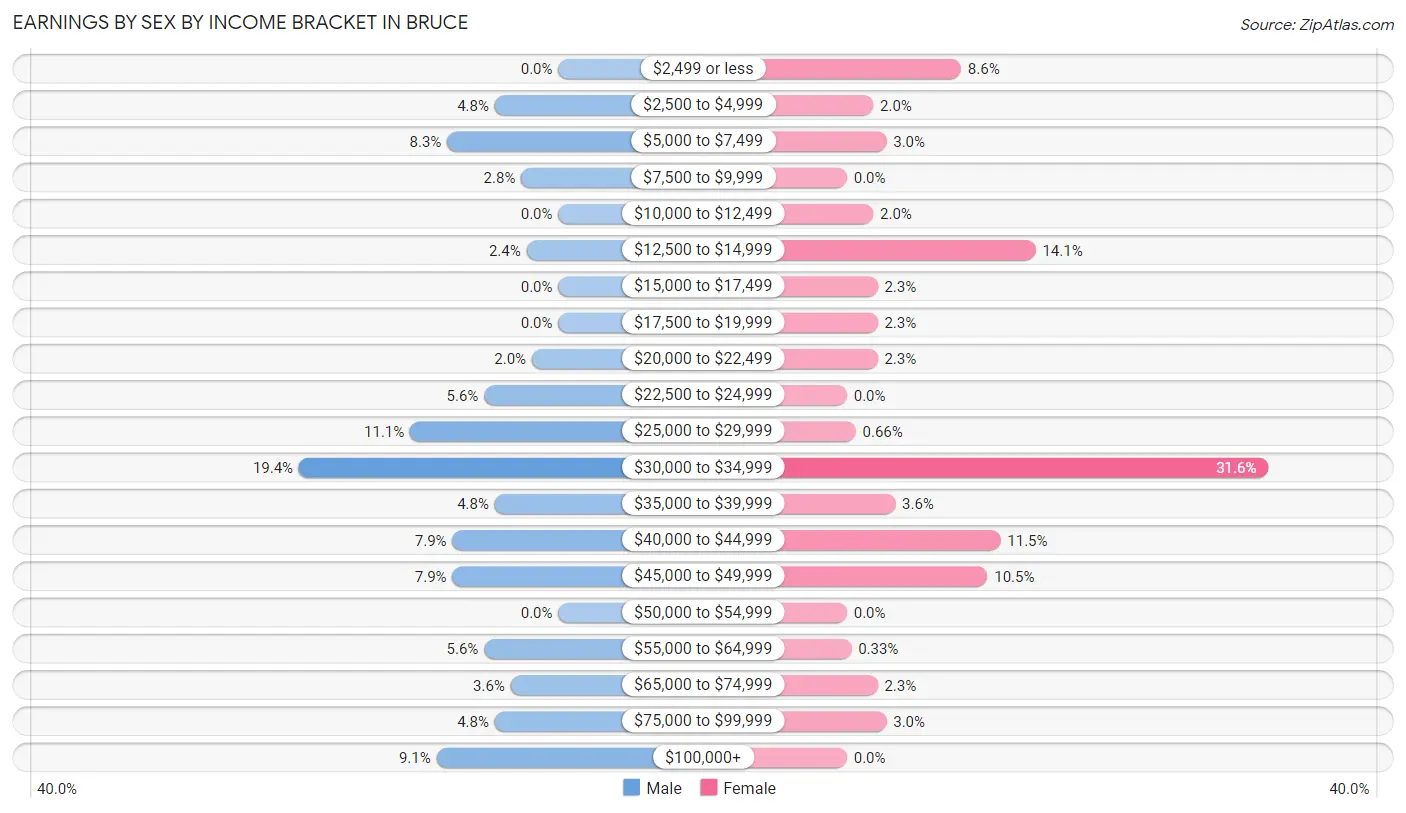
Earnings by Sex by Income Bracket in Bruce
The most common earnings brackets in Bruce are $30,000 to $34,999 for men (49 | 19.4%) and $30,000 to $34,999 for women (96 | 31.6%).
| Income | Male | Female |
| $2,499 or less | 0 (0.0%) | 26 (8.6%) |
| $2,500 to $4,999 | 12 (4.8%) | 6 (2.0%) |
| $5,000 to $7,499 | 21 (8.3%) | 9 (3.0%) |
| $7,500 to $9,999 | 7 (2.8%) | 0 (0.0%) |
| $10,000 to $12,499 | 0 (0.0%) | 6 (2.0%) |
| $12,500 to $14,999 | 6 (2.4%) | 43 (14.1%) |
| $15,000 to $17,499 | 0 (0.0%) | 7 (2.3%) |
| $17,500 to $19,999 | 0 (0.0%) | 7 (2.3%) |
| $20,000 to $22,499 | 5 (2.0%) | 7 (2.3%) |
| $22,500 to $24,999 | 14 (5.6%) | 0 (0.0%) |
| $25,000 to $29,999 | 28 (11.1%) | 2 (0.7%) |
| $30,000 to $34,999 | 49 (19.4%) | 96 (31.6%) |
| $35,000 to $39,999 | 12 (4.8%) | 11 (3.6%) |
| $40,000 to $44,999 | 20 (7.9%) | 35 (11.5%) |
| $45,000 to $49,999 | 20 (7.9%) | 32 (10.5%) |
| $50,000 to $54,999 | 0 (0.0%) | 0 (0.0%) |
| $55,000 to $64,999 | 14 (5.6%) | 1 (0.3%) |
| $65,000 to $74,999 | 9 (3.6%) | 7 (2.3%) |
| $75,000 to $99,999 | 12 (4.8%) | 9 (3.0%) |
| $100,000+ | 23 (9.1%) | 0 (0.0%) |
| Total | 252 (100.0%) | 304 (100.0%) |
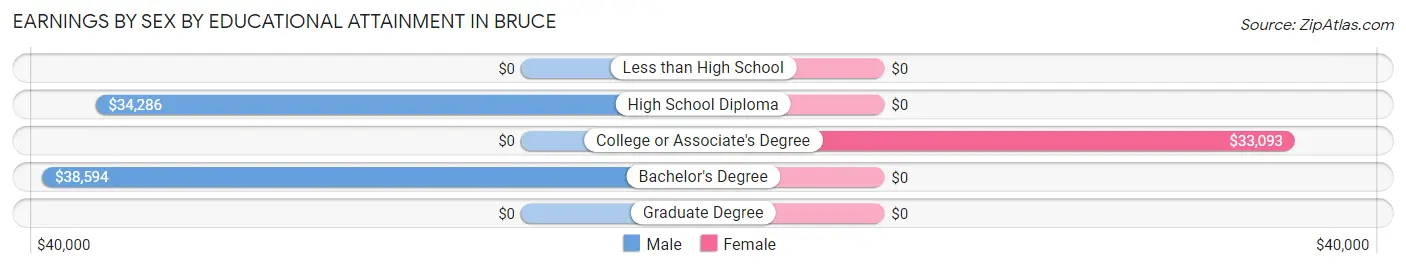
Earnings by Sex by Educational Attainment in Bruce
Average earnings in Bruce are $34,694 for men and $33,545 for women, a difference of 3.3%. Men with an educational attainment of bachelor's degree enjoy the highest average annual earnings of $38,594, while those with high school diploma education earn the least with $34,286. Women with an educational attainment of college or associate's degree earn the most with the average annual earnings of $33,093, while those with college or associate's degree education have the smallest earnings of $33,093.
| Educational Attainment | Male Income | Female Income |
| Less than High School | - | - |
| High School Diploma | $34,286 | $0 |
| College or Associate's Degree | - | - |
| Bachelor's Degree | $38,594 | $0 |
| Graduate Degree | - | - |
| Total | $34,694 | $33,545 |
Family Income in Bruce
Family Income Brackets in Bruce
According to the Bruce family income data, there are 102 families falling into the $50,000 to $74,999 income range, which is the most common income bracket and makes up 29.4% of all families. Conversely, the $150,000 to $199,999 income bracket is the least frequent group with only 3 families (0.9%) belonging to this category.
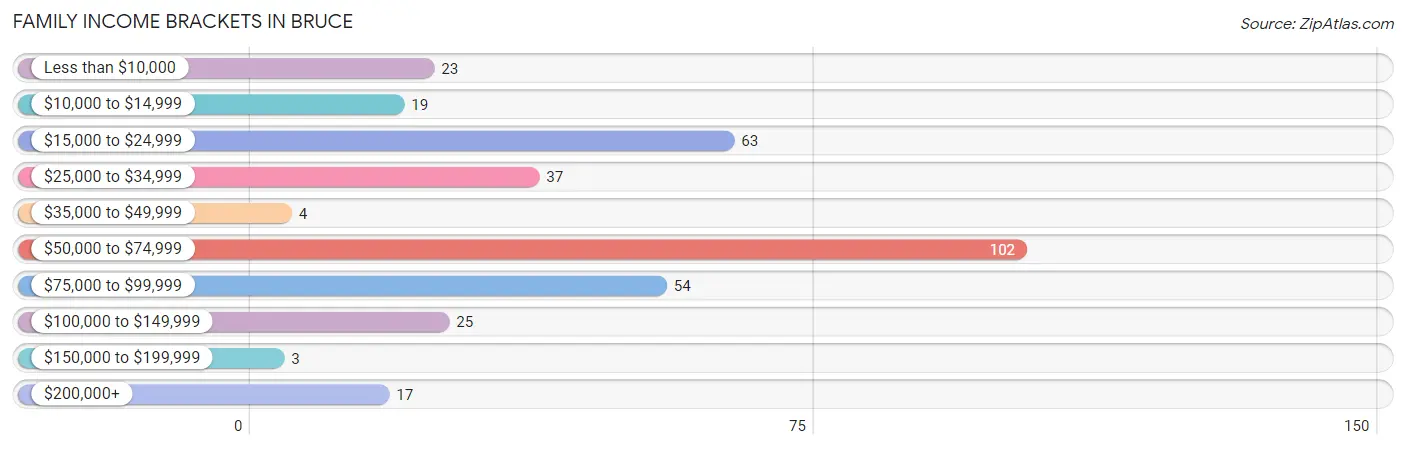
| Income Bracket | # Families | % Families |
| Less than $10,000 | 23 | 6.6% |
| $10,000 to $14,999 | 19 | 5.5% |
| $15,000 to $24,999 | 63 | 18.2% |
| $25,000 to $34,999 | 37 | 10.7% |
| $35,000 to $49,999 | 4 | 1.2% |
| $50,000 to $74,999 | 102 | 29.4% |
| $75,000 to $99,999 | 54 | 15.6% |
| $100,000 to $149,999 | 25 | 7.2% |
| $150,000 to $199,999 | 3 | 0.9% |
| $200,000+ | 17 | 4.9% |
Family Income by Famaliy Size in Bruce
4-person families (92 | 26.5%) account for the highest median family income in Bruce with $68,837 per family, while 2-person families (140 | 40.4%) have the highest median income of $19,688 per family member.
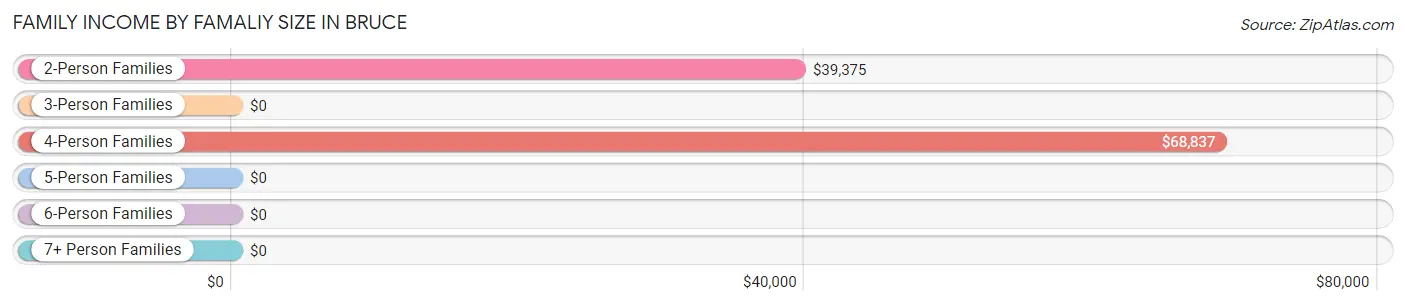
| Income Bracket | # Families | Median Income |
| 2-Person Families | 140 (40.4%) | $39,375 |
| 3-Person Families | 98 (28.2%) | $0 |
| 4-Person Families | 92 (26.5%) | $68,837 |
| 5-Person Families | 17 (4.9%) | $0 |
| 6-Person Families | 0 (0.0%) | $0 |
| 7+ Person Families | 0 (0.0%) | $0 |
| Total | 347 (100.0%) | $65,089 |
Family Income by Number of Earners in Bruce
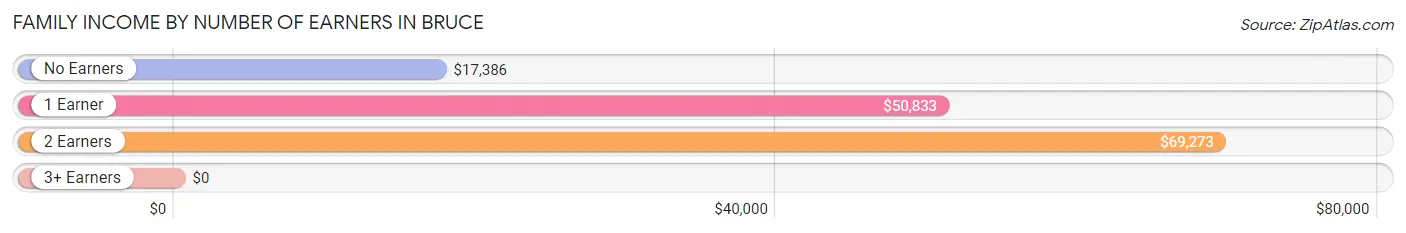
| Number of Earners | # Families | Median Income |
| No Earners | 81 (23.3%) | $17,386 |
| 1 Earner | 132 (38.0%) | $50,833 |
| 2 Earners | 119 (34.3%) | $69,273 |
| 3+ Earners | 15 (4.3%) | $0 |
| Total | 347 (100.0%) | $65,089 |
Household Income in Bruce
Household Income Brackets in Bruce
With 147 households falling in the category, the $15,000 to $24,999 income range is the most frequent in Bruce, accounting for 20.3% of all households. In contrast, only 3 households (0.4%) fall into the $150,000 to $199,999 income bracket, making it the least populous group.
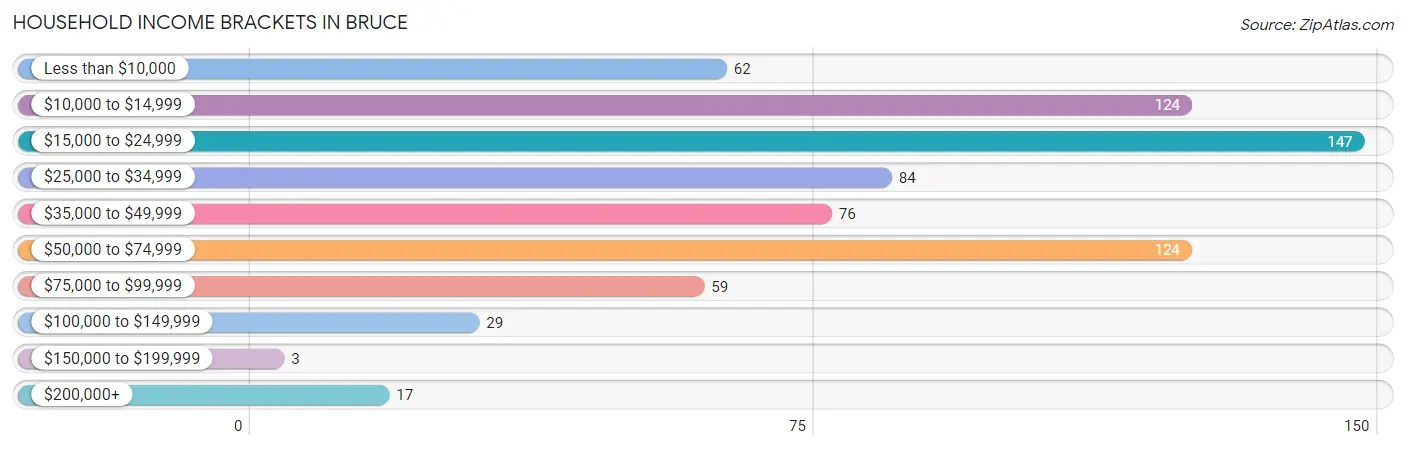
| Income Bracket | # Households | % Households |
| Less than $10,000 | 62 | 8.6% |
| $10,000 to $14,999 | 124 | 17.1% |
| $15,000 to $24,999 | 147 | 20.3% |
| $25,000 to $34,999 | 84 | 11.6% |
| $35,000 to $49,999 | 76 | 10.5% |
| $50,000 to $74,999 | 124 | 17.1% |
| $75,000 to $99,999 | 59 | 8.1% |
| $100,000 to $149,999 | 29 | 4.0% |
| $150,000 to $199,999 | 3 | 0.4% |
| $200,000+ | 17 | 2.3% |
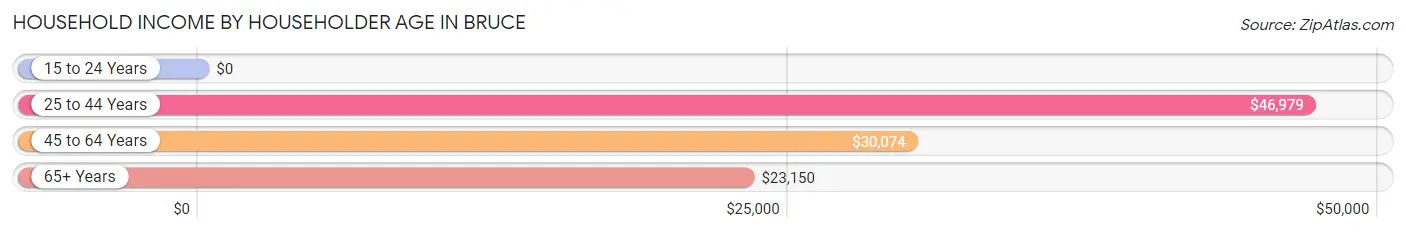
Household Income by Householder Age in Bruce
The median household income in Bruce is $30,094, with the highest median household income of $46,979 found in the 25 to 44 years age bracket for the primary householder. A total of 187 households (25.8%) fall into this category. Meanwhile, the 15 to 24 years age bracket for the primary householder has the lowest median household income of $0, with 22 households (3.0%) in this group.
| Income Bracket | # Households | Median Income |
| 15 to 24 Years | 22 (3.0%) | $0 |
| 25 to 44 Years | 187 (25.8%) | $46,979 |
| 45 to 64 Years | 277 (38.2%) | $30,074 |
| 65+ Years | 239 (33.0%) | $23,150 |
| Total | 725 (100.0%) | $30,094 |
Poverty in Bruce
Income Below Poverty by Sex and Age in Bruce
With 20.4% poverty level for males and 36.8% for females among the residents of Bruce, 5 year old males and 45 to 54 year old females are the most vulnerable to poverty, with 9 males (100.0%) and 31 females (45.6%) in their respective age groups living below the poverty level.
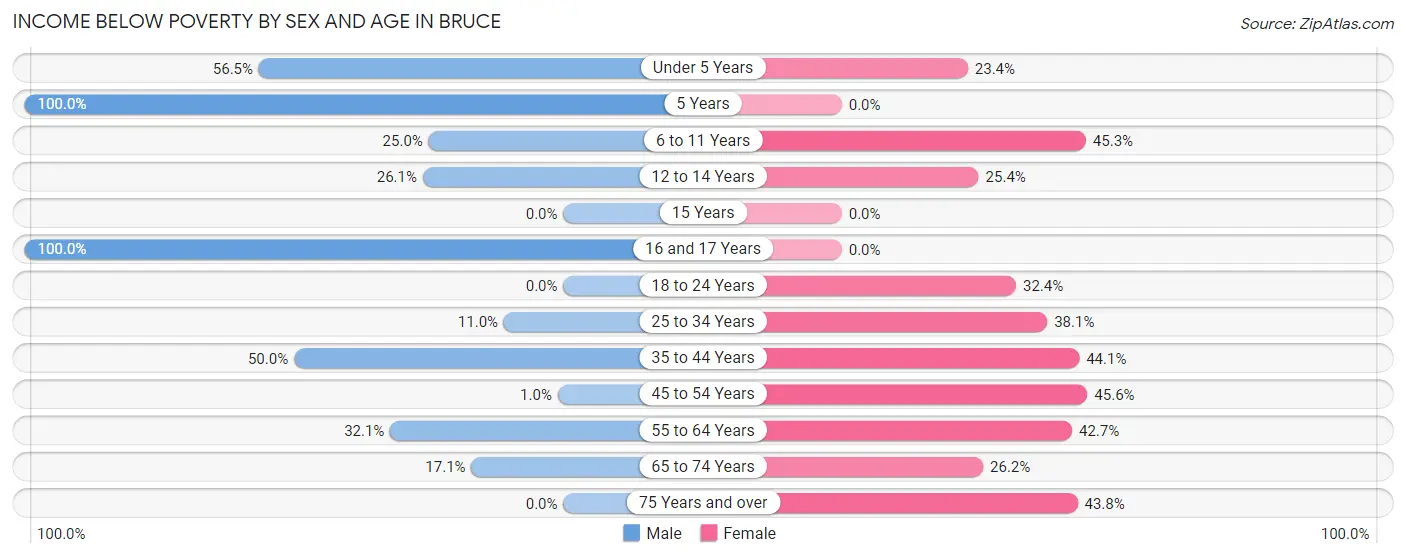
| Age Bracket | Male | Female |
| Under 5 Years | 13 (56.5%) | 22 (23.4%) |
| 5 Years | 9 (100.0%) | 0 (0.0%) |
| 6 to 11 Years | 20 (25.0%) | 29 (45.3%) |
| 12 to 14 Years | 12 (26.1%) | 16 (25.4%) |
| 15 Years | 0 (0.0%) | 0 (0.0%) |
| 16 and 17 Years | 8 (100.0%) | 0 (0.0%) |
| 18 to 24 Years | 0 (0.0%) | 11 (32.4%) |
| 25 to 34 Years | 15 (11.0%) | 53 (38.1%) |
| 35 to 44 Years | 37 (50.0%) | 26 (44.1%) |
| 45 to 54 Years | 1 (1.0%) | 31 (45.6%) |
| 55 to 64 Years | 18 (32.1%) | 53 (42.7%) |
| 65 to 74 Years | 7 (17.1%) | 16 (26.2%) |
| 75 Years and over | 0 (0.0%) | 49 (43.8%) |
| Total | 140 (20.4%) | 306 (36.8%) |
Income Above Poverty by Sex and Age in Bruce
According to the poverty statistics in Bruce, males aged 15 years and females aged 16 and 17 years are the age groups that are most secure financially, with 100.0% of males and 100.0% of females in these age groups living above the poverty line.
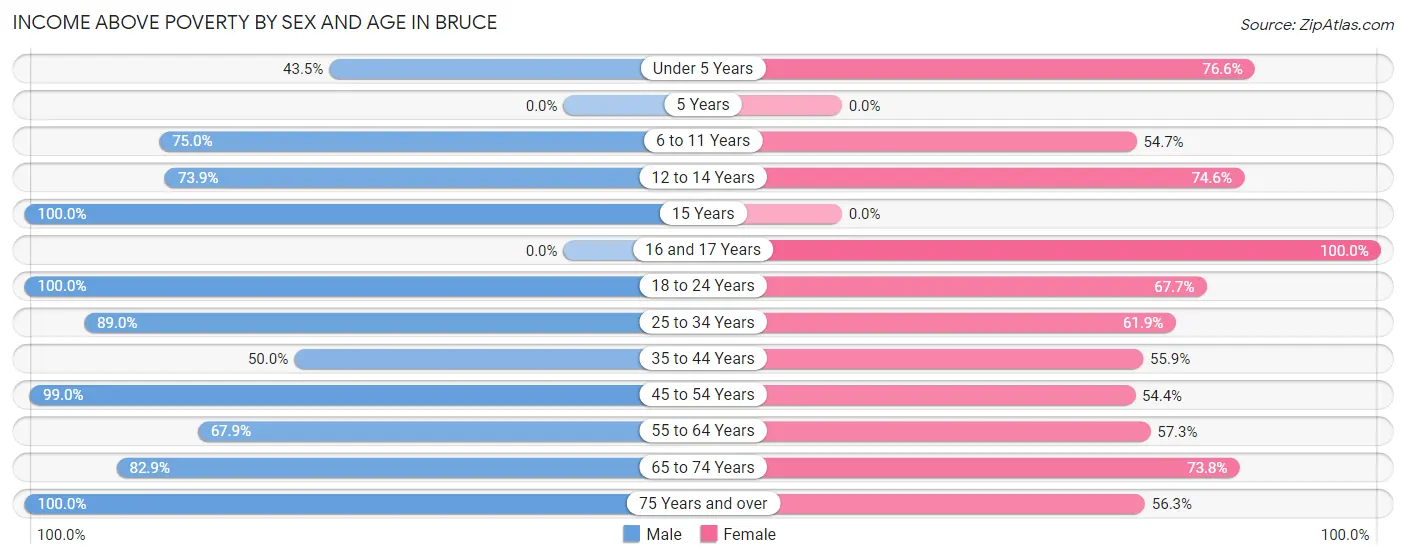
| Age Bracket | Male | Female |
| Under 5 Years | 10 (43.5%) | 72 (76.6%) |
| 5 Years | 0 (0.0%) | 0 (0.0%) |
| 6 to 11 Years | 60 (75.0%) | 35 (54.7%) |
| 12 to 14 Years | 34 (73.9%) | 47 (74.6%) |
| 15 Years | 11 (100.0%) | 0 (0.0%) |
| 16 and 17 Years | 0 (0.0%) | 14 (100.0%) |
| 18 to 24 Years | 31 (100.0%) | 23 (67.6%) |
| 25 to 34 Years | 121 (89.0%) | 86 (61.9%) |
| 35 to 44 Years | 37 (50.0%) | 33 (55.9%) |
| 45 to 54 Years | 95 (99.0%) | 37 (54.4%) |
| 55 to 64 Years | 38 (67.9%) | 71 (57.3%) |
| 65 to 74 Years | 34 (82.9%) | 45 (73.8%) |
| 75 Years and over | 74 (100.0%) | 63 (56.2%) |
| Total | 545 (79.6%) | 526 (63.2%) |
Income Below Poverty Among Married-Couple Families in Bruce
The poverty statistics for married-couple families in Bruce show that 14.9% or 27 of the total 181 families live below the poverty line. Families with 1 or 2 children have the highest poverty rate of 18.8%, comprising of 19 families. On the other hand, families with no children have the lowest poverty rate of 10.0%, which includes 8 families.
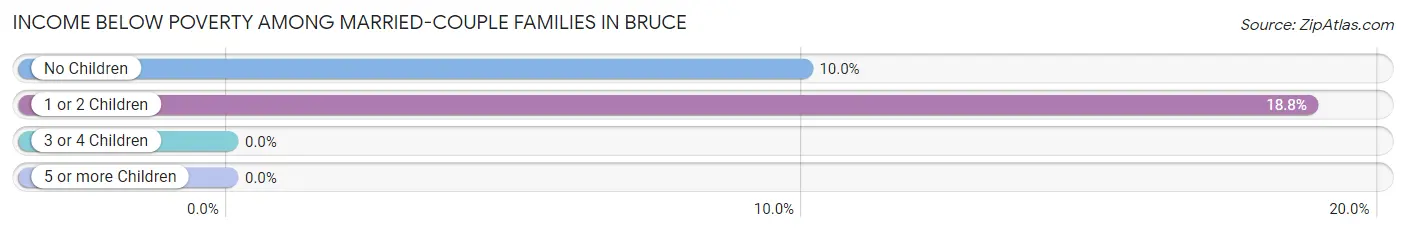
| Children | Above Poverty | Below Poverty |
| No Children | 72 (90.0%) | 8 (10.0%) |
| 1 or 2 Children | 82 (81.2%) | 19 (18.8%) |
| 3 or 4 Children | 0 (0.0%) | 0 (0.0%) |
| 5 or more Children | 0 (0.0%) | 0 (0.0%) |
| Total | 154 (85.1%) | 27 (14.9%) |
Income Below Poverty Among Single-Parent Households in Bruce
According to the poverty data in Bruce, 45.0% or 18 single-father households and 38.1% or 48 single-mother households are living below the poverty line. Among single-father households, those with 1 or 2 children have the highest poverty rate, with 18 households (69.2%) experiencing poverty. Likewise, among single-mother households, those with 1 or 2 children have the highest poverty rate, with 35 households (52.2%) falling below the poverty line.
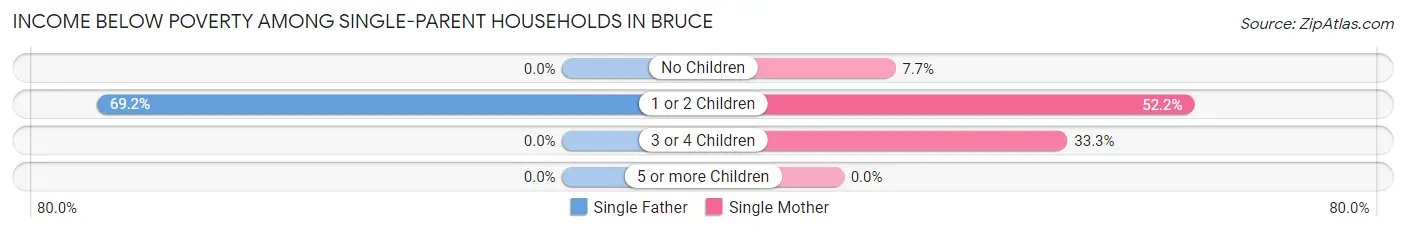
| Children | Single Father | Single Mother |
| No Children | 0 (0.0%) | 2 (7.7%) |
| 1 or 2 Children | 18 (69.2%) | 35 (52.2%) |
| 3 or 4 Children | 0 (0.0%) | 11 (33.3%) |
| 5 or more Children | 0 (0.0%) | 0 (0.0%) |
| Total | 18 (45.0%) | 48 (38.1%) |
Income Below Poverty Among Married-Couple vs Single-Parent Households in Bruce
The poverty data for Bruce shows that 27 of the married-couple family households (14.9%) and 66 of the single-parent households (39.8%) are living below the poverty level. Within the married-couple family households, those with 1 or 2 children have the highest poverty rate, with 19 households (18.8%) falling below the poverty line. Among the single-parent households, those with 1 or 2 children have the highest poverty rate, with 53 household (57.0%) living below poverty.
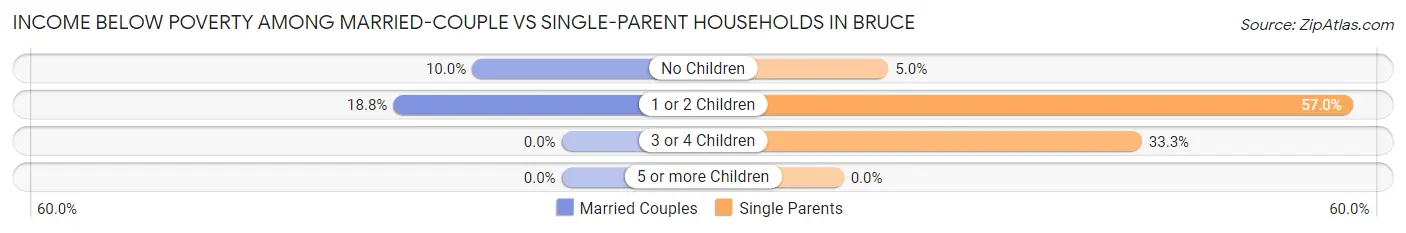
| Children | Married-Couple Families | Single-Parent Households |
| No Children | 8 (10.0%) | 2 (5.0%) |
| 1 or 2 Children | 19 (18.8%) | 53 (57.0%) |
| 3 or 4 Children | 0 (0.0%) | 11 (33.3%) |
| 5 or more Children | 0 (0.0%) | 0 (0.0%) |
| Total | 27 (14.9%) | 66 (39.8%) |
Race in Bruce
The most populous races in Bruce are Black / African American (742 | 48.7%), White / Caucasian (724 | 47.5%), and Two or more Races (57 | 3.7%).
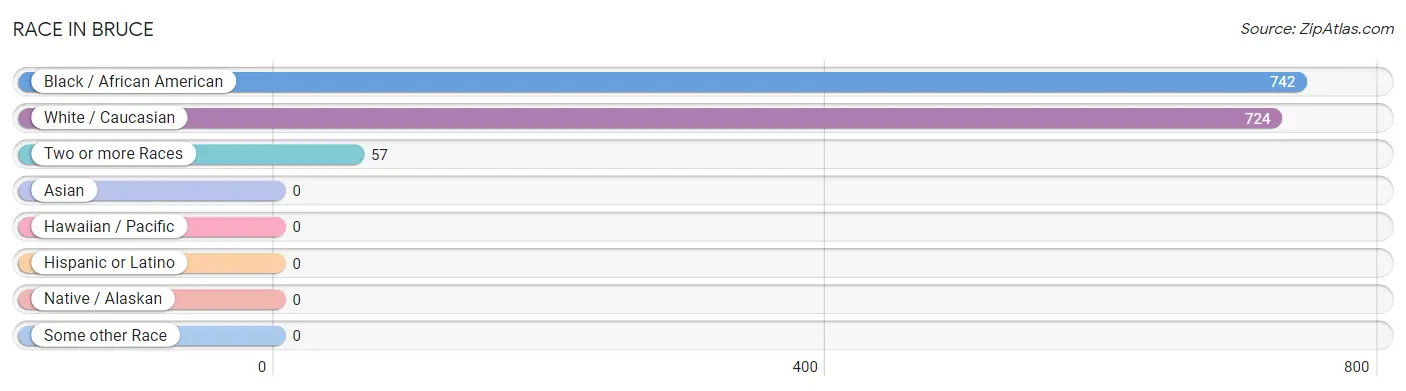
| Race | # Population | % Population |
| Asian | 0 | 0.0% |
| Black / African American | 742 | 48.7% |
| Hawaiian / Pacific | 0 | 0.0% |
| Hispanic or Latino | 0 | 0.0% |
| Native / Alaskan | 0 | 0.0% |
| White / Caucasian | 724 | 47.5% |
| Two or more Races | 57 | 3.7% |
| Some other Race | 0 | 0.0% |
| Total | 1,523 | 100.0% |
Ancestry in Bruce
The most populous ancestries reported in Bruce are American (276 | 18.1%), English (193 | 12.7%), Irish (45 | 2.9%), Cherokee (27 | 1.8%), and German (25 | 1.6%), together accounting for 37.2% of all Bruce residents.
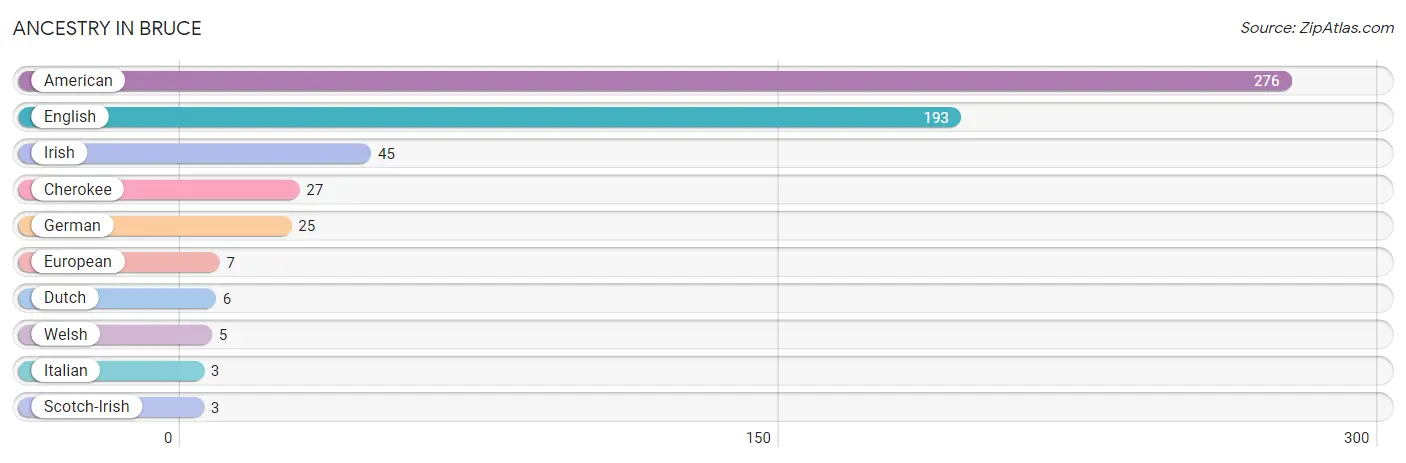
| Ancestry | # Population | % Population |
| American | 276 | 18.1% |
| Cherokee | 27 | 1.8% |
| Dutch | 6 | 0.4% |
| English | 193 | 12.7% |
| European | 7 | 0.5% |
| German | 25 | 1.6% |
| Irish | 45 | 2.9% |
| Italian | 3 | 0.2% |
| Scotch-Irish | 3 | 0.2% |
| Welsh | 5 | 0.3% | View All 10 Rows |
Immigrants in Bruce

| Immigration Origin | # Population | % Population | View All 0 Rows |
Sex and Age in Bruce
Sex and Age in Bruce
The most populous age groups in Bruce are 25 to 29 Years (112 | 16.2%) for men and Under 5 Years (94 | 11.3%) for women.
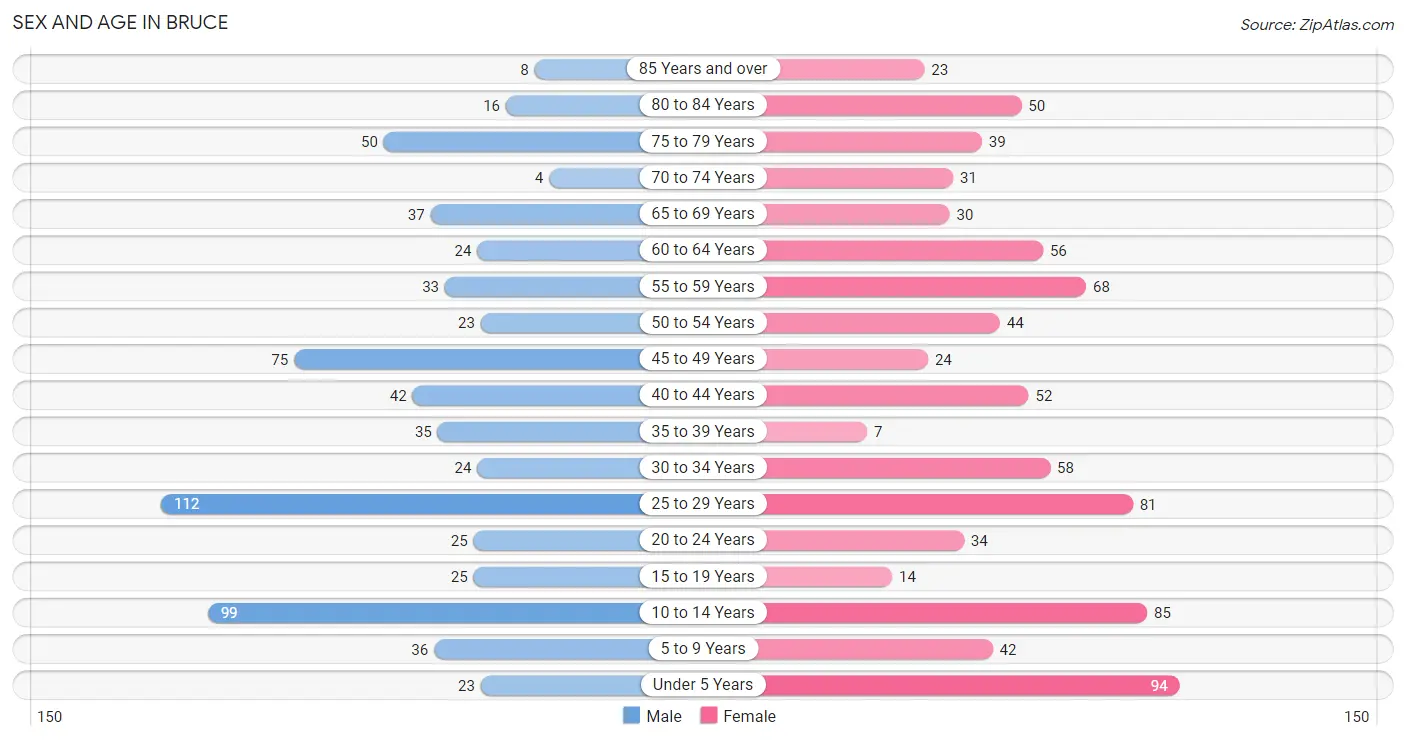
| Age Bracket | Male | Female |
| Under 5 Years | 23 (3.3%) | 94 (11.3%) |
| 5 to 9 Years | 36 (5.2%) | 42 (5.1%) |
| 10 to 14 Years | 99 (14.3%) | 85 (10.2%) |
| 15 to 19 Years | 25 (3.6%) | 14 (1.7%) |
| 20 to 24 Years | 25 (3.6%) | 34 (4.1%) |
| 25 to 29 Years | 112 (16.2%) | 81 (9.7%) |
| 30 to 34 Years | 24 (3.5%) | 58 (7.0%) |
| 35 to 39 Years | 35 (5.1%) | 7 (0.8%) |
| 40 to 44 Years | 42 (6.1%) | 52 (6.2%) |
| 45 to 49 Years | 75 (10.8%) | 24 (2.9%) |
| 50 to 54 Years | 23 (3.3%) | 44 (5.3%) |
| 55 to 59 Years | 33 (4.8%) | 68 (8.2%) |
| 60 to 64 Years | 24 (3.5%) | 56 (6.7%) |
| 65 to 69 Years | 37 (5.3%) | 30 (3.6%) |
| 70 to 74 Years | 4 (0.6%) | 31 (3.7%) |
| 75 to 79 Years | 50 (7.2%) | 39 (4.7%) |
| 80 to 84 Years | 16 (2.3%) | 50 (6.0%) |
| 85 Years and over | 8 (1.2%) | 23 (2.8%) |
| Total | 691 (100.0%) | 832 (100.0%) |
Families and Households in Bruce
Median Family Size in Bruce
The median family size in Bruce is 3.09 persons per family, with single female/mother families (126 | 36.3%) accounting for the largest median family size of 3.29 persons per family. On the other hand, single male/father families (40 | 11.5%) represent the smallest median family size with 2.03 persons per family.
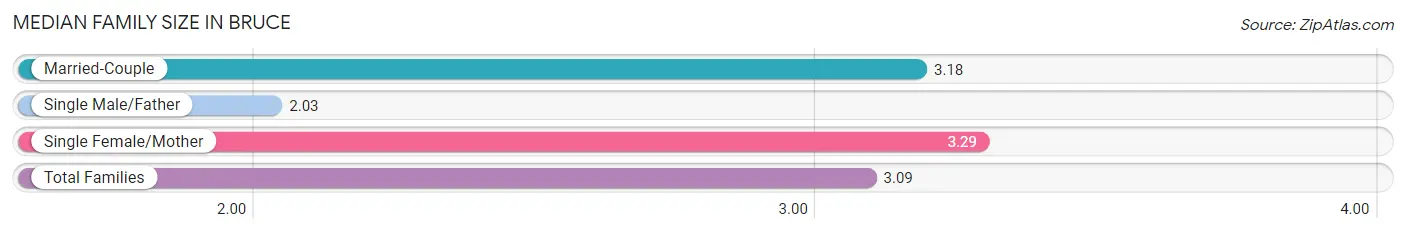
| Family Type | # Families | Family Size |
| Married-Couple | 181 (52.2%) | 3.18 |
| Single Male/Father | 40 (11.5%) | 2.03 |
| Single Female/Mother | 126 (36.3%) | 3.29 |
| Total Families | 347 (100.0%) | 3.09 |
Median Household Size in Bruce
The median household size in Bruce is 2.06 persons per household, with single female/mother households (126 | 17.4%) accounting for the largest median household size of 3.4 persons per household. non-family households (378 | 52.1%) represent the smallest median household size with 1.02 persons per household.
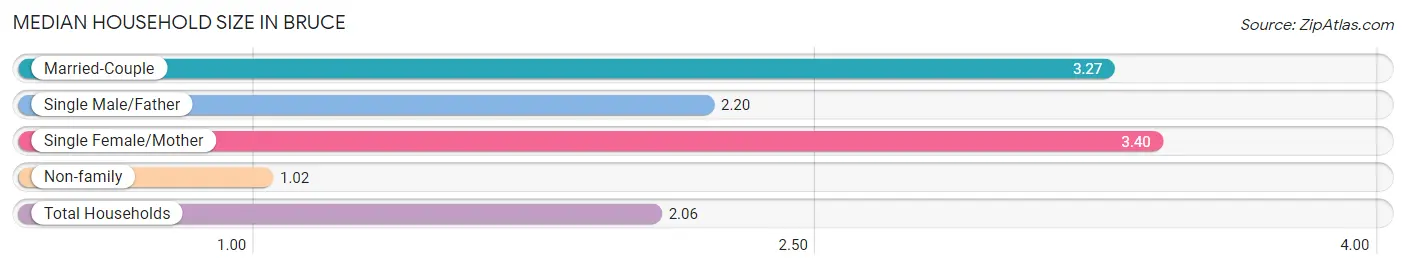
| Household Type | # Households | Household Size |
| Married-Couple | 181 (25.0%) | 3.27 |
| Single Male/Father | 40 (5.5%) | 2.20 |
| Single Female/Mother | 126 (17.4%) | 3.40 |
| Non-family | 378 (52.1%) | 1.02 |
| Total Households | 725 (100.0%) | 2.06 |
Household Size by Marriage Status in Bruce
Out of a total of 725 households in Bruce, 347 (47.9%) are family households, while 378 (52.1%) are nonfamily households. The most numerous type of family households are 2-person households, comprising 129, and the most common type of nonfamily households are 1-person households, comprising 368.
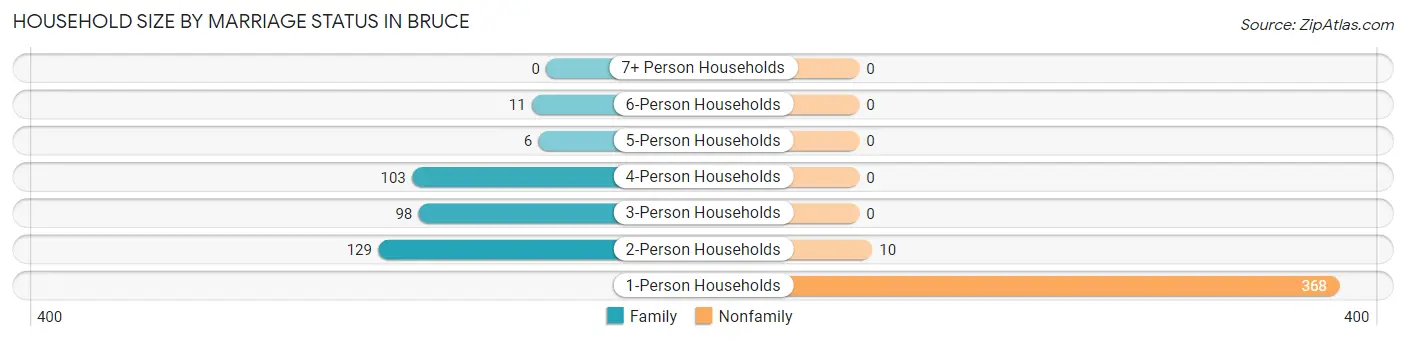
| Household Size | Family Households | Nonfamily Households |
| 1-Person Households | - | 368 (50.8%) |
| 2-Person Households | 129 (17.8%) | 10 (1.4%) |
| 3-Person Households | 98 (13.5%) | 0 (0.0%) |
| 4-Person Households | 103 (14.2%) | 0 (0.0%) |
| 5-Person Households | 6 (0.8%) | 0 (0.0%) |
| 6-Person Households | 11 (1.5%) | 0 (0.0%) |
| 7+ Person Households | 0 (0.0%) | 0 (0.0%) |
| Total | 347 (47.9%) | 378 (52.1%) |
Female Fertility in Bruce
Fertility by Age in Bruce
| Age Bracket | Women with Births | Births / 1,000 Women |
| 15 to 19 years | 0 (0.0%) | 0.0 |
| 20 to 34 years | 0 (0.0%) | 0.0 |
| 35 to 50 years | 0 (0.0%) | 0.0 |
| Total | 0 (0.0%) | 0.0 |
Fertility by Age by Marriage Status in Bruce
| Age Bracket | Married | Unmarried |
| 15 to 19 years | 0 (0.0%) | 0 (0.0%) |
| 20 to 34 years | 0 (0.0%) | 0 (0.0%) |
| 35 to 50 years | 0 (0.0%) | 0 (0.0%) |
| Total | 0 (0.0%) | 0 (0.0%) |
Fertility by Education in Bruce
| Educational Attainment | Women with Births | Births / 1,000 Women |
| Less than High School | 0 (0.0%) | 0.0 |
| High School Diploma | 0 (0.0%) | 0.0 |
| College or Associate's Degree | 0 (0.0%) | 0.0 |
| Bachelor's Degree | 0 (0.0%) | 0.0 |
| Graduate Degree | 0 (0.0%) | 0.0 |
| Total | 0 (0.0%) | 0.0 |
Fertility by Education by Marriage Status in Bruce
| Educational Attainment | Married | Unmarried |
| Less than High School | 0 (0.0%) | 0 (0.0%) |
| High School Diploma | 0 (0.0%) | 0 (0.0%) |
| College or Associate's Degree | 0 (0.0%) | 0 (0.0%) |
| Bachelor's Degree | 0 (0.0%) | 0 (0.0%) |
| Graduate Degree | 0 (0.0%) | 0 (0.0%) |
| Total | 0 (0.0%) | 0 (0.0%) |
Employment Characteristics in Bruce
Employment by Class of Employer in Bruce
Among the 501 employed individuals in Bruce, private company employees (317 | 63.3%), self-employed (not incorporated) (71 | 14.2%), and state government employees (38 | 7.6%) make up the most common classes of employment.
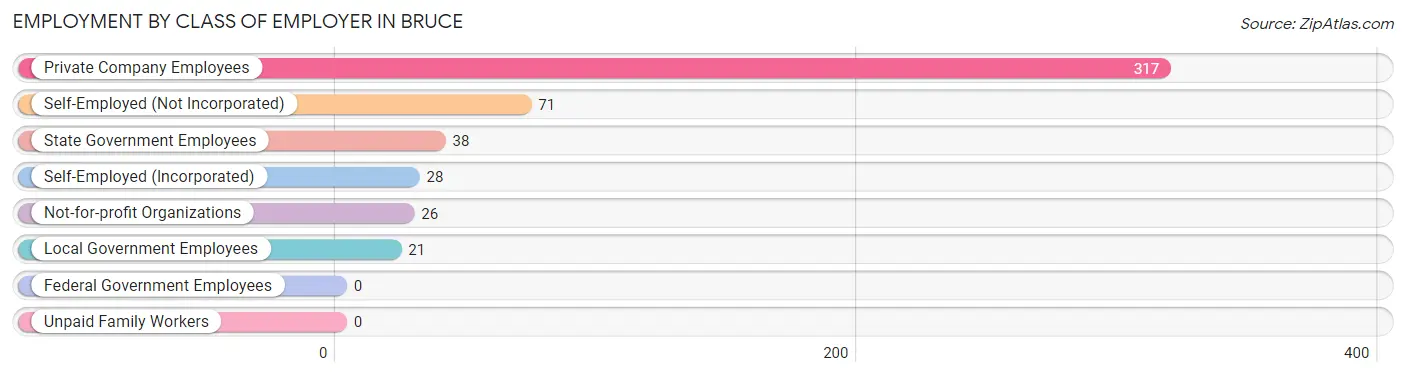
| Employer Class | # Employees | % Employees |
| Private Company Employees | 317 | 63.3% |
| Self-Employed (Incorporated) | 28 | 5.6% |
| Self-Employed (Not Incorporated) | 71 | 14.2% |
| Not-for-profit Organizations | 26 | 5.2% |
| Local Government Employees | 21 | 4.2% |
| State Government Employees | 38 | 7.6% |
| Federal Government Employees | 0 | 0.0% |
| Unpaid Family Workers | 0 | 0.0% |
| Total | 501 | 100.0% |
Employment Status by Age in Bruce
According to the labor force statistics for Bruce, out of the total population over 16 years of age (1,133), 45.7% or 518 individuals are in the labor force, with 3.3% or 17 of them unemployed. The age group with the highest labor force participation rate is 20 to 24 years, with 89.8% or 53 individuals in the labor force. Within the labor force, the 45 to 54 years age range has the highest percentage of unemployed individuals, with 12.5% or 12 of them being unemployed.
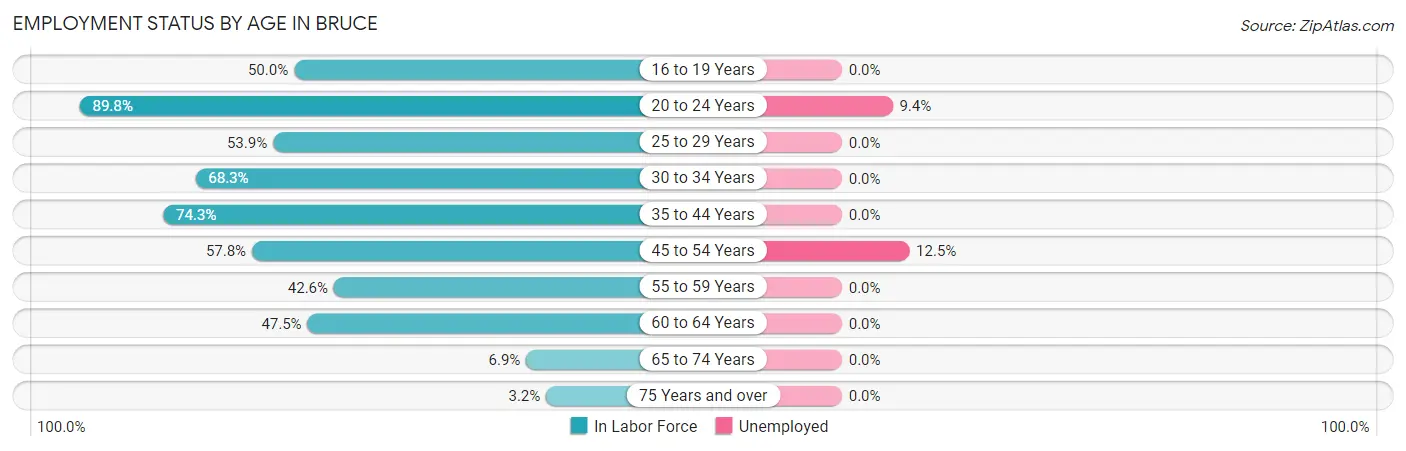
| Age Bracket | In Labor Force | Unemployed |
| 16 to 19 Years | 14 (50.0%) | 0 (0.0%) |
| 20 to 24 Years | 53 (89.8%) | 5 (9.4%) |
| 25 to 29 Years | 104 (53.9%) | 0 (0.0%) |
| 30 to 34 Years | 56 (68.3%) | 0 (0.0%) |
| 35 to 44 Years | 101 (74.3%) | 0 (0.0%) |
| 45 to 54 Years | 96 (57.8%) | 12 (12.5%) |
| 55 to 59 Years | 43 (42.6%) | 0 (0.0%) |
| 60 to 64 Years | 38 (47.5%) | 0 (0.0%) |
| 65 to 74 Years | 7 (6.9%) | 0 (0.0%) |
| 75 Years and over | 6 (3.2%) | 0 (0.0%) |
| Total | 518 (45.7%) | 17 (3.3%) |
Employment Status by Educational Attainment in Bruce
According to labor force statistics for Bruce, 57.8% of individuals (438) out of the total population between 25 and 64 years of age (758) are in the labor force, with 2.7% or 12 of them being unemployed. The group with the highest labor force participation rate are those with the educational attainment of bachelor's degree or higher, with 76.8% or 76 individuals in the labor force. Within the labor force, individuals with high school diploma education have the highest percentage of unemployment, with 11.1% or 10 of them being unemployed.
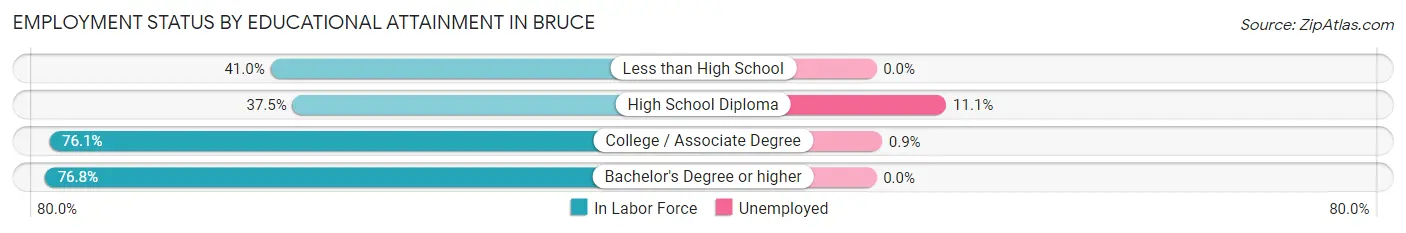
| Educational Attainment | In Labor Force | Unemployed |
| Less than High School | 55 (41.0%) | 0 (0.0%) |
| High School Diploma | 90 (37.5%) | 27 (11.1%) |
| College / Associate Degree | 217 (76.1%) | 3 (0.9%) |
| Bachelor's Degree or higher | 76 (76.8%) | 0 (0.0%) |
| Total | 438 (57.8%) | 20 (2.7%) |
Employment Occupations by Sex in Bruce
Management, Business, Science and Arts Occupations
The most common Management, Business, Science and Arts occupations in Bruce are Community & Social Service (51 | 10.2%), Health Diagnosing & Treating (29 | 5.8%), Education Instruction & Library (27 | 5.4%), Health Technologists (26 | 5.2%), and Management (19 | 3.8%).
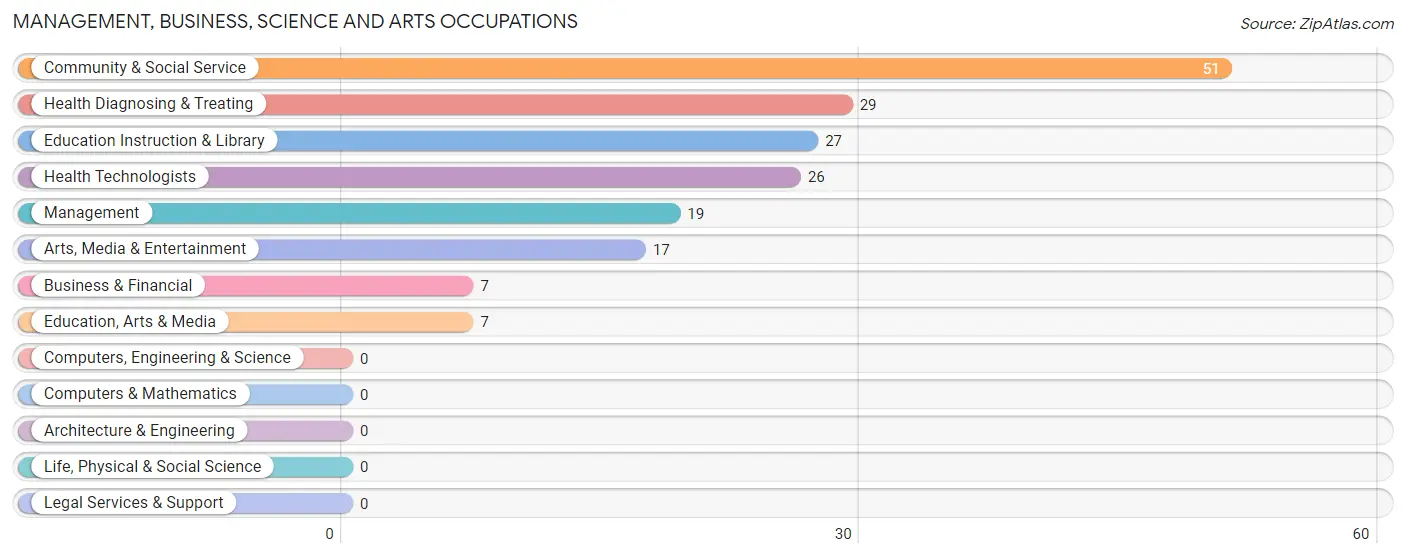
Management, Business, Science and Arts Occupations by Sex
Within the Management, Business, Science and Arts occupations in Bruce, the most male-oriented occupations are Management (100.0%), Health Technologists (34.6%), and Health Diagnosing & Treating (31.0%), while the most female-oriented occupations are Business & Financial (100.0%), Education, Arts & Media (100.0%), and Arts, Media & Entertainment (100.0%).
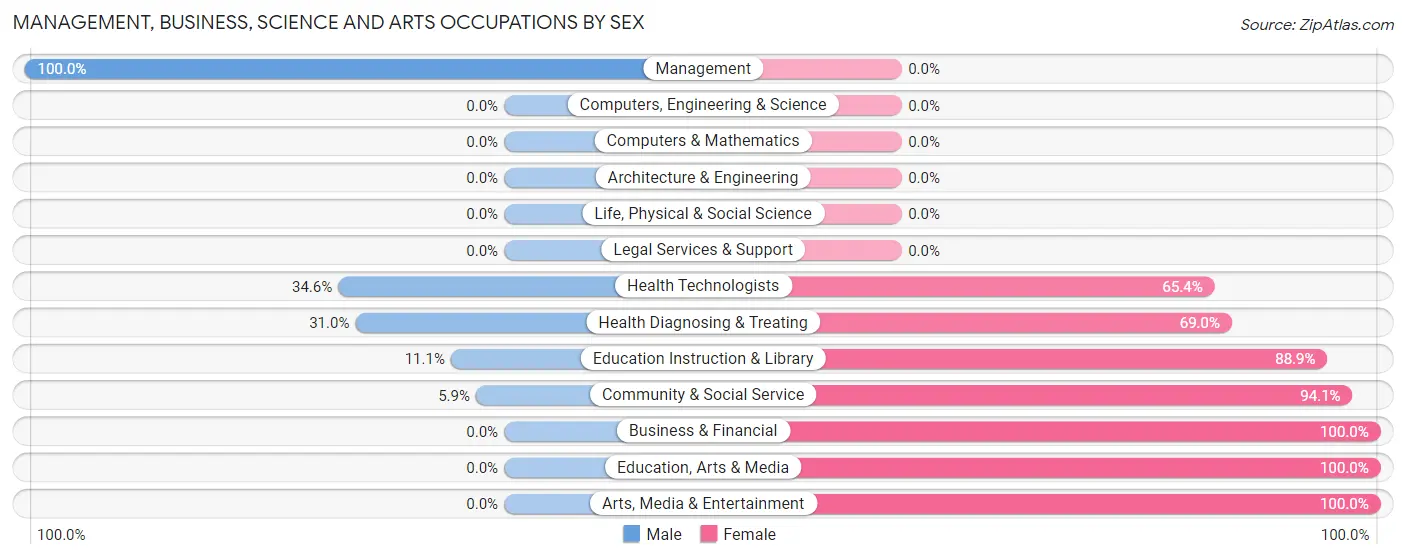
| Occupation | Male | Female |
| Management | 19 (100.0%) | 0 (0.0%) |
| Business & Financial | 0 (0.0%) | 7 (100.0%) |
| Computers, Engineering & Science | 0 (0.0%) | 0 (0.0%) |
| Computers & Mathematics | 0 (0.0%) | 0 (0.0%) |
| Architecture & Engineering | 0 (0.0%) | 0 (0.0%) |
| Life, Physical & Social Science | 0 (0.0%) | 0 (0.0%) |
| Community & Social Service | 3 (5.9%) | 48 (94.1%) |
| Education, Arts & Media | 0 (0.0%) | 7 (100.0%) |
| Legal Services & Support | 0 (0.0%) | 0 (0.0%) |
| Education Instruction & Library | 3 (11.1%) | 24 (88.9%) |
| Arts, Media & Entertainment | 0 (0.0%) | 17 (100.0%) |
| Health Diagnosing & Treating | 9 (31.0%) | 20 (69.0%) |
| Health Technologists | 9 (34.6%) | 17 (65.4%) |
| Total (Category) | 31 (29.2%) | 75 (70.8%) |
| Total (Overall) | 197 (39.3%) | 304 (60.7%) |
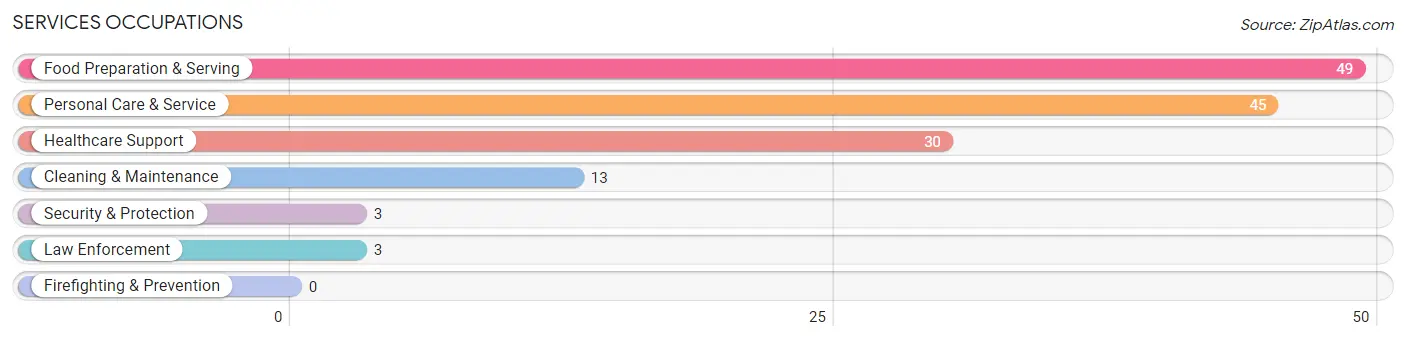
Services Occupations
The most common Services occupations in Bruce are Food Preparation & Serving (49 | 9.8%), Personal Care & Service (45 | 9.0%), Healthcare Support (30 | 6.0%), Cleaning & Maintenance (13 | 2.6%), and Security & Protection (3 | 0.6%).
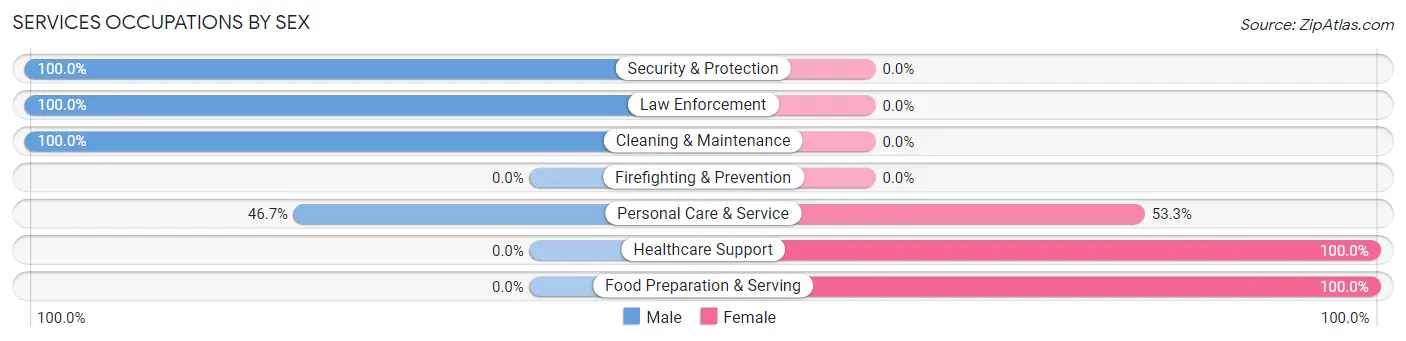
Services Occupations by Sex
Within the Services occupations in Bruce, the most male-oriented occupations are Security & Protection (100.0%), Law Enforcement (100.0%), and Cleaning & Maintenance (100.0%), while the most female-oriented occupations are Healthcare Support (100.0%), Food Preparation & Serving (100.0%), and Personal Care & Service (53.3%).
| Occupation | Male | Female |
| Healthcare Support | 0 (0.0%) | 30 (100.0%) |
| Security & Protection | 3 (100.0%) | 0 (0.0%) |
| Firefighting & Prevention | 0 (0.0%) | 0 (0.0%) |
| Law Enforcement | 3 (100.0%) | 0 (0.0%) |
| Food Preparation & Serving | 0 (0.0%) | 49 (100.0%) |
| Cleaning & Maintenance | 13 (100.0%) | 0 (0.0%) |
| Personal Care & Service | 21 (46.7%) | 24 (53.3%) |
| Total (Category) | 37 (26.4%) | 103 (73.6%) |
| Total (Overall) | 197 (39.3%) | 304 (60.7%) |
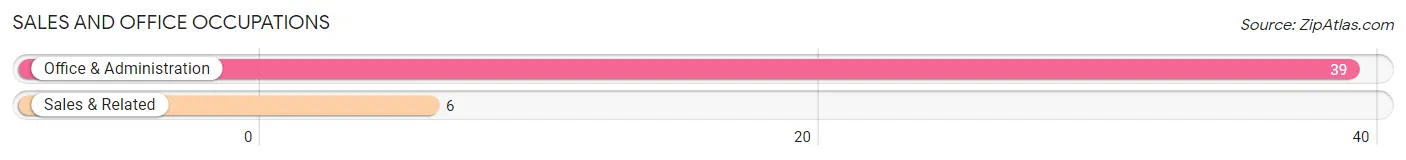
Sales and Office Occupations
The most common Sales and Office occupations in Bruce are Office & Administration (39 | 7.8%), and Sales & Related (6 | 1.2%).
Sales and Office Occupations by Sex

| Occupation | Male | Female |
| Sales & Related | 0 (0.0%) | 6 (100.0%) |
| Office & Administration | 8 (20.5%) | 31 (79.5%) |
| Total (Category) | 8 (17.8%) | 37 (82.2%) |
| Total (Overall) | 197 (39.3%) | 304 (60.7%) |
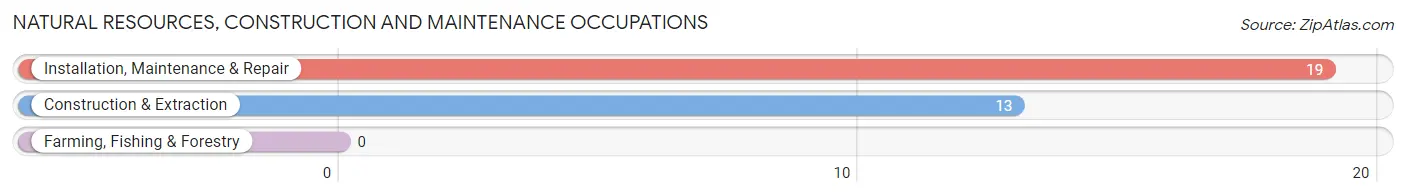
Natural Resources, Construction and Maintenance Occupations
The most common Natural Resources, Construction and Maintenance occupations in Bruce are Installation, Maintenance & Repair (19 | 3.8%), and Construction & Extraction (13 | 2.6%).
Natural Resources, Construction and Maintenance Occupations by Sex
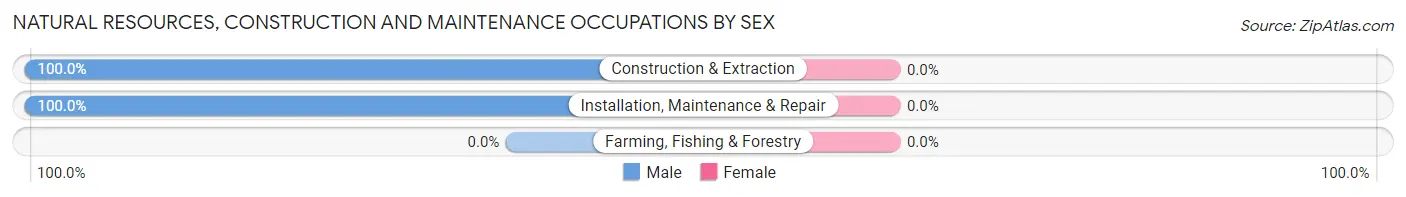
| Occupation | Male | Female |
| Farming, Fishing & Forestry | 0 (0.0%) | 0 (0.0%) |
| Construction & Extraction | 13 (100.0%) | 0 (0.0%) |
| Installation, Maintenance & Repair | 19 (100.0%) | 0 (0.0%) |
| Total (Category) | 32 (100.0%) | 0 (0.0%) |
| Total (Overall) | 197 (39.3%) | 304 (60.7%) |
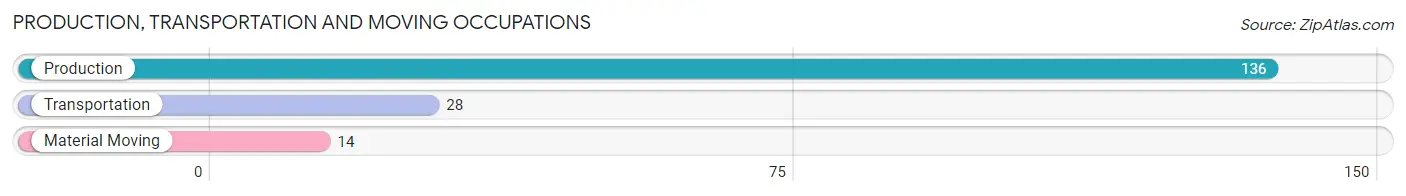
Production, Transportation and Moving Occupations
The most common Production, Transportation and Moving occupations in Bruce are Production (136 | 27.2%), Transportation (28 | 5.6%), and Material Moving (14 | 2.8%).
Production, Transportation and Moving Occupations by Sex
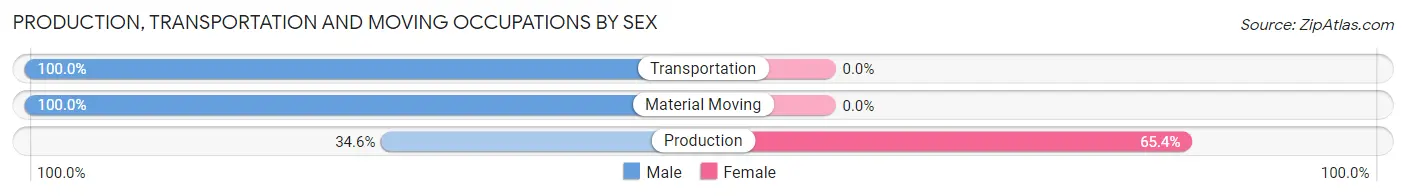
| Occupation | Male | Female |
| Production | 47 (34.6%) | 89 (65.4%) |
| Transportation | 28 (100.0%) | 0 (0.0%) |
| Material Moving | 14 (100.0%) | 0 (0.0%) |
| Total (Category) | 89 (50.0%) | 89 (50.0%) |
| Total (Overall) | 197 (39.3%) | 304 (60.7%) |
Employment Industries by Sex in Bruce
Employment Industries in Bruce
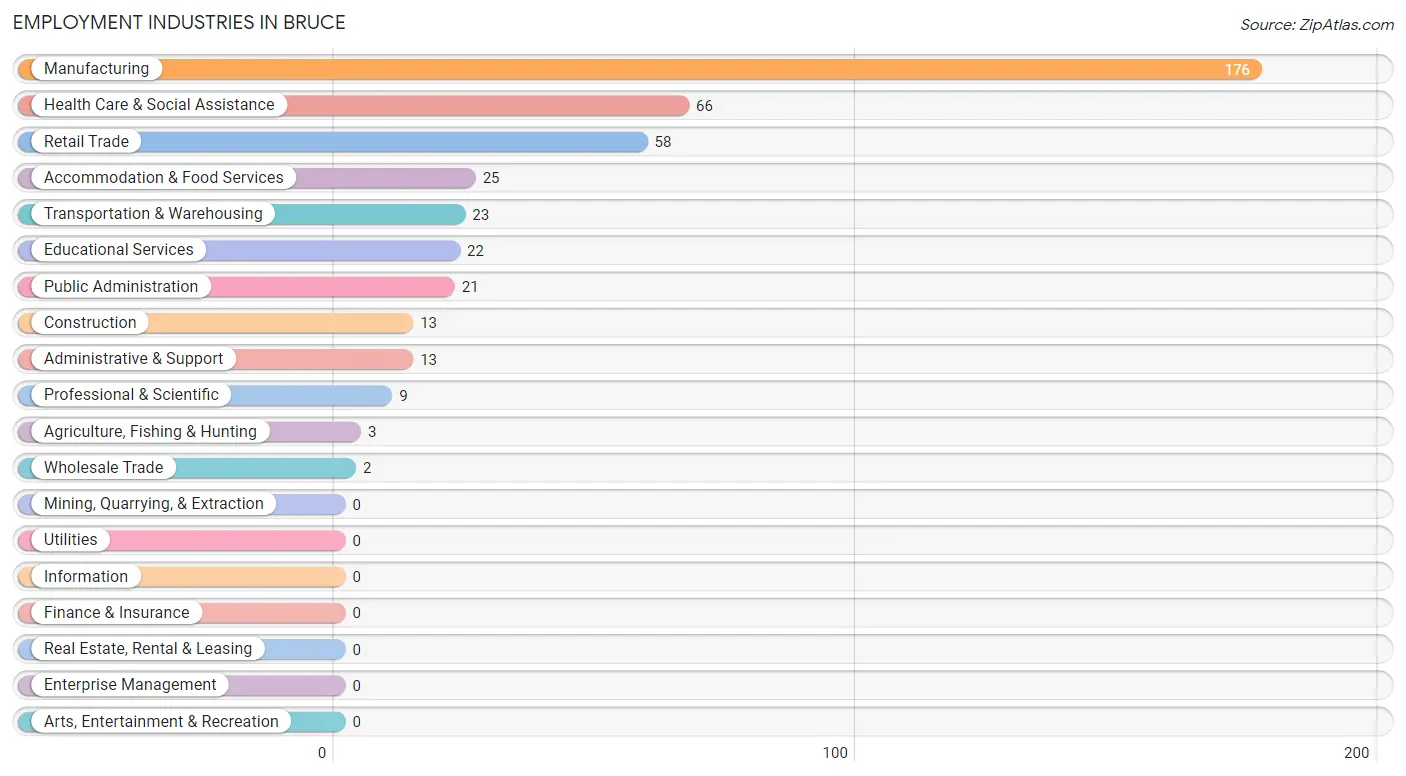
The major employment industries in Bruce include Manufacturing (176 | 35.1%), Health Care & Social Assistance (66 | 13.2%), Retail Trade (58 | 11.6%), Accommodation & Food Services (25 | 5.0%), and Transportation & Warehousing (23 | 4.6%).
Employment Industries by Sex in Bruce
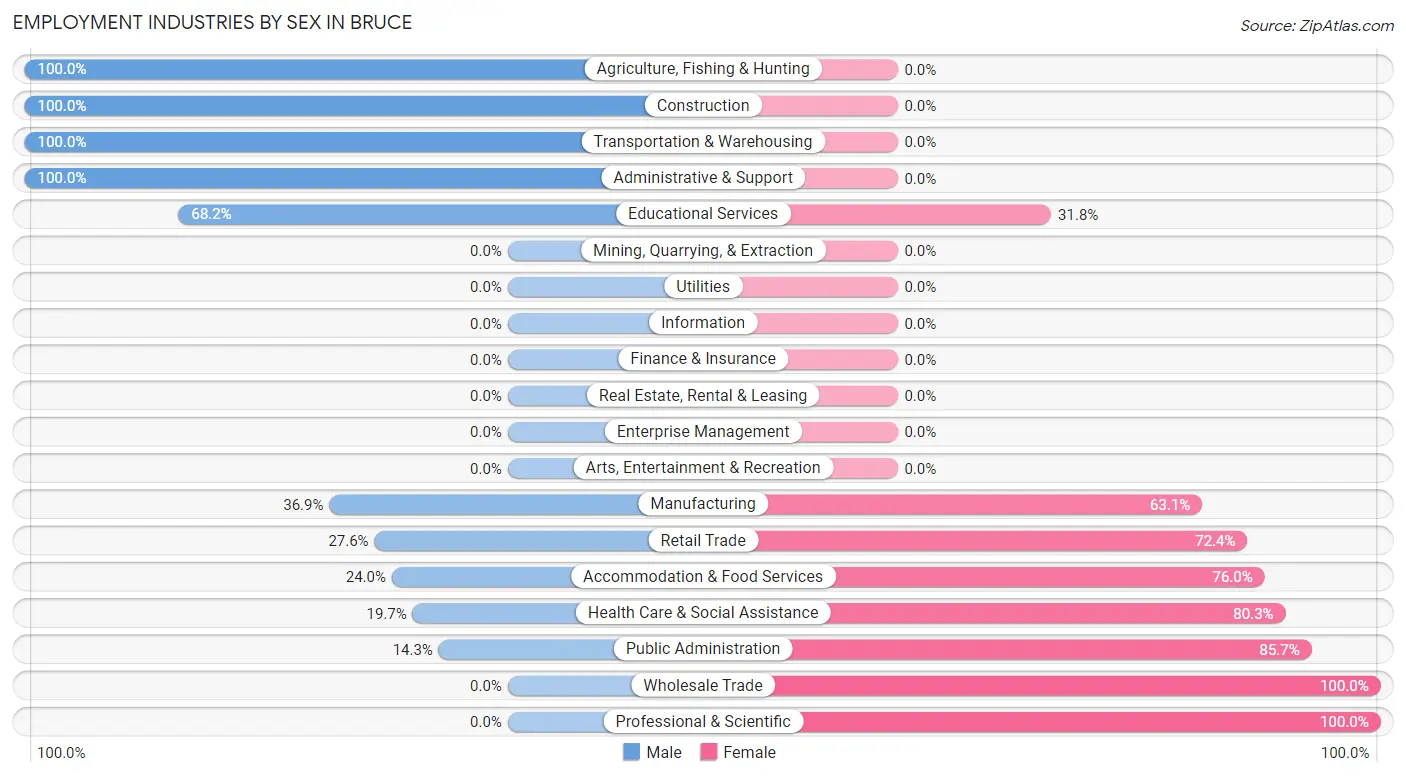
The Bruce industries that see more men than women are Agriculture, Fishing & Hunting (100.0%), Construction (100.0%), and Transportation & Warehousing (100.0%), whereas the industries that tend to have a higher number of women are Wholesale Trade (100.0%), Professional & Scientific (100.0%), and Public Administration (85.7%).
| Industry | Male | Female |
| Agriculture, Fishing & Hunting | 3 (100.0%) | 0 (0.0%) |
| Mining, Quarrying, & Extraction | 0 (0.0%) | 0 (0.0%) |
| Construction | 13 (100.0%) | 0 (0.0%) |
| Manufacturing | 65 (36.9%) | 111 (63.1%) |
| Wholesale Trade | 0 (0.0%) | 2 (100.0%) |
| Retail Trade | 16 (27.6%) | 42 (72.4%) |
| Transportation & Warehousing | 23 (100.0%) | 0 (0.0%) |
| Utilities | 0 (0.0%) | 0 (0.0%) |
| Information | 0 (0.0%) | 0 (0.0%) |
| Finance & Insurance | 0 (0.0%) | 0 (0.0%) |
| Real Estate, Rental & Leasing | 0 (0.0%) | 0 (0.0%) |
| Professional & Scientific | 0 (0.0%) | 9 (100.0%) |
| Enterprise Management | 0 (0.0%) | 0 (0.0%) |
| Administrative & Support | 13 (100.0%) | 0 (0.0%) |
| Educational Services | 15 (68.2%) | 7 (31.8%) |
| Health Care & Social Assistance | 13 (19.7%) | 53 (80.3%) |
| Arts, Entertainment & Recreation | 0 (0.0%) | 0 (0.0%) |
| Accommodation & Food Services | 6 (24.0%) | 19 (76.0%) |
| Public Administration | 3 (14.3%) | 18 (85.7%) |
| Total | 197 (39.3%) | 304 (60.7%) |
Education in Bruce
School Enrollment in Bruce
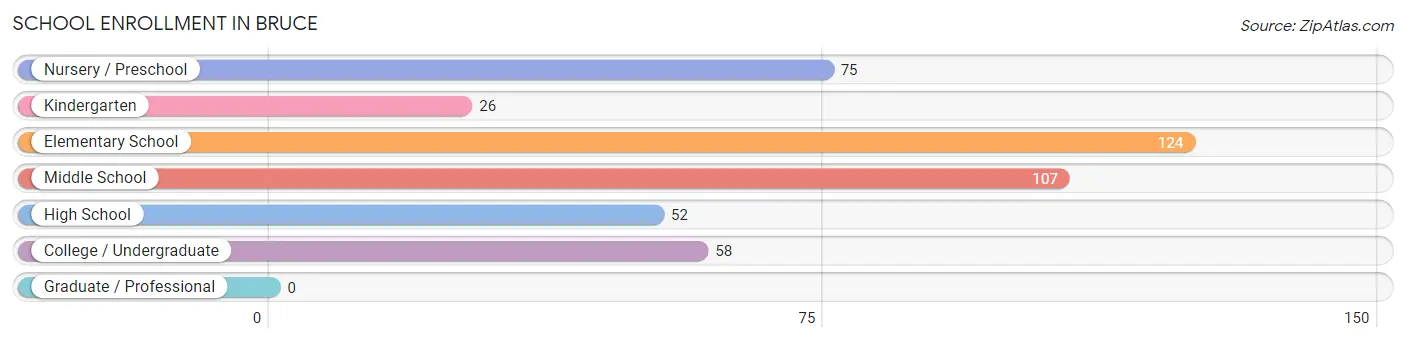
The most common levels of schooling among the 442 students in Bruce are elementary school (124 | 28.1%), middle school (107 | 24.2%), and nursery / preschool (75 | 17.0%).
| School Level | # Students | % Students |
| Nursery / Preschool | 75 | 17.0% |
| Kindergarten | 26 | 5.9% |
| Elementary School | 124 | 28.1% |
| Middle School | 107 | 24.2% |
| High School | 52 | 11.8% |
| College / Undergraduate | 58 | 13.1% |
| Graduate / Professional | 0 | 0.0% |
| Total | 442 | 100.0% |
School Enrollment by Age by Funding Source in Bruce
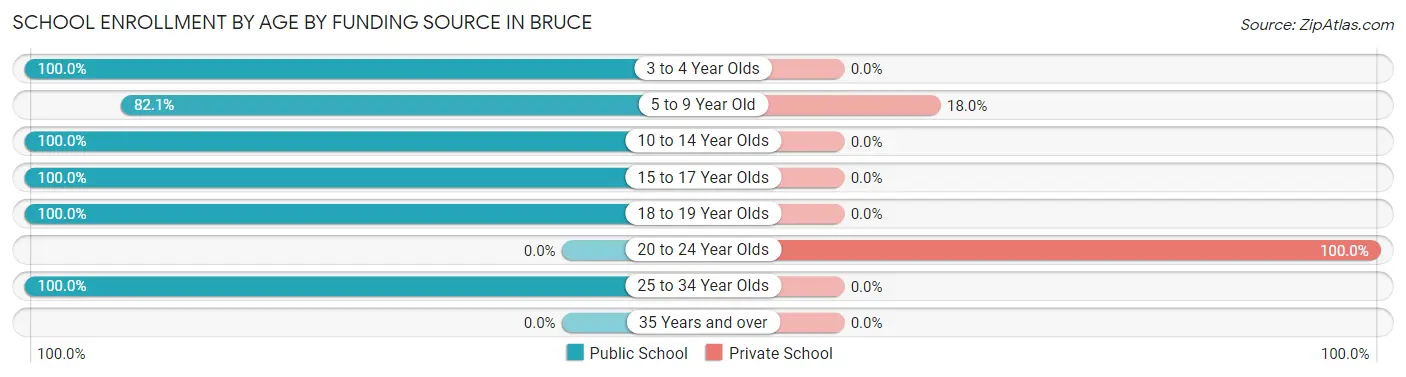
Out of a total of 442 students who are enrolled in schools in Bruce, 20 (4.5%) attend a private institution, while the remaining 422 (95.5%) are enrolled in public schools. The age group of 20 to 24 year olds has the highest likelihood of being enrolled in private schools, with 6 (100.0% in the age bracket) enrolled. Conversely, the age group of 3 to 4 year olds has the lowest likelihood of being enrolled in a private school, with 86 (100.0% in the age bracket) attending a public institution.
| Age Bracket | Public School | Private School |
| 3 to 4 Year Olds | 86 (100.0%) | 0 (0.0%) |
| 5 to 9 Year Old | 64 (82.1%) | 14 (17.9%) |
| 10 to 14 Year Olds | 181 (100.0%) | 0 (0.0%) |
| 15 to 17 Year Olds | 33 (100.0%) | 0 (0.0%) |
| 18 to 19 Year Olds | 6 (100.0%) | 0 (0.0%) |
| 20 to 24 Year Olds | 0 (0.0%) | 6 (100.0%) |
| 25 to 34 Year Olds | 52 (100.0%) | 0 (0.0%) |
| 35 Years and over | 0 (0.0%) | 0 (0.0%) |
| Total | 422 (95.5%) | 20 (4.5%) |
Educational Attainment by Field of Study in Bruce
Visual & performing arts (61 | 28.9%), education (42 | 19.9%), communications (23 | 10.9%), science & technology (22 | 10.4%), and literature & languages (13 | 6.2%) are the most common fields of study among 211 individuals in Bruce who have obtained a bachelor's degree or higher.
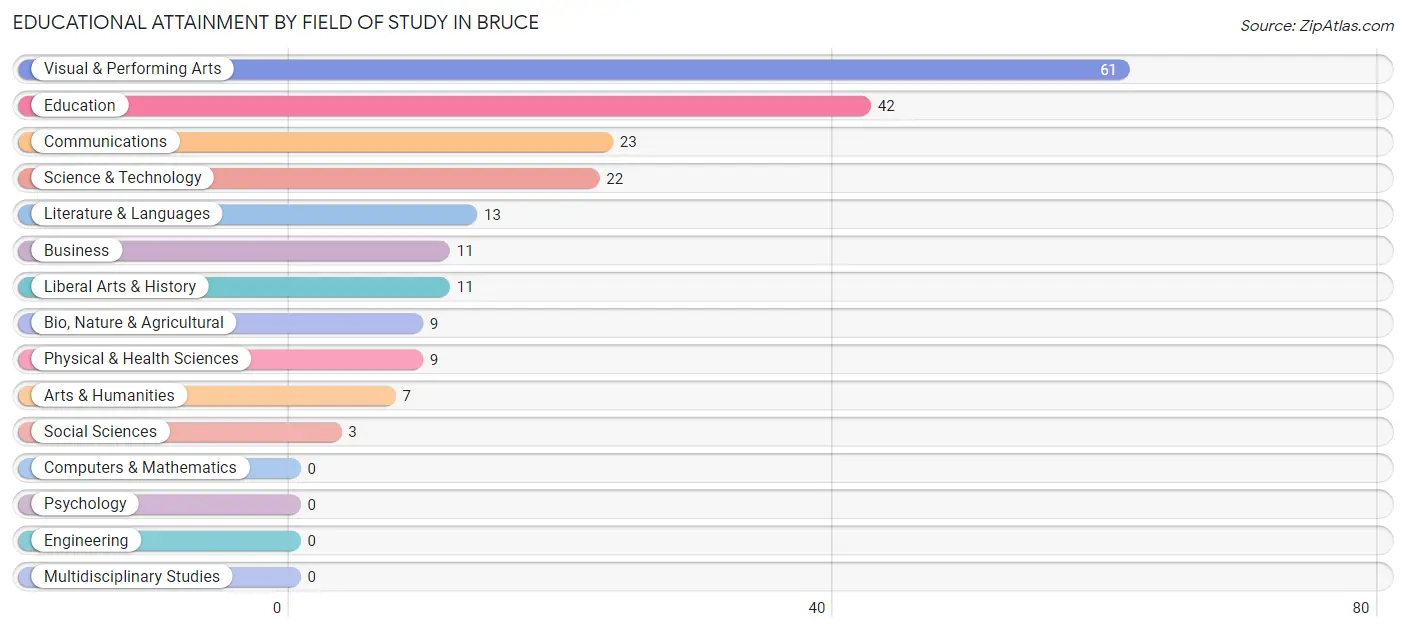
| Field of Study | # Graduates | % Graduates |
| Computers & Mathematics | 0 | 0.0% |
| Bio, Nature & Agricultural | 9 | 4.3% |
| Physical & Health Sciences | 9 | 4.3% |
| Psychology | 0 | 0.0% |
| Social Sciences | 3 | 1.4% |
| Engineering | 0 | 0.0% |
| Multidisciplinary Studies | 0 | 0.0% |
| Science & Technology | 22 | 10.4% |
| Business | 11 | 5.2% |
| Education | 42 | 19.9% |
| Literature & Languages | 13 | 6.2% |
| Liberal Arts & History | 11 | 5.2% |
| Visual & Performing Arts | 61 | 28.9% |
| Communications | 23 | 10.9% |
| Arts & Humanities | 7 | 3.3% |
| Total | 211 | 100.0% |
Transportation & Commute in Bruce
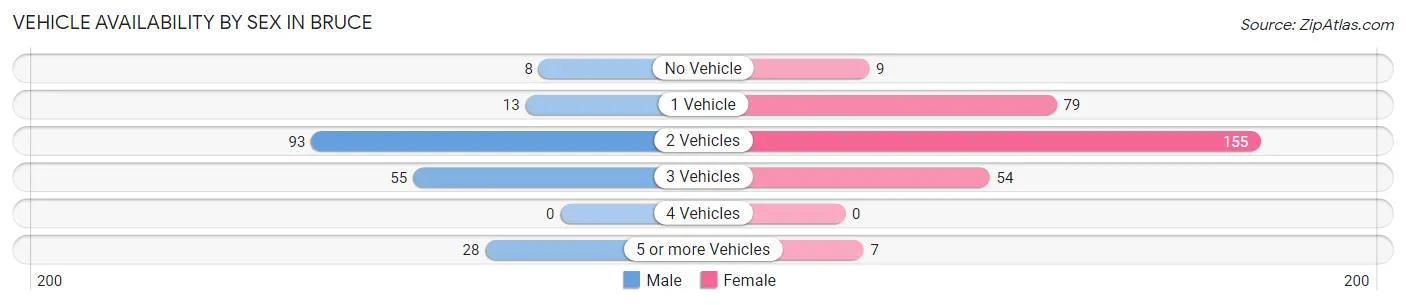
Vehicle Availability by Sex in Bruce
The most prevalent vehicle ownership categories in Bruce are males with 2 vehicles (93, accounting for 47.2%) and females with 2 vehicles (155, making up 30.6%).
| Vehicles Available | Male | Female |
| No Vehicle | 8 (4.1%) | 9 (3.0%) |
| 1 Vehicle | 13 (6.6%) | 79 (26.0%) |
| 2 Vehicles | 93 (47.2%) | 155 (51.0%) |
| 3 Vehicles | 55 (27.9%) | 54 (17.8%) |
| 4 Vehicles | 0 (0.0%) | 0 (0.0%) |
| 5 or more Vehicles | 28 (14.2%) | 7 (2.3%) |
| Total | 197 (100.0%) | 304 (100.0%) |
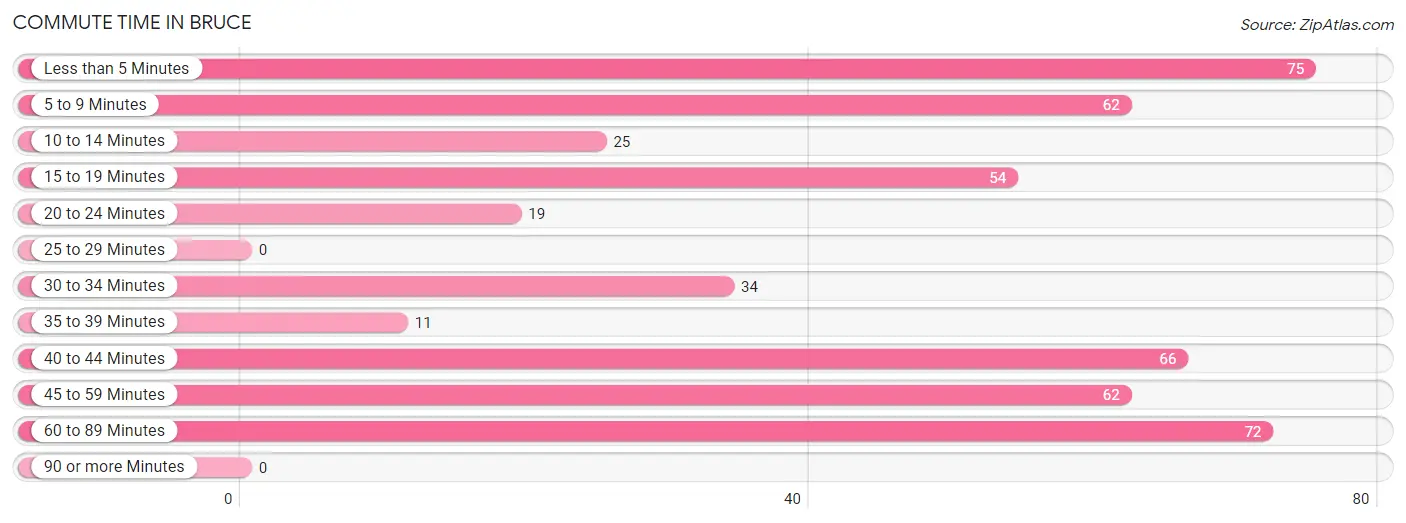
Commute Time in Bruce
The most frequently occuring commute durations in Bruce are less than 5 minutes (75 commuters, 15.6%), 60 to 89 minutes (72 commuters, 15.0%), and 40 to 44 minutes (66 commuters, 13.8%).
| Commute Time | # Commuters | % Commuters |
| Less than 5 Minutes | 75 | 15.6% |
| 5 to 9 Minutes | 62 | 12.9% |
| 10 to 14 Minutes | 25 | 5.2% |
| 15 to 19 Minutes | 54 | 11.3% |
| 20 to 24 Minutes | 19 | 4.0% |
| 25 to 29 Minutes | 0 | 0.0% |
| 30 to 34 Minutes | 34 | 7.1% |
| 35 to 39 Minutes | 11 | 2.3% |
| 40 to 44 Minutes | 66 | 13.8% |
| 45 to 59 Minutes | 62 | 12.9% |
| 60 to 89 Minutes | 72 | 15.0% |
| 90 or more Minutes | 0 | 0.0% |
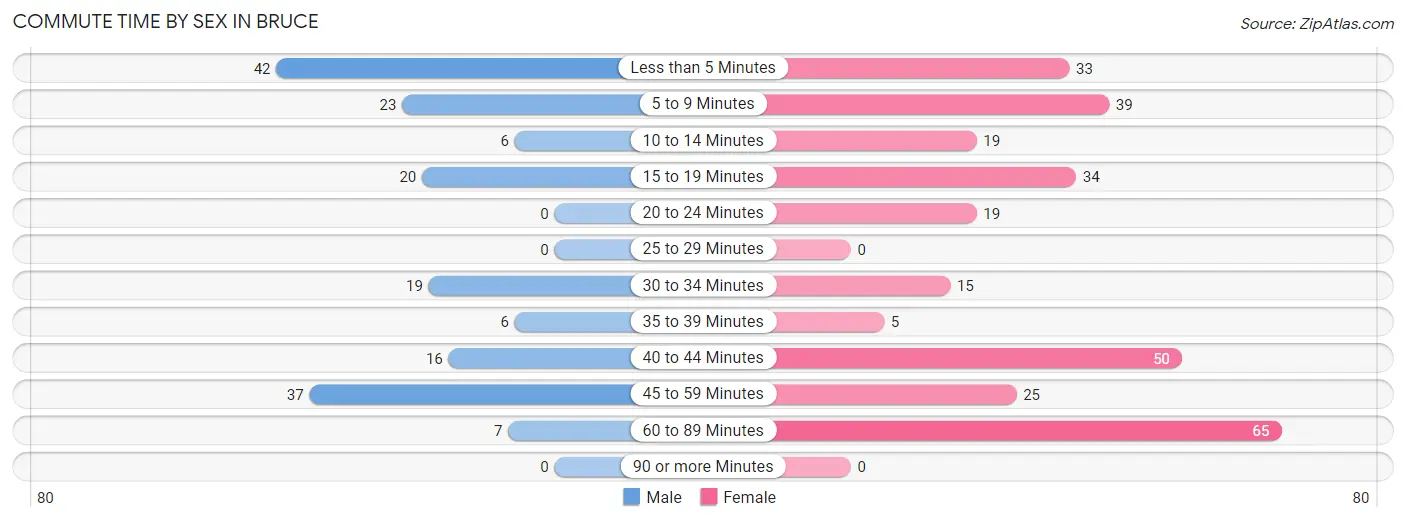
Commute Time by Sex in Bruce
The most common commute times in Bruce are less than 5 minutes (42 commuters, 23.9%) for males and 60 to 89 minutes (65 commuters, 21.4%) for females.
| Commute Time | Male | Female |
| Less than 5 Minutes | 42 (23.9%) | 33 (10.9%) |
| 5 to 9 Minutes | 23 (13.1%) | 39 (12.8%) |
| 10 to 14 Minutes | 6 (3.4%) | 19 (6.2%) |
| 15 to 19 Minutes | 20 (11.4%) | 34 (11.2%) |
| 20 to 24 Minutes | 0 (0.0%) | 19 (6.2%) |
| 25 to 29 Minutes | 0 (0.0%) | 0 (0.0%) |
| 30 to 34 Minutes | 19 (10.8%) | 15 (4.9%) |
| 35 to 39 Minutes | 6 (3.4%) | 5 (1.6%) |
| 40 to 44 Minutes | 16 (9.1%) | 50 (16.5%) |
| 45 to 59 Minutes | 37 (21.0%) | 25 (8.2%) |
| 60 to 89 Minutes | 7 (4.0%) | 65 (21.4%) |
| 90 or more Minutes | 0 (0.0%) | 0 (0.0%) |
Time of Departure to Work by Sex in Bruce
The most frequent times of departure to work in Bruce are 12:00 PM to 3:59 PM (36, 20.4%) for males and 5:30 AM to 5:59 AM (104, 34.2%) for females.
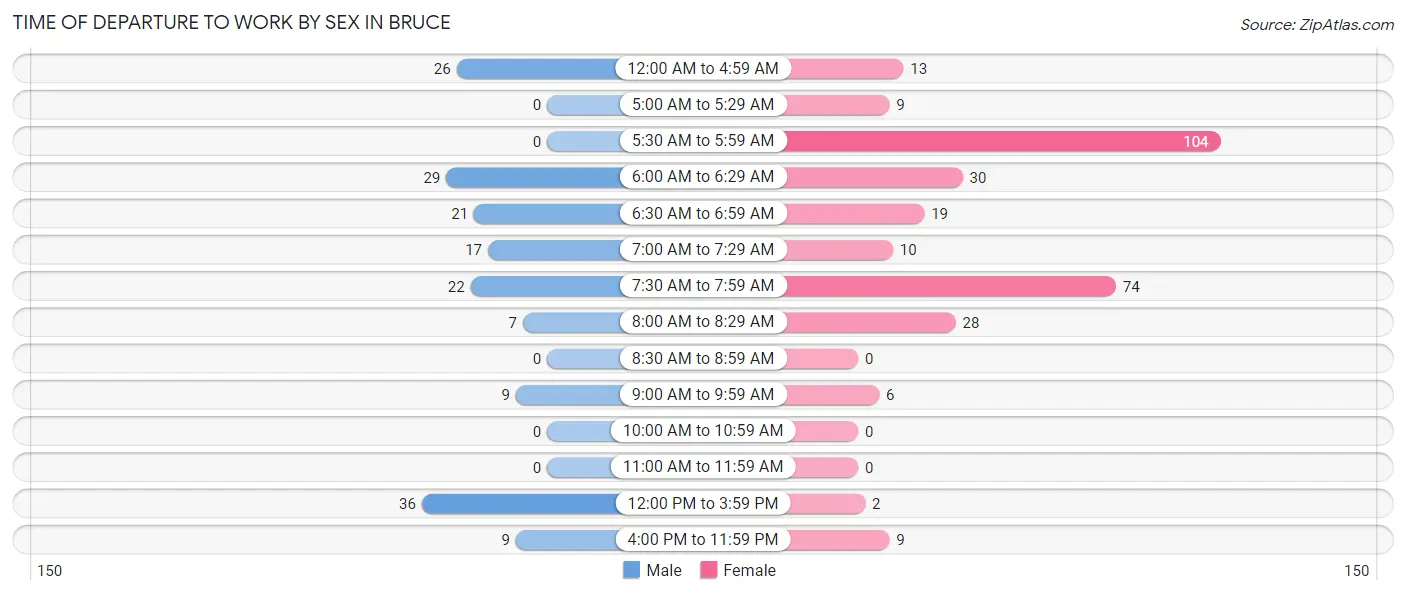
| Time of Departure | Male | Female |
| 12:00 AM to 4:59 AM | 26 (14.8%) | 13 (4.3%) |
| 5:00 AM to 5:29 AM | 0 (0.0%) | 9 (3.0%) |
| 5:30 AM to 5:59 AM | 0 (0.0%) | 104 (34.2%) |
| 6:00 AM to 6:29 AM | 29 (16.5%) | 30 (9.9%) |
| 6:30 AM to 6:59 AM | 21 (11.9%) | 19 (6.2%) |
| 7:00 AM to 7:29 AM | 17 (9.7%) | 10 (3.3%) |
| 7:30 AM to 7:59 AM | 22 (12.5%) | 74 (24.3%) |
| 8:00 AM to 8:29 AM | 7 (4.0%) | 28 (9.2%) |
| 8:30 AM to 8:59 AM | 0 (0.0%) | 0 (0.0%) |
| 9:00 AM to 9:59 AM | 9 (5.1%) | 6 (2.0%) |
| 10:00 AM to 10:59 AM | 0 (0.0%) | 0 (0.0%) |
| 11:00 AM to 11:59 AM | 0 (0.0%) | 0 (0.0%) |
| 12:00 PM to 3:59 PM | 36 (20.4%) | 2 (0.7%) |
| 4:00 PM to 11:59 PM | 9 (5.1%) | 9 (3.0%) |
| Total | 176 (100.0%) | 304 (100.0%) |
Housing Occupancy in Bruce
Occupancy by Ownership in Bruce
Of the total 725 dwellings in Bruce, owner-occupied units account for 326 (45.0%), while renter-occupied units make up 399 (55.0%).
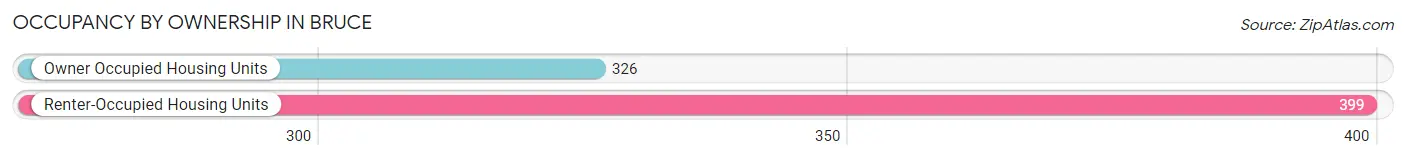
| Occupancy | # Housing Units | % Housing Units |
| Owner Occupied Housing Units | 326 | 45.0% |
| Renter-Occupied Housing Units | 399 | 55.0% |
| Total Occupied Housing Units | 725 | 100.0% |
Occupancy by Household Size in Bruce
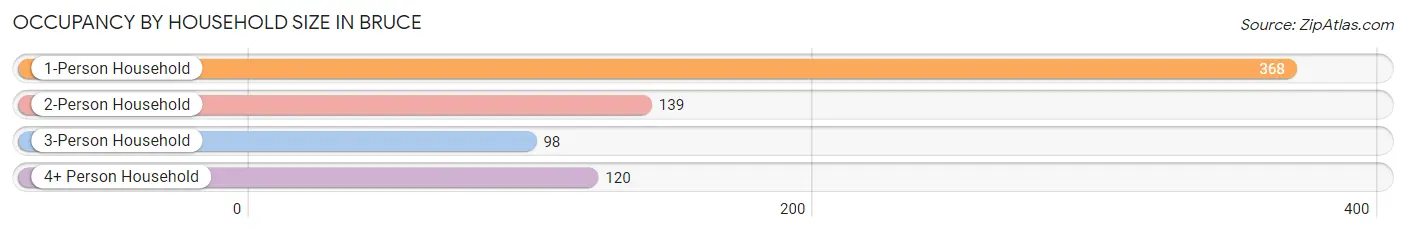
| Household Size | # Housing Units | % Housing Units |
| 1-Person Household | 368 | 50.8% |
| 2-Person Household | 139 | 19.2% |
| 3-Person Household | 98 | 13.5% |
| 4+ Person Household | 120 | 16.6% |
| Total Housing Units | 725 | 100.0% |
Occupancy by Ownership by Household Size in Bruce
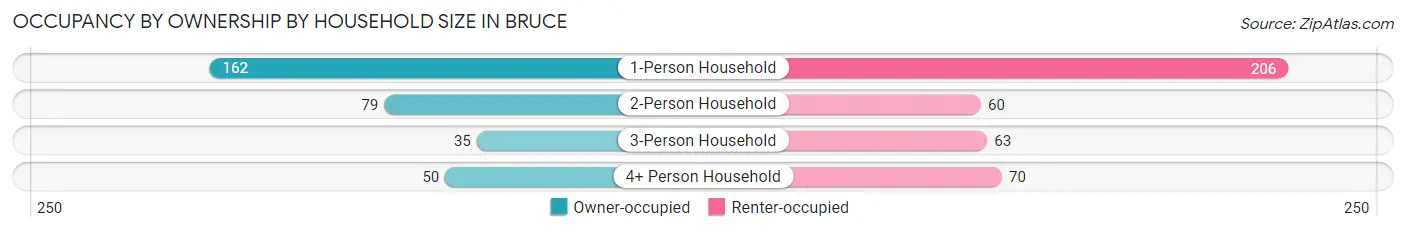
| Household Size | Owner-occupied | Renter-occupied |
| 1-Person Household | 162 (44.0%) | 206 (56.0%) |
| 2-Person Household | 79 (56.8%) | 60 (43.2%) |
| 3-Person Household | 35 (35.7%) | 63 (64.3%) |
| 4+ Person Household | 50 (41.7%) | 70 (58.3%) |
| Total Housing Units | 326 (45.0%) | 399 (55.0%) |
Occupancy by Educational Attainment in Bruce
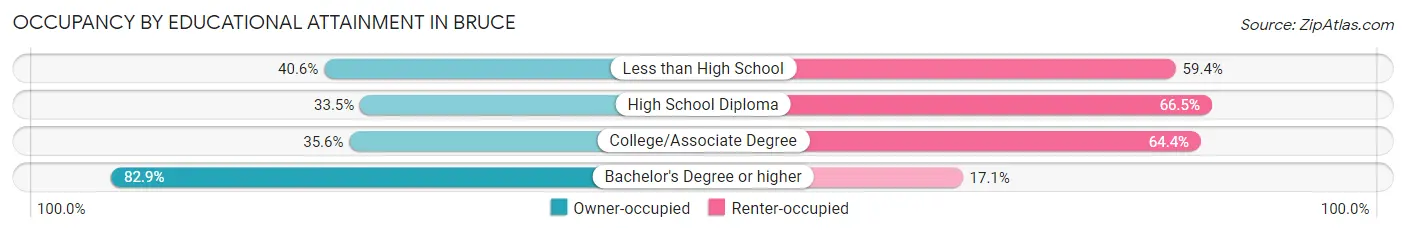
| Household Size | Owner-occupied | Renter-occupied |
| Less than High School | 52 (40.6%) | 76 (59.4%) |
| High School Diploma | 75 (33.5%) | 149 (66.5%) |
| College/Associate Degree | 83 (35.6%) | 150 (64.4%) |
| Bachelor's Degree or higher | 116 (82.9%) | 24 (17.1%) |
Occupancy by Age of Householder in Bruce
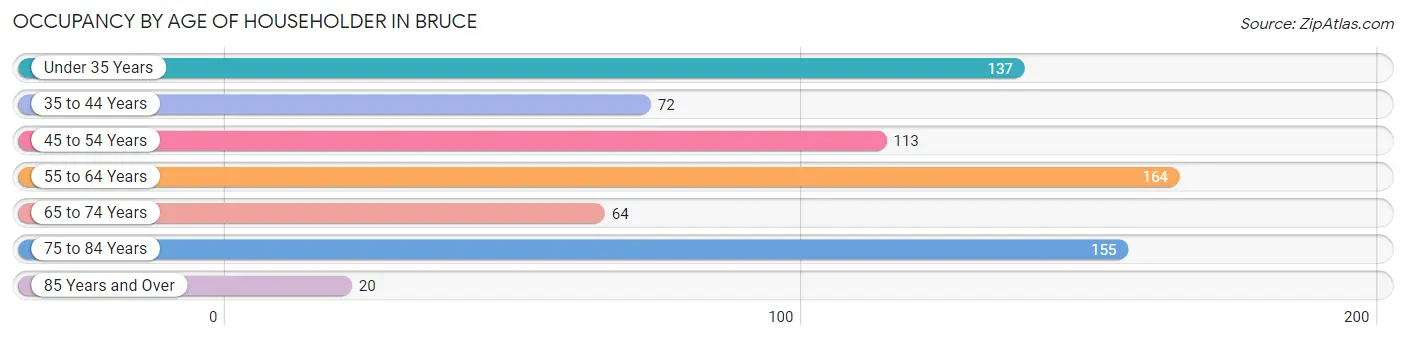
| Age Bracket | # Households | % Households |
| Under 35 Years | 137 | 18.9% |
| 35 to 44 Years | 72 | 9.9% |
| 45 to 54 Years | 113 | 15.6% |
| 55 to 64 Years | 164 | 22.6% |
| 65 to 74 Years | 64 | 8.8% |
| 75 to 84 Years | 155 | 21.4% |
| 85 Years and Over | 20 | 2.8% |
| Total | 725 | 100.0% |
Housing Finances in Bruce
Median Income by Occupancy in Bruce
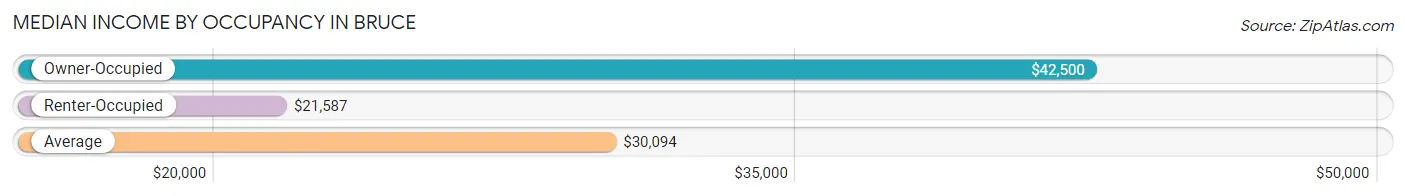
| Occupancy Type | # Households | Median Income |
| Owner-Occupied | 326 (45.0%) | $42,500 |
| Renter-Occupied | 399 (55.0%) | $21,587 |
| Average | 725 (100.0%) | $30,094 |
Occupancy by Householder Income Bracket in Bruce
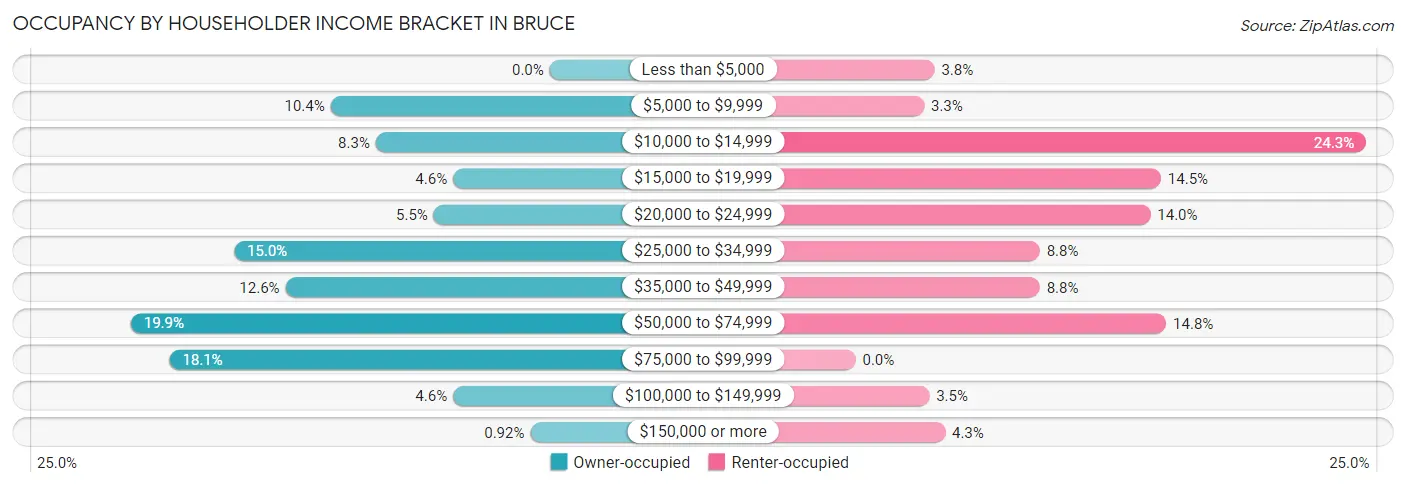
| Income Bracket | Owner-occupied | Renter-occupied |
| Less than $5,000 | 0 (0.0%) | 15 (3.8%) |
| $5,000 to $9,999 | 34 (10.4%) | 13 (3.3%) |
| $10,000 to $14,999 | 27 (8.3%) | 97 (24.3%) |
| $15,000 to $19,999 | 15 (4.6%) | 58 (14.5%) |
| $20,000 to $24,999 | 18 (5.5%) | 56 (14.0%) |
| $25,000 to $34,999 | 49 (15.0%) | 35 (8.8%) |
| $35,000 to $49,999 | 41 (12.6%) | 35 (8.8%) |
| $50,000 to $74,999 | 65 (19.9%) | 59 (14.8%) |
| $75,000 to $99,999 | 59 (18.1%) | 0 (0.0%) |
| $100,000 to $149,999 | 15 (4.6%) | 14 (3.5%) |
| $150,000 or more | 3 (0.9%) | 17 (4.3%) |
| Total | 326 (100.0%) | 399 (100.0%) |
Monthly Housing Cost Tiers in Bruce
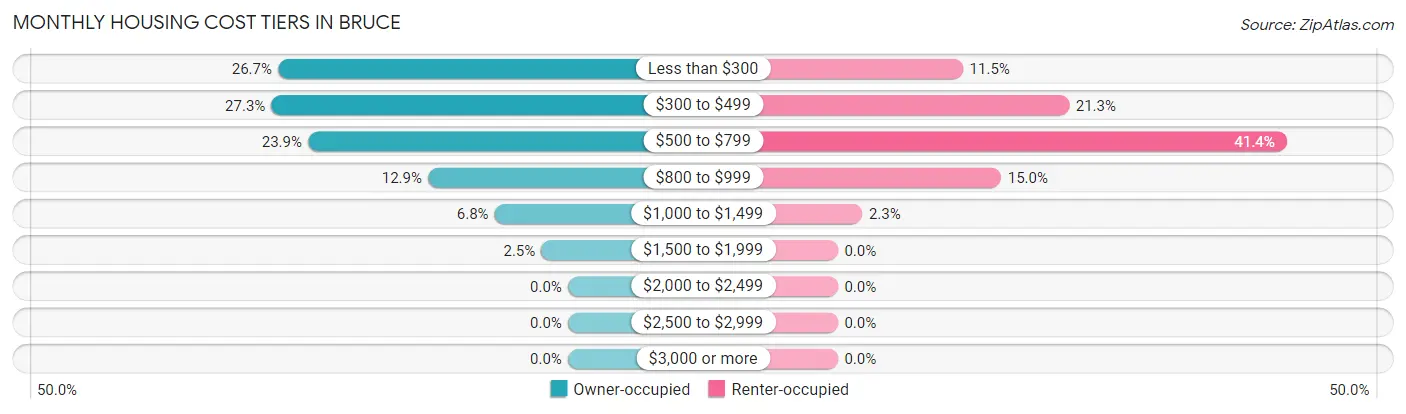
| Monthly Cost | Owner-occupied | Renter-occupied |
| Less than $300 | 87 (26.7%) | 46 (11.5%) |
| $300 to $499 | 89 (27.3%) | 85 (21.3%) |
| $500 to $799 | 78 (23.9%) | 165 (41.3%) |
| $800 to $999 | 42 (12.9%) | 60 (15.0%) |
| $1,000 to $1,499 | 22 (6.8%) | 9 (2.3%) |
| $1,500 to $1,999 | 8 (2.5%) | 0 (0.0%) |
| $2,000 to $2,499 | 0 (0.0%) | 0 (0.0%) |
| $2,500 to $2,999 | 0 (0.0%) | 0 (0.0%) |
| $3,000 or more | 0 (0.0%) | 0 (0.0%) |
| Total | 326 (100.0%) | 399 (100.0%) |
Physical Housing Characteristics in Bruce
Housing Structures in Bruce
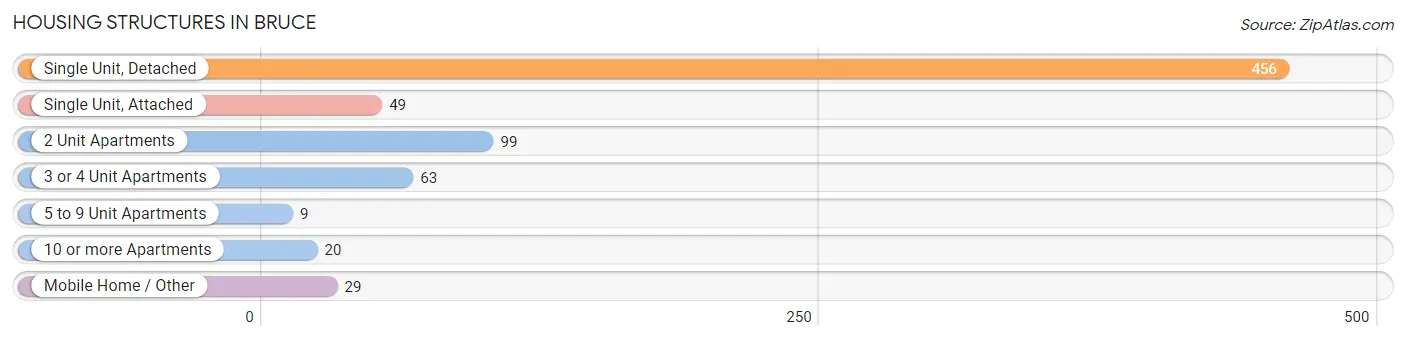
| Structure Type | # Housing Units | % Housing Units |
| Single Unit, Detached | 456 | 62.9% |
| Single Unit, Attached | 49 | 6.8% |
| 2 Unit Apartments | 99 | 13.7% |
| 3 or 4 Unit Apartments | 63 | 8.7% |
| 5 to 9 Unit Apartments | 9 | 1.2% |
| 10 or more Apartments | 20 | 2.8% |
| Mobile Home / Other | 29 | 4.0% |
| Total | 725 | 100.0% |
Housing Structures by Occupancy in Bruce
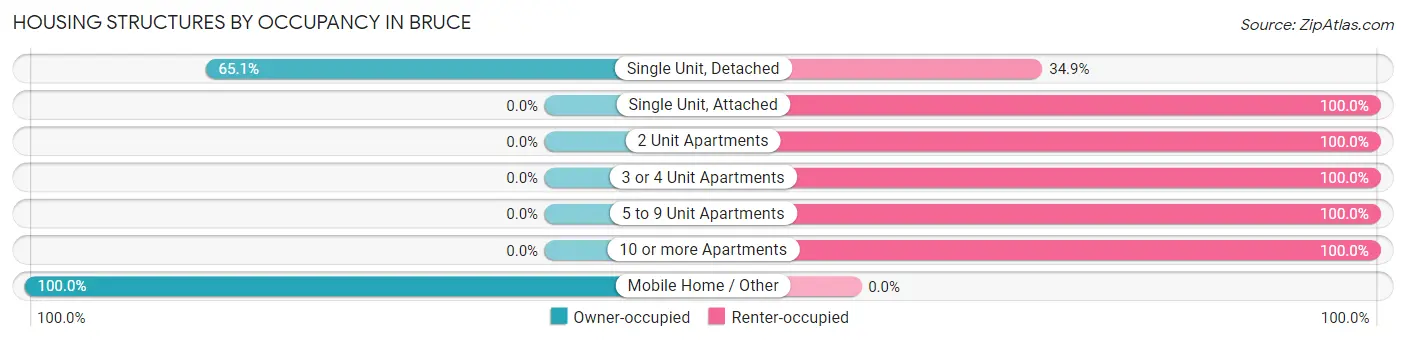
| Structure Type | Owner-occupied | Renter-occupied |
| Single Unit, Detached | 297 (65.1%) | 159 (34.9%) |
| Single Unit, Attached | 0 (0.0%) | 49 (100.0%) |
| 2 Unit Apartments | 0 (0.0%) | 99 (100.0%) |
| 3 or 4 Unit Apartments | 0 (0.0%) | 63 (100.0%) |
| 5 to 9 Unit Apartments | 0 (0.0%) | 9 (100.0%) |
| 10 or more Apartments | 0 (0.0%) | 20 (100.0%) |
| Mobile Home / Other | 29 (100.0%) | 0 (0.0%) |
| Total | 326 (45.0%) | 399 (55.0%) |
Housing Structures by Number of Rooms in Bruce
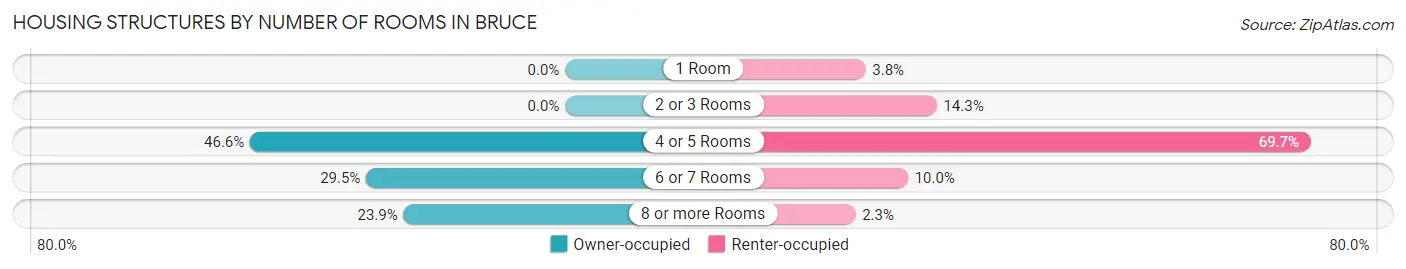
| Number of Rooms | Owner-occupied | Renter-occupied |
| 1 Room | 0 (0.0%) | 15 (3.8%) |
| 2 or 3 Rooms | 0 (0.0%) | 57 (14.3%) |
| 4 or 5 Rooms | 152 (46.6%) | 278 (69.7%) |
| 6 or 7 Rooms | 96 (29.4%) | 40 (10.0%) |
| 8 or more Rooms | 78 (23.9%) | 9 (2.3%) |
| Total | 326 (100.0%) | 399 (100.0%) |
Housing Structure by Heating Type in Bruce
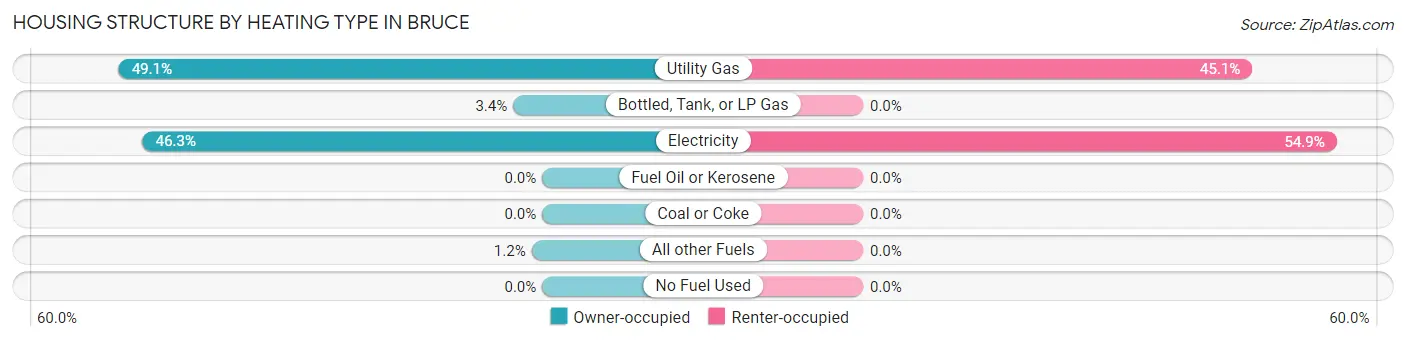
| Heating Type | Owner-occupied | Renter-occupied |
| Utility Gas | 160 (49.1%) | 180 (45.1%) |
| Bottled, Tank, or LP Gas | 11 (3.4%) | 0 (0.0%) |
| Electricity | 151 (46.3%) | 219 (54.9%) |
| Fuel Oil or Kerosene | 0 (0.0%) | 0 (0.0%) |
| Coal or Coke | 0 (0.0%) | 0 (0.0%) |
| All other Fuels | 4 (1.2%) | 0 (0.0%) |
| No Fuel Used | 0 (0.0%) | 0 (0.0%) |
| Total | 326 (100.0%) | 399 (100.0%) |
Household Vehicle Usage in Bruce
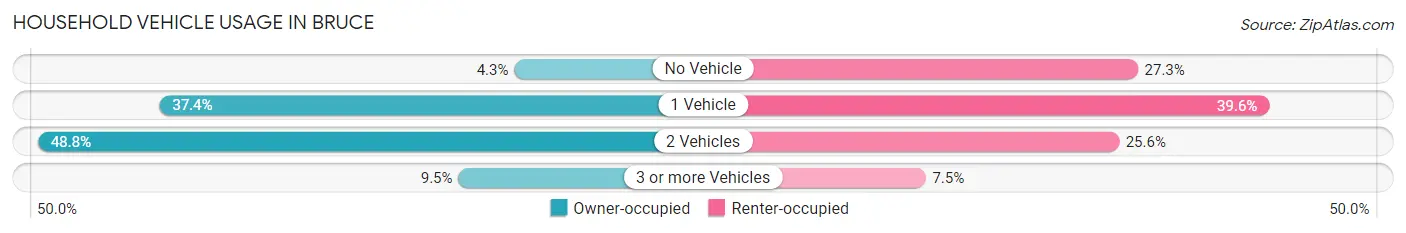
| Vehicles per Household | Owner-occupied | Renter-occupied |
| No Vehicle | 14 (4.3%) | 109 (27.3%) |
| 1 Vehicle | 122 (37.4%) | 158 (39.6%) |
| 2 Vehicles | 159 (48.8%) | 102 (25.6%) |
| 3 or more Vehicles | 31 (9.5%) | 30 (7.5%) |
| Total | 326 (100.0%) | 399 (100.0%) |
Real Estate & Mortgages in Bruce
Real Estate and Mortgage Overview in Bruce
| Characteristic | Without Mortgage | With Mortgage |
| Housing Units | 219 | 107 |
| Median Property Value | $64,500 | $96,500 |
| Median Household Income | $31,156 | $3 |
| Monthly Housing Costs | $338 | $0 |
| Real Estate Taxes | $711 | $19 |
Property Value by Mortgage Status in Bruce
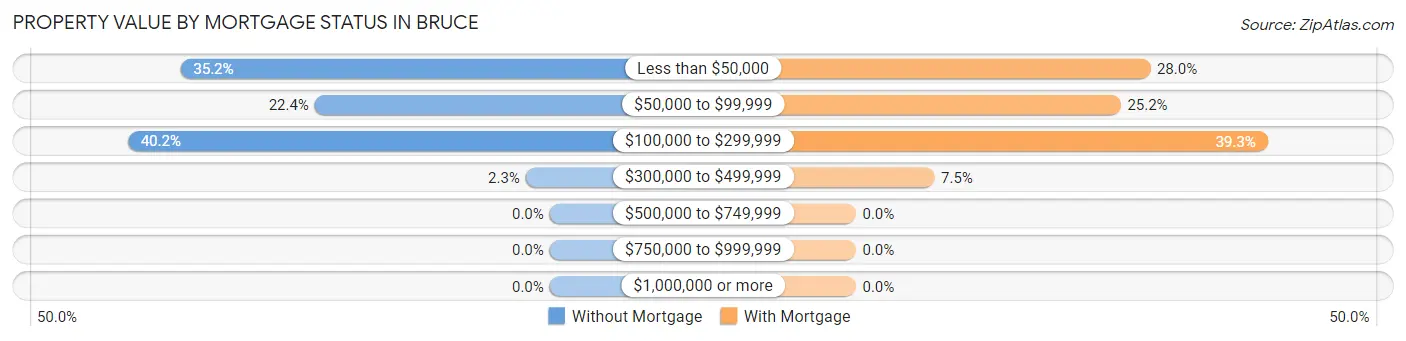
| Property Value | Without Mortgage | With Mortgage |
| Less than $50,000 | 77 (35.2%) | 30 (28.0%) |
| $50,000 to $99,999 | 49 (22.4%) | 27 (25.2%) |
| $100,000 to $299,999 | 88 (40.2%) | 42 (39.3%) |
| $300,000 to $499,999 | 5 (2.3%) | 8 (7.5%) |
| $500,000 to $749,999 | 0 (0.0%) | 0 (0.0%) |
| $750,000 to $999,999 | 0 (0.0%) | 0 (0.0%) |
| $1,000,000 or more | 0 (0.0%) | 0 (0.0%) |
| Total | 219 (100.0%) | 107 (100.0%) |
Household Income by Mortgage Status in Bruce
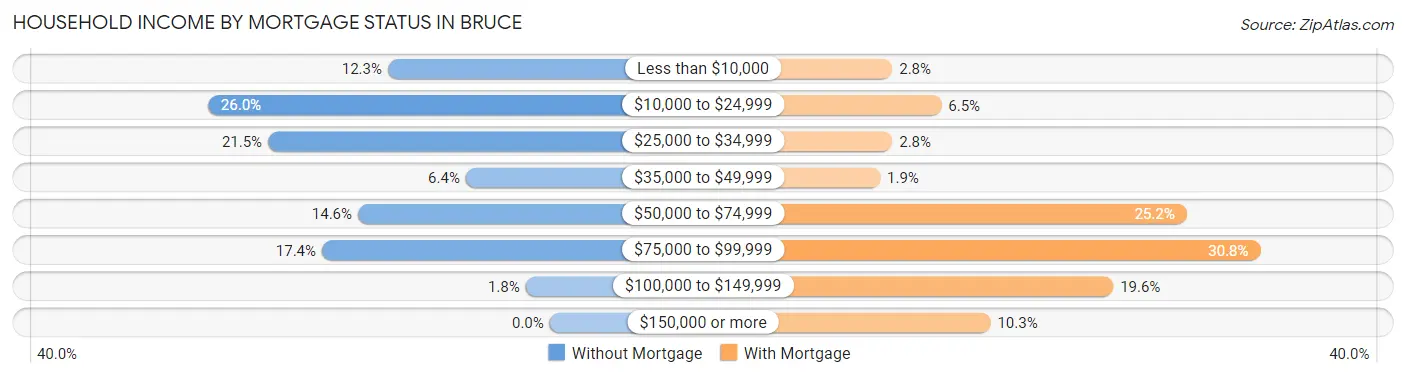
| Household Income | Without Mortgage | With Mortgage |
| Less than $10,000 | 27 (12.3%) | 3 (2.8%) |
| $10,000 to $24,999 | 57 (26.0%) | 7 (6.5%) |
| $25,000 to $34,999 | 47 (21.5%) | 3 (2.8%) |
| $35,000 to $49,999 | 14 (6.4%) | 2 (1.9%) |
| $50,000 to $74,999 | 32 (14.6%) | 27 (25.2%) |
| $75,000 to $99,999 | 38 (17.3%) | 33 (30.8%) |
| $100,000 to $149,999 | 4 (1.8%) | 21 (19.6%) |
| $150,000 or more | 0 (0.0%) | 11 (10.3%) |
| Total | 219 (100.0%) | 107 (100.0%) |
Property Value to Household Income Ratio in Bruce
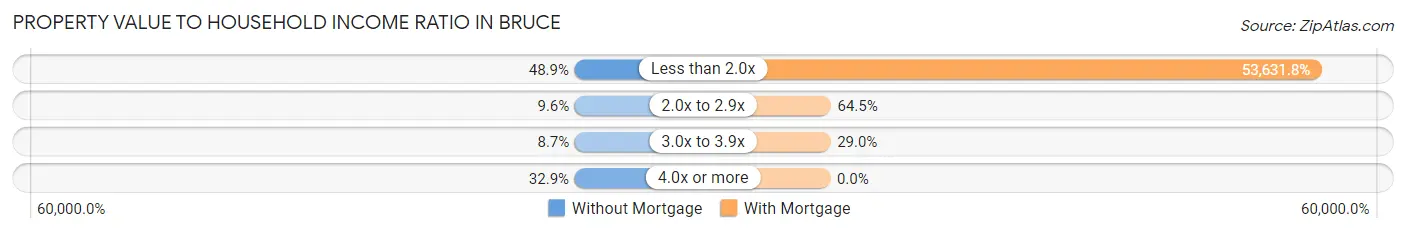
| Value-to-Income Ratio | Without Mortgage | With Mortgage |
| Less than 2.0x | 107 (48.9%) | 57,386 (53,631.8%) |
| 2.0x to 2.9x | 21 (9.6%) | 69 (64.5%) |
| 3.0x to 3.9x | 19 (8.7%) | 31 (29.0%) |
| 4.0x or more | 72 (32.9%) | 0 (0.0%) |
| Total | 219 (100.0%) | 107 (100.0%) |
Real Estate Taxes by Mortgage Status in Bruce
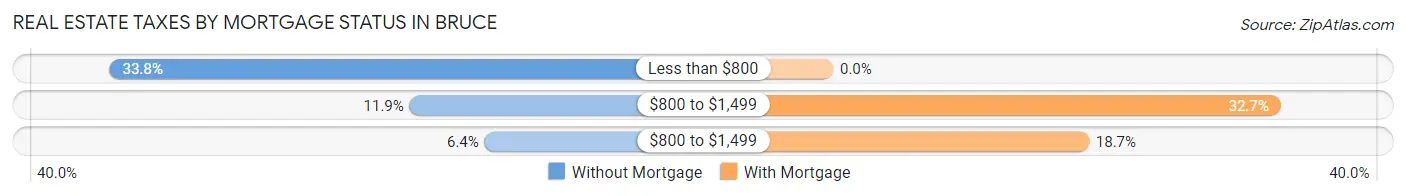
| Property Taxes | Without Mortgage | With Mortgage |
| Less than $800 | 74 (33.8%) | 0 (0.0%) |
| $800 to $1,499 | 26 (11.9%) | 35 (32.7%) |
| $800 to $1,499 | 14 (6.4%) | 20 (18.7%) |
| Total | 219 (100.0%) | 107 (100.0%) |
Health & Disability in Bruce
Health Insurance Coverage by Age in Bruce
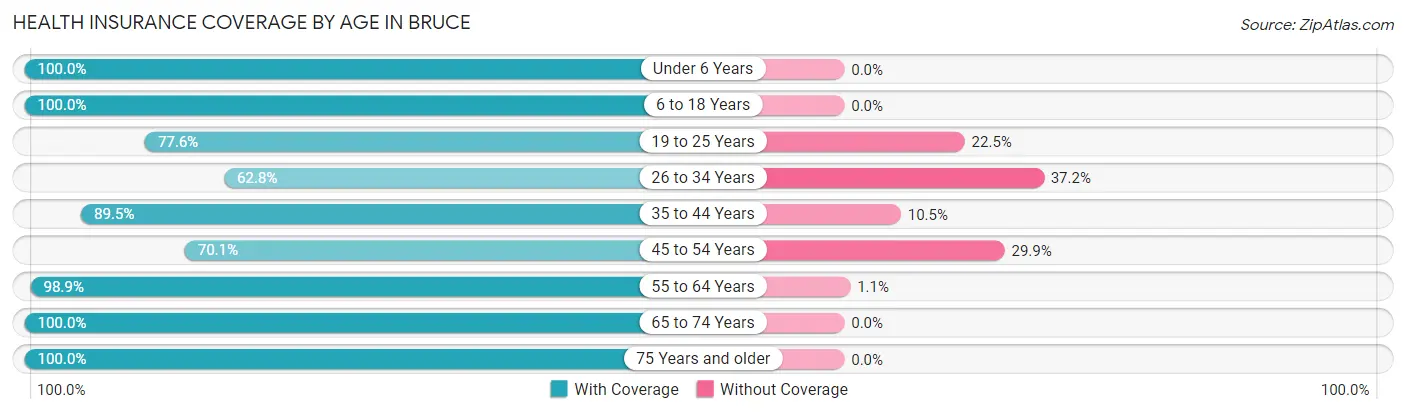
| Age Bracket | With Coverage | Without Coverage |
| Under 6 Years | 126 (100.0%) | 0 (0.0%) |
| 6 to 18 Years | 286 (100.0%) | 0 (0.0%) |
| 19 to 25 Years | 76 (77.5%) | 22 (22.5%) |
| 26 to 34 Years | 152 (62.8%) | 90 (37.2%) |
| 35 to 44 Years | 119 (89.5%) | 14 (10.5%) |
| 45 to 54 Years | 115 (70.1%) | 49 (29.9%) |
| 55 to 64 Years | 178 (98.9%) | 2 (1.1%) |
| 65 to 74 Years | 102 (100.0%) | 0 (0.0%) |
| 75 Years and older | 186 (100.0%) | 0 (0.0%) |
| Total | 1,340 (88.3%) | 177 (11.7%) |
Health Insurance Coverage by Citizenship Status in Bruce
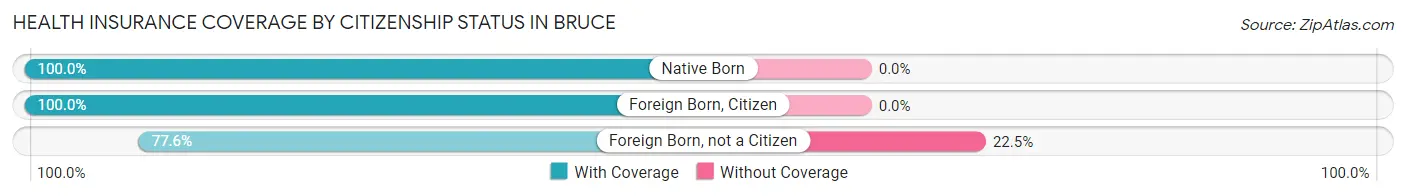
| Citizenship Status | With Coverage | Without Coverage |
| Native Born | 126 (100.0%) | 0 (0.0%) |
| Foreign Born, Citizen | 286 (100.0%) | 0 (0.0%) |
| Foreign Born, not a Citizen | 76 (77.5%) | 22 (22.5%) |
Health Insurance Coverage by Household Income in Bruce
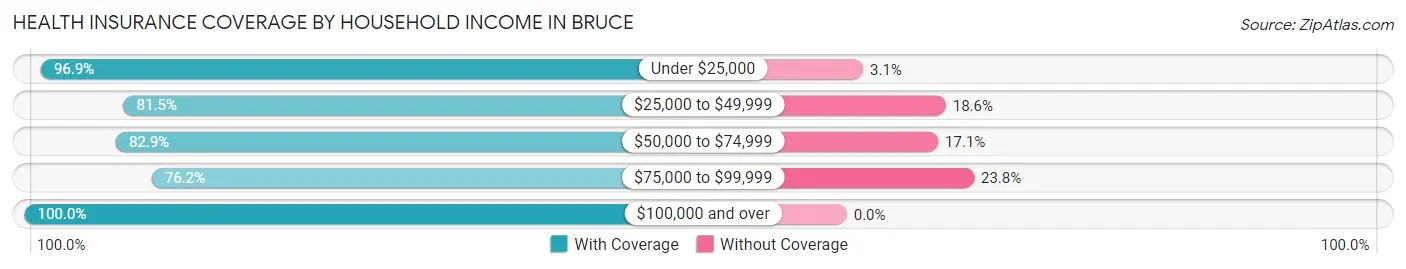
| Household Income | With Coverage | Without Coverage |
| Under $25,000 | 443 (96.9%) | 14 (3.1%) |
| $25,000 to $49,999 | 202 (81.5%) | 46 (18.5%) |
| $50,000 to $74,999 | 368 (82.9%) | 76 (17.1%) |
| $75,000 to $99,999 | 131 (76.2%) | 41 (23.8%) |
| $100,000 and over | 172 (100.0%) | 0 (0.0%) |
Public vs Private Health Insurance Coverage by Age in Bruce
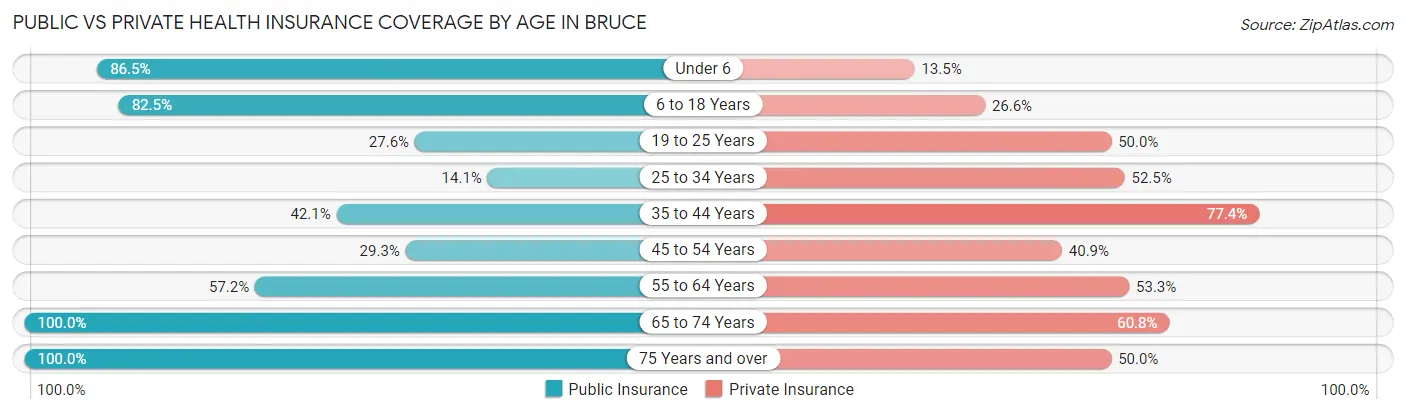
| Age Bracket | Public Insurance | Private Insurance |
| Under 6 | 109 (86.5%) | 17 (13.5%) |
| 6 to 18 Years | 236 (82.5%) | 76 (26.6%) |
| 19 to 25 Years | 27 (27.6%) | 49 (50.0%) |
| 25 to 34 Years | 34 (14.1%) | 127 (52.5%) |
| 35 to 44 Years | 56 (42.1%) | 103 (77.4%) |
| 45 to 54 Years | 48 (29.3%) | 67 (40.8%) |
| 55 to 64 Years | 103 (57.2%) | 96 (53.3%) |
| 65 to 74 Years | 102 (100.0%) | 62 (60.8%) |
| 75 Years and over | 186 (100.0%) | 93 (50.0%) |
| Total | 901 (59.4%) | 690 (45.5%) |
Disability Status by Sex by Age in Bruce
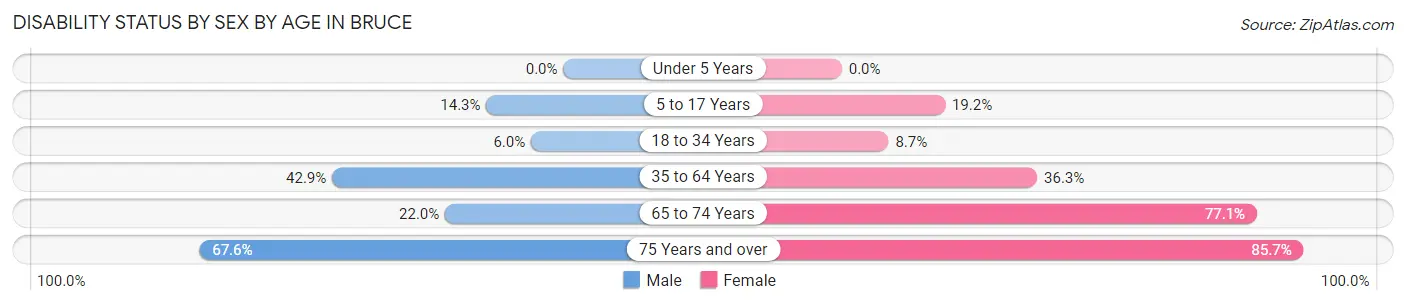
| Age Bracket | Male | Female |
| Under 5 Years | 0 (0.0%) | 0 (0.0%) |
| 5 to 17 Years | 22 (14.3%) | 27 (19.2%) |
| 18 to 34 Years | 10 (6.0%) | 15 (8.7%) |
| 35 to 64 Years | 97 (42.9%) | 91 (36.2%) |
| 65 to 74 Years | 9 (22.0%) | 47 (77.0%) |
| 75 Years and over | 50 (67.6%) | 96 (85.7%) |
Disability Class by Sex by Age in Bruce
Disability Class: Hearing Difficulty
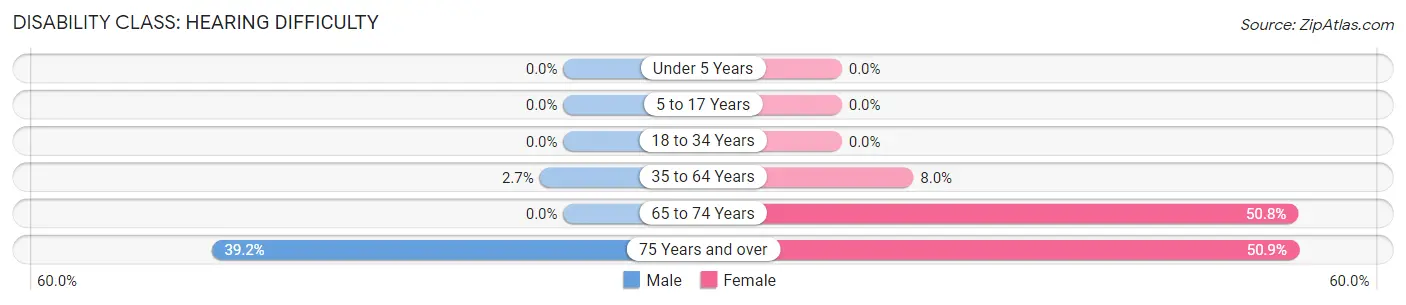
| Age Bracket | Male | Female |
| Under 5 Years | 0 (0.0%) | 0 (0.0%) |
| 5 to 17 Years | 0 (0.0%) | 0 (0.0%) |
| 18 to 34 Years | 0 (0.0%) | 0 (0.0%) |
| 35 to 64 Years | 6 (2.6%) | 20 (8.0%) |
| 65 to 74 Years | 0 (0.0%) | 31 (50.8%) |
| 75 Years and over | 29 (39.2%) | 57 (50.9%) |
Disability Class: Vision Difficulty
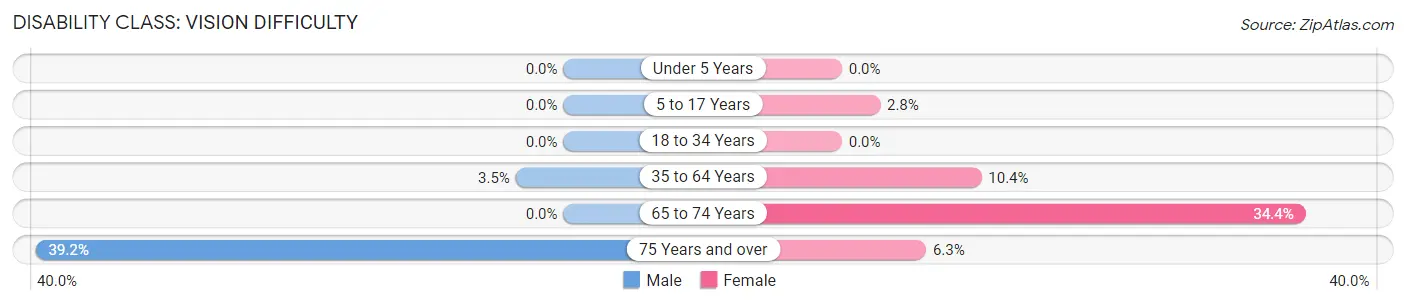
| Age Bracket | Male | Female |
| Under 5 Years | 0 (0.0%) | 0 (0.0%) |
| 5 to 17 Years | 0 (0.0%) | 4 (2.8%) |
| 18 to 34 Years | 0 (0.0%) | 0 (0.0%) |
| 35 to 64 Years | 8 (3.5%) | 26 (10.4%) |
| 65 to 74 Years | 0 (0.0%) | 21 (34.4%) |
| 75 Years and over | 29 (39.2%) | 7 (6.2%) |
Disability Class: Cognitive Difficulty
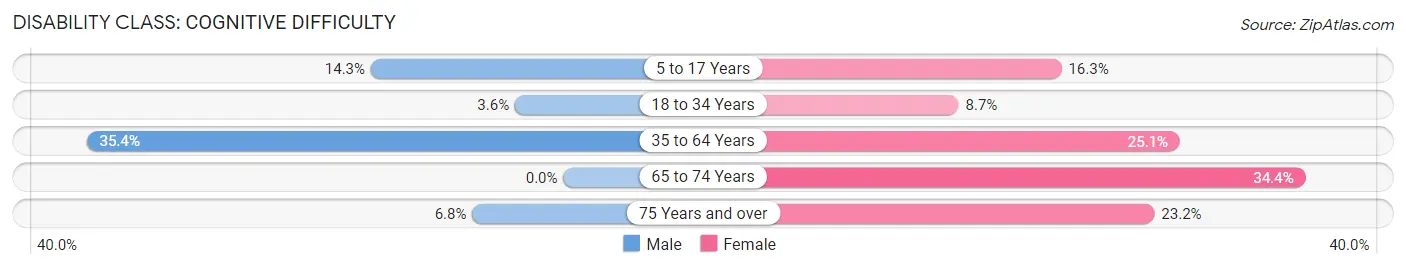
| Age Bracket | Male | Female |
| 5 to 17 Years | 22 (14.3%) | 23 (16.3%) |
| 18 to 34 Years | 6 (3.6%) | 15 (8.7%) |
| 35 to 64 Years | 80 (35.4%) | 63 (25.1%) |
| 65 to 74 Years | 0 (0.0%) | 21 (34.4%) |
| 75 Years and over | 5 (6.8%) | 26 (23.2%) |
Disability Class: Ambulatory Difficulty
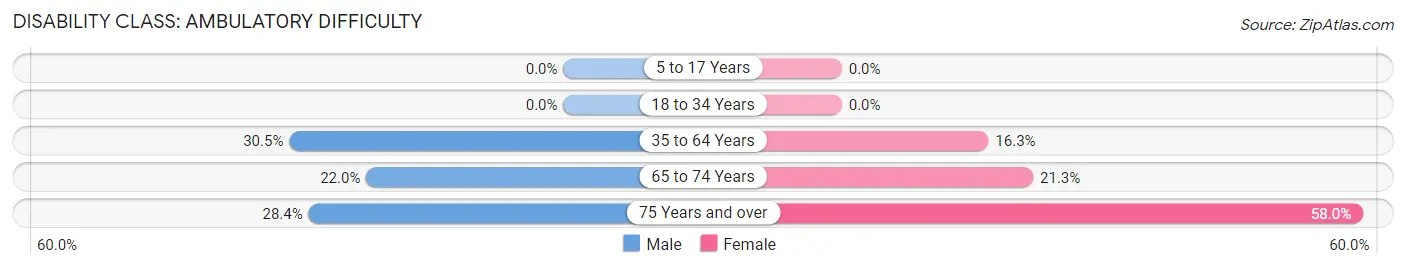
| Age Bracket | Male | Female |
| 5 to 17 Years | 0 (0.0%) | 0 (0.0%) |
| 18 to 34 Years | 0 (0.0%) | 0 (0.0%) |
| 35 to 64 Years | 69 (30.5%) | 41 (16.3%) |
| 65 to 74 Years | 9 (22.0%) | 13 (21.3%) |
| 75 Years and over | 21 (28.4%) | 65 (58.0%) |
Disability Class: Self-Care Difficulty
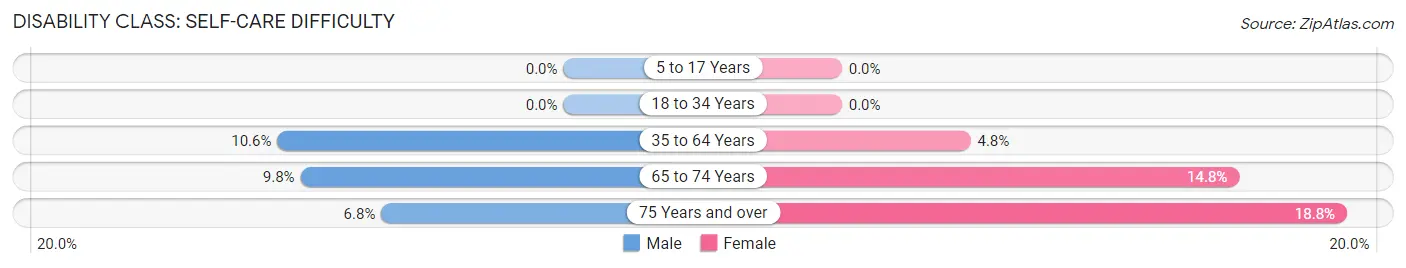
| Age Bracket | Male | Female |
| 5 to 17 Years | 0 (0.0%) | 0 (0.0%) |
| 18 to 34 Years | 0 (0.0%) | 0 (0.0%) |
| 35 to 64 Years | 24 (10.6%) | 12 (4.8%) |
| 65 to 74 Years | 4 (9.8%) | 9 (14.7%) |
| 75 Years and over | 5 (6.8%) | 21 (18.8%) |
Technology Access in Bruce
Computing Device Access in Bruce
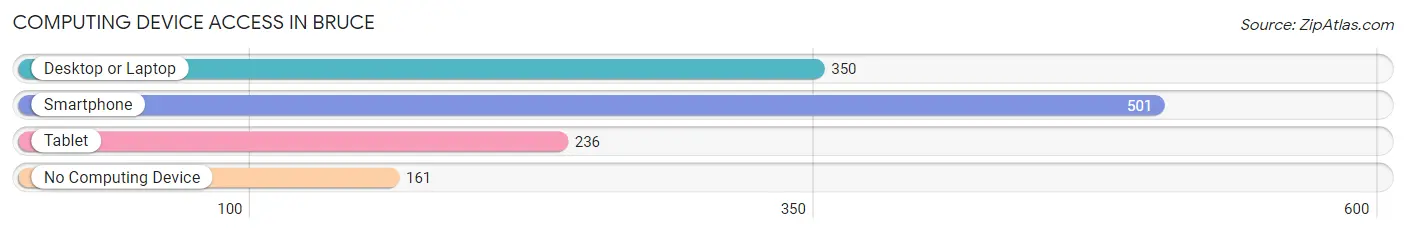
| Device Type | # Households | % Households |
| Desktop or Laptop | 350 | 48.3% |
| Smartphone | 501 | 69.1% |
| Tablet | 236 | 32.6% |
| No Computing Device | 161 | 22.2% |
| Total | 725 | 100.0% |
Internet Access in Bruce
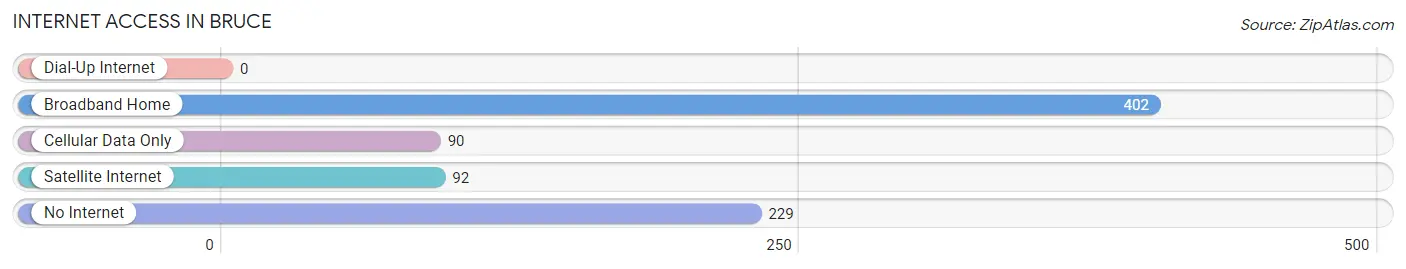
| Internet Type | # Households | % Households |
| Dial-Up Internet | 0 | 0.0% |
| Broadband Home | 402 | 55.4% |
| Cellular Data Only | 90 | 12.4% |
| Satellite Internet | 92 | 12.7% |
| No Internet | 229 | 31.6% |
| Total | 725 | 100.0% |
Bruce Summary
History
Mississippi is a state located in the southeastern region of the United States. It is bordered by Tennessee to the north, Alabama to the east, the Gulf of Mexico to the south, and Louisiana and Arkansas to the west. Mississippi has a rich and varied history, beginning with the Native American tribes who first inhabited the area. The Choctaw, Chickasaw, and Natchez tribes were the first to settle in the region, and their influence can still be seen in the state today.
The first Europeans to explore the area were the Spanish, who arrived in the late 1500s. They established several settlements in the region, but these were abandoned by the early 1700s. The French then arrived in the region and established the first permanent settlement in 1716. The French and Spanish both had a significant influence on the culture and language of the region.
In 1798, Mississippi became the 20th state to join the Union. During the 19th century, Mississippi was a slave state and was the site of several battles during the Civil War. After the war, the state was readmitted to the Union in 1870.
In the early 20th century, Mississippi was a major center of the civil rights movement. The state was the site of several important events, including the Freedom Summer of 1964 and the Selma to Montgomery march of 1965.
Geography
Mississippi is located in the southeastern region of the United States. It is bordered by Tennessee to the north, Alabama to the east, the Gulf of Mexico to the south, and Louisiana and Arkansas to the west. The state has a total area of 48,430 square miles, making it the 32nd largest state in the country.
The landscape of Mississippi is mostly flat, with rolling hills in the north and east. The state is divided into three distinct regions: the Gulf Coastal Plain, the Mississippi Alluvial Plain, and the Mississippi Delta. The Gulf Coastal Plain is located along the Gulf of Mexico and is characterized by sandy beaches and marshlands. The Mississippi Alluvial Plain is located in the central part of the state and is characterized by flat, fertile land. The Mississippi Delta is located in the northwest corner of the state and is characterized by flat, low-lying land.
Economy
Mississippi has a diverse economy that is largely based on agriculture, manufacturing, and services. The state is the largest producer of cotton in the United States and is also a major producer of soybeans, corn, and rice. Other important agricultural products include poultry, livestock, and timber.
Manufacturing is also an important part of the state’s economy. Mississippi is home to several major automotive and aerospace companies, as well as a number of smaller manufacturers. The state is also a major producer of chemicals, furniture, and textiles.
The service sector is also an important part of the state’s economy. Tourism is a major industry in Mississippi, with visitors drawn to the state’s beaches, casinos, and historic sites. The state is also home to several major universities, which provide a significant boost to the local economy.
Demographics
As of 2019, Mississippi had an estimated population of 2,976,149. The state has a population density of 60.3 people per square mile, making it the 37th most densely populated state in the country.
The racial makeup of Mississippi is 63.7% White, 37.3% African American, 0.3% Native American, 0.5% Asian, 0.1% Pacific Islander, 0.2% from other races, and 1.9% from two or more races. The state also has a large Hispanic population, with 4.3% of the population identifying as Hispanic or Latino.
The median household income in Mississippi is $41,754, and the poverty rate is 19.8%. The state has a high rate of unemployment, with 6.2% of the population unemployed as of 2019.
Common Questions
What is Per Capita Income in Bruce?
Per Capita income in Bruce is $22,623.
What is the Median Family Income in Bruce?
Median Family Income in Bruce is $65,089.
What is the Median Household income in Bruce?
Median Household Income in Bruce is $30,094.
What is Income or Wage Gap in Bruce?
Income or Wage Gap in Bruce is 2.6%.
Women in Bruce earn 97.4 cents for every dollar earned by a man.
What is Inequality or Gini Index in Bruce?
Inequality or Gini Index in Bruce is 0.50.
What is the Total Population of Bruce?
Total Population of Bruce is 1,523.
What is the Total Male Population of Bruce?
Total Male Population of Bruce is 691.
What is the Total Female Population of Bruce?
Total Female Population of Bruce is 832.
What is the Ratio of Males per 100 Females in Bruce?
There are 83.05 Males per 100 Females in Bruce.
What is the Ratio of Females per 100 Males in Bruce?
There are 120.41 Females per 100 Males in Bruce.
What is the Median Population Age in Bruce?
Median Population Age in Bruce is 36.1 Years.
What is the Average Family Size in Bruce
Average Family Size in Bruce is 3.1 People.
What is the Average Household Size in Bruce
Average Household Size in Bruce is 2.1 People.
How Large is the Labor Force in Bruce?
There are 518 People in the Labor Forcein in Bruce.
What is the Percentage of People in the Labor Force in Bruce?
45.7% of People are in the Labor Force in Bruce.
What is the Unemployment Rate in Bruce?
Unemployment Rate in Bruce is 3.3%.