Brookhaven, MS Map & Demographics
Brookhaven Map
Brookhaven Overview
$23,894
PER CAPITA INCOME
$47,217
AVG FAMILY INCOME
$32,869
AVG HOUSEHOLD INCOME
23.6%
WAGE / INCOME GAP [ % ]
76.4¢/ $1
WAGE / INCOME GAP [ $ ]
$9,952
FAMILY INCOME DEFICIT
0.52
INEQUALITY / GINI INDEX
11,714
TOTAL POPULATION
5,189
MALE POPULATION
6,525
FEMALE POPULATION
79.52
MALES / 100 FEMALES
125.75
FEMALES / 100 MALES
42.0
MEDIAN AGE
3.2
AVG FAMILY SIZE
2.4
AVG HOUSEHOLD SIZE
4,688
LABOR FORCE [ PEOPLE ]
50.4%
PERCENT IN LABOR FORCE
5.6%
UNEMPLOYMENT RATE
Brookhaven Zip Codes
Brookhaven Area Codes
Income in Brookhaven
Income Overview in Brookhaven
Per Capita Income in Brookhaven is $23,894, while median incomes of families and households are $47,217 and $32,869 respectively.
| Characteristic | Number | Measure |
| Per Capita Income | 11,714 | $23,894 |
| Median Family Income | 2,677 | $47,217 |
| Mean Family Income | 2,677 | $71,510 |
| Median Household Income | 4,584 | $32,869 |
| Mean Household Income | 4,584 | $55,899 |
| Income Deficit | 2,677 | $9,952 |
| Wage / Income Gap (%) | 11,714 | 23.57% |
| Wage / Income Gap ($) | 11,714 | 76.43¢ per $1 |
| Gini / Inequality Index | 11,714 | 0.52 |
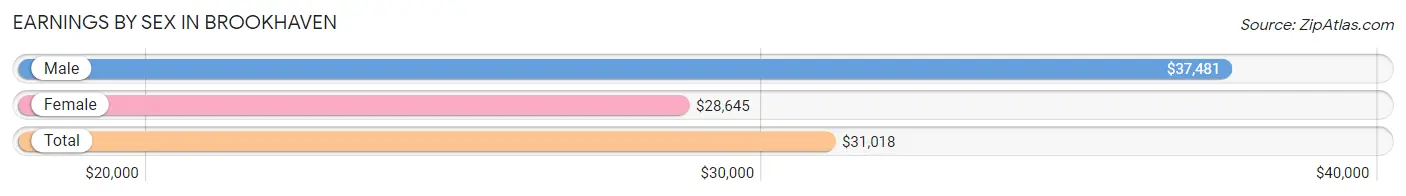
Earnings by Sex in Brookhaven
Average Earnings in Brookhaven are $31,018, $37,481 for men and $28,645 for women, a difference of 23.6%.
| Sex | Number | Average Earnings |
| Male | 2,281 (45.7%) | $37,481 |
| Female | 2,712 (54.3%) | $28,645 |
| Total | 4,993 (100.0%) | $31,018 |
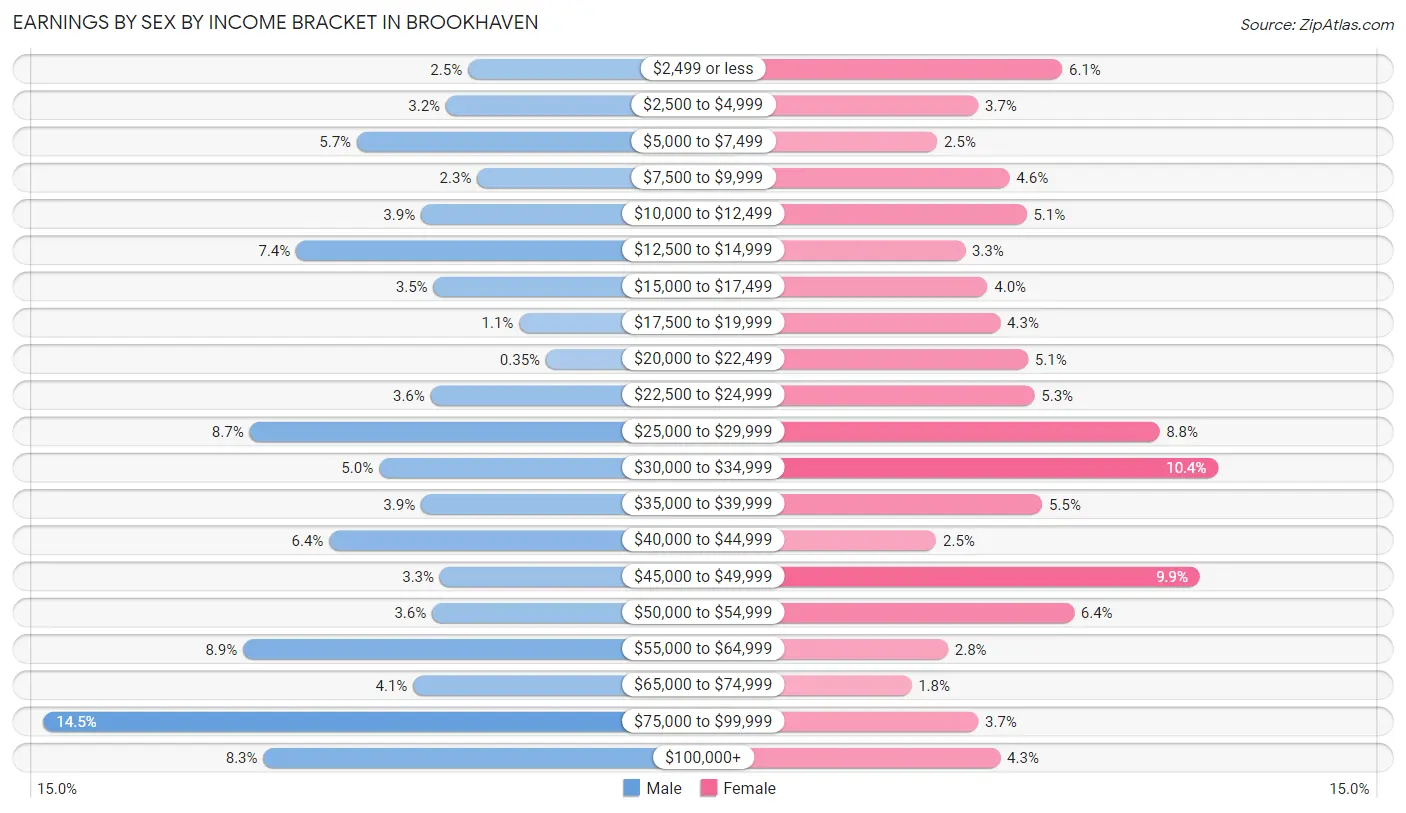
Earnings by Sex by Income Bracket in Brookhaven
The most common earnings brackets in Brookhaven are $75,000 to $99,999 for men (330 | 14.5%) and $30,000 to $34,999 for women (283 | 10.4%).
| Income | Male | Female |
| $2,499 or less | 58 (2.5%) | 164 (6.0%) |
| $2,500 to $4,999 | 72 (3.2%) | 100 (3.7%) |
| $5,000 to $7,499 | 129 (5.7%) | 69 (2.5%) |
| $7,500 to $9,999 | 52 (2.3%) | 124 (4.6%) |
| $10,000 to $12,499 | 88 (3.9%) | 137 (5.1%) |
| $12,500 to $14,999 | 168 (7.4%) | 90 (3.3%) |
| $15,000 to $17,499 | 80 (3.5%) | 107 (4.0%) |
| $17,500 to $19,999 | 25 (1.1%) | 117 (4.3%) |
| $20,000 to $22,499 | 8 (0.4%) | 138 (5.1%) |
| $22,500 to $24,999 | 82 (3.6%) | 143 (5.3%) |
| $25,000 to $29,999 | 198 (8.7%) | 238 (8.8%) |
| $30,000 to $34,999 | 115 (5.0%) | 283 (10.4%) |
| $35,000 to $39,999 | 88 (3.9%) | 149 (5.5%) |
| $40,000 to $44,999 | 147 (6.4%) | 68 (2.5%) |
| $45,000 to $49,999 | 76 (3.3%) | 269 (9.9%) |
| $50,000 to $54,999 | 81 (3.5%) | 173 (6.4%) |
| $55,000 to $64,999 | 202 (8.9%) | 77 (2.8%) |
| $65,000 to $74,999 | 93 (4.1%) | 49 (1.8%) |
| $75,000 to $99,999 | 330 (14.5%) | 100 (3.7%) |
| $100,000+ | 189 (8.3%) | 117 (4.3%) |
| Total | 2,281 (100.0%) | 2,712 (100.0%) |
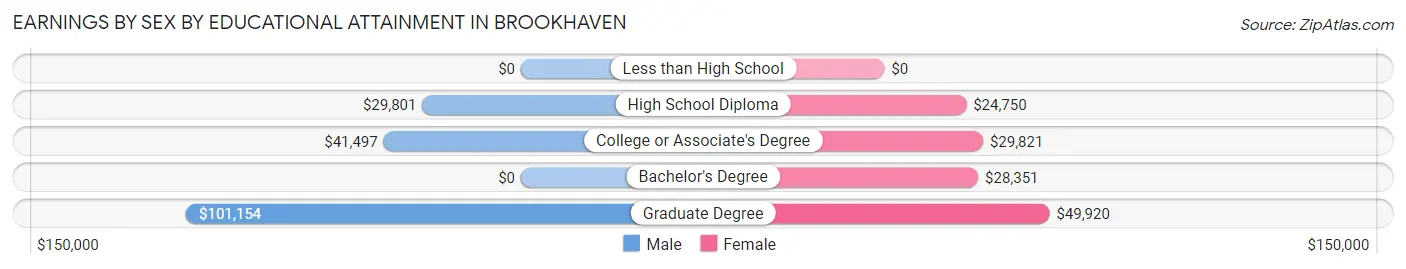
Earnings by Sex by Educational Attainment in Brookhaven
Average earnings in Brookhaven are $40,390 for men and $29,809 for women, a difference of 26.2%. Men with an educational attainment of graduate degree enjoy the highest average annual earnings of $101,154, while those with high school diploma education earn the least with $29,801. Women with an educational attainment of graduate degree earn the most with the average annual earnings of $49,920, while those with high school diploma education have the smallest earnings of $24,750.
| Educational Attainment | Male Income | Female Income |
| Less than High School | - | - |
| High School Diploma | $29,801 | $24,750 |
| College or Associate's Degree | $41,497 | $29,821 |
| Bachelor's Degree | - | - |
| Graduate Degree | $101,154 | $49,920 |
| Total | $40,390 | $29,809 |
Family Income in Brookhaven
Family Income Brackets in Brookhaven
According to the Brookhaven family income data, there are 391 families falling into the $75,000 to $99,999 income range, which is the most common income bracket and makes up 14.6% of all families. Conversely, the $200,000+ income bracket is the least frequent group with only 110 families (4.1%) belonging to this category.
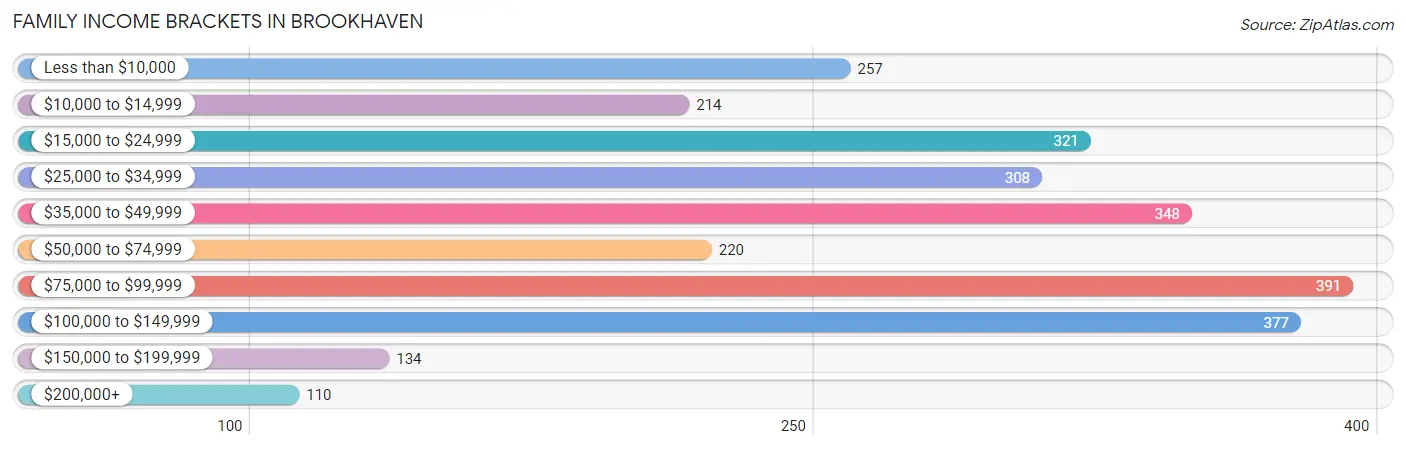
| Income Bracket | # Families | % Families |
| Less than $10,000 | 257 | 9.6% |
| $10,000 to $14,999 | 214 | 8.0% |
| $15,000 to $24,999 | 321 | 12.0% |
| $25,000 to $34,999 | 308 | 11.5% |
| $35,000 to $49,999 | 348 | 13.0% |
| $50,000 to $74,999 | 220 | 8.2% |
| $75,000 to $99,999 | 391 | 14.6% |
| $100,000 to $149,999 | 377 | 14.1% |
| $150,000 to $199,999 | 134 | 5.0% |
| $200,000+ | 110 | 4.1% |
Family Income by Famaliy Size in Brookhaven
6-person families (75 | 2.8%) account for the highest median family income in Brookhaven with $155,951 per family, while 6-person families (75 | 2.8%) have the highest median income of $25,992 per family member.
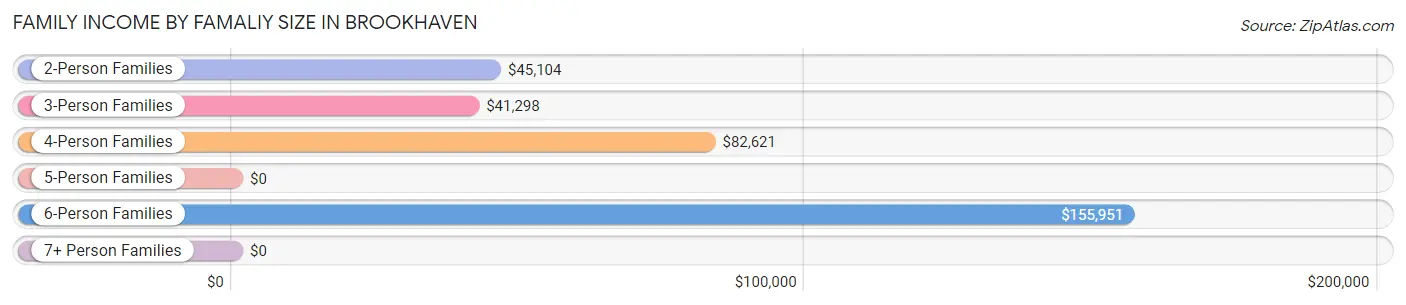
| Income Bracket | # Families | Median Income |
| 2-Person Families | 1,290 (48.2%) | $45,104 |
| 3-Person Families | 774 (28.9%) | $41,298 |
| 4-Person Families | 311 (11.6%) | $82,621 |
| 5-Person Families | 200 (7.5%) | $0 |
| 6-Person Families | 75 (2.8%) | $155,951 |
| 7+ Person Families | 27 (1.0%) | $0 |
| Total | 2,677 (100.0%) | $47,217 |
Family Income by Number of Earners in Brookhaven
The median family income in Brookhaven is $47,217, with families comprising 3+ earners (188) having the highest median family income of $138,426, while families with no earners (414) have the lowest median family income of $21,339, accounting for 7.0% and 15.5% of families, respectively.
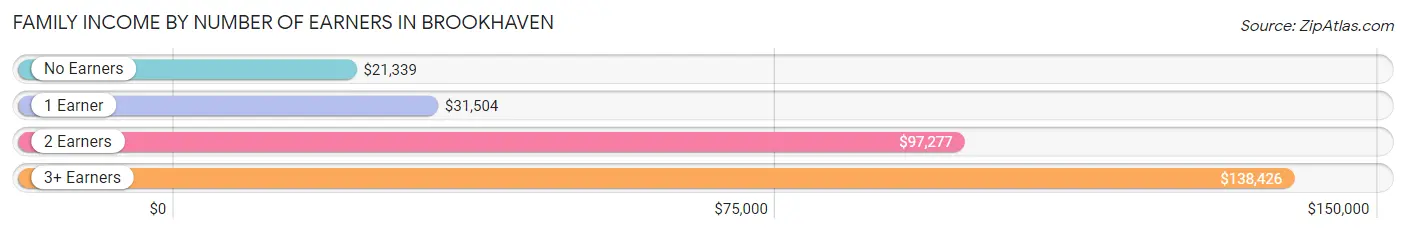
| Number of Earners | # Families | Median Income |
| No Earners | 414 (15.5%) | $21,339 |
| 1 Earner | 1,224 (45.7%) | $31,504 |
| 2 Earners | 851 (31.8%) | $97,277 |
| 3+ Earners | 188 (7.0%) | $138,426 |
| Total | 2,677 (100.0%) | $47,217 |
Household Income in Brookhaven
Household Income Brackets in Brookhaven
With 880 households falling in the category, the $15,000 to $24,999 income range is the most frequent in Brookhaven, accounting for 19.2% of all households. In contrast, only 119 households (2.6%) fall into the $200,000+ income bracket, making it the least populous group.
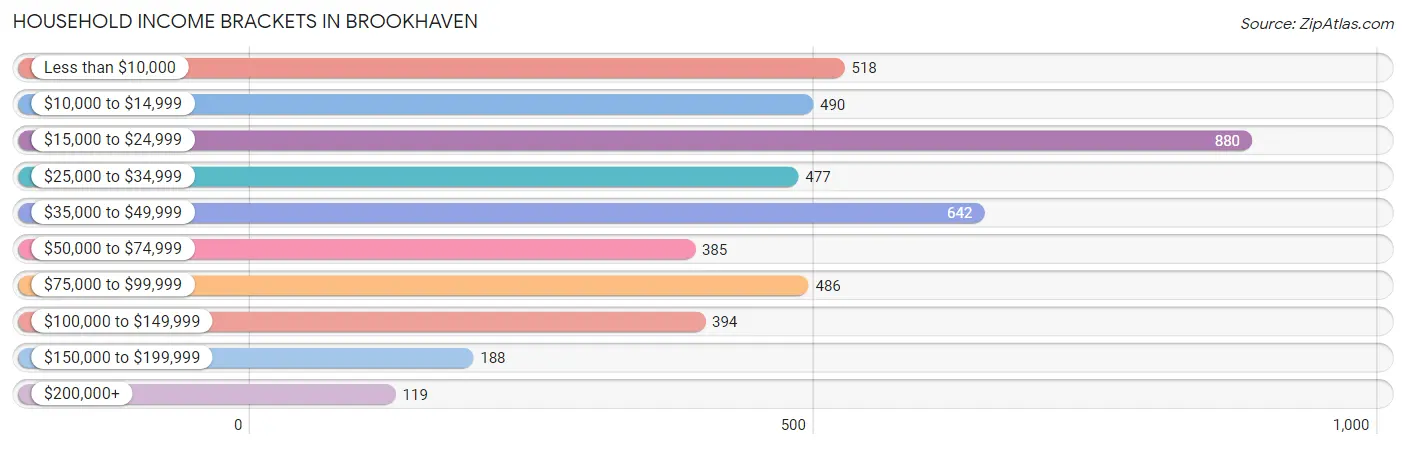
| Income Bracket | # Households | % Households |
| Less than $10,000 | 518 | 11.3% |
| $10,000 to $14,999 | 490 | 10.7% |
| $15,000 to $24,999 | 880 | 19.2% |
| $25,000 to $34,999 | 477 | 10.4% |
| $35,000 to $49,999 | 642 | 14.0% |
| $50,000 to $74,999 | 385 | 8.4% |
| $75,000 to $99,999 | 486 | 10.6% |
| $100,000 to $149,999 | 394 | 8.6% |
| $150,000 to $199,999 | 188 | 4.1% |
| $200,000+ | 119 | 2.6% |
Household Income by Householder Age in Brookhaven
The median household income in Brookhaven is $32,869, with the highest median household income of $41,914 found in the 45 to 64 years age bracket for the primary householder. A total of 1,893 households (41.3%) fall into this category. Meanwhile, the 15 to 24 years age bracket for the primary householder has the lowest median household income of $0, with 96 households (2.1%) in this group.
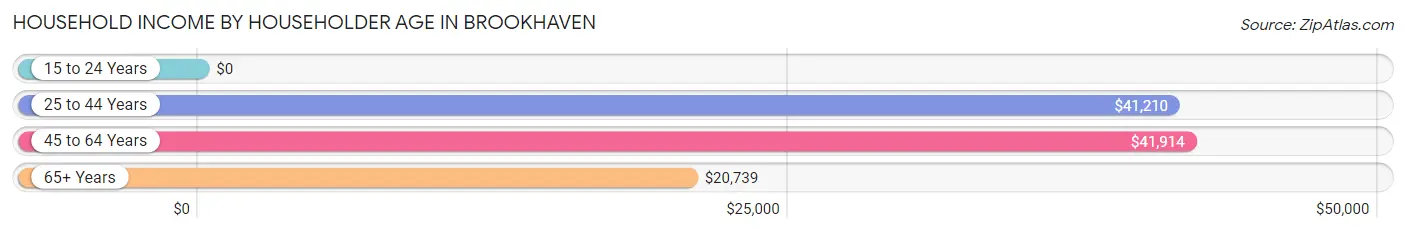
| Income Bracket | # Households | Median Income |
| 15 to 24 Years | 96 (2.1%) | $0 |
| 25 to 44 Years | 1,355 (29.6%) | $41,210 |
| 45 to 64 Years | 1,893 (41.3%) | $41,914 |
| 65+ Years | 1,240 (27.1%) | $20,739 |
| Total | 4,584 (100.0%) | $32,869 |
Poverty in Brookhaven
Income Below Poverty by Sex and Age in Brookhaven
With 28.8% poverty level for males and 33.0% for females among the residents of Brookhaven, under 5 year old males and 16 and 17 year old females are the most vulnerable to poverty, with 252 males (59.2%) and 63 females (73.3%) in their respective age groups living below the poverty level.
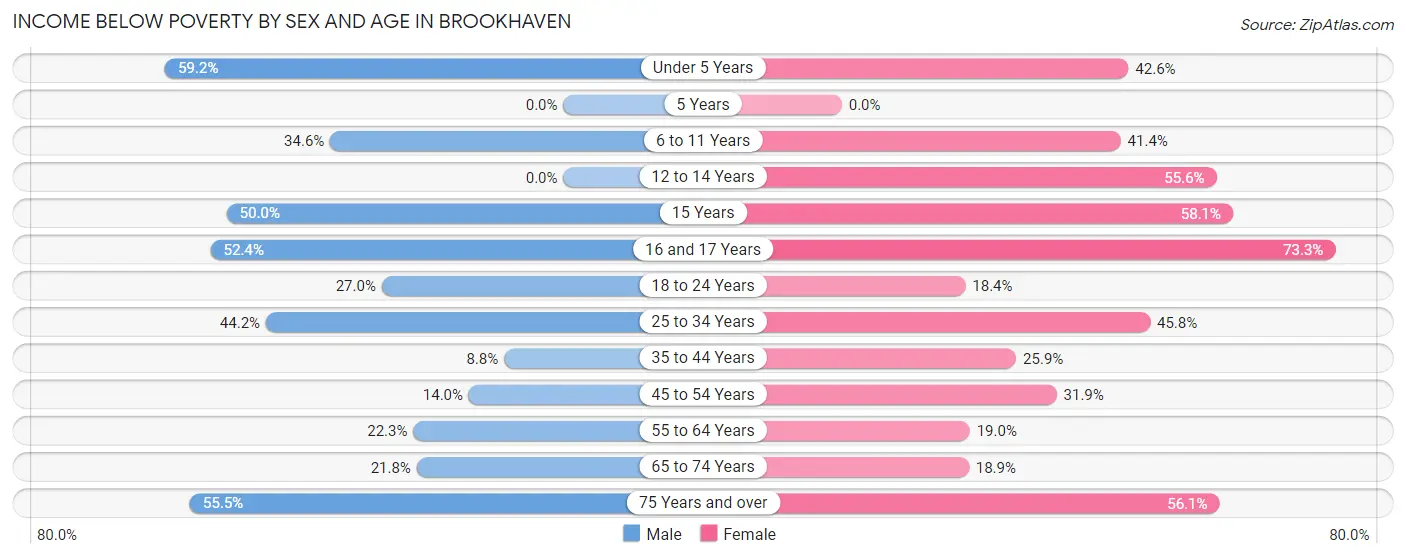
| Age Bracket | Male | Female |
| Under 5 Years | 252 (59.2%) | 206 (42.6%) |
| 5 Years | 0 (0.0%) | 0 (0.0%) |
| 6 to 11 Years | 205 (34.6%) | 176 (41.4%) |
| 12 to 14 Years | 0 (0.0%) | 94 (55.6%) |
| 15 Years | 15 (50.0%) | 18 (58.1%) |
| 16 and 17 Years | 44 (52.4%) | 63 (73.3%) |
| 18 to 24 Years | 96 (27.0%) | 69 (18.3%) |
| 25 to 34 Years | 299 (44.2%) | 325 (45.8%) |
| 35 to 44 Years | 61 (8.8%) | 226 (25.9%) |
| 45 to 54 Years | 79 (14.0%) | 259 (31.9%) |
| 55 to 64 Years | 168 (22.3%) | 206 (19.0%) |
| 65 to 74 Years | 93 (21.8%) | 113 (18.9%) |
| 75 Years and over | 122 (55.4%) | 333 (56.1%) |
| Total | 1,434 (28.8%) | 2,088 (33.0%) |
Income Above Poverty by Sex and Age in Brookhaven
According to the poverty statistics in Brookhaven, males aged 5 years and females aged 5 years are the age groups that are most secure financially, with 100.0% of males and 100.0% of females in these age groups living above the poverty line.
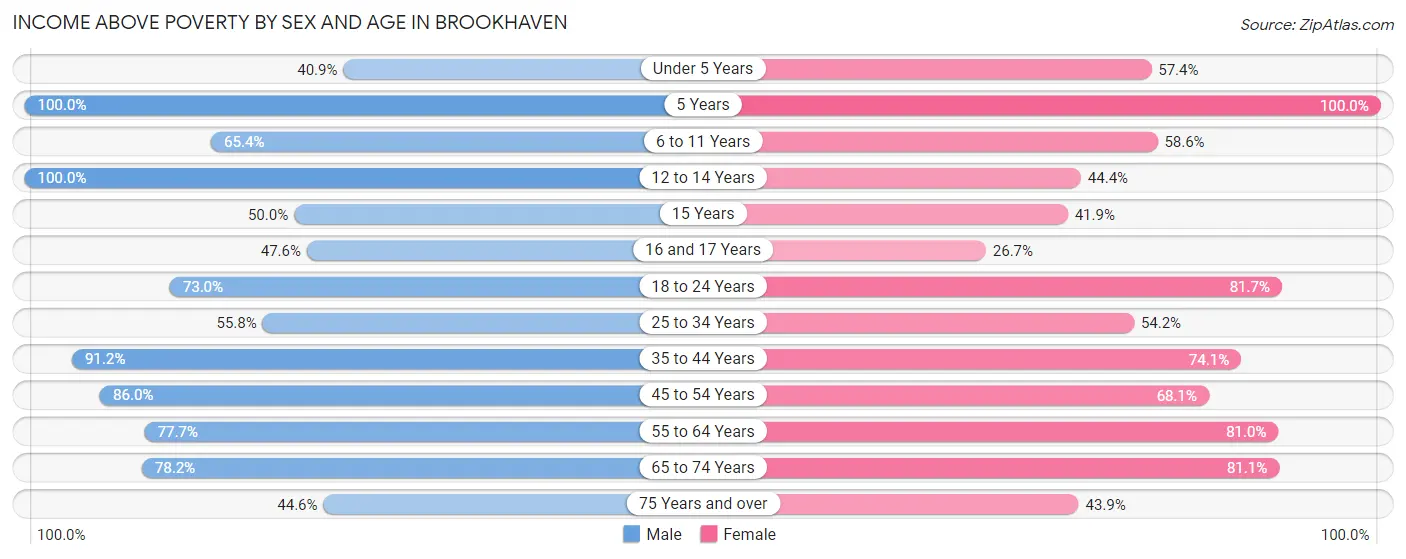
| Age Bracket | Male | Female |
| Under 5 Years | 174 (40.8%) | 278 (57.4%) |
| 5 Years | 26 (100.0%) | 77 (100.0%) |
| 6 to 11 Years | 387 (65.4%) | 249 (58.6%) |
| 12 to 14 Years | 122 (100.0%) | 75 (44.4%) |
| 15 Years | 15 (50.0%) | 13 (41.9%) |
| 16 and 17 Years | 40 (47.6%) | 23 (26.7%) |
| 18 to 24 Years | 260 (73.0%) | 307 (81.7%) |
| 25 to 34 Years | 378 (55.8%) | 385 (54.2%) |
| 35 to 44 Years | 632 (91.2%) | 647 (74.1%) |
| 45 to 54 Years | 484 (86.0%) | 553 (68.1%) |
| 55 to 64 Years | 586 (77.7%) | 878 (81.0%) |
| 65 to 74 Years | 334 (78.2%) | 486 (81.1%) |
| 75 Years and over | 98 (44.6%) | 261 (43.9%) |
| Total | 3,536 (71.2%) | 4,232 (67.0%) |
Income Below Poverty Among Married-Couple Families in Brookhaven
The poverty statistics for married-couple families in Brookhaven show that 10.3% or 144 of the total 1,398 families live below the poverty line. Families with 1 or 2 children have the highest poverty rate of 24.7%, comprising of 100 families. On the other hand, families with 3 or 4 children have the lowest poverty rate of 0.0%, which includes 0 families.
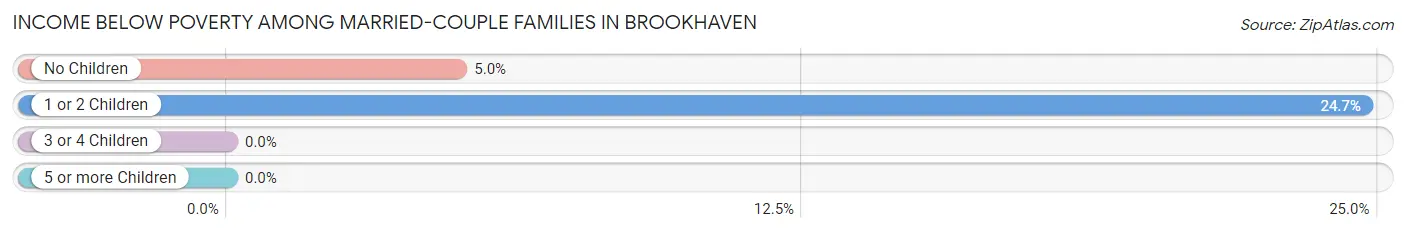
| Children | Above Poverty | Below Poverty |
| No Children | 837 (95.0%) | 44 (5.0%) |
| 1 or 2 Children | 305 (75.3%) | 100 (24.7%) |
| 3 or 4 Children | 112 (100.0%) | 0 (0.0%) |
| 5 or more Children | 0 (0.0%) | 0 (0.0%) |
| Total | 1,254 (89.7%) | 144 (10.3%) |
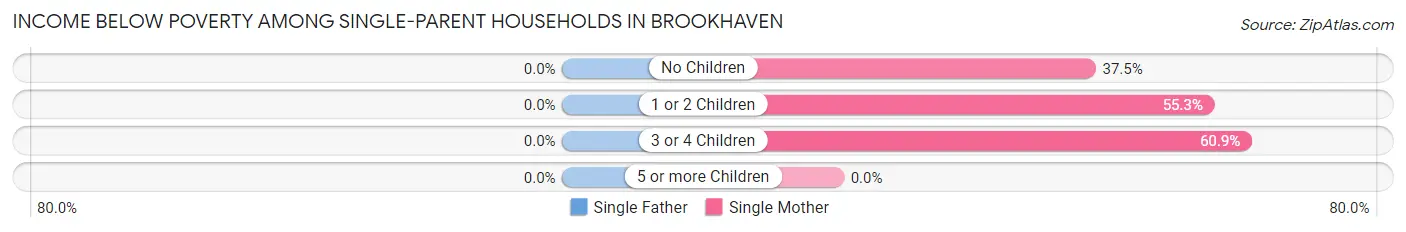
Income Below Poverty Among Single-Parent Households in Brookhaven
| Children | Single Father | Single Mother |
| No Children | 0 (0.0%) | 170 (37.5%) |
| 1 or 2 Children | 0 (0.0%) | 256 (55.3%) |
| 3 or 4 Children | 0 (0.0%) | 140 (60.9%) |
| 5 or more Children | 0 (0.0%) | 0 (0.0%) |
| Total | 0 (0.0%) | 566 (49.4%) |
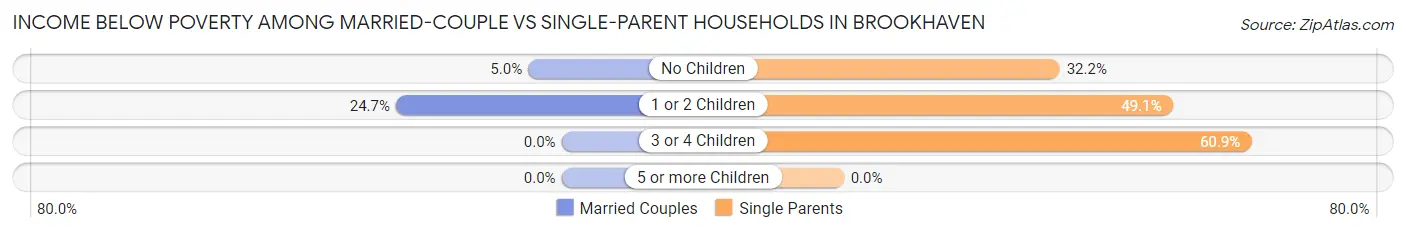
Income Below Poverty Among Married-Couple vs Single-Parent Households in Brookhaven
The poverty data for Brookhaven shows that 144 of the married-couple family households (10.3%) and 566 of the single-parent households (44.3%) are living below the poverty level. Within the married-couple family households, those with 1 or 2 children have the highest poverty rate, with 100 households (24.7%) falling below the poverty line. Among the single-parent households, those with 3 or 4 children have the highest poverty rate, with 140 household (60.9%) living below poverty.
| Children | Married-Couple Families | Single-Parent Households |
| No Children | 44 (5.0%) | 170 (32.2%) |
| 1 or 2 Children | 100 (24.7%) | 256 (49.1%) |
| 3 or 4 Children | 0 (0.0%) | 140 (60.9%) |
| 5 or more Children | 0 (0.0%) | 0 (0.0%) |
| Total | 144 (10.3%) | 566 (44.3%) |
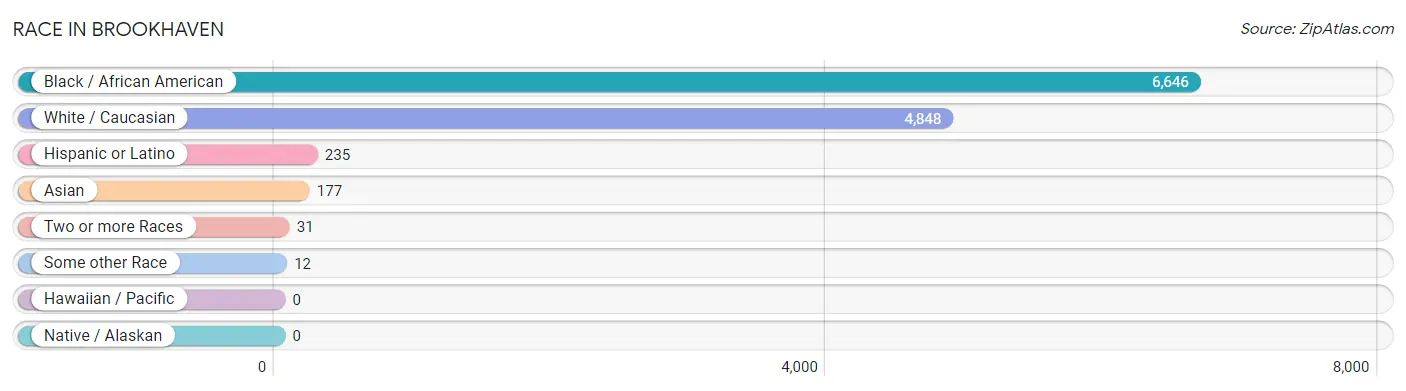
Race in Brookhaven
The most populous races in Brookhaven are Black / African American (6,646 | 56.7%), White / Caucasian (4,848 | 41.4%), and Hispanic or Latino (235 | 2.0%).
| Race | # Population | % Population |
| Asian | 177 | 1.5% |
| Black / African American | 6,646 | 56.7% |
| Hawaiian / Pacific | 0 | 0.0% |
| Hispanic or Latino | 235 | 2.0% |
| Native / Alaskan | 0 | 0.0% |
| White / Caucasian | 4,848 | 41.4% |
| Two or more Races | 31 | 0.3% |
| Some other Race | 12 | 0.1% |
| Total | 11,714 | 100.0% |
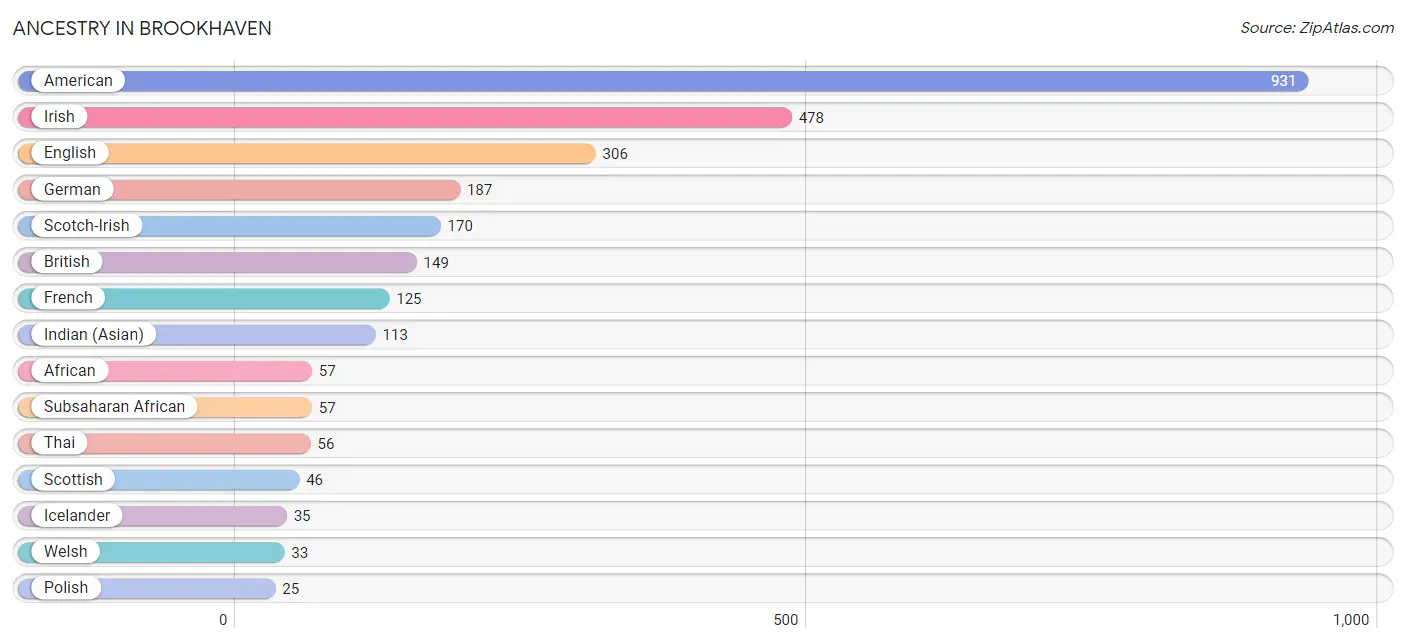
Ancestry in Brookhaven
The most populous ancestries reported in Brookhaven are American (931 | 8.0%), Irish (478 | 4.1%), English (306 | 2.6%), German (187 | 1.6%), and Scotch-Irish (170 | 1.5%), together accounting for 17.7% of all Brookhaven residents.
| Ancestry | # Population | % Population |
| African | 57 | 0.5% |
| American | 931 | 8.0% |
| British | 149 | 1.3% |
| Creek | 9 | 0.1% |
| Cuban | 8 | 0.1% |
| Dutch | 15 | 0.1% |
| English | 306 | 2.6% |
| European | 17 | 0.2% |
| French | 125 | 1.1% |
| French Canadian | 19 | 0.2% |
| German | 187 | 1.6% |
| Icelander | 35 | 0.3% |
| Indian (Asian) | 113 | 1.0% |
| Irish | 478 | 4.1% |
| Italian | 14 | 0.1% |
| Japanese | 3 | 0.0% |
| Korean | 14 | 0.1% |
| Northern European | 21 | 0.2% |
| Pennsylvania German | 8 | 0.1% |
| Polish | 25 | 0.2% |
| Russian | 1 | 0.0% |
| Scotch-Irish | 170 | 1.5% |
| Scottish | 46 | 0.4% |
| Subsaharan African | 57 | 0.5% |
| Swedish | 25 | 0.2% |
| Swiss | 14 | 0.1% |
| Thai | 56 | 0.5% |
| Welsh | 33 | 0.3% | View All 28 Rows |
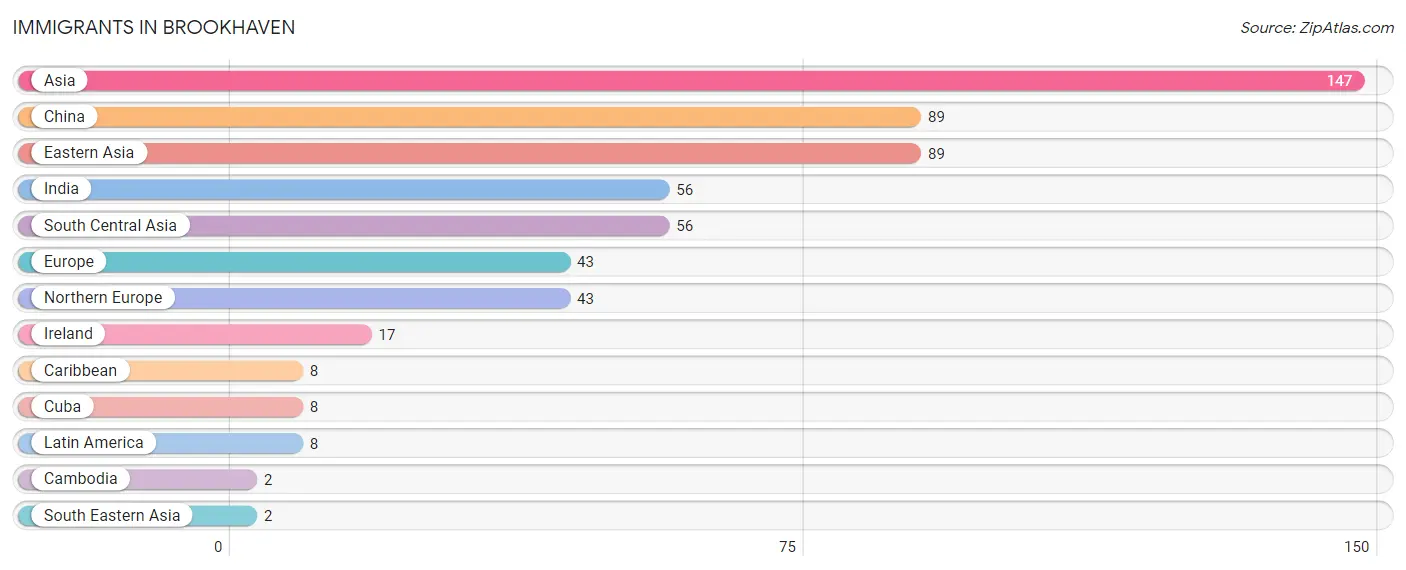
Immigrants in Brookhaven
The most numerous immigrant groups reported in Brookhaven came from Asia (147 | 1.3%), China (89 | 0.8%), Eastern Asia (89 | 0.8%), India (56 | 0.5%), and South Central Asia (56 | 0.5%), together accounting for 3.7% of all Brookhaven residents.
| Immigration Origin | # Population | % Population |
| Asia | 147 | 1.3% |
| Cambodia | 2 | 0.0% |
| Caribbean | 8 | 0.1% |
| China | 89 | 0.8% |
| Cuba | 8 | 0.1% |
| Eastern Asia | 89 | 0.8% |
| Europe | 43 | 0.4% |
| India | 56 | 0.5% |
| Ireland | 17 | 0.2% |
| Latin America | 8 | 0.1% |
| Northern Europe | 43 | 0.4% |
| South Central Asia | 56 | 0.5% |
| South Eastern Asia | 2 | 0.0% | View All 13 Rows |
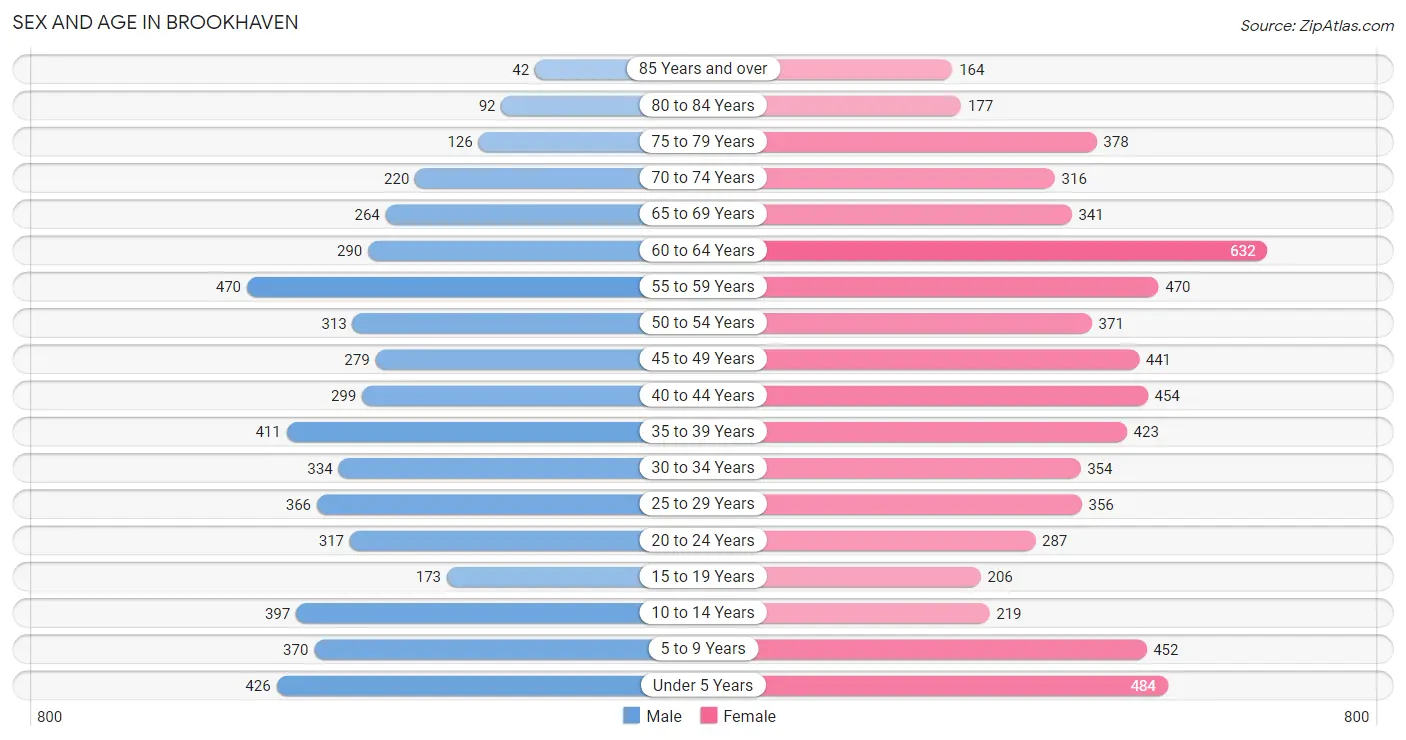
Sex and Age in Brookhaven
Sex and Age in Brookhaven
The most populous age groups in Brookhaven are 55 to 59 Years (470 | 9.1%) for men and 60 to 64 Years (632 | 9.7%) for women.
| Age Bracket | Male | Female |
| Under 5 Years | 426 (8.2%) | 484 (7.4%) |
| 5 to 9 Years | 370 (7.1%) | 452 (6.9%) |
| 10 to 14 Years | 397 (7.6%) | 219 (3.4%) |
| 15 to 19 Years | 173 (3.3%) | 206 (3.2%) |
| 20 to 24 Years | 317 (6.1%) | 287 (4.4%) |
| 25 to 29 Years | 366 (7.0%) | 356 (5.5%) |
| 30 to 34 Years | 334 (6.4%) | 354 (5.4%) |
| 35 to 39 Years | 411 (7.9%) | 423 (6.5%) |
| 40 to 44 Years | 299 (5.8%) | 454 (7.0%) |
| 45 to 49 Years | 279 (5.4%) | 441 (6.8%) |
| 50 to 54 Years | 313 (6.0%) | 371 (5.7%) |
| 55 to 59 Years | 470 (9.1%) | 470 (7.2%) |
| 60 to 64 Years | 290 (5.6%) | 632 (9.7%) |
| 65 to 69 Years | 264 (5.1%) | 341 (5.2%) |
| 70 to 74 Years | 220 (4.2%) | 316 (4.8%) |
| 75 to 79 Years | 126 (2.4%) | 378 (5.8%) |
| 80 to 84 Years | 92 (1.8%) | 177 (2.7%) |
| 85 Years and over | 42 (0.8%) | 164 (2.5%) |
| Total | 5,189 (100.0%) | 6,525 (100.0%) |
Families and Households in Brookhaven
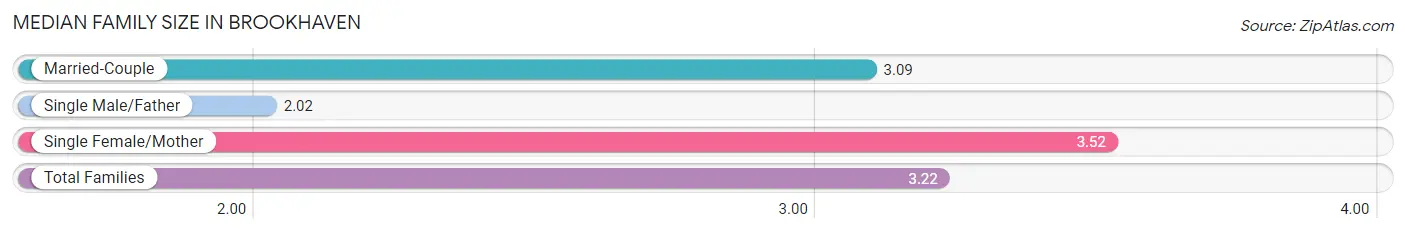
Median Family Size in Brookhaven
The median family size in Brookhaven is 3.22 persons per family, with single female/mother families (1,146 | 42.8%) accounting for the largest median family size of 3.52 persons per family. On the other hand, single male/father families (133 | 5.0%) represent the smallest median family size with 2.02 persons per family.
| Family Type | # Families | Family Size |
| Married-Couple | 1,398 (52.2%) | 3.09 |
| Single Male/Father | 133 (5.0%) | 2.02 |
| Single Female/Mother | 1,146 (42.8%) | 3.52 |
| Total Families | 2,677 (100.0%) | 3.22 |
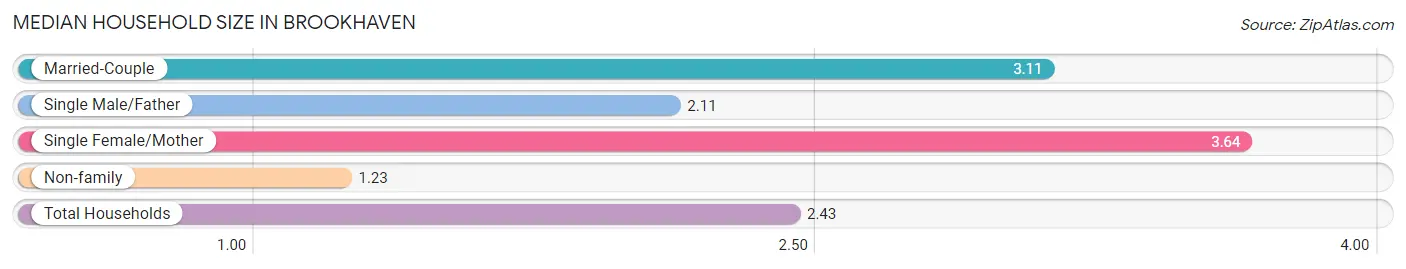
Median Household Size in Brookhaven
The median household size in Brookhaven is 2.43 persons per household, with single female/mother households (1,146 | 25.0%) accounting for the largest median household size of 3.64 persons per household. non-family households (1,907 | 41.6%) represent the smallest median household size with 1.23 persons per household.
| Household Type | # Households | Household Size |
| Married-Couple | 1,398 (30.5%) | 3.11 |
| Single Male/Father | 133 (2.9%) | 2.11 |
| Single Female/Mother | 1,146 (25.0%) | 3.64 |
| Non-family | 1,907 (41.6%) | 1.23 |
| Total Households | 4,584 (100.0%) | 2.43 |
Household Size by Marriage Status in Brookhaven
Out of a total of 4,584 households in Brookhaven, 2,677 (58.4%) are family households, while 1,907 (41.6%) are nonfamily households. The most numerous type of family households are 2-person households, comprising 1,271, and the most common type of nonfamily households are 1-person households, comprising 1,627.
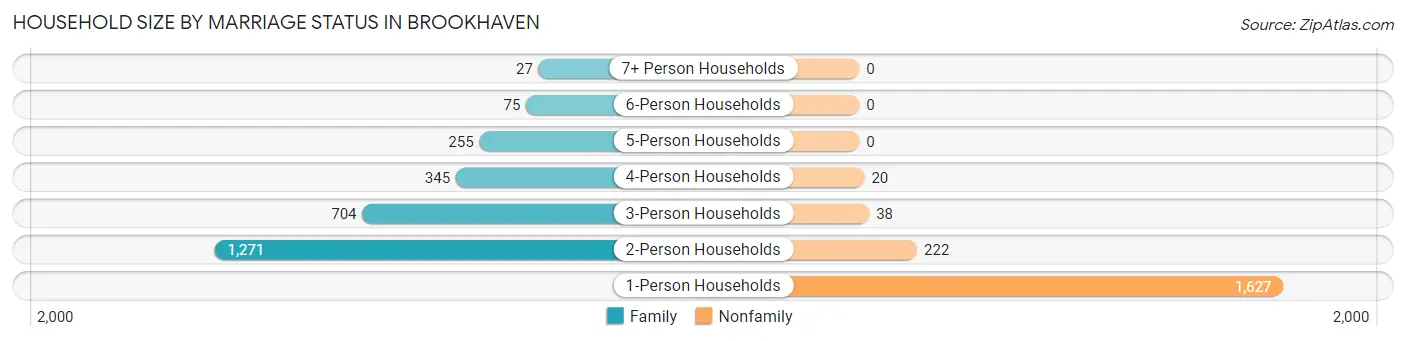
| Household Size | Family Households | Nonfamily Households |
| 1-Person Households | - | 1,627 (35.5%) |
| 2-Person Households | 1,271 (27.7%) | 222 (4.8%) |
| 3-Person Households | 704 (15.4%) | 38 (0.8%) |
| 4-Person Households | 345 (7.5%) | 20 (0.4%) |
| 5-Person Households | 255 (5.6%) | 0 (0.0%) |
| 6-Person Households | 75 (1.6%) | 0 (0.0%) |
| 7+ Person Households | 27 (0.6%) | 0 (0.0%) |
| Total | 2,677 (58.4%) | 1,907 (41.6%) |
Female Fertility in Brookhaven
Fertility by Age in Brookhaven
Average fertility rate in Brookhaven is 73.0 births per 1,000 women. Women in the age bracket of 20 to 34 years have the highest fertility rate with 190.0 births per 1,000 women. Women in the age bracket of 20 to 34 years acount for 100.0% of all women with births.
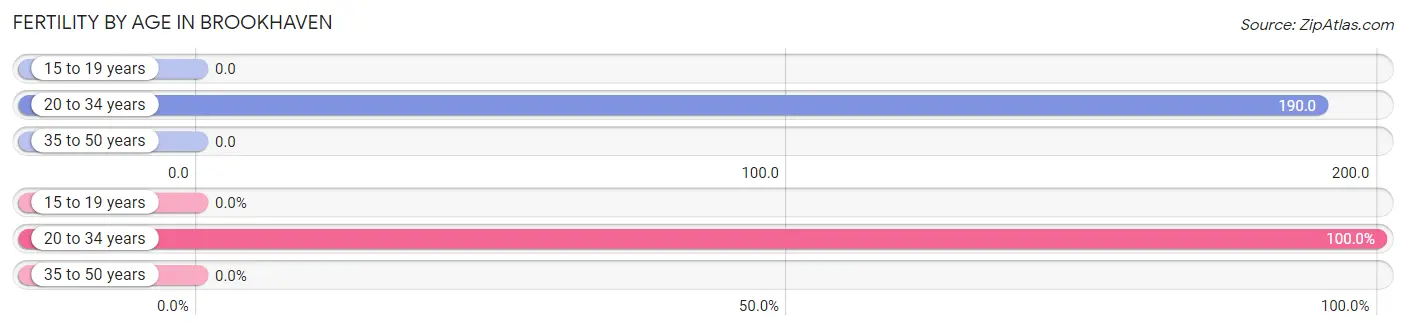
| Age Bracket | Women with Births | Births / 1,000 Women |
| 15 to 19 years | 0 (0.0%) | 0.0 |
| 20 to 34 years | 189 (100.0%) | 190.0 |
| 35 to 50 years | 0 (0.0%) | 0.0 |
| Total | 189 (100.0%) | 73.0 |
Fertility by Age by Marriage Status in Brookhaven
12.7% of women with births (189) in Brookhaven are married. The highest percentage of unmarried women with births falls into 20 to 34 years age bracket with 87.3% of them unmarried at the time of birth, while the lowest percentage of unmarried women with births belong to 20 to 34 years age bracket with 87.3% of them unmarried.
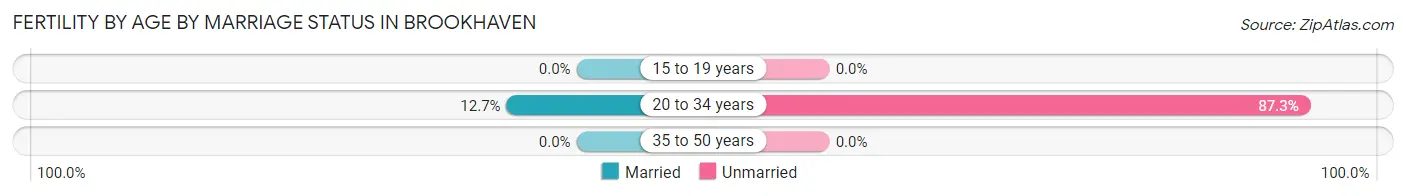
| Age Bracket | Married | Unmarried |
| 15 to 19 years | 0 (0.0%) | 0 (0.0%) |
| 20 to 34 years | 24 (12.7%) | 165 (87.3%) |
| 35 to 50 years | 0 (0.0%) | 0 (0.0%) |
| Total | 24 (12.7%) | 165 (87.3%) |
Fertility by Education in Brookhaven
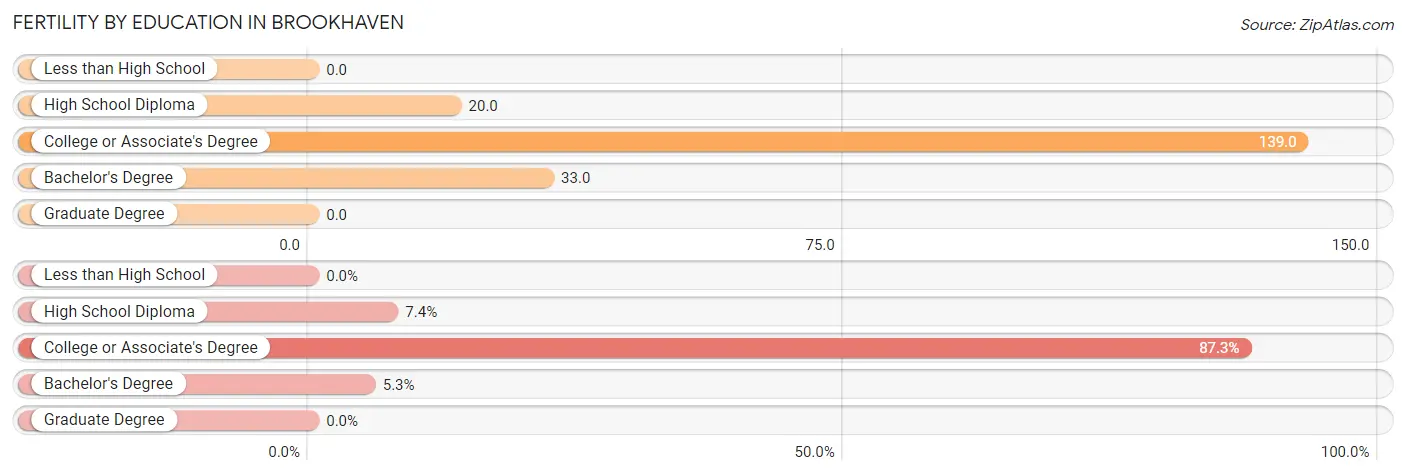
| Educational Attainment | Women with Births | Births / 1,000 Women |
| Less than High School | 0 (0.0%) | 0.0 |
| High School Diploma | 14 (7.4%) | 20.0 |
| College or Associate's Degree | 165 (87.3%) | 139.0 |
| Bachelor's Degree | 10 (5.3%) | 33.0 |
| Graduate Degree | 0 (0.0%) | 0.0 |
| Total | 189 (100.0%) | 73.0 |
Fertility by Education by Marriage Status in Brookhaven
87.3% of women with births in Brookhaven are unmarried. Women with the educational attainment of high school diploma are most likely to be married with 100.0% of them married at childbirth, while women with the educational attainment of college or associate's degree are least likely to be married with 100.0% of them unmarried at childbirth.
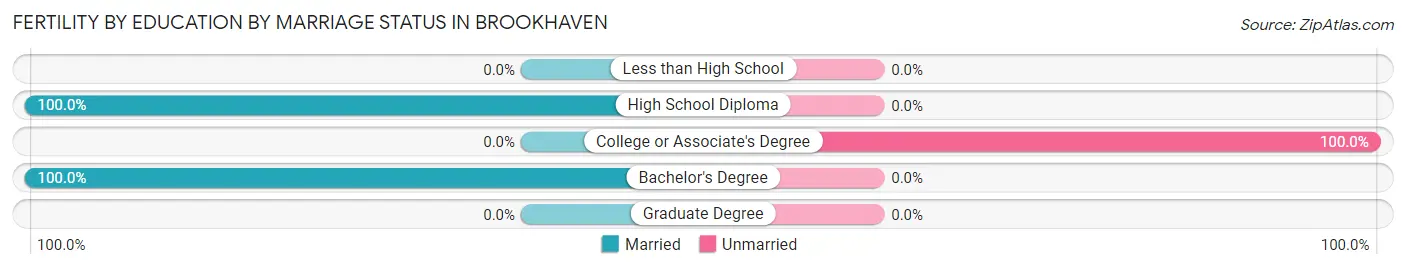
| Educational Attainment | Married | Unmarried |
| Less than High School | 0 (0.0%) | 0 (0.0%) |
| High School Diploma | 14 (100.0%) | 0 (0.0%) |
| College or Associate's Degree | 0 (0.0%) | 165 (100.0%) |
| Bachelor's Degree | 10 (100.0%) | 0 (0.0%) |
| Graduate Degree | 0 (0.0%) | 0 (0.0%) |
| Total | 24 (12.7%) | 165 (87.3%) |
Employment Characteristics in Brookhaven
Employment by Class of Employer in Brookhaven
Among the 4,285 employed individuals in Brookhaven, private company employees (3,087 | 72.0%), state government employees (333 | 7.8%), and not-for-profit organizations (247 | 5.8%) make up the most common classes of employment.
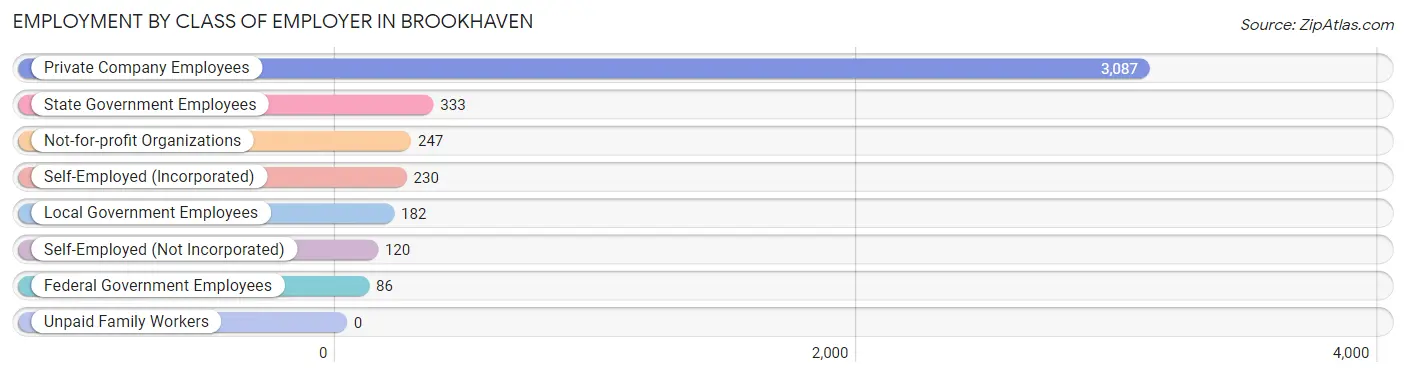
| Employer Class | # Employees | % Employees |
| Private Company Employees | 3,087 | 72.0% |
| Self-Employed (Incorporated) | 230 | 5.4% |
| Self-Employed (Not Incorporated) | 120 | 2.8% |
| Not-for-profit Organizations | 247 | 5.8% |
| Local Government Employees | 182 | 4.3% |
| State Government Employees | 333 | 7.8% |
| Federal Government Employees | 86 | 2.0% |
| Unpaid Family Workers | 0 | 0.0% |
| Total | 4,285 | 100.0% |
Employment Status by Age in Brookhaven
According to the labor force statistics for Brookhaven, out of the total population over 16 years of age (9,301), 50.4% or 4,688 individuals are in the labor force, with 5.6% or 263 of them unemployed. The age group with the highest labor force participation rate is 30 to 34 years, with 81.3% or 559 individuals in the labor force. Within the labor force, the 65 to 74 years age range has the highest percentage of unemployed individuals, with 31.7% or 84 of them being unemployed.
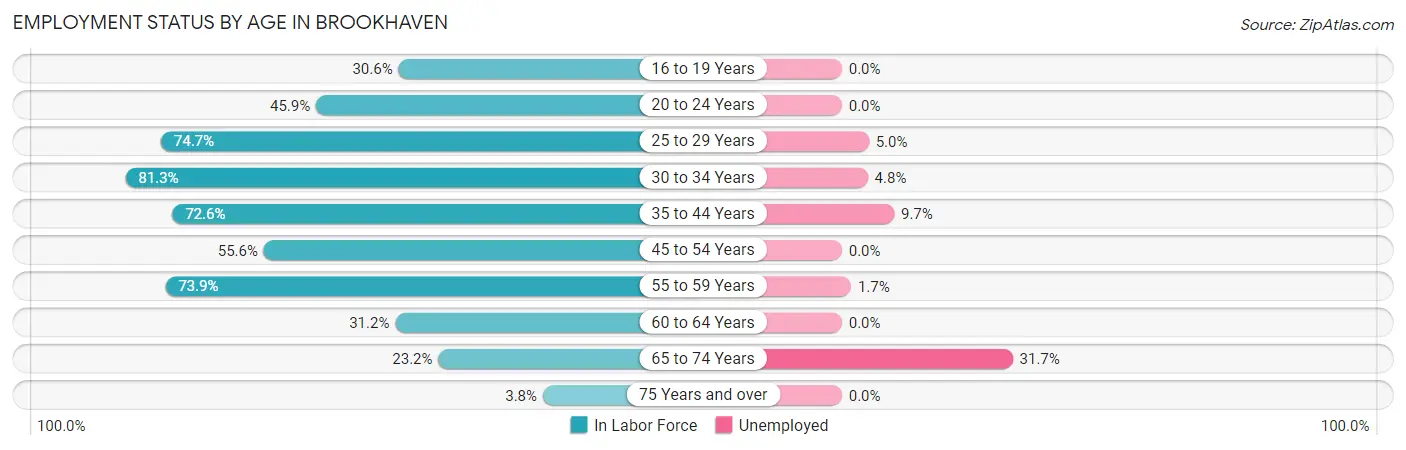
| Age Bracket | In Labor Force | Unemployed |
| 16 to 19 Years | 96 (30.6%) | 0 (0.0%) |
| 20 to 24 Years | 277 (45.9%) | 0 (0.0%) |
| 25 to 29 Years | 539 (74.7%) | 27 (5.0%) |
| 30 to 34 Years | 559 (81.3%) | 27 (4.8%) |
| 35 to 44 Years | 1,152 (72.6%) | 112 (9.7%) |
| 45 to 54 Years | 781 (55.6%) | 0 (0.0%) |
| 55 to 59 Years | 695 (73.9%) | 12 (1.7%) |
| 60 to 64 Years | 288 (31.2%) | 0 (0.0%) |
| 65 to 74 Years | 265 (23.2%) | 84 (31.7%) |
| 75 Years and over | 37 (3.8%) | 0 (0.0%) |
| Total | 4,688 (50.4%) | 263 (5.6%) |
Employment Status by Educational Attainment in Brookhaven
According to labor force statistics for Brookhaven, 64.1% of individuals (4,015) out of the total population between 25 and 64 years of age (6,263) are in the labor force, with 4.4% or 177 of them being unemployed. The group with the highest labor force participation rate are those with the educational attainment of bachelor's degree or higher, with 87.2% or 1,063 individuals in the labor force. Within the labor force, individuals with less than high school education have the highest percentage of unemployment, with 75.0% or 108 of them being unemployed.
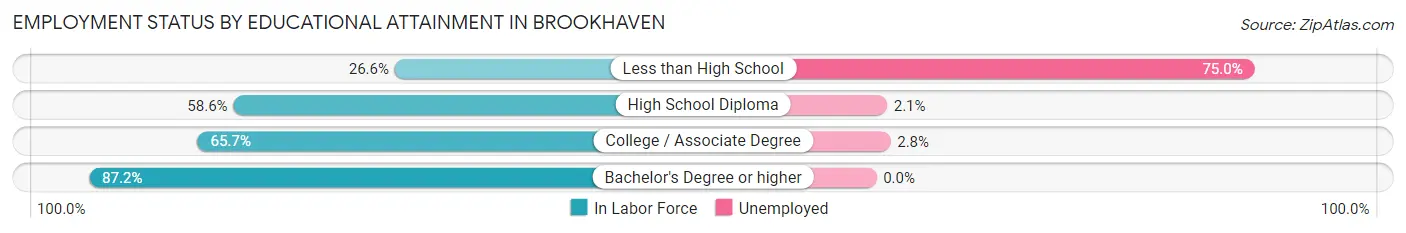
| Educational Attainment | In Labor Force | Unemployed |
| Less than High School | 144 (26.6%) | 406 (75.0%) |
| High School Diploma | 1,237 (58.6%) | 44 (2.1%) |
| College / Associate Degree | 1,572 (65.7%) | 67 (2.8%) |
| Bachelor's Degree or higher | 1,063 (87.2%) | 0 (0.0%) |
| Total | 4,015 (64.1%) | 276 (4.4%) |
Employment Occupations by Sex in Brookhaven
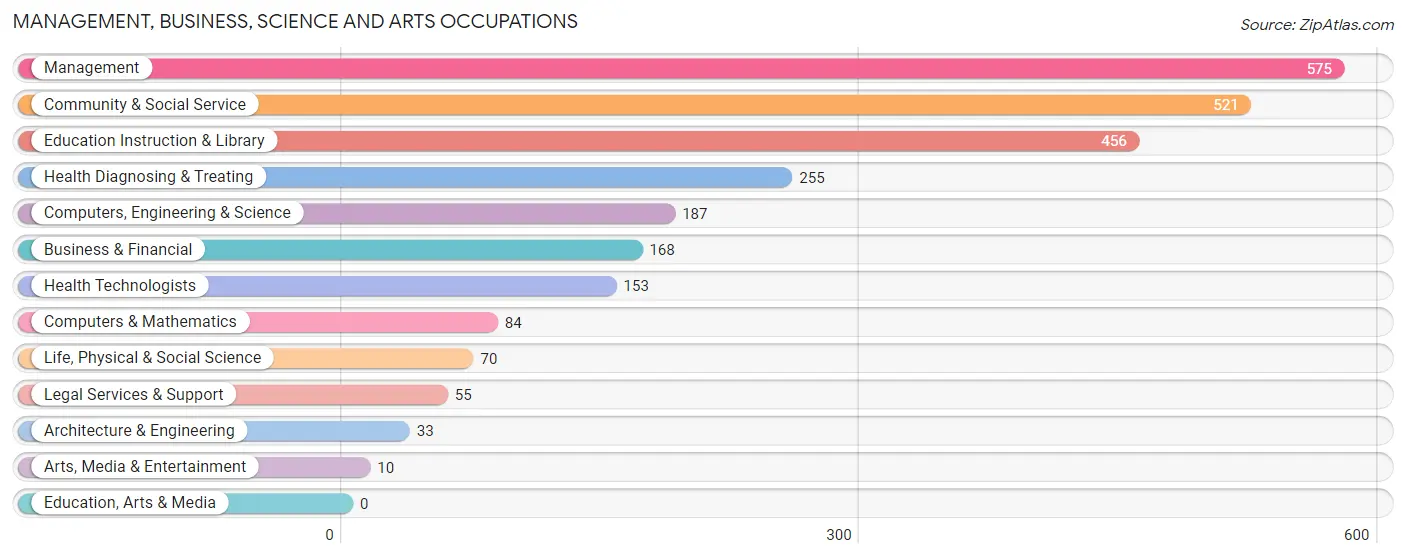
Management, Business, Science and Arts Occupations
The most common Management, Business, Science and Arts occupations in Brookhaven are Management (575 | 13.0%), Community & Social Service (521 | 11.8%), Education Instruction & Library (456 | 10.3%), Health Diagnosing & Treating (255 | 5.8%), and Computers, Engineering & Science (187 | 4.2%).
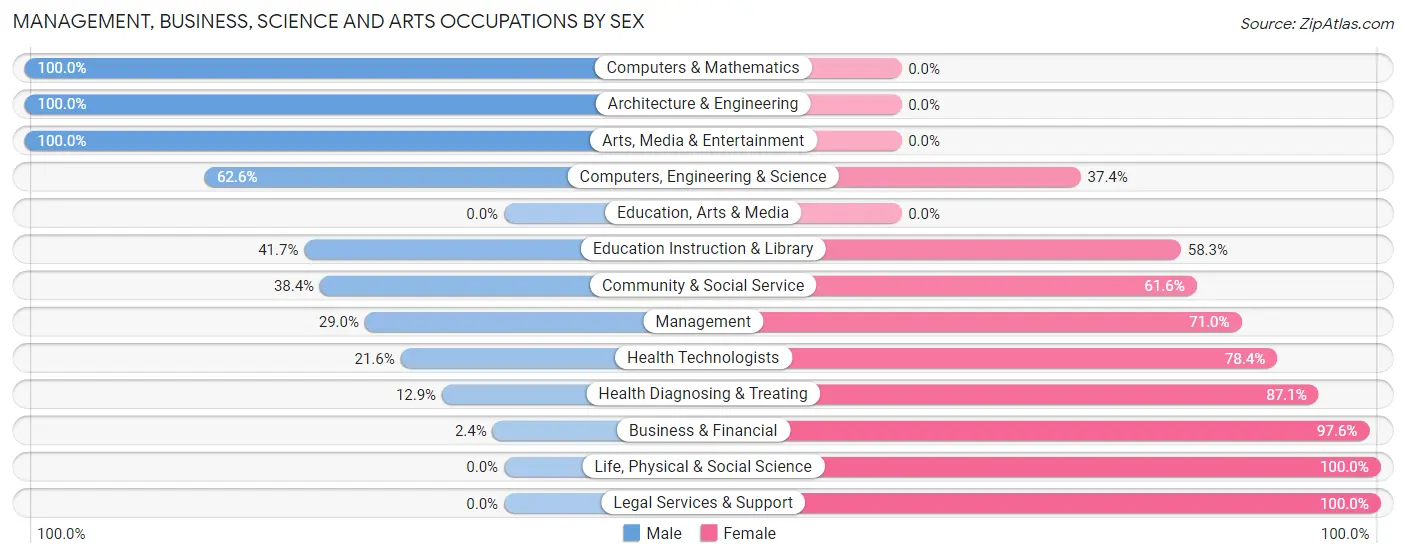
Management, Business, Science and Arts Occupations by Sex
Within the Management, Business, Science and Arts occupations in Brookhaven, the most male-oriented occupations are Computers & Mathematics (100.0%), Architecture & Engineering (100.0%), and Arts, Media & Entertainment (100.0%), while the most female-oriented occupations are Life, Physical & Social Science (100.0%), Legal Services & Support (100.0%), and Business & Financial (97.6%).
| Occupation | Male | Female |
| Management | 167 (29.0%) | 408 (71.0%) |
| Business & Financial | 4 (2.4%) | 164 (97.6%) |
| Computers, Engineering & Science | 117 (62.6%) | 70 (37.4%) |
| Computers & Mathematics | 84 (100.0%) | 0 (0.0%) |
| Architecture & Engineering | 33 (100.0%) | 0 (0.0%) |
| Life, Physical & Social Science | 0 (0.0%) | 70 (100.0%) |
| Community & Social Service | 200 (38.4%) | 321 (61.6%) |
| Education, Arts & Media | 0 (0.0%) | 0 (0.0%) |
| Legal Services & Support | 0 (0.0%) | 55 (100.0%) |
| Education Instruction & Library | 190 (41.7%) | 266 (58.3%) |
| Arts, Media & Entertainment | 10 (100.0%) | 0 (0.0%) |
| Health Diagnosing & Treating | 33 (12.9%) | 222 (87.1%) |
| Health Technologists | 33 (21.6%) | 120 (78.4%) |
| Total (Category) | 521 (30.5%) | 1,185 (69.5%) |
| Total (Overall) | 1,976 (44.6%) | 2,451 (55.4%) |
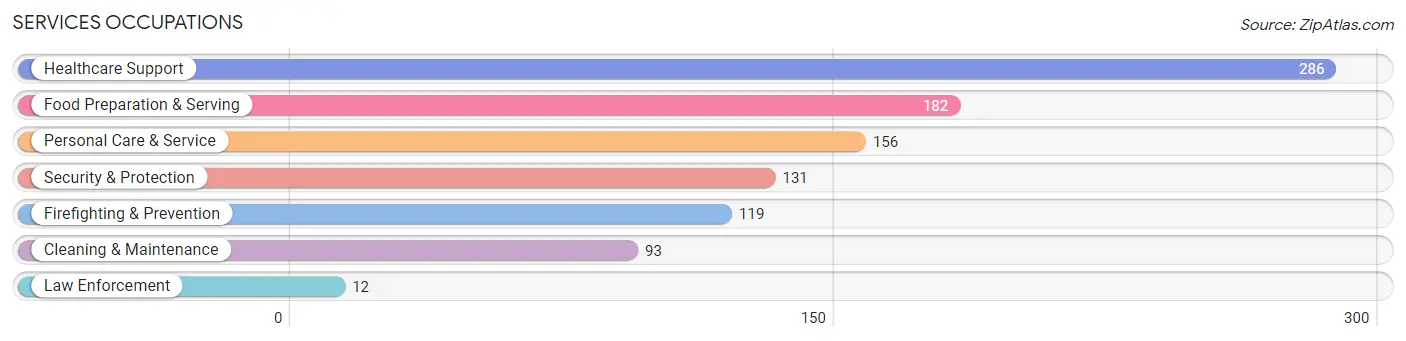
Services Occupations
The most common Services occupations in Brookhaven are Healthcare Support (286 | 6.5%), Food Preparation & Serving (182 | 4.1%), Personal Care & Service (156 | 3.5%), Security & Protection (131 | 3.0%), and Firefighting & Prevention (119 | 2.7%).
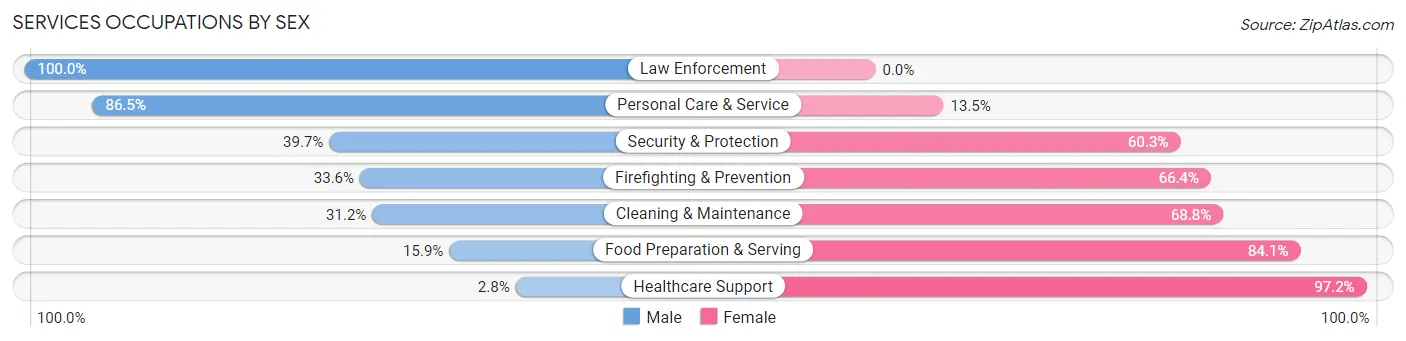
Services Occupations by Sex
Within the Services occupations in Brookhaven, the most male-oriented occupations are Law Enforcement (100.0%), Personal Care & Service (86.5%), and Security & Protection (39.7%), while the most female-oriented occupations are Healthcare Support (97.2%), Food Preparation & Serving (84.1%), and Cleaning & Maintenance (68.8%).
| Occupation | Male | Female |
| Healthcare Support | 8 (2.8%) | 278 (97.2%) |
| Security & Protection | 52 (39.7%) | 79 (60.3%) |
| Firefighting & Prevention | 40 (33.6%) | 79 (66.4%) |
| Law Enforcement | 12 (100.0%) | 0 (0.0%) |
| Food Preparation & Serving | 29 (15.9%) | 153 (84.1%) |
| Cleaning & Maintenance | 29 (31.2%) | 64 (68.8%) |
| Personal Care & Service | 135 (86.5%) | 21 (13.5%) |
| Total (Category) | 253 (29.8%) | 595 (70.2%) |
| Total (Overall) | 1,976 (44.6%) | 2,451 (55.4%) |
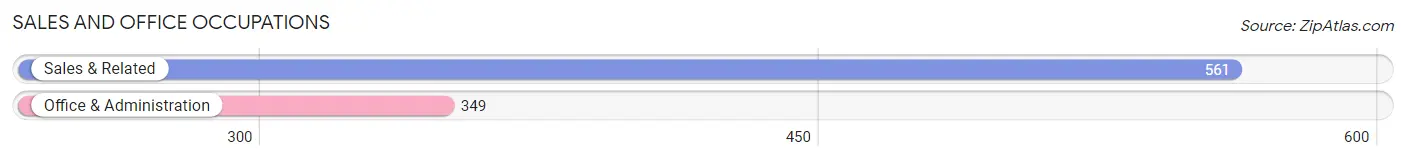
Sales and Office Occupations
The most common Sales and Office occupations in Brookhaven are Sales & Related (561 | 12.7%), and Office & Administration (349 | 7.9%).
Sales and Office Occupations by Sex
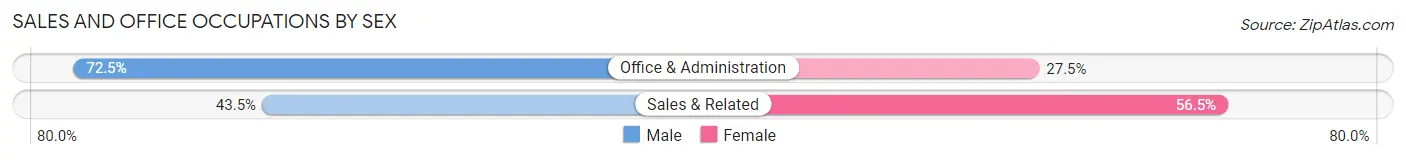
| Occupation | Male | Female |
| Sales & Related | 244 (43.5%) | 317 (56.5%) |
| Office & Administration | 253 (72.5%) | 96 (27.5%) |
| Total (Category) | 497 (54.6%) | 413 (45.4%) |
| Total (Overall) | 1,976 (44.6%) | 2,451 (55.4%) |
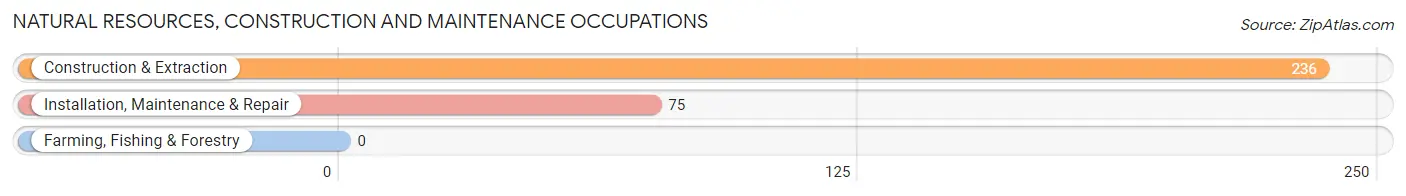
Natural Resources, Construction and Maintenance Occupations
The most common Natural Resources, Construction and Maintenance occupations in Brookhaven are Construction & Extraction (236 | 5.3%), and Installation, Maintenance & Repair (75 | 1.7%).
Natural Resources, Construction and Maintenance Occupations by Sex
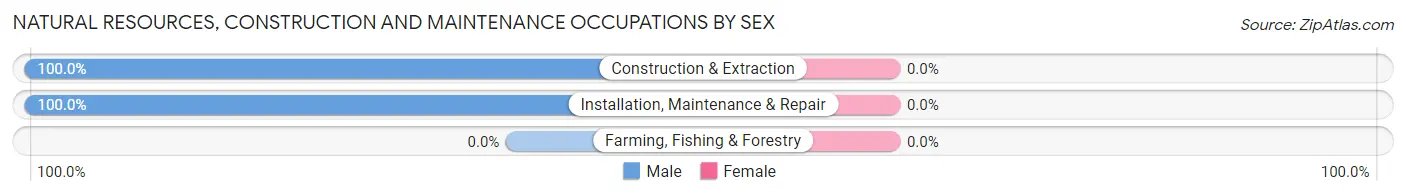
| Occupation | Male | Female |
| Farming, Fishing & Forestry | 0 (0.0%) | 0 (0.0%) |
| Construction & Extraction | 236 (100.0%) | 0 (0.0%) |
| Installation, Maintenance & Repair | 75 (100.0%) | 0 (0.0%) |
| Total (Category) | 311 (100.0%) | 0 (0.0%) |
| Total (Overall) | 1,976 (44.6%) | 2,451 (55.4%) |
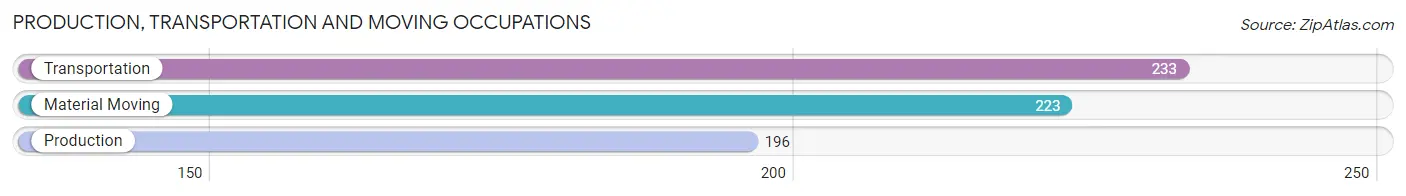
Production, Transportation and Moving Occupations
The most common Production, Transportation and Moving occupations in Brookhaven are Transportation (233 | 5.3%), Material Moving (223 | 5.0%), and Production (196 | 4.4%).
Production, Transportation and Moving Occupations by Sex
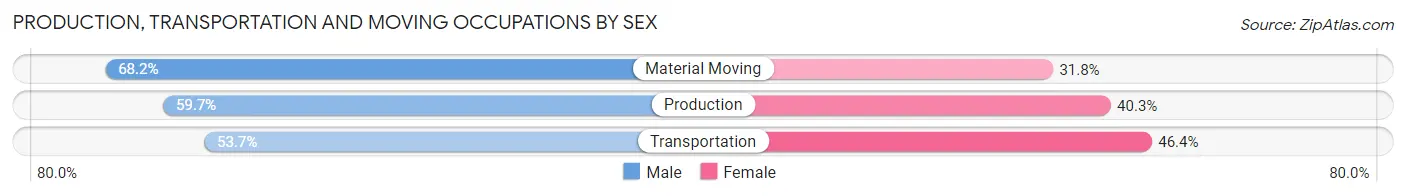
| Occupation | Male | Female |
| Production | 117 (59.7%) | 79 (40.3%) |
| Transportation | 125 (53.6%) | 108 (46.4%) |
| Material Moving | 152 (68.2%) | 71 (31.8%) |
| Total (Category) | 394 (60.4%) | 258 (39.6%) |
| Total (Overall) | 1,976 (44.6%) | 2,451 (55.4%) |
Employment Industries by Sex in Brookhaven
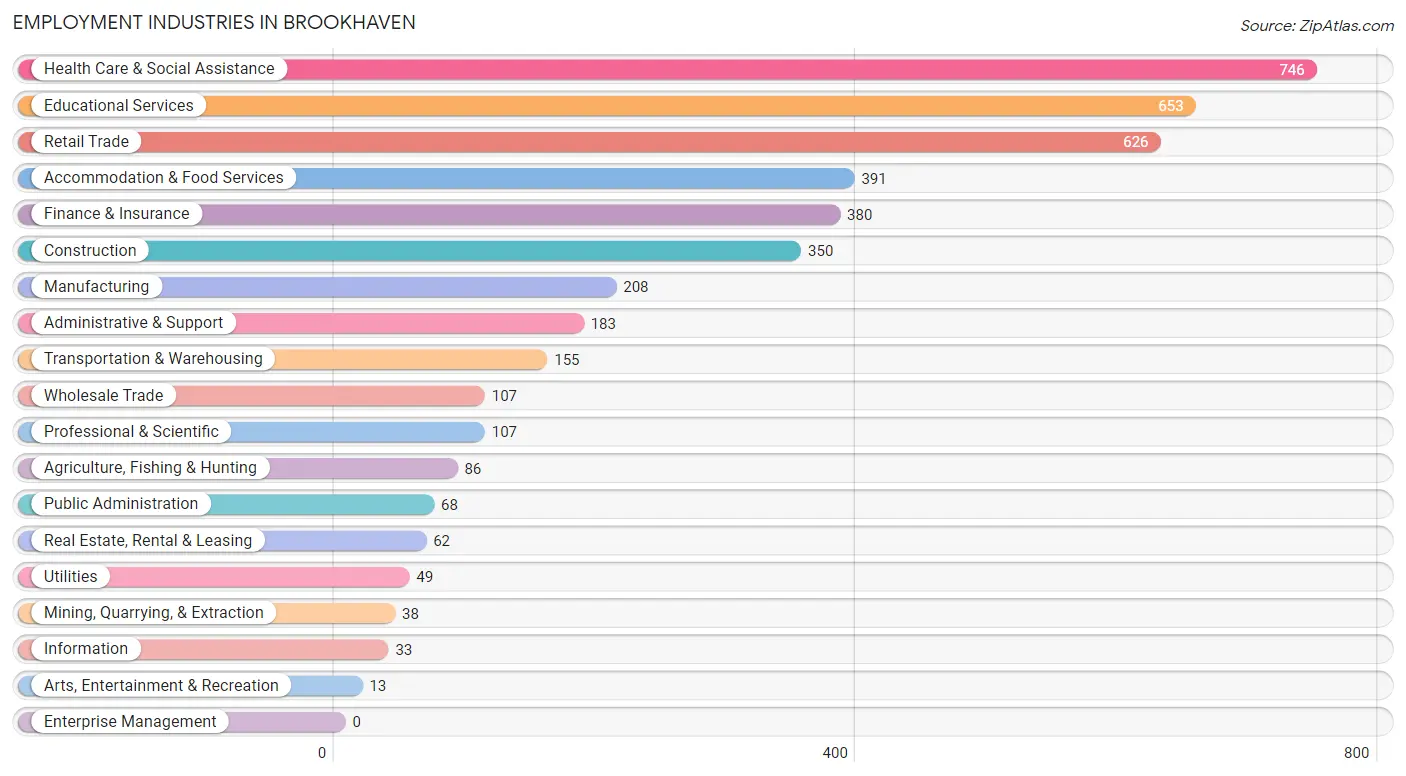
Employment Industries in Brookhaven
The major employment industries in Brookhaven include Health Care & Social Assistance (746 | 16.9%), Educational Services (653 | 14.7%), Retail Trade (626 | 14.1%), Accommodation & Food Services (391 | 8.8%), and Finance & Insurance (380 | 8.6%).
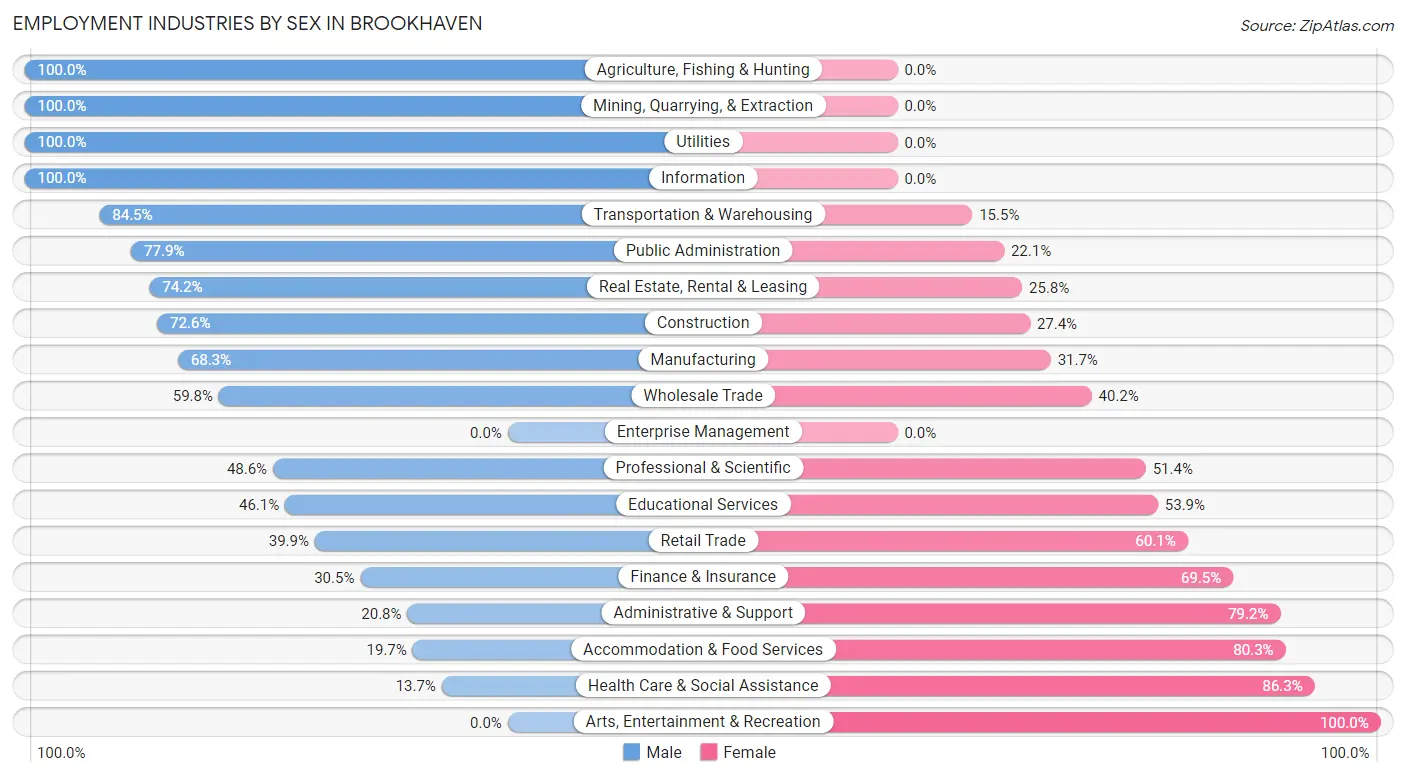
Employment Industries by Sex in Brookhaven
The Brookhaven industries that see more men than women are Agriculture, Fishing & Hunting (100.0%), Mining, Quarrying, & Extraction (100.0%), and Utilities (100.0%), whereas the industries that tend to have a higher number of women are Arts, Entertainment & Recreation (100.0%), Health Care & Social Assistance (86.3%), and Accommodation & Food Services (80.3%).
| Industry | Male | Female |
| Agriculture, Fishing & Hunting | 86 (100.0%) | 0 (0.0%) |
| Mining, Quarrying, & Extraction | 38 (100.0%) | 0 (0.0%) |
| Construction | 254 (72.6%) | 96 (27.4%) |
| Manufacturing | 142 (68.3%) | 66 (31.7%) |
| Wholesale Trade | 64 (59.8%) | 43 (40.2%) |
| Retail Trade | 250 (39.9%) | 376 (60.1%) |
| Transportation & Warehousing | 131 (84.5%) | 24 (15.5%) |
| Utilities | 49 (100.0%) | 0 (0.0%) |
| Information | 33 (100.0%) | 0 (0.0%) |
| Finance & Insurance | 116 (30.5%) | 264 (69.5%) |
| Real Estate, Rental & Leasing | 46 (74.2%) | 16 (25.8%) |
| Professional & Scientific | 52 (48.6%) | 55 (51.4%) |
| Enterprise Management | 0 (0.0%) | 0 (0.0%) |
| Administrative & Support | 38 (20.8%) | 145 (79.2%) |
| Educational Services | 301 (46.1%) | 352 (53.9%) |
| Health Care & Social Assistance | 102 (13.7%) | 644 (86.3%) |
| Arts, Entertainment & Recreation | 0 (0.0%) | 13 (100.0%) |
| Accommodation & Food Services | 77 (19.7%) | 314 (80.3%) |
| Public Administration | 53 (77.9%) | 15 (22.1%) |
| Total | 1,976 (44.6%) | 2,451 (55.4%) |
Education in Brookhaven
School Enrollment in Brookhaven
The most common levels of schooling among the 2,286 students in Brookhaven are elementary school (763 | 33.4%), middle school (442 | 19.3%), and high school (326 | 14.3%).
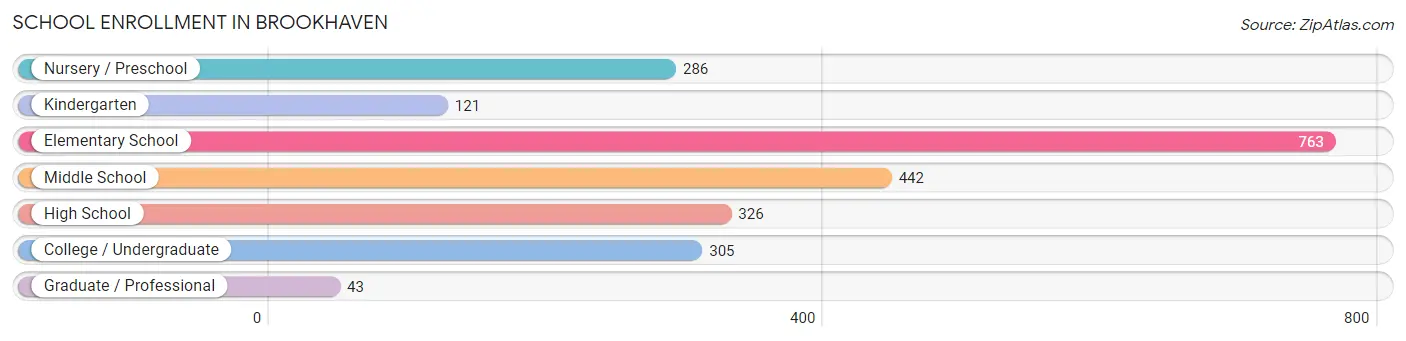
| School Level | # Students | % Students |
| Nursery / Preschool | 286 | 12.5% |
| Kindergarten | 121 | 5.3% |
| Elementary School | 763 | 33.4% |
| Middle School | 442 | 19.3% |
| High School | 326 | 14.3% |
| College / Undergraduate | 305 | 13.3% |
| Graduate / Professional | 43 | 1.9% |
| Total | 2,286 | 100.0% |
School Enrollment by Age by Funding Source in Brookhaven
Out of a total of 2,286 students who are enrolled in schools in Brookhaven, 119 (5.2%) attend a private institution, while the remaining 2,167 (94.8%) are enrolled in public schools. The age group of 25 to 34 year olds has the highest likelihood of being enrolled in private schools, with 16 (32.0% in the age bracket) enrolled. Conversely, the age group of 18 to 19 year olds has the lowest likelihood of being enrolled in a private school, with 84 (100.0% in the age bracket) attending a public institution.
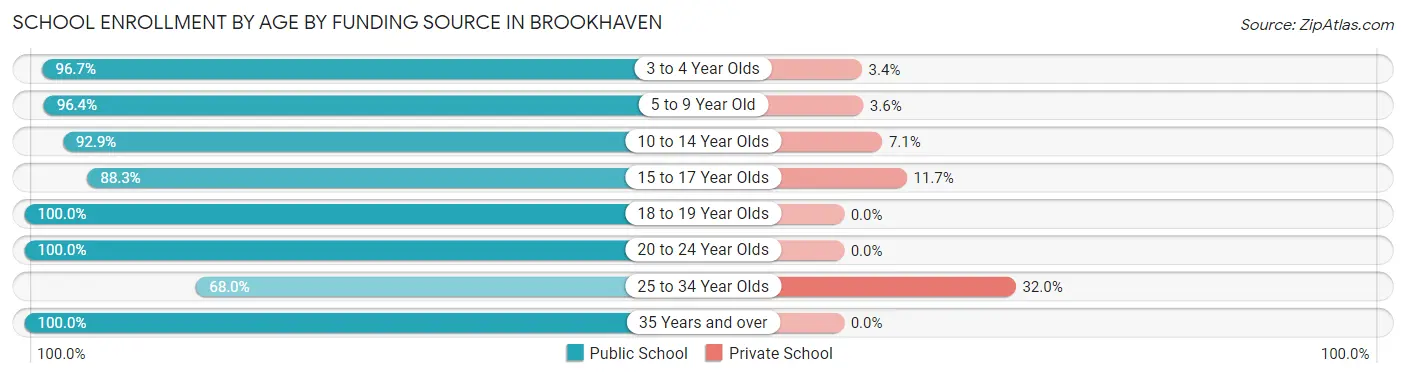
| Age Bracket | Public School | Private School |
| 3 to 4 Year Olds | 202 (96.7%) | 7 (3.4%) |
| 5 to 9 Year Old | 782 (96.4%) | 29 (3.6%) |
| 10 to 14 Year Olds | 572 (92.9%) | 44 (7.1%) |
| 15 to 17 Year Olds | 181 (88.3%) | 24 (11.7%) |
| 18 to 19 Year Olds | 84 (100.0%) | 0 (0.0%) |
| 20 to 24 Year Olds | 110 (100.0%) | 0 (0.0%) |
| 25 to 34 Year Olds | 34 (68.0%) | 16 (32.0%) |
| 35 Years and over | 201 (100.0%) | 0 (0.0%) |
| Total | 2,167 (94.8%) | 119 (5.2%) |
Educational Attainment by Field of Study in Brookhaven
Education (521 | 27.0%), business (400 | 20.7%), social sciences (220 | 11.4%), science & technology (209 | 10.8%), and computers & mathematics (119 | 6.2%) are the most common fields of study among 1,932 individuals in Brookhaven who have obtained a bachelor's degree or higher.
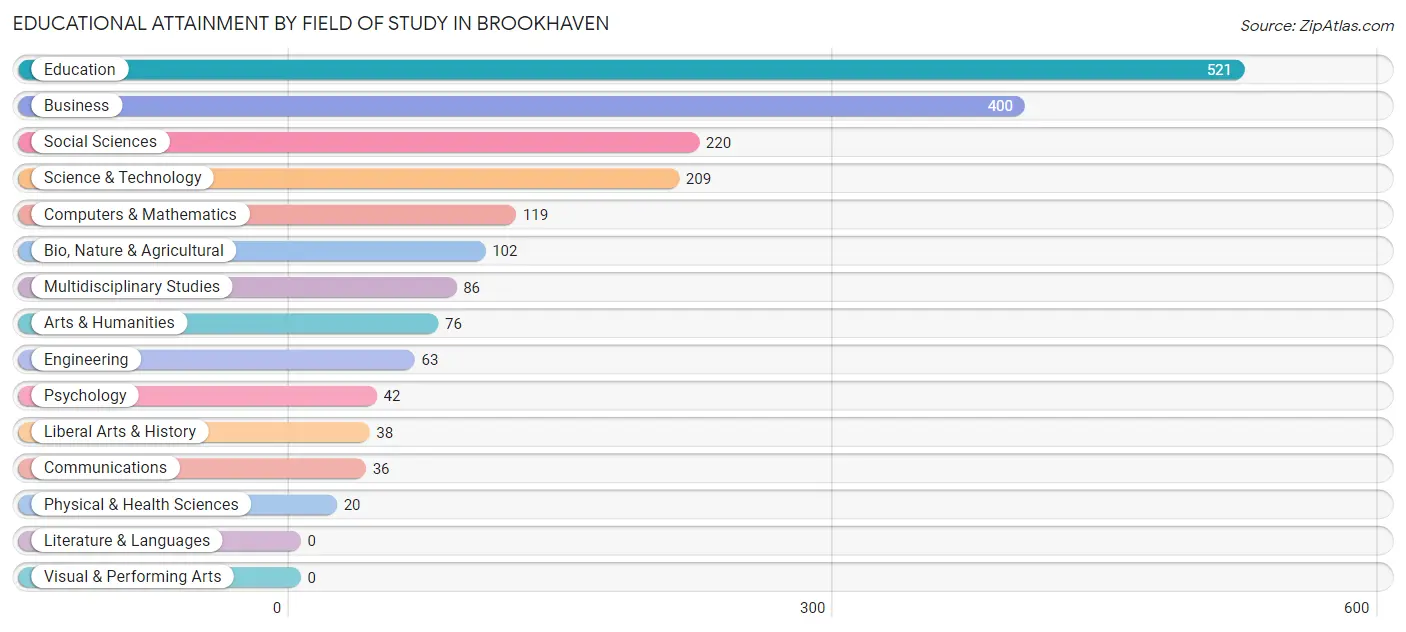
| Field of Study | # Graduates | % Graduates |
| Computers & Mathematics | 119 | 6.2% |
| Bio, Nature & Agricultural | 102 | 5.3% |
| Physical & Health Sciences | 20 | 1.0% |
| Psychology | 42 | 2.2% |
| Social Sciences | 220 | 11.4% |
| Engineering | 63 | 3.3% |
| Multidisciplinary Studies | 86 | 4.4% |
| Science & Technology | 209 | 10.8% |
| Business | 400 | 20.7% |
| Education | 521 | 27.0% |
| Literature & Languages | 0 | 0.0% |
| Liberal Arts & History | 38 | 2.0% |
| Visual & Performing Arts | 0 | 0.0% |
| Communications | 36 | 1.9% |
| Arts & Humanities | 76 | 3.9% |
| Total | 1,932 | 100.0% |
Transportation & Commute in Brookhaven
Vehicle Availability by Sex in Brookhaven
The most prevalent vehicle ownership categories in Brookhaven are males with 2 vehicles (959, accounting for 51.6%) and females with 2 vehicles (1,069, making up 39.6%).
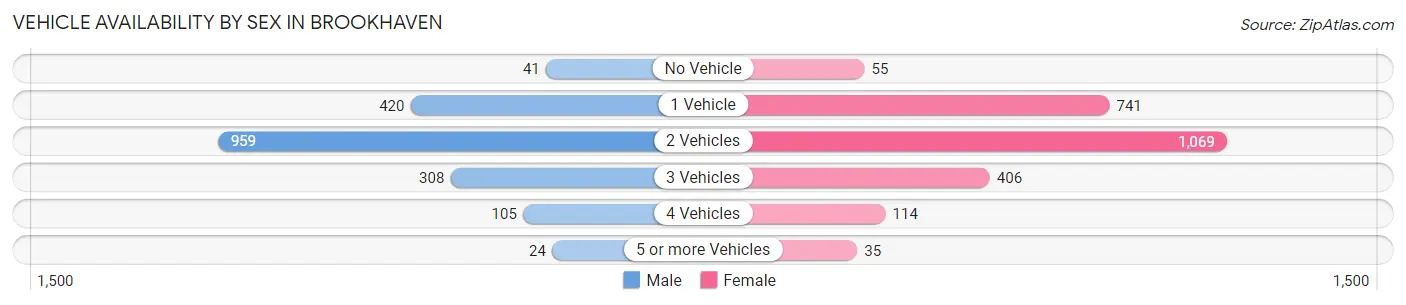
| Vehicles Available | Male | Female |
| No Vehicle | 41 (2.2%) | 55 (2.3%) |
| 1 Vehicle | 420 (22.6%) | 741 (30.6%) |
| 2 Vehicles | 959 (51.6%) | 1,069 (44.2%) |
| 3 Vehicles | 308 (16.6%) | 406 (16.8%) |
| 4 Vehicles | 105 (5.7%) | 114 (4.7%) |
| 5 or more Vehicles | 24 (1.3%) | 35 (1.5%) |
| Total | 1,857 (100.0%) | 2,420 (100.0%) |
Commute Time in Brookhaven
The most frequently occuring commute durations in Brookhaven are 5 to 9 minutes (1,526 commuters, 36.3%), 10 to 14 minutes (1,003 commuters, 23.8%), and less than 5 minutes (419 commuters, 10.0%).
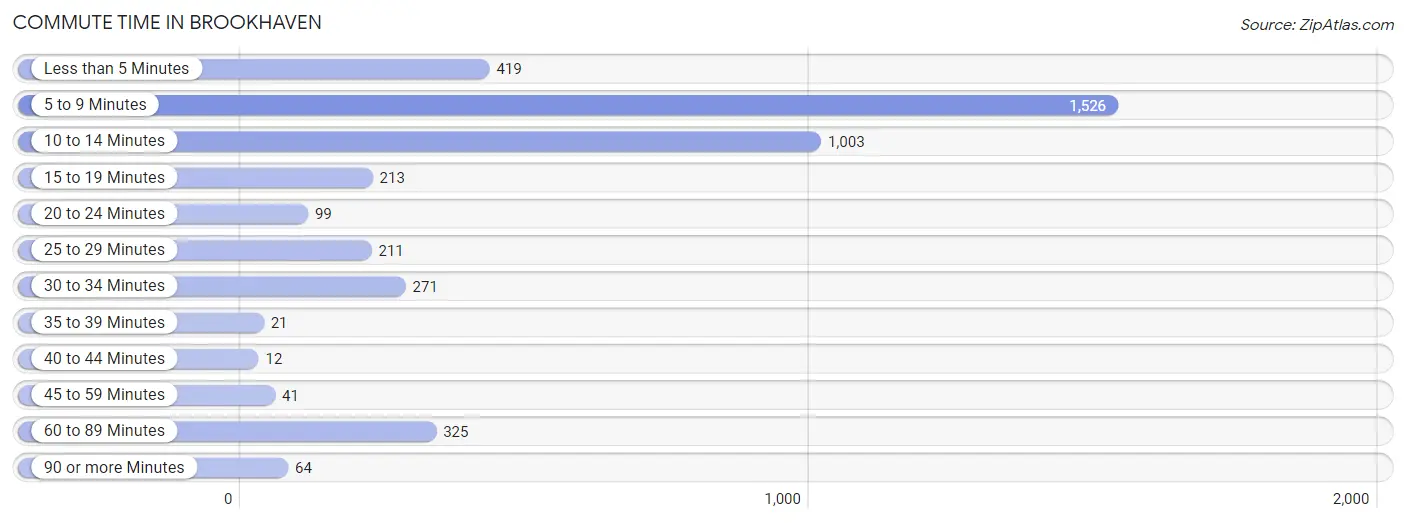
| Commute Time | # Commuters | % Commuters |
| Less than 5 Minutes | 419 | 10.0% |
| 5 to 9 Minutes | 1,526 | 36.3% |
| 10 to 14 Minutes | 1,003 | 23.8% |
| 15 to 19 Minutes | 213 | 5.1% |
| 20 to 24 Minutes | 99 | 2.4% |
| 25 to 29 Minutes | 211 | 5.0% |
| 30 to 34 Minutes | 271 | 6.4% |
| 35 to 39 Minutes | 21 | 0.5% |
| 40 to 44 Minutes | 12 | 0.3% |
| 45 to 59 Minutes | 41 | 1.0% |
| 60 to 89 Minutes | 325 | 7.7% |
| 90 or more Minutes | 64 | 1.5% |
Commute Time by Sex in Brookhaven
The most common commute times in Brookhaven are 5 to 9 minutes (535 commuters, 29.5%) for males and 5 to 9 minutes (991 commuters, 41.4%) for females.
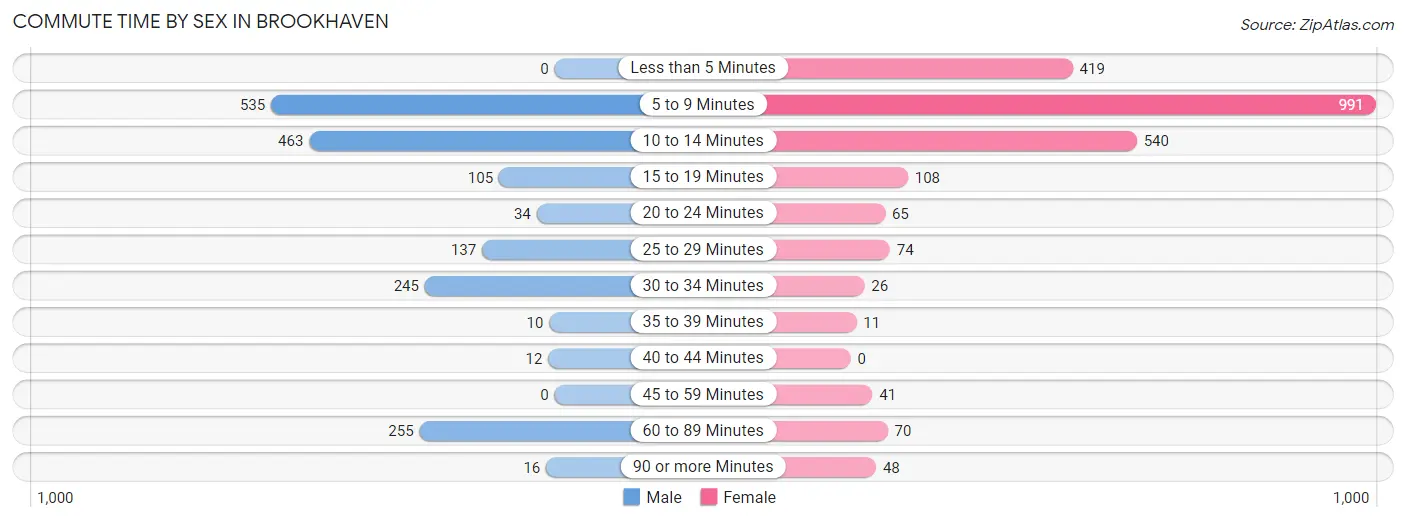
| Commute Time | Male | Female |
| Less than 5 Minutes | 0 (0.0%) | 419 (17.5%) |
| 5 to 9 Minutes | 535 (29.5%) | 991 (41.4%) |
| 10 to 14 Minutes | 463 (25.6%) | 540 (22.6%) |
| 15 to 19 Minutes | 105 (5.8%) | 108 (4.5%) |
| 20 to 24 Minutes | 34 (1.9%) | 65 (2.7%) |
| 25 to 29 Minutes | 137 (7.6%) | 74 (3.1%) |
| 30 to 34 Minutes | 245 (13.5%) | 26 (1.1%) |
| 35 to 39 Minutes | 10 (0.5%) | 11 (0.5%) |
| 40 to 44 Minutes | 12 (0.7%) | 0 (0.0%) |
| 45 to 59 Minutes | 0 (0.0%) | 41 (1.7%) |
| 60 to 89 Minutes | 255 (14.1%) | 70 (2.9%) |
| 90 or more Minutes | 16 (0.9%) | 48 (2.0%) |
Time of Departure to Work by Sex in Brookhaven
The most frequent times of departure to work in Brookhaven are 7:00 AM to 7:29 AM (362, 20.0%) for males and 7:30 AM to 7:59 AM (414, 17.3%) for females.
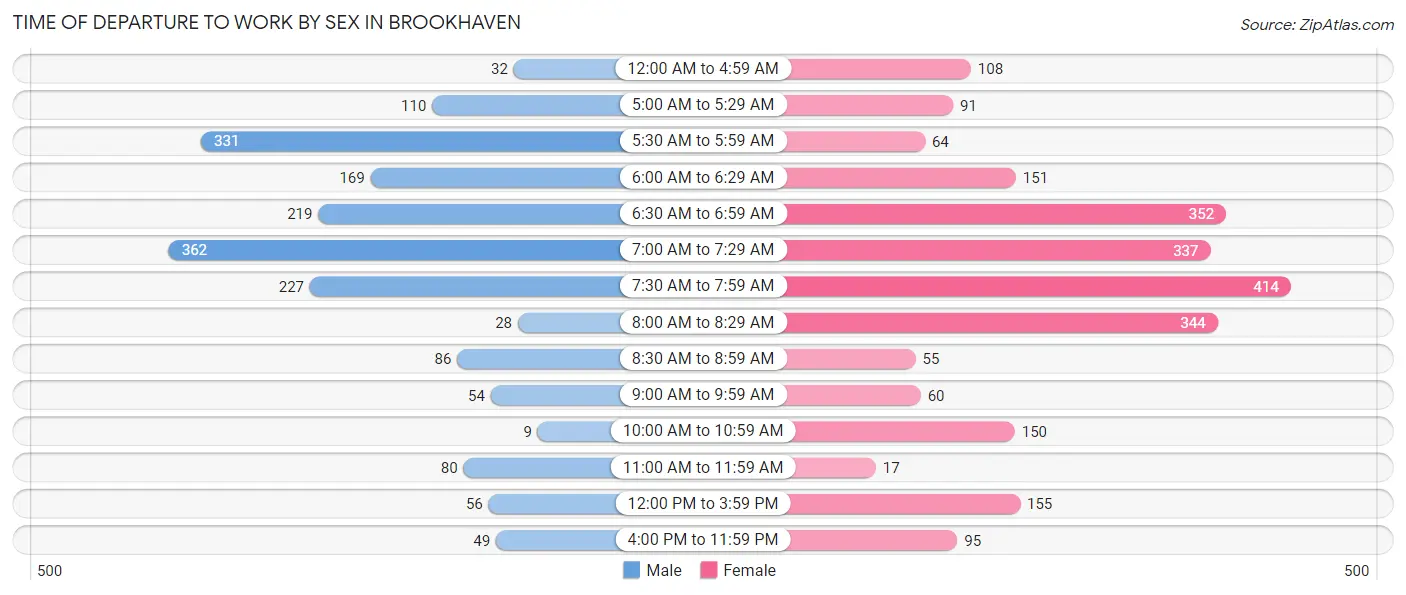
| Time of Departure | Male | Female |
| 12:00 AM to 4:59 AM | 32 (1.8%) | 108 (4.5%) |
| 5:00 AM to 5:29 AM | 110 (6.1%) | 91 (3.8%) |
| 5:30 AM to 5:59 AM | 331 (18.3%) | 64 (2.7%) |
| 6:00 AM to 6:29 AM | 169 (9.3%) | 151 (6.3%) |
| 6:30 AM to 6:59 AM | 219 (12.1%) | 352 (14.7%) |
| 7:00 AM to 7:29 AM | 362 (20.0%) | 337 (14.1%) |
| 7:30 AM to 7:59 AM | 227 (12.5%) | 414 (17.3%) |
| 8:00 AM to 8:29 AM | 28 (1.5%) | 344 (14.4%) |
| 8:30 AM to 8:59 AM | 86 (4.8%) | 55 (2.3%) |
| 9:00 AM to 9:59 AM | 54 (3.0%) | 60 (2.5%) |
| 10:00 AM to 10:59 AM | 9 (0.5%) | 150 (6.3%) |
| 11:00 AM to 11:59 AM | 80 (4.4%) | 17 (0.7%) |
| 12:00 PM to 3:59 PM | 56 (3.1%) | 155 (6.5%) |
| 4:00 PM to 11:59 PM | 49 (2.7%) | 95 (4.0%) |
| Total | 1,812 (100.0%) | 2,393 (100.0%) |
Housing Occupancy in Brookhaven
Occupancy by Ownership in Brookhaven
Of the total 4,584 dwellings in Brookhaven, owner-occupied units account for 2,613 (57.0%), while renter-occupied units make up 1,971 (43.0%).
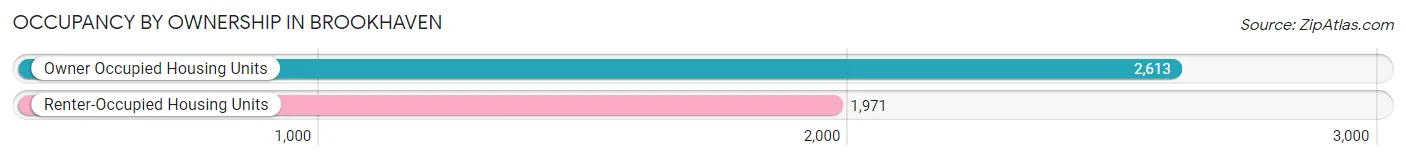
| Occupancy | # Housing Units | % Housing Units |
| Owner Occupied Housing Units | 2,613 | 57.0% |
| Renter-Occupied Housing Units | 1,971 | 43.0% |
| Total Occupied Housing Units | 4,584 | 100.0% |
Occupancy by Household Size in Brookhaven
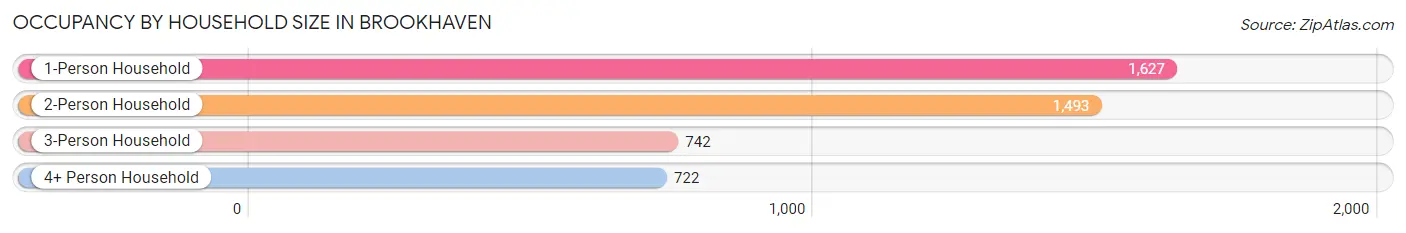
| Household Size | # Housing Units | % Housing Units |
| 1-Person Household | 1,627 | 35.5% |
| 2-Person Household | 1,493 | 32.6% |
| 3-Person Household | 742 | 16.2% |
| 4+ Person Household | 722 | 15.8% |
| Total Housing Units | 4,584 | 100.0% |
Occupancy by Ownership by Household Size in Brookhaven
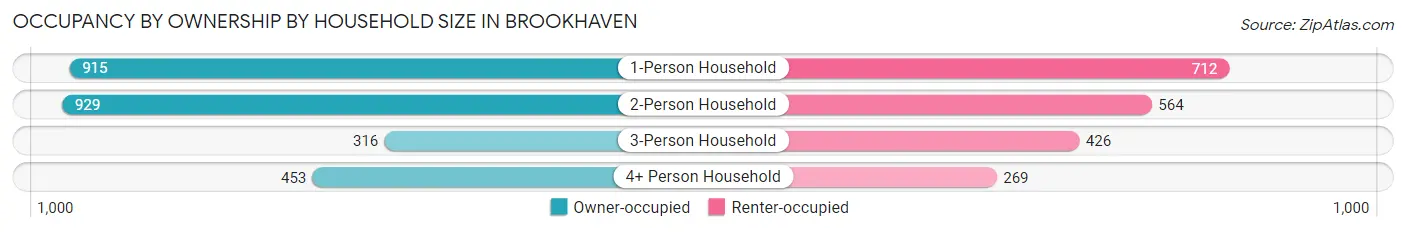
| Household Size | Owner-occupied | Renter-occupied |
| 1-Person Household | 915 (56.2%) | 712 (43.8%) |
| 2-Person Household | 929 (62.2%) | 564 (37.8%) |
| 3-Person Household | 316 (42.6%) | 426 (57.4%) |
| 4+ Person Household | 453 (62.7%) | 269 (37.3%) |
| Total Housing Units | 2,613 (57.0%) | 1,971 (43.0%) |
Occupancy by Educational Attainment in Brookhaven
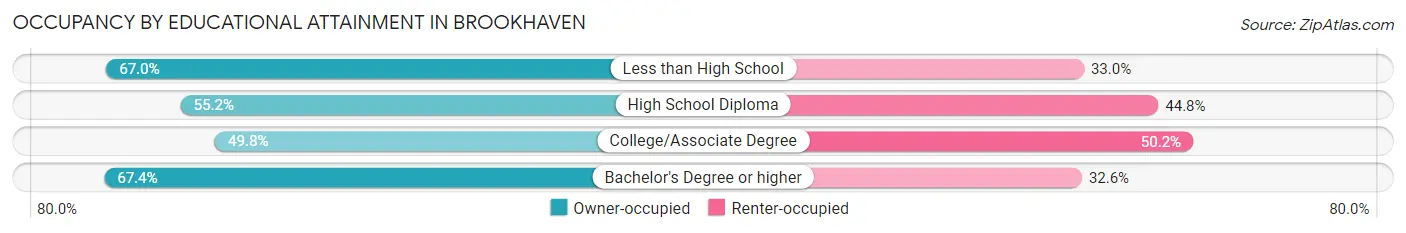
| Household Size | Owner-occupied | Renter-occupied |
| Less than High School | 303 (67.0%) | 149 (33.0%) |
| High School Diploma | 596 (55.2%) | 483 (44.8%) |
| College/Associate Degree | 969 (49.8%) | 978 (50.2%) |
| Bachelor's Degree or higher | 745 (67.4%) | 361 (32.6%) |
Occupancy by Age of Householder in Brookhaven
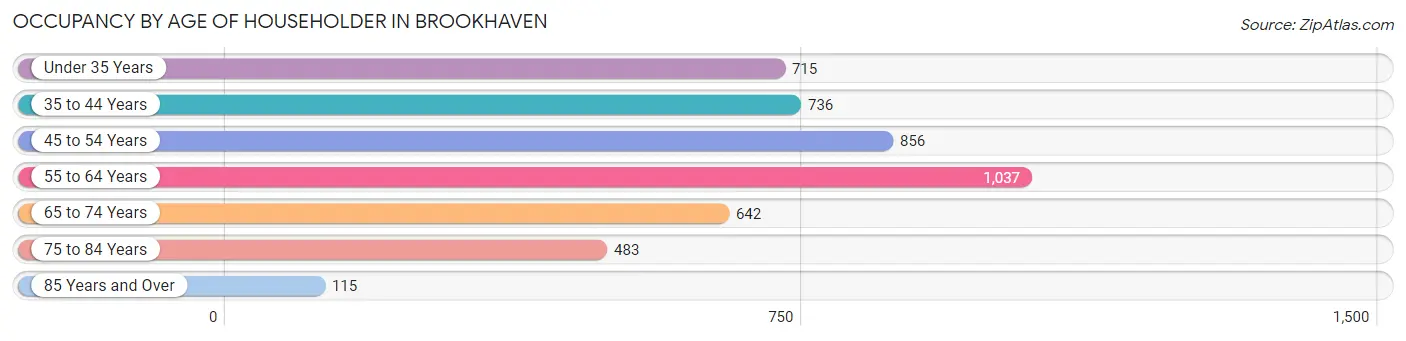
| Age Bracket | # Households | % Households |
| Under 35 Years | 715 | 15.6% |
| 35 to 44 Years | 736 | 16.1% |
| 45 to 54 Years | 856 | 18.7% |
| 55 to 64 Years | 1,037 | 22.6% |
| 65 to 74 Years | 642 | 14.0% |
| 75 to 84 Years | 483 | 10.5% |
| 85 Years and Over | 115 | 2.5% |
| Total | 4,584 | 100.0% |
Housing Finances in Brookhaven
Median Income by Occupancy in Brookhaven
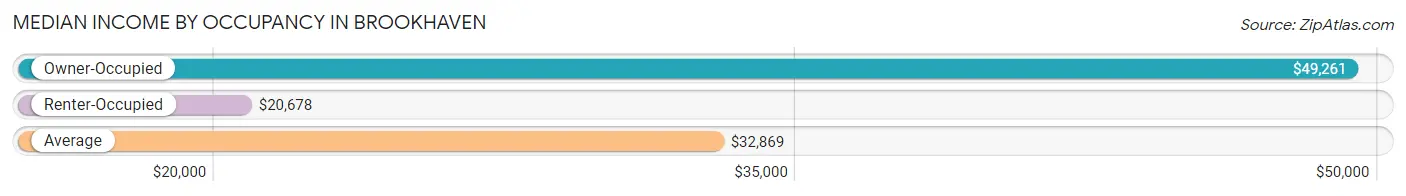
| Occupancy Type | # Households | Median Income |
| Owner-Occupied | 2,613 (57.0%) | $49,261 |
| Renter-Occupied | 1,971 (43.0%) | $20,678 |
| Average | 4,584 (100.0%) | $32,869 |
Occupancy by Householder Income Bracket in Brookhaven
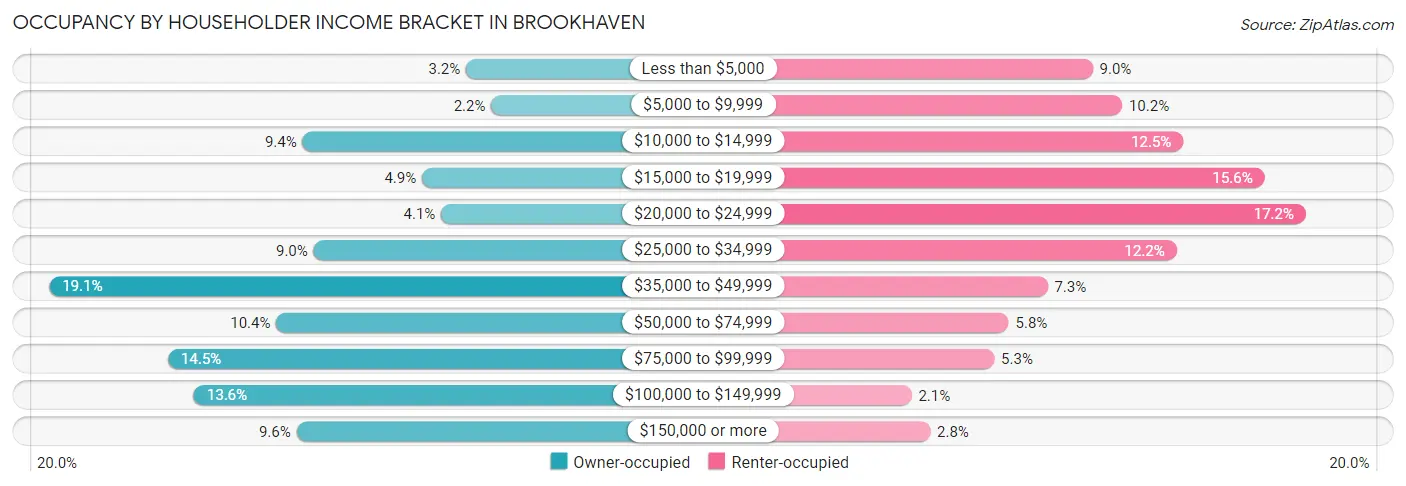
| Income Bracket | Owner-occupied | Renter-occupied |
| Less than $5,000 | 83 (3.2%) | 178 (9.0%) |
| $5,000 to $9,999 | 58 (2.2%) | 200 (10.2%) |
| $10,000 to $14,999 | 246 (9.4%) | 246 (12.5%) |
| $15,000 to $19,999 | 127 (4.9%) | 307 (15.6%) |
| $20,000 to $24,999 | 108 (4.1%) | 338 (17.2%) |
| $25,000 to $34,999 | 235 (9.0%) | 241 (12.2%) |
| $35,000 to $49,999 | 498 (19.1%) | 144 (7.3%) |
| $50,000 to $74,999 | 272 (10.4%) | 115 (5.8%) |
| $75,000 to $99,999 | 380 (14.5%) | 104 (5.3%) |
| $100,000 to $149,999 | 354 (13.6%) | 42 (2.1%) |
| $150,000 or more | 252 (9.6%) | 56 (2.8%) |
| Total | 2,613 (100.0%) | 1,971 (100.0%) |
Monthly Housing Cost Tiers in Brookhaven
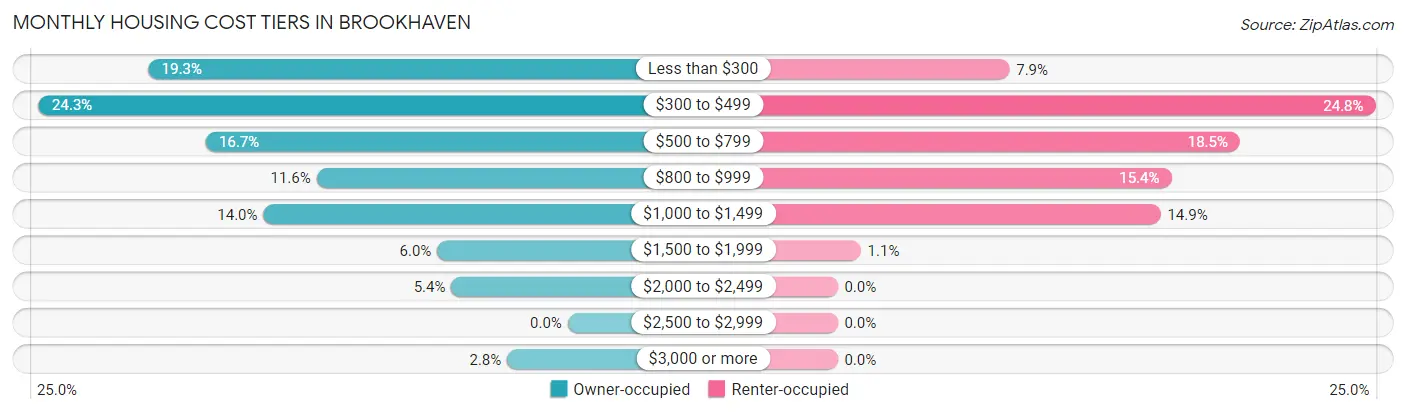
| Monthly Cost | Owner-occupied | Renter-occupied |
| Less than $300 | 504 (19.3%) | 156 (7.9%) |
| $300 to $499 | 636 (24.3%) | 488 (24.8%) |
| $500 to $799 | 435 (16.7%) | 365 (18.5%) |
| $800 to $999 | 302 (11.6%) | 303 (15.4%) |
| $1,000 to $1,499 | 366 (14.0%) | 293 (14.9%) |
| $1,500 to $1,999 | 157 (6.0%) | 21 (1.1%) |
| $2,000 to $2,499 | 140 (5.4%) | 0 (0.0%) |
| $2,500 to $2,999 | 0 (0.0%) | 0 (0.0%) |
| $3,000 or more | 73 (2.8%) | 0 (0.0%) |
| Total | 2,613 (100.0%) | 1,971 (100.0%) |
Physical Housing Characteristics in Brookhaven
Housing Structures in Brookhaven
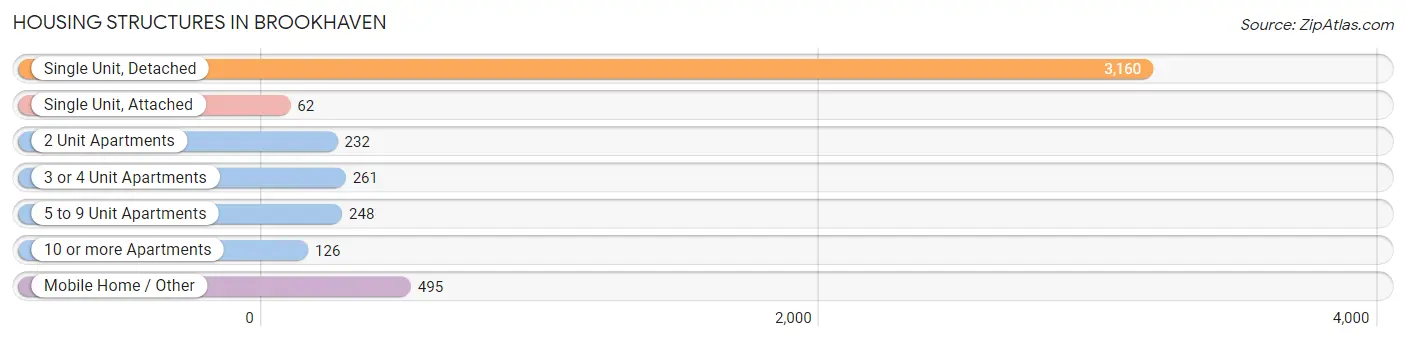
| Structure Type | # Housing Units | % Housing Units |
| Single Unit, Detached | 3,160 | 68.9% |
| Single Unit, Attached | 62 | 1.3% |
| 2 Unit Apartments | 232 | 5.1% |
| 3 or 4 Unit Apartments | 261 | 5.7% |
| 5 to 9 Unit Apartments | 248 | 5.4% |
| 10 or more Apartments | 126 | 2.8% |
| Mobile Home / Other | 495 | 10.8% |
| Total | 4,584 | 100.0% |
Housing Structures by Occupancy in Brookhaven
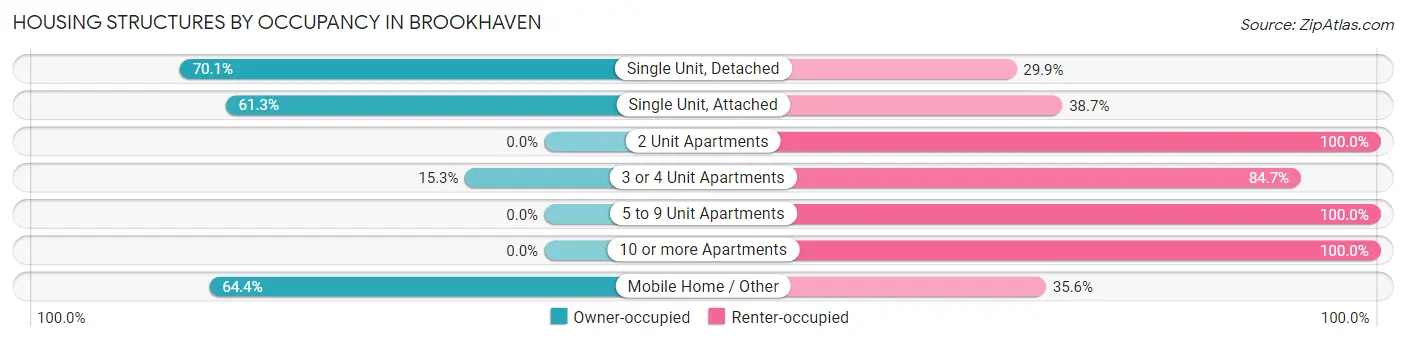
| Structure Type | Owner-occupied | Renter-occupied |
| Single Unit, Detached | 2,216 (70.1%) | 944 (29.9%) |
| Single Unit, Attached | 38 (61.3%) | 24 (38.7%) |
| 2 Unit Apartments | 0 (0.0%) | 232 (100.0%) |
| 3 or 4 Unit Apartments | 40 (15.3%) | 221 (84.7%) |
| 5 to 9 Unit Apartments | 0 (0.0%) | 248 (100.0%) |
| 10 or more Apartments | 0 (0.0%) | 126 (100.0%) |
| Mobile Home / Other | 319 (64.4%) | 176 (35.6%) |
| Total | 2,613 (57.0%) | 1,971 (43.0%) |
Housing Structures by Number of Rooms in Brookhaven
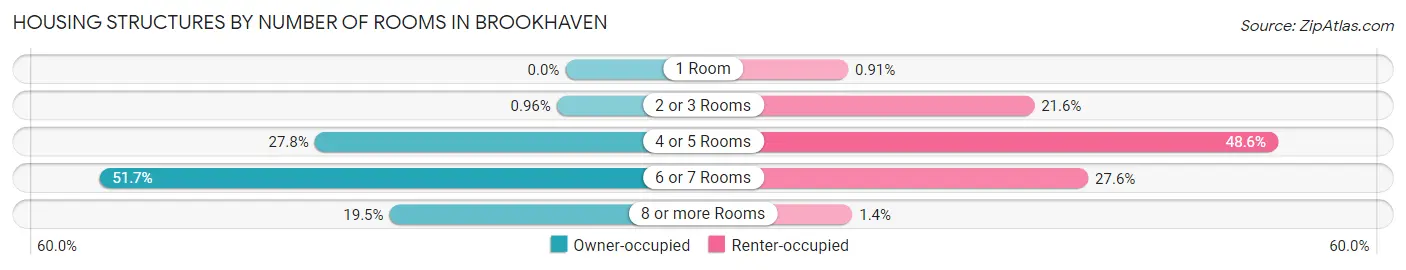
| Number of Rooms | Owner-occupied | Renter-occupied |
| 1 Room | 0 (0.0%) | 18 (0.9%) |
| 2 or 3 Rooms | 25 (1.0%) | 425 (21.6%) |
| 4 or 5 Rooms | 727 (27.8%) | 958 (48.6%) |
| 6 or 7 Rooms | 1,351 (51.7%) | 543 (27.6%) |
| 8 or more Rooms | 510 (19.5%) | 27 (1.4%) |
| Total | 2,613 (100.0%) | 1,971 (100.0%) |
Housing Structure by Heating Type in Brookhaven
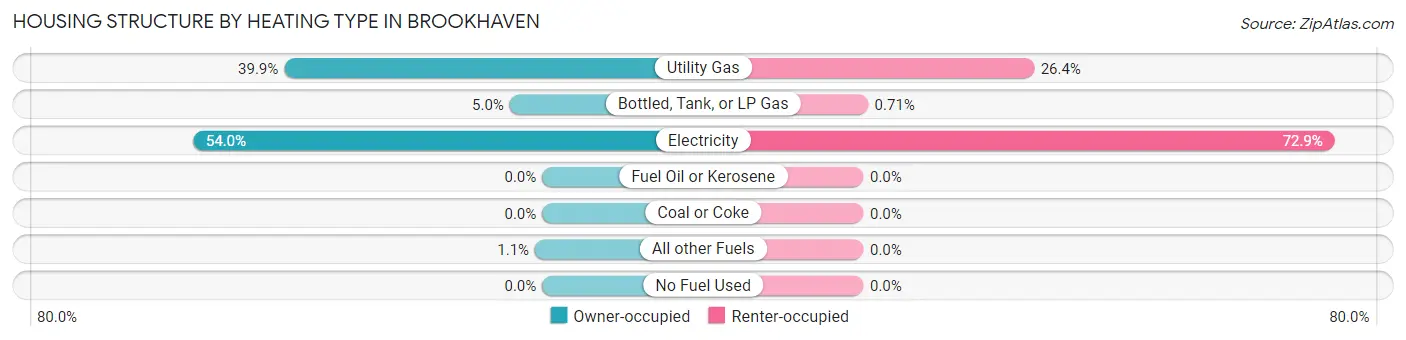
| Heating Type | Owner-occupied | Renter-occupied |
| Utility Gas | 1,042 (39.9%) | 520 (26.4%) |
| Bottled, Tank, or LP Gas | 131 (5.0%) | 14 (0.7%) |
| Electricity | 1,411 (54.0%) | 1,437 (72.9%) |
| Fuel Oil or Kerosene | 0 (0.0%) | 0 (0.0%) |
| Coal or Coke | 0 (0.0%) | 0 (0.0%) |
| All other Fuels | 29 (1.1%) | 0 (0.0%) |
| No Fuel Used | 0 (0.0%) | 0 (0.0%) |
| Total | 2,613 (100.0%) | 1,971 (100.0%) |
Household Vehicle Usage in Brookhaven
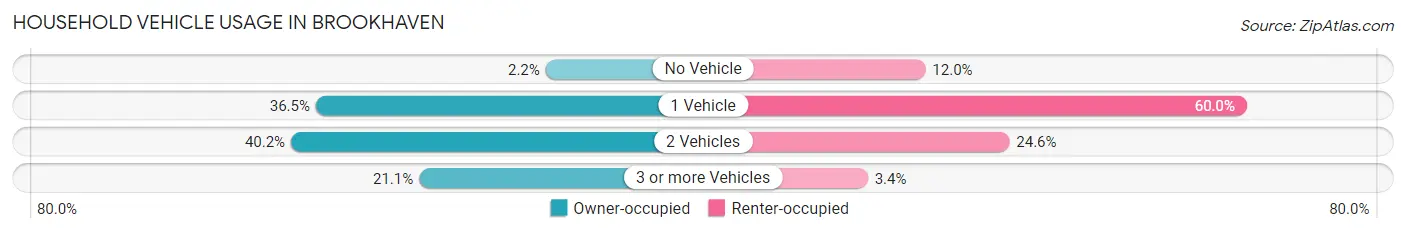
| Vehicles per Household | Owner-occupied | Renter-occupied |
| No Vehicle | 57 (2.2%) | 237 (12.0%) |
| 1 Vehicle | 954 (36.5%) | 1,183 (60.0%) |
| 2 Vehicles | 1,051 (40.2%) | 484 (24.6%) |
| 3 or more Vehicles | 551 (21.1%) | 67 (3.4%) |
| Total | 2,613 (100.0%) | 1,971 (100.0%) |
Real Estate & Mortgages in Brookhaven
Real Estate and Mortgage Overview in Brookhaven
| Characteristic | Without Mortgage | With Mortgage |
| Housing Units | 1,400 | 1,213 |
| Median Property Value | $89,200 | $123,700 |
| Median Household Income | $40,441 | $217 |
| Monthly Housing Costs | $347 | $73 |
| Real Estate Taxes | $901 | $170 |
Property Value by Mortgage Status in Brookhaven
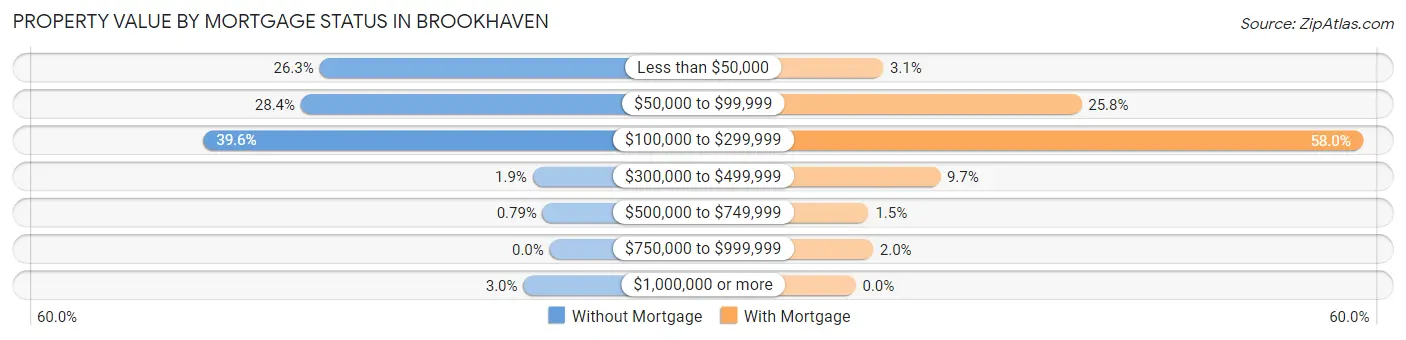
| Property Value | Without Mortgage | With Mortgage |
| Less than $50,000 | 368 (26.3%) | 38 (3.1%) |
| $50,000 to $99,999 | 398 (28.4%) | 313 (25.8%) |
| $100,000 to $299,999 | 554 (39.6%) | 703 (58.0%) |
| $300,000 to $499,999 | 27 (1.9%) | 117 (9.7%) |
| $500,000 to $749,999 | 11 (0.8%) | 18 (1.5%) |
| $750,000 to $999,999 | 0 (0.0%) | 24 (2.0%) |
| $1,000,000 or more | 42 (3.0%) | 0 (0.0%) |
| Total | 1,400 (100.0%) | 1,213 (100.0%) |
Household Income by Mortgage Status in Brookhaven
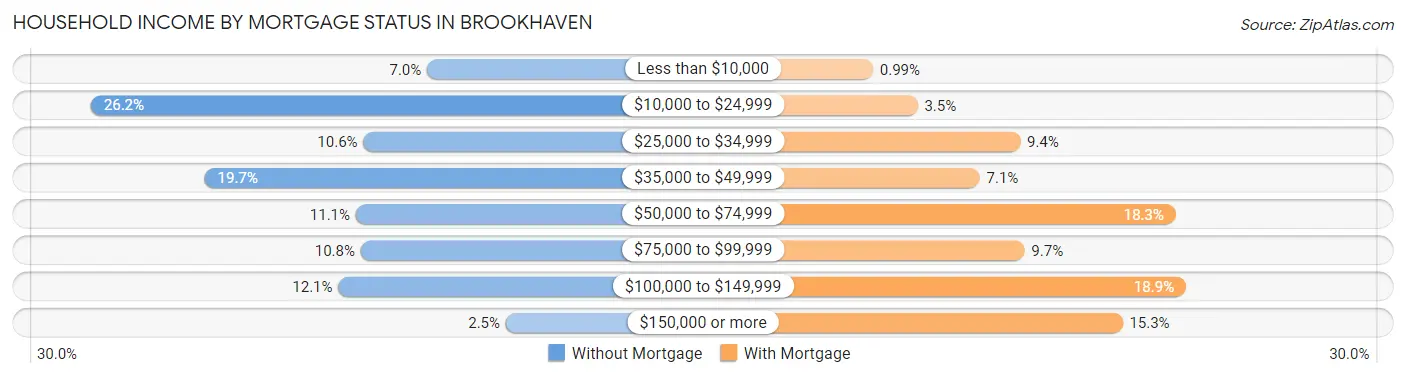
| Household Income | Without Mortgage | With Mortgage |
| Less than $10,000 | 98 (7.0%) | 12 (1.0%) |
| $10,000 to $24,999 | 367 (26.2%) | 43 (3.5%) |
| $25,000 to $34,999 | 149 (10.6%) | 114 (9.4%) |
| $35,000 to $49,999 | 276 (19.7%) | 86 (7.1%) |
| $50,000 to $74,999 | 155 (11.1%) | 222 (18.3%) |
| $75,000 to $99,999 | 151 (10.8%) | 117 (9.7%) |
| $100,000 to $149,999 | 169 (12.1%) | 229 (18.9%) |
| $150,000 or more | 35 (2.5%) | 185 (15.2%) |
| Total | 1,400 (100.0%) | 1,213 (100.0%) |
Property Value to Household Income Ratio in Brookhaven
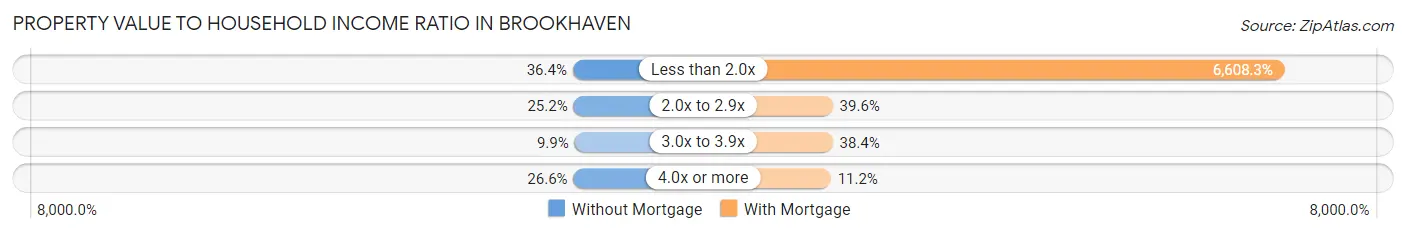
| Value-to-Income Ratio | Without Mortgage | With Mortgage |
| Less than 2.0x | 509 (36.4%) | 80,159 (6,608.3%) |
| 2.0x to 2.9x | 353 (25.2%) | 480 (39.6%) |
| 3.0x to 3.9x | 138 (9.9%) | 466 (38.4%) |
| 4.0x or more | 372 (26.6%) | 136 (11.2%) |
| Total | 1,400 (100.0%) | 1,213 (100.0%) |
Real Estate Taxes by Mortgage Status in Brookhaven
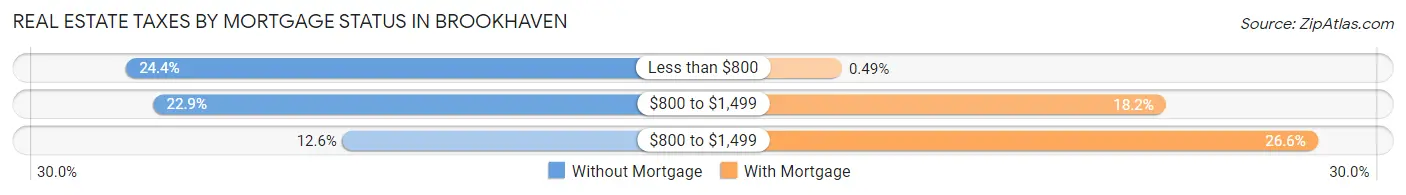
| Property Taxes | Without Mortgage | With Mortgage |
| Less than $800 | 342 (24.4%) | 6 (0.5%) |
| $800 to $1,499 | 321 (22.9%) | 221 (18.2%) |
| $800 to $1,499 | 176 (12.6%) | 322 (26.6%) |
| Total | 1,400 (100.0%) | 1,213 (100.0%) |
Health & Disability in Brookhaven
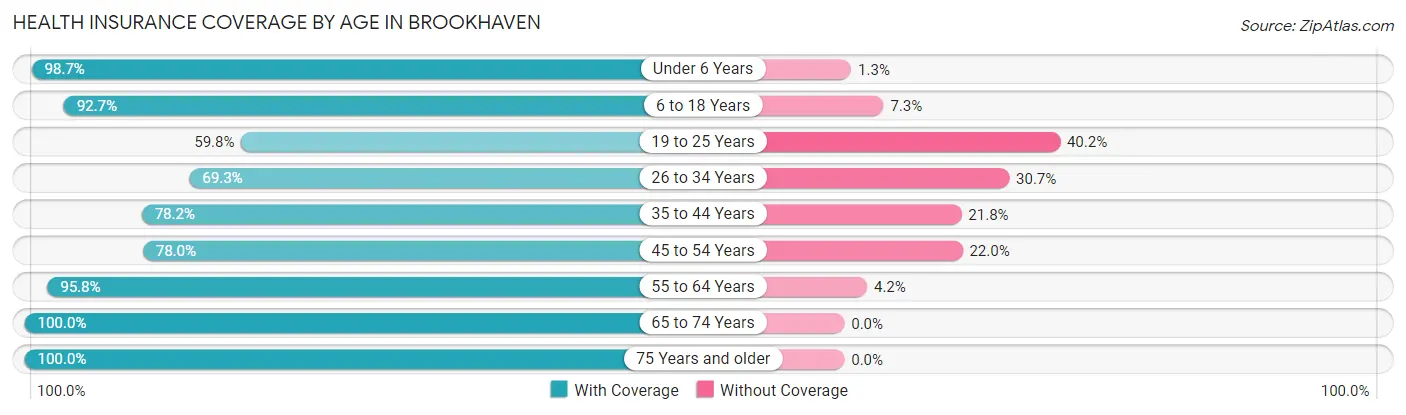
Health Insurance Coverage by Age in Brookhaven
| Age Bracket | With Coverage | Without Coverage |
| Under 6 Years | 1,000 (98.7%) | 13 (1.3%) |
| 6 to 18 Years | 1,498 (92.7%) | 118 (7.3%) |
| 19 to 25 Years | 532 (59.8%) | 358 (40.2%) |
| 26 to 34 Years | 809 (69.3%) | 359 (30.7%) |
| 35 to 44 Years | 1,224 (78.2%) | 342 (21.8%) |
| 45 to 54 Years | 1,072 (78.0%) | 303 (22.0%) |
| 55 to 64 Years | 1,760 (95.8%) | 78 (4.2%) |
| 65 to 74 Years | 1,026 (100.0%) | 0 (0.0%) |
| 75 Years and older | 814 (100.0%) | 0 (0.0%) |
| Total | 9,735 (86.1%) | 1,571 (13.9%) |
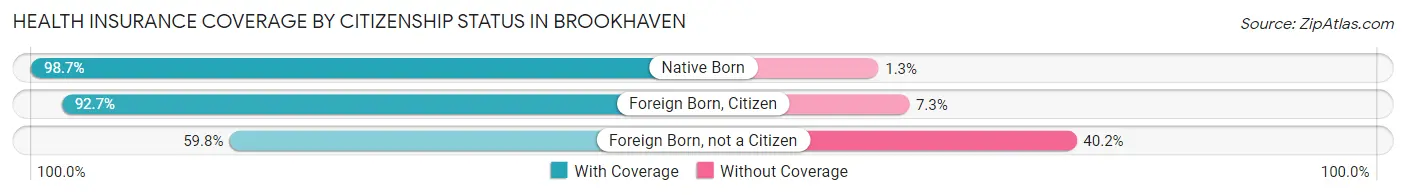
Health Insurance Coverage by Citizenship Status in Brookhaven
| Citizenship Status | With Coverage | Without Coverage |
| Native Born | 1,000 (98.7%) | 13 (1.3%) |
| Foreign Born, Citizen | 1,498 (92.7%) | 118 (7.3%) |
| Foreign Born, not a Citizen | 532 (59.8%) | 358 (40.2%) |
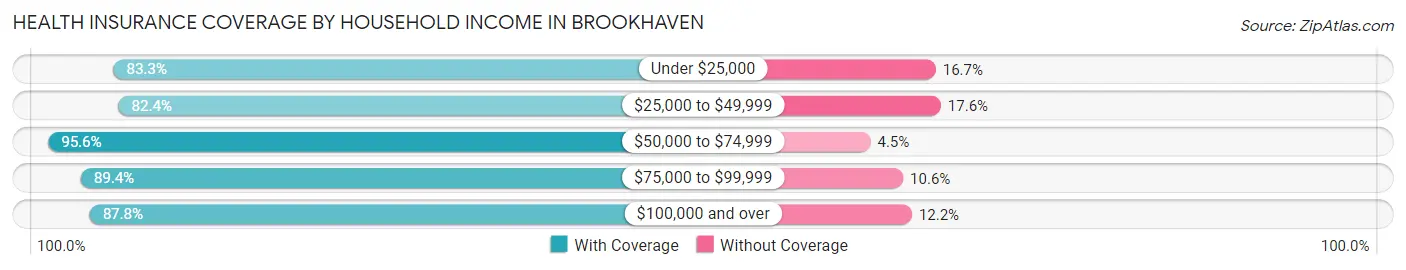
Health Insurance Coverage by Household Income in Brookhaven
| Household Income | With Coverage | Without Coverage |
| Under $25,000 | 3,134 (83.3%) | 627 (16.7%) |
| $25,000 to $49,999 | 2,163 (82.4%) | 463 (17.6%) |
| $50,000 to $74,999 | 1,008 (95.6%) | 47 (4.4%) |
| $75,000 to $99,999 | 1,321 (89.4%) | 156 (10.6%) |
| $100,000 and over | 1,948 (87.8%) | 271 (12.2%) |
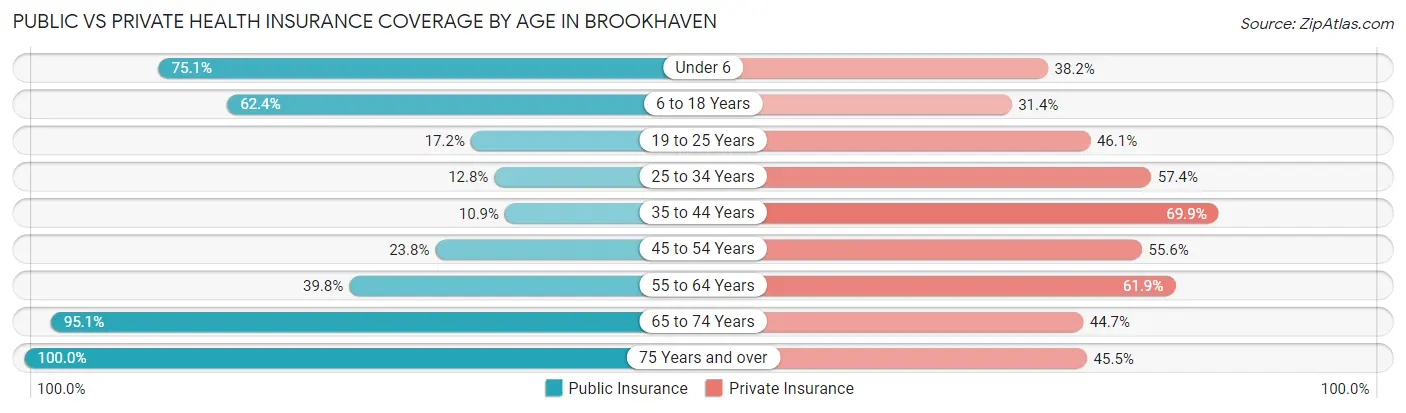
Public vs Private Health Insurance Coverage by Age in Brookhaven
| Age Bracket | Public Insurance | Private Insurance |
| Under 6 | 761 (75.1%) | 387 (38.2%) |
| 6 to 18 Years | 1,008 (62.4%) | 508 (31.4%) |
| 19 to 25 Years | 153 (17.2%) | 410 (46.1%) |
| 25 to 34 Years | 150 (12.8%) | 670 (57.4%) |
| 35 to 44 Years | 170 (10.9%) | 1,095 (69.9%) |
| 45 to 54 Years | 327 (23.8%) | 765 (55.6%) |
| 55 to 64 Years | 731 (39.8%) | 1,137 (61.9%) |
| 65 to 74 Years | 976 (95.1%) | 459 (44.7%) |
| 75 Years and over | 814 (100.0%) | 370 (45.5%) |
| Total | 5,090 (45.0%) | 5,801 (51.3%) |
Disability Status by Sex by Age in Brookhaven
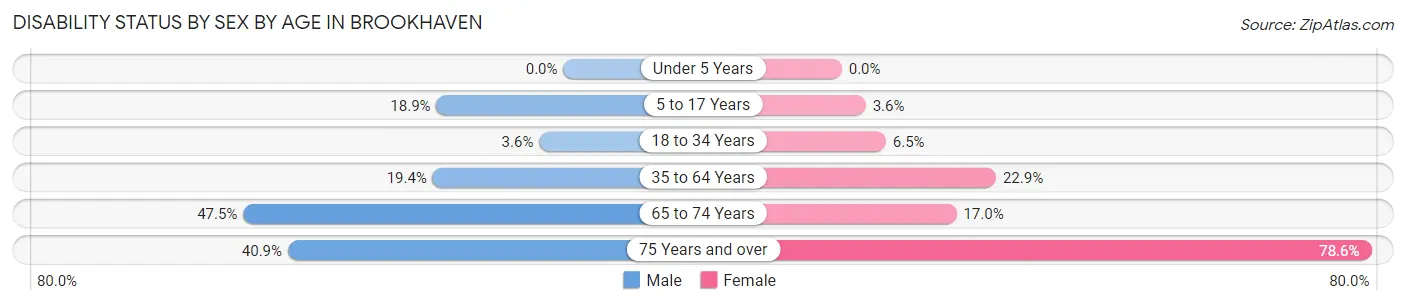
| Age Bracket | Male | Female |
| Under 5 Years | 0 (0.0%) | 0 (0.0%) |
| 5 to 17 Years | 164 (18.9%) | 28 (3.5%) |
| 18 to 34 Years | 37 (3.6%) | 71 (6.5%) |
| 35 to 64 Years | 390 (19.4%) | 634 (22.9%) |
| 65 to 74 Years | 203 (47.5%) | 102 (17.0%) |
| 75 Years and over | 90 (40.9%) | 467 (78.6%) |
Disability Class by Sex by Age in Brookhaven
Disability Class: Hearing Difficulty
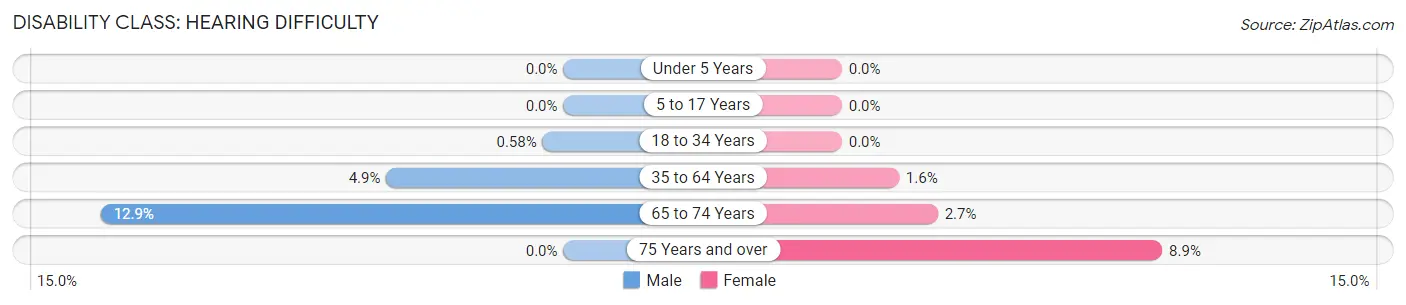
| Age Bracket | Male | Female |
| Under 5 Years | 0 (0.0%) | 0 (0.0%) |
| 5 to 17 Years | 0 (0.0%) | 0 (0.0%) |
| 18 to 34 Years | 6 (0.6%) | 0 (0.0%) |
| 35 to 64 Years | 99 (4.9%) | 44 (1.6%) |
| 65 to 74 Years | 55 (12.9%) | 16 (2.7%) |
| 75 Years and over | 0 (0.0%) | 53 (8.9%) |
Disability Class: Vision Difficulty
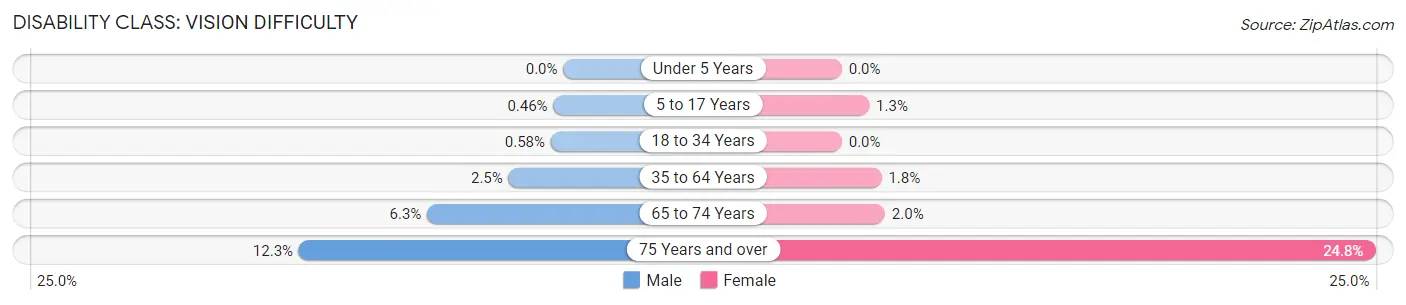
| Age Bracket | Male | Female |
| Under 5 Years | 0 (0.0%) | 0 (0.0%) |
| 5 to 17 Years | 4 (0.5%) | 10 (1.3%) |
| 18 to 34 Years | 6 (0.6%) | 0 (0.0%) |
| 35 to 64 Years | 51 (2.5%) | 51 (1.8%) |
| 65 to 74 Years | 27 (6.3%) | 12 (2.0%) |
| 75 Years and over | 27 (12.3%) | 147 (24.7%) |
Disability Class: Cognitive Difficulty
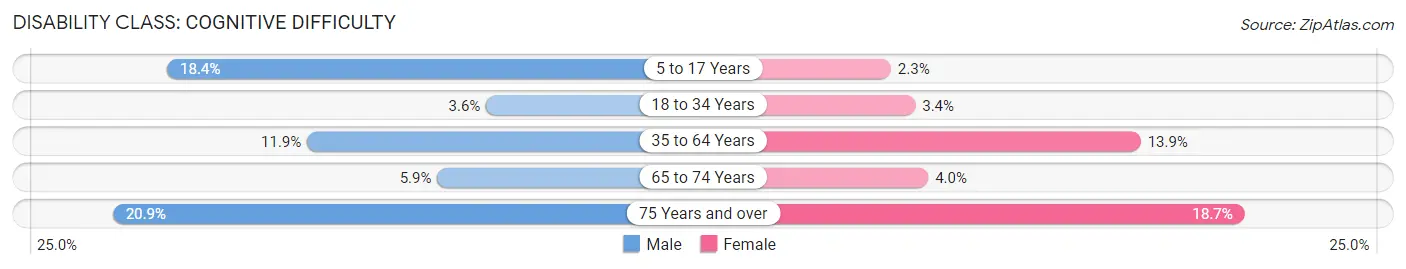
| Age Bracket | Male | Female |
| 5 to 17 Years | 160 (18.4%) | 18 (2.3%) |
| 18 to 34 Years | 37 (3.6%) | 37 (3.4%) |
| 35 to 64 Years | 239 (11.9%) | 384 (13.9%) |
| 65 to 74 Years | 25 (5.9%) | 24 (4.0%) |
| 75 Years and over | 46 (20.9%) | 111 (18.7%) |
Disability Class: Ambulatory Difficulty
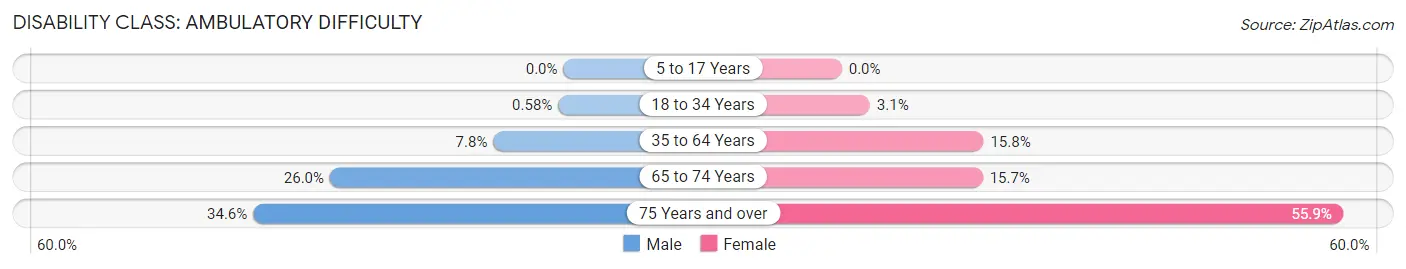
| Age Bracket | Male | Female |
| 5 to 17 Years | 0 (0.0%) | 0 (0.0%) |
| 18 to 34 Years | 6 (0.6%) | 34 (3.1%) |
| 35 to 64 Years | 157 (7.8%) | 437 (15.8%) |
| 65 to 74 Years | 111 (26.0%) | 94 (15.7%) |
| 75 Years and over | 76 (34.5%) | 332 (55.9%) |
Disability Class: Self-Care Difficulty
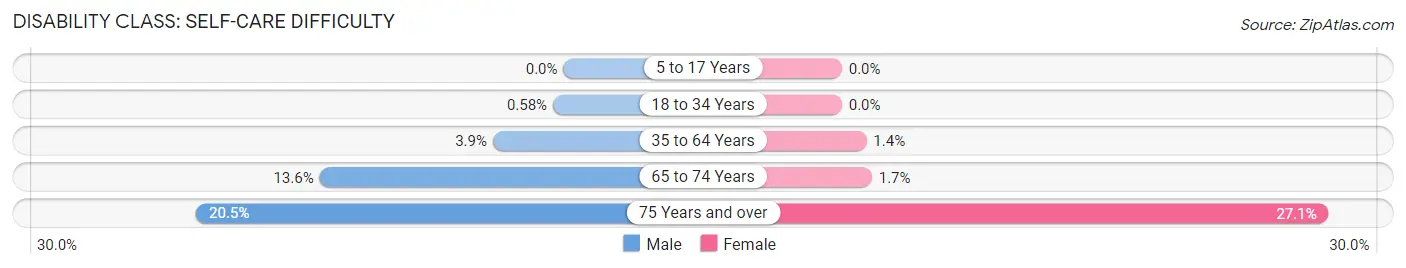
| Age Bracket | Male | Female |
| 5 to 17 Years | 0 (0.0%) | 0 (0.0%) |
| 18 to 34 Years | 6 (0.6%) | 0 (0.0%) |
| 35 to 64 Years | 79 (3.9%) | 38 (1.4%) |
| 65 to 74 Years | 58 (13.6%) | 10 (1.7%) |
| 75 Years and over | 45 (20.4%) | 161 (27.1%) |
Technology Access in Brookhaven
Computing Device Access in Brookhaven
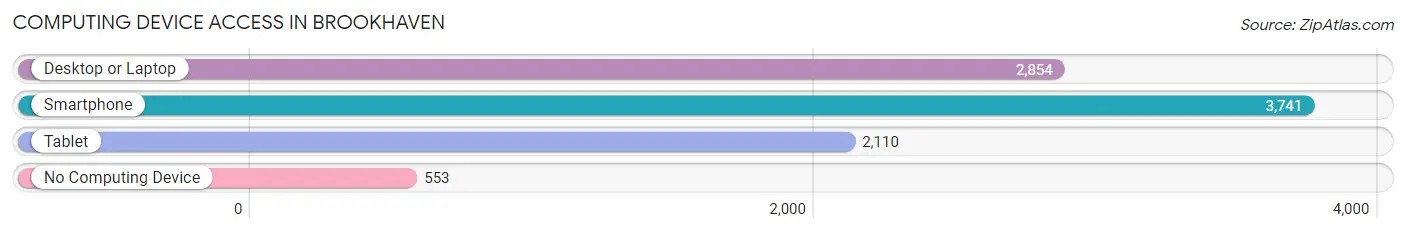
| Device Type | # Households | % Households |
| Desktop or Laptop | 2,854 | 62.3% |
| Smartphone | 3,741 | 81.6% |
| Tablet | 2,110 | 46.0% |
| No Computing Device | 553 | 12.1% |
| Total | 4,584 | 100.0% |
Internet Access in Brookhaven
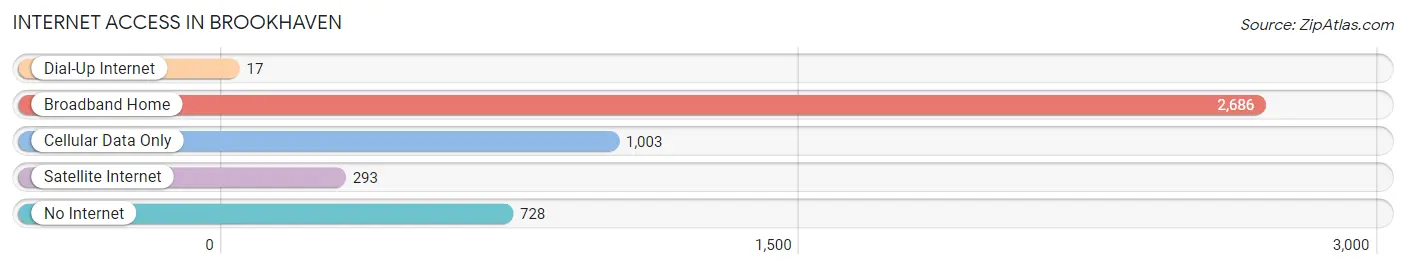
| Internet Type | # Households | % Households |
| Dial-Up Internet | 17 | 0.4% |
| Broadband Home | 2,686 | 58.6% |
| Cellular Data Only | 1,003 | 21.9% |
| Satellite Internet | 293 | 6.4% |
| No Internet | 728 | 15.9% |
| Total | 4,584 | 100.0% |
Brookhaven Summary
History
The city of Brookhaven, Mississippi is located in Lincoln County, approximately 60 miles south of Jackson, the state capital. The city was founded in 1818 and was named after the town of Brookhaven, New York. The city was originally a small farming community, but it has grown significantly over the years.
The city of Brookhaven has a rich history that dates back to the early 1800s. The city was founded by a group of settlers from the state of New York who were looking for a new home. The settlers were attracted to the area due to its fertile soil and abundant natural resources. The city was officially incorporated in 1818 and was named after the town of Brookhaven, New York.
The city of Brookhaven has a long and storied history. During the Civil War, the city was the site of several battles between Union and Confederate forces. After the war, the city experienced a period of growth and prosperity. The city was home to several prominent businesses, including a cotton mill, a sawmill, and a brickyard.
In the early 1900s, the city of Brookhaven experienced a period of decline. The Great Depression and World War II caused many businesses to close and the population to decrease. However, the city was able to rebound in the 1950s and 1960s, thanks to the growth of the poultry industry. The city is now home to several large poultry processing plants, as well as other businesses.
Geography
Brookhaven is located in Lincoln County, Mississippi, approximately 60 miles south of Jackson, the state capital. The city is situated in the rolling hills of the Piney Woods region of the state. The city is bordered by the Bogue Chitto River to the east and the Pearl River to the west.
The city of Brookhaven covers an area of approximately 10 square miles. The terrain is mostly flat, with some rolling hills. The climate is humid subtropical, with hot, humid summers and mild winters. The average annual temperature is around 70 degrees Fahrenheit.
Economy
The economy of Brookhaven is largely based on the poultry industry. The city is home to several large poultry processing plants, as well as other businesses. The city is also home to several manufacturing companies, including a furniture factory and a plastics plant.
The city of Brookhaven is also home to several retail stores, restaurants, and other businesses. The city is also home to a number of medical facilities, including a hospital and several clinics.
Demographics
As of the 2010 census, the population of Brookhaven was 12,520. The racial makeup of the city was 79.3% White, 17.7% African American, 0.3% Native American, 0.7% Asian, 0.1% Pacific Islander, and 1.9% from other races. The median household income was $31,945, and the median family income was $41,945.
The city of Brookhaven is served by the Lincoln County School District. The district has several elementary schools, a middle school, and a high school. The city is also home to a number of private schools, including a Catholic school and a Christian school.
Common Questions
What is Per Capita Income in Brookhaven?
Per Capita income in Brookhaven is $23,894.
What is the Median Family Income in Brookhaven?
Median Family Income in Brookhaven is $47,217.
What is the Median Household income in Brookhaven?
Median Household Income in Brookhaven is $32,869.
What is Income or Wage Gap in Brookhaven?
Income or Wage Gap in Brookhaven is 23.6%.
Women in Brookhaven earn 76.4 cents for every dollar earned by a man.
What is Family Income Deficit in Brookhaven?
Family Income Deficit in Brookhaven is $9,952.
Families that are below poverty line in Brookhaven earn $9,952 less on average than the poverty threshold level.
What is Inequality or Gini Index in Brookhaven?
Inequality or Gini Index in Brookhaven is 0.52.
What is the Total Population of Brookhaven?
Total Population of Brookhaven is 11,714.
What is the Total Male Population of Brookhaven?
Total Male Population of Brookhaven is 5,189.
What is the Total Female Population of Brookhaven?
Total Female Population of Brookhaven is 6,525.
What is the Ratio of Males per 100 Females in Brookhaven?
There are 79.52 Males per 100 Females in Brookhaven.
What is the Ratio of Females per 100 Males in Brookhaven?
There are 125.75 Females per 100 Males in Brookhaven.
What is the Median Population Age in Brookhaven?
Median Population Age in Brookhaven is 42.0 Years.
What is the Average Family Size in Brookhaven
Average Family Size in Brookhaven is 3.2 People.
What is the Average Household Size in Brookhaven
Average Household Size in Brookhaven is 2.4 People.
How Large is the Labor Force in Brookhaven?
There are 4,688 People in the Labor Forcein in Brookhaven.
What is the Percentage of People in the Labor Force in Brookhaven?
50.4% of People are in the Labor Force in Brookhaven.
What is the Unemployment Rate in Brookhaven?
Unemployment Rate in Brookhaven is 5.6%.