Boyle, MS Map & Demographics
Boyle Map
Boyle Overview
$21,354
PER CAPITA INCOME
$36,477
AVG FAMILY INCOME
$33,750
AVG HOUSEHOLD INCOME
0.2%
WAGE / INCOME GAP [ % ]
99.8¢/ $1
WAGE / INCOME GAP [ $ ]
0.39
INEQUALITY / GINI INDEX
700
TOTAL POPULATION
353
MALE POPULATION
347
FEMALE POPULATION
101.73
MALES / 100 FEMALES
98.30
FEMALES / 100 MALES
36.7
MEDIAN AGE
2.6
AVG FAMILY SIZE
2.3
AVG HOUSEHOLD SIZE
339
LABOR FORCE [ PEOPLE ]
59.5%
PERCENT IN LABOR FORCE
10.3%
UNEMPLOYMENT RATE
Boyle Zip Codes
Boyle Area Codes
Income in Boyle
Income Overview in Boyle
Per Capita Income in Boyle is $21,354, while median incomes of families and households are $36,477 and $33,750 respectively.
| Characteristic | Number | Measure |
| Per Capita Income | 700 | $21,354 |
| Median Family Income | 207 | $36,477 |
| Mean Family Income | 207 | $52,182 |
| Median Household Income | 298 | $33,750 |
| Mean Household Income | 298 | $47,814 |
| Income Deficit | 207 | $0 |
| Wage / Income Gap (%) | 700 | 0.18% |
| Wage / Income Gap ($) | 700 | 99.82¢ per $1 |
| Gini / Inequality Index | 700 | 0.39 |
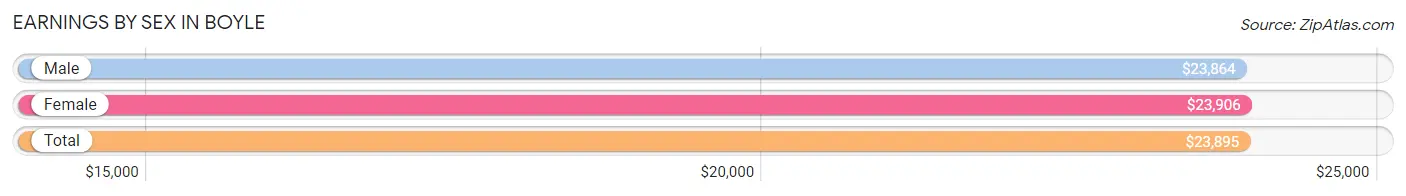
Earnings by Sex in Boyle
Average Earnings in Boyle are $23,895, $23,864 for men and $23,906 for women, a difference of 0.2%.
| Sex | Number | Average Earnings |
| Male | 198 (60.0%) | $23,864 |
| Female | 132 (40.0%) | $23,906 |
| Total | 330 (100.0%) | $23,895 |
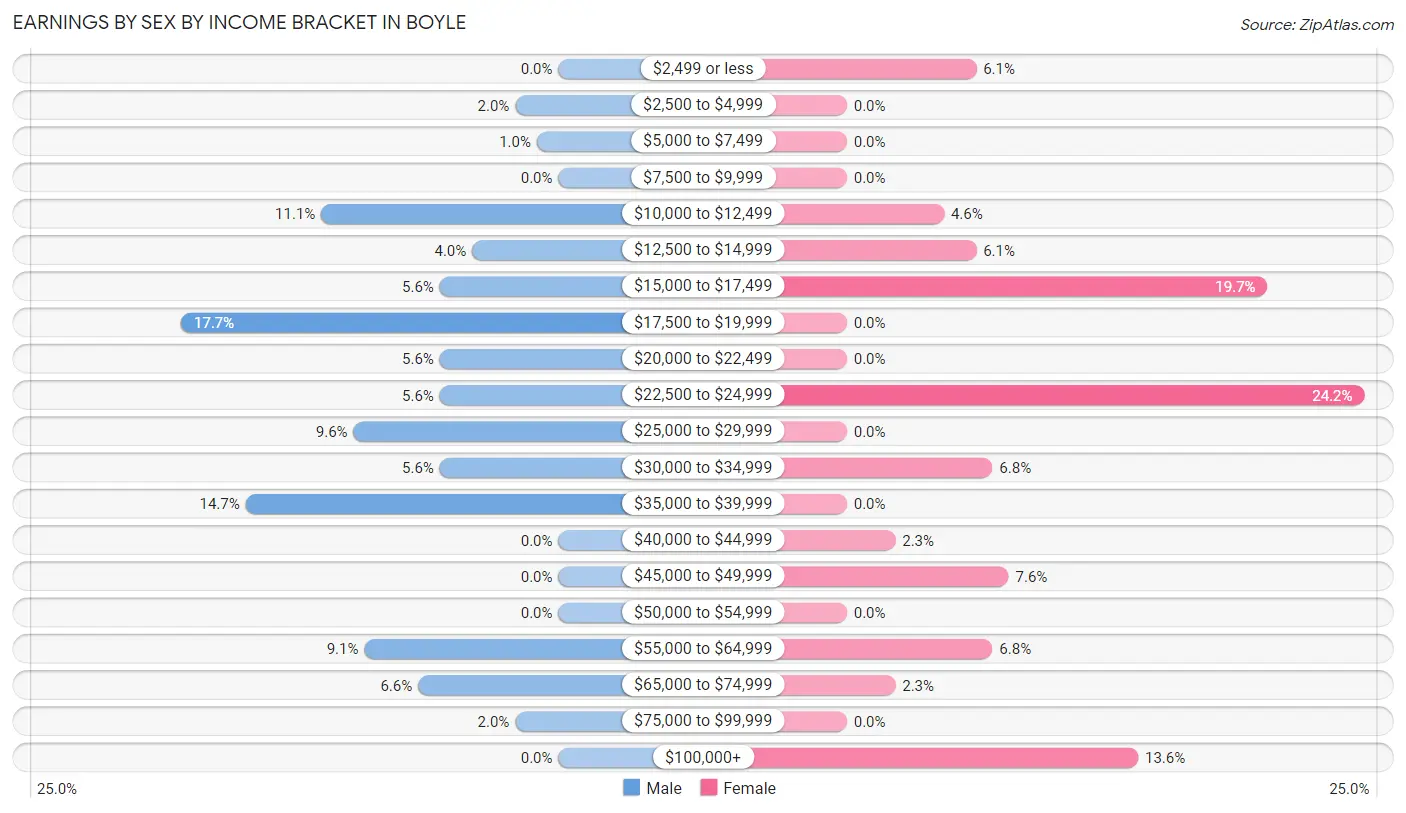
Earnings by Sex by Income Bracket in Boyle
The most common earnings brackets in Boyle are $17,500 to $19,999 for men (35 | 17.7%) and $22,500 to $24,999 for women (32 | 24.2%).
| Income | Male | Female |
| $2,499 or less | 0 (0.0%) | 8 (6.1%) |
| $2,500 to $4,999 | 4 (2.0%) | 0 (0.0%) |
| $5,000 to $7,499 | 2 (1.0%) | 0 (0.0%) |
| $7,500 to $9,999 | 0 (0.0%) | 0 (0.0%) |
| $10,000 to $12,499 | 22 (11.1%) | 6 (4.5%) |
| $12,500 to $14,999 | 8 (4.0%) | 8 (6.1%) |
| $15,000 to $17,499 | 11 (5.6%) | 26 (19.7%) |
| $17,500 to $19,999 | 35 (17.7%) | 0 (0.0%) |
| $20,000 to $22,499 | 11 (5.6%) | 0 (0.0%) |
| $22,500 to $24,999 | 11 (5.6%) | 32 (24.2%) |
| $25,000 to $29,999 | 19 (9.6%) | 0 (0.0%) |
| $30,000 to $34,999 | 11 (5.6%) | 9 (6.8%) |
| $35,000 to $39,999 | 29 (14.6%) | 0 (0.0%) |
| $40,000 to $44,999 | 0 (0.0%) | 3 (2.3%) |
| $45,000 to $49,999 | 0 (0.0%) | 10 (7.6%) |
| $50,000 to $54,999 | 0 (0.0%) | 0 (0.0%) |
| $55,000 to $64,999 | 18 (9.1%) | 9 (6.8%) |
| $65,000 to $74,999 | 13 (6.6%) | 3 (2.3%) |
| $75,000 to $99,999 | 4 (2.0%) | 0 (0.0%) |
| $100,000+ | 0 (0.0%) | 18 (13.6%) |
| Total | 198 (100.0%) | 132 (100.0%) |
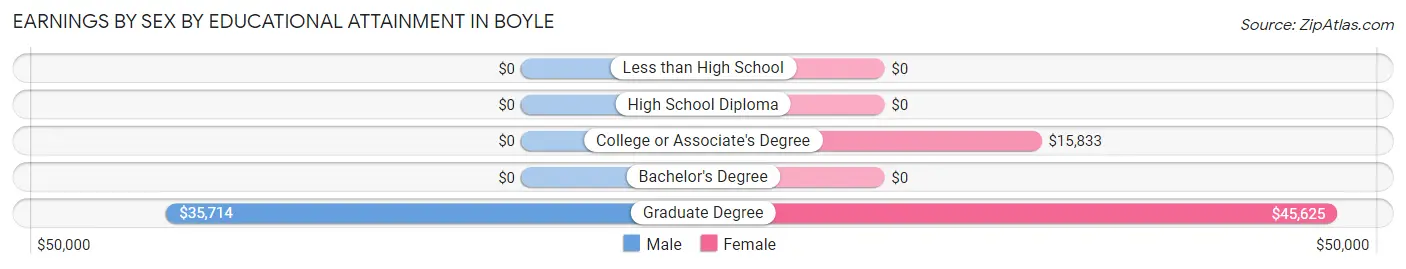
Earnings by Sex by Educational Attainment in Boyle
Average earnings in Boyle are $23,750 for men and $24,141 for women, a difference of 1.6%. Men with an educational attainment of graduate degree enjoy the highest average annual earnings of $35,714, while those with graduate degree education earn the least with $35,714. Women with an educational attainment of graduate degree earn the most with the average annual earnings of $45,625, while those with college or associate's degree education have the smallest earnings of $15,833.
| Educational Attainment | Male Income | Female Income |
| Less than High School | - | - |
| High School Diploma | - | - |
| College or Associate's Degree | - | - |
| Bachelor's Degree | - | - |
| Graduate Degree | $35,714 | $45,625 |
| Total | $23,750 | $24,141 |
Family Income in Boyle
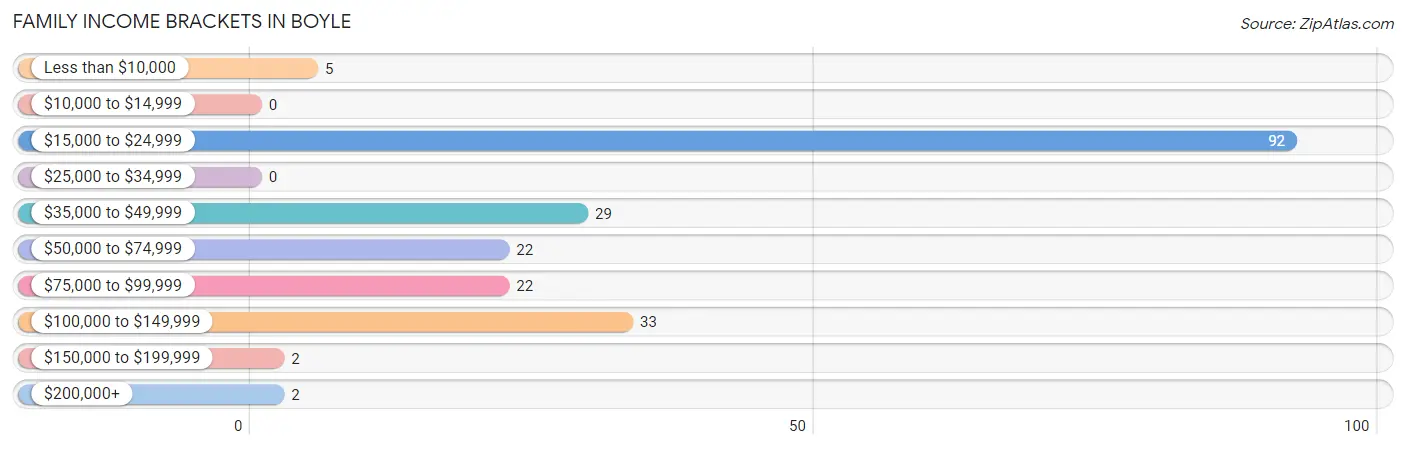
Family Income Brackets in Boyle
According to the Boyle family income data, there are 92 families falling into the $15,000 to $24,999 income range, which is the most common income bracket and makes up 44.4% of all families.
| Income Bracket | # Families | % Families |
| Less than $10,000 | 5 | 2.4% |
| $10,000 to $14,999 | 0 | 0.0% |
| $15,000 to $24,999 | 92 | 44.4% |
| $25,000 to $34,999 | 0 | 0.0% |
| $35,000 to $49,999 | 29 | 14.0% |
| $50,000 to $74,999 | 22 | 10.6% |
| $75,000 to $99,999 | 22 | 10.6% |
| $100,000 to $149,999 | 33 | 15.9% |
| $150,000 to $199,999 | 2 | 1.0% |
| $200,000+ | 2 | 1.0% |
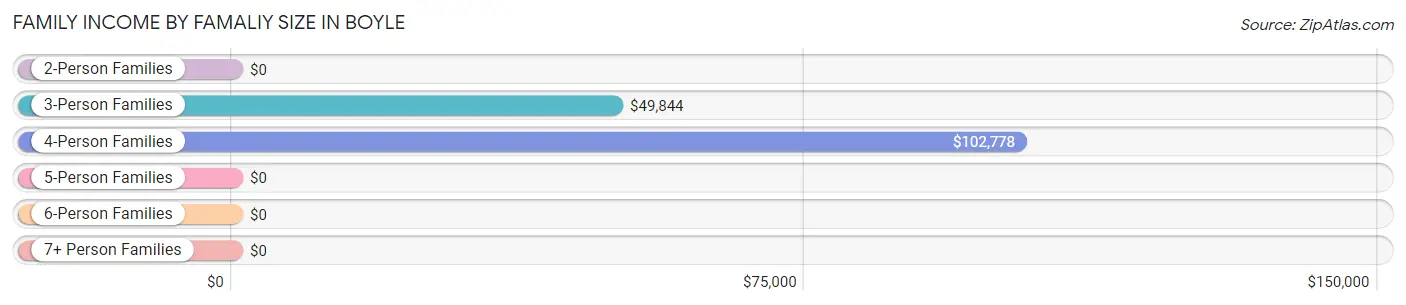
Family Income by Famaliy Size in Boyle
4-person families (24 | 11.6%) account for the highest median family income in Boyle with $102,778 per family, while 4-person families (24 | 11.6%) have the highest median income of $25,694 per family member.
| Income Bracket | # Families | Median Income |
| 2-Person Families | 139 (67.1%) | $0 |
| 3-Person Families | 35 (16.9%) | $49,844 |
| 4-Person Families | 24 (11.6%) | $102,778 |
| 5-Person Families | 9 (4.3%) | $0 |
| 6-Person Families | 0 (0.0%) | $0 |
| 7+ Person Families | 0 (0.0%) | $0 |
| Total | 207 (100.0%) | $36,477 |
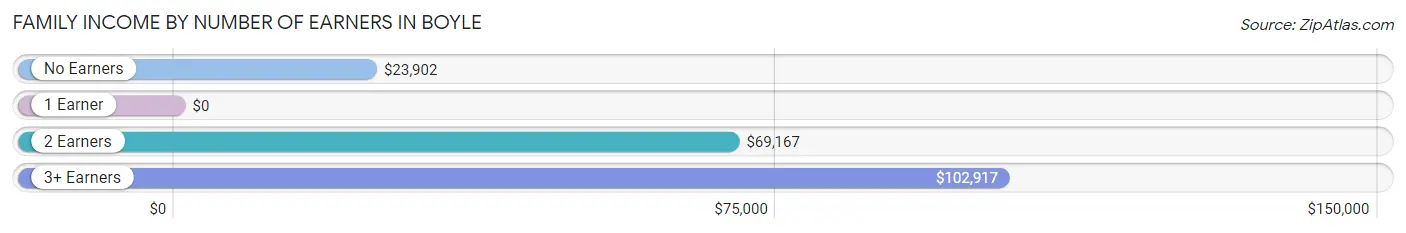
Family Income by Number of Earners in Boyle
| Number of Earners | # Families | Median Income |
| No Earners | 56 (27.1%) | $23,902 |
| 1 Earner | 88 (42.5%) | $0 |
| 2 Earners | 44 (21.3%) | $69,167 |
| 3+ Earners | 19 (9.2%) | $102,917 |
| Total | 207 (100.0%) | $36,477 |
Household Income in Boyle
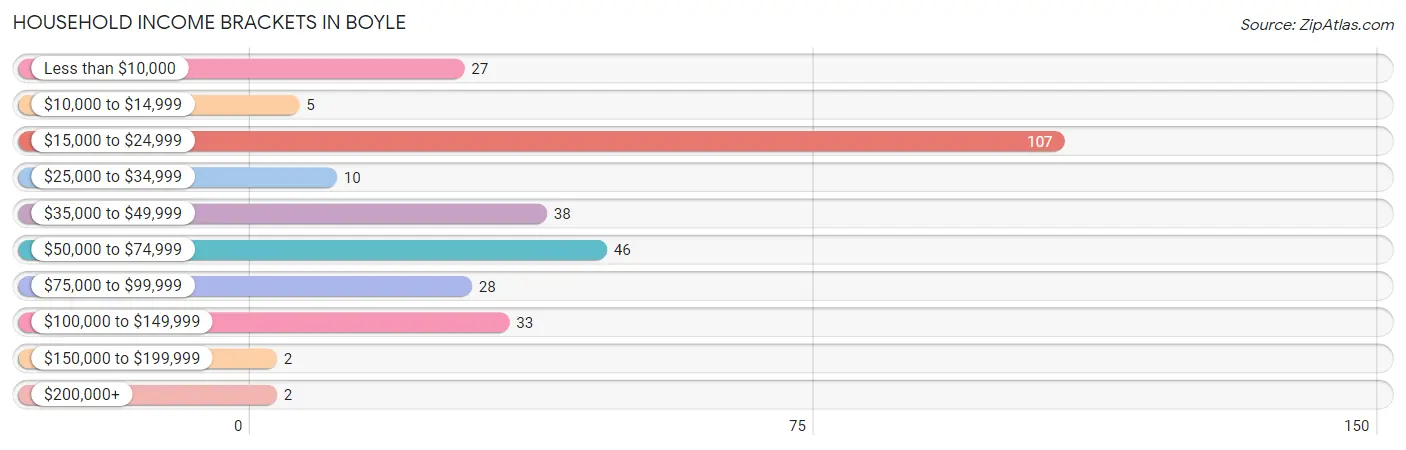
Household Income Brackets in Boyle
With 107 households falling in the category, the $15,000 to $24,999 income range is the most frequent in Boyle, accounting for 35.9% of all households. In contrast, only 2 households (0.7%) fall into the $150,000 to $199,999 income bracket, making it the least populous group.
| Income Bracket | # Households | % Households |
| Less than $10,000 | 27 | 9.1% |
| $10,000 to $14,999 | 5 | 1.7% |
| $15,000 to $24,999 | 107 | 35.9% |
| $25,000 to $34,999 | 10 | 3.4% |
| $35,000 to $49,999 | 38 | 12.8% |
| $50,000 to $74,999 | 46 | 15.4% |
| $75,000 to $99,999 | 28 | 9.4% |
| $100,000 to $149,999 | 33 | 11.1% |
| $150,000 to $199,999 | 2 | 0.7% |
| $200,000+ | 2 | 0.7% |
Household Income by Householder Age in Boyle
The median household income in Boyle is $33,750, with the highest median household income of $48,594 found in the 45 to 64 years age bracket for the primary householder. A total of 121 households (40.6%) fall into this category.
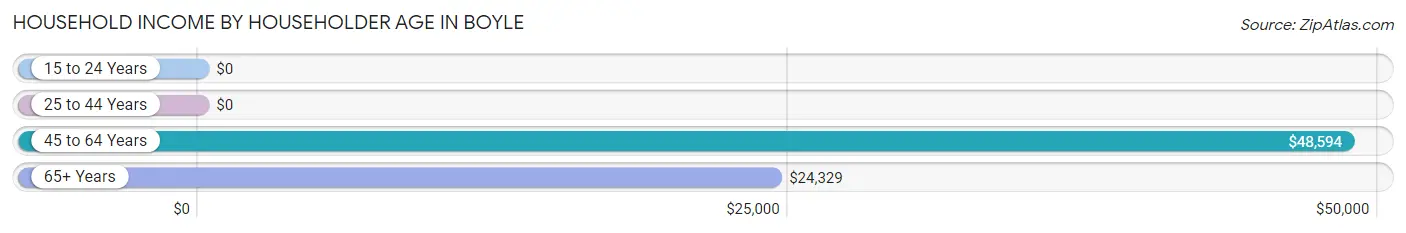
| Income Bracket | # Households | Median Income |
| 15 to 24 Years | 0 (0.0%) | $0 |
| 25 to 44 Years | 101 (33.9%) | $0 |
| 45 to 64 Years | 121 (40.6%) | $48,594 |
| 65+ Years | 76 (25.5%) | $24,329 |
| Total | 298 (100.0%) | $33,750 |
Poverty in Boyle
Income Below Poverty by Sex and Age in Boyle
With 22.5% poverty level for males and 20.7% for females among the residents of Boyle, under 5 year old males and 12 to 14 year old females are the most vulnerable to poverty, with 14 males (73.7%) and 6 females (100.0%) in their respective age groups living below the poverty level.
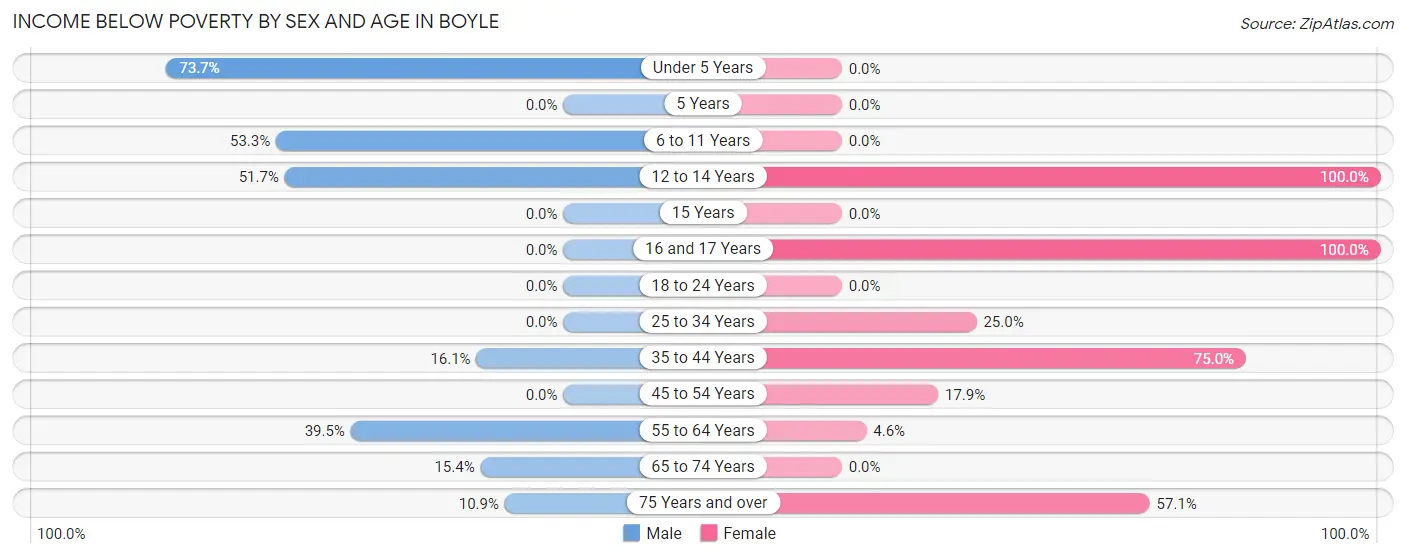
| Age Bracket | Male | Female |
| Under 5 Years | 14 (73.7%) | 0 (0.0%) |
| 5 Years | 0 (0.0%) | 0 (0.0%) |
| 6 to 11 Years | 16 (53.3%) | 0 (0.0%) |
| 12 to 14 Years | 15 (51.7%) | 6 (100.0%) |
| 15 Years | 0 (0.0%) | 0 (0.0%) |
| 16 and 17 Years | 0 (0.0%) | 15 (100.0%) |
| 18 to 24 Years | 0 (0.0%) | 0 (0.0%) |
| 25 to 34 Years | 0 (0.0%) | 28 (25.0%) |
| 35 to 44 Years | 10 (16.1%) | 12 (75.0%) |
| 45 to 54 Years | 0 (0.0%) | 5 (17.9%) |
| 55 to 64 Years | 15 (39.5%) | 2 (4.5%) |
| 65 to 74 Years | 2 (15.4%) | 0 (0.0%) |
| 75 Years and over | 5 (10.9%) | 4 (57.1%) |
| Total | 77 (22.5%) | 72 (20.7%) |
Income Above Poverty by Sex and Age in Boyle
According to the poverty statistics in Boyle, males aged 16 and 17 years and females aged under 5 years are the age groups that are most secure financially, with 100.0% of males and 100.0% of females in these age groups living above the poverty line.
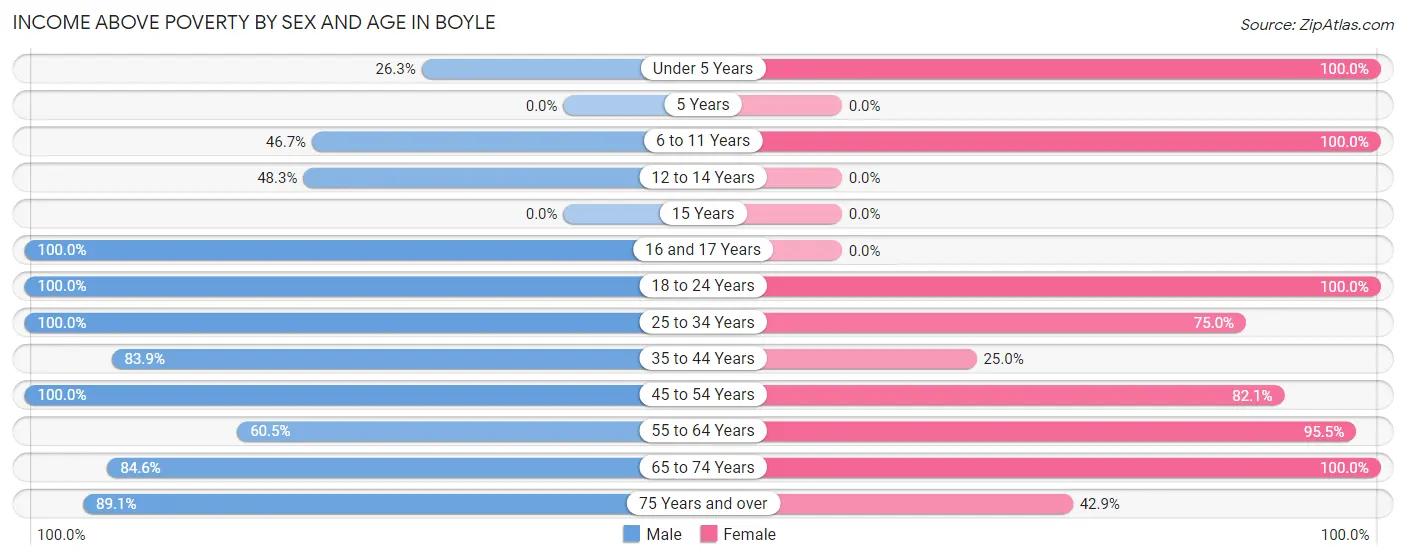
| Age Bracket | Male | Female |
| Under 5 Years | 5 (26.3%) | 11 (100.0%) |
| 5 Years | 0 (0.0%) | 0 (0.0%) |
| 6 to 11 Years | 14 (46.7%) | 25 (100.0%) |
| 12 to 14 Years | 14 (48.3%) | 0 (0.0%) |
| 15 Years | 0 (0.0%) | 0 (0.0%) |
| 16 and 17 Years | 4 (100.0%) | 0 (0.0%) |
| 18 to 24 Years | 25 (100.0%) | 22 (100.0%) |
| 25 to 34 Years | 25 (100.0%) | 84 (75.0%) |
| 35 to 44 Years | 52 (83.9%) | 4 (25.0%) |
| 45 to 54 Years | 52 (100.0%) | 23 (82.1%) |
| 55 to 64 Years | 23 (60.5%) | 42 (95.5%) |
| 65 to 74 Years | 11 (84.6%) | 61 (100.0%) |
| 75 Years and over | 41 (89.1%) | 3 (42.9%) |
| Total | 266 (77.5%) | 275 (79.2%) |
Income Below Poverty Among Married-Couple Families in Boyle
The poverty statistics for married-couple families in Boyle show that 9.8% or 5 of the total 51 families live below the poverty line. Families with 1 or 2 children have the highest poverty rate of 29.4%, comprising of 5 families. On the other hand, families with no children have the lowest poverty rate of 0.0%, which includes 0 families.
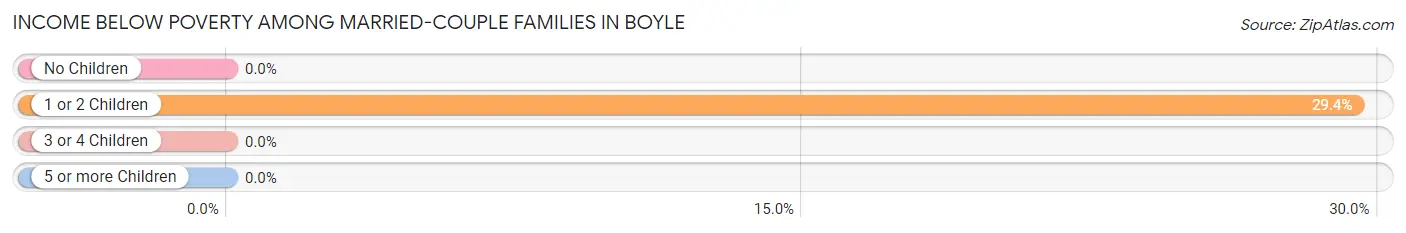
| Children | Above Poverty | Below Poverty |
| No Children | 34 (100.0%) | 0 (0.0%) |
| 1 or 2 Children | 12 (70.6%) | 5 (29.4%) |
| 3 or 4 Children | 0 (0.0%) | 0 (0.0%) |
| 5 or more Children | 0 (0.0%) | 0 (0.0%) |
| Total | 46 (90.2%) | 5 (9.8%) |
Income Below Poverty Among Single-Parent Households in Boyle
According to the poverty data in Boyle, 15.6% or 10 single-father households and 9.8% or 9 single-mother households are living below the poverty line. Among single-father households, those with 1 or 2 children have the highest poverty rate, with 10 households (100.0%) experiencing poverty. Likewise, among single-mother households, those with 3 or 4 children have the highest poverty rate, with 9 households (100.0%) falling below the poverty line.
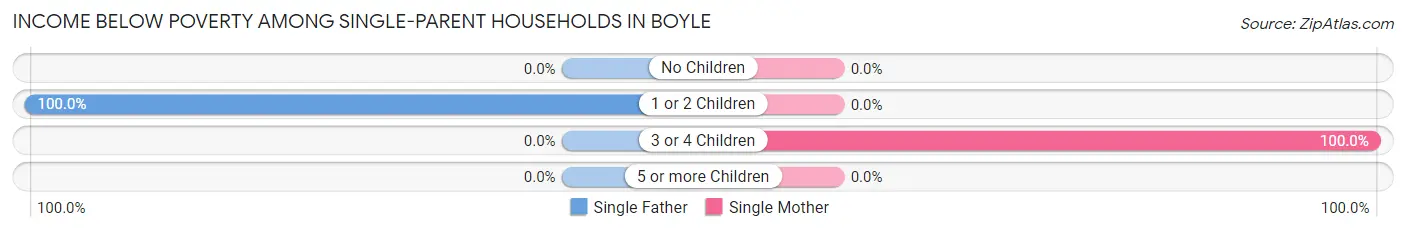
| Children | Single Father | Single Mother |
| No Children | 0 (0.0%) | 0 (0.0%) |
| 1 or 2 Children | 10 (100.0%) | 0 (0.0%) |
| 3 or 4 Children | 0 (0.0%) | 9 (100.0%) |
| 5 or more Children | 0 (0.0%) | 0 (0.0%) |
| Total | 10 (15.6%) | 9 (9.8%) |
Income Below Poverty Among Married-Couple vs Single-Parent Households in Boyle
The poverty data for Boyle shows that 5 of the married-couple family households (9.8%) and 19 of the single-parent households (12.2%) are living below the poverty level. Within the married-couple family households, those with 1 or 2 children have the highest poverty rate, with 5 households (29.4%) falling below the poverty line. Among the single-parent households, those with 3 or 4 children have the highest poverty rate, with 9 household (100.0%) living below poverty.
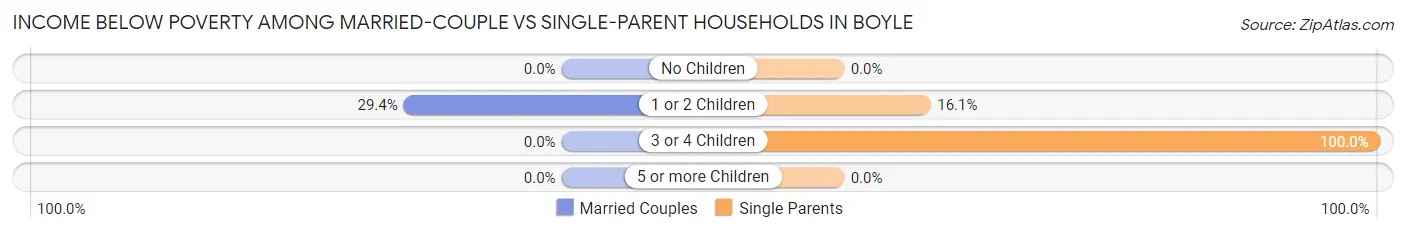
| Children | Married-Couple Families | Single-Parent Households |
| No Children | 0 (0.0%) | 0 (0.0%) |
| 1 or 2 Children | 5 (29.4%) | 10 (16.1%) |
| 3 or 4 Children | 0 (0.0%) | 9 (100.0%) |
| 5 or more Children | 0 (0.0%) | 0 (0.0%) |
| Total | 5 (9.8%) | 19 (12.2%) |
Race in Boyle
The most populous races in Boyle are White / Caucasian (374 | 53.4%), Black / African American (248 | 35.4%), and Some other Race (78 | 11.1%).
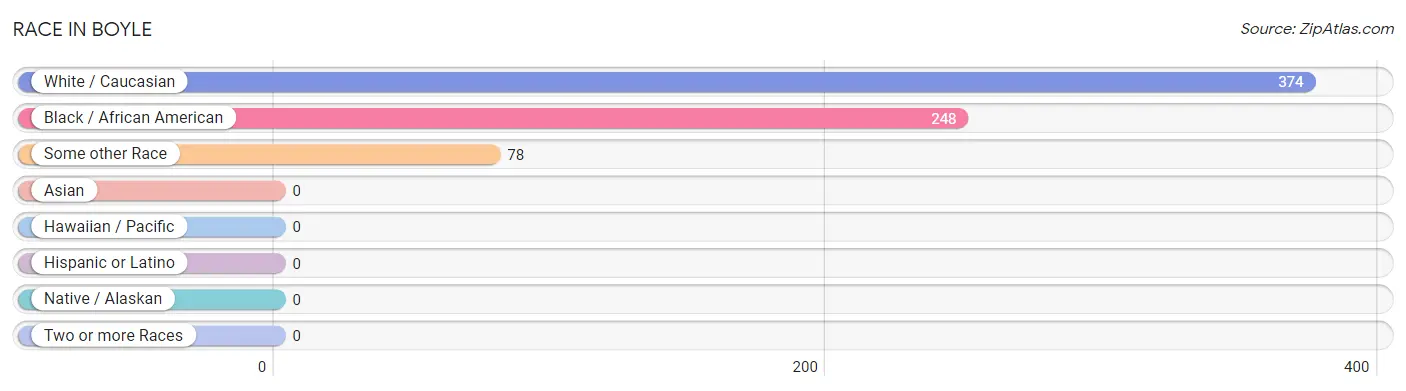
| Race | # Population | % Population |
| Asian | 0 | 0.0% |
| Black / African American | 248 | 35.4% |
| Hawaiian / Pacific | 0 | 0.0% |
| Hispanic or Latino | 0 | 0.0% |
| Native / Alaskan | 0 | 0.0% |
| White / Caucasian | 374 | 53.4% |
| Two or more Races | 0 | 0.0% |
| Some other Race | 78 | 11.1% |
| Total | 700 | 100.0% |
Ancestry in Boyle
The most populous ancestries reported in Boyle are German (79 | 11.3%), Slovene (78 | 11.1%), English (69 | 9.9%), Irish (40 | 5.7%), and French (10 | 1.4%), together accounting for 39.4% of all Boyle residents.
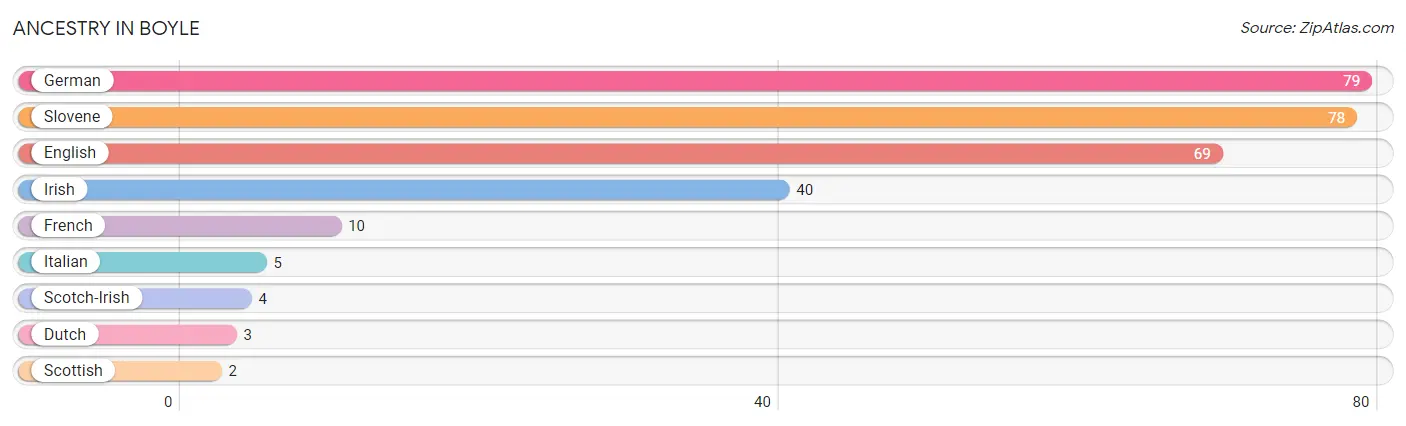
| Ancestry | # Population | % Population |
| Dutch | 3 | 0.4% |
| English | 69 | 9.9% |
| French | 10 | 1.4% |
| German | 79 | 11.3% |
| Irish | 40 | 5.7% |
| Italian | 5 | 0.7% |
| Scotch-Irish | 4 | 0.6% |
| Scottish | 2 | 0.3% |
| Slovene | 78 | 11.1% | View All 9 Rows |
Immigrants in Boyle
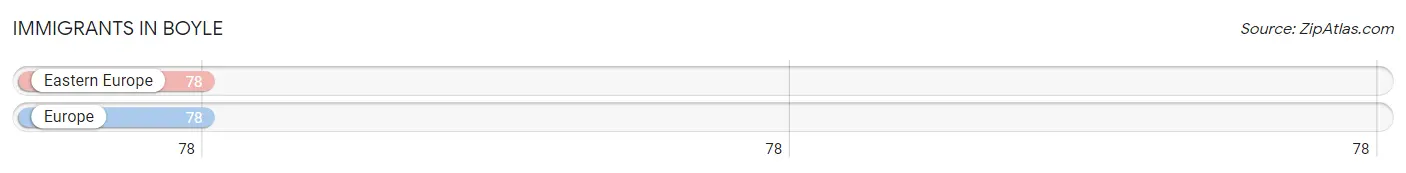
The most numerous immigrant groups reported in Boyle came from Eastern Europe (78 | 11.1%), and Europe (78 | 11.1%), together accounting for 22.3% of all Boyle residents.
| Immigration Origin | # Population | % Population |
| Eastern Europe | 78 | 11.1% |
| Europe | 78 | 11.1% | View All 2 Rows |
Sex and Age in Boyle
Sex and Age in Boyle
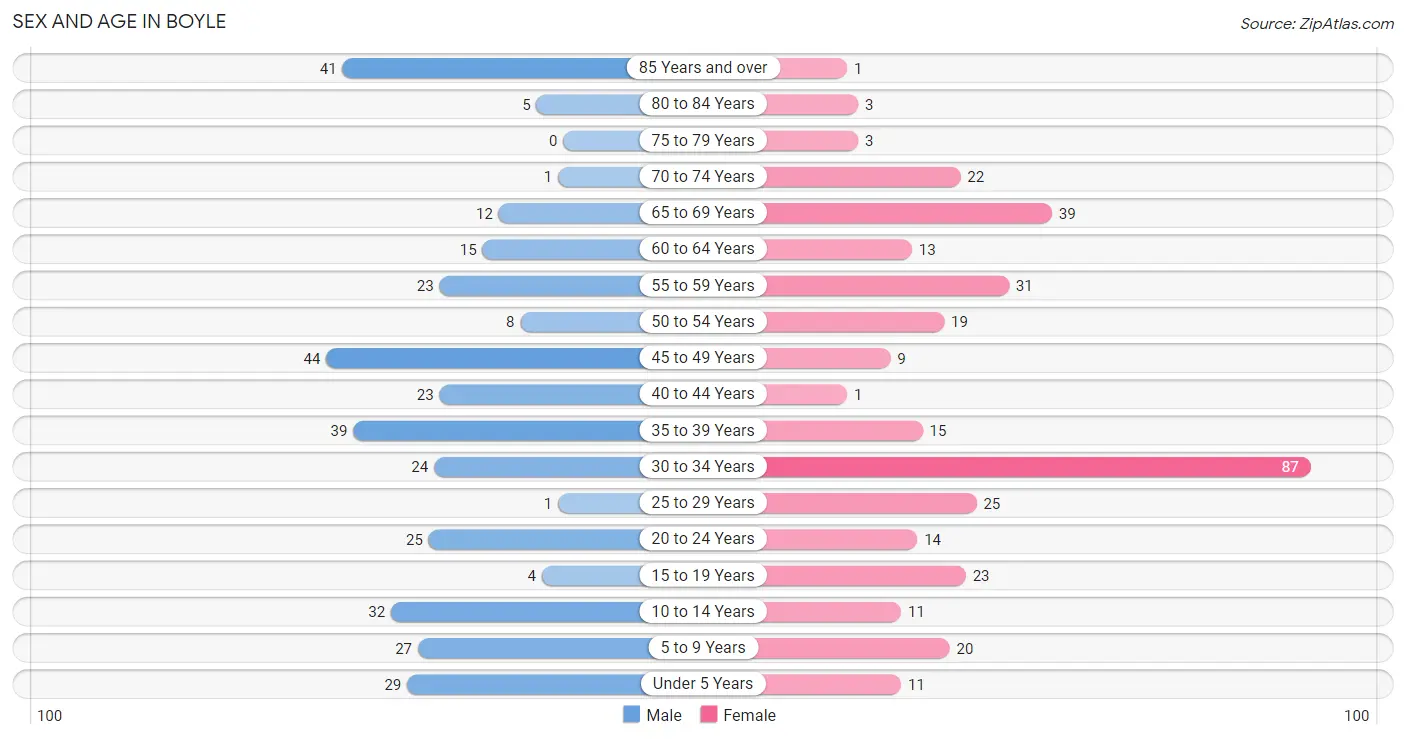
The most populous age groups in Boyle are 45 to 49 Years (44 | 12.5%) for men and 30 to 34 Years (87 | 25.1%) for women.
| Age Bracket | Male | Female |
| Under 5 Years | 29 (8.2%) | 11 (3.2%) |
| 5 to 9 Years | 27 (7.6%) | 20 (5.8%) |
| 10 to 14 Years | 32 (9.1%) | 11 (3.2%) |
| 15 to 19 Years | 4 (1.1%) | 23 (6.6%) |
| 20 to 24 Years | 25 (7.1%) | 14 (4.0%) |
| 25 to 29 Years | 1 (0.3%) | 25 (7.2%) |
| 30 to 34 Years | 24 (6.8%) | 87 (25.1%) |
| 35 to 39 Years | 39 (11.1%) | 15 (4.3%) |
| 40 to 44 Years | 23 (6.5%) | 1 (0.3%) |
| 45 to 49 Years | 44 (12.5%) | 9 (2.6%) |
| 50 to 54 Years | 8 (2.3%) | 19 (5.5%) |
| 55 to 59 Years | 23 (6.5%) | 31 (8.9%) |
| 60 to 64 Years | 15 (4.3%) | 13 (3.7%) |
| 65 to 69 Years | 12 (3.4%) | 39 (11.2%) |
| 70 to 74 Years | 1 (0.3%) | 22 (6.3%) |
| 75 to 79 Years | 0 (0.0%) | 3 (0.9%) |
| 80 to 84 Years | 5 (1.4%) | 3 (0.9%) |
| 85 Years and over | 41 (11.6%) | 1 (0.3%) |
| Total | 353 (100.0%) | 347 (100.0%) |
Families and Households in Boyle
Median Family Size in Boyle
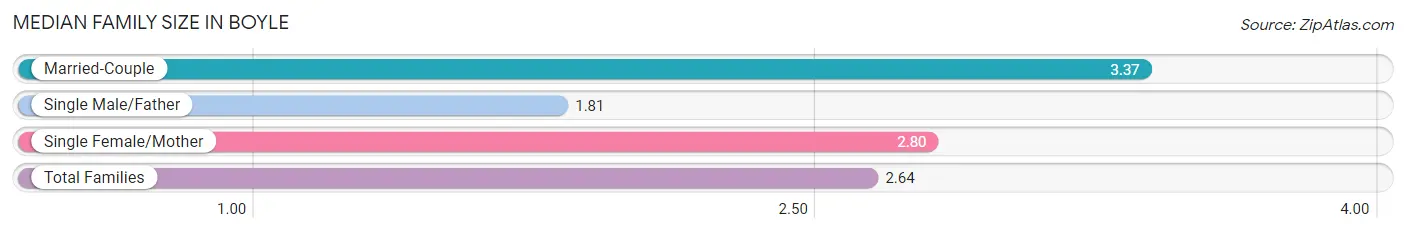
The median family size in Boyle is 2.64 persons per family, with married-couple families (51 | 24.6%) accounting for the largest median family size of 3.37 persons per family. On the other hand, single male/father families (64 | 30.9%) represent the smallest median family size with 1.81 persons per family.
| Family Type | # Families | Family Size |
| Married-Couple | 51 (24.6%) | 3.37 |
| Single Male/Father | 64 (30.9%) | 1.81 |
| Single Female/Mother | 92 (44.4%) | 2.80 |
| Total Families | 207 (100.0%) | 2.64 |
Median Household Size in Boyle
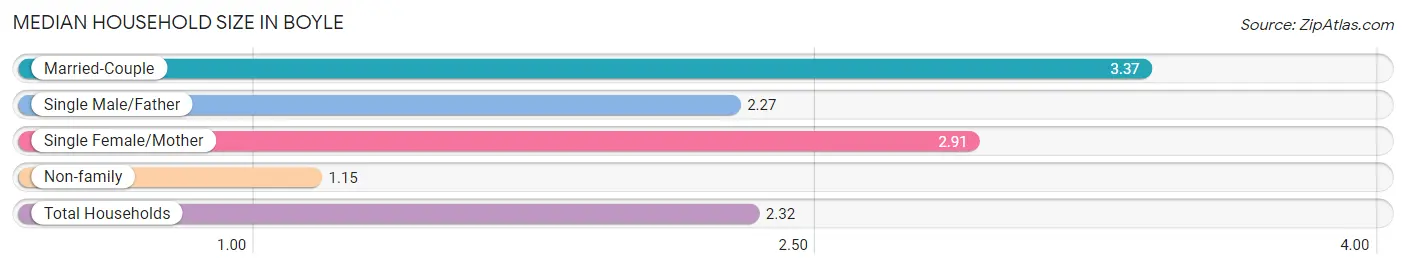
The median household size in Boyle is 2.32 persons per household, with married-couple households (51 | 17.1%) accounting for the largest median household size of 3.37 persons per household. non-family households (91 | 30.5%) represent the smallest median household size with 1.15 persons per household.
| Household Type | # Households | Household Size |
| Married-Couple | 51 (17.1%) | 3.37 |
| Single Male/Father | 64 (21.5%) | 2.27 |
| Single Female/Mother | 92 (30.9%) | 2.91 |
| Non-family | 91 (30.5%) | 1.15 |
| Total Households | 298 (100.0%) | 2.32 |
Household Size by Marriage Status in Boyle
Out of a total of 298 households in Boyle, 207 (69.5%) are family households, while 91 (30.5%) are nonfamily households. The most numerous type of family households are 2-person households, comprising 129, and the most common type of nonfamily households are 1-person households, comprising 76.
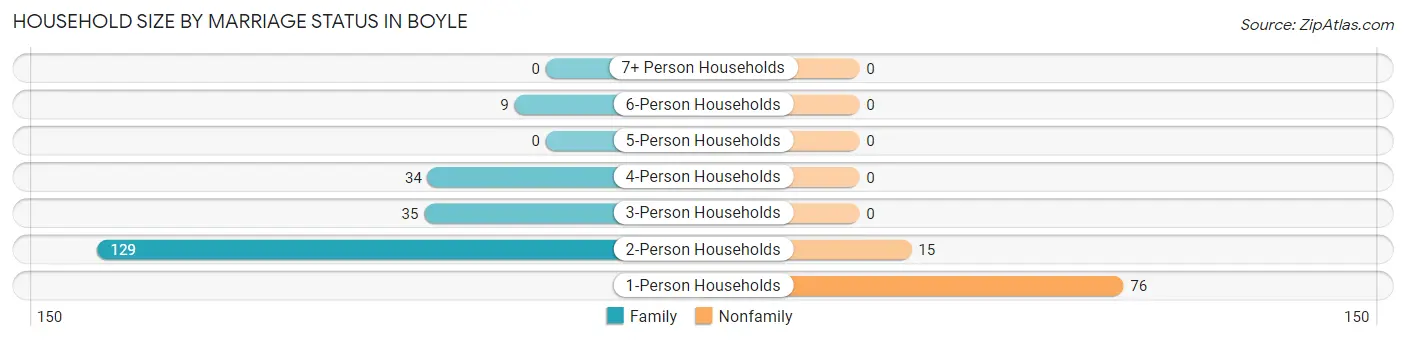
| Household Size | Family Households | Nonfamily Households |
| 1-Person Households | - | 76 (25.5%) |
| 2-Person Households | 129 (43.3%) | 15 (5.0%) |
| 3-Person Households | 35 (11.7%) | 0 (0.0%) |
| 4-Person Households | 34 (11.4%) | 0 (0.0%) |
| 5-Person Households | 0 (0.0%) | 0 (0.0%) |
| 6-Person Households | 9 (3.0%) | 0 (0.0%) |
| 7+ Person Households | 0 (0.0%) | 0 (0.0%) |
| Total | 207 (69.5%) | 91 (30.5%) |
Female Fertility in Boyle
Fertility by Age in Boyle
Average fertility rate in Boyle is 83.0 births per 1,000 women. Women in the age bracket of 15 to 19 years have the highest fertility rate with 652.0 births per 1,000 women. Women in the age bracket of 15 to 19 years acount for 100.0% of all women with births.
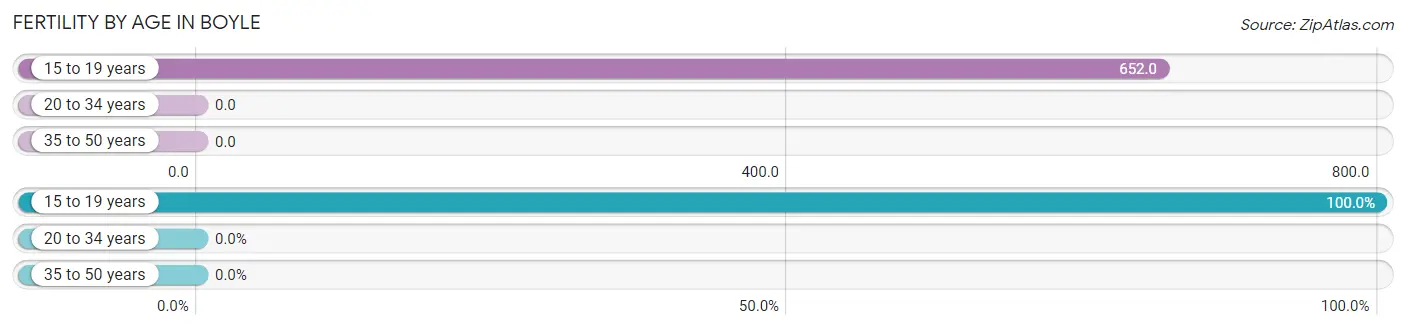
| Age Bracket | Women with Births | Births / 1,000 Women |
| 15 to 19 years | 15 (100.0%) | 652.0 |
| 20 to 34 years | 0 (0.0%) | 0.0 |
| 35 to 50 years | 0 (0.0%) | 0.0 |
| Total | 15 (100.0%) | 83.0 |
Fertility by Age by Marriage Status in Boyle
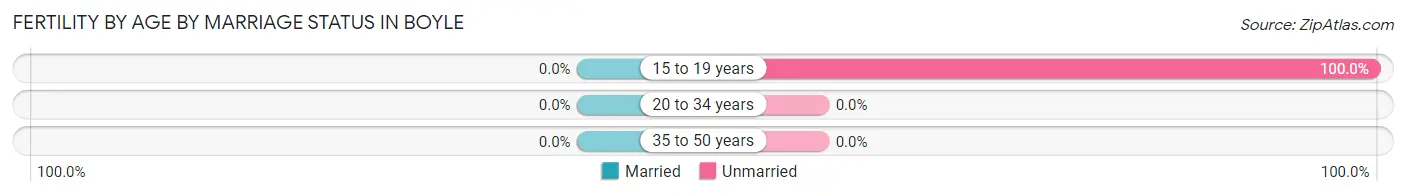
| Age Bracket | Married | Unmarried |
| 15 to 19 years | 0 (0.0%) | 15 (100.0%) |
| 20 to 34 years | 0 (0.0%) | 0 (0.0%) |
| 35 to 50 years | 0 (0.0%) | 0 (0.0%) |
| Total | 0 (0.0%) | 15 (100.0%) |
Fertility by Education in Boyle
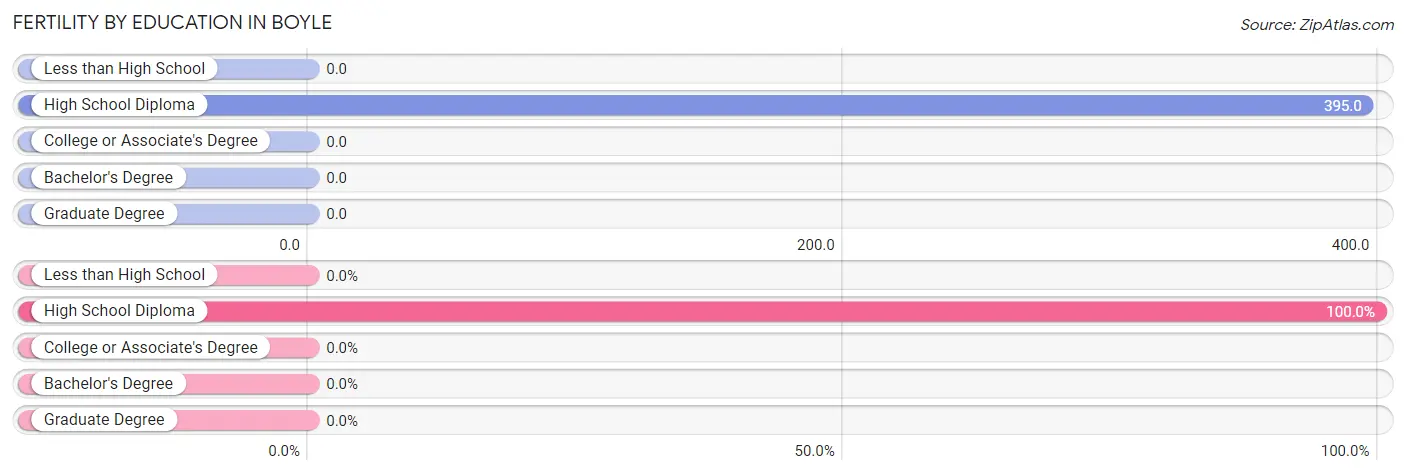
| Educational Attainment | Women with Births | Births / 1,000 Women |
| Less than High School | 0 (0.0%) | 0.0 |
| High School Diploma | 15 (100.0%) | 395.0 |
| College or Associate's Degree | 0 (0.0%) | 0.0 |
| Bachelor's Degree | 0 (0.0%) | 0.0 |
| Graduate Degree | 0 (0.0%) | 0.0 |
| Total | 15 (100.0%) | 83.0 |
Fertility by Education by Marriage Status in Boyle
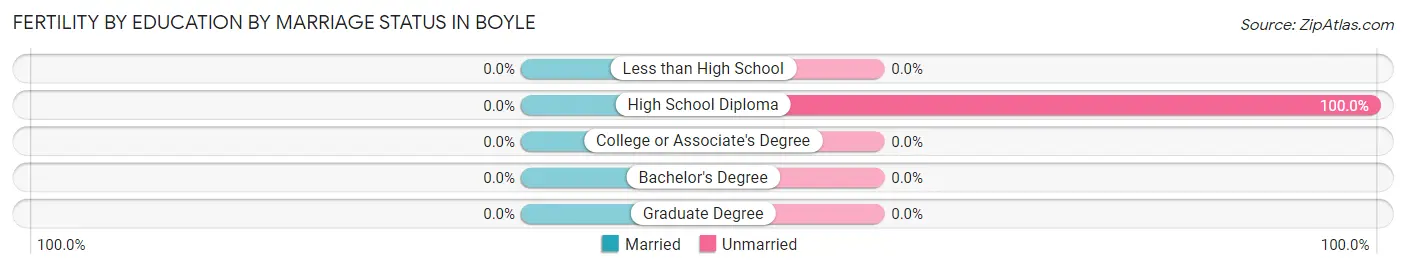
| Educational Attainment | Married | Unmarried |
| Less than High School | 0 (0.0%) | 0 (0.0%) |
| High School Diploma | 0 (0.0%) | 15 (100.0%) |
| College or Associate's Degree | 0 (0.0%) | 0 (0.0%) |
| Bachelor's Degree | 0 (0.0%) | 0 (0.0%) |
| Graduate Degree | 0 (0.0%) | 0 (0.0%) |
| Total | 0 (0.0%) | 15 (100.0%) |
Employment Characteristics in Boyle
Employment by Class of Employer in Boyle
Among the 304 employed individuals in Boyle, private company employees (217 | 71.4%), state government employees (46 | 15.1%), and local government employees (30 | 9.9%) make up the most common classes of employment.
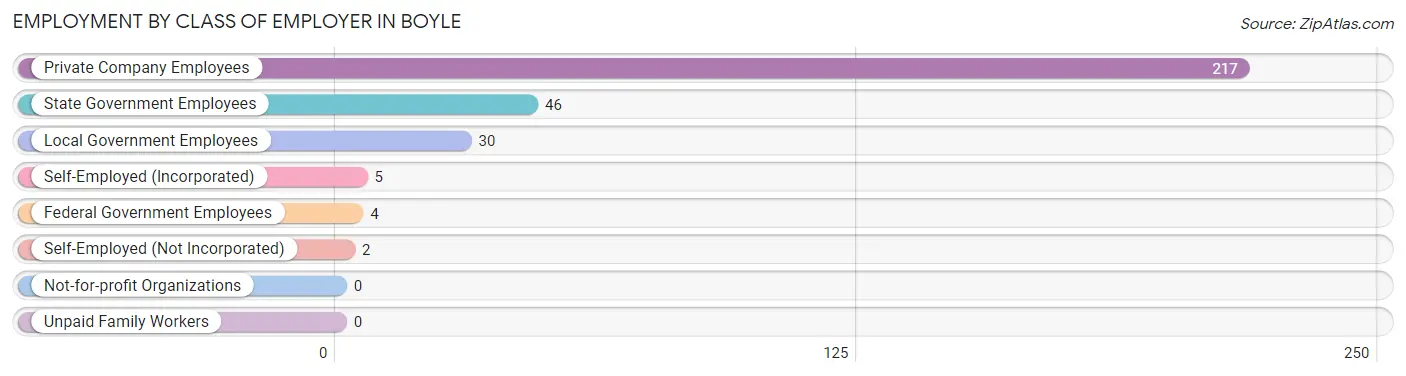
| Employer Class | # Employees | % Employees |
| Private Company Employees | 217 | 71.4% |
| Self-Employed (Incorporated) | 5 | 1.6% |
| Self-Employed (Not Incorporated) | 2 | 0.7% |
| Not-for-profit Organizations | 0 | 0.0% |
| Local Government Employees | 30 | 9.9% |
| State Government Employees | 46 | 15.1% |
| Federal Government Employees | 4 | 1.3% |
| Unpaid Family Workers | 0 | 0.0% |
| Total | 304 | 100.0% |
Employment Status by Age in Boyle
According to the labor force statistics for Boyle, out of the total population over 16 years of age (570), 59.5% or 339 individuals are in the labor force, with 10.3% or 35 of them unemployed. The age group with the highest labor force participation rate is 45 to 54 years, with 91.3% or 73 individuals in the labor force. Within the labor force, the 16 to 19 years age range has the highest percentage of unemployed individuals, with 100.0% or 15 of them being unemployed.
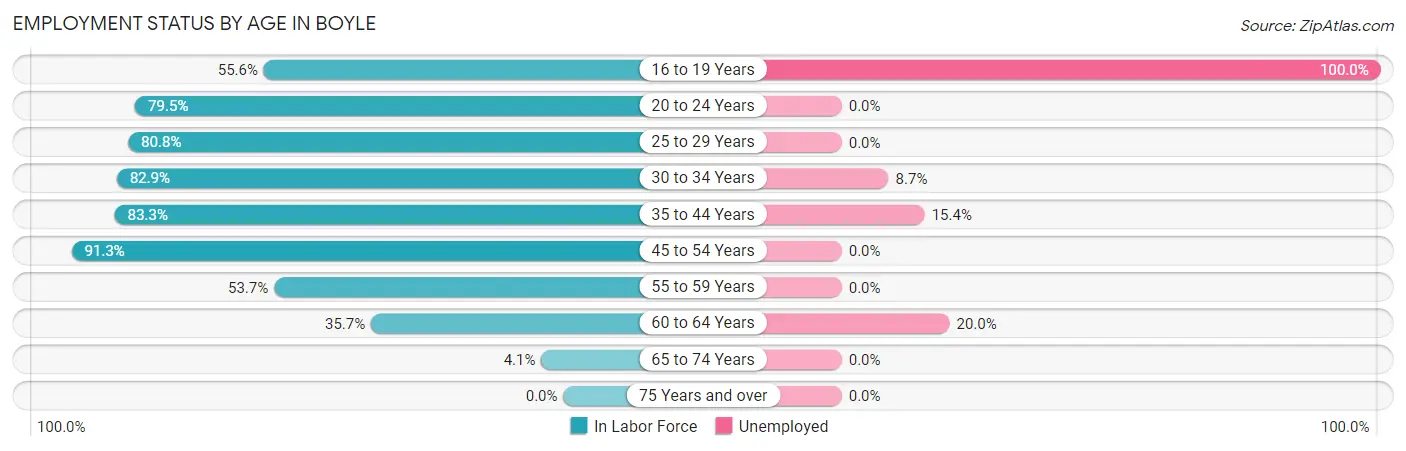
| Age Bracket | In Labor Force | Unemployed |
| 16 to 19 Years | 15 (55.6%) | 15 (100.0%) |
| 20 to 24 Years | 31 (79.5%) | 0 (0.0%) |
| 25 to 29 Years | 21 (80.8%) | 0 (0.0%) |
| 30 to 34 Years | 92 (82.9%) | 8 (8.7%) |
| 35 to 44 Years | 65 (83.3%) | 10 (15.4%) |
| 45 to 54 Years | 73 (91.3%) | 0 (0.0%) |
| 55 to 59 Years | 29 (53.7%) | 0 (0.0%) |
| 60 to 64 Years | 10 (35.7%) | 2 (20.0%) |
| 65 to 74 Years | 3 (4.1%) | 0 (0.0%) |
| 75 Years and over | 0 (0.0%) | 0 (0.0%) |
| Total | 339 (59.5%) | 35 (10.3%) |
Employment Status by Educational Attainment in Boyle
According to labor force statistics for Boyle, 76.9% of individuals (290) out of the total population between 25 and 64 years of age (377) are in the labor force, with 6.9% or 20 of them being unemployed. The group with the highest labor force participation rate are those with the educational attainment of bachelor's degree or higher, with 93.2% or 110 individuals in the labor force. Within the labor force, individuals with less than high school education have the highest percentage of unemployment, with 47.6% or 10 of them being unemployed.
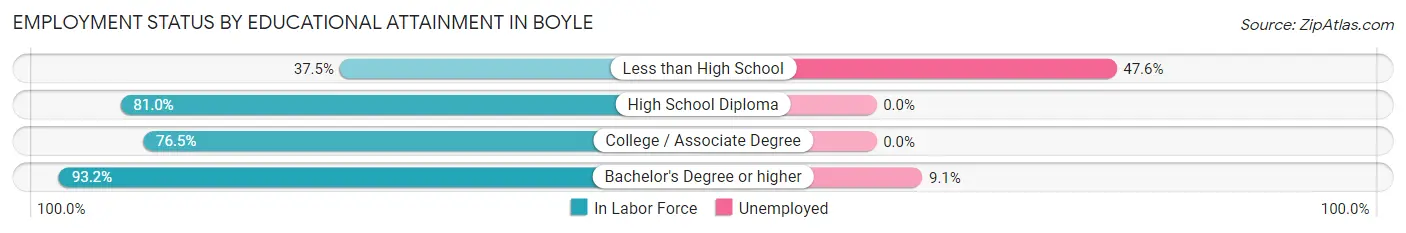
| Educational Attainment | In Labor Force | Unemployed |
| Less than High School | 21 (37.5%) | 27 (47.6%) |
| High School Diploma | 68 (81.0%) | 0 (0.0%) |
| College / Associate Degree | 91 (76.5%) | 0 (0.0%) |
| Bachelor's Degree or higher | 110 (93.2%) | 11 (9.1%) |
| Total | 290 (76.9%) | 26 (6.9%) |
Employment Occupations by Sex in Boyle
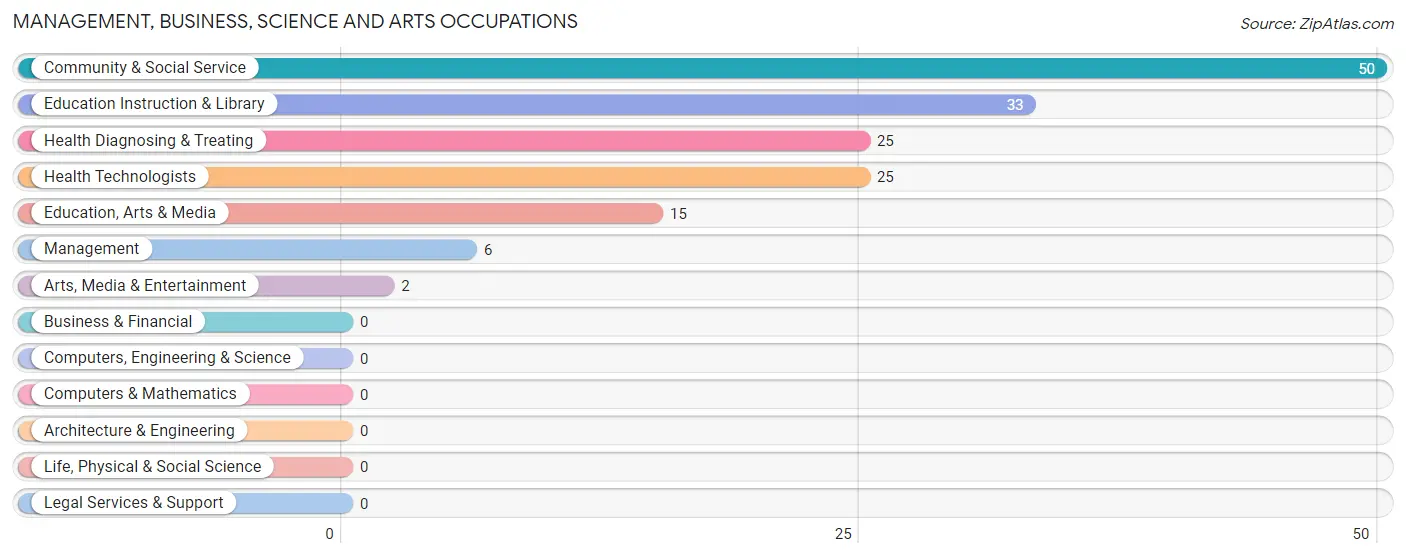
Management, Business, Science and Arts Occupations
The most common Management, Business, Science and Arts occupations in Boyle are Community & Social Service (50 | 16.5%), Education Instruction & Library (33 | 10.9%), Health Diagnosing & Treating (25 | 8.2%), Health Technologists (25 | 8.2%), and Education, Arts & Media (15 | 4.9%).
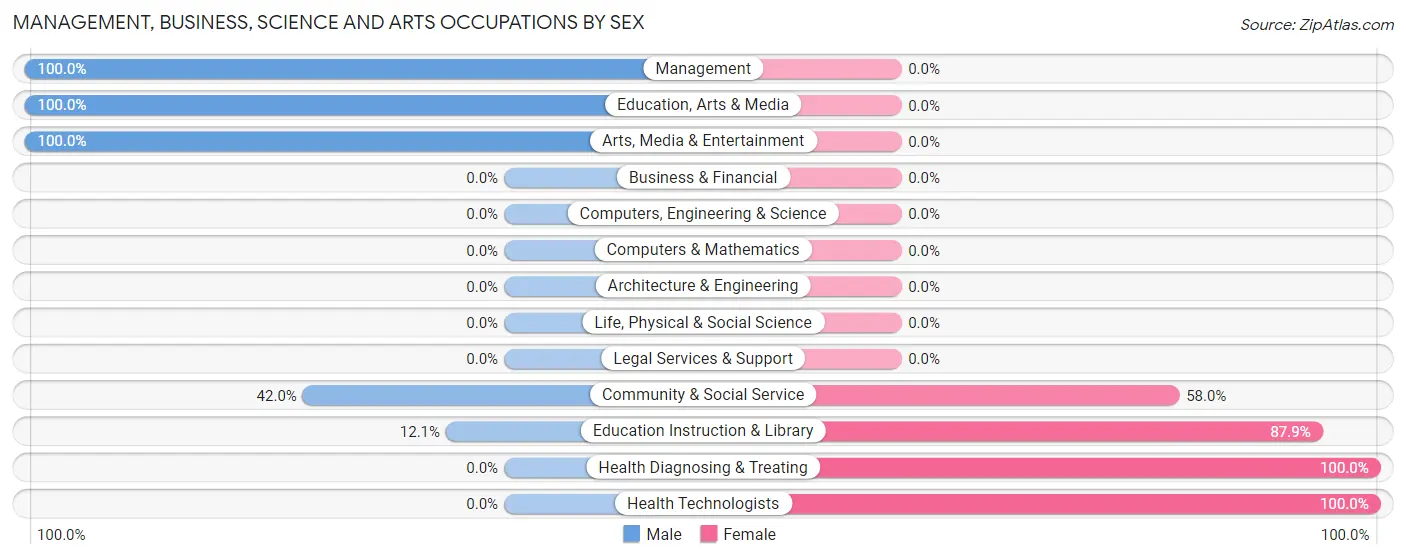
Management, Business, Science and Arts Occupations by Sex
Within the Management, Business, Science and Arts occupations in Boyle, the most male-oriented occupations are Management (100.0%), Education, Arts & Media (100.0%), and Arts, Media & Entertainment (100.0%), while the most female-oriented occupations are Health Diagnosing & Treating (100.0%), Health Technologists (100.0%), and Education Instruction & Library (87.9%).
| Occupation | Male | Female |
| Management | 6 (100.0%) | 0 (0.0%) |
| Business & Financial | 0 (0.0%) | 0 (0.0%) |
| Computers, Engineering & Science | 0 (0.0%) | 0 (0.0%) |
| Computers & Mathematics | 0 (0.0%) | 0 (0.0%) |
| Architecture & Engineering | 0 (0.0%) | 0 (0.0%) |
| Life, Physical & Social Science | 0 (0.0%) | 0 (0.0%) |
| Community & Social Service | 21 (42.0%) | 29 (58.0%) |
| Education, Arts & Media | 15 (100.0%) | 0 (0.0%) |
| Legal Services & Support | 0 (0.0%) | 0 (0.0%) |
| Education Instruction & Library | 4 (12.1%) | 29 (87.9%) |
| Arts, Media & Entertainment | 2 (100.0%) | 0 (0.0%) |
| Health Diagnosing & Treating | 0 (0.0%) | 25 (100.0%) |
| Health Technologists | 0 (0.0%) | 25 (100.0%) |
| Total (Category) | 27 (33.3%) | 54 (66.7%) |
| Total (Overall) | 172 (56.6%) | 132 (43.4%) |
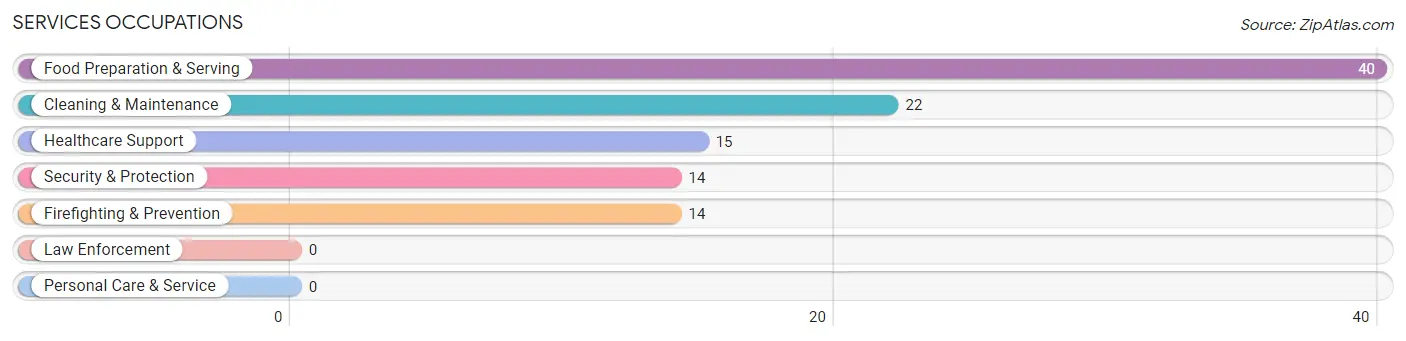
Services Occupations
The most common Services occupations in Boyle are Food Preparation & Serving (40 | 13.2%), Cleaning & Maintenance (22 | 7.2%), Healthcare Support (15 | 4.9%), Security & Protection (14 | 4.6%), and Firefighting & Prevention (14 | 4.6%).
Services Occupations by Sex
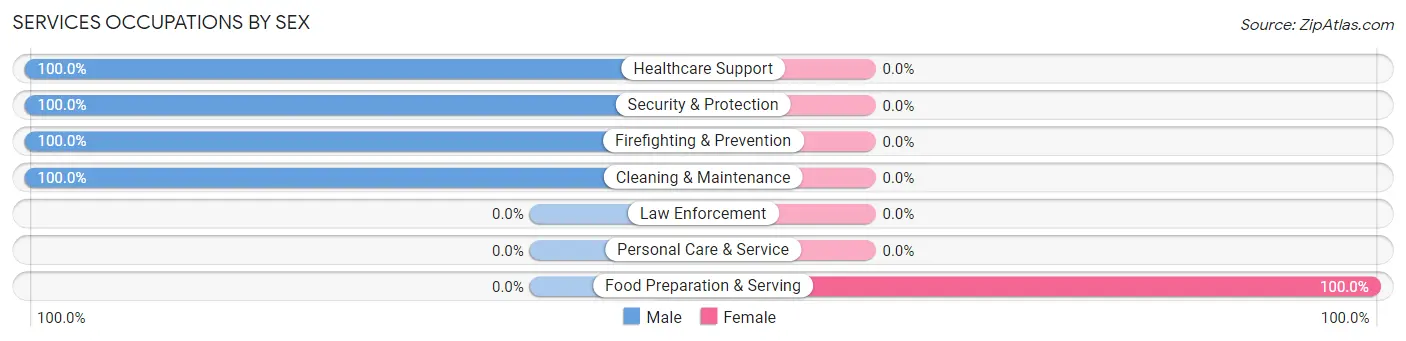
| Occupation | Male | Female |
| Healthcare Support | 15 (100.0%) | 0 (0.0%) |
| Security & Protection | 14 (100.0%) | 0 (0.0%) |
| Firefighting & Prevention | 14 (100.0%) | 0 (0.0%) |
| Law Enforcement | 0 (0.0%) | 0 (0.0%) |
| Food Preparation & Serving | 0 (0.0%) | 40 (100.0%) |
| Cleaning & Maintenance | 22 (100.0%) | 0 (0.0%) |
| Personal Care & Service | 0 (0.0%) | 0 (0.0%) |
| Total (Category) | 51 (56.0%) | 40 (44.0%) |
| Total (Overall) | 172 (56.6%) | 132 (43.4%) |
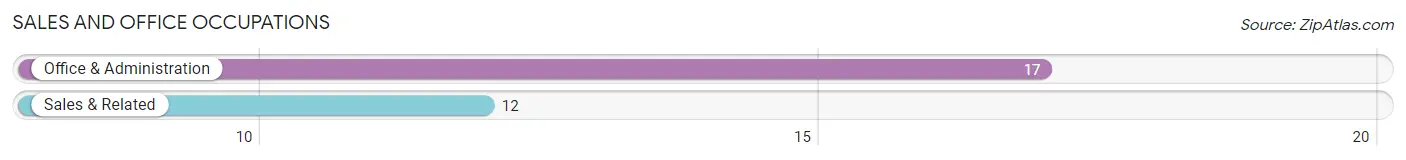
Sales and Office Occupations
The most common Sales and Office occupations in Boyle are Office & Administration (17 | 5.6%), and Sales & Related (12 | 4.0%).
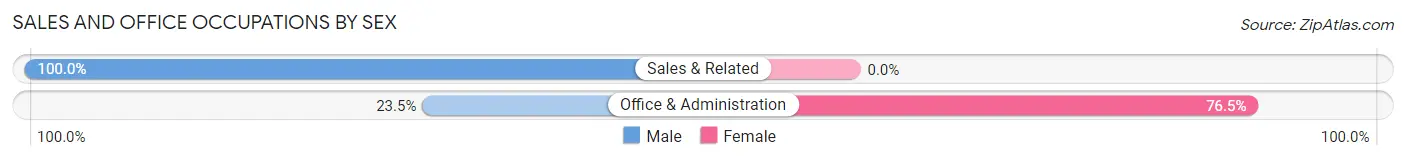
Sales and Office Occupations by Sex
| Occupation | Male | Female |
| Sales & Related | 12 (100.0%) | 0 (0.0%) |
| Office & Administration | 4 (23.5%) | 13 (76.5%) |
| Total (Category) | 16 (55.2%) | 13 (44.8%) |
| Total (Overall) | 172 (56.6%) | 132 (43.4%) |
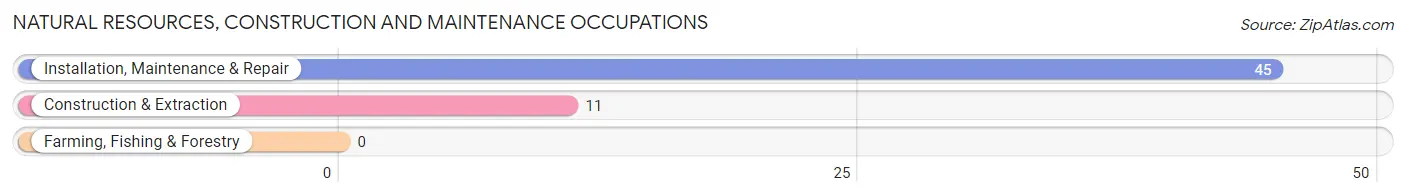
Natural Resources, Construction and Maintenance Occupations
The most common Natural Resources, Construction and Maintenance occupations in Boyle are Installation, Maintenance & Repair (45 | 14.8%), and Construction & Extraction (11 | 3.6%).
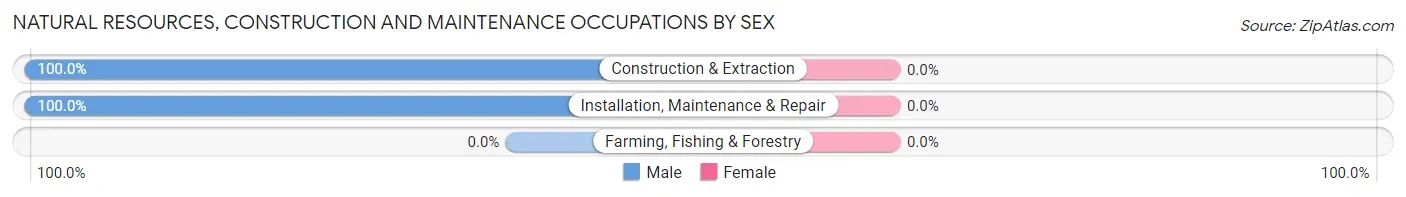
Natural Resources, Construction and Maintenance Occupations by Sex
| Occupation | Male | Female |
| Farming, Fishing & Forestry | 0 (0.0%) | 0 (0.0%) |
| Construction & Extraction | 11 (100.0%) | 0 (0.0%) |
| Installation, Maintenance & Repair | 45 (100.0%) | 0 (0.0%) |
| Total (Category) | 56 (100.0%) | 0 (0.0%) |
| Total (Overall) | 172 (56.6%) | 132 (43.4%) |
Production, Transportation and Moving Occupations
The most common Production, Transportation and Moving occupations in Boyle are , and Production (47 | 15.5%).
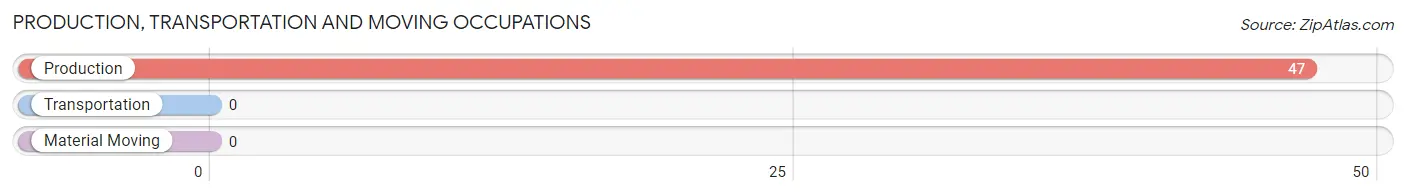
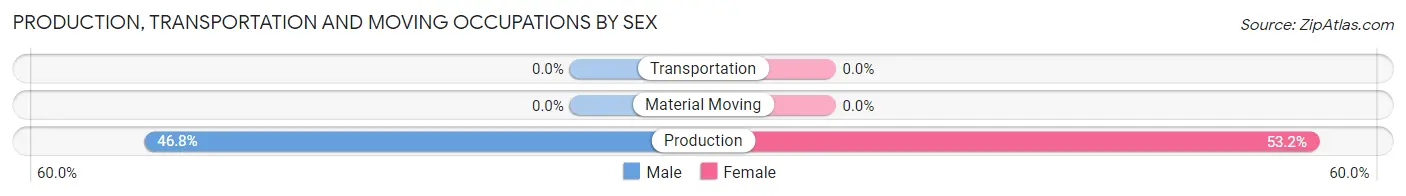
Production, Transportation and Moving Occupations by Sex
| Occupation | Male | Female |
| Production | 22 (46.8%) | 25 (53.2%) |
| Transportation | 0 (0.0%) | 0 (0.0%) |
| Material Moving | 0 (0.0%) | 0 (0.0%) |
| Total (Category) | 22 (46.8%) | 25 (53.2%) |
| Total (Overall) | 172 (56.6%) | 132 (43.4%) |
Employment Industries by Sex in Boyle
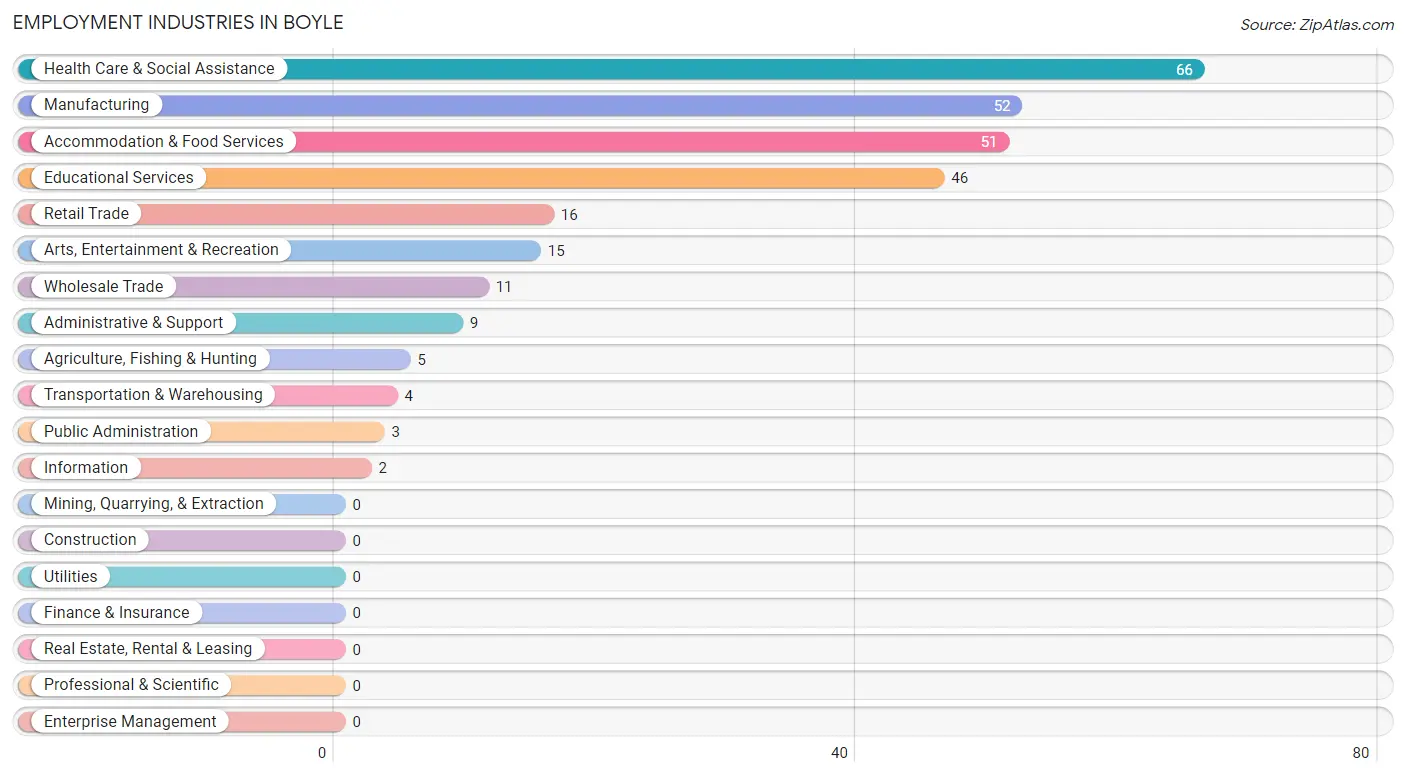
Employment Industries in Boyle
The major employment industries in Boyle include Health Care & Social Assistance (66 | 21.7%), Manufacturing (52 | 17.1%), Accommodation & Food Services (51 | 16.8%), Educational Services (46 | 15.1%), and Retail Trade (16 | 5.3%).
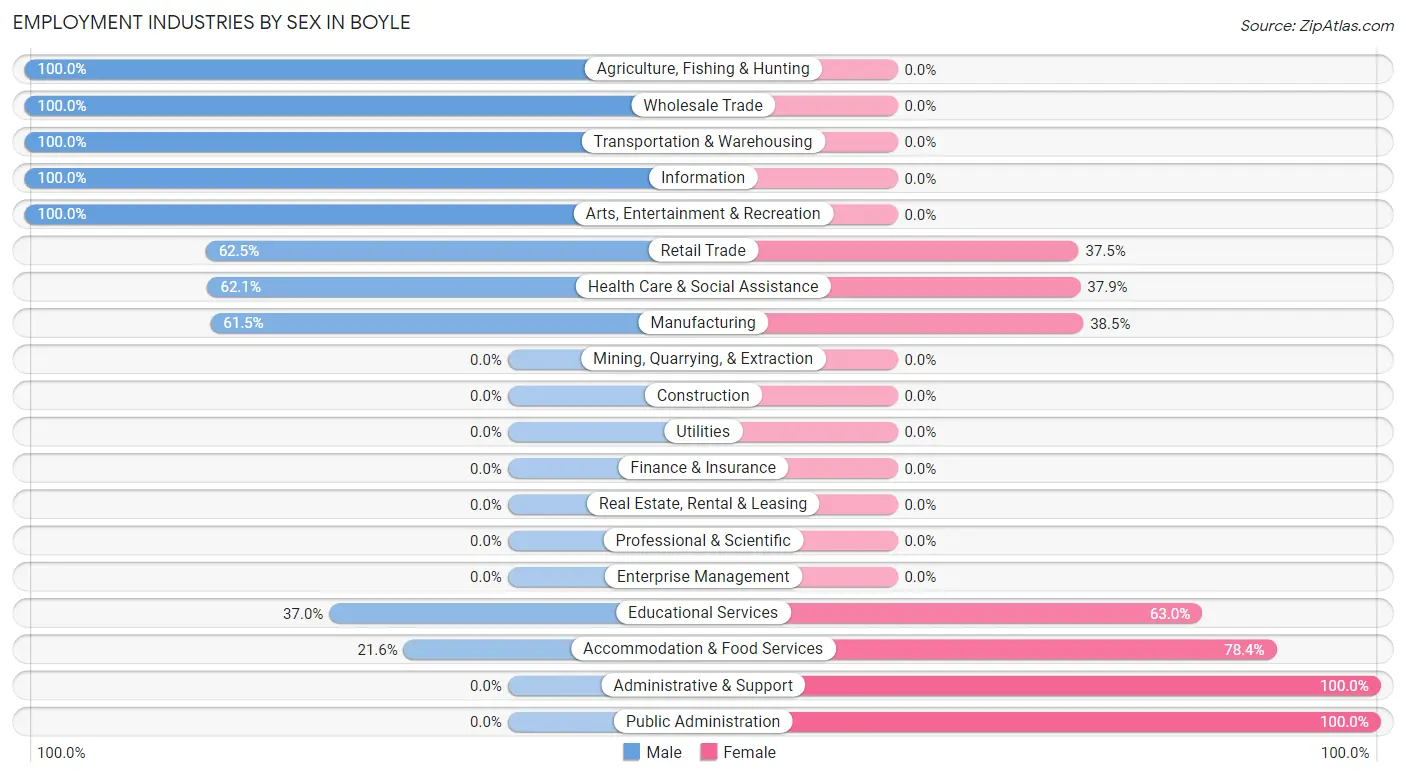
Employment Industries by Sex in Boyle
The Boyle industries that see more men than women are Agriculture, Fishing & Hunting (100.0%), Wholesale Trade (100.0%), and Transportation & Warehousing (100.0%), whereas the industries that tend to have a higher number of women are Administrative & Support (100.0%), Public Administration (100.0%), and Accommodation & Food Services (78.4%).
| Industry | Male | Female |
| Agriculture, Fishing & Hunting | 5 (100.0%) | 0 (0.0%) |
| Mining, Quarrying, & Extraction | 0 (0.0%) | 0 (0.0%) |
| Construction | 0 (0.0%) | 0 (0.0%) |
| Manufacturing | 32 (61.5%) | 20 (38.5%) |
| Wholesale Trade | 11 (100.0%) | 0 (0.0%) |
| Retail Trade | 10 (62.5%) | 6 (37.5%) |
| Transportation & Warehousing | 4 (100.0%) | 0 (0.0%) |
| Utilities | 0 (0.0%) | 0 (0.0%) |
| Information | 2 (100.0%) | 0 (0.0%) |
| Finance & Insurance | 0 (0.0%) | 0 (0.0%) |
| Real Estate, Rental & Leasing | 0 (0.0%) | 0 (0.0%) |
| Professional & Scientific | 0 (0.0%) | 0 (0.0%) |
| Enterprise Management | 0 (0.0%) | 0 (0.0%) |
| Administrative & Support | 0 (0.0%) | 9 (100.0%) |
| Educational Services | 17 (37.0%) | 29 (63.0%) |
| Health Care & Social Assistance | 41 (62.1%) | 25 (37.9%) |
| Arts, Entertainment & Recreation | 15 (100.0%) | 0 (0.0%) |
| Accommodation & Food Services | 11 (21.6%) | 40 (78.4%) |
| Public Administration | 0 (0.0%) | 3 (100.0%) |
| Total | 172 (56.6%) | 132 (43.4%) |
Education in Boyle
School Enrollment in Boyle
The most common levels of schooling among the 103 students in Boyle are elementary school (38 | 36.9%), middle school (34 | 33.0%), and graduate / professional (10 | 9.7%).
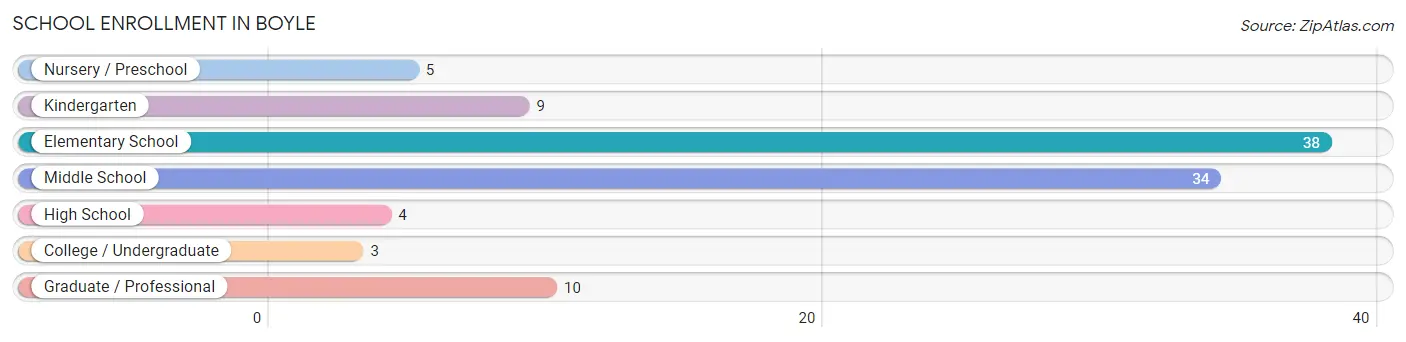
| School Level | # Students | % Students |
| Nursery / Preschool | 5 | 4.9% |
| Kindergarten | 9 | 8.7% |
| Elementary School | 38 | 36.9% |
| Middle School | 34 | 33.0% |
| High School | 4 | 3.9% |
| College / Undergraduate | 3 | 2.9% |
| Graduate / Professional | 10 | 9.7% |
| Total | 103 | 100.0% |
School Enrollment by Age by Funding Source in Boyle
Out of a total of 103 students who are enrolled in schools in Boyle, 20 (19.4%) attend a private institution, while the remaining 83 (80.6%) are enrolled in public schools. The age group of 3 to 4 year olds has the highest likelihood of being enrolled in private schools, with 5 (100.0% in the age bracket) enrolled. Conversely, the age group of 5 to 9 year old has the lowest likelihood of being enrolled in a private school, with 47 (100.0% in the age bracket) attending a public institution.
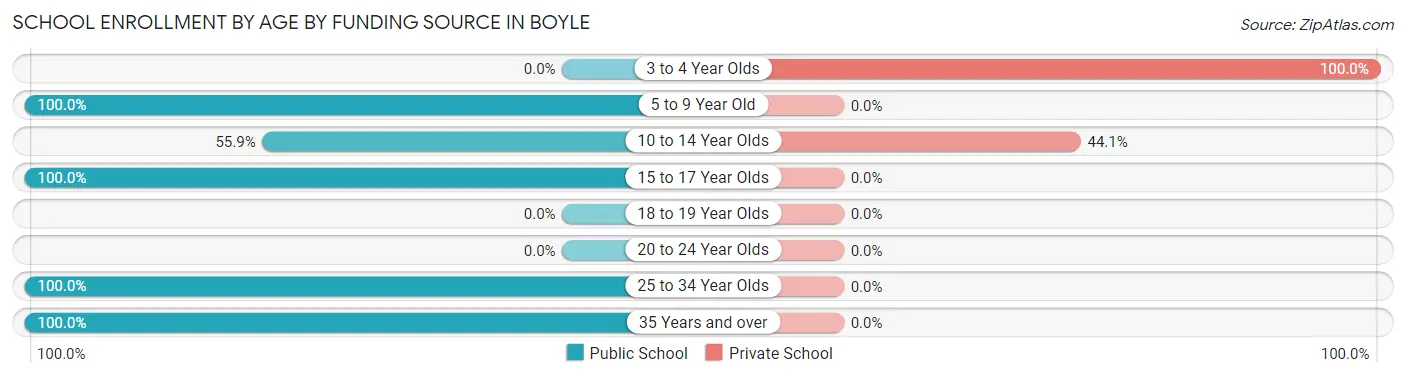
| Age Bracket | Public School | Private School |
| 3 to 4 Year Olds | 0 (0.0%) | 5 (100.0%) |
| 5 to 9 Year Old | 47 (100.0%) | 0 (0.0%) |
| 10 to 14 Year Olds | 19 (55.9%) | 15 (44.1%) |
| 15 to 17 Year Olds | 4 (100.0%) | 0 (0.0%) |
| 18 to 19 Year Olds | 0 (0.0%) | 0 (0.0%) |
| 20 to 24 Year Olds | 0 (0.0%) | 0 (0.0%) |
| 25 to 34 Year Olds | 10 (100.0%) | 0 (0.0%) |
| 35 Years and over | 3 (100.0%) | 0 (0.0%) |
| Total | 83 (80.6%) | 20 (19.4%) |
Educational Attainment by Field of Study in Boyle
Business (55 | 25.8%), visual & performing arts (42 | 19.7%), engineering (41 | 19.3%), education (17 | 8.0%), and arts & humanities (16 | 7.5%) are the most common fields of study among 213 individuals in Boyle who have obtained a bachelor's degree or higher.
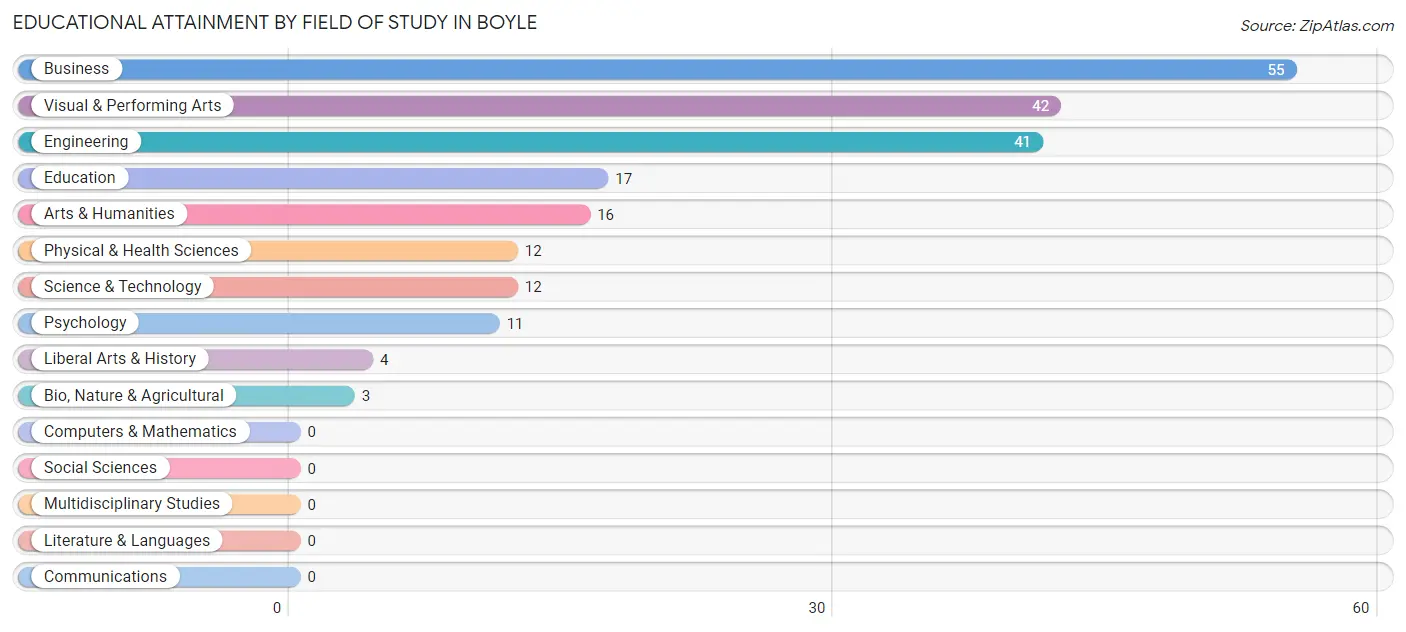
| Field of Study | # Graduates | % Graduates |
| Computers & Mathematics | 0 | 0.0% |
| Bio, Nature & Agricultural | 3 | 1.4% |
| Physical & Health Sciences | 12 | 5.6% |
| Psychology | 11 | 5.2% |
| Social Sciences | 0 | 0.0% |
| Engineering | 41 | 19.3% |
| Multidisciplinary Studies | 0 | 0.0% |
| Science & Technology | 12 | 5.6% |
| Business | 55 | 25.8% |
| Education | 17 | 8.0% |
| Literature & Languages | 0 | 0.0% |
| Liberal Arts & History | 4 | 1.9% |
| Visual & Performing Arts | 42 | 19.7% |
| Communications | 0 | 0.0% |
| Arts & Humanities | 16 | 7.5% |
| Total | 213 | 100.0% |
Transportation & Commute in Boyle
Vehicle Availability by Sex in Boyle
The most prevalent vehicle ownership categories in Boyle are males with 2 vehicles (65, accounting for 38.0%) and females with 2 vehicles (65, making up 49.2%).
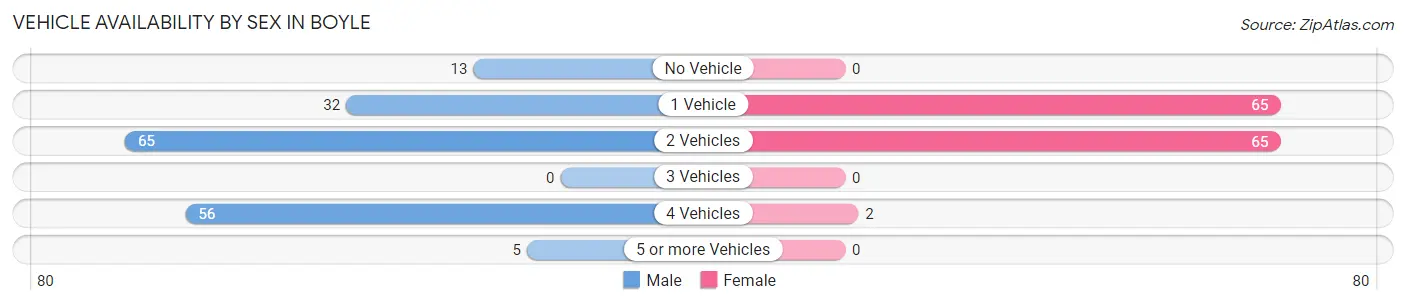
| Vehicles Available | Male | Female |
| No Vehicle | 13 (7.6%) | 0 (0.0%) |
| 1 Vehicle | 32 (18.7%) | 65 (49.2%) |
| 2 Vehicles | 65 (38.0%) | 65 (49.2%) |
| 3 Vehicles | 0 (0.0%) | 0 (0.0%) |
| 4 Vehicles | 56 (32.8%) | 2 (1.5%) |
| 5 or more Vehicles | 5 (2.9%) | 0 (0.0%) |
| Total | 171 (100.0%) | 132 (100.0%) |
Commute Time in Boyle
The most frequently occuring commute durations in Boyle are 10 to 14 minutes (154 commuters, 50.7%), 20 to 24 minutes (40 commuters, 13.2%), and 5 to 9 minutes (36 commuters, 11.8%).
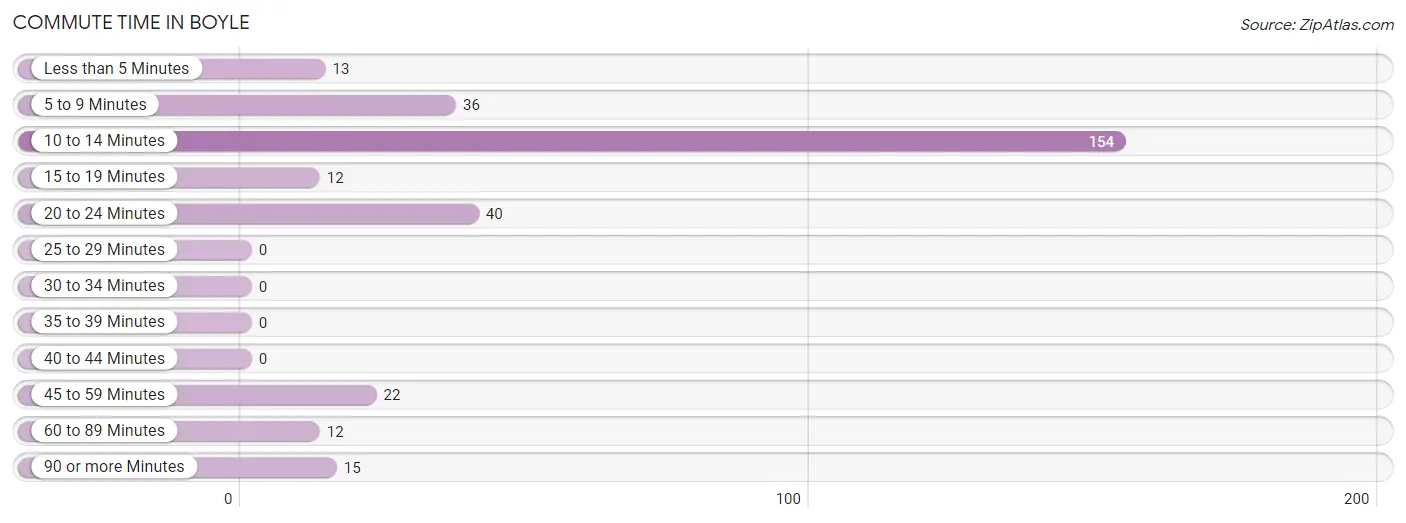
| Commute Time | # Commuters | % Commuters |
| Less than 5 Minutes | 13 | 4.3% |
| 5 to 9 Minutes | 36 | 11.8% |
| 10 to 14 Minutes | 154 | 50.7% |
| 15 to 19 Minutes | 12 | 4.0% |
| 20 to 24 Minutes | 40 | 13.2% |
| 25 to 29 Minutes | 0 | 0.0% |
| 30 to 34 Minutes | 0 | 0.0% |
| 35 to 39 Minutes | 0 | 0.0% |
| 40 to 44 Minutes | 0 | 0.0% |
| 45 to 59 Minutes | 22 | 7.2% |
| 60 to 89 Minutes | 12 | 4.0% |
| 90 or more Minutes | 15 | 4.9% |
Commute Time by Sex in Boyle
The most common commute times in Boyle are 10 to 14 minutes (101 commuters, 58.7%) for males and 10 to 14 minutes (53 commuters, 40.2%) for females.
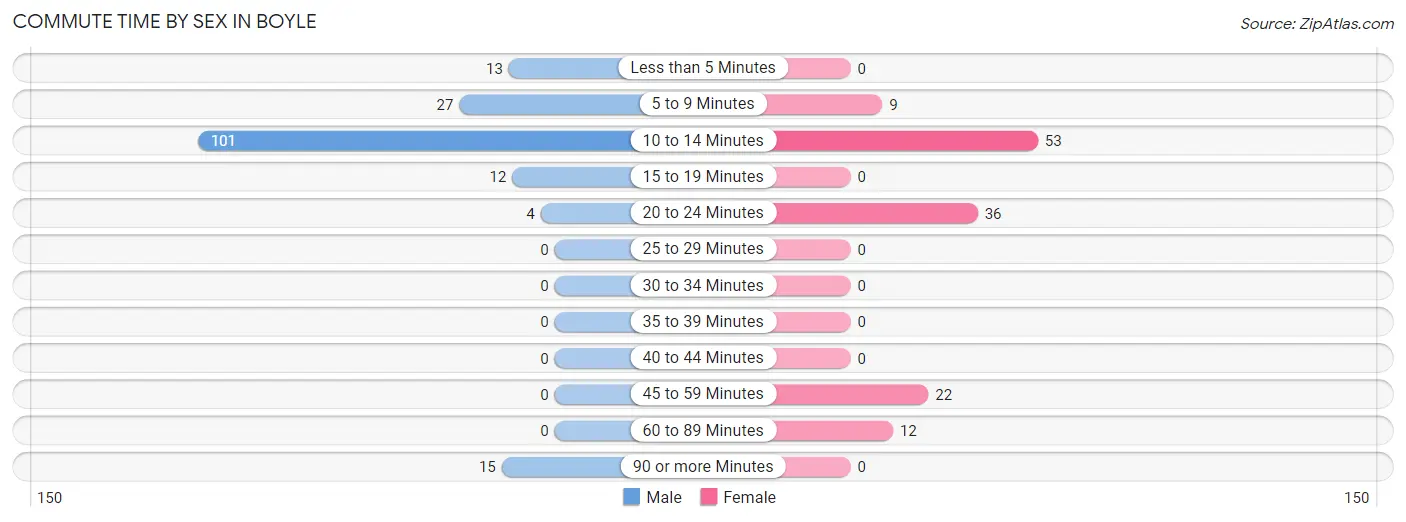
| Commute Time | Male | Female |
| Less than 5 Minutes | 13 (7.6%) | 0 (0.0%) |
| 5 to 9 Minutes | 27 (15.7%) | 9 (6.8%) |
| 10 to 14 Minutes | 101 (58.7%) | 53 (40.2%) |
| 15 to 19 Minutes | 12 (7.0%) | 0 (0.0%) |
| 20 to 24 Minutes | 4 (2.3%) | 36 (27.3%) |
| 25 to 29 Minutes | 0 (0.0%) | 0 (0.0%) |
| 30 to 34 Minutes | 0 (0.0%) | 0 (0.0%) |
| 35 to 39 Minutes | 0 (0.0%) | 0 (0.0%) |
| 40 to 44 Minutes | 0 (0.0%) | 0 (0.0%) |
| 45 to 59 Minutes | 0 (0.0%) | 22 (16.7%) |
| 60 to 89 Minutes | 0 (0.0%) | 12 (9.1%) |
| 90 or more Minutes | 15 (8.7%) | 0 (0.0%) |
Time of Departure to Work by Sex in Boyle
The most frequent times of departure to work in Boyle are 6:00 AM to 6:29 AM (36, 20.9%) for males and 7:30 AM to 7:59 AM (41, 31.1%) for females.
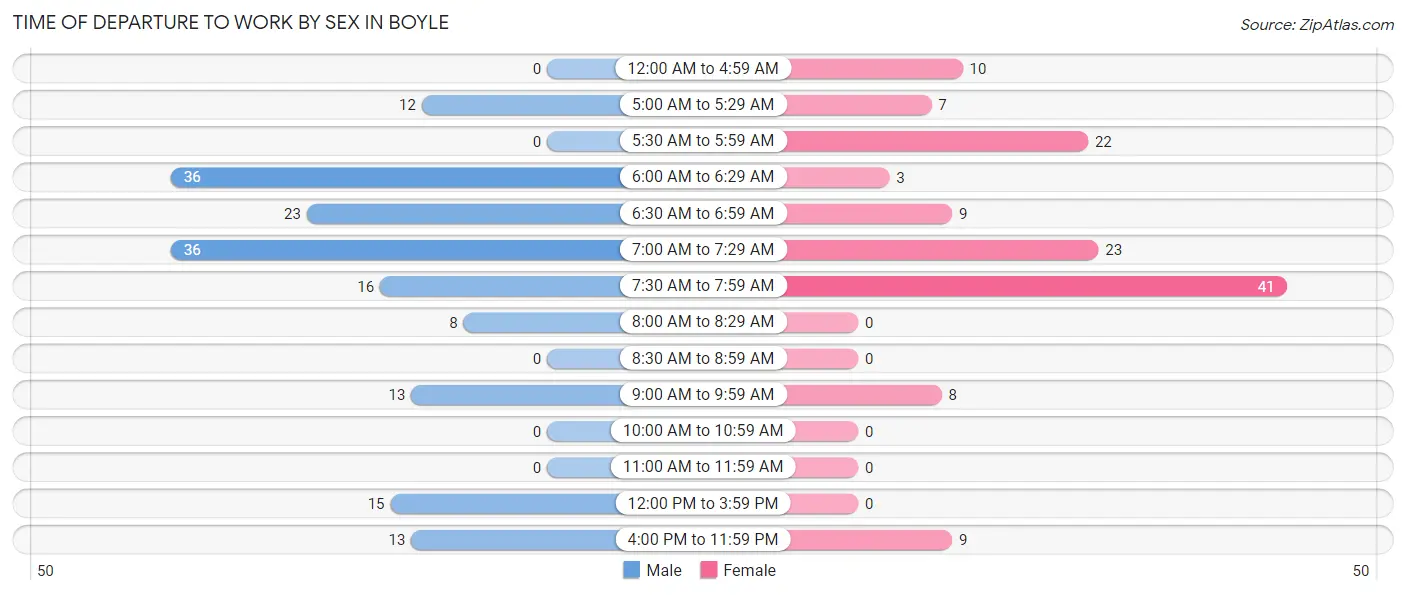
| Time of Departure | Male | Female |
| 12:00 AM to 4:59 AM | 0 (0.0%) | 10 (7.6%) |
| 5:00 AM to 5:29 AM | 12 (7.0%) | 7 (5.3%) |
| 5:30 AM to 5:59 AM | 0 (0.0%) | 22 (16.7%) |
| 6:00 AM to 6:29 AM | 36 (20.9%) | 3 (2.3%) |
| 6:30 AM to 6:59 AM | 23 (13.4%) | 9 (6.8%) |
| 7:00 AM to 7:29 AM | 36 (20.9%) | 23 (17.4%) |
| 7:30 AM to 7:59 AM | 16 (9.3%) | 41 (31.1%) |
| 8:00 AM to 8:29 AM | 8 (4.6%) | 0 (0.0%) |
| 8:30 AM to 8:59 AM | 0 (0.0%) | 0 (0.0%) |
| 9:00 AM to 9:59 AM | 13 (7.6%) | 8 (6.1%) |
| 10:00 AM to 10:59 AM | 0 (0.0%) | 0 (0.0%) |
| 11:00 AM to 11:59 AM | 0 (0.0%) | 0 (0.0%) |
| 12:00 PM to 3:59 PM | 15 (8.7%) | 0 (0.0%) |
| 4:00 PM to 11:59 PM | 13 (7.6%) | 9 (6.8%) |
| Total | 172 (100.0%) | 132 (100.0%) |
Housing Occupancy in Boyle
Occupancy by Ownership in Boyle
Of the total 298 dwellings in Boyle, owner-occupied units account for 177 (59.4%), while renter-occupied units make up 121 (40.6%).
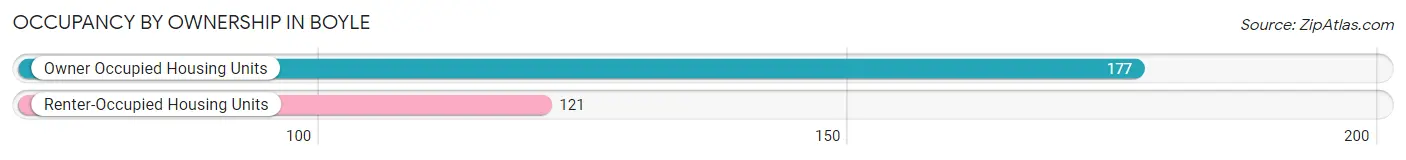
| Occupancy | # Housing Units | % Housing Units |
| Owner Occupied Housing Units | 177 | 59.4% |
| Renter-Occupied Housing Units | 121 | 40.6% |
| Total Occupied Housing Units | 298 | 100.0% |
Occupancy by Household Size in Boyle
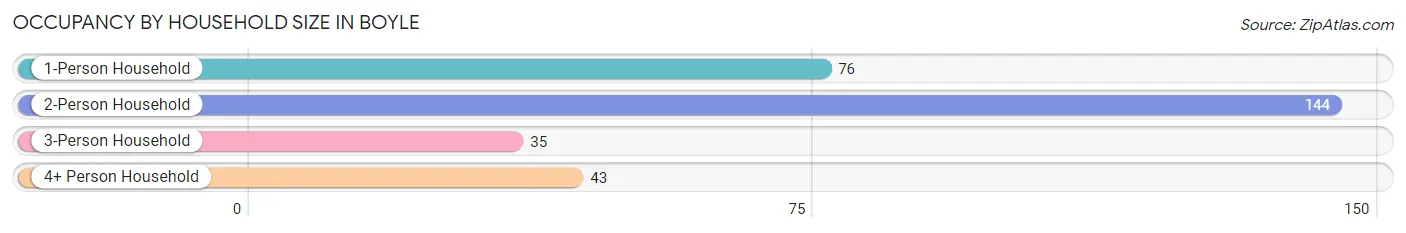
| Household Size | # Housing Units | % Housing Units |
| 1-Person Household | 76 | 25.5% |
| 2-Person Household | 144 | 48.3% |
| 3-Person Household | 35 | 11.7% |
| 4+ Person Household | 43 | 14.4% |
| Total Housing Units | 298 | 100.0% |
Occupancy by Ownership by Household Size in Boyle
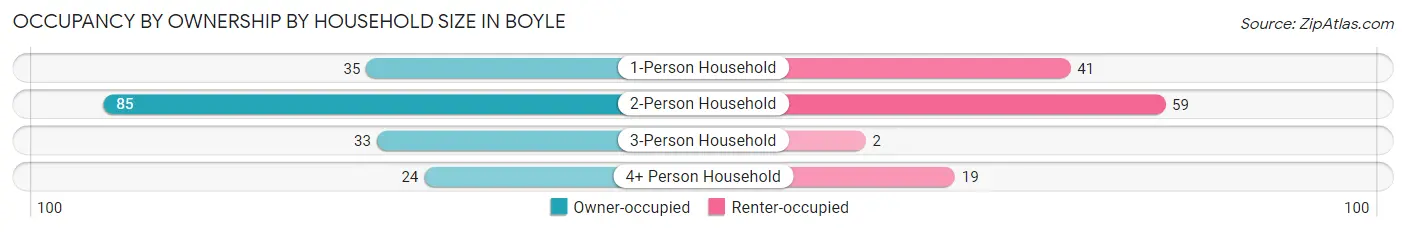
| Household Size | Owner-occupied | Renter-occupied |
| 1-Person Household | 35 (46.1%) | 41 (53.9%) |
| 2-Person Household | 85 (59.0%) | 59 (41.0%) |
| 3-Person Household | 33 (94.3%) | 2 (5.7%) |
| 4+ Person Household | 24 (55.8%) | 19 (44.2%) |
| Total Housing Units | 177 (59.4%) | 121 (40.6%) |
Occupancy by Educational Attainment in Boyle
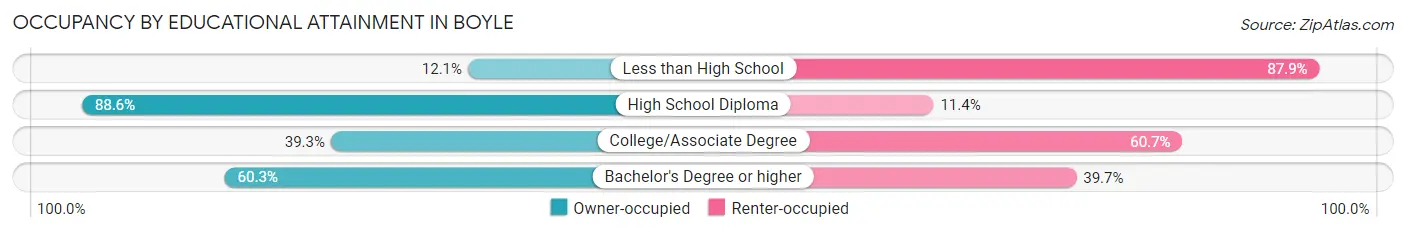
| Household Size | Owner-occupied | Renter-occupied |
| Less than High School | 4 (12.1%) | 29 (87.9%) |
| High School Diploma | 78 (88.6%) | 10 (11.4%) |
| College/Associate Degree | 22 (39.3%) | 34 (60.7%) |
| Bachelor's Degree or higher | 73 (60.3%) | 48 (39.7%) |
Occupancy by Age of Householder in Boyle
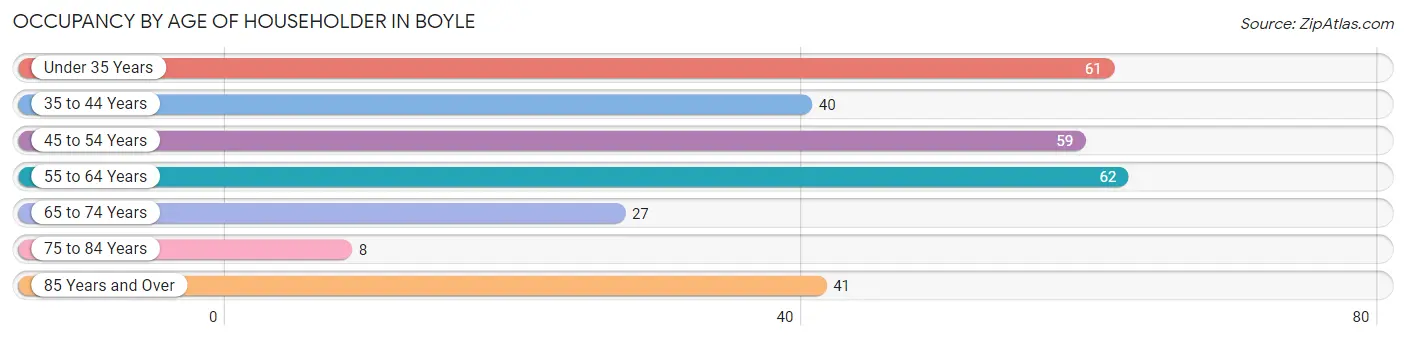
| Age Bracket | # Households | % Households |
| Under 35 Years | 61 | 20.5% |
| 35 to 44 Years | 40 | 13.4% |
| 45 to 54 Years | 59 | 19.8% |
| 55 to 64 Years | 62 | 20.8% |
| 65 to 74 Years | 27 | 9.1% |
| 75 to 84 Years | 8 | 2.7% |
| 85 Years and Over | 41 | 13.8% |
| Total | 298 | 100.0% |
Housing Finances in Boyle
Median Income by Occupancy in Boyle
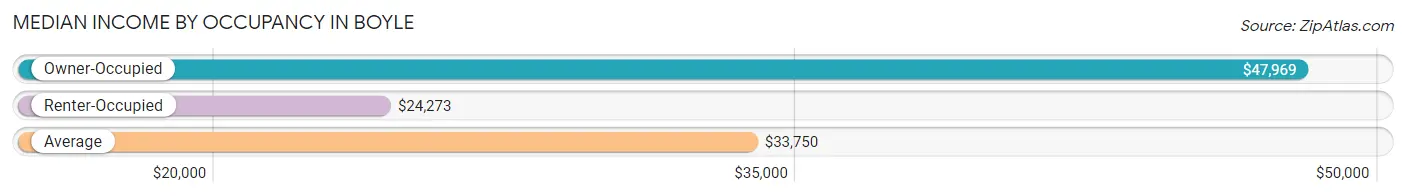
| Occupancy Type | # Households | Median Income |
| Owner-Occupied | 177 (59.4%) | $47,969 |
| Renter-Occupied | 121 (40.6%) | $24,273 |
| Average | 298 (100.0%) | $33,750 |
Occupancy by Householder Income Bracket in Boyle
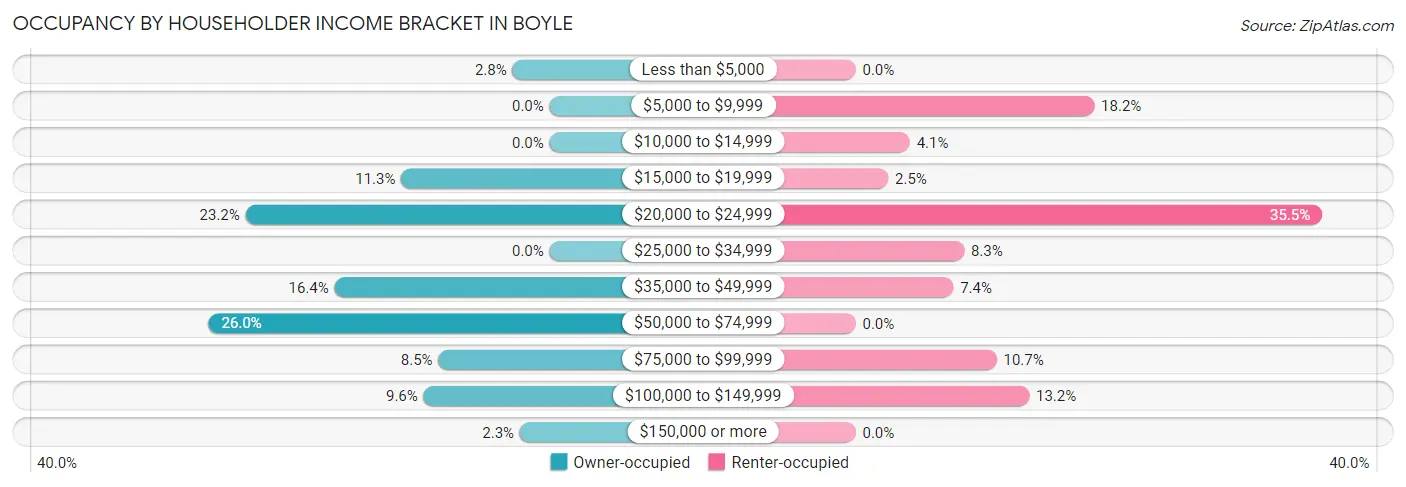
| Income Bracket | Owner-occupied | Renter-occupied |
| Less than $5,000 | 5 (2.8%) | 0 (0.0%) |
| $5,000 to $9,999 | 0 (0.0%) | 22 (18.2%) |
| $10,000 to $14,999 | 0 (0.0%) | 5 (4.1%) |
| $15,000 to $19,999 | 20 (11.3%) | 3 (2.5%) |
| $20,000 to $24,999 | 41 (23.2%) | 43 (35.5%) |
| $25,000 to $34,999 | 0 (0.0%) | 10 (8.3%) |
| $35,000 to $49,999 | 29 (16.4%) | 9 (7.4%) |
| $50,000 to $74,999 | 46 (26.0%) | 0 (0.0%) |
| $75,000 to $99,999 | 15 (8.5%) | 13 (10.7%) |
| $100,000 to $149,999 | 17 (9.6%) | 16 (13.2%) |
| $150,000 or more | 4 (2.3%) | 0 (0.0%) |
| Total | 177 (100.0%) | 121 (100.0%) |
Monthly Housing Cost Tiers in Boyle
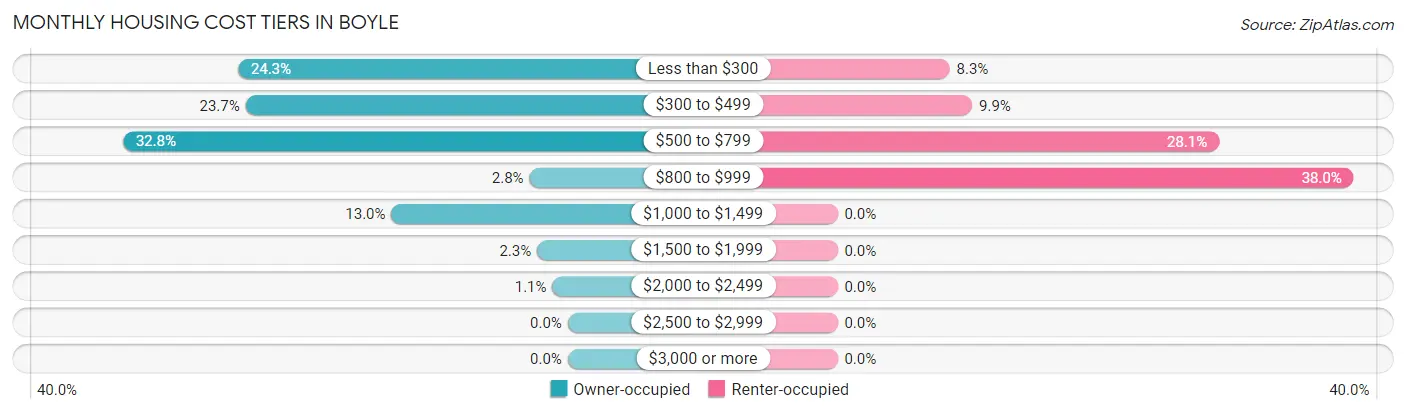
| Monthly Cost | Owner-occupied | Renter-occupied |
| Less than $300 | 43 (24.3%) | 10 (8.3%) |
| $300 to $499 | 42 (23.7%) | 12 (9.9%) |
| $500 to $799 | 58 (32.8%) | 34 (28.1%) |
| $800 to $999 | 5 (2.8%) | 46 (38.0%) |
| $1,000 to $1,499 | 23 (13.0%) | 0 (0.0%) |
| $1,500 to $1,999 | 4 (2.3%) | 0 (0.0%) |
| $2,000 to $2,499 | 2 (1.1%) | 0 (0.0%) |
| $2,500 to $2,999 | 0 (0.0%) | 0 (0.0%) |
| $3,000 or more | 0 (0.0%) | 0 (0.0%) |
| Total | 177 (100.0%) | 121 (100.0%) |
Physical Housing Characteristics in Boyle
Housing Structures in Boyle
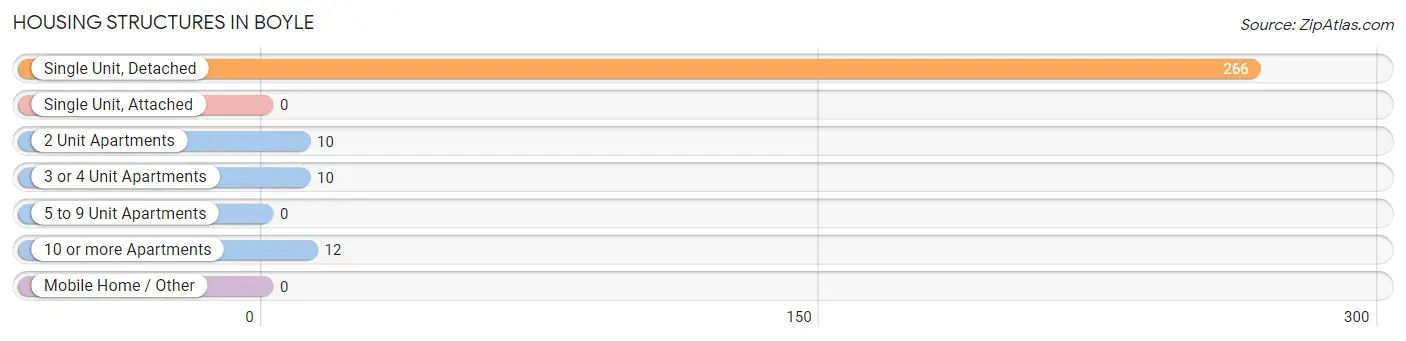
| Structure Type | # Housing Units | % Housing Units |
| Single Unit, Detached | 266 | 89.3% |
| Single Unit, Attached | 0 | 0.0% |
| 2 Unit Apartments | 10 | 3.4% |
| 3 or 4 Unit Apartments | 10 | 3.4% |
| 5 to 9 Unit Apartments | 0 | 0.0% |
| 10 or more Apartments | 12 | 4.0% |
| Mobile Home / Other | 0 | 0.0% |
| Total | 298 | 100.0% |
Housing Structures by Occupancy in Boyle
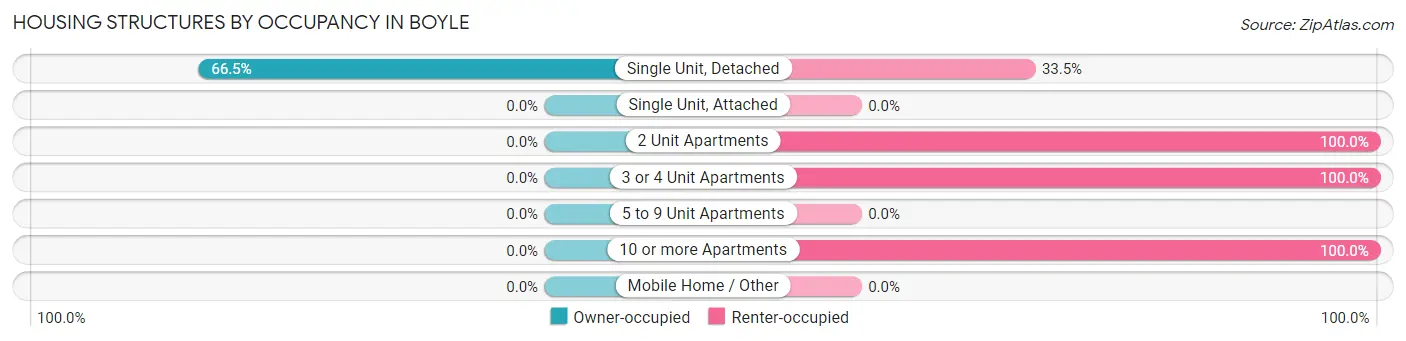
| Structure Type | Owner-occupied | Renter-occupied |
| Single Unit, Detached | 177 (66.5%) | 89 (33.5%) |
| Single Unit, Attached | 0 (0.0%) | 0 (0.0%) |
| 2 Unit Apartments | 0 (0.0%) | 10 (100.0%) |
| 3 or 4 Unit Apartments | 0 (0.0%) | 10 (100.0%) |
| 5 to 9 Unit Apartments | 0 (0.0%) | 0 (0.0%) |
| 10 or more Apartments | 0 (0.0%) | 12 (100.0%) |
| Mobile Home / Other | 0 (0.0%) | 0 (0.0%) |
| Total | 177 (59.4%) | 121 (40.6%) |
Housing Structures by Number of Rooms in Boyle
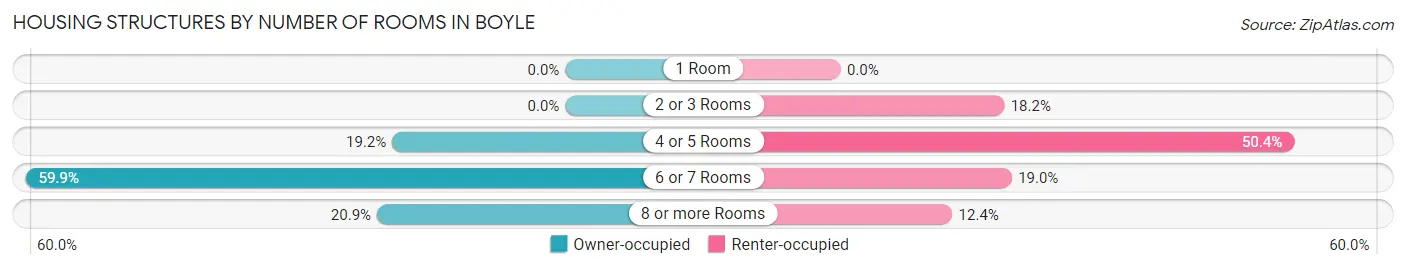
| Number of Rooms | Owner-occupied | Renter-occupied |
| 1 Room | 0 (0.0%) | 0 (0.0%) |
| 2 or 3 Rooms | 0 (0.0%) | 22 (18.2%) |
| 4 or 5 Rooms | 34 (19.2%) | 61 (50.4%) |
| 6 or 7 Rooms | 106 (59.9%) | 23 (19.0%) |
| 8 or more Rooms | 37 (20.9%) | 15 (12.4%) |
| Total | 177 (100.0%) | 121 (100.0%) |
Housing Structure by Heating Type in Boyle
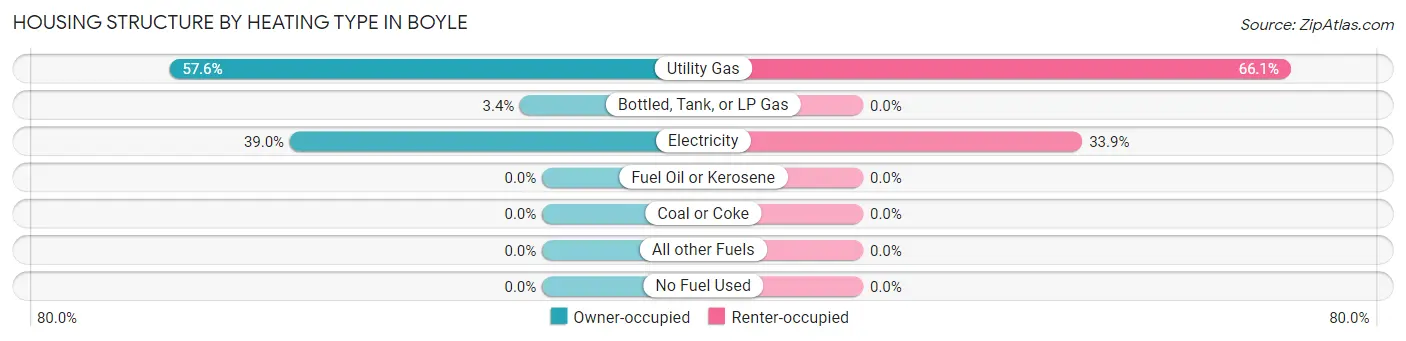
| Heating Type | Owner-occupied | Renter-occupied |
| Utility Gas | 102 (57.6%) | 80 (66.1%) |
| Bottled, Tank, or LP Gas | 6 (3.4%) | 0 (0.0%) |
| Electricity | 69 (39.0%) | 41 (33.9%) |
| Fuel Oil or Kerosene | 0 (0.0%) | 0 (0.0%) |
| Coal or Coke | 0 (0.0%) | 0 (0.0%) |
| All other Fuels | 0 (0.0%) | 0 (0.0%) |
| No Fuel Used | 0 (0.0%) | 0 (0.0%) |
| Total | 177 (100.0%) | 121 (100.0%) |
Household Vehicle Usage in Boyle
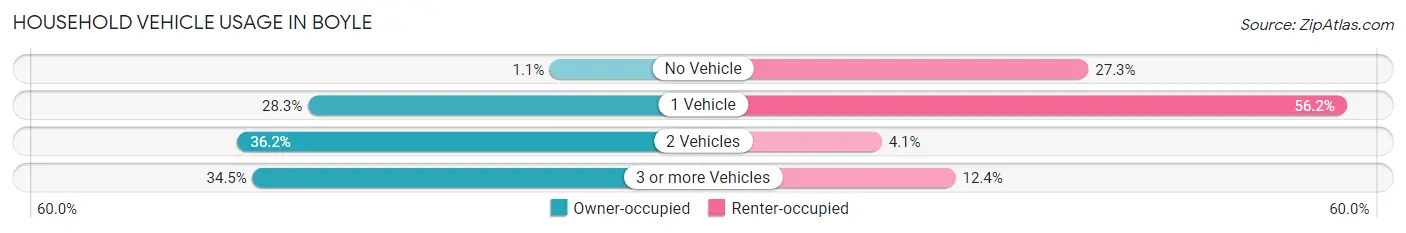
| Vehicles per Household | Owner-occupied | Renter-occupied |
| No Vehicle | 2 (1.1%) | 33 (27.3%) |
| 1 Vehicle | 50 (28.2%) | 68 (56.2%) |
| 2 Vehicles | 64 (36.2%) | 5 (4.1%) |
| 3 or more Vehicles | 61 (34.5%) | 15 (12.4%) |
| Total | 177 (100.0%) | 121 (100.0%) |
Real Estate & Mortgages in Boyle
Real Estate and Mortgage Overview in Boyle
| Characteristic | Without Mortgage | With Mortgage |
| Housing Units | 134 | 43 |
| Median Property Value | - | - |
| Median Household Income | - | - |
| Monthly Housing Costs | $344 | $0 |
| Real Estate Taxes | $819 | $5 |
Property Value by Mortgage Status in Boyle
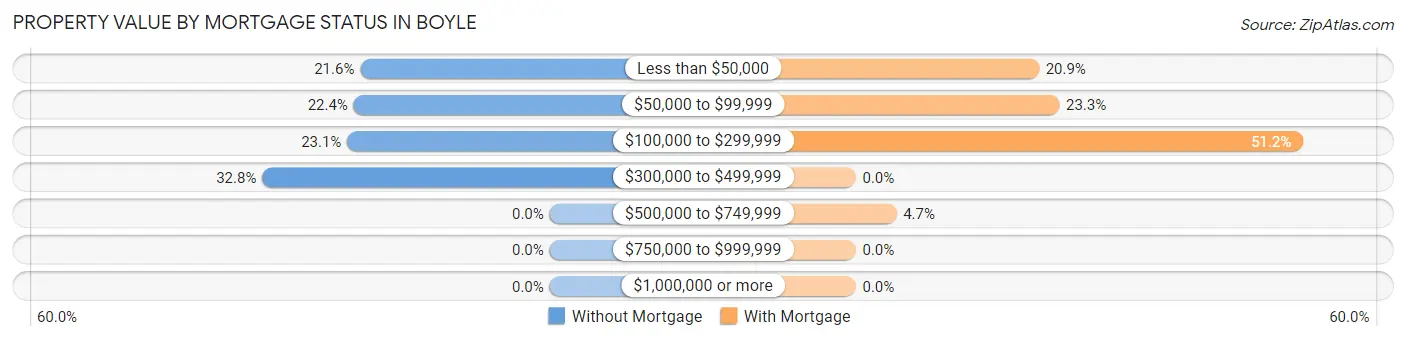
| Property Value | Without Mortgage | With Mortgage |
| Less than $50,000 | 29 (21.6%) | 9 (20.9%) |
| $50,000 to $99,999 | 30 (22.4%) | 10 (23.3%) |
| $100,000 to $299,999 | 31 (23.1%) | 22 (51.2%) |
| $300,000 to $499,999 | 44 (32.8%) | 0 (0.0%) |
| $500,000 to $749,999 | 0 (0.0%) | 2 (4.6%) |
| $750,000 to $999,999 | 0 (0.0%) | 0 (0.0%) |
| $1,000,000 or more | 0 (0.0%) | 0 (0.0%) |
| Total | 134 (100.0%) | 43 (100.0%) |
Household Income by Mortgage Status in Boyle
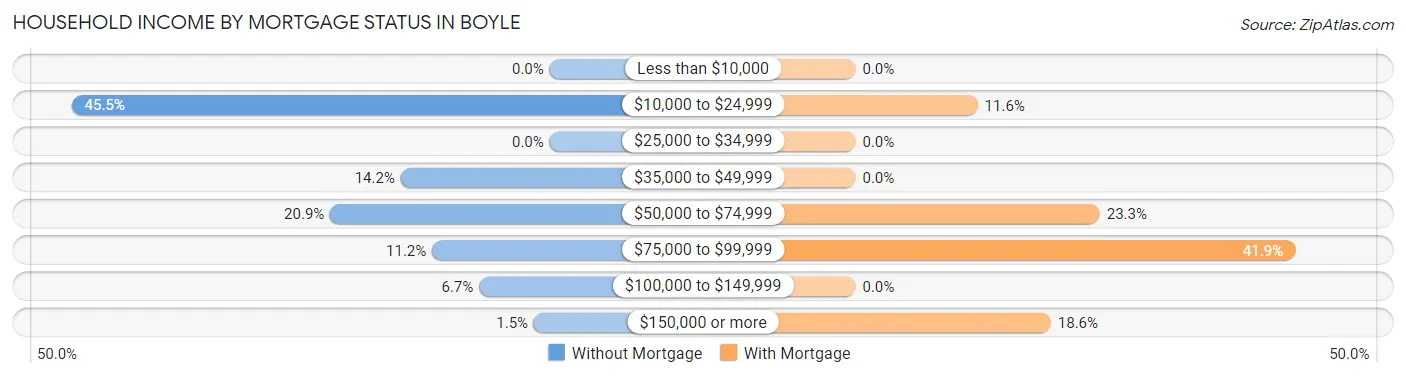
| Household Income | Without Mortgage | With Mortgage |
| Less than $10,000 | 0 (0.0%) | 0 (0.0%) |
| $10,000 to $24,999 | 61 (45.5%) | 5 (11.6%) |
| $25,000 to $34,999 | 0 (0.0%) | 0 (0.0%) |
| $35,000 to $49,999 | 19 (14.2%) | 0 (0.0%) |
| $50,000 to $74,999 | 28 (20.9%) | 10 (23.3%) |
| $75,000 to $99,999 | 15 (11.2%) | 18 (41.9%) |
| $100,000 to $149,999 | 9 (6.7%) | 0 (0.0%) |
| $150,000 or more | 2 (1.5%) | 8 (18.6%) |
| Total | 134 (100.0%) | 43 (100.0%) |
Property Value to Household Income Ratio in Boyle
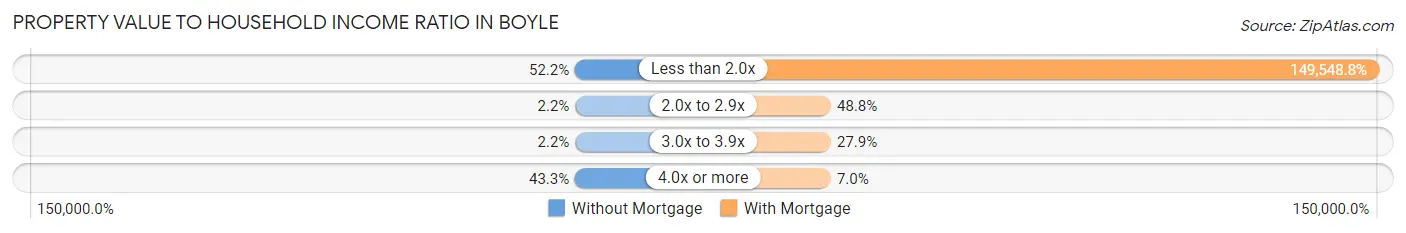
| Value-to-Income Ratio | Without Mortgage | With Mortgage |
| Less than 2.0x | 70 (52.2%) | 64,306 (149,548.8%) |
| 2.0x to 2.9x | 3 (2.2%) | 21 (48.8%) |
| 3.0x to 3.9x | 3 (2.2%) | 12 (27.9%) |
| 4.0x or more | 58 (43.3%) | 3 (7.0%) |
| Total | 134 (100.0%) | 43 (100.0%) |
Real Estate Taxes by Mortgage Status in Boyle
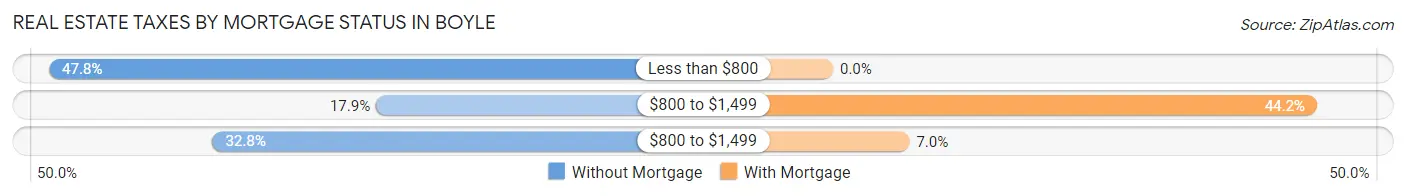
| Property Taxes | Without Mortgage | With Mortgage |
| Less than $800 | 64 (47.8%) | 0 (0.0%) |
| $800 to $1,499 | 24 (17.9%) | 19 (44.2%) |
| $800 to $1,499 | 44 (32.8%) | 3 (7.0%) |
| Total | 134 (100.0%) | 43 (100.0%) |
Health & Disability in Boyle
Health Insurance Coverage by Age in Boyle
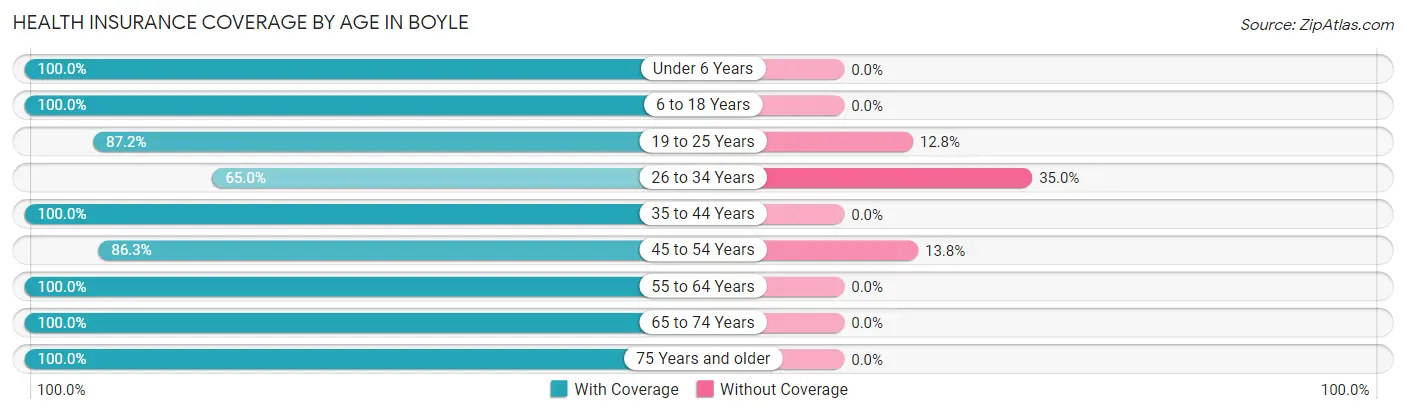
| Age Bracket | With Coverage | Without Coverage |
| Under 6 Years | 40 (100.0%) | 0 (0.0%) |
| 6 to 18 Years | 109 (100.0%) | 0 (0.0%) |
| 19 to 25 Years | 41 (87.2%) | 6 (12.8%) |
| 26 to 34 Years | 89 (65.0%) | 48 (35.0%) |
| 35 to 44 Years | 78 (100.0%) | 0 (0.0%) |
| 45 to 54 Years | 69 (86.3%) | 11 (13.8%) |
| 55 to 64 Years | 82 (100.0%) | 0 (0.0%) |
| 65 to 74 Years | 74 (100.0%) | 0 (0.0%) |
| 75 Years and older | 53 (100.0%) | 0 (0.0%) |
| Total | 635 (90.7%) | 65 (9.3%) |
Health Insurance Coverage by Citizenship Status in Boyle
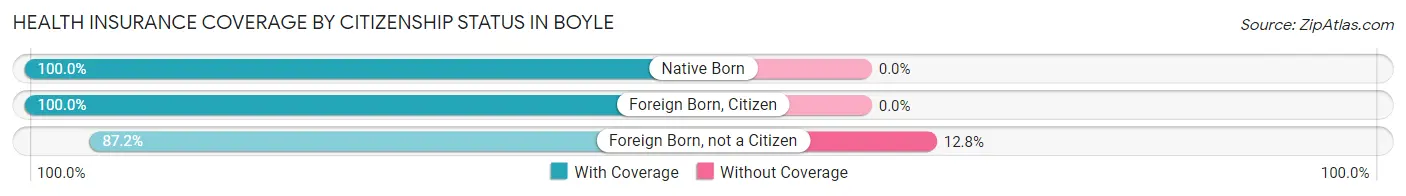
| Citizenship Status | With Coverage | Without Coverage |
| Native Born | 40 (100.0%) | 0 (0.0%) |
| Foreign Born, Citizen | 109 (100.0%) | 0 (0.0%) |
| Foreign Born, not a Citizen | 41 (87.2%) | 6 (12.8%) |
Health Insurance Coverage by Household Income in Boyle
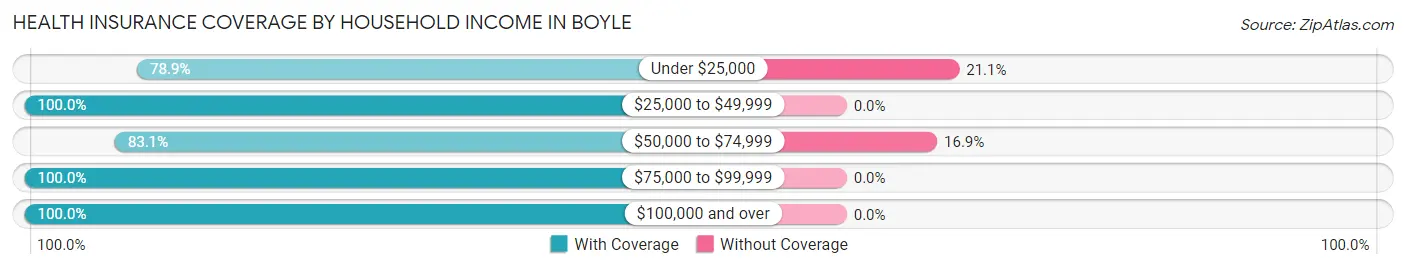
| Household Income | With Coverage | Without Coverage |
| Under $25,000 | 161 (78.9%) | 43 (21.1%) |
| $25,000 to $49,999 | 183 (100.0%) | 0 (0.0%) |
| $50,000 to $74,999 | 108 (83.1%) | 22 (16.9%) |
| $75,000 to $99,999 | 45 (100.0%) | 0 (0.0%) |
| $100,000 and over | 128 (100.0%) | 0 (0.0%) |
Public vs Private Health Insurance Coverage by Age in Boyle
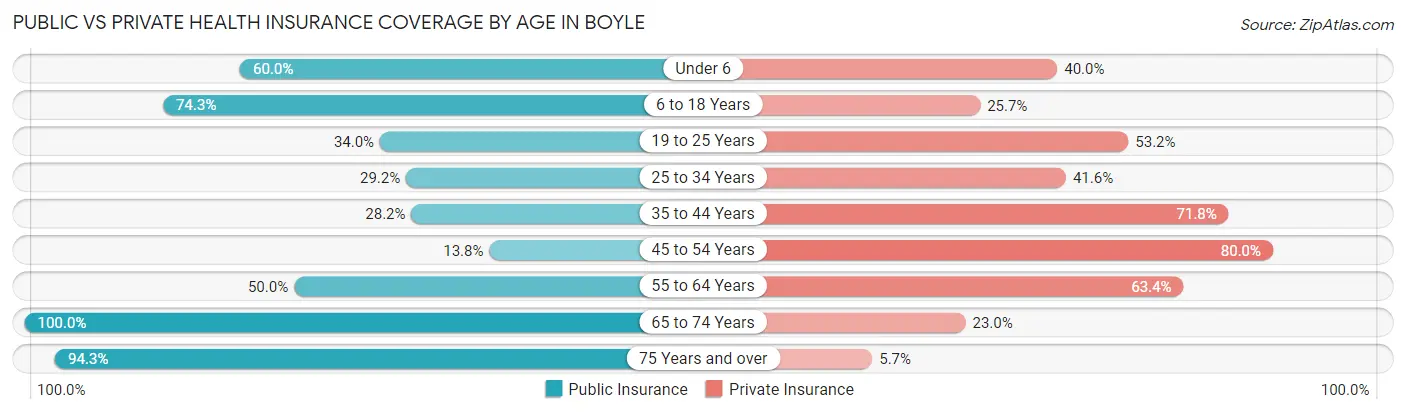
| Age Bracket | Public Insurance | Private Insurance |
| Under 6 | 24 (60.0%) | 16 (40.0%) |
| 6 to 18 Years | 81 (74.3%) | 28 (25.7%) |
| 19 to 25 Years | 16 (34.0%) | 25 (53.2%) |
| 25 to 34 Years | 40 (29.2%) | 57 (41.6%) |
| 35 to 44 Years | 22 (28.2%) | 56 (71.8%) |
| 45 to 54 Years | 11 (13.8%) | 64 (80.0%) |
| 55 to 64 Years | 41 (50.0%) | 52 (63.4%) |
| 65 to 74 Years | 74 (100.0%) | 17 (23.0%) |
| 75 Years and over | 50 (94.3%) | 3 (5.7%) |
| Total | 359 (51.3%) | 318 (45.4%) |
Disability Status by Sex by Age in Boyle
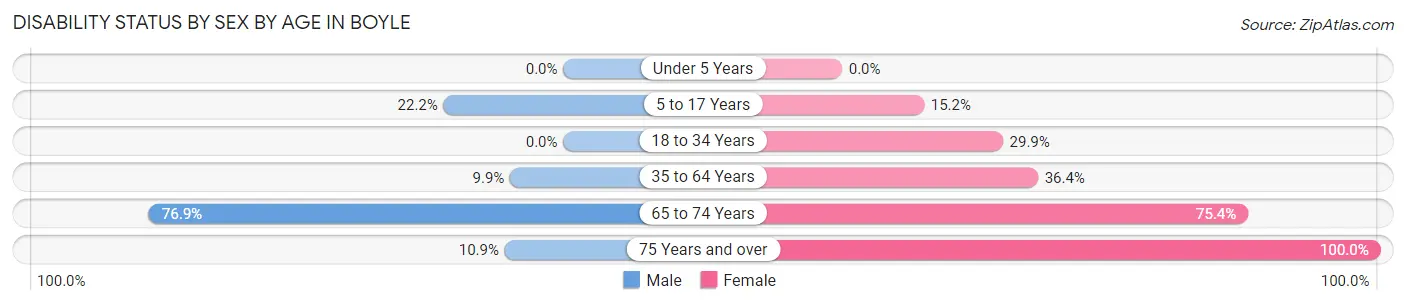
| Age Bracket | Male | Female |
| Under 5 Years | 0 (0.0%) | 0 (0.0%) |
| 5 to 17 Years | 14 (22.2%) | 7 (15.2%) |
| 18 to 34 Years | 0 (0.0%) | 40 (29.8%) |
| 35 to 64 Years | 15 (9.9%) | 32 (36.4%) |
| 65 to 74 Years | 10 (76.9%) | 46 (75.4%) |
| 75 Years and over | 5 (10.9%) | 7 (100.0%) |
Disability Class by Sex by Age in Boyle
Disability Class: Hearing Difficulty
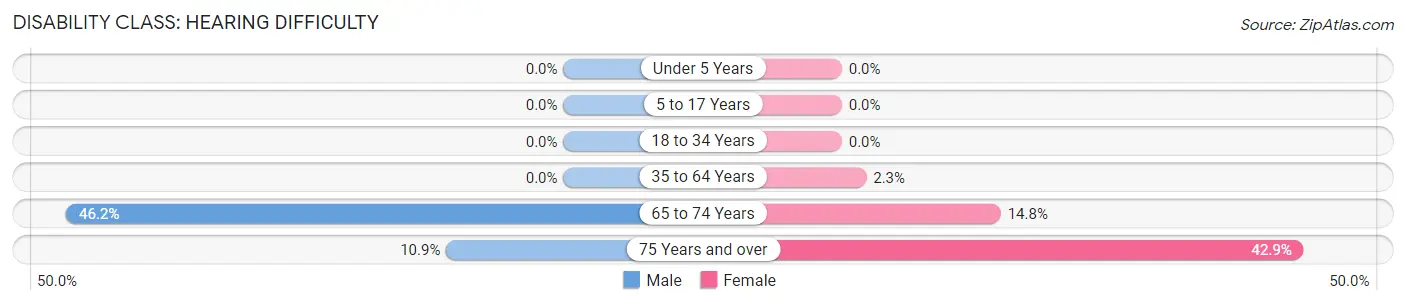
| Age Bracket | Male | Female |
| Under 5 Years | 0 (0.0%) | 0 (0.0%) |
| 5 to 17 Years | 0 (0.0%) | 0 (0.0%) |
| 18 to 34 Years | 0 (0.0%) | 0 (0.0%) |
| 35 to 64 Years | 0 (0.0%) | 2 (2.3%) |
| 65 to 74 Years | 6 (46.2%) | 9 (14.7%) |
| 75 Years and over | 5 (10.9%) | 3 (42.9%) |
Disability Class: Vision Difficulty
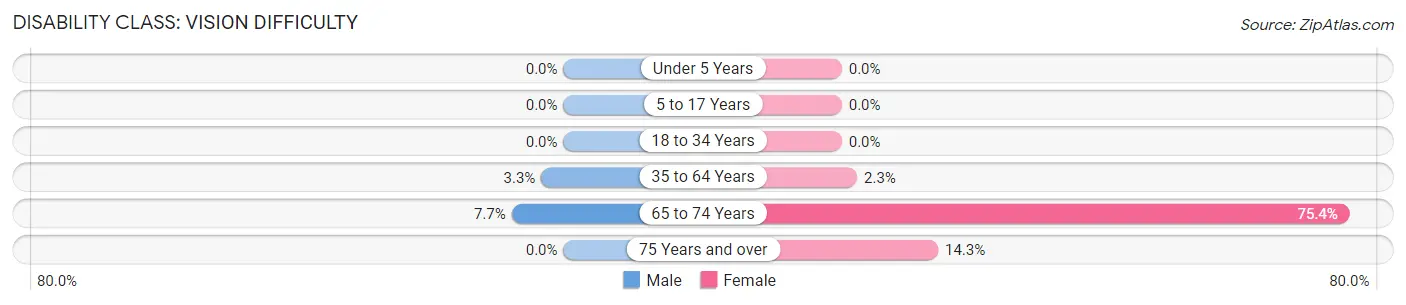
| Age Bracket | Male | Female |
| Under 5 Years | 0 (0.0%) | 0 (0.0%) |
| 5 to 17 Years | 0 (0.0%) | 0 (0.0%) |
| 18 to 34 Years | 0 (0.0%) | 0 (0.0%) |
| 35 to 64 Years | 5 (3.3%) | 2 (2.3%) |
| 65 to 74 Years | 1 (7.7%) | 46 (75.4%) |
| 75 Years and over | 0 (0.0%) | 1 (14.3%) |
Disability Class: Cognitive Difficulty
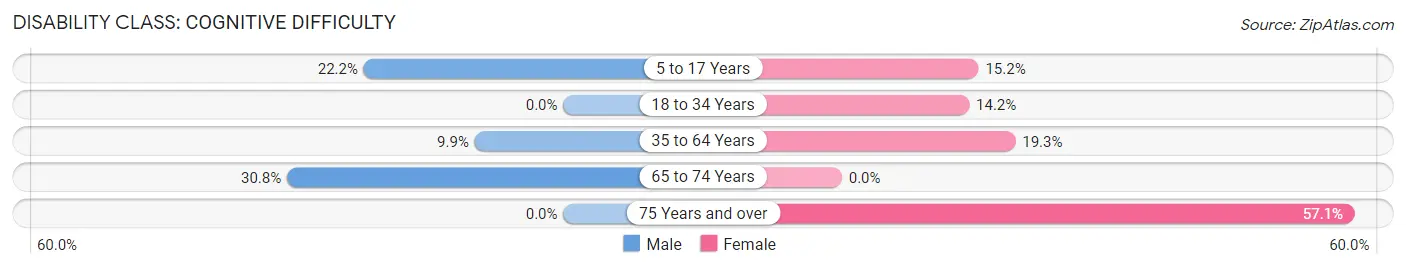
| Age Bracket | Male | Female |
| 5 to 17 Years | 14 (22.2%) | 7 (15.2%) |
| 18 to 34 Years | 0 (0.0%) | 19 (14.2%) |
| 35 to 64 Years | 15 (9.9%) | 17 (19.3%) |
| 65 to 74 Years | 4 (30.8%) | 0 (0.0%) |
| 75 Years and over | 0 (0.0%) | 4 (57.1%) |
Disability Class: Ambulatory Difficulty
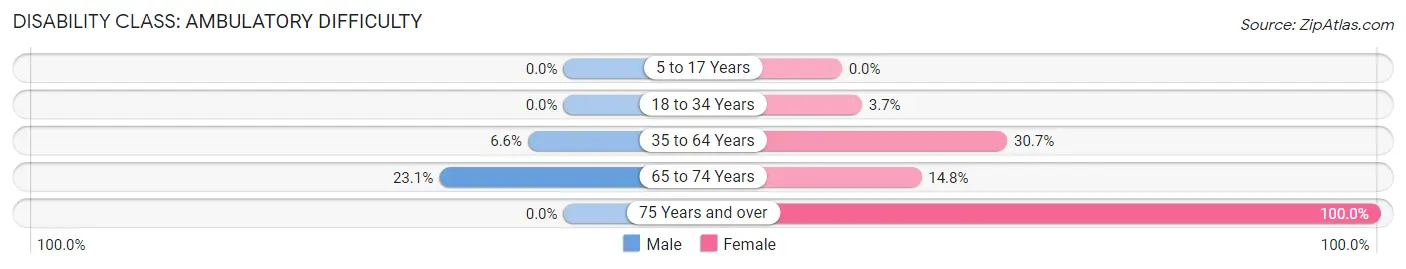
| Age Bracket | Male | Female |
| 5 to 17 Years | 0 (0.0%) | 0 (0.0%) |
| 18 to 34 Years | 0 (0.0%) | 5 (3.7%) |
| 35 to 64 Years | 10 (6.6%) | 27 (30.7%) |
| 65 to 74 Years | 3 (23.1%) | 9 (14.7%) |
| 75 Years and over | 0 (0.0%) | 7 (100.0%) |
Disability Class: Self-Care Difficulty
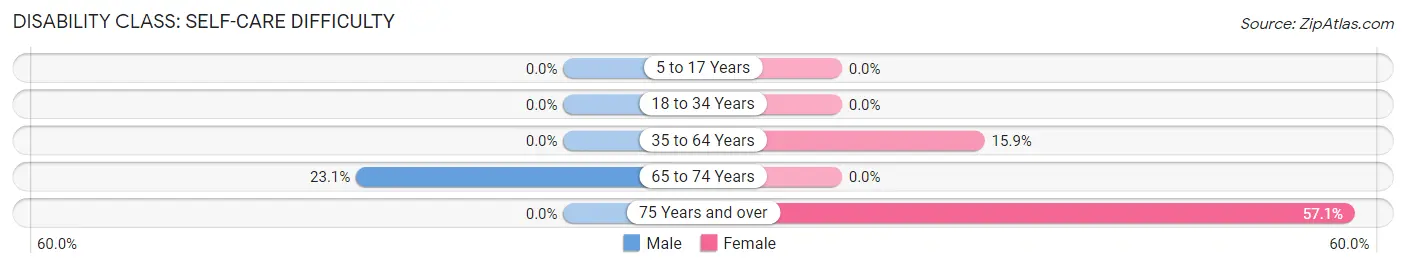
| Age Bracket | Male | Female |
| 5 to 17 Years | 0 (0.0%) | 0 (0.0%) |
| 18 to 34 Years | 0 (0.0%) | 0 (0.0%) |
| 35 to 64 Years | 0 (0.0%) | 14 (15.9%) |
| 65 to 74 Years | 3 (23.1%) | 0 (0.0%) |
| 75 Years and over | 0 (0.0%) | 4 (57.1%) |
Technology Access in Boyle
Computing Device Access in Boyle
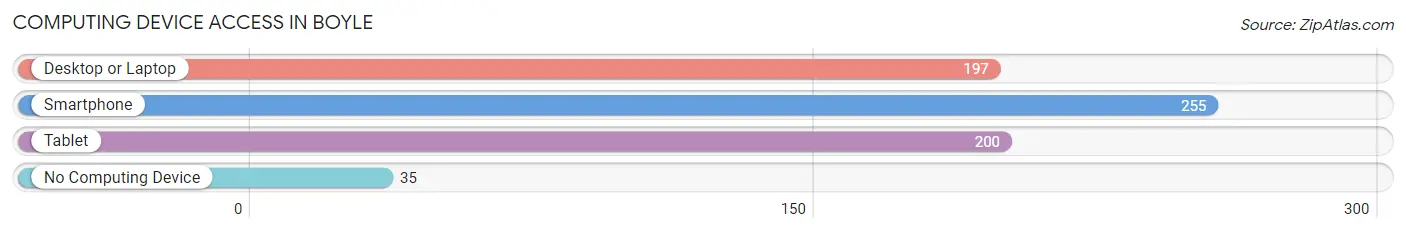
| Device Type | # Households | % Households |
| Desktop or Laptop | 197 | 66.1% |
| Smartphone | 255 | 85.6% |
| Tablet | 200 | 67.1% |
| No Computing Device | 35 | 11.7% |
| Total | 298 | 100.0% |
Internet Access in Boyle
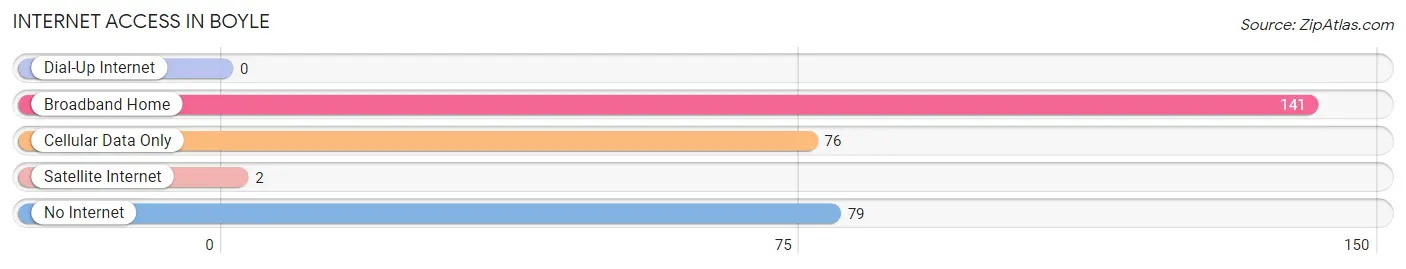
| Internet Type | # Households | % Households |
| Dial-Up Internet | 0 | 0.0% |
| Broadband Home | 141 | 47.3% |
| Cellular Data Only | 76 | 25.5% |
| Satellite Internet | 2 | 0.7% |
| No Internet | 79 | 26.5% |
| Total | 298 | 100.0% |
Boyle Summary
Boyle is a small town located in the county of Roscommon in the Republic of Ireland. It is situated on the River Boyle, which is a tributary of the River Shannon. The town has a population of approximately 2,500 people and is the administrative centre of the county.
History
The town of Boyle has a long and varied history, with evidence of human settlement in the area dating back to the Neolithic period. The town was founded in the 12th century by the Anglo-Norman de Bermingham family, who built a castle in the town. The castle was destroyed in 1641 during the Irish Rebellion, but the ruins still remain today.
In the 17th century, Boyle was an important centre for the wool trade, and the town was home to a number of wealthy merchants. The town was also the birthplace of the famous Irish poet and playwright, William Butler Yeats, who was born in 1865.
Geography
Boyle is located in the north-west of Ireland, in the province of Connacht. The town is situated on the River Boyle, which is a tributary of the River Shannon. The town is surrounded by rolling hills and is close to the Slieve Bloom Mountains.
The town is located approximately 50 kilometres from the city of Galway and is well connected to the rest of the country by road and rail. The nearest airport is located in Knock, which is approximately 40 kilometres away.
Economy
The economy of Boyle is largely based on agriculture, with the town being home to a number of farms and agricultural businesses. The town is also home to a number of small businesses, including shops, restaurants and pubs.
Tourism is also an important part of the local economy, with the town being home to a number of attractions, including the ruins of the de Bermingham castle, the Boyle Abbey and the King House Museum.
Demographics
As of the 2016 census, the population of Boyle was 2,521. The majority of the population is Irish, with a small minority of other nationalities, including Polish, Lithuanian and Nigerian. The town has a young population, with the median age being 33.
The town has a high level of unemployment, with the rate being approximately 15%. The town also has a low level of educational attainment, with only 28% of the population having a third-level qualification.
In conclusion, Boyle is a small town located in the county of Roscommon in the Republic of Ireland. The town has a long and varied history, with evidence of human settlement in the area dating back to the Neolithic period. The economy of Boyle is largely based on agriculture, with the town being home to a number of farms and agricultural businesses. The population of Boyle is predominantly Irish, with a small minority of other nationalities. The town has a high level of unemployment and a low level of educational attainment.
Common Questions
What is Per Capita Income in Boyle?
Per Capita income in Boyle is $21,354.
What is the Median Family Income in Boyle?
Median Family Income in Boyle is $36,477.
What is the Median Household income in Boyle?
Median Household Income in Boyle is $33,750.
What is Income or Wage Gap in Boyle?
Income or Wage Gap in Boyle is 0.2%.
Women in Boyle earn 99.8 cents for every dollar earned by a man.
What is Inequality or Gini Index in Boyle?
Inequality or Gini Index in Boyle is 0.39.
What is the Total Population of Boyle?
Total Population of Boyle is 700.
What is the Total Male Population of Boyle?
Total Male Population of Boyle is 353.
What is the Total Female Population of Boyle?
Total Female Population of Boyle is 347.
What is the Ratio of Males per 100 Females in Boyle?
There are 101.73 Males per 100 Females in Boyle.
What is the Ratio of Females per 100 Males in Boyle?
There are 98.30 Females per 100 Males in Boyle.
What is the Median Population Age in Boyle?
Median Population Age in Boyle is 36.7 Years.
What is the Average Family Size in Boyle
Average Family Size in Boyle is 2.6 People.
What is the Average Household Size in Boyle
Average Household Size in Boyle is 2.3 People.
How Large is the Labor Force in Boyle?
There are 339 People in the Labor Forcein in Boyle.
What is the Percentage of People in the Labor Force in Boyle?
59.5% of People are in the Labor Force in Boyle.
What is the Unemployment Rate in Boyle?
Unemployment Rate in Boyle is 10.3%.