Zip Codes with the Highest Percentage of Population Employed in Arts, Entertainment & Recreation in Missouri
RELATED REPORTS & OPTIONS
Arts, Entertainment & Recreation
Missouri
Compare Zip Codes
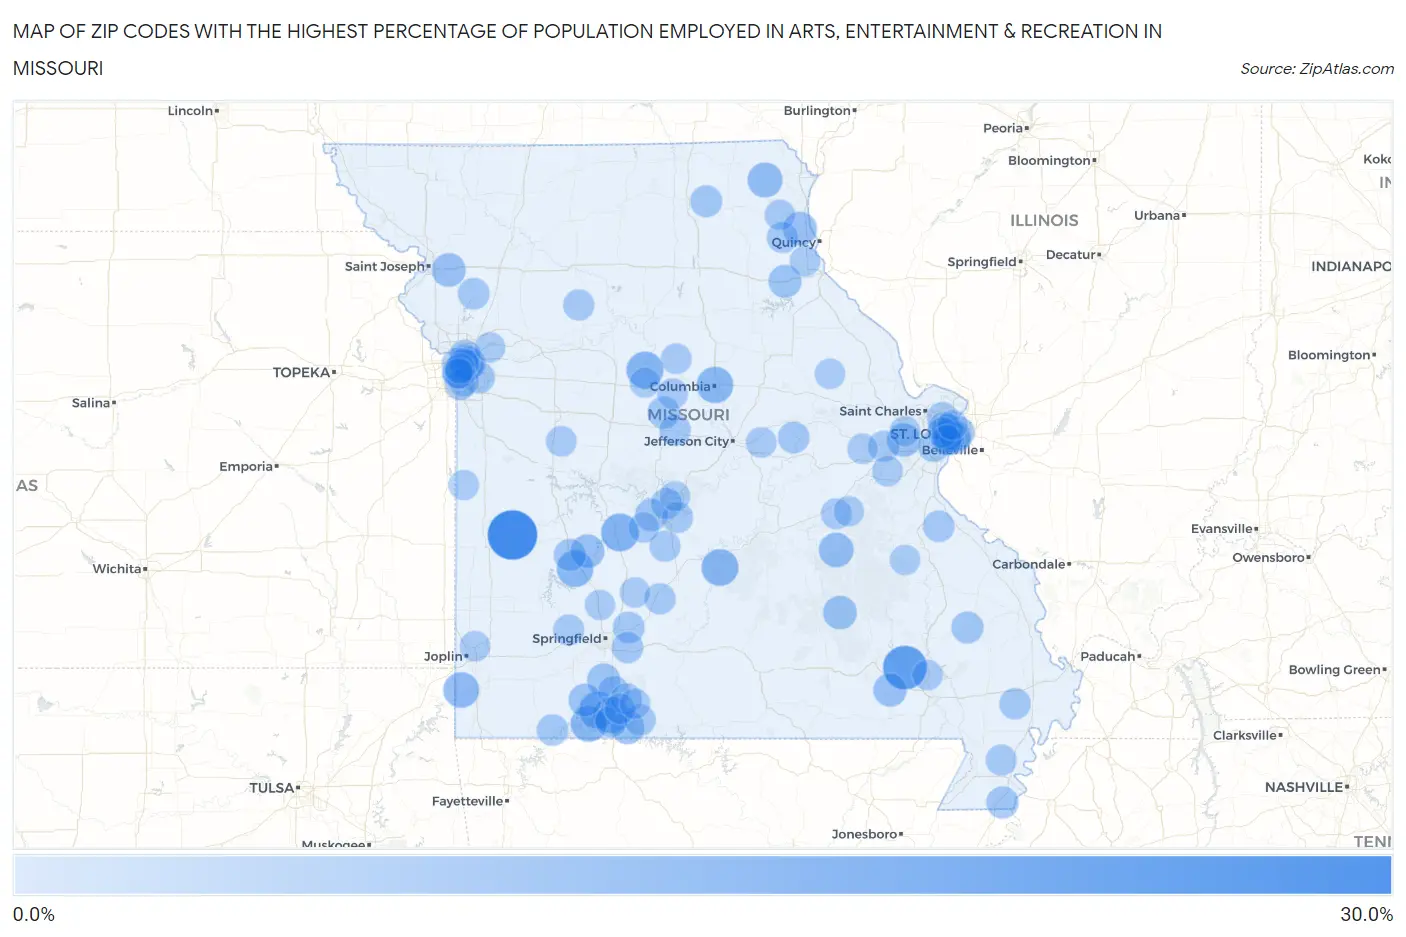
Map of Zip Codes with the Highest Percentage of Population Employed in Arts, Entertainment & Recreation in Missouri
0.0%
30.0%
Zip Codes with the Highest Percentage of Population Employed in Arts, Entertainment & Recreation in Missouri
| Zip Code | % Employed | vs State | vs National | |
| 1. | 64750 | 28.8% | 1.8%(+27.0)#1 | 2.1%(+26.7)#82 |
| 2. | 63952 | 20.8% | 1.8%(+19.0)#2 | 2.1%(+18.8)#170 |
| 3. | 65732 | 12.7% | 1.8%(+10.9)#3 | 2.1%(+10.6)#470 |
| 4. | 65320 | 11.8% | 1.8%(+9.93)#4 | 2.1%(+9.68)#531 |
| 5. | 65534 | 11.6% | 1.8%(+9.75)#5 | 2.1%(+9.50)#550 |
| 6. | 65737 | 11.4% | 1.8%(+9.53)#6 | 2.1%(+9.28)#562 |
| 7. | 65640 | 11.2% | 1.8%(+9.41)#7 | 2.1%(+9.16)#576 |
| 8. | 65216 | 11.1% | 1.8%(+9.28)#8 | 2.1%(+9.03)#593 |
| 9. | 65616 | 10.8% | 1.8%(+8.95)#9 | 2.1%(+8.70)#616 |
| 10. | 65686 | 10.6% | 1.8%(+8.75)#10 | 2.1%(+8.50)#640 |
| 11. | 64865 | 10.1% | 1.8%(+8.27)#11 | 2.1%(+8.02)#691 |
| 12. | 63474 | 9.1% | 1.8%(+7.26)#12 | 2.1%(+7.01)#837 |
| 13. | 65446 | 8.8% | 1.8%(+6.97)#13 | 2.1%(+6.72)#890 |
| 14. | 64125 | 7.7% | 1.8%(+5.86)#14 | 2.1%(+5.61)#1,133 |
| 15. | 63448 | 7.6% | 1.8%(+5.79)#15 | 2.1%(+5.54)#1,149 |
| 16. | 65650 | 7.6% | 1.8%(+5.77)#16 | 2.1%(+5.52)#1,151 |
| 17. | 64443 | 7.6% | 1.8%(+5.73)#17 | 2.1%(+5.48)#1,168 |
| 18. | 63038 | 7.4% | 1.8%(+5.61)#18 | 2.1%(+5.36)#1,190 |
| 19. | 63629 | 7.4% | 1.8%(+5.55)#19 | 2.1%(+5.30)#1,212 |
| 20. | 65679 | 7.1% | 1.8%(+5.23)#20 | 2.1%(+4.98)#1,310 |
| 21. | 63943 | 7.0% | 1.8%(+5.16)#21 | 2.1%(+4.91)#1,333 |
| 22. | 65669 | 6.8% | 1.8%(+5.00)#22 | 2.1%(+4.75)#1,383 |
| 23. | 63456 | 6.5% | 1.8%(+4.71)#23 | 2.1%(+4.46)#1,475 |
| 24. | 65656 | 6.5% | 1.8%(+4.65)#24 | 2.1%(+4.40)#1,508 |
| 25. | 65787 | 5.9% | 1.8%(+4.06)#25 | 2.1%(+3.81)#1,751 |
| 26. | 65674 | 5.7% | 1.8%(+3.86)#26 | 2.1%(+3.61)#1,862 |
| 27. | 63839 | 5.6% | 1.8%(+3.72)#27 | 2.1%(+3.47)#1,934 |
| 28. | 65237 | 5.5% | 1.8%(+3.64)#28 | 2.1%(+3.39)#1,980 |
| 29. | 64136 | 5.4% | 1.8%(+3.55)#29 | 2.1%(+3.30)#2,032 |
| 30. | 65726 | 5.3% | 1.8%(+3.49)#30 | 2.1%(+3.24)#2,069 |
| 31. | 63751 | 5.3% | 1.8%(+3.43)#31 | 2.1%(+3.18)#2,102 |
| 32. | 63102 | 5.3% | 1.8%(+3.42)#32 | 2.1%(+3.17)#2,116 |
| 33. | 63533 | 5.2% | 1.8%(+3.35)#33 | 2.1%(+3.10)#2,165 |
| 34. | 65061 | 4.9% | 1.8%(+3.02)#34 | 2.1%(+2.78)#2,392 |
| 35. | 63127 | 4.8% | 1.8%(+2.97)#35 | 2.1%(+2.72)#2,433 |
| 36. | 65757 | 4.7% | 1.8%(+2.91)#36 | 2.1%(+2.66)#2,492 |
| 37. | 64477 | 4.7% | 1.8%(+2.90)#37 | 2.1%(+2.65)#2,501 |
| 38. | 65742 | 4.7% | 1.8%(+2.87)#38 | 2.1%(+2.62)#2,526 |
| 39. | 63036 | 4.6% | 1.8%(+2.78)#39 | 2.1%(+2.53)#2,622 |
| 40. | 65641 | 4.6% | 1.8%(+2.76)#40 | 2.1%(+2.51)#2,633 |
| 41. | 65680 | 4.6% | 1.8%(+2.72)#41 | 2.1%(+2.48)#2,676 |
| 42. | 64120 | 4.5% | 1.8%(+2.68)#42 | 2.1%(+2.43)#2,728 |
| 43. | 65025 | 4.5% | 1.8%(+2.66)#43 | 2.1%(+2.42)#2,745 |
| 44. | 63828 | 4.5% | 1.8%(+2.64)#44 | 2.1%(+2.40)#2,776 |
| 45. | 64105 | 4.4% | 1.8%(+2.60)#45 | 2.1%(+2.35)#2,816 |
| 46. | 65632 | 4.3% | 1.8%(+2.47)#46 | 2.1%(+2.22)#2,958 |
| 47. | 63440 | 4.3% | 1.8%(+2.43)#47 | 2.1%(+2.19)#2,999 |
| 48. | 64622 | 4.2% | 1.8%(+2.35)#48 | 2.1%(+2.10)#3,104 |
| 49. | 65079 | 4.2% | 1.8%(+2.32)#49 | 2.1%(+2.07)#3,143 |
| 50. | 65052 | 4.1% | 1.8%(+2.25)#50 | 2.1%(+2.00)#3,217 |
| 51. | 65630 | 4.1% | 1.8%(+2.22)#51 | 2.1%(+1.97)#3,263 |
| 52. | 63879 | 4.0% | 1.8%(+2.21)#52 | 2.1%(+1.96)#3,276 |
| 53. | 65604 | 4.0% | 1.8%(+2.21)#53 | 2.1%(+1.96)#3,279 |
| 54. | 65653 | 4.0% | 1.8%(+2.19)#54 | 2.1%(+1.94)#3,302 |
| 55. | 63055 | 4.0% | 1.8%(+2.19)#55 | 2.1%(+1.94)#3,305 |
| 56. | 63140 | 4.0% | 1.8%(+2.17)#56 | 2.1%(+1.92)#3,339 |
| 57. | 65463 | 4.0% | 1.8%(+2.13)#57 | 2.1%(+1.88)#3,383 |
| 58. | 63110 | 4.0% | 1.8%(+2.13)#58 | 2.1%(+1.88)#3,390 |
| 59. | 65740 | 3.9% | 1.8%(+2.04)#59 | 2.1%(+1.79)#3,517 |
| 60. | 64126 | 3.8% | 1.8%(+2.01)#60 | 2.1%(+1.77)#3,556 |
| 61. | 63139 | 3.8% | 1.8%(+2.00)#61 | 2.1%(+1.75)#3,580 |
| 62. | 65248 | 3.7% | 1.8%(+1.91)#62 | 2.1%(+1.66)#3,722 |
| 63. | 65535 | 3.7% | 1.8%(+1.89)#63 | 2.1%(+1.64)#3,734 |
| 64. | 65233 | 3.7% | 1.8%(+1.82)#64 | 2.1%(+1.57)#3,839 |
| 65. | 64117 | 3.6% | 1.8%(+1.81)#65 | 2.1%(+1.56)#3,861 |
| 66. | 63130 | 3.6% | 1.8%(+1.81)#66 | 2.1%(+1.56)#3,872 |
| 67. | 65016 | 3.6% | 1.8%(+1.80)#67 | 2.1%(+1.55)#3,886 |
| 68. | 63452 | 3.6% | 1.8%(+1.79)#68 | 2.1%(+1.54)#3,911 |
| 69. | 63112 | 3.6% | 1.8%(+1.74)#69 | 2.1%(+1.49)#3,992 |
| 70. | 64124 | 3.5% | 1.8%(+1.71)#70 | 2.1%(+1.46)#4,037 |
| 71. | 63118 | 3.5% | 1.8%(+1.69)#71 | 2.1%(+1.44)#4,077 |
| 72. | 64111 | 3.5% | 1.8%(+1.67)#72 | 2.1%(+1.42)#4,118 |
| 73. | 63104 | 3.5% | 1.8%(+1.67)#73 | 2.1%(+1.42)#4,124 |
| 74. | 65786 | 3.5% | 1.8%(+1.67)#74 | 2.1%(+1.42)#4,130 |
| 75. | 64761 | 3.5% | 1.8%(+1.63)#75 | 2.1%(+1.38)#4,214 |
| 76. | 65759 | 3.4% | 1.8%(+1.61)#76 | 2.1%(+1.36)#4,260 |
| 77. | 64132 | 3.4% | 1.8%(+1.60)#77 | 2.1%(+1.35)#4,286 |
| 78. | 63116 | 3.4% | 1.8%(+1.57)#78 | 2.1%(+1.33)#4,338 |
| 79. | 63072 | 3.4% | 1.8%(+1.56)#79 | 2.1%(+1.31)#4,372 |
| 80. | 64131 | 3.4% | 1.8%(+1.55)#80 | 2.1%(+1.30)#4,392 |
| 81. | 63117 | 3.4% | 1.8%(+1.52)#81 | 2.1%(+1.28)#4,445 |
| 82. | 64835 | 3.4% | 1.8%(+1.52)#82 | 2.1%(+1.27)#4,455 |
| 83. | 63967 | 3.3% | 1.8%(+1.50)#83 | 2.1%(+1.26)#4,490 |
| 84. | 64072 | 3.3% | 1.8%(+1.47)#84 | 2.1%(+1.22)#4,553 |
| 85. | 63090 | 3.3% | 1.8%(+1.46)#85 | 2.1%(+1.21)#4,585 |
| 86. | 63624 | 3.3% | 1.8%(+1.45)#86 | 2.1%(+1.20)#4,615 |
| 87. | 64110 | 3.3% | 1.8%(+1.44)#87 | 2.1%(+1.19)#4,626 |
| 88. | 63461 | 3.3% | 1.8%(+1.42)#88 | 2.1%(+1.17)#4,671 |
| 89. | 65441 | 3.2% | 1.8%(+1.41)#89 | 2.1%(+1.16)#4,703 |
| 90. | 65322 | 3.2% | 1.8%(+1.39)#90 | 2.1%(+1.14)#4,731 |
| 91. | 64722 | 3.2% | 1.8%(+1.39)#91 | 2.1%(+1.14)#4,735 |
| 92. | 63333 | 3.2% | 1.8%(+1.38)#92 | 2.1%(+1.13)#4,759 |
| 93. | 65049 | 3.2% | 1.8%(+1.36)#93 | 2.1%(+1.11)#4,825 |
| 94. | 63109 | 3.2% | 1.8%(+1.34)#94 | 2.1%(+1.09)#4,874 |
| 95. | 64112 | 3.1% | 1.8%(+1.29)#95 | 2.1%(+1.04)#4,995 |
| 96. | 63115 | 3.1% | 1.8%(+1.29)#96 | 2.1%(+1.04)#5,007 |
| 97. | 65644 | 3.1% | 1.8%(+1.28)#97 | 2.1%(+1.03)#5,023 |
| 98. | 63005 | 3.1% | 1.8%(+1.28)#98 | 2.1%(+1.03)#5,025 |
| 99. | 64109 | 3.1% | 1.8%(+1.24)#99 | 2.1%(+0.989)#5,156 |
| 100. | 65617 | 3.1% | 1.8%(+1.24)#100 | 2.1%(+0.987)#5,165 |
Common Questions
What are the Top 10 Zip Codes with the Highest Percentage of Population Employed in Arts, Entertainment & Recreation in Missouri?
Top 10 Zip Codes with the Highest Percentage of Population Employed in Arts, Entertainment & Recreation in Missouri are:
What zip code has the Highest Percentage of Population Employed in Arts, Entertainment & Recreation in Missouri?
64750 has the Highest Percentage of Population Employed in Arts, Entertainment & Recreation in Missouri with 28.8%.
What is the Percentage of Population Employed in Arts, Entertainment & Recreation in the State of Missouri?
Percentage of Population Employed in Arts, Entertainment & Recreation in Missouri is 1.8%.
What is the Percentage of Population Employed in Arts, Entertainment & Recreation in the United States?
Percentage of Population Employed in Arts, Entertainment & Recreation in the United States is 2.1%.