Zip Codes with the Highest Percentage of Population Employed in Agriculture, Fishing & Hunting in Saint Joseph, MO
RELATED REPORTS & OPTIONS
Agriculture, Fishing & Hunting
Saint Joseph
Compare Zip Codes
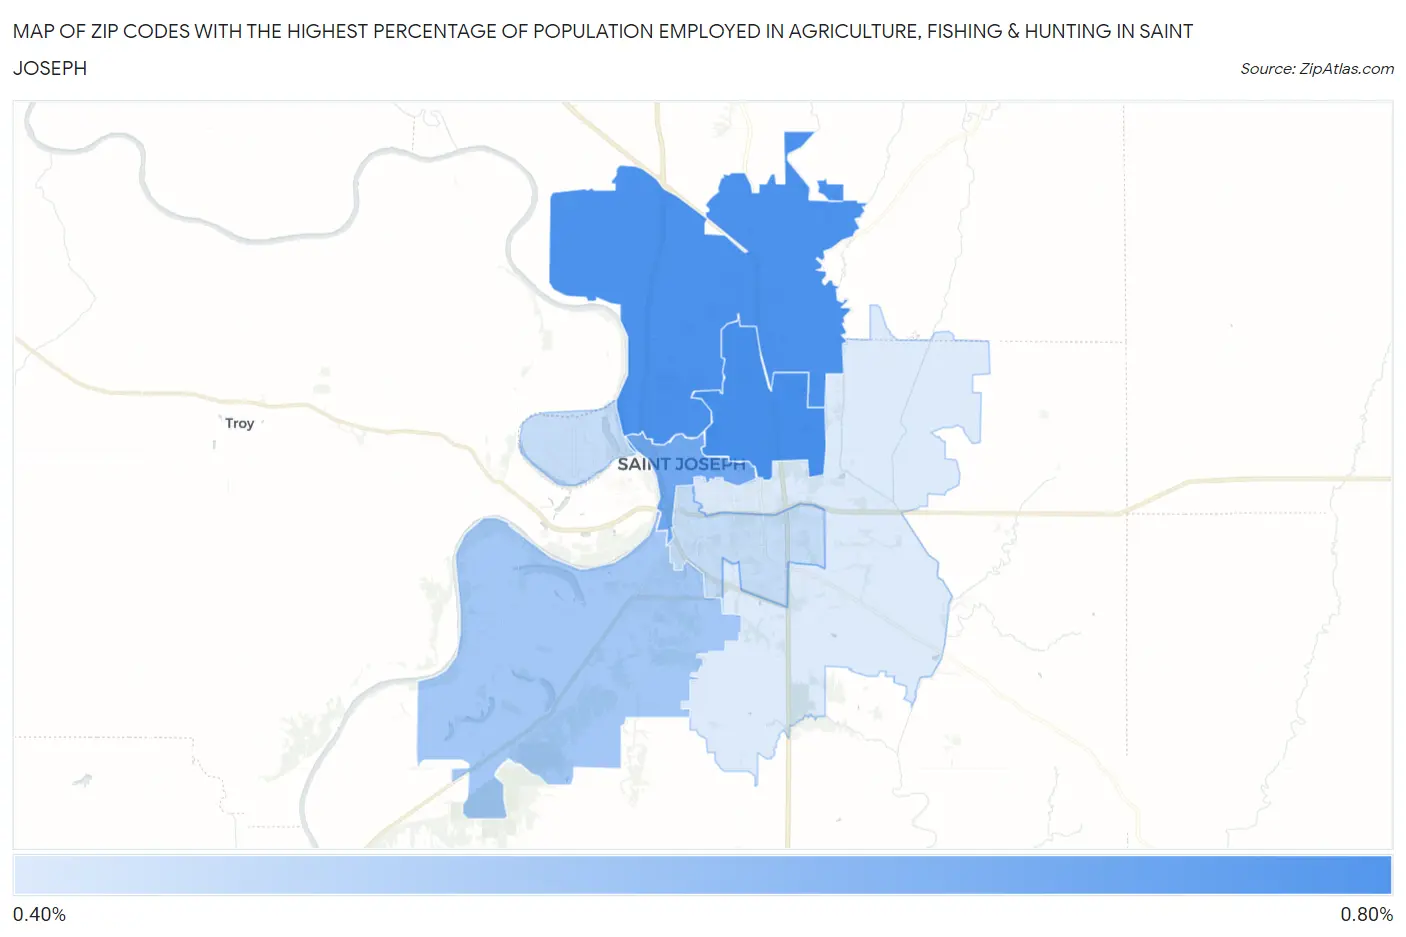
Map of Zip Codes with the Highest Percentage of Population Employed in Agriculture, Fishing & Hunting in Saint Joseph
0.0%
0.80%
Zip Codes with the Highest Percentage of Population Employed in Agriculture, Fishing & Hunting in Saint Joseph, MO
| Zip Code | % Employed | vs State | vs National | |
| 1. | 64506 | 0.79% | 1.4%(-0.651)#652 | 1.2%(-0.406)#17,276 |
| 2. | 64505 | 0.78% | 1.4%(-0.660)#654 | 1.2%(-0.416)#17,346 |
| 3. | 64501 | 0.70% | 1.4%(-0.748)#666 | 1.2%(-0.504)#17,864 |
| 4. | 64504 | 0.58% | 1.4%(-0.860)#684 | 1.2%(-0.616)#18,596 |
| 5. | 64503 | 0.50% | 1.4%(-0.940)#704 | 1.2%(-0.695)#19,248 |
| 6. | 64507 | 0.45% | 1.4%(-0.992)#718 | 1.2%(-0.748)#19,687 |
1
Common Questions
What are the Top 5 Zip Codes with the Highest Percentage of Population Employed in Agriculture, Fishing & Hunting in Saint Joseph, MO?
Top 5 Zip Codes with the Highest Percentage of Population Employed in Agriculture, Fishing & Hunting in Saint Joseph, MO are:
What zip code has the Highest Percentage of Population Employed in Agriculture, Fishing & Hunting in Saint Joseph, MO?
64506 has the Highest Percentage of Population Employed in Agriculture, Fishing & Hunting in Saint Joseph, MO with 0.79%.
What is the Percentage of Population Employed in Agriculture, Fishing & Hunting in Missouri?
Percentage of Population Employed in Agriculture, Fishing & Hunting in Missouri is 1.4%.
What is the Percentage of Population Employed in Agriculture, Fishing & Hunting in the United States?
Percentage of Population Employed in Agriculture, Fishing & Hunting in the United States is 1.2%.