Zip Codes with the Highest Percentage of Population Employed in Farming, Fishing & Forestry in Saint Joseph, MO
RELATED REPORTS & OPTIONS
Farming, Fishing & Forestry
Saint Joseph
Compare Zip Codes
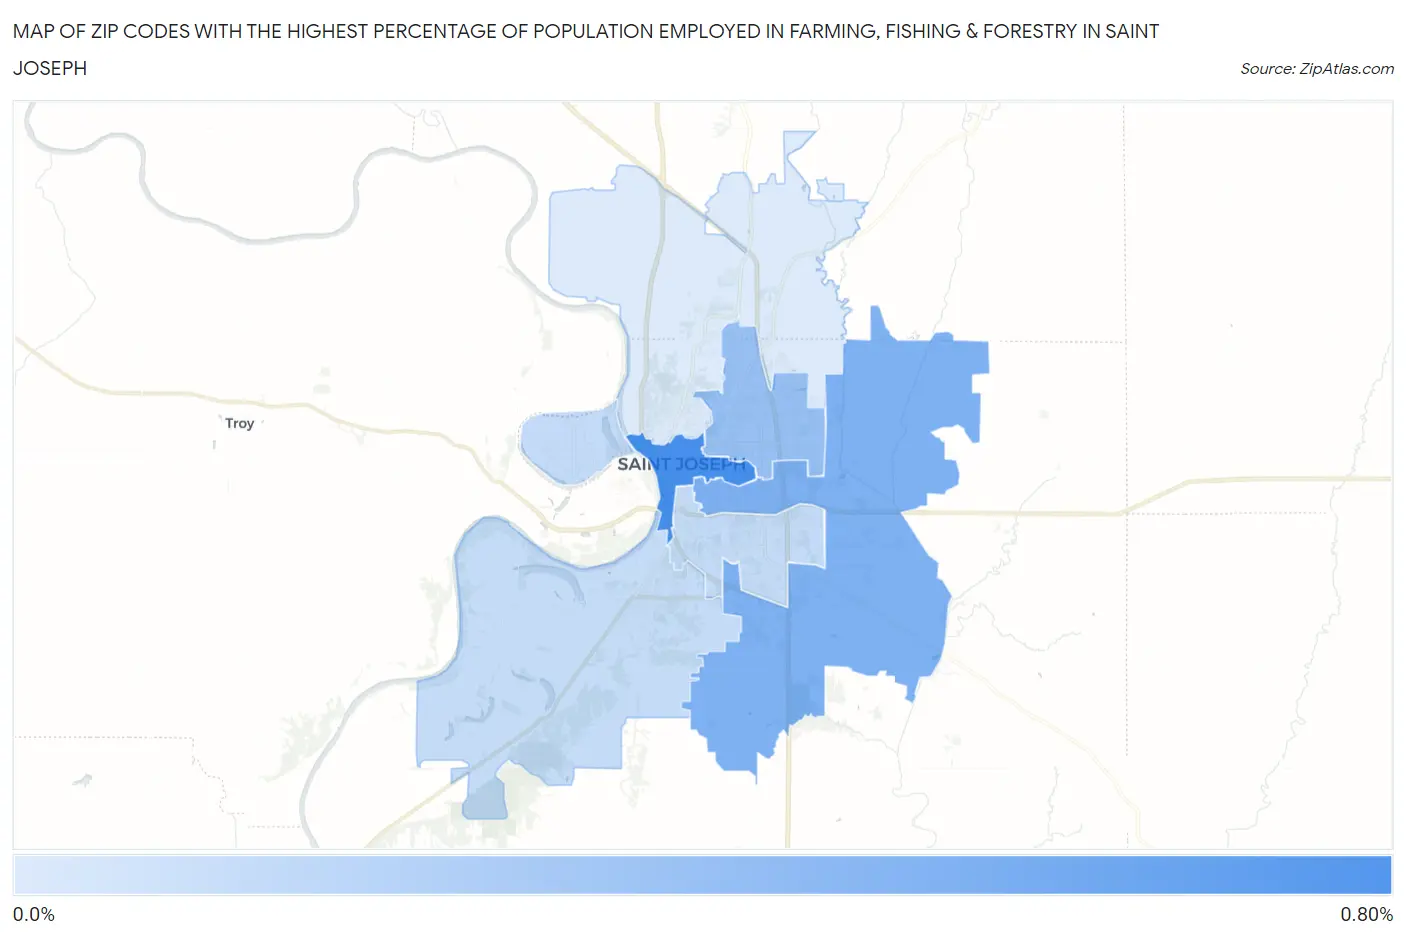
Map of Zip Codes with the Highest Percentage of Population Employed in Farming, Fishing & Forestry in Saint Joseph
0.0%
0.80%
Zip Codes with the Highest Percentage of Population Employed in Farming, Fishing & Forestry in Saint Joseph, MO
| Zip Code | % Employed | vs State | vs National | |
| 1. | 64501 | 0.65% | 0.49%(+0.163)#408 | 0.61%(+0.047)#11,680 |
| 2. | 64507 | 0.45% | 0.49%(-0.038)#448 | 0.61%(-0.154)#13,273 |
| 3. | 64506 | 0.36% | 0.49%(-0.134)#468 | 0.61%(-0.250)#14,198 |
| 4. | 64503 | 0.20% | 0.49%(-0.288)#523 | 0.61%(-0.404)#16,107 |
| 5. | 64504 | 0.19% | 0.49%(-0.303)#527 | 0.61%(-0.419)#16,334 |
| 6. | 64505 | 0.11% | 0.49%(-0.384)#564 | 0.61%(-0.500)#17,657 |
1
Common Questions
What are the Top 5 Zip Codes with the Highest Percentage of Population Employed in Farming, Fishing & Forestry in Saint Joseph, MO?
Top 5 Zip Codes with the Highest Percentage of Population Employed in Farming, Fishing & Forestry in Saint Joseph, MO are:
What zip code has the Highest Percentage of Population Employed in Farming, Fishing & Forestry in Saint Joseph, MO?
64501 has the Highest Percentage of Population Employed in Farming, Fishing & Forestry in Saint Joseph, MO with 0.65%.
What is the Percentage of Population Employed in Farming, Fishing & Forestry in Missouri?
Percentage of Population Employed in Farming, Fishing & Forestry in Missouri is 0.49%.
What is the Percentage of Population Employed in Farming, Fishing & Forestry in the United States?
Percentage of Population Employed in Farming, Fishing & Forestry in the United States is 0.61%.