Zip Codes with the Highest Percentage of Self-Employed / Incorporated in Minnesota
RELATED REPORTS & OPTIONS
Self-Employed / Incorporated
Minnesota
Compare Zip Codes
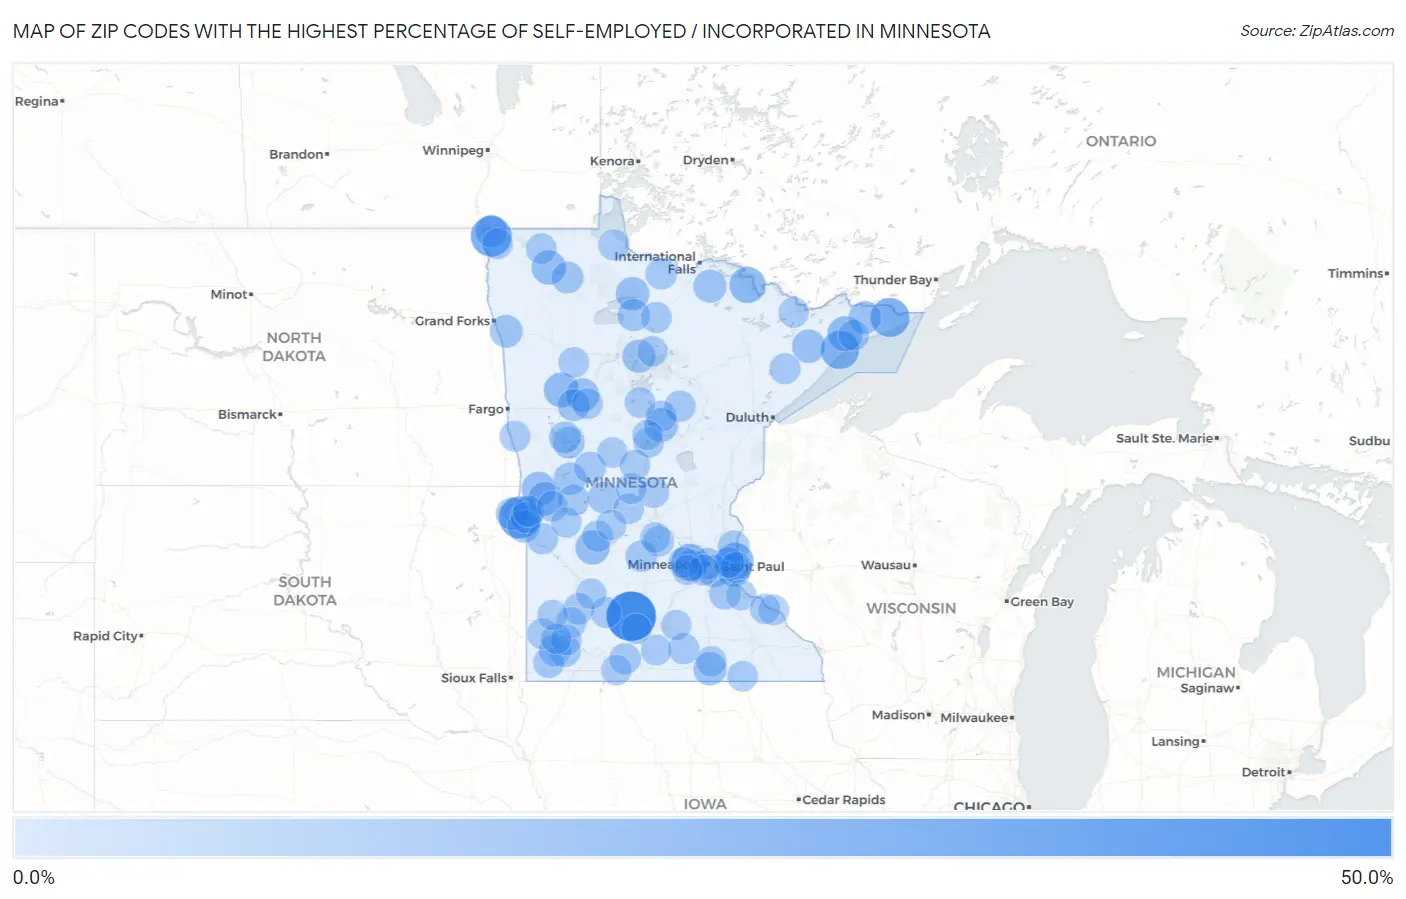
Map of Zip Codes with the Highest Percentage of Self-Employed / Incorporated in Minnesota
0.0%
50.0%
Zip Codes with the Highest Percentage of Self-Employed / Incorporated in Minnesota
| Zip Code | % Self-Employed / Incorporated | vs State | vs National | |
| 1. | 56030 | 50.0% | 3.9%(+46.1)#1 | 3.8%(+46.2)#85 |
| 2. | 56210 | 33.3% | 3.9%(+29.4)#2 | 3.8%(+29.5)#181 |
| 3. | 56731 | 30.3% | 3.9%(+26.4)#3 | 3.8%(+26.5)#214 |
| 4. | 55606 | 26.5% | 3.9%(+22.6)#4 | 3.8%(+22.7)#278 |
| 5. | 55613 | 24.8% | 3.9%(+20.8)#5 | 3.8%(+20.9)#319 |
| 6. | 55356 | 22.7% | 3.9%(+18.8)#6 | 3.8%(+18.9)#380 |
| 7. | 55003 | 22.0% | 3.9%(+18.1)#7 | 3.8%(+18.2)#406 |
| 8. | 55725 | 20.0% | 3.9%(+16.1)#8 | 3.8%(+16.2)#515 |
| 9. | 55615 | 18.2% | 3.9%(+14.3)#9 | 3.8%(+14.4)#610 |
| 10. | 56591 | 17.5% | 3.9%(+13.5)#10 | 3.8%(+13.6)#663 |
| 11. | 56759 | 16.4% | 3.9%(+12.5)#11 | 3.8%(+12.6)#771 |
| 12. | 56252 | 15.9% | 3.9%(+12.0)#12 | 3.8%(+12.1)#830 |
| 13. | 56274 | 15.5% | 3.9%(+11.5)#13 | 3.8%(+11.6)#891 |
| 14. | 56248 | 15.1% | 3.9%(+11.2)#14 | 3.8%(+11.3)#928 |
| 15. | 56442 | 15.0% | 3.9%(+11.1)#15 | 3.8%(+11.2)#949 |
| 16. | 56575 | 14.3% | 3.9%(+10.4)#16 | 3.8%(+10.5)#1,070 |
| 17. | 55607 | 14.3% | 3.9%(+10.4)#17 | 3.8%(+10.5)#1,073 |
| 18. | 56685 | 14.3% | 3.9%(+10.4)#18 | 3.8%(+10.5)#1,081 |
| 19. | 55001 | 14.0% | 3.9%(+10.1)#19 | 3.8%(+10.2)#1,132 |
| 20. | 56043 | 13.9% | 3.9%(+10.00)#20 | 3.8%(+10.1)#1,152 |
| 21. | 56663 | 13.6% | 3.9%(+9.72)#21 | 3.8%(+9.82)#1,215 |
| 22. | 56669 | 13.4% | 3.9%(+9.49)#22 | 3.8%(+9.60)#1,245 |
| 23. | 56723 | 12.7% | 3.9%(+8.76)#23 | 3.8%(+8.87)#1,393 |
| 24. | 55604 | 12.6% | 3.9%(+8.69)#24 | 3.8%(+8.79)#1,410 |
| 25. | 56211 | 12.6% | 3.9%(+8.66)#25 | 3.8%(+8.77)#1,418 |
| 26. | 56326 | 12.3% | 3.9%(+8.34)#26 | 3.8%(+8.45)#1,503 |
| 27. | 56225 | 12.2% | 3.9%(+8.29)#27 | 3.8%(+8.40)#1,514 |
| 28. | 56650 | 11.8% | 3.9%(+7.92)#28 | 3.8%(+8.02)#1,601 |
| 29. | 56755 | 11.8% | 3.9%(+7.84)#29 | 3.8%(+7.95)#1,631 |
| 30. | 56122 | 11.7% | 3.9%(+7.74)#30 | 3.8%(+7.84)#1,673 |
| 31. | 56578 | 11.6% | 3.9%(+7.72)#31 | 3.8%(+7.82)#1,675 |
| 32. | 56576 | 11.2% | 3.9%(+7.29)#32 | 3.8%(+7.39)#1,806 |
| 33. | 55150 | 11.1% | 3.9%(+7.19)#33 | 3.8%(+7.29)#1,844 |
| 34. | 56724 | 11.1% | 3.9%(+7.19)#34 | 3.8%(+7.29)#1,845 |
| 35. | 56528 | 10.9% | 3.9%(+6.97)#35 | 3.8%(+7.07)#1,942 |
| 36. | 56389 | 10.8% | 3.9%(+6.89)#36 | 3.8%(+6.99)#1,973 |
| 37. | 56361 | 10.6% | 3.9%(+6.71)#37 | 3.8%(+6.81)#2,055 |
| 38. | 55047 | 10.6% | 3.9%(+6.69)#38 | 3.8%(+6.80)#2,061 |
| 39. | 56141 | 10.3% | 3.9%(+6.42)#39 | 3.8%(+6.53)#2,157 |
| 40. | 55031 | 10.3% | 3.9%(+6.40)#40 | 3.8%(+6.50)#2,162 |
| 41. | 56240 | 10.2% | 3.9%(+6.29)#41 | 3.8%(+6.39)#2,216 |
| 42. | 56236 | 10.2% | 3.9%(+6.26)#42 | 3.8%(+6.36)#2,228 |
| 43. | 55402 | 10.1% | 3.9%(+6.19)#43 | 3.8%(+6.29)#2,262 |
| 44. | 55324 | 10.0% | 3.9%(+6.04)#44 | 3.8%(+6.15)#2,346 |
| 45. | 55391 | 9.8% | 3.9%(+5.91)#45 | 3.8%(+6.01)#2,401 |
| 46. | 56327 | 9.7% | 3.9%(+5.77)#46 | 3.8%(+5.88)#2,466 |
| 47. | 56629 | 9.6% | 3.9%(+5.72)#47 | 3.8%(+5.82)#2,501 |
| 48. | 55785 | 9.5% | 3.9%(+5.56)#48 | 3.8%(+5.67)#2,604 |
| 49. | 56176 | 9.4% | 3.9%(+5.50)#49 | 3.8%(+5.60)#2,631 |
| 50. | 55043 | 9.4% | 3.9%(+5.45)#50 | 3.8%(+5.55)#2,663 |
| 51. | 56289 | 9.2% | 3.9%(+5.30)#51 | 3.8%(+5.40)#2,744 |
| 52. | 55042 | 9.2% | 3.9%(+5.29)#52 | 3.8%(+5.39)#2,750 |
| 53. | 56660 | 9.2% | 3.9%(+5.27)#53 | 3.8%(+5.38)#2,759 |
| 54. | 55602 | 9.2% | 3.9%(+5.25)#54 | 3.8%(+5.36)#2,775 |
| 55. | 56091 | 9.1% | 3.9%(+5.17)#55 | 3.8%(+5.27)#2,826 |
| 56. | 56147 | 9.1% | 3.9%(+5.17)#56 | 3.8%(+5.27)#2,832 |
| 57. | 56227 | 9.0% | 3.9%(+5.10)#57 | 3.8%(+5.21)#2,869 |
| 58. | 56263 | 9.0% | 3.9%(+5.10)#58 | 3.8%(+5.20)#2,870 |
| 59. | 56686 | 8.9% | 3.9%(+5.01)#59 | 3.8%(+5.11)#2,924 |
| 60. | 56448 | 8.9% | 3.9%(+4.95)#60 | 3.8%(+5.05)#2,961 |
| 61. | 56728 | 8.9% | 3.9%(+4.94)#61 | 3.8%(+5.05)#2,967 |
| 62. | 56594 | 8.8% | 3.9%(+4.93)#62 | 3.8%(+5.03)#2,982 |
| 63. | 56139 | 8.8% | 3.9%(+4.92)#63 | 3.8%(+5.02)#2,984 |
| 64. | 55359 | 8.8% | 3.9%(+4.90)#64 | 3.8%(+5.01)#2,993 |
| 65. | 55424 | 8.8% | 3.9%(+4.90)#65 | 3.8%(+5.00)#3,001 |
| 66. | 56373 | 8.7% | 3.9%(+4.82)#66 | 3.8%(+4.92)#3,054 |
| 67. | 55302 | 8.7% | 3.9%(+4.81)#67 | 3.8%(+4.92)#3,056 |
| 68. | 56235 | 8.7% | 3.9%(+4.79)#68 | 3.8%(+4.89)#3,075 |
| 69. | 56331 | 8.7% | 3.9%(+4.79)#69 | 3.8%(+4.89)#3,076 |
| 70. | 56570 | 8.7% | 3.9%(+4.78)#70 | 3.8%(+4.89)#3,078 |
| 71. | 56175 | 8.6% | 3.9%(+4.69)#71 | 3.8%(+4.80)#3,139 |
| 72. | 56010 | 8.6% | 3.9%(+4.67)#72 | 3.8%(+4.77)#3,156 |
| 73. | 56452 | 8.5% | 3.9%(+4.58)#73 | 3.8%(+4.68)#3,229 |
| 74. | 56726 | 8.5% | 3.9%(+4.57)#74 | 3.8%(+4.67)#3,240 |
| 75. | 55612 | 8.4% | 3.9%(+4.51)#75 | 3.8%(+4.61)#3,290 |
| 76. | 56651 | 8.4% | 3.9%(+4.50)#76 | 3.8%(+4.61)#3,293 |
| 77. | 56224 | 8.4% | 3.9%(+4.47)#77 | 3.8%(+4.57)#3,325 |
| 78. | 56172 | 8.4% | 3.9%(+4.43)#78 | 3.8%(+4.53)#3,355 |
| 79. | 56382 | 8.3% | 3.9%(+4.34)#79 | 3.8%(+4.44)#3,439 |
| 80. | 55977 | 8.2% | 3.9%(+4.31)#80 | 3.8%(+4.42)#3,453 |
| 81. | 56214 | 8.2% | 3.9%(+4.25)#81 | 3.8%(+4.35)#3,503 |
| 82. | 56151 | 8.1% | 3.9%(+4.20)#82 | 3.8%(+4.31)#3,544 |
| 83. | 56312 | 8.1% | 3.9%(+4.16)#83 | 3.8%(+4.27)#3,592 |
| 84. | 55089 | 8.1% | 3.9%(+4.14)#84 | 3.8%(+4.25)#3,611 |
| 85. | 56045 | 8.0% | 3.9%(+4.13)#85 | 3.8%(+4.23)#3,626 |
| 86. | 55968 | 8.0% | 3.9%(+4.08)#86 | 3.8%(+4.18)#3,666 |
| 87. | 56111 | 8.0% | 3.9%(+4.04)#87 | 3.8%(+4.15)#3,700 |
| 88. | 56434 | 8.0% | 3.9%(+4.03)#88 | 3.8%(+4.14)#3,707 |
| 89. | 56244 | 8.0% | 3.9%(+4.03)#89 | 3.8%(+4.13)#3,714 |
| 90. | 56681 | 7.9% | 3.9%(+4.00)#90 | 3.8%(+4.10)#3,740 |
| 91. | 56041 | 7.9% | 3.9%(+3.99)#91 | 3.8%(+4.10)#3,748 |
| 92. | 55382 | 7.9% | 3.9%(+3.99)#92 | 3.8%(+4.10)#3,751 |
| 93. | 56443 | 7.8% | 3.9%(+3.92)#93 | 3.8%(+4.02)#3,821 |
| 94. | 56468 | 7.8% | 3.9%(+3.92)#94 | 3.8%(+4.02)#3,824 |
| 95. | 55731 | 7.7% | 3.9%(+3.82)#95 | 3.8%(+3.93)#3,924 |
| 96. | 55331 | 7.7% | 3.9%(+3.81)#96 | 3.8%(+3.91)#3,937 |
| 97. | 55041 | 7.7% | 3.9%(+3.80)#97 | 3.8%(+3.91)#3,940 |
| 98. | 56063 | 7.7% | 3.9%(+3.80)#98 | 3.8%(+3.90)#3,944 |
| 99. | 56472 | 7.7% | 3.9%(+3.79)#99 | 3.8%(+3.90)#3,952 |
| 100. | 56169 | 7.7% | 3.9%(+3.77)#100 | 3.8%(+3.88)#3,973 |
Common Questions
What are the Top 10 Zip Codes with the Highest Percentage of Self-Employed / Incorporated in Minnesota?
Top 10 Zip Codes with the Highest Percentage of Self-Employed / Incorporated in Minnesota are:
What zip code has the Highest Percentage of Self-Employed / Incorporated in Minnesota?
56030 has the Highest Percentage of Self-Employed / Incorporated in Minnesota with 50.0%.
What is the Percentage of Self-Employed / Incorporated in the State of Minnesota?
Percentage of Self-Employed / Incorporated in Minnesota is 3.9%.
What is the Percentage of Self-Employed / Incorporated in the United States?
Percentage of Self-Employed / Incorporated in the United States is 3.8%.