Zip Codes with the Highest Percentage of Population Employed in Transportation & Warehousing in Minnesota
RELATED REPORTS & OPTIONS
Transportation & Warehousing
Minnesota
Compare Zip Codes
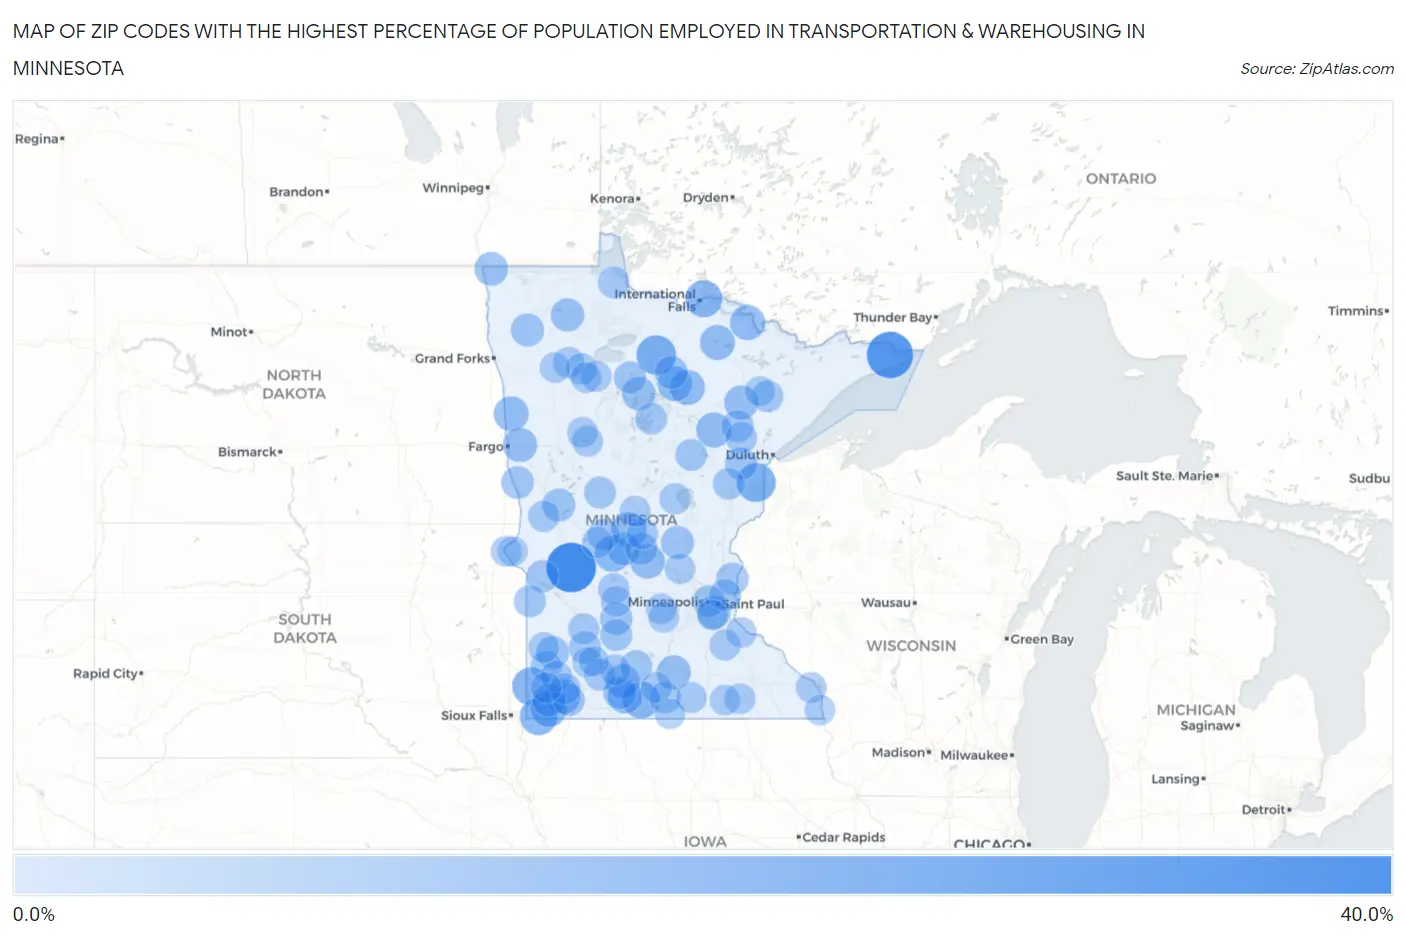
Map of Zip Codes with the Highest Percentage of Population Employed in Transportation & Warehousing in Minnesota
0.0%
40.0%
Zip Codes with the Highest Percentage of Population Employed in Transportation & Warehousing in Minnesota
| Zip Code | % Employed | vs State | vs National | |
| 1. | 56226 | 30.5% | 4.2%(+26.3)#1 | 4.9%(+25.5)#219 |
| 2. | 55606 | 26.5% | 4.2%(+22.3)#2 | 4.9%(+21.6)#298 |
| 3. | 56660 | 18.4% | 4.2%(+14.2)#3 | 4.9%(+13.4)#649 |
| 4. | 55749 | 17.7% | 4.2%(+13.5)#4 | 4.9%(+12.8)#710 |
| 5. | 56140 | 16.7% | 4.2%(+12.5)#5 | 4.9%(+11.7)#828 |
| 6. | 56173 | 16.3% | 4.2%(+12.1)#6 | 4.9%(+11.3)#868 |
| 7. | 56668 | 15.5% | 4.2%(+11.3)#7 | 4.9%(+10.6)#967 |
| 8. | 56075 | 15.3% | 4.2%(+11.1)#8 | 4.9%(+10.3)#1,010 |
| 9. | 56158 | 14.8% | 4.2%(+10.6)#9 | 4.9%(+9.83)#1,107 |
| 10. | 56325 | 14.3% | 4.2%(+10.1)#10 | 4.9%(+9.34)#1,210 |
| 11. | 56185 | 13.8% | 4.2%(+9.63)#11 | 4.9%(+8.89)#1,316 |
| 12. | 56318 | 13.4% | 4.2%(+9.23)#12 | 4.9%(+8.49)#1,410 |
| 13. | 55725 | 13.3% | 4.2%(+9.13)#13 | 4.9%(+8.39)#1,448 |
| 14. | 55784 | 13.2% | 4.2%(+9.00)#14 | 4.9%(+8.26)#1,480 |
| 15. | 55772 | 13.0% | 4.2%(+8.84)#15 | 4.9%(+8.10)#1,525 |
| 16. | 56550 | 12.9% | 4.2%(+8.72)#16 | 4.9%(+7.98)#1,552 |
| 17. | 56657 | 12.9% | 4.2%(+8.70)#17 | 4.9%(+7.96)#1,564 |
| 18. | 56637 | 12.8% | 4.2%(+8.62)#18 | 4.9%(+7.87)#1,587 |
| 19. | 56369 | 12.7% | 4.2%(+8.55)#19 | 4.9%(+7.80)#1,610 |
| 20. | 56176 | 12.5% | 4.2%(+8.27)#20 | 4.9%(+7.53)#1,692 |
| 21. | 56120 | 12.2% | 4.2%(+8.04)#21 | 4.9%(+7.29)#1,770 |
| 22. | 56547 | 12.2% | 4.2%(+8.00)#22 | 4.9%(+7.26)#1,784 |
| 23. | 56080 | 12.2% | 4.2%(+7.96)#23 | 4.9%(+7.22)#1,794 |
| 24. | 55751 | 12.0% | 4.2%(+7.77)#24 | 4.9%(+7.03)#1,878 |
| 25. | 56755 | 11.4% | 4.2%(+7.23)#25 | 4.9%(+6.48)#2,108 |
| 26. | 56356 | 11.4% | 4.2%(+7.16)#26 | 4.9%(+6.42)#2,142 |
| 27. | 56663 | 11.4% | 4.2%(+7.16)#27 | 4.9%(+6.42)#2,144 |
| 28. | 55121 | 11.2% | 4.2%(+7.00)#28 | 4.9%(+6.26)#2,228 |
| 29. | 56724 | 11.1% | 4.2%(+6.91)#29 | 4.9%(+6.16)#2,275 |
| 30. | 56760 | 11.0% | 4.2%(+6.78)#30 | 4.9%(+6.03)#2,334 |
| 31. | 56147 | 10.9% | 4.2%(+6.71)#31 | 4.9%(+5.96)#2,364 |
| 32. | 56324 | 10.9% | 4.2%(+6.67)#32 | 4.9%(+5.93)#2,376 |
| 33. | 56357 | 10.9% | 4.2%(+6.65)#33 | 4.9%(+5.91)#2,391 |
| 34. | 56160 | 10.8% | 4.2%(+6.58)#34 | 4.9%(+5.84)#2,436 |
| 35. | 56688 | 10.7% | 4.2%(+6.51)#35 | 4.9%(+5.77)#2,471 |
| 36. | 56169 | 10.6% | 4.2%(+6.41)#36 | 4.9%(+5.67)#2,522 |
| 37. | 56553 | 10.2% | 4.2%(+6.02)#37 | 4.9%(+5.28)#2,742 |
| 38. | 55310 | 10.2% | 4.2%(+6.00)#38 | 4.9%(+5.26)#2,760 |
| 39. | 55780 | 10.1% | 4.2%(+5.91)#39 | 4.9%(+5.17)#2,816 |
| 40. | 55073 | 10.0% | 4.2%(+5.75)#40 | 4.9%(+5.01)#2,925 |
| 41. | 56255 | 9.8% | 4.2%(+5.64)#41 | 4.9%(+4.90)#2,988 |
| 42. | 56165 | 9.8% | 4.2%(+5.61)#42 | 4.9%(+4.87)#3,006 |
| 43. | 55765 | 9.8% | 4.2%(+5.60)#43 | 4.9%(+4.85)#3,012 |
| 44. | 56227 | 9.8% | 4.2%(+5.57)#44 | 4.9%(+4.83)#3,026 |
| 45. | 56389 | 9.8% | 4.2%(+5.55)#45 | 4.9%(+4.81)#3,039 |
| 46. | 56647 | 9.7% | 4.2%(+5.53)#46 | 4.9%(+4.79)#3,053 |
| 47. | 56041 | 9.7% | 4.2%(+5.49)#47 | 4.9%(+4.75)#3,076 |
| 48. | 56310 | 9.7% | 4.2%(+5.48)#48 | 4.9%(+4.73)#3,088 |
| 49. | 56257 | 9.6% | 4.2%(+5.38)#49 | 4.9%(+4.63)#3,181 |
| 50. | 55333 | 9.6% | 4.2%(+5.37)#50 | 4.9%(+4.63)#3,188 |
| 51. | 56453 | 9.5% | 4.2%(+5.27)#51 | 4.9%(+4.53)#3,254 |
| 52. | 55454 | 9.4% | 4.2%(+5.15)#52 | 4.9%(+4.41)#3,353 |
| 53. | 55090 | 9.3% | 4.2%(+5.14)#53 | 4.9%(+4.39)#3,365 |
| 54. | 56469 | 9.3% | 4.2%(+5.08)#54 | 4.9%(+4.34)#3,408 |
| 55. | 55705 | 9.3% | 4.2%(+5.07)#55 | 4.9%(+4.32)#3,426 |
| 56. | 55783 | 9.2% | 4.2%(+5.04)#56 | 4.9%(+4.30)#3,444 |
| 57. | 56686 | 9.2% | 4.2%(+5.01)#57 | 4.9%(+4.27)#3,467 |
| 58. | 56023 | 9.2% | 4.2%(+4.98)#58 | 4.9%(+4.24)#3,494 |
| 59. | 56641 | 9.2% | 4.2%(+4.96)#59 | 4.9%(+4.22)#3,517 |
| 60. | 56145 | 9.1% | 4.2%(+4.93)#60 | 4.9%(+4.19)#3,551 |
| 61. | 56590 | 8.9% | 4.2%(+4.71)#61 | 4.9%(+3.96)#3,795 |
| 62. | 55702 | 8.9% | 4.2%(+4.70)#62 | 4.9%(+3.95)#3,806 |
| 63. | 56170 | 8.8% | 4.2%(+4.58)#63 | 4.9%(+3.84)#3,943 |
| 64. | 56684 | 8.7% | 4.2%(+4.53)#64 | 4.9%(+3.79)#4,003 |
| 65. | 56644 | 8.7% | 4.2%(+4.52)#65 | 4.9%(+3.78)#4,015 |
| 66. | 56251 | 8.7% | 4.2%(+4.51)#66 | 4.9%(+3.77)#4,029 |
| 67. | 56385 | 8.7% | 4.2%(+4.49)#67 | 4.9%(+3.75)#4,046 |
| 68. | 56151 | 8.7% | 4.2%(+4.47)#68 | 4.9%(+3.72)#4,078 |
| 69. | 56450 | 8.6% | 4.2%(+4.40)#69 | 4.9%(+3.66)#4,149 |
| 70. | 56141 | 8.5% | 4.2%(+4.34)#70 | 4.9%(+3.60)#4,216 |
| 71. | 56314 | 8.5% | 4.2%(+4.31)#71 | 4.9%(+3.57)#4,256 |
| 72. | 55018 | 8.5% | 4.2%(+4.30)#72 | 4.9%(+3.56)#4,275 |
| 73. | 56237 | 8.5% | 4.2%(+4.30)#73 | 4.9%(+3.56)#4,276 |
| 74. | 56010 | 8.5% | 4.2%(+4.26)#74 | 4.9%(+3.51)#4,317 |
| 75. | 56019 | 8.5% | 4.2%(+4.25)#75 | 4.9%(+3.51)#4,325 |
| 76. | 56032 | 8.4% | 4.2%(+4.19)#76 | 4.9%(+3.45)#4,396 |
| 77. | 56570 | 8.4% | 4.2%(+4.16)#77 | 4.9%(+3.42)#4,423 |
| 78. | 56575 | 8.3% | 4.2%(+4.09)#78 | 4.9%(+3.34)#4,523 |
| 79. | 56652 | 8.3% | 4.2%(+4.07)#79 | 4.9%(+3.32)#4,547 |
| 80. | 55925 | 8.2% | 4.2%(+4.04)#80 | 4.9%(+3.30)#4,585 |
| 81. | 56475 | 8.2% | 4.2%(+4.03)#81 | 4.9%(+3.29)#4,594 |
| 82. | 55926 | 8.2% | 4.2%(+4.03)#82 | 4.9%(+3.28)#4,604 |
| 83. | 56634 | 8.2% | 4.2%(+3.98)#83 | 4.9%(+3.24)#4,657 |
| 84. | 56219 | 8.2% | 4.2%(+3.97)#84 | 4.9%(+3.23)#4,661 |
| 85. | 55089 | 8.1% | 4.2%(+3.91)#85 | 4.9%(+3.17)#4,736 |
| 86. | 55950 | 8.1% | 4.2%(+3.90)#86 | 4.9%(+3.16)#4,749 |
| 87. | 56128 | 8.1% | 4.2%(+3.89)#87 | 4.9%(+3.15)#4,770 |
| 88. | 56253 | 8.1% | 4.2%(+3.88)#88 | 4.9%(+3.14)#4,788 |
| 89. | 56113 | 8.1% | 4.2%(+3.86)#89 | 4.9%(+3.12)#4,813 |
| 90. | 56715 | 8.0% | 4.2%(+3.83)#90 | 4.9%(+3.08)#4,856 |
| 91. | 55354 | 8.0% | 4.2%(+3.78)#91 | 4.9%(+3.03)#4,933 |
| 92. | 55309 | 8.0% | 4.2%(+3.75)#92 | 4.9%(+3.01)#4,961 |
| 93. | 55370 | 7.9% | 4.2%(+3.70)#93 | 4.9%(+2.96)#5,027 |
| 94. | 56166 | 7.9% | 4.2%(+3.66)#94 | 4.9%(+2.92)#5,089 |
| 95. | 56211 | 7.8% | 4.2%(+3.57)#95 | 4.9%(+2.82)#5,226 |
| 96. | 55919 | 7.7% | 4.2%(+3.54)#96 | 4.9%(+2.79)#5,262 |
| 97. | 56033 | 7.7% | 4.2%(+3.53)#97 | 4.9%(+2.79)#5,277 |
| 98. | 55122 | 7.7% | 4.2%(+3.52)#98 | 4.9%(+2.78)#5,291 |
| 99. | 56152 | 7.6% | 4.2%(+3.42)#99 | 4.9%(+2.67)#5,457 |
| 100. | 55708 | 7.6% | 4.2%(+3.42)#100 | 4.9%(+2.67)#5,462 |
Common Questions
What are the Top 10 Zip Codes with the Highest Percentage of Population Employed in Transportation & Warehousing in Minnesota?
Top 10 Zip Codes with the Highest Percentage of Population Employed in Transportation & Warehousing in Minnesota are:
What zip code has the Highest Percentage of Population Employed in Transportation & Warehousing in Minnesota?
56226 has the Highest Percentage of Population Employed in Transportation & Warehousing in Minnesota with 30.5%.
What is the Percentage of Population Employed in Transportation & Warehousing in the State of Minnesota?
Percentage of Population Employed in Transportation & Warehousing in Minnesota is 4.2%.
What is the Percentage of Population Employed in Transportation & Warehousing in the United States?
Percentage of Population Employed in Transportation & Warehousing in the United States is 4.9%.