Zip Codes with the Highest Percentage of Population Employed in Arts, Entertainment & Recreation in Minnesota
RELATED REPORTS & OPTIONS
Arts, Entertainment & Recreation
Minnesota
Compare Zip Codes
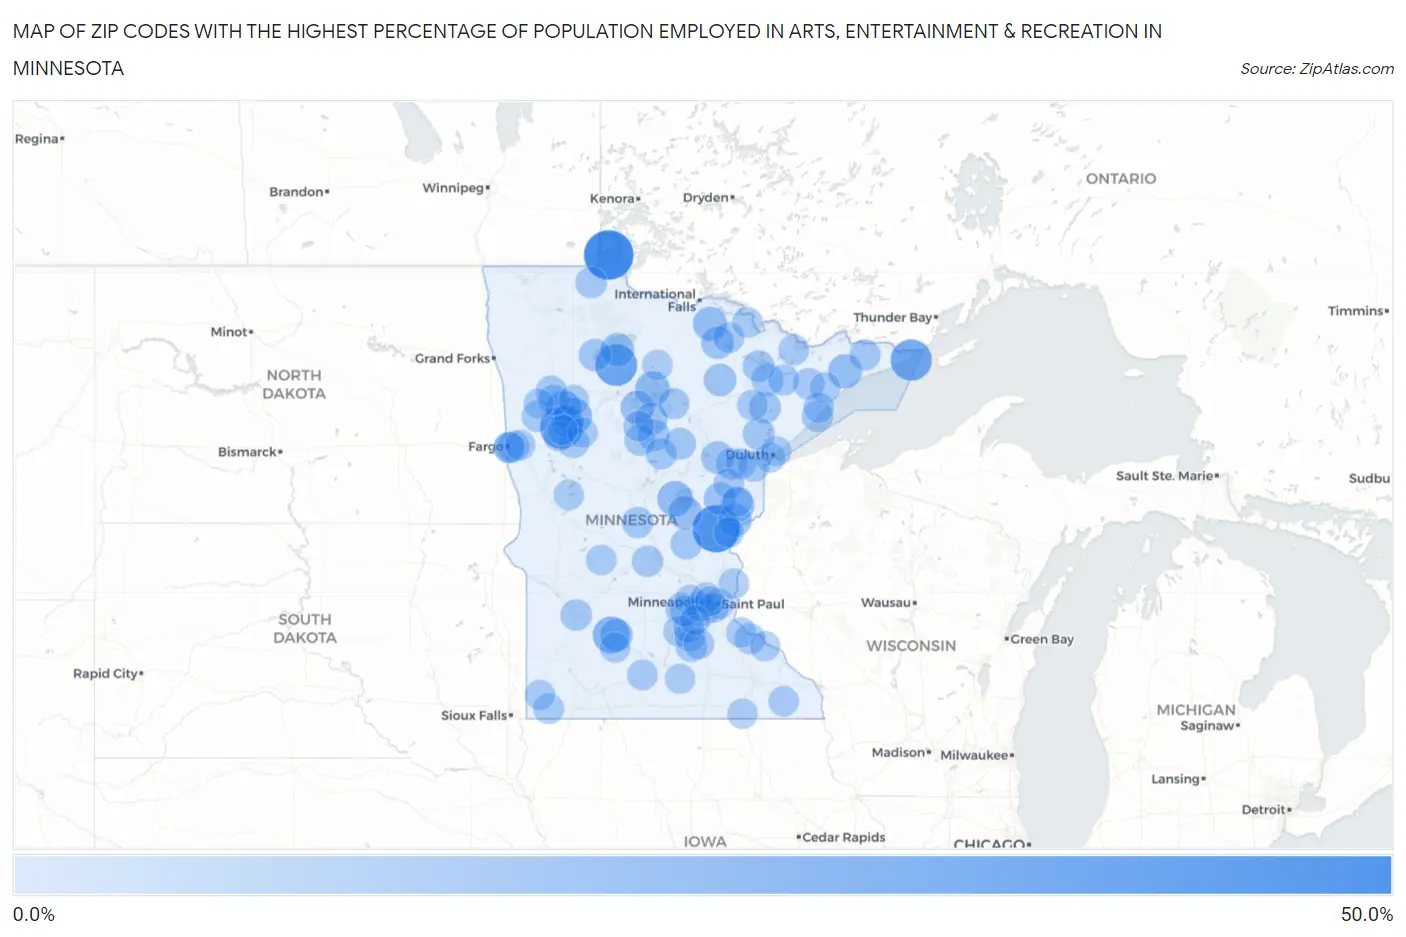
Map of Zip Codes with the Highest Percentage of Population Employed in Arts, Entertainment & Recreation in Minnesota
0.0%
50.0%
Zip Codes with the Highest Percentage of Population Employed in Arts, Entertainment & Recreation in Minnesota
| Zip Code | % Employed | vs State | vs National | |
| 1. | 56711 | 43.1% | 1.9%(+41.2)#1 | 2.1%(+41.0)#48 |
| 2. | 55036 | 38.5% | 1.9%(+36.5)#2 | 2.1%(+36.4)#56 |
| 3. | 56591 | 28.6% | 1.9%(+26.7)#3 | 2.1%(+26.6)#84 |
| 4. | 56670 | 27.1% | 1.9%(+25.2)#4 | 2.1%(+25.0)#101 |
| 5. | 55605 | 25.8% | 1.9%(+23.9)#5 | 2.1%(+23.7)#109 |
| 6. | 56270 | 16.7% | 1.9%(+14.8)#6 | 2.1%(+14.6)#262 |
| 7. | 56566 | 16.4% | 1.9%(+14.5)#7 | 2.1%(+14.3)#273 |
| 8. | 56557 | 15.6% | 1.9%(+13.7)#8 | 2.1%(+13.5)#311 |
| 9. | 56450 | 13.4% | 1.9%(+11.5)#9 | 2.1%(+11.4)#420 |
| 10. | 56681 | 12.6% | 1.9%(+10.7)#10 | 2.1%(+10.5)#474 |
| 11. | 55615 | 11.1% | 1.9%(+9.20)#11 | 2.1%(+9.03)#592 |
| 12. | 56669 | 11.0% | 1.9%(+9.06)#12 | 2.1%(+8.89)#604 |
| 13. | 55072 | 10.6% | 1.9%(+8.66)#13 | 2.1%(+8.49)#643 |
| 14. | 56633 | 10.4% | 1.9%(+8.44)#14 | 2.1%(+8.27)#660 |
| 15. | 56359 | 10.2% | 1.9%(+8.30)#15 | 2.1%(+8.13)#677 |
| 16. | 56666 | 10.0% | 1.9%(+8.09)#16 | 2.1%(+7.92)#699 |
| 17. | 55037 | 9.5% | 1.9%(+7.59)#17 | 2.1%(+7.43)#781 |
| 18. | 56589 | 9.3% | 1.9%(+7.34)#18 | 2.1%(+7.17)#813 |
| 19. | 55333 | 8.7% | 1.9%(+6.82)#19 | 2.1%(+6.65)#902 |
| 20. | 55772 | 8.7% | 1.9%(+6.78)#20 | 2.1%(+6.61)#913 |
| 21. | 56641 | 8.3% | 1.9%(+6.42)#21 | 2.1%(+6.25)#978 |
| 22. | 55787 | 8.3% | 1.9%(+6.39)#22 | 2.1%(+6.22)#986 |
| 23. | 55735 | 8.2% | 1.9%(+6.25)#23 | 2.1%(+6.08)#1,012 |
| 24. | 55781 | 8.1% | 1.9%(+6.19)#24 | 2.1%(+6.03)#1,030 |
| 25. | 56671 | 7.6% | 1.9%(+5.65)#25 | 2.1%(+5.48)#1,167 |
| 26. | 55732 | 7.4% | 1.9%(+5.48)#26 | 2.1%(+5.31)#1,208 |
| 27. | 56655 | 6.9% | 1.9%(+5.00)#27 | 2.1%(+4.83)#1,361 |
| 28. | 55763 | 6.8% | 1.9%(+4.91)#28 | 2.1%(+4.75)#1,384 |
| 29. | 55790 | 6.7% | 1.9%(+4.79)#29 | 2.1%(+4.62)#1,414 |
| 30. | 55785 | 6.7% | 1.9%(+4.75)#30 | 2.1%(+4.58)#1,433 |
| 31. | 55717 | 6.7% | 1.9%(+4.75)#31 | 2.1%(+4.58)#1,435 |
| 32. | 56763 | 6.1% | 1.9%(+4.14)#32 | 2.1%(+3.97)#1,673 |
| 33. | 55375 | 6.0% | 1.9%(+4.13)#33 | 2.1%(+3.96)#1,676 |
| 34. | 56241 | 6.0% | 1.9%(+4.11)#34 | 2.1%(+3.95)#1,687 |
| 35. | 55726 | 6.0% | 1.9%(+4.09)#35 | 2.1%(+3.92)#1,701 |
| 36. | 56452 | 6.0% | 1.9%(+4.08)#36 | 2.1%(+3.91)#1,706 |
| 37. | 56584 | 5.9% | 1.9%(+3.97)#37 | 2.1%(+3.80)#1,760 |
| 38. | 56363 | 5.9% | 1.9%(+3.97)#38 | 2.1%(+3.80)#1,765 |
| 39. | 55718 | 5.7% | 1.9%(+3.82)#39 | 2.1%(+3.65)#1,836 |
| 40. | 55607 | 5.7% | 1.9%(+3.80)#40 | 2.1%(+3.63)#1,847 |
| 41. | 56069 | 5.7% | 1.9%(+3.76)#41 | 2.1%(+3.59)#1,872 |
| 42. | 55601 | 5.6% | 1.9%(+3.72)#42 | 2.1%(+3.55)#1,892 |
| 43. | 56592 | 5.6% | 1.9%(+3.71)#43 | 2.1%(+3.55)#1,894 |
| 44. | 56328 | 5.6% | 1.9%(+3.70)#44 | 2.1%(+3.54)#1,898 |
| 45. | 56369 | 5.6% | 1.9%(+3.66)#45 | 2.1%(+3.50)#1,919 |
| 46. | 56448 | 5.6% | 1.9%(+3.64)#46 | 2.1%(+3.47)#1,933 |
| 47. | 56516 | 5.6% | 1.9%(+3.64)#47 | 2.1%(+3.47)#1,935 |
| 48. | 55604 | 5.4% | 1.9%(+3.51)#48 | 2.1%(+3.34)#2,006 |
| 49. | 56578 | 5.1% | 1.9%(+3.16)#49 | 2.1%(+2.99)#2,237 |
| 50. | 56529 | 4.9% | 1.9%(+2.97)#50 | 2.1%(+2.80)#2,373 |
| 51. | 56636 | 4.8% | 1.9%(+2.90)#51 | 2.1%(+2.73)#2,428 |
| 52. | 55066 | 4.8% | 1.9%(+2.84)#52 | 2.1%(+2.67)#2,483 |
| 53. | 55706 | 4.7% | 1.9%(+2.83)#53 | 2.1%(+2.66)#2,488 |
| 54. | 56563 | 4.7% | 1.9%(+2.78)#54 | 2.1%(+2.62)#2,536 |
| 55. | 56011 | 4.7% | 1.9%(+2.77)#55 | 2.1%(+2.60)#2,549 |
| 56. | 55771 | 4.7% | 1.9%(+2.75)#56 | 2.1%(+2.58)#2,561 |
| 57. | 55435 | 4.6% | 1.9%(+2.70)#57 | 2.1%(+2.53)#2,618 |
| 58. | 56562 | 4.6% | 1.9%(+2.66)#58 | 2.1%(+2.49)#2,656 |
| 59. | 56071 | 4.5% | 1.9%(+2.63)#59 | 2.1%(+2.46)#2,690 |
| 60. | 55780 | 4.5% | 1.9%(+2.58)#60 | 2.1%(+2.41)#2,750 |
| 61. | 55725 | 4.4% | 1.9%(+2.53)#61 | 2.1%(+2.36)#2,808 |
| 62. | 56158 | 4.4% | 1.9%(+2.52)#62 | 2.1%(+2.35)#2,814 |
| 63. | 55734 | 4.4% | 1.9%(+2.48)#63 | 2.1%(+2.31)#2,854 |
| 64. | 55352 | 4.3% | 1.9%(+2.42)#64 | 2.1%(+2.25)#2,927 |
| 65. | 55783 | 4.3% | 1.9%(+2.39)#65 | 2.1%(+2.23)#2,951 |
| 66. | 55603 | 4.3% | 1.9%(+2.38)#66 | 2.1%(+2.21)#2,975 |
| 67. | 55046 | 4.3% | 1.9%(+2.37)#67 | 2.1%(+2.20)#2,984 |
| 68. | 55731 | 4.2% | 1.9%(+2.32)#68 | 2.1%(+2.16)#3,032 |
| 69. | 56484 | 4.2% | 1.9%(+2.32)#69 | 2.1%(+2.15)#3,034 |
| 70. | 55386 | 4.2% | 1.9%(+2.29)#70 | 2.1%(+2.13)#3,067 |
| 71. | 55101 | 4.2% | 1.9%(+2.27)#71 | 2.1%(+2.10)#3,101 |
| 72. | 56316 | 4.1% | 1.9%(+2.17)#72 | 2.1%(+2.00)#3,214 |
| 73. | 55949 | 4.0% | 1.9%(+2.09)#73 | 2.1%(+1.92)#3,333 |
| 74. | 55614 | 4.0% | 1.9%(+2.05)#74 | 2.1%(+1.89)#3,379 |
| 75. | 56062 | 3.9% | 1.9%(+2.03)#75 | 2.1%(+1.86)#3,406 |
| 76. | 55047 | 3.9% | 1.9%(+1.99)#76 | 2.1%(+1.83)#3,470 |
| 77. | 55343 | 3.9% | 1.9%(+1.94)#77 | 2.1%(+1.77)#3,545 |
| 78. | 56547 | 3.8% | 1.9%(+1.88)#78 | 2.1%(+1.71)#3,637 |
| 79. | 56266 | 3.7% | 1.9%(+1.83)#79 | 2.1%(+1.66)#3,715 |
| 80. | 56134 | 3.7% | 1.9%(+1.79)#80 | 2.1%(+1.62)#3,770 |
| 81. | 56661 | 3.7% | 1.9%(+1.76)#81 | 2.1%(+1.59)#3,814 |
| 82. | 55089 | 3.6% | 1.9%(+1.72)#82 | 2.1%(+1.55)#3,890 |
| 83. | 56521 | 3.6% | 1.9%(+1.71)#83 | 2.1%(+1.55)#3,901 |
| 84. | 56575 | 3.6% | 1.9%(+1.71)#84 | 2.1%(+1.54)#3,904 |
| 85. | 56651 | 3.6% | 1.9%(+1.66)#85 | 2.1%(+1.49)#4,000 |
| 86. | 56515 | 3.6% | 1.9%(+1.65)#86 | 2.1%(+1.48)#4,010 |
| 87. | 55412 | 3.6% | 1.9%(+1.65)#87 | 2.1%(+1.48)#4,012 |
| 88. | 55356 | 3.5% | 1.9%(+1.63)#88 | 2.1%(+1.46)#4,041 |
| 89. | 55704 | 3.5% | 1.9%(+1.59)#89 | 2.1%(+1.42)#4,117 |
| 90. | 55116 | 3.5% | 1.9%(+1.58)#90 | 2.1%(+1.41)#4,146 |
| 91. | 55455 | 3.5% | 1.9%(+1.57)#91 | 2.1%(+1.41)#4,154 |
| 92. | 55807 | 3.5% | 1.9%(+1.56)#92 | 2.1%(+1.39)#4,181 |
| 93. | 56078 | 3.5% | 1.9%(+1.56)#93 | 2.1%(+1.39)#4,186 |
| 94. | 55041 | 3.5% | 1.9%(+1.54)#94 | 2.1%(+1.37)#4,233 |
| 95. | 56545 | 3.4% | 1.9%(+1.53)#95 | 2.1%(+1.37)#4,242 |
| 96. | 55977 | 3.4% | 1.9%(+1.53)#96 | 2.1%(+1.37)#4,245 |
| 97. | 56569 | 3.4% | 1.9%(+1.53)#97 | 2.1%(+1.36)#4,257 |
| 98. | 55379 | 3.4% | 1.9%(+1.52)#98 | 2.1%(+1.35)#4,271 |
| 99. | 55812 | 3.4% | 1.9%(+1.51)#99 | 2.1%(+1.35)#4,292 |
| 100. | 55063 | 3.4% | 1.9%(+1.51)#100 | 2.1%(+1.34)#4,312 |
Common Questions
What are the Top 10 Zip Codes with the Highest Percentage of Population Employed in Arts, Entertainment & Recreation in Minnesota?
Top 10 Zip Codes with the Highest Percentage of Population Employed in Arts, Entertainment & Recreation in Minnesota are:
What zip code has the Highest Percentage of Population Employed in Arts, Entertainment & Recreation in Minnesota?
56711 has the Highest Percentage of Population Employed in Arts, Entertainment & Recreation in Minnesota with 43.1%.
What is the Percentage of Population Employed in Arts, Entertainment & Recreation in the State of Minnesota?
Percentage of Population Employed in Arts, Entertainment & Recreation in Minnesota is 1.9%.
What is the Percentage of Population Employed in Arts, Entertainment & Recreation in the United States?
Percentage of Population Employed in Arts, Entertainment & Recreation in the United States is 2.1%.