Zip Codes with the Highest Percentage of Population Employed in Arts, Entertainment & Recreation in Waterford, MI
RELATED REPORTS & OPTIONS
Arts, Entertainment & Recreation
Waterford
Compare Zip Codes
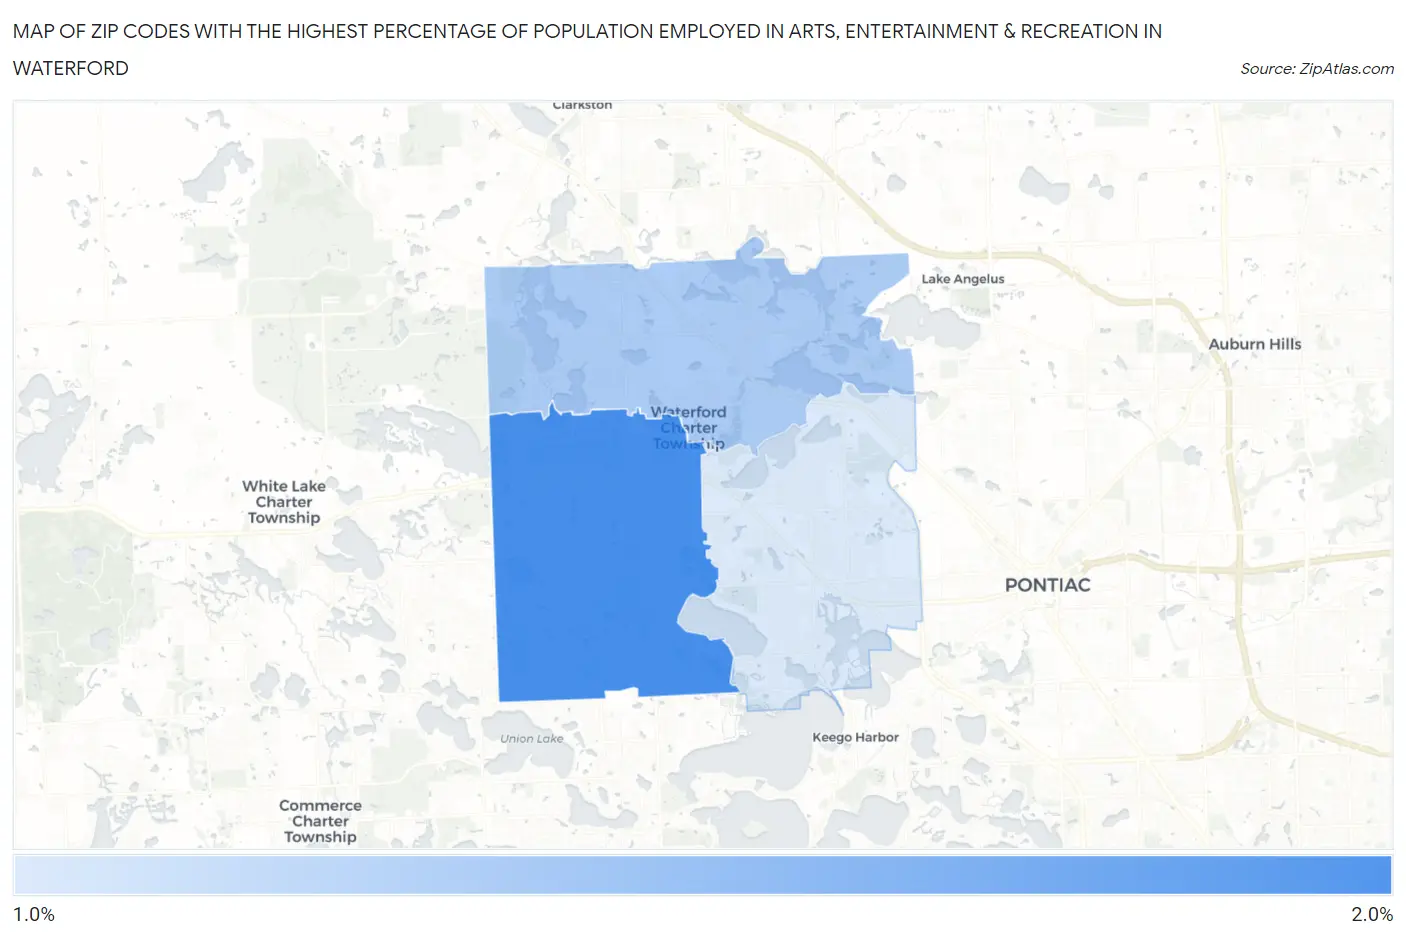
Map of Zip Codes with the Highest Percentage of Population Employed in Arts, Entertainment & Recreation in Waterford
0.0%
2.0%
Zip Codes with the Highest Percentage of Population Employed in Arts, Entertainment & Recreation in Waterford, MI
| Zip Code | % Employed | vs State | vs National | |
| 1. | 48327 | 2.0% | 1.8%(+0.197)#316 | 2.1%(-0.099)#9,873 |
| 2. | 48329 | 1.7% | 1.8%(-0.130)#414 | 2.1%(-0.426)#12,038 |
| 3. | 48328 | 1.5% | 1.8%(-0.282)#458 | 2.1%(-0.578)#13,213 |
1
Common Questions
What are the Top Zip Codes with the Highest Percentage of Population Employed in Arts, Entertainment & Recreation in Waterford, MI?
Top Zip Codes with the Highest Percentage of Population Employed in Arts, Entertainment & Recreation in Waterford, MI are:
What zip code has the Highest Percentage of Population Employed in Arts, Entertainment & Recreation in Waterford, MI?
48327 has the Highest Percentage of Population Employed in Arts, Entertainment & Recreation in Waterford, MI with 2.0%.
What is the Percentage of Population Employed in Arts, Entertainment & Recreation in Michigan?
Percentage of Population Employed in Arts, Entertainment & Recreation in Michigan is 1.8%.
What is the Percentage of Population Employed in Arts, Entertainment & Recreation in the United States?
Percentage of Population Employed in Arts, Entertainment & Recreation in the United States is 2.1%.