Zip Codes with the Highest Percentage of Population Employed in Agriculture, Fishing & Hunting in Rochester, MI
RELATED REPORTS & OPTIONS
Agriculture, Fishing & Hunting
Rochester
Compare Zip Codes
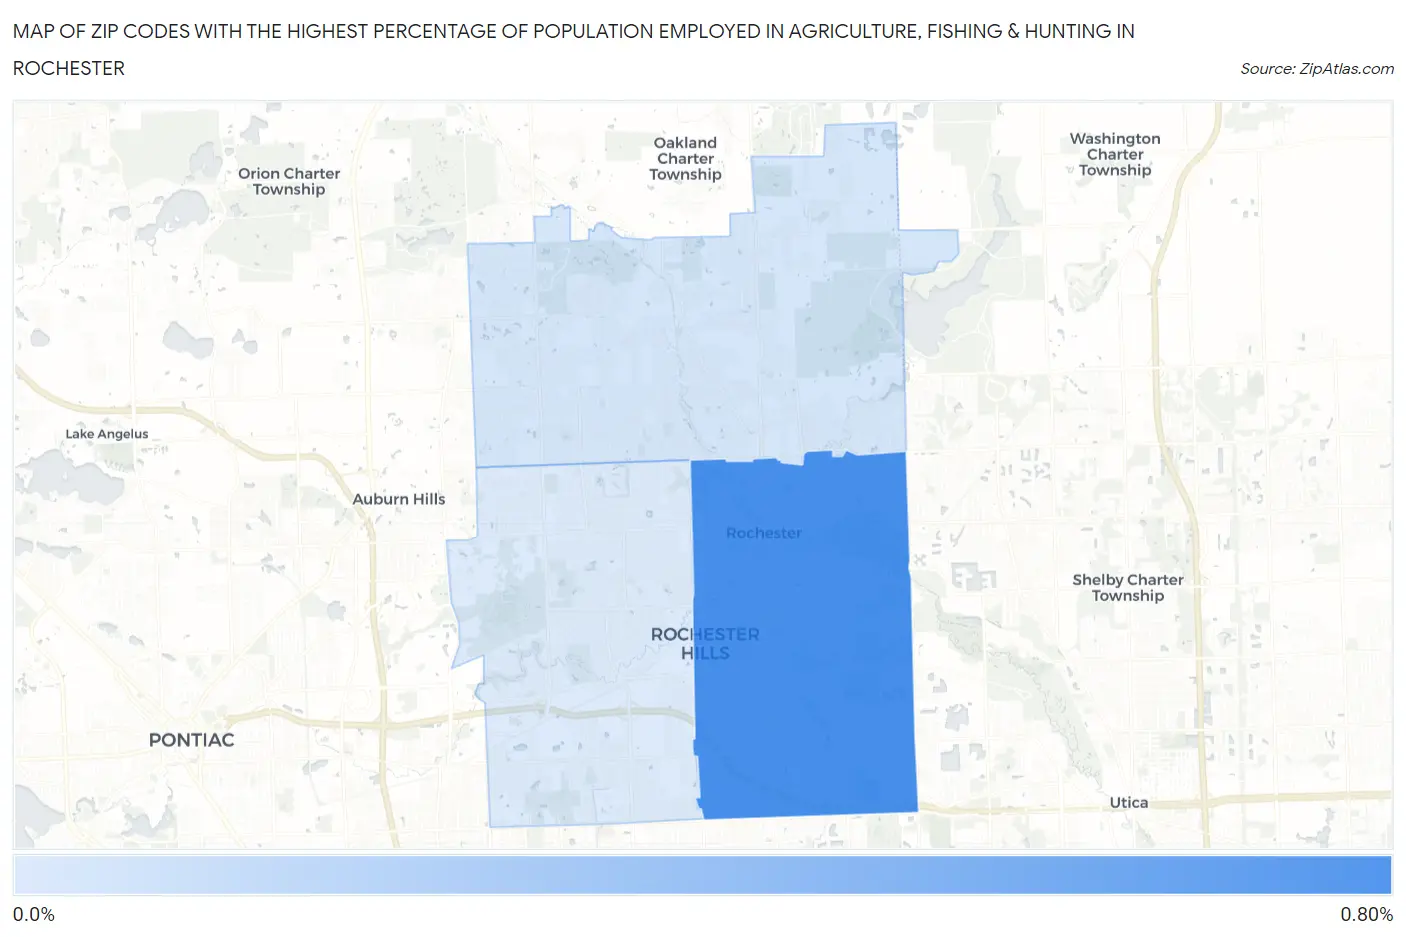
Map of Zip Codes with the Highest Percentage of Population Employed in Agriculture, Fishing & Hunting in Rochester
0.0%
0.80%
Zip Codes with the Highest Percentage of Population Employed in Agriculture, Fishing & Hunting in Rochester, MI
| Zip Code | % Employed | vs State | vs National | |
| 1. | 48307 | 0.76% | 0.98%(-0.227)#563 | 1.2%(-0.442)#17,491 |
| 2. | 48306 | 0.10% | 0.98%(-0.882)#791 | 1.2%(-1.10)#23,643 |
| 3. | 48309 | 0.074% | 0.98%(-0.910)#799 | 1.2%(-1.13)#24,043 |
1
Common Questions
What are the Top Zip Codes with the Highest Percentage of Population Employed in Agriculture, Fishing & Hunting in Rochester, MI?
Top Zip Codes with the Highest Percentage of Population Employed in Agriculture, Fishing & Hunting in Rochester, MI are:
What zip code has the Highest Percentage of Population Employed in Agriculture, Fishing & Hunting in Rochester, MI?
48307 has the Highest Percentage of Population Employed in Agriculture, Fishing & Hunting in Rochester, MI with 0.76%.
What is the Percentage of Population Employed in Agriculture, Fishing & Hunting in Rochester, MI?
Percentage of Population Employed in Agriculture, Fishing & Hunting in Rochester is 0.23%.
What is the Percentage of Population Employed in Agriculture, Fishing & Hunting in Michigan?
Percentage of Population Employed in Agriculture, Fishing & Hunting in Michigan is 0.98%.
What is the Percentage of Population Employed in Agriculture, Fishing & Hunting in the United States?
Percentage of Population Employed in Agriculture, Fishing & Hunting in the United States is 1.2%.