Zip Codes with the Highest Percentage of Population Employed in Arts, Entertainment & Recreation in East Lansing, MI
RELATED REPORTS & OPTIONS
Arts, Entertainment & Recreation
East Lansing
Compare Zip Codes
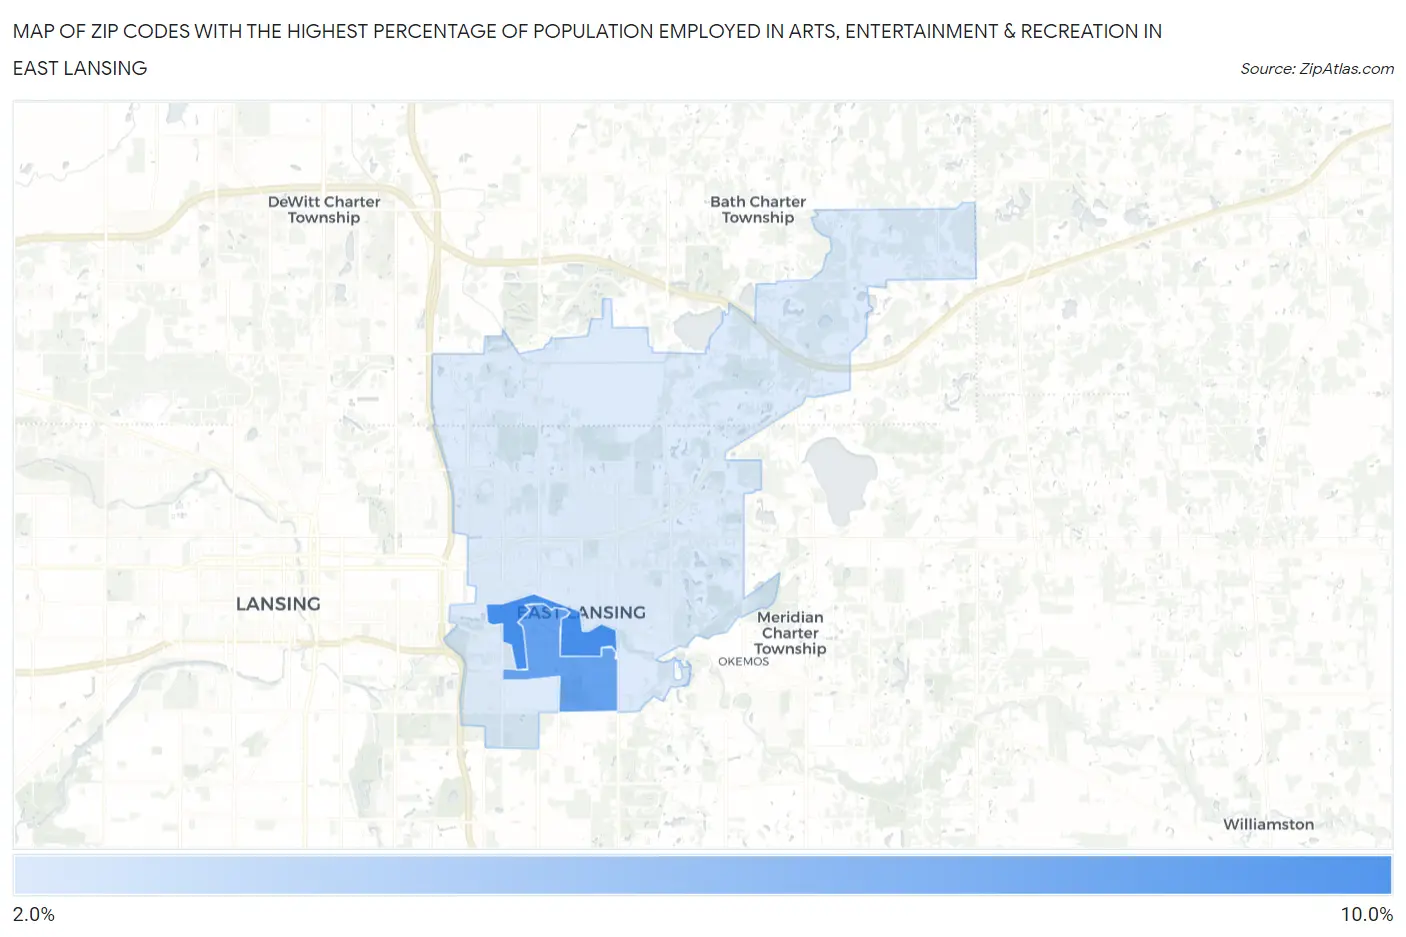
Map of Zip Codes with the Highest Percentage of Population Employed in Arts, Entertainment & Recreation in East Lansing
0.0%
10.0%
Zip Codes with the Highest Percentage of Population Employed in Arts, Entertainment & Recreation in East Lansing, MI
| Zip Code | % Employed | vs State | vs National | |
| 1. | 48825 | 8.4% | 1.8%(+6.56)#20 | 2.1%(+6.27)#974 |
| 2. | 48824 | 7.2% | 1.8%(+5.44)#33 | 2.1%(+5.15)#1,255 |
| 3. | 48823 | 2.7% | 1.8%(+0.940)#177 | 2.1%(+0.643)#6,268 |
1
Common Questions
What are the Top Zip Codes with the Highest Percentage of Population Employed in Arts, Entertainment & Recreation in East Lansing, MI?
Top Zip Codes with the Highest Percentage of Population Employed in Arts, Entertainment & Recreation in East Lansing, MI are:
What zip code has the Highest Percentage of Population Employed in Arts, Entertainment & Recreation in East Lansing, MI?
48825 has the Highest Percentage of Population Employed in Arts, Entertainment & Recreation in East Lansing, MI with 8.4%.
What is the Percentage of Population Employed in Arts, Entertainment & Recreation in East Lansing, MI?
Percentage of Population Employed in Arts, Entertainment & Recreation in East Lansing is 4.2%.
What is the Percentage of Population Employed in Arts, Entertainment & Recreation in Michigan?
Percentage of Population Employed in Arts, Entertainment & Recreation in Michigan is 1.8%.
What is the Percentage of Population Employed in Arts, Entertainment & Recreation in the United States?
Percentage of Population Employed in Arts, Entertainment & Recreation in the United States is 2.1%.