Zip Codes with the Highest Percentage of Population Employed in Professional & Scientific Services in Laurel, MD
RELATED REPORTS & OPTIONS
Professional & Scientific Services
Laurel
Compare Zip Codes
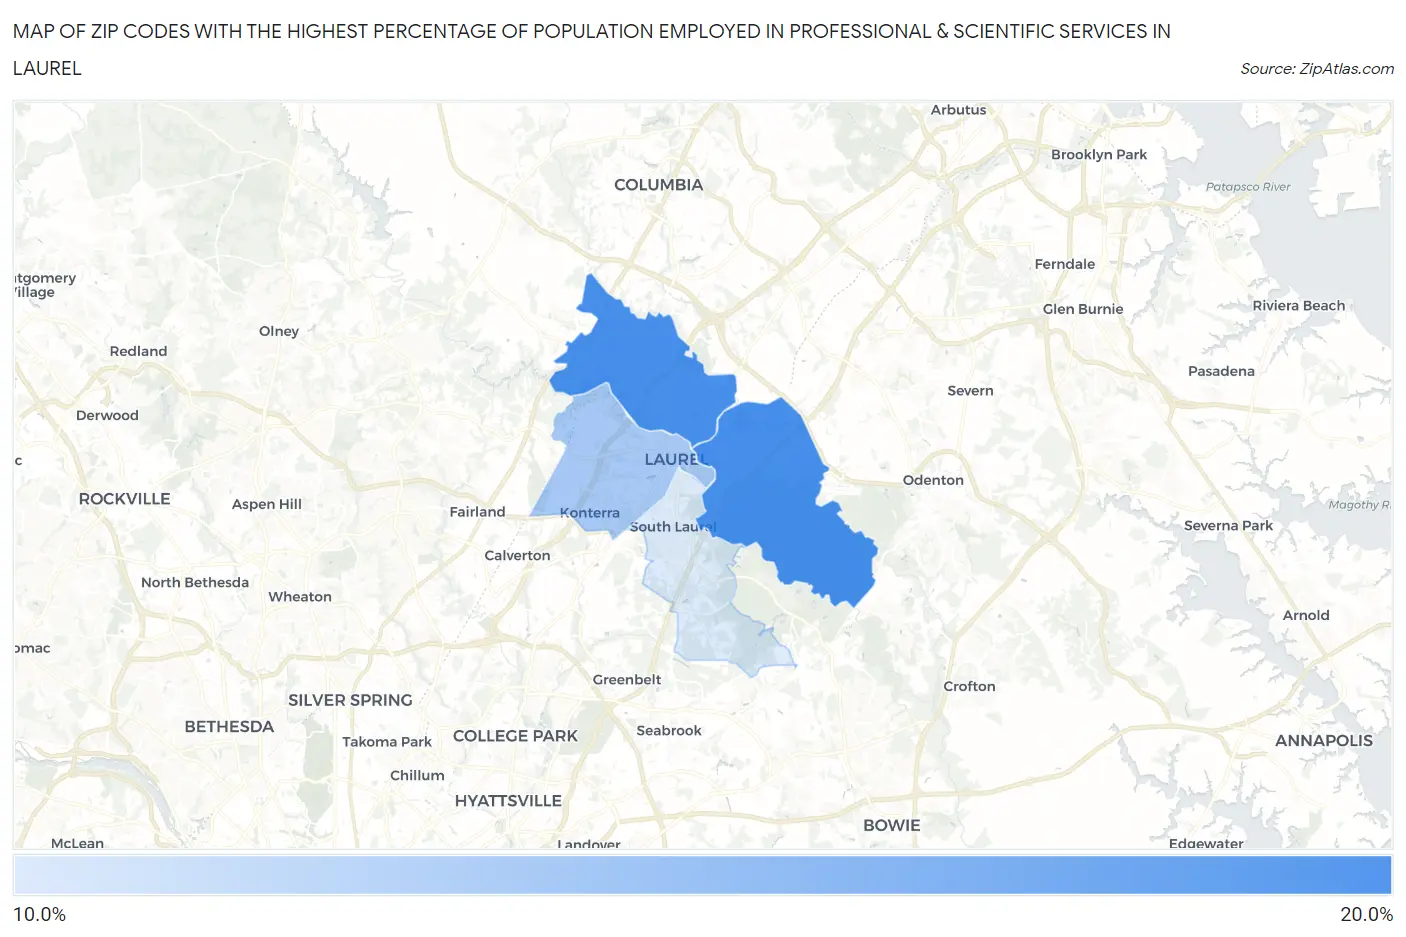
Map of Zip Codes with the Highest Percentage of Population Employed in Professional & Scientific Services in Laurel
10.9%
16.6%
Zip Codes with the Highest Percentage of Population Employed in Professional & Scientific Services in Laurel, MD
| Zip Code | % Employed | vs State | vs National | |
| 1. | 20723 | 16.6% | 11.8%(+4.84)#70 | 7.8%(+8.74)#1,459 |
| 2. | 20724 | 16.5% | 11.8%(+4.80)#72 | 7.8%(+8.70)#1,473 |
| 3. | 20707 | 12.9% | 11.8%(+1.16)#144 | 7.8%(+5.06)#2,749 |
| 4. | 20708 | 10.9% | 11.8%(-0.884)#197 | 7.8%(+3.02)#3,937 |
1
Common Questions
What are the Top 3 Zip Codes with the Highest Percentage of Population Employed in Professional & Scientific Services in Laurel, MD?
Top 3 Zip Codes with the Highest Percentage of Population Employed in Professional & Scientific Services in Laurel, MD are:
What zip code has the Highest Percentage of Population Employed in Professional & Scientific Services in Laurel, MD?
20723 has the Highest Percentage of Population Employed in Professional & Scientific Services in Laurel, MD with 16.6%.
What is the Percentage of Population Employed in Professional & Scientific Services in Laurel, MD?
Percentage of Population Employed in Professional & Scientific Services in Laurel is 11.9%.
What is the Percentage of Population Employed in Professional & Scientific Services in Maryland?
Percentage of Population Employed in Professional & Scientific Services in Maryland is 11.8%.
What is the Percentage of Population Employed in Professional & Scientific Services in the United States?
Percentage of Population Employed in Professional & Scientific Services in the United States is 7.8%.