Zip Codes with the Highest Percentage of Population Employed in Community & Social Service in Frederick, MD

RELATED REPORTS & OPTIONS

Community & Social Service
Population
Families and Households
Female Fertility
Female Fertility (Unmarried)
Race (Community Size)
Race (Percentage)
Ancestry (Community Size)
AfghanAfricanAmericanArabArgentineanArmenianAustralianAustrianBarbadianBelgianBhutaneseBlackfeetBolivianBrazilianBritishBulgarianBurmeseCanadianCarpatho RusynCelticCentral AmericanCentral American IndianCherokeeChileanChippewaColombianCosta RicanCroatianCubanCzechCzechoslovakianDanishDelawareDominicanDutchEastern EuropeanEcuadorianEgyptianEnglishEuropeanFilipinoFinnishFrenchFrench CanadianGermanGhanaianGreekGuamanian / ChamorroGuatemalanHaitianHonduranHungarianIndian (Asian)IndonesianIranianIrishIsraeliItalianJamaicanJapaneseKenyanKoreanLaotianLatvianLebaneseLiberianLithuanianLumbeeMexicanMexican American IndianMoroccanNative HawaiianNicaraguanNigerianNorthern EuropeanNorwegianPakistaniPalestinianPanamanianPennsylvania GermanPeruvianPolishPortuguesePuerto RicanRomanianRussianSalvadoranScandinavianScotch-IrishScottishSerbianSlovakSloveneSouth AfricanSouth AmericanSouth American IndianSpaniardSpanishSpanish American IndianSri LankanSubsaharan AfricanSwedishSwissThaiTrinidadian and TobagonianTurkishUkrainianUruguayanVenezuelanWelshYugoslavian
Ancestry (Percentage)
AfghanAfricanAmericanArabArgentineanArmenianAustralianAustrianBarbadianBelgianBhutaneseBlackfeetBolivianBrazilianBritishBulgarianBurmeseCanadianCarpatho RusynCelticCentral AmericanCentral American IndianCherokeeChileanChippewaColombianCosta RicanCroatianCubanCzechCzechoslovakianDanishDelawareDominicanDutchEastern EuropeanEcuadorianEgyptianEnglishEuropeanFilipinoFinnishFrenchFrench CanadianGermanGhanaianGreekGuamanian / ChamorroGuatemalanHaitianHonduranHungarianIndian (Asian)IndonesianIranianIrishIsraeliItalianJamaicanJapaneseKenyanKoreanLaotianLatvianLebaneseLiberianLithuanianLumbeeMexicanMexican American IndianMoroccanNative HawaiianNicaraguanNigerianNorthern EuropeanNorwegianPakistaniPalestinianPanamanianPennsylvania GermanPeruvianPolishPortuguesePuerto RicanRomanianRussianSalvadoranScandinavianScotch-IrishScottishSerbianSlovakSloveneSouth AfricanSouth AmericanSouth American IndianSpaniardSpanishSpanish American IndianSri LankanSubsaharan AfricanSwedishSwissThaiTrinidadian and TobagonianTurkishUkrainianUruguayanVenezuelanWelshYugoslavian
Immigrant Origin (Total)
AfghanistanAfricaArgentinaAsiaAustraliaBangladeshBoliviaBosnia and HerzegovinaBrazilBulgariaBurma / MyanmarCambodiaCameroonCanadaCaribbeanCentral AmericaChileChinaColombiaCosta RicaCubaCzechoslovakiaDominican RepublicEastern AfricaEastern AsiaEastern EuropeEcuadorEgyptEl SalvadorEnglandEthiopiaEuropeFranceGermanyGhanaGreeceGuatemalaGuyanaHaitiHondurasHong KongHungaryIndiaIranIrelandIsraelItalyJamaicaJapanKenyaKoreaLatin AmericaLiberiaMexicoMiddle AfricaMoroccoNepalNetherlandsNicaraguaNigeriaNorthern AfricaNorthern EuropeOceaniaPakistanPanamaPeruPhilippinesPolandRomaniaRussiaScotlandSenegalSierra LeoneSouth AfricaSouth AmericaSouth Central AsiaSouth Eastern AsiaSouthern EuropeSpainSwedenTaiwanThailandTrinidad and TobagoTurkeyUkraineUruguayVenezuelaVietnamWestern AfricaWestern AsiaWestern EuropeZaire
Immigrant Origin (Percentage)
AfghanistanAfricaArgentinaAsiaAustraliaBangladeshBoliviaBosnia and HerzegovinaBrazilBulgariaBurma / MyanmarCambodiaCameroonCanadaCaribbeanCentral AmericaChileChinaColombiaCosta RicaCubaCzechoslovakiaDominican RepublicEastern AfricaEastern AsiaEastern EuropeEcuadorEgyptEl SalvadorEnglandEthiopiaEuropeFranceGermanyGhanaGreeceGuatemalaGuyanaHaitiHondurasHong KongHungaryIndiaIranIrelandIsraelItalyJamaicaJapanKenyaKoreaLatin AmericaLiberiaMexicoMiddle AfricaMoroccoNepalNetherlandsNicaraguaNigeriaNorthern AfricaNorthern EuropeOceaniaPakistanPanamaPeruPhilippinesPolandRomaniaRussiaScotlandSenegalSierra LeoneSouth AfricaSouth AmericaSouth Central AsiaSouth Eastern AsiaSouthern EuropeSpainSwedenTaiwanThailandTrinidad and TobagoTurkeyUkraineUruguayVenezuelaVietnamWestern AfricaWestern AsiaWestern EuropeZaire
Income
Income (Families)
Income (Households)
Poverty
Poverty (Families)
Unemployment
Employment Occupations
Employment Industries
Employer Class
Commute Time
Commute Means
School Enrollment
Education by Degree Field
Occupancy
Finances
Physical Characteristics
Frederick
Compare Zip Codes
Comparison Subject

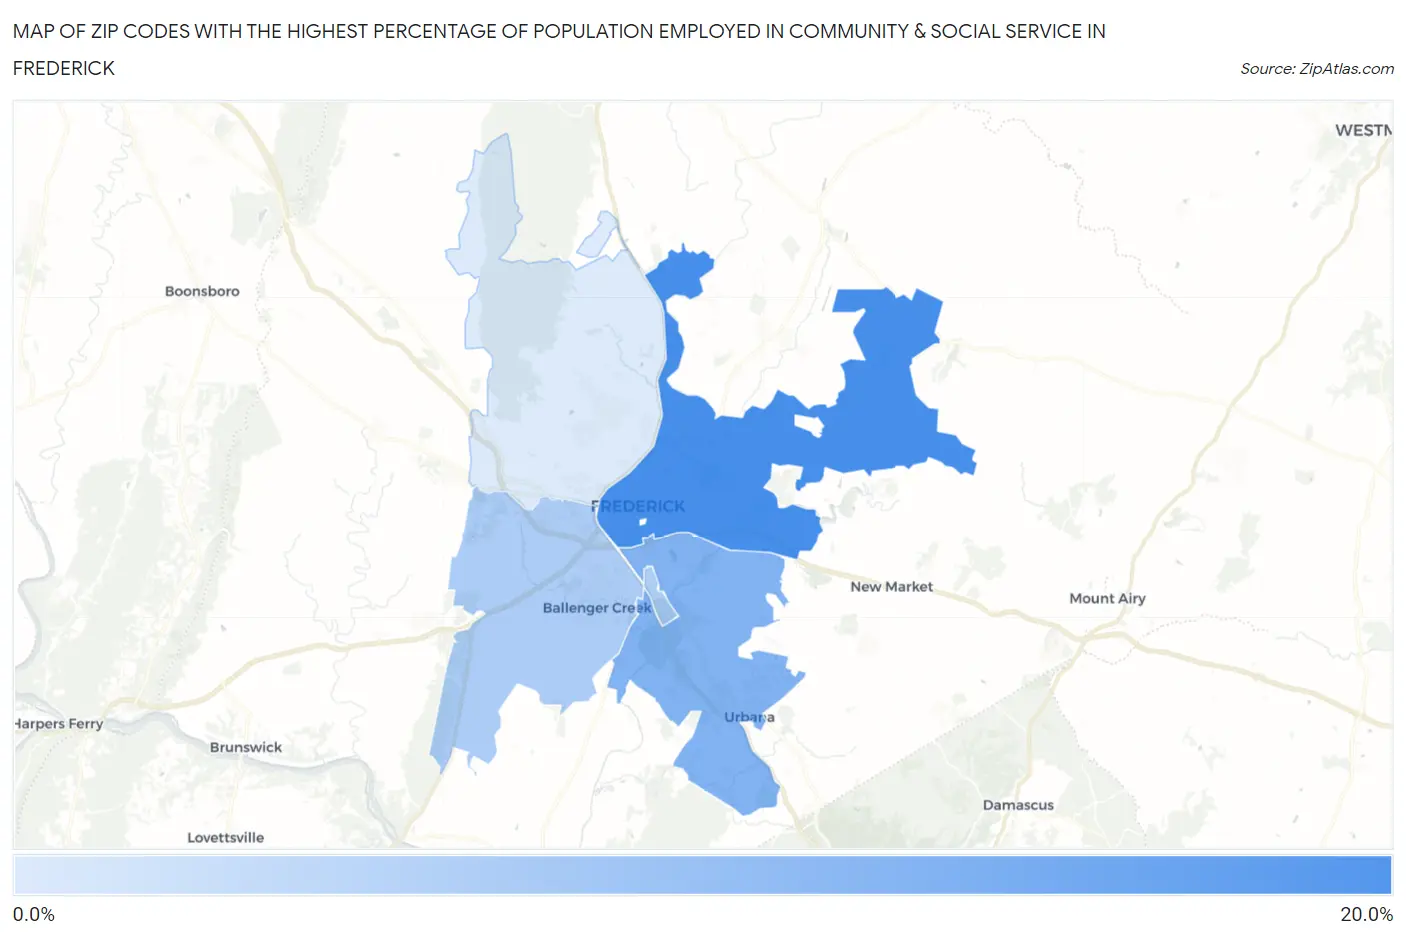
Map of Zip Codes with the Highest Percentage of Population Employed in Community & Social Service in Frederick

0.0%
20.0%
Zip Codes with the Highest Percentage of Population Employed in Community & Social Service  in Frederick Map

Zip Codes with the Highest Percentage of Population Employed in Community & Social Service in Frederick, MD

Zip Code % Employed vs State vs National
1.2170115.0%12.6%(+2.44)#8511.2%(+3.83)#4,929
2.2170412.7%12.6%(+0.066)#15411.2%(+1.46)#8,120
3.2170310.9%12.6%(-1.68)#22211.2%(-0.292)#11,842
4.217029.1%12.6%(-3.55)#29811.2%(-2.16)#16,677

Common Questions

What are the Top 3 Zip Codes with the Highest Percentage of Population Employed in Community & Social Service in Frederick, MD?
Top 3 Zip Codes with the Highest Percentage of Population Employed in Community & Social Service in Frederick, MD are:
#1
15.0%
#2
12.7%
#3
10.9%
What zip code has the Highest Percentage of Population Employed in Community & Social Service in Frederick, MD?
21701 has the Highest Percentage of Population Employed in Community & Social Service in Frederick, MD with 15.0%.
What is the Percentage of Population Employed in Community & Social Service in Frederick, MD?
Percentage of Population Employed in Community & Social Service in Frederick is 11.4%.
What is the Percentage of Population Employed in Community & Social Service in Maryland?
Percentage of Population Employed in Community & Social Service in Maryland is 12.6%.
What is the Percentage of Population Employed in Community & Social Service in the United States?
Percentage of Population Employed in Community & Social Service in the United States is 11.2%.