Zip Codes with the Highest Percentage of Population Employed in Agriculture, Fishing & Hunting in Framingham, MA
RELATED REPORTS & OPTIONS
Agriculture, Fishing & Hunting
Framingham
Compare Zip Codes
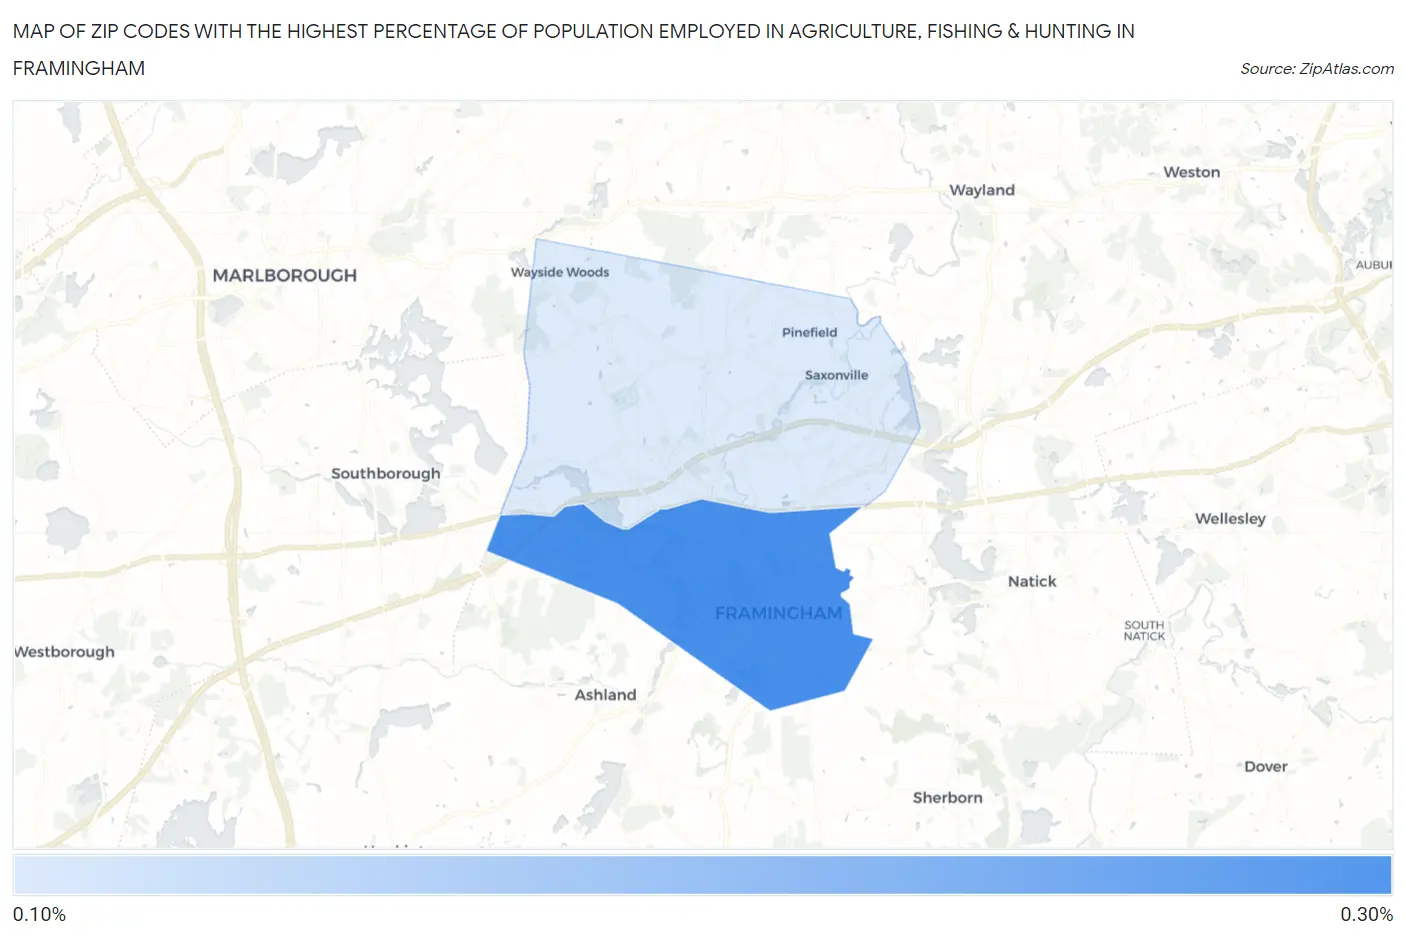
Map of Zip Codes with the Highest Percentage of Population Employed in Agriculture, Fishing & Hunting in Framingham
0.0%
0.30%
Zip Codes with the Highest Percentage of Population Employed in Agriculture, Fishing & Hunting in Framingham, MA
| Zip Code | % Employed | vs State | vs National | |
| 1. | 01702 | 0.28% | 0.39%(-0.115)#253 | 1.2%(-0.920)#21,422 |
| 2. | 01701 | 0.14% | 0.39%(-0.250)#303 | 1.2%(-1.05)#23,088 |
1
Common Questions
What are the Top Zip Codes with the Highest Percentage of Population Employed in Agriculture, Fishing & Hunting in Framingham, MA?
Top Zip Codes with the Highest Percentage of Population Employed in Agriculture, Fishing & Hunting in Framingham, MA are:
What zip code has the Highest Percentage of Population Employed in Agriculture, Fishing & Hunting in Framingham, MA?
01702 has the Highest Percentage of Population Employed in Agriculture, Fishing & Hunting in Framingham, MA with 0.28%.
What is the Percentage of Population Employed in Agriculture, Fishing & Hunting in Framingham, MA?
Percentage of Population Employed in Agriculture, Fishing & Hunting in Framingham is 0.22%.
What is the Percentage of Population Employed in Agriculture, Fishing & Hunting in Massachusetts?
Percentage of Population Employed in Agriculture, Fishing & Hunting in Massachusetts is 0.39%.
What is the Percentage of Population Employed in Agriculture, Fishing & Hunting in the United States?
Percentage of Population Employed in Agriculture, Fishing & Hunting in the United States is 1.2%.