Zip Codes with the Highest Poverty Level Among Children Under the Age of 5 in New Orleans, LA

RELATED REPORTS & OPTIONS

Highest Poverty | Child 0-5
Population
Families and Households
Female Fertility
Female Fertility (Unmarried)
Race (Community Size)
Race (Percentage)
Ancestry (Community Size)
AfricanAlaska NativeAlbanianAlsatianAmericanApacheArabArgentineanArmenianAustralianAustrianBarbadianBasqueBelgianBelizeanBhutaneseBlackfeetBolivianBrazilianBritishBritish West IndianBulgarianBurmeseCajunCanadianCelticCentral AmericanCentral American IndianCherokeeChickasawChileanChippewaChoctawColombianCosta RicanCreekCroatianCubanCzechCzechoslovakianDanishDominicanDutchEastern EuropeanEcuadorianEgyptianEnglishEstonianEthiopianEuropeanFilipinoFinnishFrenchFrench CanadianGermanGhanaianGreekGuamanian / ChamorroGuatemalanGuyaneseHaitianHonduranHoumaHungarianIndian (Asian)IranianIrishIroquoisIsraeliItalianJamaicanJapaneseKenyanKoreanLaotianLatvianLebaneseLithuanianLuxembourgerMexicanMexican American IndianMongolianMoroccanNative HawaiianNavajoNicaraguanNigerianNorthern EuropeanNorwegianPakistaniPalestinianPanamanianParaguayanPennsylvania GermanPeruvianPolishPortuguesePuerto RicanRomanianRussianSalvadoranSamoanScandinavianScotch-IrishScottishSeminoleSenegaleseSerbianSiouxSlavicSlovakSloveneSouth AfricanSouth AmericanSouth American IndianSpaniardSpanishSri LankanSubsaharan AfricanSwedishSwissSyrianThaiTrinidadian and TobagonianTurkishUgandanUkrainianUruguayanVenezuelanVietnameseWelshWest IndianYugoslavian
Ancestry (Percentage)
AfricanAlaska NativeAlbanianAlsatianAmericanApacheArabArgentineanArmenianAustralianAustrianBarbadianBasqueBelgianBelizeanBhutaneseBlackfeetBolivianBrazilianBritishBritish West IndianBulgarianBurmeseCajunCanadianCelticCentral AmericanCentral American IndianCherokeeChickasawChileanChippewaChoctawColombianCosta RicanCreekCroatianCubanCzechCzechoslovakianDanishDominicanDutchEastern EuropeanEcuadorianEgyptianEnglishEstonianEthiopianEuropeanFilipinoFinnishFrenchFrench CanadianGermanGhanaianGreekGuamanian / ChamorroGuatemalanGuyaneseHaitianHonduranHoumaHungarianIndian (Asian)IranianIrishIroquoisIsraeliItalianJamaicanJapaneseKenyanKoreanLaotianLatvianLebaneseLithuanianLuxembourgerMexicanMexican American IndianMongolianMoroccanNative HawaiianNavajoNicaraguanNigerianNorthern EuropeanNorwegianPakistaniPalestinianPanamanianParaguayanPennsylvania GermanPeruvianPolishPortuguesePuerto RicanRomanianRussianSalvadoranSamoanScandinavianScotch-IrishScottishSeminoleSenegaleseSerbianSiouxSlavicSlovakSloveneSouth AfricanSouth AmericanSouth American IndianSpaniardSpanishSri LankanSubsaharan AfricanSwedishSwissSyrianThaiTrinidadian and TobagonianTurkishUgandanUkrainianUruguayanVenezuelanVietnameseWelshWest IndianYugoslavian
Immigrant Origin (Total)
AfricaAlbaniaArgentinaAsiaAustraliaAustriaBangladeshBarbadosBelgiumBelizeBoliviaBrazilBulgariaCambodiaCameroonCanadaCaribbeanCentral AmericaChileChinaColombiaCosta RicaCubaCzechoslovakiaDominicaDominican RepublicEastern AfricaEastern AsiaEastern EuropeEcuadorEl SalvadorEnglandEritreaEthiopiaEuropeFranceGermanyGreeceGuatemalaGuyanaHaitiHondurasHong KongHungaryIndiaIndonesiaIranIraqIrelandIsraelItalyJamaicaJapanKenyaKoreaLaosLatin AmericaLebanonMalaysiaMexicoMiddle AfricaNetherlandsNicaraguaNigeriaNorthern AfricaNorthern EuropeNorwayOceaniaPakistanPanamaPeruPhilippinesPolandRomaniaRussiaSaudi ArabiaScotlandSenegalSouth AfricaSouth AmericaSouth Central AsiaSouth Eastern AsiaSouthern EuropeSpainSwedenSwitzerlandSyriaTaiwanThailandTrinidad and TobagoTurkeyUgandaUkraineVenezuelaVietnamWest IndiesWestern AfricaWestern AsiaWestern Europe
Immigrant Origin (Percentage)
AfricaAlbaniaArgentinaAsiaAustraliaAustriaBangladeshBarbadosBelgiumBelizeBoliviaBrazilBulgariaCambodiaCameroonCanadaCaribbeanCentral AmericaChileChinaColombiaCosta RicaCubaCzechoslovakiaDominicaDominican RepublicEastern AfricaEastern AsiaEastern EuropeEcuadorEl SalvadorEnglandEritreaEthiopiaEuropeFranceGermanyGreeceGuatemalaGuyanaHaitiHondurasHong KongHungaryIndiaIndonesiaIranIraqIrelandIsraelItalyJamaicaJapanKenyaKoreaLaosLatin AmericaLebanonMalaysiaMexicoMiddle AfricaNetherlandsNicaraguaNigeriaNorthern AfricaNorthern EuropeNorwayOceaniaPakistanPanamaPeruPhilippinesPolandRomaniaRussiaSaudi ArabiaScotlandSenegalSouth AfricaSouth AmericaSouth Central AsiaSouth Eastern AsiaSouthern EuropeSpainSwedenSwitzerlandSyriaTaiwanThailandTrinidad and TobagoTurkeyUgandaUkraineVenezuelaVietnamWest IndiesWestern AfricaWestern AsiaWestern Europe
Income
Income (Families)
Income (Households)
Poverty
Poverty (Families)
Unemployment
Employment Occupations
Employment Industries
Employer Class
Commute Time
Commute Means
School Enrollment
Education by Degree Field
Occupancy
Finances
Physical Characteristics
New Orleans
Compare Zip Codes
Comparison Subject

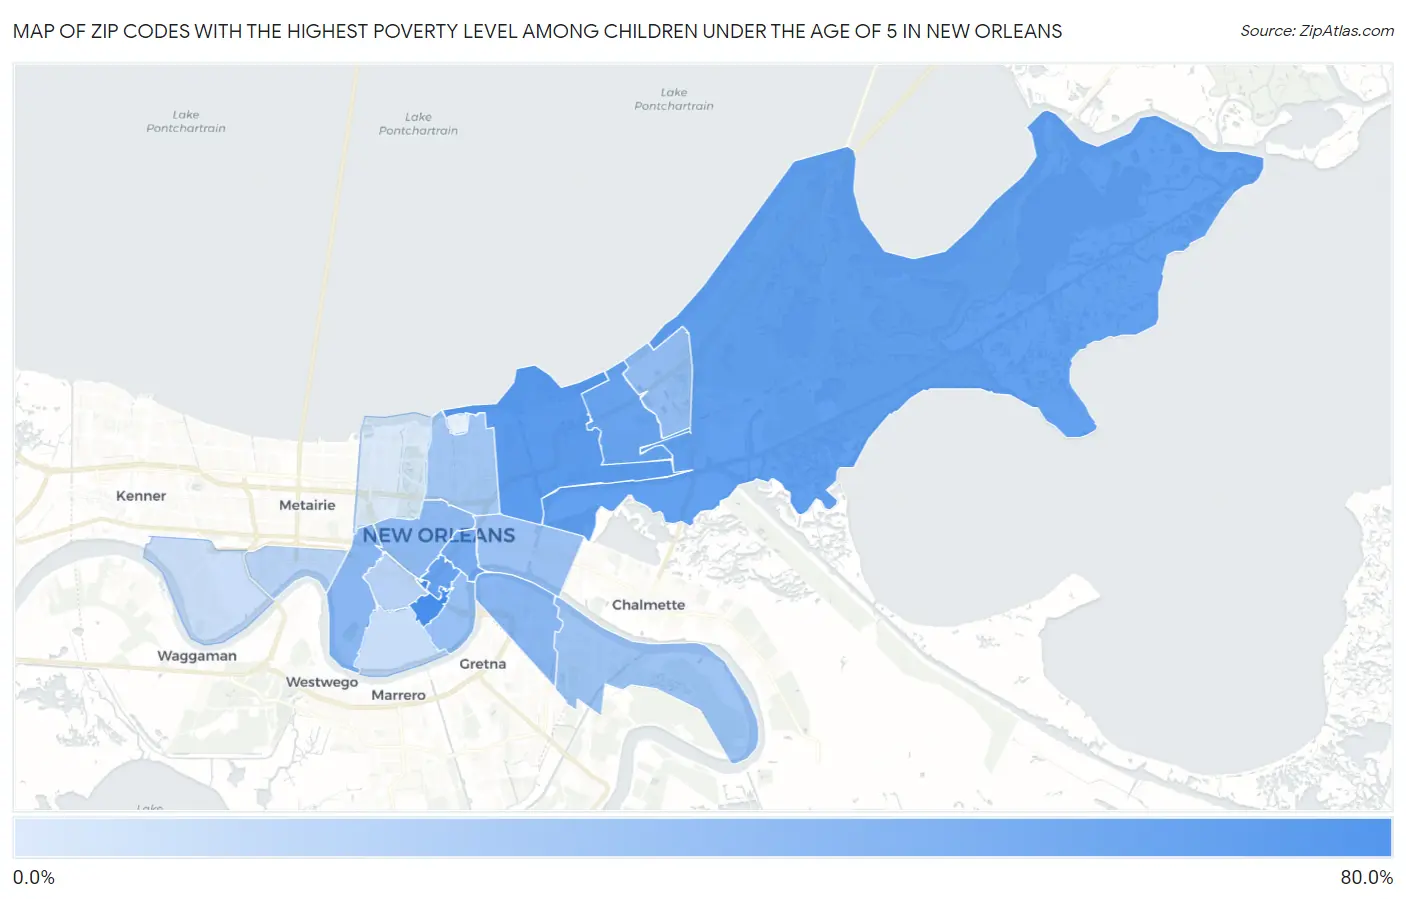
Map of Zip Codes with the Highest Poverty Level Among Children Under the Age of 5 in New Orleans

0.0%
80.0%
Zip Codes with the Highest Poverty Level Among Children Under the Age of 5 in New Orleans Map

Zip Codes with the Highest Poverty Level Among Children Under the Age of 5 in New Orleans, LA

Zip Code Child Poverty vs State vs National
1.7011364.9%28.4%(+36.5)#4918.1%(+46.8)#1,388
2.7012654.7%28.4%(+26.3)#7018.1%(+36.7)#2,086
3.7012951.3%28.4%(+22.9)#7718.1%(+33.3)#2,400
4.7011248.9%28.4%(+20.5)#8518.1%(+30.8)#2,704
5.7012748.3%28.4%(+19.9)#8818.1%(+30.3)#2,780
6.7011641.0%28.4%(+12.6)#13018.1%(+22.9)#3,838
7.7011434.7%28.4%(+6.24)#15618.1%(+16.6)#5,149
8.7011834.0%28.4%(+5.61)#16018.1%(+16.0)#5,290
9.7011932.3%28.4%(+3.84)#16918.1%(+14.2)#5,779
10.7012830.3%28.4%(+1.87)#18618.1%(+12.2)#6,269
11.7013028.4%28.4%(+0.030)#19618.1%(+10.4)#6,839
12.7011728.4%28.4%(-0.005)#19818.1%(+10.3)#6,849
13.7013126.6%28.4%(-1.82)#21218.1%(+8.54)#7,439
14.7012224.5%28.4%(-3.91)#23018.1%(+6.45)#8,171
15.7012517.1%28.4%(-11.3)#27918.1%(-0.923)#11,364
16.7012117.1%28.4%(-11.3)#28018.1%(-0.931)#11,368
17.7011511.2%28.4%(-17.2)#32118.1%(-6.84)#14,683
18.7012310.5%28.4%(-18.0)#32818.1%(-7.60)#15,143
19.701244.4%28.4%(-24.1)#36118.1%(-13.7)#19,214

Common Questions

What are the Top 10 Zip Codes with the Highest Poverty Level Among Children Under the Age of 5 in New Orleans, LA?
Top 10 Zip Codes with the Highest Poverty Level Among Children Under the Age of 5 in New Orleans, LA are:
#1
64.9%
#2
54.7%
#3
51.3%
#4
48.9%
#5
48.3%
#6
41.0%
#7
34.7%
#8
34.0%
#9
32.3%
#10
30.3%
What zip code has the Highest Poverty Level Among Children Under the Age of 5 in New Orleans, LA?
70113 has the Highest Poverty Level Among Children Under the Age of 5 in New Orleans, LA with 64.9%.
What is the Poverty Level Among Children Under the Age of 5 in New Orleans, LA?
Poverty Level Among Children Under the Age of 5 in New Orleans is 31.4%.
What is the Poverty Level Among Children Under the Age of 5 in Louisiana?
Poverty Level Among Children Under the Age of 5 in Louisiana is 28.4%.
What is the Poverty Level Among Children Under the Age of 5 in the United States?
Poverty Level Among Children Under the Age of 5 in the United States is 18.1%.