Zip Codes with the Highest Percentage of Local Government Employees in Monroe, LA
RELATED REPORTS & OPTIONS
Local Government Employees
Monroe
Compare Zip Codes
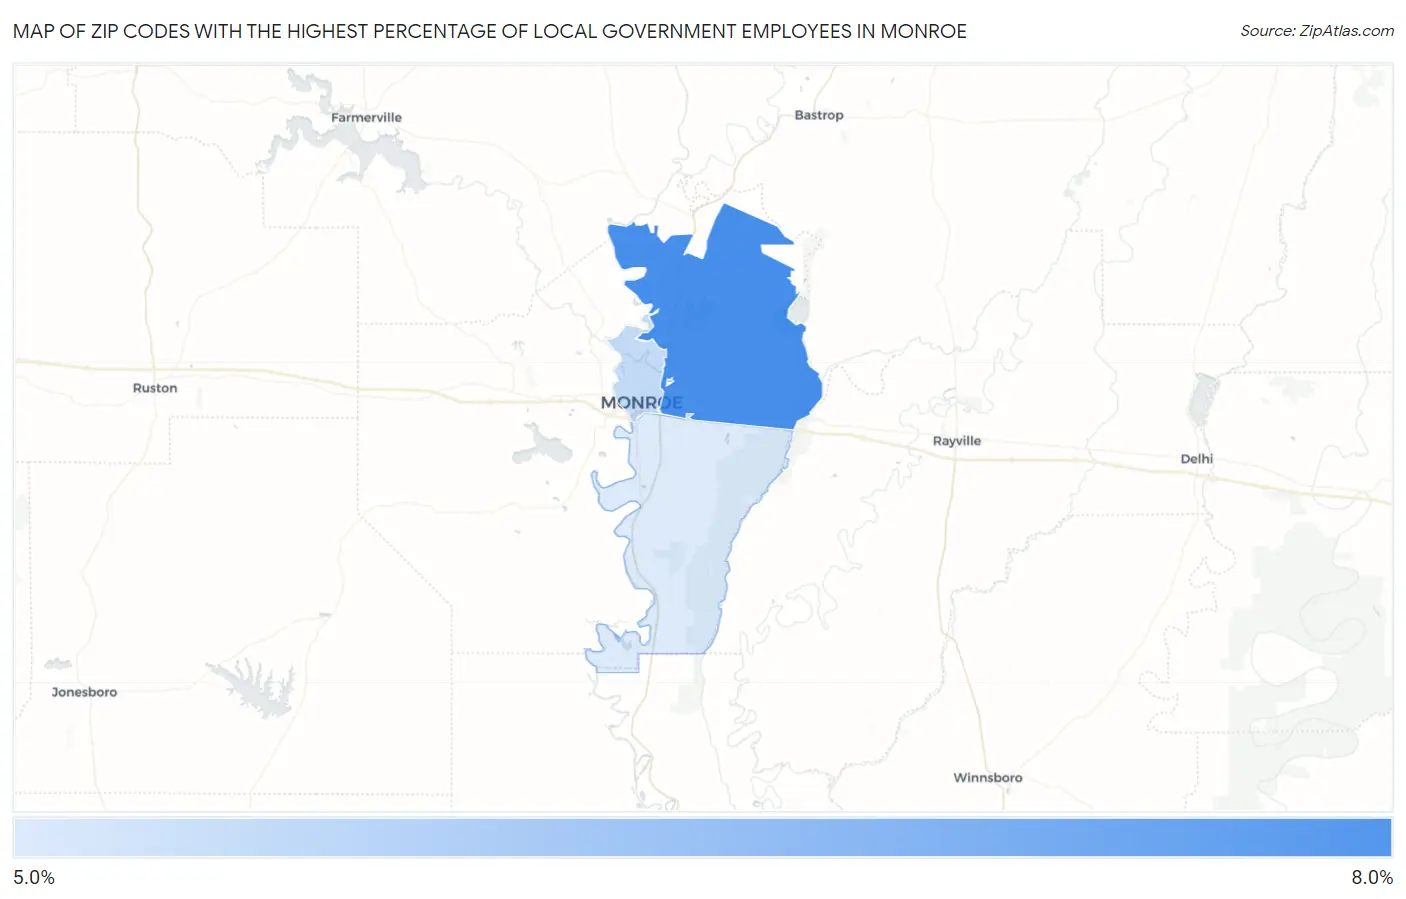
Map of Zip Codes with the Highest Percentage of Local Government Employees in Monroe
5.7%
7.4%
Zip Codes with the Highest Percentage of Local Government Employees in Monroe, LA
| Zip Code | % Local Government Employees | vs State | vs National | |
| 1. | 71203 | 7.4% | 7.3%(+0.072)#260 | 7.2%(+0.169)#15,092 |
| 2. | 71201 | 6.0% | 7.3%(-1.36)#326 | 7.2%(-1.26)#19,899 |
| 3. | 71202 | 5.7% | 7.3%(-1.66)#345 | 7.2%(-1.56)#20,906 |
1
Common Questions
What are the Top 3 Zip Codes with the Highest Percentage of Local Government Employees in Monroe, LA?
Top 3 Zip Codes with the Highest Percentage of Local Government Employees in Monroe, LA are:
What zip code has the Highest Percentage of Local Government Employees in Monroe, LA?
71203 has the Highest Percentage of Local Government Employees in Monroe, LA with 7.4%.
What is the Percentage of Local Government Employees in Monroe, LA?
Percentage of Local Government Employees in Monroe is 5.3%.
What is the Percentage of Local Government Employees in Louisiana?
Percentage of Local Government Employees in Louisiana is 7.3%.
What is the Percentage of Local Government Employees in the United States?
Percentage of Local Government Employees in the United States is 7.2%.