Zip Codes with the Highest Percentage of Population Employed in Finance & Insurance in Kentucky
RELATED REPORTS & OPTIONS
Finance & Insurance
Kentucky
Compare Zip Codes
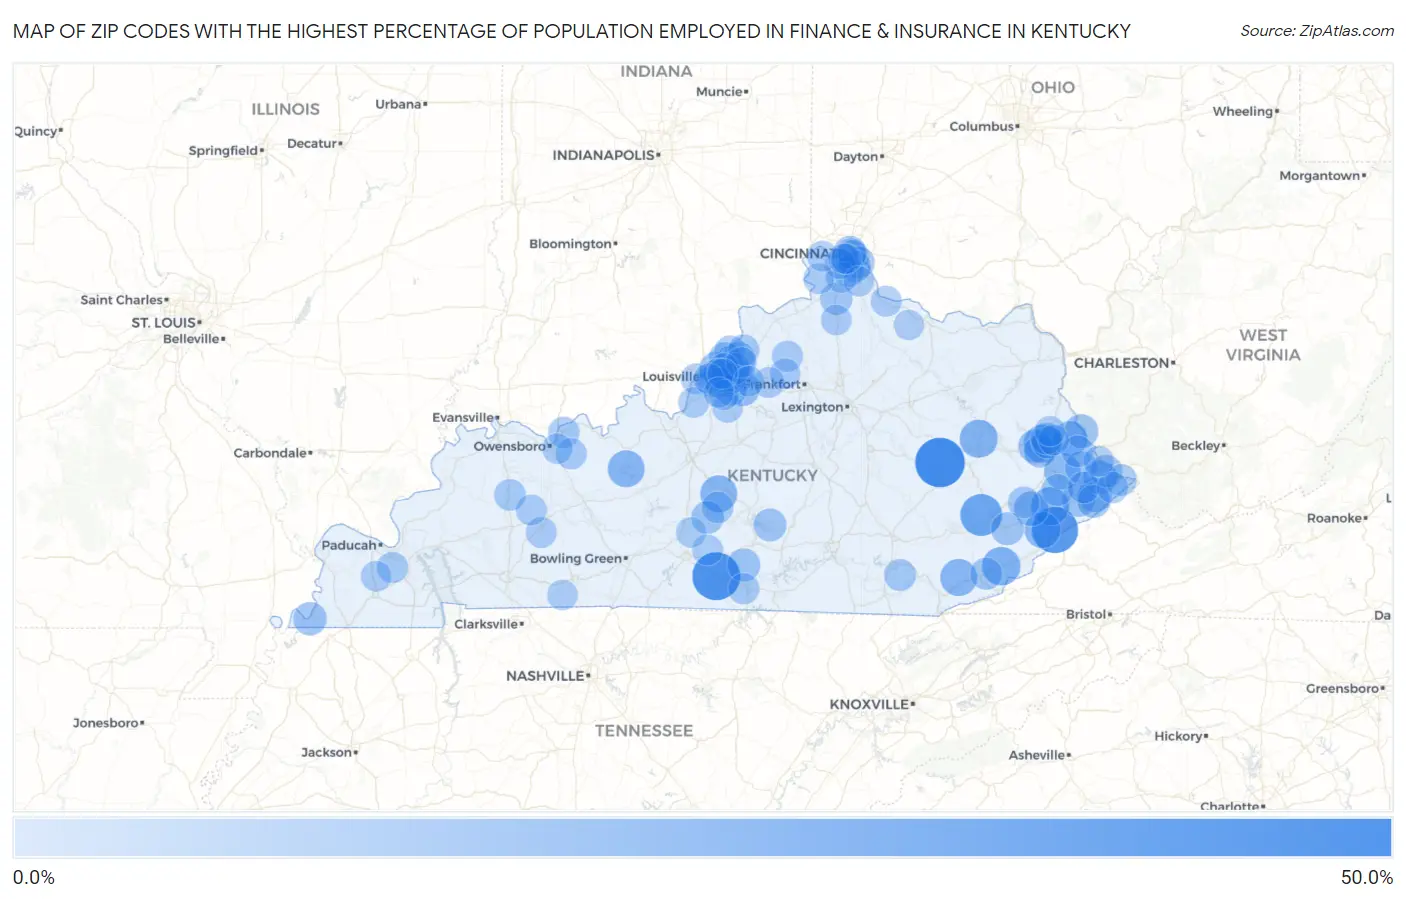
Map of Zip Codes with the Highest Percentage of Population Employed in Finance & Insurance in Kentucky
0.0%
50.0%
Zip Codes with the Highest Percentage of Population Employed in Finance & Insurance in Kentucky
| Zip Code | % Employed | vs State | vs National | |
| 1. | 41397 | 44.9% | 4.2%(+40.7)#1 | 4.8%(+40.2)#38 |
| 2. | 42124 | 41.5% | 4.2%(+37.2)#2 | 4.8%(+36.7)#43 |
| 3. | 41810 | 38.1% | 4.2%(+33.9)#3 | 4.8%(+33.4)#56 |
| 4. | 41754 | 29.4% | 4.2%(+25.2)#4 | 4.8%(+24.6)#96 |
| 5. | 40870 | 22.3% | 4.2%(+18.1)#5 | 4.8%(+17.5)#186 |
| 6. | 41612 | 21.6% | 4.2%(+17.3)#6 | 4.8%(+16.8)#201 |
| 7. | 41352 | 21.4% | 4.2%(+17.2)#7 | 4.8%(+16.7)#206 |
| 8. | 41268 | 21.2% | 4.2%(+17.0)#8 | 4.8%(+16.5)#211 |
| 9. | 40988 | 19.5% | 4.2%(+15.3)#9 | 4.8%(+14.7)#277 |
| 10. | 42764 | 19.3% | 4.2%(+15.1)#10 | 4.8%(+14.5)#284 |
| 11. | 40152 | 19.2% | 4.2%(+15.0)#11 | 4.8%(+14.4)#290 |
| 12. | 41659 | 18.3% | 4.2%(+14.0)#12 | 4.8%(+13.5)#321 |
| 13. | 41855 | 17.5% | 4.2%(+13.3)#13 | 4.8%(+12.8)#373 |
| 14. | 41224 | 15.6% | 4.2%(+11.4)#14 | 4.8%(+10.9)#496 |
| 15. | 41844 | 15.1% | 4.2%(+10.8)#15 | 4.8%(+10.3)#555 |
| 16. | 40023 | 14.7% | 4.2%(+10.5)#16 | 4.8%(+9.97)#587 |
| 17. | 41554 | 13.6% | 4.2%(+9.42)#17 | 4.8%(+8.87)#718 |
| 18. | 41267 | 13.5% | 4.2%(+9.23)#18 | 4.8%(+8.68)#755 |
| 19. | 40025 | 13.1% | 4.2%(+8.89)#19 | 4.8%(+8.34)#803 |
| 20. | 41562 | 12.8% | 4.2%(+8.59)#20 | 4.8%(+8.04)#850 |
| 21. | 40010 | 12.6% | 4.2%(+8.43)#21 | 4.8%(+7.88)#879 |
| 22. | 41543 | 12.6% | 4.2%(+8.39)#22 | 4.8%(+7.85)#889 |
| 23. | 42050 | 12.4% | 4.2%(+8.18)#23 | 4.8%(+7.63)#926 |
| 24. | 41222 | 12.2% | 4.2%(+8.02)#24 | 4.8%(+7.47)#963 |
| 25. | 42715 | 11.8% | 4.2%(+7.54)#25 | 4.8%(+7.00)#1,074 |
| 26. | 40059 | 11.5% | 4.2%(+7.32)#26 | 4.8%(+6.77)#1,126 |
| 27. | 41073 | 11.4% | 4.2%(+7.23)#27 | 4.8%(+6.68)#1,155 |
| 28. | 41540 | 11.4% | 4.2%(+7.17)#28 | 4.8%(+6.62)#1,171 |
| 29. | 41760 | 11.2% | 4.2%(+6.97)#29 | 4.8%(+6.43)#1,240 |
| 30. | 42753 | 11.1% | 4.2%(+6.85)#30 | 4.8%(+6.31)#1,277 |
| 31. | 41216 | 10.7% | 4.2%(+6.53)#31 | 4.8%(+5.98)#1,379 |
| 32. | 42722 | 10.7% | 4.2%(+6.51)#32 | 4.8%(+5.97)#1,386 |
| 33. | 41571 | 10.6% | 4.2%(+6.39)#33 | 4.8%(+5.84)#1,438 |
| 34. | 41531 | 10.3% | 4.2%(+6.09)#34 | 4.8%(+5.54)#1,569 |
| 35. | 41075 | 10.3% | 4.2%(+6.05)#35 | 4.8%(+5.50)#1,587 |
| 36. | 41030 | 9.9% | 4.2%(+5.69)#36 | 4.8%(+5.14)#1,759 |
| 37. | 40245 | 9.7% | 4.2%(+5.50)#37 | 4.8%(+4.95)#1,860 |
| 38. | 41234 | 9.7% | 4.2%(+5.50)#38 | 4.8%(+4.95)#1,861 |
| 39. | 40806 | 9.7% | 4.2%(+5.47)#39 | 4.8%(+4.92)#1,882 |
| 40. | 40771 | 9.2% | 4.2%(+4.99)#40 | 4.8%(+4.45)#2,123 |
| 41. | 41631 | 9.1% | 4.2%(+4.93)#41 | 4.8%(+4.38)#2,158 |
| 42. | 41085 | 9.1% | 4.2%(+4.84)#42 | 4.8%(+4.30)#2,214 |
| 43. | 41557 | 9.1% | 4.2%(+4.84)#43 | 4.8%(+4.30)#2,215 |
| 44. | 41076 | 9.0% | 4.2%(+4.81)#44 | 4.8%(+4.26)#2,237 |
| 45. | 41250 | 9.0% | 4.2%(+4.77)#45 | 4.8%(+4.22)#2,271 |
| 46. | 42782 | 8.7% | 4.2%(+4.53)#46 | 4.8%(+3.98)#2,430 |
| 47. | 41831 | 8.7% | 4.2%(+4.52)#47 | 4.8%(+3.97)#2,439 |
| 48. | 40205 | 8.7% | 4.2%(+4.49)#48 | 4.8%(+3.94)#2,464 |
| 49. | 42413 | 8.6% | 4.2%(+4.39)#49 | 4.8%(+3.84)#2,527 |
| 50. | 41260 | 8.5% | 4.2%(+4.31)#50 | 4.8%(+3.77)#2,597 |
| 51. | 42355 | 8.4% | 4.2%(+4.17)#51 | 4.8%(+3.62)#2,721 |
| 52. | 40299 | 8.4% | 4.2%(+4.15)#52 | 4.8%(+3.60)#2,744 |
| 53. | 40223 | 8.4% | 4.2%(+4.13)#53 | 4.8%(+3.58)#2,758 |
| 54. | 41547 | 8.3% | 4.2%(+4.11)#54 | 4.8%(+3.57)#2,774 |
| 55. | 41015 | 8.2% | 4.2%(+3.99)#55 | 4.8%(+3.45)#2,870 |
| 56. | 40026 | 8.1% | 4.2%(+3.91)#56 | 4.8%(+3.36)#2,961 |
| 57. | 41553 | 8.0% | 4.2%(+3.77)#57 | 4.8%(+3.22)#3,092 |
| 58. | 40243 | 8.0% | 4.2%(+3.74)#58 | 4.8%(+3.19)#3,131 |
| 59. | 42082 | 7.9% | 4.2%(+3.71)#59 | 4.8%(+3.16)#3,166 |
| 60. | 40056 | 7.9% | 4.2%(+3.69)#60 | 4.8%(+3.14)#3,177 |
| 61. | 40207 | 7.9% | 4.2%(+3.67)#61 | 4.8%(+3.12)#3,193 |
| 62. | 40031 | 7.8% | 4.2%(+3.61)#62 | 4.8%(+3.06)#3,257 |
| 63. | 42717 | 7.8% | 4.2%(+3.55)#63 | 4.8%(+3.00)#3,316 |
| 64. | 40241 | 7.7% | 4.2%(+3.52)#64 | 4.8%(+2.97)#3,351 |
| 65. | 42366 | 7.7% | 4.2%(+3.45)#65 | 4.8%(+2.90)#3,430 |
| 66. | 41074 | 7.3% | 4.2%(+3.12)#66 | 4.8%(+2.57)#3,785 |
| 67. | 42345 | 7.3% | 4.2%(+3.09)#67 | 4.8%(+2.54)#3,819 |
| 68. | 40065 | 7.3% | 4.2%(+3.05)#68 | 4.8%(+2.51)#3,865 |
| 69. | 42325 | 7.2% | 4.2%(+3.03)#69 | 4.8%(+2.48)#3,898 |
| 70. | 41043 | 7.2% | 4.2%(+3.02)#70 | 4.8%(+2.47)#3,916 |
| 71. | 42154 | 7.2% | 4.2%(+3.00)#71 | 4.8%(+2.45)#3,937 |
| 72. | 40057 | 7.2% | 4.2%(+2.96)#72 | 4.8%(+2.41)#3,999 |
| 73. | 41051 | 7.1% | 4.2%(+2.86)#73 | 4.8%(+2.31)#4,138 |
| 74. | 42051 | 7.1% | 4.2%(+2.83)#74 | 4.8%(+2.29)#4,170 |
| 75. | 41204 | 7.0% | 4.2%(+2.77)#75 | 4.8%(+2.22)#4,254 |
| 76. | 40211 | 7.0% | 4.2%(+2.75)#76 | 4.8%(+2.21)#4,271 |
| 77. | 41503 | 7.0% | 4.2%(+2.74)#77 | 4.8%(+2.20)#4,281 |
| 78. | 41017 | 6.9% | 4.2%(+2.73)#78 | 4.8%(+2.18)#4,300 |
| 79. | 40220 | 6.9% | 4.2%(+2.70)#79 | 4.8%(+2.15)#4,337 |
| 80. | 40222 | 6.9% | 4.2%(+2.68)#80 | 4.8%(+2.13)#4,372 |
| 81. | 40014 | 6.9% | 4.2%(+2.64)#81 | 4.8%(+2.10)#4,429 |
| 82. | 41097 | 6.9% | 4.2%(+2.64)#82 | 4.8%(+2.09)#4,431 |
| 83. | 40003 | 6.8% | 4.2%(+2.59)#83 | 4.8%(+2.04)#4,507 |
| 84. | 40067 | 6.8% | 4.2%(+2.57)#84 | 4.8%(+2.02)#4,528 |
| 85. | 40047 | 6.8% | 4.2%(+2.56)#85 | 4.8%(+2.01)#4,548 |
| 86. | 40272 | 6.7% | 4.2%(+2.52)#86 | 4.8%(+1.97)#4,600 |
| 87. | 41091 | 6.7% | 4.2%(+2.50)#87 | 4.8%(+1.96)#4,624 |
| 88. | 41048 | 6.7% | 4.2%(+2.48)#88 | 4.8%(+1.93)#4,673 |
| 89. | 40204 | 6.7% | 4.2%(+2.46)#89 | 4.8%(+1.91)#4,691 |
| 90. | 41011 | 6.7% | 4.2%(+2.44)#90 | 4.8%(+1.89)#4,735 |
| 91. | 40291 | 6.6% | 4.2%(+2.41)#91 | 4.8%(+1.87)#4,769 |
| 92. | 41001 | 6.6% | 4.2%(+2.41)#92 | 4.8%(+1.87)#4,770 |
| 93. | 40242 | 6.6% | 4.2%(+2.40)#93 | 4.8%(+1.85)#4,793 |
| 94. | 42265 | 6.6% | 4.2%(+2.36)#94 | 4.8%(+1.81)#4,839 |
| 95. | 41014 | 6.6% | 4.2%(+2.34)#95 | 4.8%(+1.80)#4,869 |
| 96. | 42303 | 6.5% | 4.2%(+2.28)#96 | 4.8%(+1.73)#4,990 |
| 97. | 40228 | 6.5% | 4.2%(+2.24)#97 | 4.8%(+1.69)#5,050 |
| 98. | 42749 | 6.4% | 4.2%(+2.14)#98 | 4.8%(+1.59)#5,214 |
| 99. | 41254 | 6.3% | 4.2%(+2.12)#99 | 4.8%(+1.57)#5,241 |
| 100. | 41044 | 6.3% | 4.2%(+2.08)#100 | 4.8%(+1.54)#5,312 |
Common Questions
What are the Top 10 Zip Codes with the Highest Percentage of Population Employed in Finance & Insurance in Kentucky?
Top 10 Zip Codes with the Highest Percentage of Population Employed in Finance & Insurance in Kentucky are:
What zip code has the Highest Percentage of Population Employed in Finance & Insurance in Kentucky?
41397 has the Highest Percentage of Population Employed in Finance & Insurance in Kentucky with 44.9%.
What is the Percentage of Population Employed in Finance & Insurance in the State of Kentucky?
Percentage of Population Employed in Finance & Insurance in Kentucky is 4.2%.
What is the Percentage of Population Employed in Finance & Insurance in the United States?
Percentage of Population Employed in Finance & Insurance in the United States is 4.8%.