Zip Codes with the Highest Percentage of Population Employed in Agriculture, Fishing & Hunting in Ashland, KY
RELATED REPORTS & OPTIONS
Agriculture, Fishing & Hunting
Ashland
Compare Zip Codes
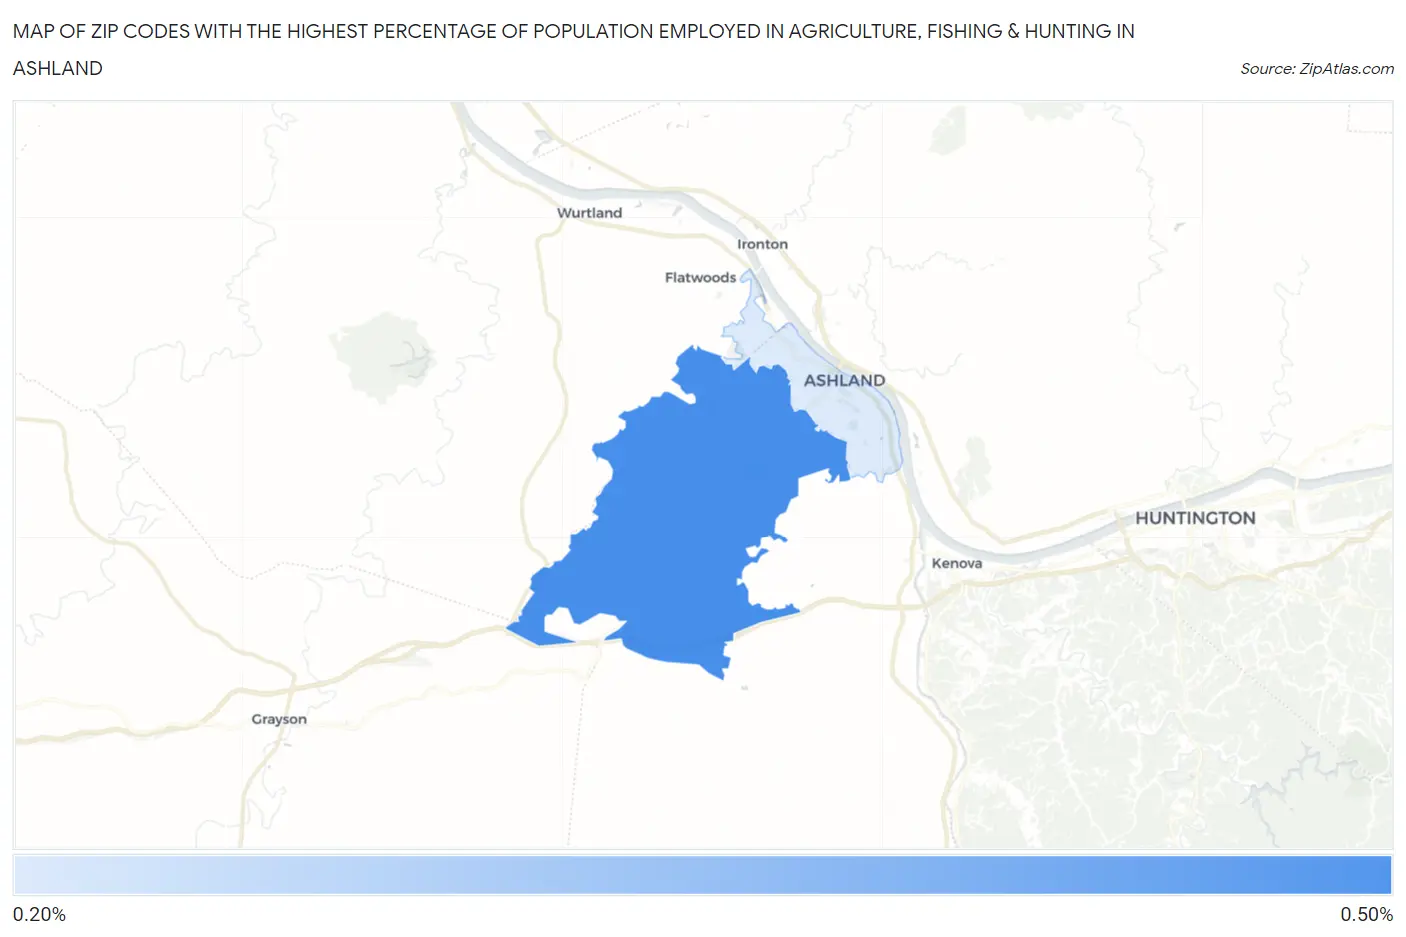
Map of Zip Codes with the Highest Percentage of Population Employed in Agriculture, Fishing & Hunting in Ashland
0.0%
0.50%
Zip Codes with the Highest Percentage of Population Employed in Agriculture, Fishing & Hunting in Ashland, KY
| Zip Code | % Employed | vs State | vs National | |
| 1. | 41102 | 0.44% | 1.3%(-0.878)#339 | 1.2%(-0.762)#19,830 |
| 2. | 41101 | 0.23% | 1.3%(-1.08)#372 | 1.2%(-0.969)#21,985 |
1
Common Questions
What are the Top Zip Codes with the Highest Percentage of Population Employed in Agriculture, Fishing & Hunting in Ashland, KY?
Top Zip Codes with the Highest Percentage of Population Employed in Agriculture, Fishing & Hunting in Ashland, KY are:
What zip code has the Highest Percentage of Population Employed in Agriculture, Fishing & Hunting in Ashland, KY?
41102 has the Highest Percentage of Population Employed in Agriculture, Fishing & Hunting in Ashland, KY with 0.44%.
What is the Percentage of Population Employed in Agriculture, Fishing & Hunting in Ashland, KY?
Percentage of Population Employed in Agriculture, Fishing & Hunting in Ashland is 0.21%.
What is the Percentage of Population Employed in Agriculture, Fishing & Hunting in Kentucky?
Percentage of Population Employed in Agriculture, Fishing & Hunting in Kentucky is 1.3%.
What is the Percentage of Population Employed in Agriculture, Fishing & Hunting in the United States?
Percentage of Population Employed in Agriculture, Fishing & Hunting in the United States is 1.2%.