Zip Codes with the Highest Percentage of Population Employed in Accommodation & Food Services in Ashland, KY
RELATED REPORTS & OPTIONS
Accommodation & Food Services
Ashland
Compare Zip Codes
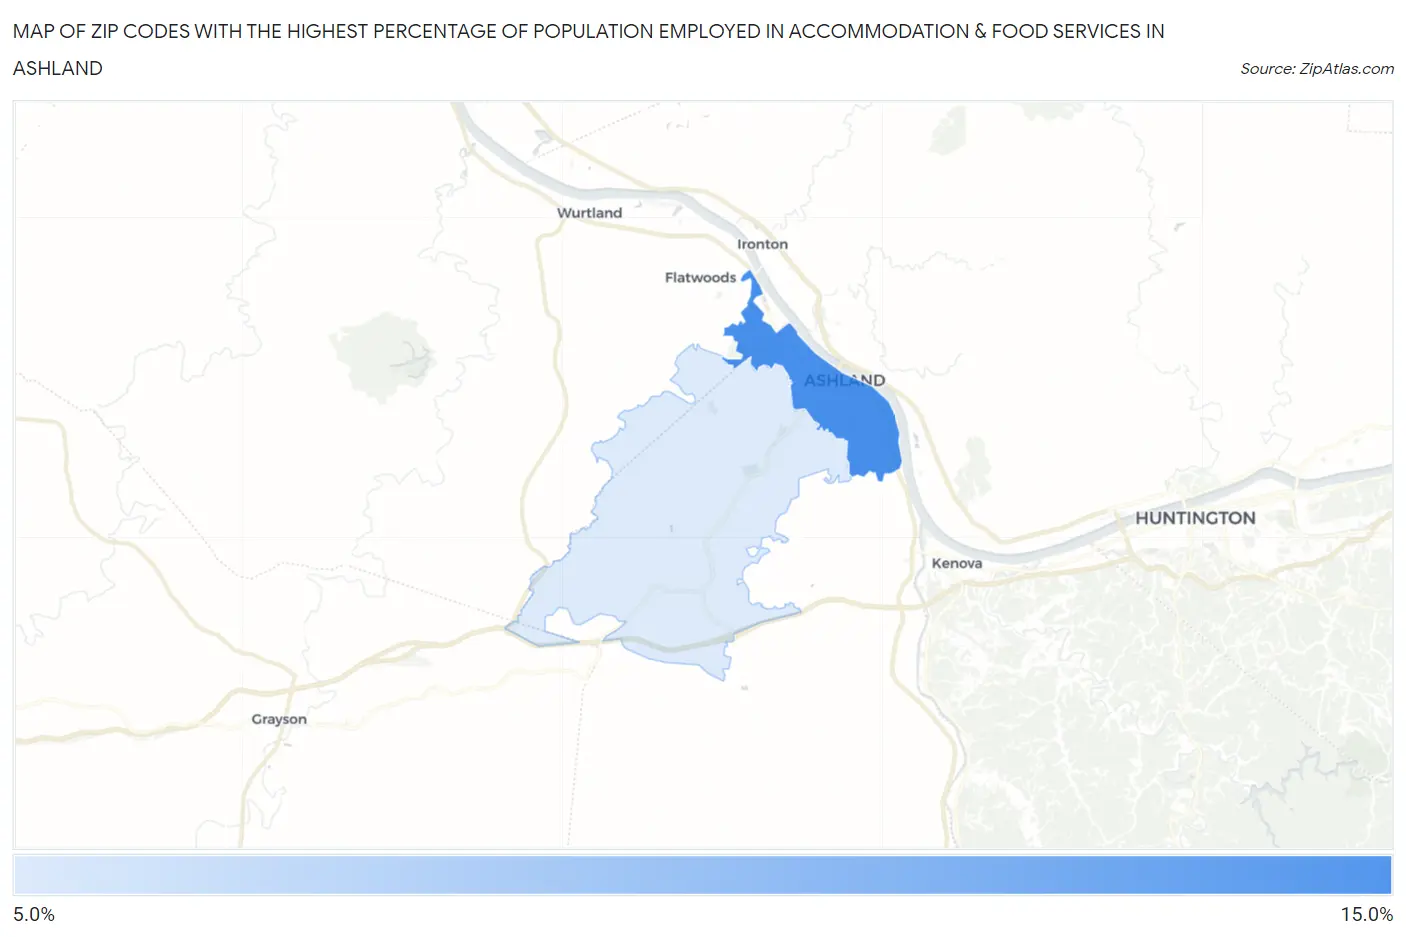
Map of Zip Codes with the Highest Percentage of Population Employed in Accommodation & Food Services in Ashland
5.1%
12.5%
Zip Codes with the Highest Percentage of Population Employed in Accommodation & Food Services in Ashland, KY
| Zip Code | % Employed | vs State | vs National | |
| 1. | 41101 | 12.5% | 6.7%(+5.78)#74 | 6.9%(+5.57)#2,616 |
| 2. | 41102 | 5.1% | 6.7%(-1.56)#311 | 6.9%(-1.78)#16,444 |
1
Common Questions
What are the Top Zip Codes with the Highest Percentage of Population Employed in Accommodation & Food Services in Ashland, KY?
Top Zip Codes with the Highest Percentage of Population Employed in Accommodation & Food Services in Ashland, KY are:
What zip code has the Highest Percentage of Population Employed in Accommodation & Food Services in Ashland, KY?
41101 has the Highest Percentage of Population Employed in Accommodation & Food Services in Ashland, KY with 12.5%.
What is the Percentage of Population Employed in Accommodation & Food Services in Ashland, KY?
Percentage of Population Employed in Accommodation & Food Services in Ashland is 12.9%.
What is the Percentage of Population Employed in Accommodation & Food Services in Kentucky?
Percentage of Population Employed in Accommodation & Food Services in Kentucky is 6.7%.
What is the Percentage of Population Employed in Accommodation & Food Services in the United States?
Percentage of Population Employed in Accommodation & Food Services in the United States is 6.9%.