Zip Codes with the Highest Percentage of Population Employed in Administrative & Support Services in Ashland, KY
RELATED REPORTS & OPTIONS
Administrative & Support Services
Ashland
Compare Zip Codes
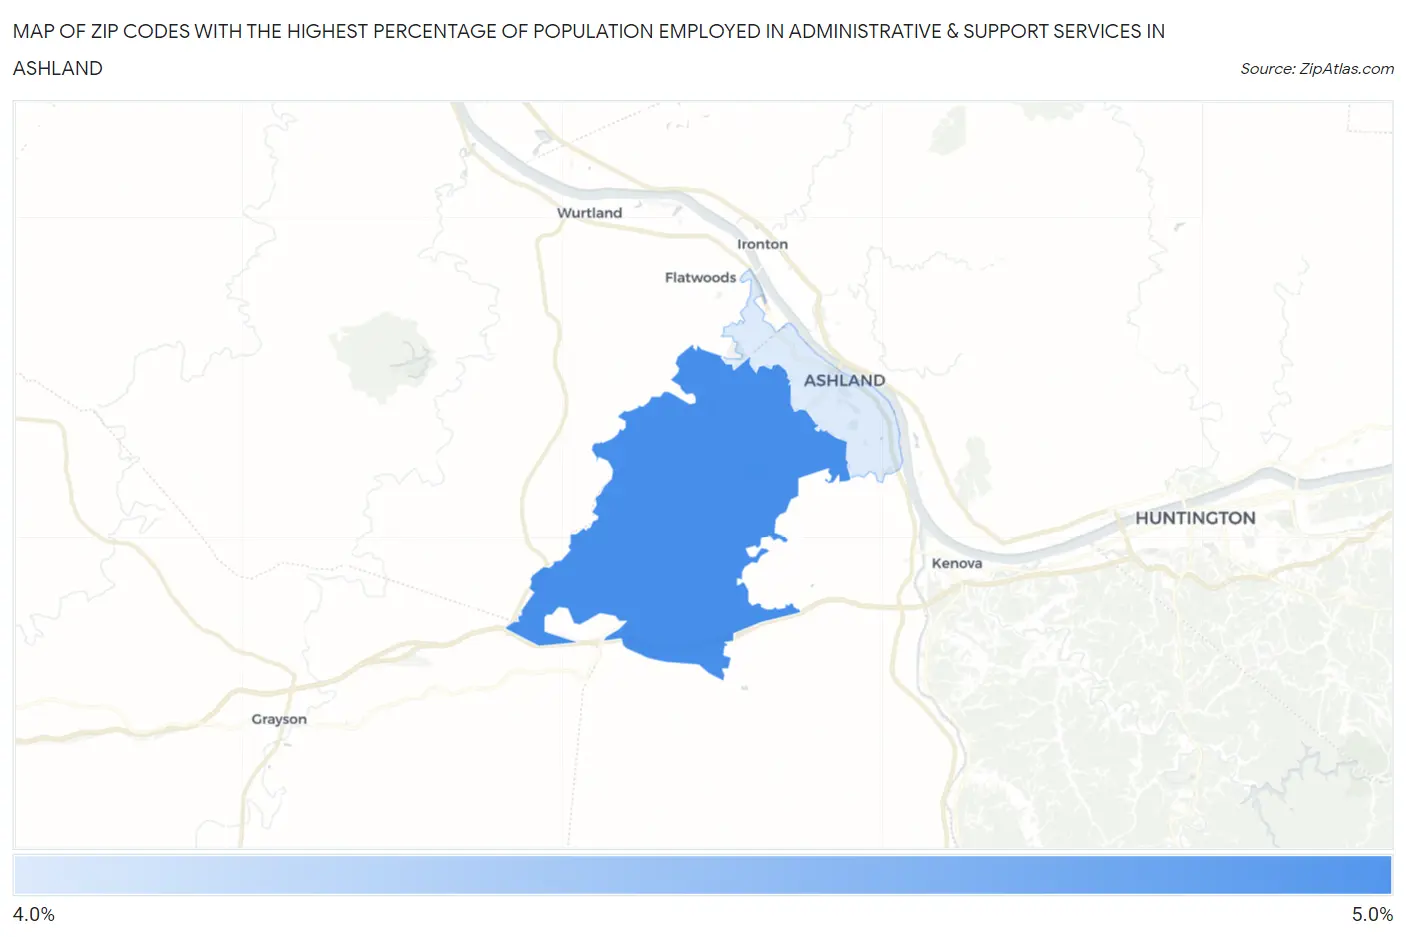
Map of Zip Codes with the Highest Percentage of Population Employed in Administrative & Support Services in Ashland
4.2%
4.7%
Zip Codes with the Highest Percentage of Population Employed in Administrative & Support Services in Ashland, KY
| Zip Code | % Employed | vs State | vs National | |
| 1. | 41102 | 4.7% | 4.0%(+0.735)#198 | 4.1%(+0.544)#8,052 |
| 2. | 41101 | 4.2% | 4.0%(+0.200)#243 | 4.1%(+0.009)#10,001 |
1
Common Questions
What are the Top Zip Codes with the Highest Percentage of Population Employed in Administrative & Support Services in Ashland, KY?
Top Zip Codes with the Highest Percentage of Population Employed in Administrative & Support Services in Ashland, KY are:
What zip code has the Highest Percentage of Population Employed in Administrative & Support Services in Ashland, KY?
41102 has the Highest Percentage of Population Employed in Administrative & Support Services in Ashland, KY with 4.7%.
What is the Percentage of Population Employed in Administrative & Support Services in Ashland, KY?
Percentage of Population Employed in Administrative & Support Services in Ashland is 2.7%.
What is the Percentage of Population Employed in Administrative & Support Services in Kentucky?
Percentage of Population Employed in Administrative & Support Services in Kentucky is 4.0%.
What is the Percentage of Population Employed in Administrative & Support Services in the United States?
Percentage of Population Employed in Administrative & Support Services in the United States is 4.1%.