Zip Codes with the Highest Percentage of Population Employed in Sales & Related in Overland Park, KS
RELATED REPORTS & OPTIONS
Sales & Related
Overland Park
Compare Zip Codes
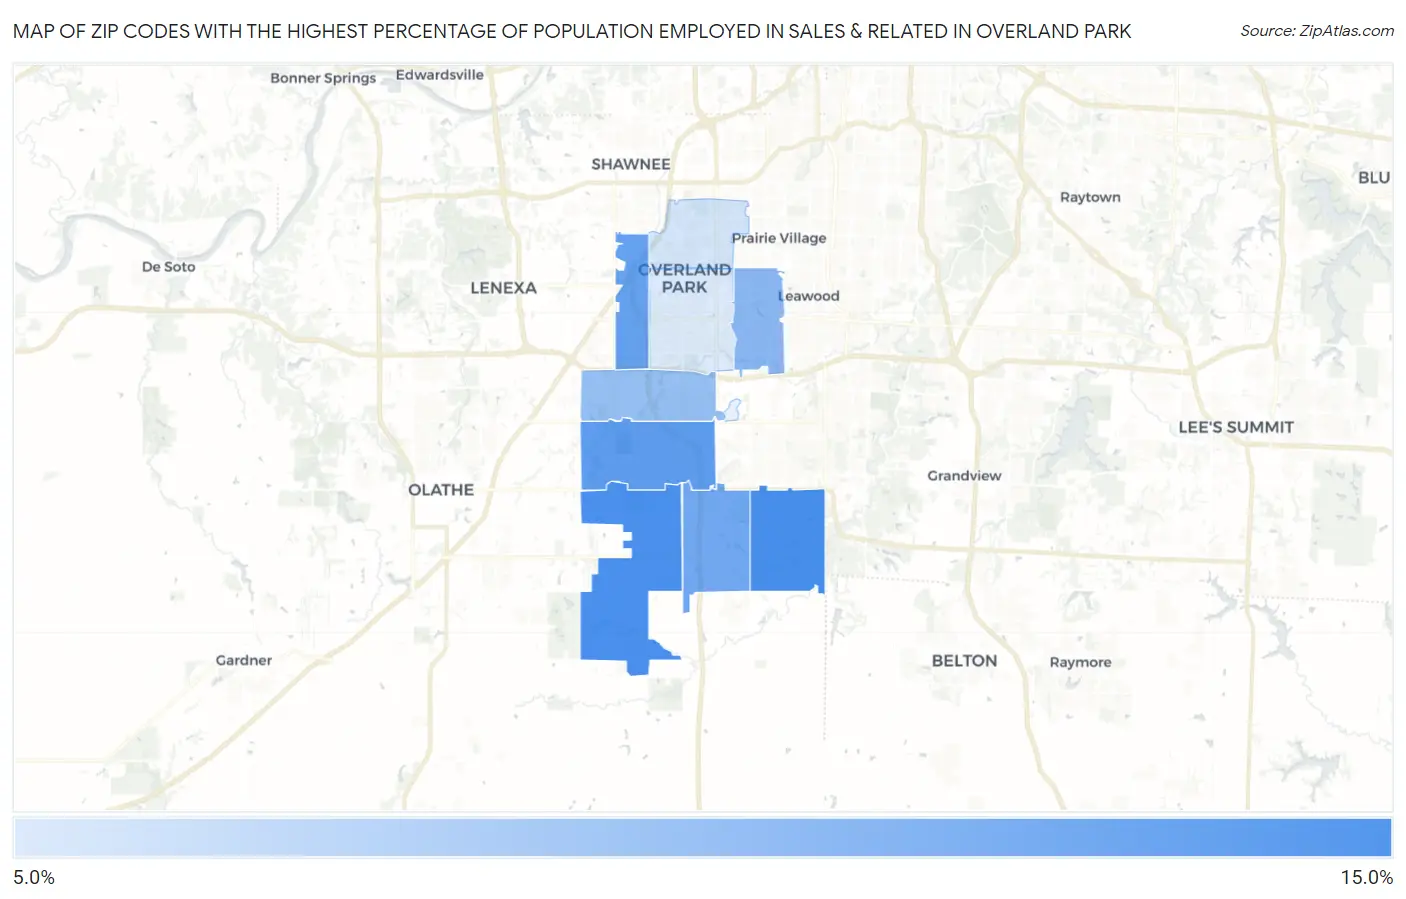
Map of Zip Codes with the Highest Percentage of Population Employed in Sales & Related in Overland Park
0.0%
15.0%
Zip Codes with the Highest Percentage of Population Employed in Sales & Related in Overland Park, KS
| Zip Code | % Employed | vs State | vs National | |
| 1. | 66224 | 14.5% | 9.3%(+5.19)#42 | 9.6%(+4.87)#3,097 |
| 2. | 66221 | 14.4% | 9.3%(+5.14)#45 | 9.6%(+4.82)#3,146 |
| 3. | 66213 | 13.6% | 9.3%(+4.30)#55 | 9.6%(+3.98)#3,862 |
| 4. | 66214 | 13.4% | 9.3%(+4.08)#61 | 9.6%(+3.76)#4,102 |
| 5. | 66223 | 12.8% | 9.3%(+3.56)#72 | 9.6%(+3.24)#4,702 |
| 6. | 66207 | 11.9% | 9.3%(+2.65)#97 | 9.6%(+2.33)#6,181 |
| 7. | 66210 | 11.5% | 9.3%(+2.21)#112 | 9.6%(+1.89)#7,038 |
| 8. | 66204 | 9.1% | 9.3%(-0.147)#216 | 9.6%(-0.467)#14,044 |
| 9. | 66212 | 8.8% | 9.3%(-0.465)#238 | 9.6%(-0.785)#15,227 |
1
Common Questions
What are the Top 5 Zip Codes with the Highest Percentage of Population Employed in Sales & Related in Overland Park, KS?
Top 5 Zip Codes with the Highest Percentage of Population Employed in Sales & Related in Overland Park, KS are:
What zip code has the Highest Percentage of Population Employed in Sales & Related in Overland Park, KS?
66224 has the Highest Percentage of Population Employed in Sales & Related in Overland Park, KS with 14.5%.
What is the Percentage of Population Employed in Sales & Related in Overland Park, KS?
Percentage of Population Employed in Sales & Related in Overland Park is 12.1%.
What is the Percentage of Population Employed in Sales & Related in Kansas?
Percentage of Population Employed in Sales & Related in Kansas is 9.3%.
What is the Percentage of Population Employed in Sales & Related in the United States?
Percentage of Population Employed in Sales & Related in the United States is 9.6%.